Embed Size (px)
Citation preview
J. Bio. &Env. Sci. 2017
163 | Fobaneet al.
RESEARCH PAPER OPEN ACCESS
Flora diversity and characterization of plant groups in Atlantic
Forests of Cameroon
Jean Louis Fobane*1,2
, Jean Michel Onana2,3
, Jules Christian Zekeng2,Hortense Elvire
Biye2,Marguerite Marie Abada Mbolo
2
1Department of Biological Science, Higher Teachers’ Training College, University of
Yaoundé I, Yaoundé, Cameroon
2Department of Plant Biology, Faculty of Sciences, University of Yaoundé I, Yaoundé,
Cameroon
3IRAD-National Herbarium of Cameroon, Yaoundé, Cameroon
Article published on May 29, 2017
Key words: Lower-Guinea, evergreen forest, flora diversity, chorological type, Cameroon
Abstract
Atlantic forests are part of the Guinean Low land and are known for their rich flora and fauna. A thorough
botanical study has never been carried out at the level of the forest management units (FMU) located in these
forests. This research therefore sought to characterize the vegetation using diversity indices and structure, to
describe the plant diversity and to analyze the chorological types encountered in these forests. Twelve permanent
one hectare plots were established in the two FMU‟s. Trees with dbh (diameter at breast height) ≥10 cm were
identified, counted, measured, marked and tagged in each hectare. A total of 6425 individuals belonging to 317
species, 212 genera and 60 families were obtained. Three plant groups were described based on their similarity to
variables such as altitude, the soil content and rainfall. The Fabaceae-Caesalpinioideaeare the most diverse in
term of number of individuals. Garcinia lucida (Clusiaceae) found only in Group 1, is the most abundant species
with an IVI=23.71. The Shannon diversity index (H‟≥3.5)shows a forest with high species abundance and
diversity. The chorological analysis reveals a predominance of Guineo-Congolese species with zoochore species
being the most dominant in all three plant groups.
*Corresponding Author: Jean Louis Fobane [email protected]
Journal of Biodiversity and Environmental Sciences (JBES) ISSN: 2220-6663 (Print) 2222-3045 (Online)
Vol. 10, No. 5, p. 163-176, 2017
http://www.innspub.net
J. Bio. &Env. Sci. 2017
164 | Fobaneet al.
Introduction
The „„Lower-Guinea” center of endemism (White,
1983) is found in Central-West Africa around the Gulf
of Guinea and its vegetation has been classified by
White (1983). Letouzey (1985) using the
phytogeography map of Cameroon identifies the
forest in guinea-congolian region, evergreen rain
forest domain, and atlantic or nigero-cameroono-
gabonese sector. This atlantic forest consists of four
atlantic districts: (1-the western-north atlantictype
district, with submontane forest and poor in
Caesalpinioideae, 2-the biafran atlantic district
particularly rich in gregarious Caesalpinioideae, 3-the
littoral atlantic district relatively poor in
Caesalpinioideaecompare to the later, 4-the central
and eastern atlantic districts, also poor in
Caesalpinioideae but incontestably containing atlantic
elements)(Caballé, 1978; Doumenge et al., 2001;
Letouzey, 1968; 1985).
Several studies conducted in this forest have led to
good inventories of the atlantic forest of Cameroon
compare to the other types of vegetation (Onana,
2011), planttaxa richness, endemism and floristic
hotspots are well described (Davis et al., 1994;
Doumenge et al., 2003; Gonmadje et al., 2012;
Linder, 2001; Onana, 2011; Onana, 2013; Onana and
Cheek, 2011; République du Cameroun, 2014;
Tchouto et al., 2009; Tchouto et al., 2006; White,
1983). Also, a high richness in fauna was revealed by
several researchers working in this area. Many
mammals and endemic birds threatened to extinction
according to the UICN red listhave been reported in
the “Lower Guinea‟‟ area (Djama, 2001; Kamet al.,
2002; Vivien, 1991). People living in this region
depend on forests to meet their daily needs such as
wood for energy, arable land, non-timber forests
products (FAO, 2006). Thus, there is human pressure
on the forests, although at its lower proportion
compared to other tropical forests for which
deforestation has reached treshold of 673000 ha per
year, implying an annual extraction rate of 0.28%
from the year 2000 to 2005 (Holmgren et al., 2007).
Cameroon is documented among the top country in
tropical Africa with plant species diversity of more than
5000 species per degree square in part of the lower
guinea forest of Southwest Region. The flora
richnessCameroon (c. 8500 vascular plant species) is the
second most diversified of the Congo Basin after Congo-
Kinshasa (c. 10 000) (Cheek and Onana, 2011). In recent
decades, these forests have undergone an extensive
conversion. The annual rate of deforestation is estimated
at 0.9% with the lost of 220 000 ha of forest per year
according to Global Forest Resource Assessment Report
(République du Cameroun, 2014). Half of the initial
forest areas have been cleared for agriculture and
villages settlements. The exploitation of forests for
farming is the main cause of deforestation; as rapid
opening of large areas of remaining primary forests is
mostly done in the South-east of the country (Bikié et al.,
2000).
Numerous works on biodiversityhave been carried
out in Central Africa forests (Beina, 2011; Campbell et
al., 2006; Gonmadje et al., 2012; Kouob, 2009;
Senterre, 2001; 2005; Sonké, 1998; Sunderland et al.,
2003; Tchiengué, 2004; Tchouto, 2004; White,
1996). In forest management units, inventories have
been conducted for forest management purposes
withparticular emphasis on timber species. In the
FMU 00 004 and 11 001, studies conducted have been
focused specificallyon faunaand has little or no
importance to plants (Bobo, 2012; Ekobo, 2008).
Botanical inventory carried out in the National Park
of Korup close to FMU 11 001 revealed an important
plantrichness of which some are endemic (Kuper et
al., 2004). In EBO reserve near FMU 00 004, a high
number of animals belonging to class A such as
elephants, chimpanzee, gorilla and other primates
were observed. With regards to plants, apart from
phytogeographical study realized by (Letouzey, 1985),
more detailed researches are needed within these
littoral (FMU 00 004) and southwest (FMU 11 001)
forests. The purpose of this study is to characterize
the vegetation structure using diversity indices while
describing the flora diversity and to realizing
chorological vegetation analysis.
J. Bio. &Env. Sci. 2017
165 | Fobaneet al.
Materials and methods
Area of study
The sites of the various research devices were selected
based on the concessionaire„s determination to
preserve them from any compromising human
activity that might reduce their qualities as research
site dedicated to biodiversity exploration.
This study was carried out in two types of forests:
- Yinguiforest (FMU 00 004 at 10°20‟ and 10°40‟ of
North latitude and between 4°30‟ and 4°50‟
longitude) is administratively located in Yingui
District of Nkam Division. This forest is situated on a
slope of the high plateau towards the sea and on
Precambrian formations, in particular the inferior
Precambrian. Thus, a part of the area has an altitude
of up to 1300 meters, and the other part is located at
relatively lower altitude (Gasel, 1957). This area
receives more than 2000mm rainfall per year with
two seasons yearly; a long dry season from mid-
november to mid-march and a major rainy season
from mid-march to mid-november;
- Okoroba forest (FMU 11 001) is located in the
Eyumedjuck, Manyu Division, south west Region
(5°18‟ - 5°37‟ N latitude and 9°05‟ - 9°23‟E longitude).
In its northern part, the relief is fairly flat and
corresponds to the bottom of water-bed. Generally,
the region‟s latitude ranges from 100 to 1.400m
between Eyumojock and Akwaya.In this area, soils
are ferralitic and often sandy. At the level of lowlands,
the intense erosion on the flanks of hills forms sandy-
clay soil (Effala, 2007).
Climatic data of the site was taken from the
meteorological station of Mamfe. The maximum
rainfall occurs in august (445.69mm) while the
minimum is observed in january (17.46mm). This
region has an equatorial climate type characterized by
rainy and dry seasons similar to the one of the FMU
00 004.
Vegetation of the bothstudy areas belong to
theevergreen forest or the nigero-cameroono-
gabonese sector (Letouzey, 1968; Onana, 2013).
These are atlantic forests more or less rich in
Caesalpinioideae with four districts which threeare
characteristics of our study area. The western-north
atlantic district, poor in Caesalpinioideae have a high
number of elements which are incontestably atlantics
with few or no elements of semi-deciduous forests.
Elements of neighboring forests penetratedthe
meridional biafra forests in the southern North of
Mamfe. The littoral atlantic district are relatively poor
in Caesalpinioideae and geographically occupy the
littoral plain about 0 to 200m in altitude (Letouzey,
1968; Onana, 2013). The biafran atlantic district
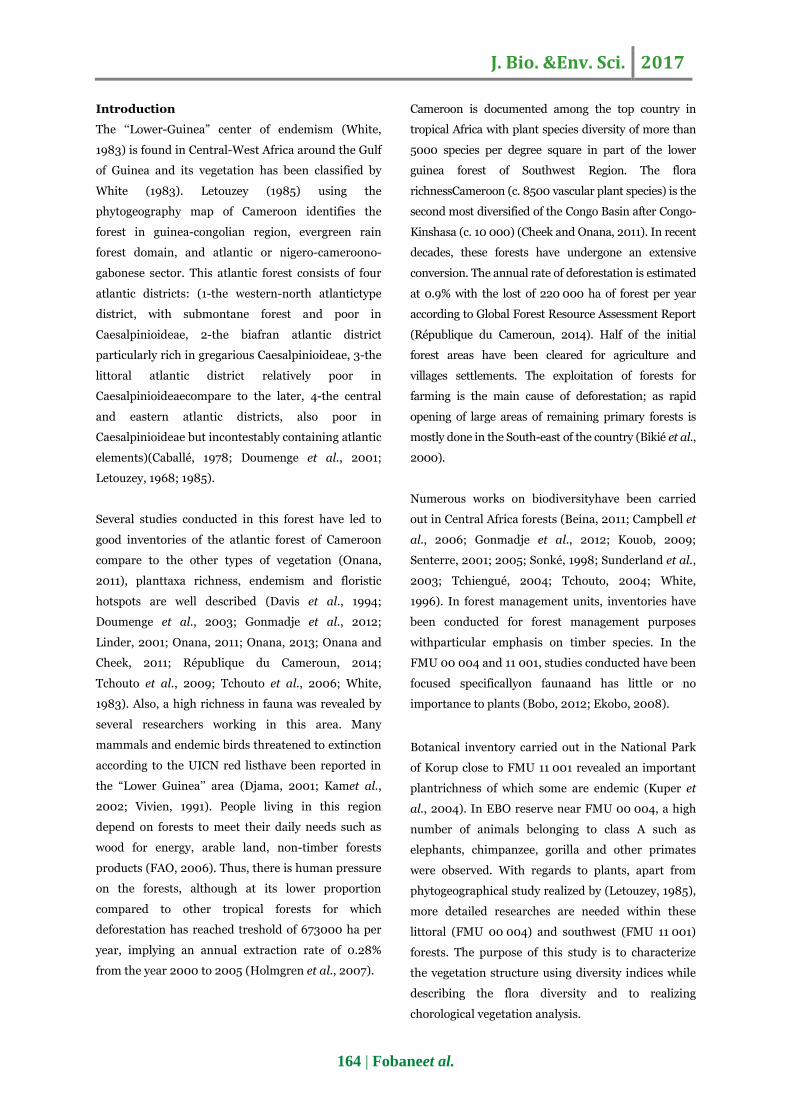
particularly rich in gregarious Caesalpinioideae. Fig.1.
presents the administrative localization of sites
chosen for this study.
Fig.1. Localisation of FMU 00 004 (Yingui forest) and 11 001 (Okoroba forest).
J. Bio. &Env. Sci. 2017
166 | Fobaneet al.
Flora inventory
Twelve permanent plots of one hectare (100m x
100m) were established in the two FMU‟s with six
plots in each FMU‟s. Each hectare was divided into 25
subplots of 20m x 20m. Thesesubplots assisted in the
determination of the distribution of species. The field
study permitted to identify elements of each plot with
a GPS and a field sheet was used to describe each
sampled plot.
In order to estimate plants resources of these
areas,forest companies committed in the process of
forest management generally used a systematic
network of linear trails with the distance of 1 to 3km.
These transects, divided into georeferenced plots,
covering the forest massif, have been profitably used
for flora inventory of this study. Trees of dbh≥10cm
identified within each plot were measured, marked
and tagged. The dbh ≥ 10cm was chosen to facilitate
the structural study of both forests. Measures of dbh
of trees with stilt roots were taken at 1.30m above the
ground level with a measuring tape and at 10cm
above foothills or stilt roots. Such measurements were
done at the level with no deformations observed. A
number was attributed to all trees identified and it
was marked on an aluminum tag about 30 or 40cm
from the measured point depending on the state of
the tree.
Data analysis
Diversity indices
For the vegetation characterization, specificrichness (S),
which is the number of species in a community or of a
sample, was used andthe calculations of diversity indices
carried out.
Shannon-Wiener H’ diversity index
It derives from the theory of information and
measures the entropy of a sample, namely the
“saturation” of the community (Kent and Coker,
1992); it measuresuncertaintly the randomselectionof
particular species from the sample. The index is given
by the formula: H’ = - Σsi=1 ((Ni / Ns) log2 (Ni / Ns)).
S being the total number of present species, Ni the
number ofthe species i in the sample and Nsthe
totalnumber. H‟ varies from 0 when there is a single
species, to log2 S, when all species present have an
equivalence abundance.
Piélou equitability
Equitability constitute a second fundamental
dimension of diversity, (Ramade, 1984). It is the ratio
of the maximum diversity (Hmax), it is expressed as
follows:
E= H‟ / Hmax
Hmax= Log2 (S)
S is the number of species forming the
population.Equitability makes it possible to compare
the structures of population.
Simpson index
This expression is probability for two individuals
selected randomly among the studied population to
belong to the same species. In a community it
determines the way individuals are distributed among
species of a community; it is also an inverse measure
of diversity.
D = 1/Ʃ(Ni/N)2
Structure indices
To determine the most important species in each type
of vegetation, we usedimportance index value (IVI).
IVI = relative abundance + relative dominance +
relative frequency. The species were then classified
according to be their IVI, the with the important IVI
is considered to be the most important in the plot
(Curtis and McIntosh, 1951). To establish the relative
importance of families, Familial Index Value (FIV)
was used. FIV = relative abundance + relative
dominance + relative diversity. FIV is obtained by
summingthe relative value of abundance, diversity
and relative dominance (Cottam and Curtis, 1956;
Mori et al., 1983). Values of IVI and FIV are between
0 (absence of dominance) and 300
(monodominance). These indices identify the
J. Bio. &Env. Sci. 2017
167 | Fobaneet al.
dominant entity of a community in a compartment,
implying species and families which ecologic value.
Reitsma (1988) consider that a species or a family is
ecologically dominant when IVI or IFV >10. Similar
to previous works carried out by several authors like
Danserau and Lems (1957); Evrard (1968); Mandango
(1982), White (1979; 1983); Apema (1995);Sonké
(1998); Yongo (2004);Senterre (2005);Kouob
(2009);Beina (2011) on chorology and
phytogeography, diaspores, ecological characteristics
of tropical forest species of Central Africa,we have
defined the chorological types, phytogeographical
types, types of diaspores and distribution modes of
vegetation of both forests in this study.
Statistical analysis
Correspondence analysis (AC) was used to determine
different groups from the environmental variables
such as altitude, rainfall, and diversity indices. For
that, a BiodiversityR package (Kindt and Coe, 2005)
of the software program R (R Core Team, 2015) was
used. The diversity indices of the different groups
were compared using ANOVA and the Turkey HSD
test when a significant difference was observed. These
analyses was performed using a package
Recommender (Fox, 2005) of the same software.
Results and discussions
Distribution of groups
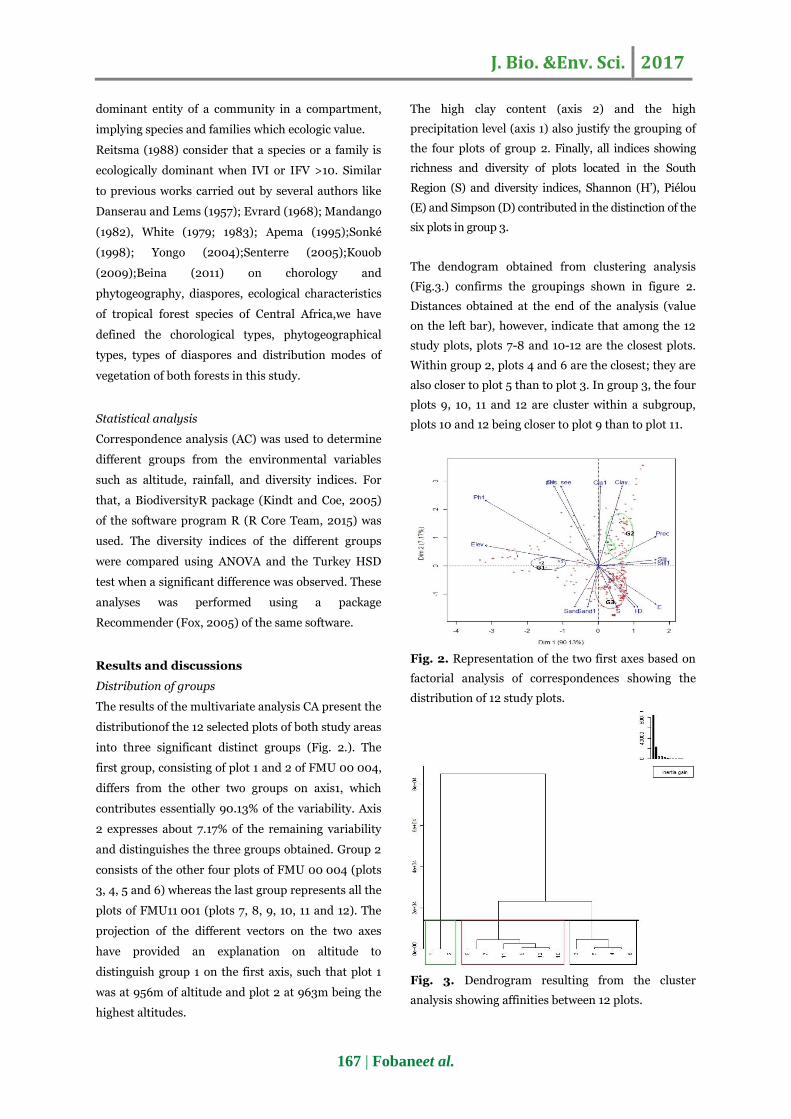
The results of the multivariate analysis CA present the
distributionof the 12 selected plots of both study areas
into three significant distinct groups (Fig. 2.). The
first group, consisting of plot 1 and 2 of FMU 00 004,
differs from the other two groups on axis1, which
contributes essentially 90.13% of the variability. Axis
2 expresses about 7.17% of the remaining variability
and distinguishes the three groups obtained. Group 2
consists of the other four plots of FMU 00 004 (plots
3, 4, 5 and 6) whereas the last group represents all the
plots of FMU11 001 (plots 7, 8, 9, 10, 11 and 12). The
projection of the different vectors on the two axes
have provided an explanation on altitude to
distinguish group 1 on the first axis, such that plot 1
was at 956m of altitude and plot 2 at 963m being the
highest altitudes.
The high clay content (axis 2) and the high
precipitation level (axis 1) also justify the grouping of
the four plots of group 2. Finally, all indices showing
richness and diversity of plots located in the South
Region (S) and diversity indices, Shannon (H‟), Piélou
(E) and Simpson (D) contributed in the distinction of the
six plots in group 3.
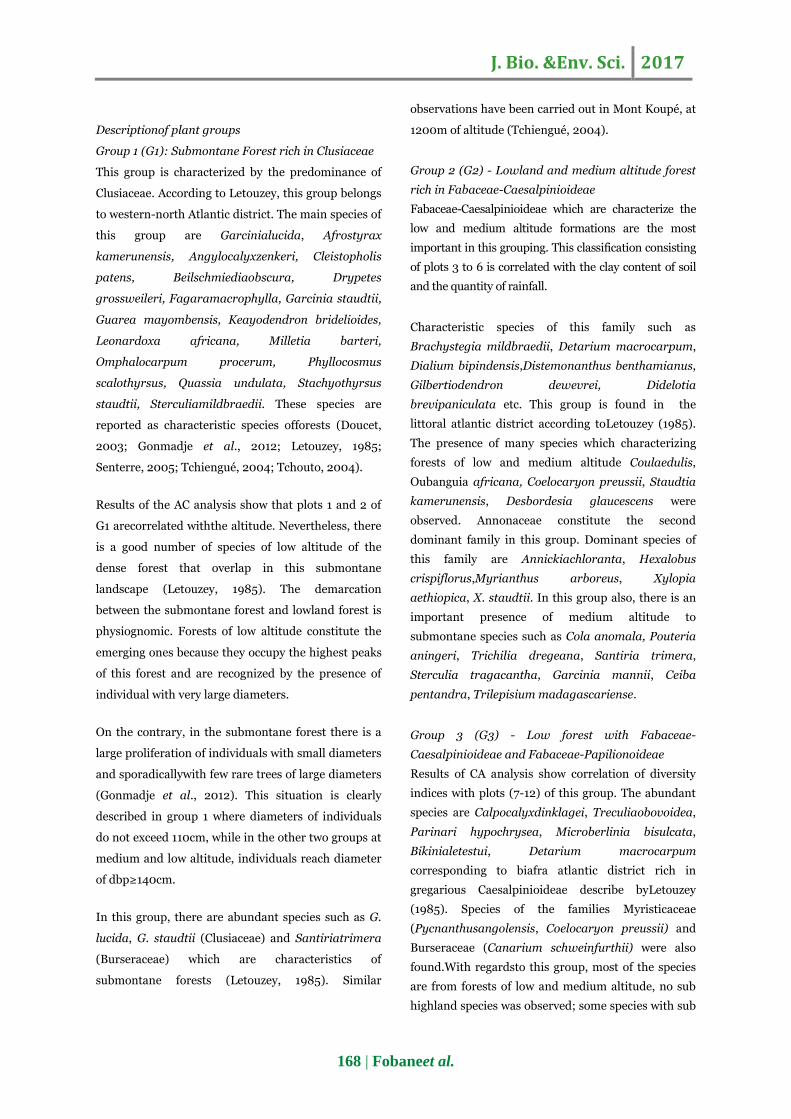
The dendogram obtained from clustering analysis
(Fig.3.) confirms the groupings shown in figure 2.
Distances obtained at the end of the analysis (value
on the left bar), however, indicate that among the 12
study plots, plots 7-8 and 10-12 are the closest plots.
Within group 2, plots 4 and 6 are the closest; they are
also closer to plot 5 than to plot 3. In group 3, the four
plots 9, 10, 11 and 12 are cluster within a subgroup,
plots 10 and 12 being closer to plot 9 than to plot 11.
Fig. 2. Representation of the two first axes based on
factorial analysis of correspondences showing the
distribution of 12 study plots.
Fig. 3. Dendrogram resulting from the cluster
analysis showing affinities between 12 plots.
J. Bio. &Env. Sci. 2017
168 | Fobaneet al.
Descriptionof plant groups
Group 1 (G1): Submontane Forest rich in Clusiaceae
This group is characterized by the predominance of
Clusiaceae. According to Letouzey, this group belongs
to western-north Atlantic district. The main species of
this group are Garcinialucida, Afrostyrax
kamerunensis, Angylocalyxzenkeri, Cleistopholis
patens, Beilschmiediaobscura, Drypetes
grossweileri, Fagaramacrophylla, Garcinia staudtii,
Guarea mayombensis, Keayodendron bridelioides,
Leonardoxa africana, Milletia barteri,
Omphalocarpum procerum, Phyllocosmus
scalothyrsus, Quassia undulata, Stachyothyrsus
staudtii, Sterculiamildbraedii. These species are
reported as characteristic species offorests (Doucet,
2003; Gonmadje et al., 2012; Letouzey, 1985;
Senterre, 2005; Tchiengué, 2004; Tchouto, 2004).
Results of the AC analysis show that plots 1 and 2 of
G1 arecorrelated withthe altitude. Nevertheless, there
is a good number of species of low altitude of the
dense forest that overlap in this submontane
landscape (Letouzey, 1985). The demarcation
between the submontane forest and lowland forest is
physiognomic. Forests of low altitude constitute the
emerging ones because they occupy the highest peaks
of this forest and are recognized by the presence of
individual with very large diameters.
On the contrary, in the submontane forest there is a
large proliferation of individuals with small diameters
and sporadicallywith few rare trees of large diameters
(Gonmadje et al., 2012). This situation is clearly
described in group 1 where diameters of individuals
do not exceed 110cm, while in the other two groups at
medium and low altitude, individuals reach diameter
of dbp≥140cm.
In this group, there are abundant species such as G.
lucida, G. staudtii (Clusiaceae) and Santiriatrimera
(Burseraceae) which are characteristics of
submontane forests (Letouzey, 1985). Similar
observations have been carried out in Mont Koupé, at
1200m of altitude (Tchiengué, 2004).
Group 2 (G2) - Lowland and medium altitude forest
rich in Fabaceae-Caesalpinioideae
Fabaceae-Caesalpinioideae which are characterize the
low and medium altitude formations are the most
important in this grouping. This classification consisting
of plots 3 to 6 is correlated with the clay content of soil
and the quantity of rainfall.
Characteristic species of this family such as
Brachystegia mildbraedii, Detarium macrocarpum,
Dialium bipindensis,Distemonanthus benthamianus,
Gilbertiodendron dewevrei, Didelotia
brevipaniculata etc. This group is found in the
littoral atlantic district according toLetouzey (1985).
The presence of many species which characterizing
forests of low and medium altitude Coulaedulis,
Oubanguia africana, Coelocaryon preussii, Staudtia
kamerunensis, Desbordesia glaucescens were
observed. Annonaceae constitute the second
dominant family in this group. Dominant species of
this family are Annickiachloranta, Hexalobus
crispiflorus,Myrianthus arboreus, Xylopia
aethiopica, X. staudtii. In this group also, there is an
important presence of medium altitude to
submontane species such as Cola anomala, Pouteria
aningeri, Trichilia dregeana, Santiria trimera,
Sterculia tragacantha, Garcinia mannii, Ceiba
pentandra, Trilepisium madagascariense.
Group 3 (G3) - Low forest with Fabaceae-
Caesalpinioideae and Fabaceae-Papilionoideae
Results of CA analysis show correlation of diversity
indices with plots (7-12) of this group. The abundant
species are Calpocalyxdinklagei, Treculiaobovoidea,
Parinari hypochrysea, Microberlinia bisulcata,
Bikinialetestui, Detarium macrocarpum
corresponding to biafra atlantic district rich in
gregarious Caesalpinioideae describe byLetouzey
(1985). Species of the families Myristicaceae
(Pycnanthusangolensis, Coelocaryon preussii) and
Burseraceae (Canarium schweinfurthii) were also
found.With regardsto this group, most of the species
are from forests of low and medium altitude, no sub
highland species was observed; some species with sub
J. Bio. &Env. Sci. 2017
169 | Fobaneet al.
highland affinity present densities that are relatively
low. Discriminating species of this group are
Plagiostyles africana and Staudtia kamerunensis.
Floristic richness and diversity
Flora surveys carried out in the 12 plots of one hectare
set up in Yingui forest (FMU 11 001) and Okoroba
forest (FMU 00 004) resulted in the identification of
6425 individuals plants.
The tree species flora of these two forests is rich in
317 species, 212 genres and 60 families were
observed. The number of species per group varies
from 82 to 130 among the 12 plots and the mean
number of species in G1 is 100.50 ± 17.68, in G2 is
93.00±6.48 and 119.17 ± 9.13 in G3 (Table 1).
Statistical analysis revealed that groups varied
significantly (P=0.0066).
The Shannon diversity index between plots varies
from 3, 6 to 4, it has been stated that 4 indicates a
rich and diversified forest (Gonmadje et al., 2012;
Kent and Coker, 1992). This assertion is confirmed
with values obtained in the three groups. The specific
diversity has a high value inG3 (4.19 ± 0.16), while
values of the two other groups are relatively
similar(3.79 ± 0.29for G1) and (3.88 ± 0.18 for G2).
High specific plant diversity is observed in a biotope
whose capacity is high compared to G1 and G2, G3
would therefore be one of the most interesting areas
based on the flora. Values of Pielou and Simpson
indices showed no significant differences among the
three groups. These values indicate a relative stability
within these forests.
Table 1.Summary of diversity indices observed in the three groups.
Parameter Group1 Group 2 Group 3 P.value
Specificrichness (S) 100,50 ± 17,68ab 93,00 ± 6,48a 119,17 ± 9,13b 0,0066
PiélouEquitability (E) 0,821 ± 0,02a 0,85 ± 0,03a 0,88 ± 0,03a 0,104
Shannon Weaver (H) 3,79 ± 0,29a 3,88 ± 0,18a 4,19 ± 0,16b 0,0339
Simpson index 0,95 ± 0,02a 0,96 ± 0,2a 0,97 ±0,01a 0,12
Different letters which are on the same line indicate a significant difference among groups to P<0,05.
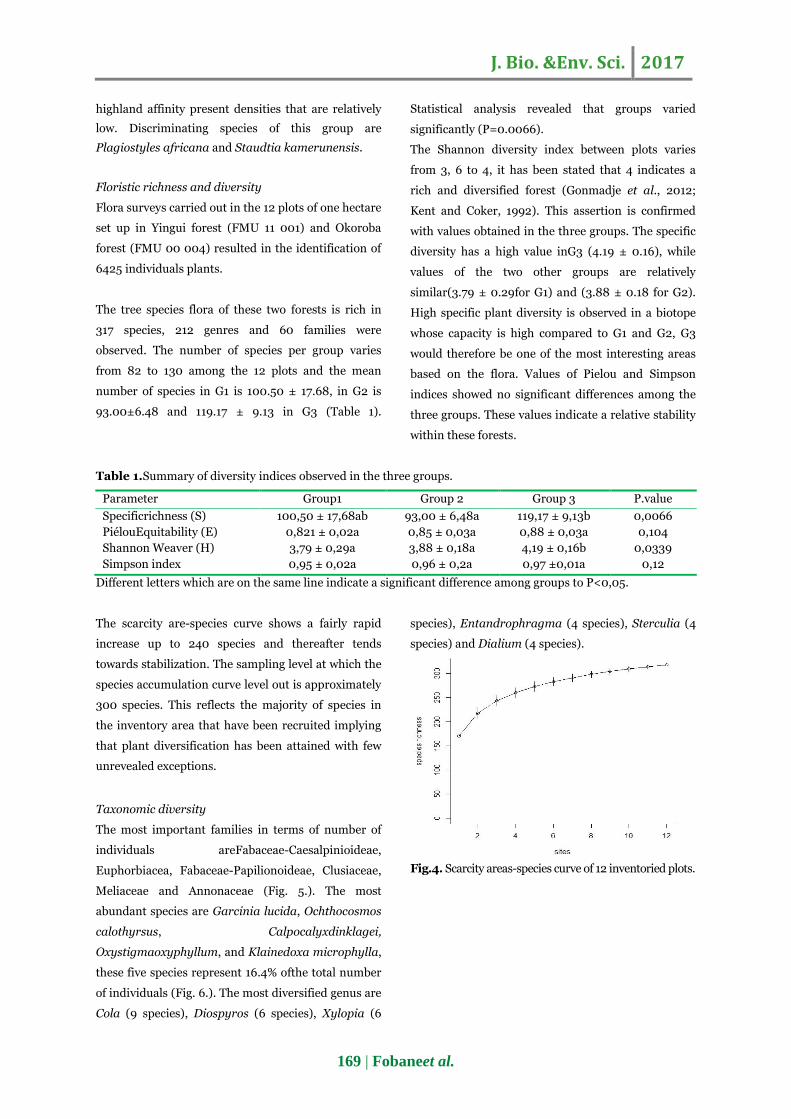
The scarcity are-species curve shows a fairly rapid
increase up to 240 species and thereafter tends
towards stabilization. The sampling level at which the
species accumulation curve level out is approximately
300 species. This reflects the majority of species in
the inventory area that have been recruited implying
that plant diversification has been attained with few
unrevealed exceptions.
Taxonomic diversity
The most important families in terms of number of
individuals areFabaceae-Caesalpinioideae,
Euphorbiacea, Fabaceae-Papilionoideae, Clusiaceae,
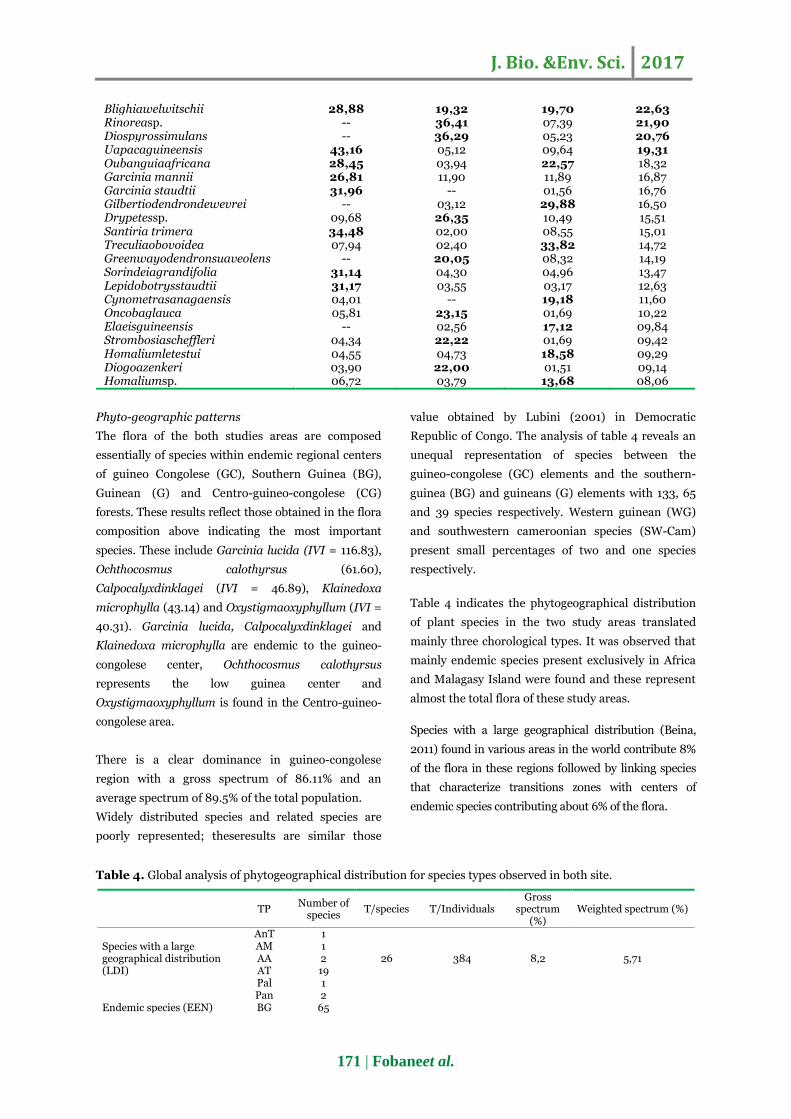
Meliaceae and Annonaceae (Fig. 5.). The most
abundant species are Garcinia lucida, Ochthocosmos
calothyrsus, Calpocalyxdinklagei,
Oxystigmaoxyphyllum, and Klainedoxa microphylla,
these five species represent 16.4% ofthe total number
of individuals (Fig. 6.). The most diversified genus are
Cola (9 species), Diospyros (6 species), Xylopia (6
species), Entandrophragma (4 species), Sterculia (4
species) and Dialium (4 species).
Fig.4. Scarcity areas-species curve of 12 inventoried plots.
J. Bio. &Env. Sci. 2017
170 | Fobaneet al.
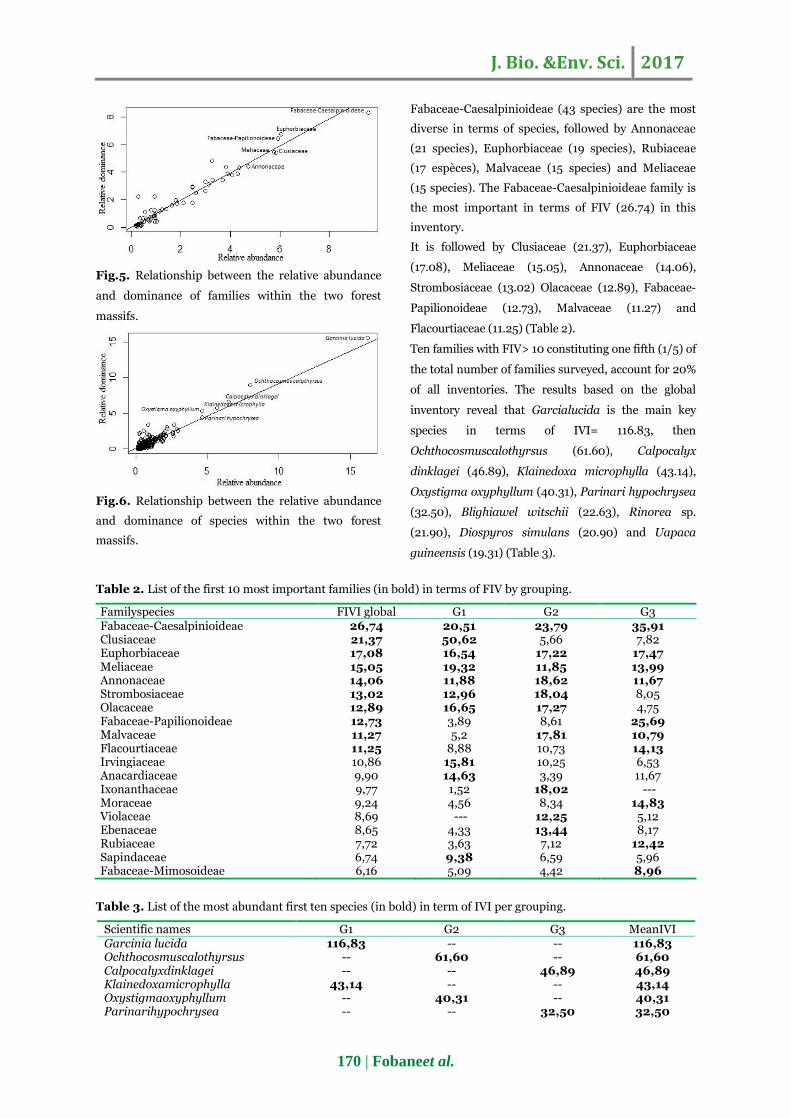
Fig.5. Relationship between the relative abundance
and dominance of families within the two forest
massifs.
Fig.6. Relationship between the relative abundance
and dominance of species within the two forest
massifs.
Fabaceae-Caesalpinioideae (43 species) are the most
diverse in terms of species, followed by Annonaceae
(21 species), Euphorbiaceae (19 species), Rubiaceae
(17 espèces), Malvaceae (15 species) and Meliaceae
(15 species). The Fabaceae-Caesalpinioideae family is
the most important in terms of FIV (26.74) in this
inventory.
It is followed by Clusiaceae (21.37), Euphorbiaceae
(17.08), Meliaceae (15.05), Annonaceae (14.06),
Strombosiaceae (13.02) Olacaceae (12.89), Fabaceae-
Papilionoideae (12.73), Malvaceae (11.27) and
Flacourtiaceae (11.25) (Table 2).
Ten families with FIV> 10 constituting one fifth (1/5) of
the total number of families surveyed, account for 20%
of all inventories. The results based on the global
inventory reveal that Garcialucida is the main key
species in terms of IVI= 116.83, then
Ochthocosmuscalothyrsus (61.60), Calpocalyx
dinklagei (46.89), Klainedoxa microphylla (43.14),
Oxystigma oxyphyllum (40.31), Parinari hypochrysea
(32.50), Blighiawel witschii (22.63), Rinorea sp.
(21.90), Diospyros simulans (20.90) and Uapaca
guineensis (19.31) (Table 3).
Table 2. List of the first 10 most important families (in bold) in terms of FIV by grouping.
Familyspecies FIVI global G1 G2 G3 Fabaceae-Caesalpinioideae 26,74 20,51 23,79 35,91 Clusiaceae 21,37 50,62 5,66 7,82 Euphorbiaceae 17,08 16,54 17,22 17,47 Meliaceae 15,05 19,32 11,85 13,99 Annonaceae 14,06 11,88 18,62 11,67 Strombosiaceae 13,02 12,96 18,04 8,05 Olacaceae 12,89 16,65 17,27 4,75 Fabaceae-Papilionoideae 12,73 3,89 8,61 25,69 Malvaceae 11,27 5,2 17,81 10,79 Flacourtiaceae 11,25 8,88 10,73 14,13 Irvingiaceae 10,86 15,81 10,25 6,53 Anacardiaceae 9,90 14,63 3,39 11,67 Ixonanthaceae 9,77 1,52 18,02 --- Moraceae 9,24 4,56 8,34 14,83 Violaceae 8,69 --- 12,25 5,12 Ebenaceae 8,65 4,33 13,44 8,17 Rubiaceae 7,72 3,63 7,12 12,42 Sapindaceae 6,74 9,38 6,59 5,96 Fabaceae-Mimosoideae 6,16 5,09 4,42 8,96
Table 3. List of the most abundant first ten species (in bold) in term of IVI per grouping.
Scientific names G1 G2 G3 MeanIVI Garcinia lucida 116,83 -- -- 116,83 Ochthocosmuscalothyrsus -- 61,60 -- 61,60 Calpocalyxdinklagei -- -- 46,89 46,89 Klainedoxamicrophylla 43,14 -- -- 43,14 Oxystigmaoxyphyllum -- 40,31 -- 40,31 Parinarihypochrysea -- -- 32,50 32,50
J. Bio. &Env. Sci. 2017
171 | Fobaneet al.
Blighiawelwitschii 28,88 19,32 19,70 22,63 Rinoreasp. -- 36,41 07,39 21,90 Diospyrossimulans -- 36,29 05,23 20,76 Uapacaguineensis 43,16 05,12 09,64 19,31 Oubanguiaafricana 28,45 03,94 22,57 18,32 Garcinia mannii 26,81 11,90 11,89 16,87 Garcinia staudtii 31,96 -- 01,56 16,76 Gilbertiodendrondewevrei -- 03,12 29,88 16,50 Drypetessp. 09,68 26,35 10,49 15,51 Santiria trimera 34,48 02,00 08,55 15,01 Treculiaobovoidea 07,94 02,40 33,82 14,72 Greenwayodendronsuaveolens -- 20,05 08,32 14,19 Sorindeiagrandifolia 31,14 04,30 04,96 13,47 Lepidobotrysstaudtii 31,17 03,55 03,17 12,63 Cynometrasanagaensis 04,01 -- 19,18 11,60 Oncobaglauca 05,81 23,15 01,69 10,22 Elaeisguineensis -- 02,56 17,12 09,84 Strombosiascheffleri 04,34 22,22 01,69 09,42 Homaliumletestui 04,55 04,73 18,58 09,29 Diogoazenkeri 03,90 22,00 01,51 09,14 Homaliumsp. 06,72 03,79 13,68 08,06
Phyto-geographic patterns
The flora of the both studies areas are composed
essentially of species within endemic regional centers
of guineo Congolese (GC), Southern Guinea (BG),
Guinean (G) and Centro-guineo-congolese (CG)
forests. These results reflect those obtained in the flora
composition above indicating the most important
species. These include Garcinia lucida (IVI = 116.83),
Ochthocosmus calothyrsus (61.60),
Calpocalyxdinklagei (IVI = 46.89), Klainedoxa
microphylla (43.14) and Oxystigmaoxyphyllum (IVI =
40.31). Garcinia lucida, Calpocalyxdinklagei and
Klainedoxa microphylla are endemic to the guineo-
congolese center, Ochthocosmus calothyrsus
represents the low guinea center and
Oxystigmaoxyphyllum is found in the Centro-guineo-
congolese area.
There is a clear dominance in guineo-congolese
region with a gross spectrum of 86.11% and an
average spectrum of 89.5% of the total population.
Widely distributed species and related species are
poorly represented; theseresults are similar those
value obtained by Lubini (2001) in Democratic
Republic of Congo. The analysis of table 4 reveals an
unequal representation of species between the
guineo-congolese (GC) elements and the southern-
guinea (BG) and guineans (G) elements with 133, 65
and 39 species respectively. Western guinean (WG)
and southwestern cameroonian species (SW-Cam)
present small percentages of two and one species
respectively.
Table 4 indicates the phytogeographical distribution
of plant species in the two study areas translated
mainly three chorological types. It was observed that
mainly endemic species present exclusively in Africa
and Malagasy Island were found and these represent
almost the total flora of these study areas.
Species with a large geographical distribution (Beina,
2011) found in various areas in the world contribute 8%
of the flora in these regions followed by linking species
that characterize transitions zones with centers of
endemic species contributing about 6% of the flora.
Table 4. Global analysis of phytogeographical distribution for species types observed in both site.
TP
Number of species
T/species T/Individuals Gross
spectrum (%)
Weighted spectrum (%)
Species with a large geographical distribution (LDI)
AnT 1
AM 1
AA 2 26 384 8,2 5,71 AT 19
Pal 1
Pan 2
Endemic species (EEN) BG 65
J. Bio. &Env. Sci. 2017
172 | Fobaneet al.
BGC 6
CG 27
GC 133 273 5751 86,11 89,5 G 39
SW-Cam 1
WG 2
Linking species (ELI) GC-SZ 8
18 290 5,73 4,11
GC-Z 10 Based on the chorological types (BG, BGC, CG, GC,
and G), the flora of these areas is made up of 86%
species having guineo-congolese characteristics. This
guineo-congolese chorological status is confirmed by
the zoning proposed by White (1979). The flora of
these areas is present above the gradient of Guineo-
congolese affinity according to the description of
Senterre (2005). This is justified by the following
classification Mbaiki forest (56%), Okoroba and
Yingui forests (86%), Dja Biosphere Reserve (RBD)
(88%), National Park of Monte Alen (92%) and Ndoté
Reserve (95%) (Beina, 2011). Flora of Okoroba and
Yingui forestsis characterize by a percentage of
guineo-congolese species overlapping between Mbaiki
and RBD. According to Senterre (2005), the
percentage of guineo-congolese endemism increases
as towards the sea. This assertion is not verified here,
because Okoroba and Yingui forests are probably
closer to the sea than the RBD. This phenomenon
could be explained by the relatively high rate of
species of other chories, which represent a total of
14% species of linkage and species with a wide
geographical distribution.
Moreover, based on the guineo-congolese species,
Okoroba and Yingui forests would have a fairly high
proportion of species as a semi-deciduous forest.
However it should be noted that guineo-congolese
species are better represented in the forests studied.
Such a level of endemism is paleo-climatic, aspointed
by Maley (1996) there exist forest refuges where the
convergence of ideas of the great majority still suffers
from the relevance of this concept.
Chorological types
Modes of dissemination have been determined for the
types of diaspores, the gross and the chorological
spectra of slide types of all groups are recorded in
table 5. This table shows that the sarcochore type
gathers the largest number of species (58.99%) and
the best cover (63.45%) in front of the ballochore and
pterochore types. The other types, although been
present, are poorly represented in both spectra. The
smallest proportions are recorded by pogonochore
type with 1.26% of the gross spectrum and 0.51% of
weighted spectrum.
Table 5. Analysis types of dissemination in the three groups.
Types Number of species Number of individuals Gross
spectrum (%) Weighted spectrum
(%) Ballochores (Ballo) 42 889 13,25 13,83 Barochores (Baro) 34 476 10,73 7,4 Pogonochores (Pogo) 4 33 1,26 0,51
Ptérochores (Ptéro) 40 844 12,62 13,13
Sarcochores (Sarco) 187 4077 58,99 63,45
Sclérochores (Scléro) 10 106 3,15 1,64
Total 317 6425 100 100
Table 6. Gross and weighted spectra and diaspora types.
Diaspores types G1 G2 G3 Pvalue Ballochores 6,82±1,61 a
3,41±1,97 a 10,56±3,18ab 6,73±3,88 a
14,06±2,16b 17,07±6,43b
0,0155 0,014
Barochores 11,62±3,58 6,36±2,19
8,84±0,89 8,05±5,92
8,79±1,46 11,98±7,55
0,158 0,507
Pogonochores 0,44±0,625 0,08±0,10
1,62±0,63 2,78±2,38
1,39±1,00 6,79±10,38
0,318 0,537
Pterochores 6,63±1,87 2,09±0,10
11,87±1,46 12,92±11,54
12,19±2,98 16,15±5,59
0,055 0,146
J. Bio. &Env. Sci. 2017
173 | Fobaneet al.
Sarcochores 63,93±2,80 a 82,95±5,02b
67,57±19,02 a 26,37±25,51a
96,88±2,49 b 38,17±16,36a
0,0035 0,023
Sclerochores 3,35±1,52 1,24±0,87
3,87±4,11 2,81±2,48
2,11±0,747 8,29±9,51
0,553 0,39
The first line represents the gross spectrum while the second line represents the weighted spectrum. Following
each line different letters indicate a significant difference at the 5% threshold.
Looking at table 6, it is noticed that only ballochores
and sarcochores diaspores are statistically significant.
However, gross spectrum of ballochores species of G1
and G3 are found to vary significantly while between
G1-G2 and G2-G3 show no difference. Concerning the
sarcochores species, there is significant difference
between G1-G3 and G2-G3, while G1-G2 do not vary
significantly for P<0, 05. The primacy of species
which made up the sarcochore diasporesin the forest
formations have been emphasized by several authors.
Howe (1984) cited by Doucet (2003) suggests that in
paleotropical forests, 35 to 48% of trees that occupy
the highest peaks of the forest are zoochores and 70
to 80% occur in the inferior strata. Moreover, Evrard
(1968) notes that the fleshy diaspores, in this case the
sarcochores, are the most frequent in most of the
undergrowth. Kouka (2000) indicates the prevalence
of zoochoryfound between 70 and 78% in this type of
formation in Congo. In Cameroon, Sonké (1998)
emphasizes the importance of sarcochores diaspores,
which account for almost 83% of all species.
Conclusion
This work constitutes the first result of a series of
research undertaken in order to enrich knowledge or
evidences on the biodiversity of atlantic forests.The
most diversified genus is Cola (9 species) followed by
Diospyros (6 species). Fabaceae-Caesalpinioideae (43
species) are the most diverse in terms of species. With
regard to IVI, Garcinia lucidais the most important
specie with (IVI = 116.83). The high level of diversity
and specificity of group three indicates its priority in
conservation area. However, the decision concerning
the delimitation of this sector for conservation is
based on a compromise between the economic and
environmental interest of the studied areas. Further
research is required to determine the conservation
status and the level of endemism of these forests. In
order to achieve this, it would be important to
increase the sampling size by integrating other forests
of the sub region that are part of this massif.
Acknowledgements
We express our gratitude to Transformation Reef
Cameroon company which facilitated this research
with necessary logistics for this work.
Special thanks go to the Idea Wild Foundation for
field trips material, to Dr. Nkono and Tchobsala for
their comments and Fongog Augustina, associate
professor in Higher Teacher‟s Training College of the
University of Yaoundé Ifor her comment and English
language editing of the manuscript.
Raferences
Apema AK. 1995. Etude phytosociologique des
végétations aquatiques et semi-aquatiques du Zaïre.
Thèse de doctorat, Université libre de Bruxelles.
Beina D. 2011. Diversité floristique de la foret dense
demi-décidue de Mbaiki, république centraficaine:
Etude expérimentale de l'impact de deux types
d'intervention sylvicole. PhD, Université de Picardie
Jules Verne, Amiens France.
Bikié H, Collomb JG, Djomo L, Minnemeyer S,
Ngoufo R, and Nguiffo S. 2000. Apreçu sur la
situation de l'exploitation forestière au Cameroun.
Gobal Forest Watch, Washington USA.
Bobo KS. 2012. Dynamique des grands et moyens
mammifères et des activités anthropiques dans l‟UFA
11-001: Cas des UFE 1 et 2 Transformation Reef
Cameroun, Douala, Cameroun.
Caballé G. 1978. Essai sur la phytogéographie du
Gabon. Adansonia 17, 425-440.
Campbell P, Rivera P, Duncan T, H. BB, Nzabi
T, Alonzo A, and Dallmeier F. 2006. Structure,
composition et diversité floristique d'une foret
équatoriale du Gabon. Biological society of
washington 12, 30-42.
J. Bio. &Env. Sci. 2017
174 | Fobaneet al.
Cheek M, Onana JM. 2011. Red data plant species
in Cameroon. A guide for secondary school teachers.
Royal Botanic Gardens. Kew. London-UK.
Cottam G, Curtis JT. 1956. The use of distance
measures in phytosociological sampling. Ecology 37,
451-460.
Curtis JT, McIntosh RP. 1951. An Upland Forest
Continuum in the Prairie-Forest Border Region of
Wisconsin. Ecology 32, 476-496.
Danserau P, Lems K. 1957. The grading of
dispersal types in plant communities and their
ecological significance. Institut Botanique de
l‟Université de Montreal, Montreal Canada.
Davis SD, Heywood VH, and Hamilton AC. 1994.
Centre of plant diversity: a guide and strategy for their
conservation. IUCN-The World Conservation Union.
Djama T. 2001. Inventaire quantitatif des poissons
dans l'UTO Campo Ma'an. UTO, Kribi, Cameroun.
Doucet JL. 2003. L‟alliance délicate de la gestion
forestière et de la biodiversité dans les forêts du
centre du Gabon. Thèse de doctorat, Faculté
Universitaire des Sciences Agronomiques de
Gembloux, Gembloux Belgique.
Doumenge C, Garcia Yuste JE, Gartlan S,
Langrand O, Ndinga A. 2001. Conservation de la
biodiversité forestière en Afrique centrale atlantique:
le reseau d'aires protégées est-il adéquat?=Forest
biodiversity conservation in Atlantic regions of
Central Africa: is the protected area system efficient?
Bois et forets des tropiques 228, 5-28.
Doumenge C, Ndinga A, Fomete Nembot T,
Tchanou Z, Micha Ondo V, Ona Nze N,
Bourobou Bourobou H, Ngoye A. 2003.
Conservation de la biodiversité forestière en Afrique
centrale atlantique. II. Identification d‟un réseau de sites
critiques. Bois et forets des tropiques 276, 43-57.
Effala G. 2007. Etude socio-économique réalisée
dans les villages riverain de l‟UFA 11-001: Synthèse
des données générales et analyse des résultats
d‟enquêtes. Transformation Reef Cameroun, Douala,
Cameroun.
Ekobo A. 2008. Etude Sur les Potentialités
Fauniques de l‟UFA 11-001 Province du Sud ouest,
Cameroun. WWF.
Evrard C. 1968. Recherches écologiques sur le
peuplement forestier des sols hydromorphes de la
cuvette congolaise. In, Vol. 110, pp. 1-295. Publ. INEAC.
FAO. 2006. Global forest resources assessment
2005: progress towards sustainable forest
management Rome. United Nations Food and
Agriculture Organization, Rome Italie.
Fox J. 2005. The R Commander: A Basic Statistics
Graphical UserInterface to R. Journal of Statistical
Software 14, 1-42.
Gasel J. 1957. Géologie du Cameroun. FOM,
Cameroun.
Gonmadje CF, Doumenge C, Sunderland TCH,
Balinga MPB, Sonké B. 2012. Analyse
phytogéographique des forêts d‟Afrique Centrale: le
cas du massif de Ngovayang (Cameroun. Plant
Ecology and Evolution 145, 152-164.
Holmgren P, Marklund LG, Saket M, Wilkie
ML. 2007. Forest monitoring and assessment for
climate change reporting: partnerships, capacity
building and delivery In Forest Resources Assessment
Working, pp. 142. FAO, Rome Italie.
Kam MD, Fines JP, Akogo G, eds. 2002. Schéma
directeur pour le développement de l'Unité Technique
Opérationnelle de Campo Ma'an. UTO, Kribi Cameroun.
Kent M, and Coker P. 1992. Vegetation description
and analysis: a practical approach, London UK.
J. Bio. &Env. Sci. 2017
175 | Fobaneet al.
Kindt R, Coe R. 2005. Tree diversity analysis. A
manual and software for common statistical methods
for ecological and biodiversity studies. Nairobi: World
Agroforestry Centre (ICRAF). 207.
Kouka LA. 2000. Recherches sur la flore, la
structure et la dynamique des forets du parc national
d'Odzala (Congo Brazzaville). Thèse de doctorat,
Université Libre de Bruxelles, Bruxelles Belgique.
Kouob BS. 2009. Organisation de la diversité
végétale dans les forêts matures de terre ferme du
sud-est Cameroun. Doctorat, Université Libre de
Bruxelles, Bruxelles Belgique.
Kuper W, Sommer JH, Lovett JC, Mutke J,
Linder HP, Beentje HJ, Van Rompaey R,
Chatelain C, Sosef M, Barthlott W. 2004.
Africa‟s hotspots of biodiversity redefined. Annals of
the Missouri Botanical Garden 91, 525-535.
Letouzey R. 1968. Etude phytogéographique du
Cameroun, Lechevallier P, Paris France.
Letouzey R. 1985. Carte Phytogéographique du
Cameroun au 1: 500 000, accompagnée de: Notice de
la carte phytogéographique du Cameroun au 1: 500
000. 4) TV: Domaine de la forêt dense humide
toujours verte (Pages 95 à 142 avec groupements nº
185 à 267), Institut de la carte internationale de
végétation, Toulouse france.
Linder HP. 2001. Plant diversity and endemism in
sub-Saharan tropical Africa. Journal of Biogeography
28, 169-182.
Maley J. 1996. The african rain forest main
characteristics of changes in vegetation and climate
for the upper Cretaceous of the Quaternary.
Proceedingof Royal Society of Biology Sciences 31-73.
Mandango MA. 1982. Flore et végétation des iles du
fleuve Zaire dans la sous-région dela Tshopo (Haut-
Zaire). Thèse de doctorat, Université de Kisangani,
Kisangani Zaire.
Mori SA, Boom BM, De Carvalino AM. 1983.
Ecological importance of Myrtaceae in an Eastern
Brazilian wet forest. Biotropica 15, 68-70.
Onana JM. 2011. The vascular plants of Cameroon. A
taxonomic checklist with IUCN assessments: 26. Flore
du Cameroon 39"occasional volume"The national
Herbarium of Cameroon Ministry of Scientific Research
and Innovation. Yaoundé-Cameroon.
Onana JM. 2013. Synopsis des espèces végétales
vasculaires endémiques et rares du Cameroun. Check
liste pour la gestion durable et la conservation de la
biodiversité. In Flore du Cameroun. (J. M. Onana,
Ed.), Vol. 40, pp. 277. Ministère de la Recherche et de
l'Innovation, Yaoundé, Cameroun.
Onana JM, Cheek M. 2011. Red data book of the
flowering plants of Cameroon: IUCN global
assessments. Royal Botanic Gardens. Kew. London- UK.
R Core Team. 2015. R: A language and environment
for statistical computing. In. R Foundation for
Statistical Computing, Vienna Austria.
Ramade F.1984. Eléments d‟écologie. Écologie
fondamentale 2 Paris France.
Reitsma JM. 1988. Forest vegetation of Gabon. The
Tropenbos Foundation, Pays-Bas.
République du Cameroun. 2014. Cinquième
rapport national du Cameroun à la Convention sur la
Biodiversité MINEPDED, Yaoundé-Cameroun.
Senterre B. 2001. La phytogéographie des forêts
denses de Guinée Equatoriale, avec une attention
particulière aux forêts de Nsork.. Systematics and
Geography of Plants 71, 1087-1096.
Senterre B. 2005. Recherches méthodologiques
pour la typologie de la végétation et la
Phytogéographie des forêts denses d'Afrique
Tropicale. Doctorat, Université Libre de Bruxelles
Bruxelles Belgique.
J. Bio. &Env. Sci. 2017
176 | Fobaneet al.
Sonké B. 1998. Etudes floristiques et structurales
des forêts de la Réserve de Faune du Dja (Cameroun).
Doctorat, Université libre de Bruxelles, Bruxelles
Belgique.
Sunderland TCH, Comiskey JA, Besong S, Mboh
H, Fonwebon J, Dione MA. 2003. Vegetation
Assessment of Takamanda Forest Reserve, Cameroon.
Smithsonian Institution, Washington USA.
Tchiengué B. 2004. Etude écologique et floristique
de la végétation d‟un massif de la ligne du Cameroun:
le mont Koupé. Thèse de doctorat, Université de
Yaoundé I, Yaoundé Cameroun.
Tchouto MGP. 2004. Plant diversity in central
African rain forest. Implications for biodiversity
conservation in Cameroon. PhD thesis, Wageningen
University, Wageningen Netherland.
Tchouto MGP, De Wilde J, De Boer WF, Van Der
Maesen LJG, Cleef A. 2009. Bio-indicator species
and Central African rain forest refuges in the Campo-
Ma‟an area. Systematics and Biodiversity 7, 21-31.
Tchouto MGP, Yemefack M, Boer W, Wilde J,
Maesen L, Cleef A. 2006. Biodiversity Hotspots
and conservation priorities in the Campo-Ma'an rain
forest, Cameroun. Boiodiversity and conservation 15,
1219-1259.
Vivien J. 1991. Faune du Cameroun. Guide des
mammifères et poissons. GICAM Cameroun.
White F. 1979. The Guineo-Congolian Region and its
relationships to other phytochoria. Bull Jard Bot Nat
Belg49, 11-55.
White F. 1983. The vegetation of africa: a descriptive
memoir to accompany the UNESCO/AETFAT/UNSO.
Vegetation map of Africa. UNESCO, Paris France.
White LJT. 1996. Detreminants of vegetation
composition in the Lopé Reserve. AGRECO/CTFT,
Gabon.
Yongo OD. 2004. Contribution aux études floristiques,
phytogéographiques et phytosociologiques de la forêt de
Ngotto (République Centrafricaine). Thèse de doctorat,
Université de Lille, Lille.


![RESEARCH ARTICLE Open Access Gastrointestinal flora and ...€¦ · positive for GI distress, primarily with diarrhea and con-stipation [3]. A characterization study of 160 children](https://img.pdfslide.net/doc/110x75/60d552277f9816088e63c1a9/research-article-open-access-gastrointestinal-flora-and-positive-for-gi-distress.jpg)