Embed Size (px)
Citation preview
FLORIDA DEPARTMENT OF TRANSPORTATION
STATE MATERIALS OFFICE
RIGID PAVEMENT CONDITION SURVEY
HANDBOOK
March 2012
Table of Contents
Title Page
List of Tables .................................................................................................................... i
List of Figures .................................................................................................................. ii
Executive Summary ........................................................................................................ iii
I. Introduction ........................................................................................................... 1
II. Pavement Section Selection and Identification ..................................................... 3
III. Evaluation Methods ............................................................................................ 11
Ride Rating .................................................................................................... 11
Defect Rating ................................................................................................. 14
IV. Rigid Pavement Condition Survey Field Workbook ............................................ 41
Appendix A – Computer Use for Rigid Pavement Condition Survey Data ..................... 47
Appendix B – Ride Rating Re-run Procedure ................................................................ 57
Appendix C – Profiler Calibration Instructions ............................................................... 59
i
List of Tables
Table Page
1 Roadway Direction Code .................................................................................. 4
2 Standard Remarks .......................................................................................... 8
3 Numerical Deduct Values for Rigid Pavement Distresses .............................. 40
ii
List of Figures
Figure Page
1 Inertial Profiler Photograph ............................................................................. 13
2 Surface Deterioration Photograph .................................................................. 16
3 Spalling Photograph ....................................................................................... 18
4 Patching Photograph ...................................................................................... 21
5 Transverse Cracking Photograph ................................................................... 24
6 Longitudinal Cracking Photograph ................................................................. 27
7 Corner Cracking Photograph ......................................................................... 30
8 Shattered Slab Photograph ............................................................................ 32
9 Faulting Photograph ....................................................................................... 34
10 Pumping Photograph ...................................................................................... 37
11 Joint Condition Photograph ............................................................................ 39

iii
Executive Summary
This handbook has been developed as a guide for personnel responsible for conducting
the Florida Department of Transportation Pavement Condition Survey (PCS) on rigid
pavements and to ensure consistency among raters. This reference describes the
procedures for conducting a visual, mechanical and automated condition evaluation of
the Department’s rigid pavement system. Items evaluated in the survey include:
1. Surface Deterioration
2. Spalling
3. Patching
4. Transverse Cracking
5. Longitudinal Cracking
6. Corner Cracking
7. Shattered Slabs
8. Faulting
9. Pumping
10. Joint Condition
11. Ride Quality
The data collected during the PCS is used as input into the pavement management
system and for project prioritization purposes.
Keywords: Defect Rating, Ride Rating, International Roughness Index (IRI), Ride
Number (RN), Pavement Evaluation, Rigid Pavement Condition Survey, Profiler,
Roadway Characteristics Inventory (RCI), Straight Line Diagram (SLD)
Rigid Pavement Condition Survey Handbook, March 2012 Page 1
I. Introduction
The present condition of Florida’s rigid pavement system is of interest to Pavement
Management, Design, Planning, Maintenance, consultants, and other groups within the
Florida Department of Transportation.
The information provided in this handbook describes the methods used to evaluate
surface distresses and determine the ride quality of the rigid pavement. Any mention of
flexible pavement is only discussed when necessary for the completion of the Rigid
Pavement Condition Survey. For information relating to the evaluation of flexible
pavements, please refer to the Flexible Pavement Condition Survey Handbook.
The results of this evaluation provide information that is used in conjunction with other
data for the following purposes:
1. Determine the present condition of the State Highway System
2. Compare present with past condition
3. Predict future deterioration rates
4. Estimate rehabilitation funding needs
5. Provide justification for annual pavement rehabilitation budget
6. Provide justification for prioritizing rehabilitation projects
7. Provide justification for distribution of rehabilitation funds to Districts
The various changes and enhancements that have been implemented with each survey
are recorded. The “History of Florida Pavement Condition Survey” is located at the
following web address:
http://www.dot.state.fl.us/statematerialsoffice/pavement/performance/pcs/pcshistory.pdf
Rigid Pavement Condition Survey Handbook, March 2012 Page 3
II. Pavement Section Selection and Identification
The length of pavement to be evaluated will vary depending upon a number of factors.
Typical factors that create section limits (rated sections) include the following:
1. County line
2. County section or subsection
3. Construction Limits
4. Significant changes in pavement condition.
5. Structures in excess of 0.25 mile.
6. Flexible Pavement in excess of 0.50 mile in length within a Rigid Pavement
section.
As implied by the list above, a certain amount of office preparation is required prior to
the field evaluation. The Rater should have access to Construction Plans, Straight Line
Diagrams (SLD), Video-logs, Maps, Roadway Characteristics Inventory (RCI) data, and
historical PCS Data for those highways to be evaluated.
Construction Limits
Section limits should be based initially upon construction project limits. The section may
deteriorate at different rates, requiring additional “breaks” within the overall section, but
the beginning and ending mileposts must not be modified. To preserve the history of
PCS data, section limits must only be changed if the limits of a new construction project
extend into previously existing project limits. For new construction projects equal to or
greater than one mile in length, provide a financial project number (FIN), if possible.
Section Length
Pavement sections less than 0.50 miles should not be rated separately. Combine any
sections shorter than 0.50 miles with the adjacent section having the most similar
condition.
Page 4 Rigid Pavement Condition Survey Handbook, March 2012
Roadway Direction
The direction a section is rated depends on the following criteria:
Divided
Any pavement section 0.50 miles or greater that has a physical median or
permanent barrier wall separating traffic traveling in different directions. One lane in
each direction must be rated for divided roadways.
Composite (Undivided)
Pavement sections without dividers or sections where any consecutive divided
segment is less than 0.50 miles are considered composite. Composite pavement
sections include areas with paved center turn lanes. One lane in only one direction
must be rated. Rate these sections in the same direction each year, unless an
obvious difference exists based upon visual observation of the pavement condition.
In this case, the rater must rate the direction having the greatest amount of
distresses.
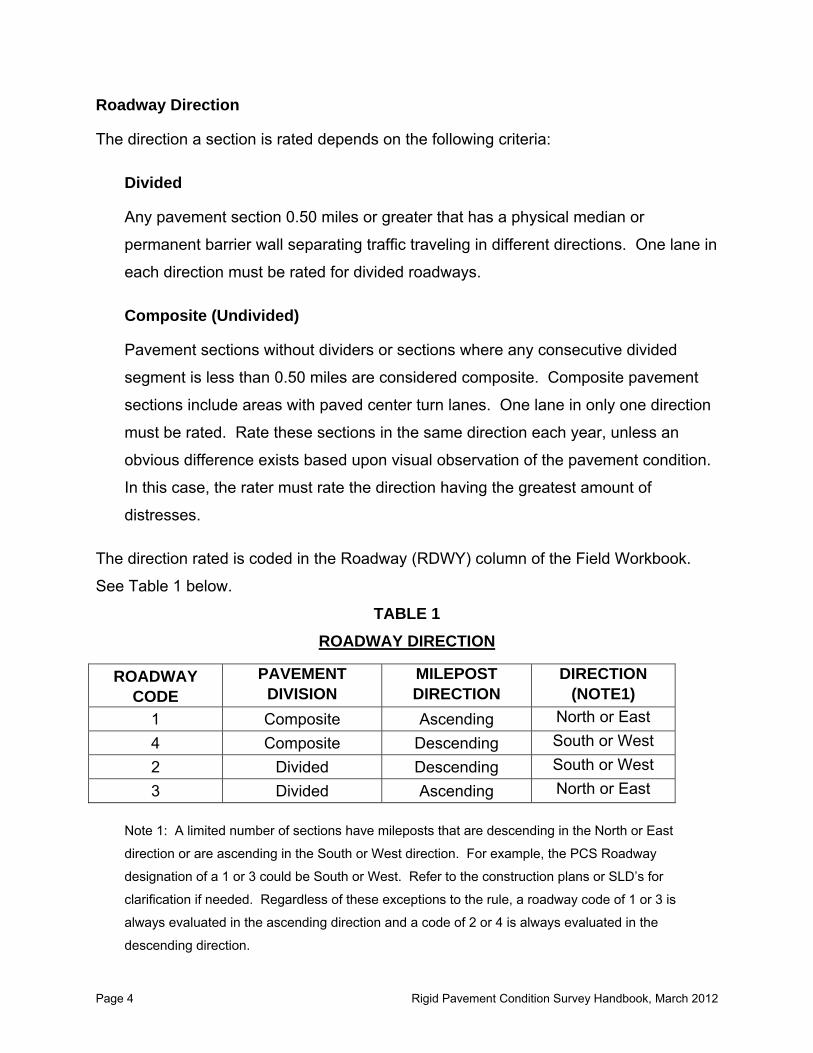
The direction rated is coded in the Roadway (RDWY) column of the Field Workbook.
See Table 1 below.
TABLE 1
ROADWAY DIRECTION
Note 1: A limited number of sections have mileposts that are descending in the North or East
direction or are ascending in the South or West direction. For example, the PCS Roadway
designation of a 1 or 3 could be South or West. Refer to the construction plans or SLD’s for
clarification if needed. Regardless of these exceptions to the rule, a roadway code of 1 or 3 is
always evaluated in the ascending direction and a code of 2 or 4 is always evaluated in the
descending direction.
ROADWAY CODE
PAVEMENT DIVISION
MILEPOST DIRECTION
DIRECTION (NOTE1)
1 Composite Ascending North or East
4 Composite Descending South or West
2 Divided Descending South or West
3 Divided Ascending North or East

Rigid Pavement Condition Survey Handbook, March 2012 Page 5
Pavement Type (Type)
The Type column of the Field Workbook is used to denote the surface type of the
roadway as well as other conditions the rater observes while performing the survey.
The following is a list of all Type codes used:
Exceptions (type 0)
Exceptions include pavement sections that are not state-maintained or sections that
overlap other sections that have been surveyed and are state-maintained. Only
code Remarks and/or Comments for sections having type 0.
Pavement Improvement (type 2)
Type 2 is for sections that have been partially rehabilitated. This includes but is not
limited to: slab replacements, crack sealing or longitudinal grinding. This code is
used to note that changes to the pavement surface were made that influence the
Crack, Rut or Ride ratings. This can result in either positive or negative changes to
the ratings. Unless additional improvements are made this type must change in the
following year. This new type will be assigned by rater. Normally this will be type 4.
Rigid Pavement (type 4)
Type 4 is for standard rigid pavement sections that do not fall under any of the other
pavement type codes.
New Construction (type 5)
Type 5 is for a newly constructed section of roadway. When a new roadway is
opened to traffic each section is noted as type 5. When a composite roadway has
new construction that changes it to a divided roadway, the lanes added in the new
direction are coded as type 5. The following year this type must change to a
different code assigned by the rater, usually type 4. Provide a financial project
number (FIN), for projects equal to or greater than one mile in length, if possible.
Page 6 Rigid Pavement Condition Survey Handbook, March 2012
No Ride (type 6)
Type 6 is for sections where the profiler is unable to achieve a repeatable ride
rating. These are normally sections that are very short, but sometimes other longer
sections have characteristics that the profiler is unable to repeat. These sections
are usually in urban areas and have features such as many cross streets with
signalized intersections and radical intersecting profiles. Do not report Ride
Number (RN) for these sections, but process data for faulting.
If a section that is New Pavement (type 7) is also a No Ride (type 6), code as New
Pavement (type 7) and do not enter any values for RN, or International Roughness
Index (IRI). Include comments for New Pavement (NP) and No Ride (NR) in the
remarks.
New Pavement (type 7)
Type 7 is to be used on sections of existing roadway, where previous pavement,
flexible or rigid, has been completely replaced with rigid pavement. The following
year this type must change to a different code assigned by the rater, usually type 4.
Provide a financial project number (FIN), for projects equal to or greater than one
mile in length, if possible.
Under Construction (type 8)
Type 8 is for areas that are under construction during the survey. Areas that are
signed as under construction can be rated providing the original surface is
undisturbed and no lane shifts or other deviations from the previously surveyed
roadway exists. This code can be used for more than one year. If type 8 is used
and upon returning the next survey it is determined that no rehabilitation took place,
the section must be coded type 4 and Not New Pavement (Not NP) coded in the
remarks.
Structures (type 9)
Type 9 is for Structures including bridges, box culverts and other permanent objects
that are equal to or greater than 0.25 miles. These structures should be
Rigid Pavement Condition Survey Handbook, March 2012 Page 7
represented by separate pavement section limits and coded as type 9. Any
structure less than 0.25 miles must remain combined with the larger section and
profiler roughness turned off. Do not provide RN or faulting data for any structure.
Mileposts recorded for structures (bridges, box culverts and other permanent
objects) as well as exceptions must come from SLD’s or RCI whenever possible,
not from distance-measuring instrument. This allows for data cross checks with
Department RCI data. Milepost limits for structures must be in agreement with RCI
feature code 258 (Structures).
If a structure is located between a flexible and rigid pavement section, coding as
type 9 in the rigid pavement survey adds the structure to the rigid pavement system.
If coded as type 0 the structure is excluded from the rigid pavement system. It is
important to ensure any structures coded as type 9 in the rigid pavement survey are
coded as type 0 in the flexible pavement survey. Not doing so would add the
mileage for the structure to both surveys.
Mileage from sections coded type 9 is also used to denote pavement sections that
have been added to the state-maintained system since the PCS was completed.
This allows the mileage to be added to the survey and also serves as a reminder for
the rater to rate the section the next year. Always code number of Travel Lanes
and Remarks for sections listed as type 9.
Lanes
For composite roadways, this is the total number of through travel lanes. For divided
roadways, this is the number of through lanes in the direction of travel. Do not include
turn lanes, parking lanes or emergency lanes in the number of Lanes. The value used
for Lane must be in agreement with RCI feature code 212 (Thru Lanes). Include the
total number of lanes in the Lanes (LN) column of the Field Workbook.
Page 8 Rigid Pavement Condition Survey Handbook, March 2012
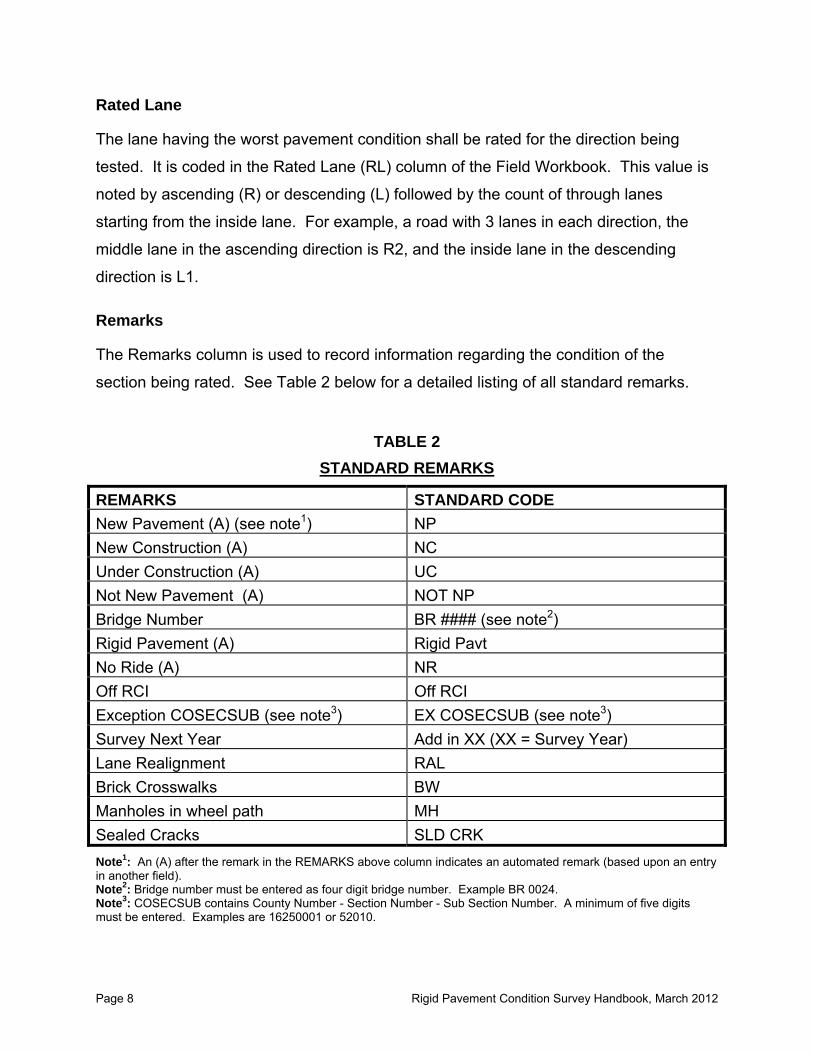
Rated Lane
The lane having the worst pavement condition shall be rated for the direction being
tested. It is coded in the Rated Lane (RL) column of the Field Workbook. This value is
noted by ascending (R) or descending (L) followed by the count of through lanes
starting from the inside lane. For example, a road with 3 lanes in each direction, the
middle lane in the ascending direction is R2, and the inside lane in the descending
direction is L1.
Remarks
The Remarks column is used to record information regarding the condition of the
section being rated. See Table 2 below for a detailed listing of all standard remarks.
TABLE 2
STANDARD REMARKS
REMARKS STANDARD CODE
New Pavement (A) (see note1) NP
New Construction (A) NC
Under Construction (A) UC
Not New Pavement (A) NOT NP
Bridge Number BR #### (see note2)
Rigid Pavement (A) Rigid Pavt
No Ride (A) NR
Off RCI Off RCI
Exception COSECSUB (see note3) EX COSECSUB (see note3)
Survey Next Year Add in XX (XX = Survey Year)
Lane Realignment RAL
Brick Crosswalks BW
Manholes in wheel path MH
Sealed Cracks SLD CRK
Note1: An (A) after the remark in the REMARKS above column indicates an automated remark (based upon an entry in another field). Note2: Bridge number must be entered as four digit bridge number. Example BR 0024. Note3: COSECSUB contains County Number - Section Number - Sub Section Number. A minimum of five digits must be entered. Examples are 16250001 or 52010.
Rigid Pavement Condition Survey Handbook, March 2012 Page 9
Comments
The Comments column is used to record information specific to the section that will
assist raters in future surveys. Examples include County section numbers for
exceptions and any other non-standard remarks that will help in identifying the section.
This column can also be used to record standardized comments that exceed the
seventeen character limit of the Remarks column.
Rigid Pavement Condition Survey Handbook, March 2012 Page 11
III. Evaluation Methods
Data collection is accomplished by visually estimating distresses present within each
roadway section and through use of an inertial profiler to collect Ride and Faulting data
at highway speeds.
Ride Rating
The longitudinal profile of each wheel path is measured at highway speeds by an ASTM
E-950 Class I non-contact inertial profiler. See Figure 1 (page 13). Longitudinal profile
data are collected at the smallest sample interval the profiler is capable of using, usually
less than one inch. The data is then processed using a profile distance of 6 inches, a
moving average of 12 inches, and 300 foot wavelength filtering. This longitudinal profile
data is then used to calculate Ride Number (RN) and International Ride Index (IRI).
RN is a mathematical processing of the longitudinal profile measurements. RN is an
estimate of subjective ride quality (ASTM Standard E1489) and it is presented on a 0 to
5 scale that is not represented by any units. A RN of 5 represents a pavement that is
perfectly smooth; however this value is unachievable even with the smoothest of
pavements. RN is reported as the average of the left and right wheel paths. RN data
for each individual wheel path may be reported upon request.
The Ride Rating (RR) is calculated from RN average using methods below:
RR100 = RN X 20
RR10 = RN X 2
Where: RN = = Ride Number (0 to 5 scale)
RR10 = Ride Rating (0 to 10 scale)
RR100 = Ride Rating (0 to 100 scale)
Ride Rating on a scale of 0 to 100 is calculated from Ride Number primarily for use by
the rater while in the field. When Ride Number is inputted into the database, it is then
used to determine Ride Rating on a 0 to 10 scale. A Ride Rating of 10 indicates a
Page 12 Rigid Pavement Condition Survey Handbook, March 2012
pavement that is perfectly smooth. This value of 10 is only hypothetical and not
achievable.
IRI is also a mathematical processing of the longitudinal profile generated by the
profiler. IRI is a standard practice for computing and reporting road roughness (ASTM
E1926). IRI is reported in units of inches per mile (in/mi) and is scaled with 0 being the
smoothest and the upper limit being infinite. IRI is reported to the Federal Highway
Administration (FHWA) annually. IRI is reported as the average of the left and right
wheel paths. IRI data for each individual wheel path may be reported upon request.
The following points are critical to the collection and reporting of Ride Rating:
1. Ride Rating Check: The Ride Rating (RR100) should be within eight (8)
points of the previous year’s survey. When RR100 is determined to be out of
tolerance by more than the eight (8) points, rerun the section in accordance
with Appendix B
2. Braking abruptly or accelerating rapidly (greater than 3 mph per second)
produces invalid data. If this occurs the section must be re-tested.
3. Moisture on the surface of the pavement may affect the signal being returned
from the sensor, causing invalid data. Do not test if pavement is wet.
A thorough calibration and verification must be completed to ensure the accuracy of the
longitudinal profile data. See Appendix C, (“Profiler Calibration Instructions”) for
information on the calibration process.
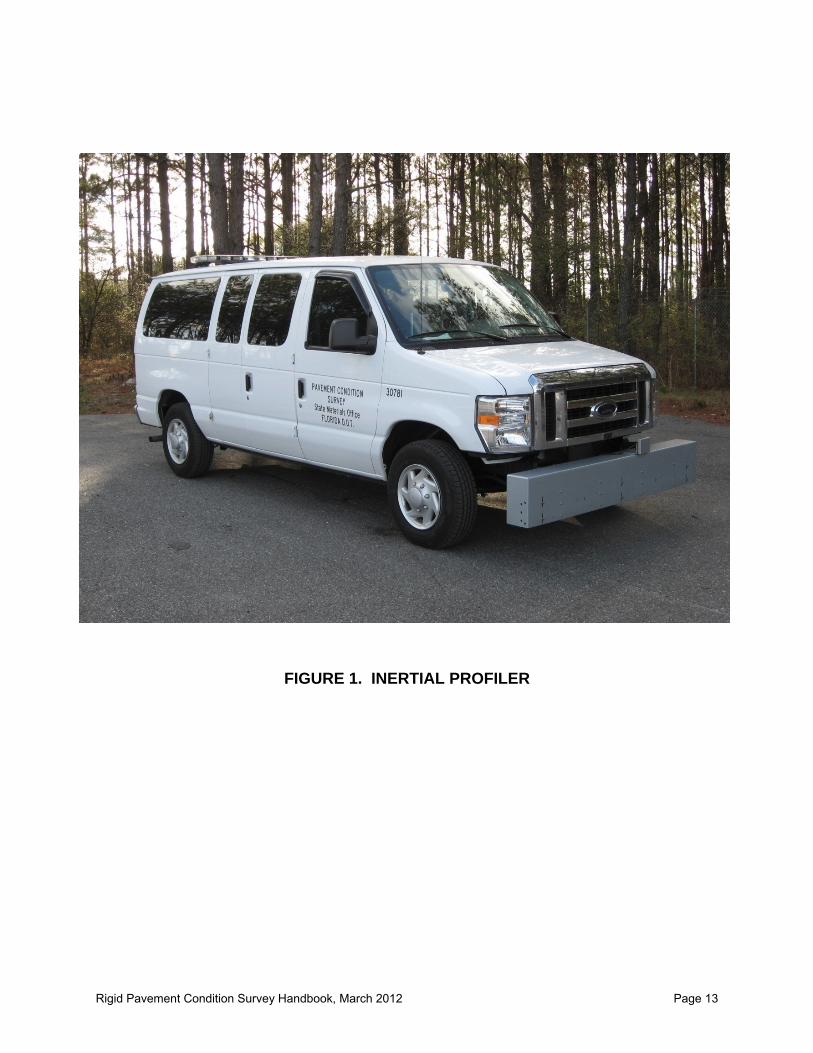
Rigid Pavement Condition Survey Handbook, March 2012 Page 13
FIGURE 1. INERTIAL PROFILER
Page 14 Rigid Pavement Condition Survey Handbook, March 2012
Defect Rating
The Defect rating is determined by a visual inspection of distress indicators that are
present within each rated section. The Rater records the distress type, number, and
severity level of each critical distress indicator. Each of these values is weighted
according to distress type and severity level. All of the weighted values are then
combined into a total weighted deduct then subtracted from 100 to determine the Defect
Rating of a rated section. A detailed explanation of how these indicators are identified
and classified by severity begins on the next page.
Rigid Pavement Condition Survey Handbook, March 2012 Page 15
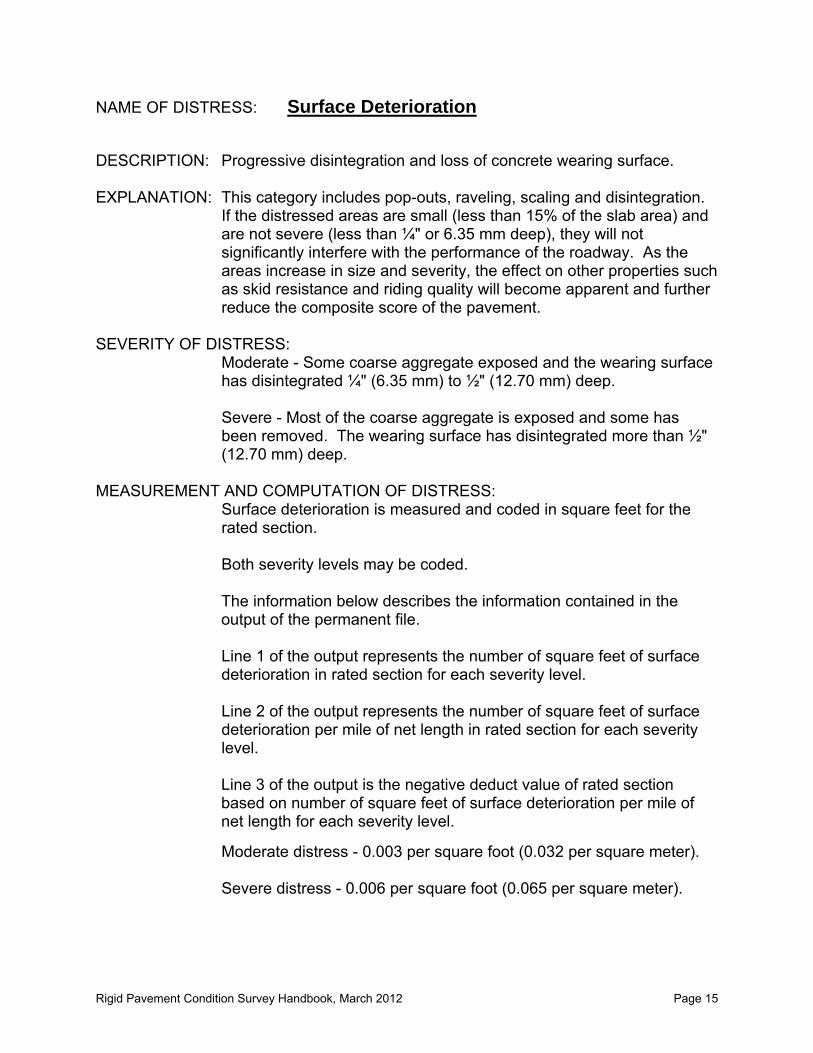
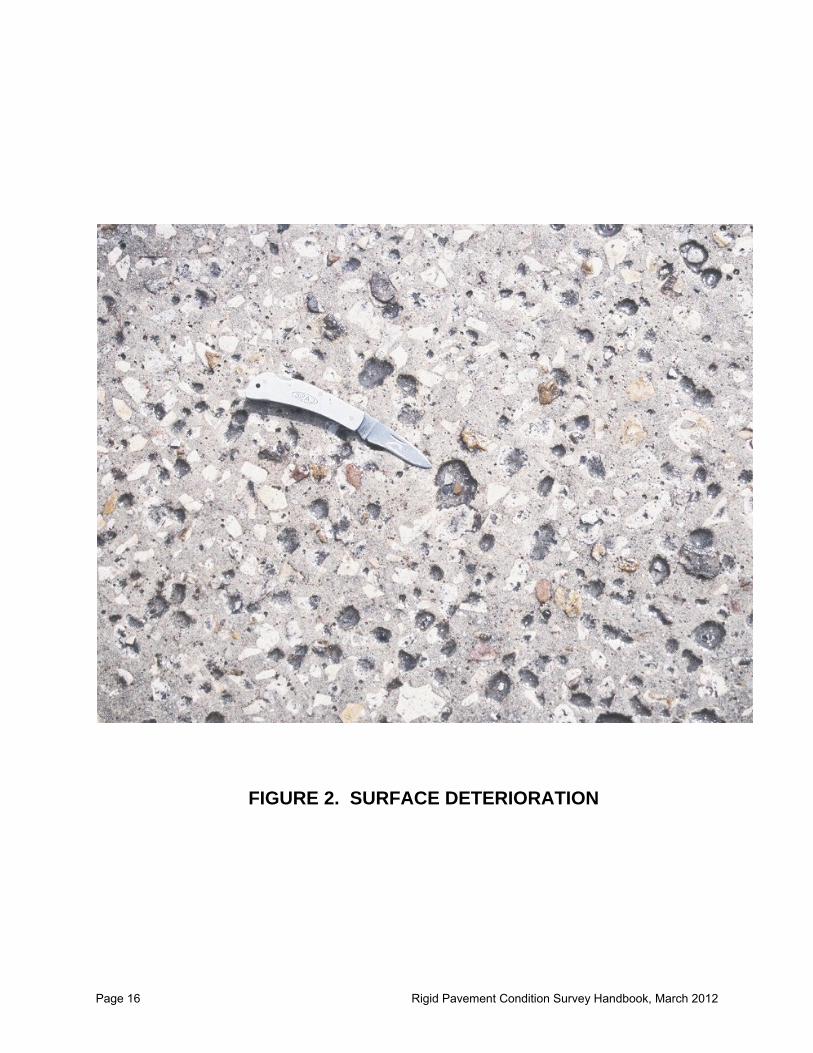
NAME OF DISTRESS: Surface Deterioration
DESCRIPTION: Progressive disintegration and loss of concrete wearing surface. EXPLANATION: This category includes pop-outs, raveling, scaling and disintegration.
If the distressed areas are small (less than 15% of the slab area) and are not severe (less than ¼" or 6.35 mm deep), they will not significantly interfere with the performance of the roadway. As the areas increase in size and severity, the effect on other properties such as skid resistance and riding quality will become apparent and further reduce the composite score of the pavement.
SEVERITY OF DISTRESS:
Moderate - Some coarse aggregate exposed and the wearing surface has disintegrated ¼" (6.35 mm) to ½" (12.70 mm) deep.
Severe - Most of the coarse aggregate is exposed and some has been removed. The wearing surface has disintegrated more than ½" (12.70 mm) deep.
MEASUREMENT AND COMPUTATION OF DISTRESS:
Surface deterioration is measured and coded in square feet for the rated section.
Both severity levels may be coded.
The information below describes the information contained in the output of the permanent file.
Line 1 of the output represents the number of square feet of surface deterioration in rated section for each severity level.
Line 2 of the output represents the number of square feet of surface deterioration per mile of net length in rated section for each severity level.
Line 3 of the output is the negative deduct value of rated section based on number of square feet of surface deterioration per mile of net length for each severity level.
Moderate distress - 0.003 per square foot (0.032 per square meter).
Severe distress - 0.006 per square foot (0.065 per square meter).
Page 16 Rigid Pavement Condition Survey Handbook, March 2012
FIGURE 2. SURFACE DETERIORATION
Rigid Pavement Condition Survey Handbook, March 2012 Page 17
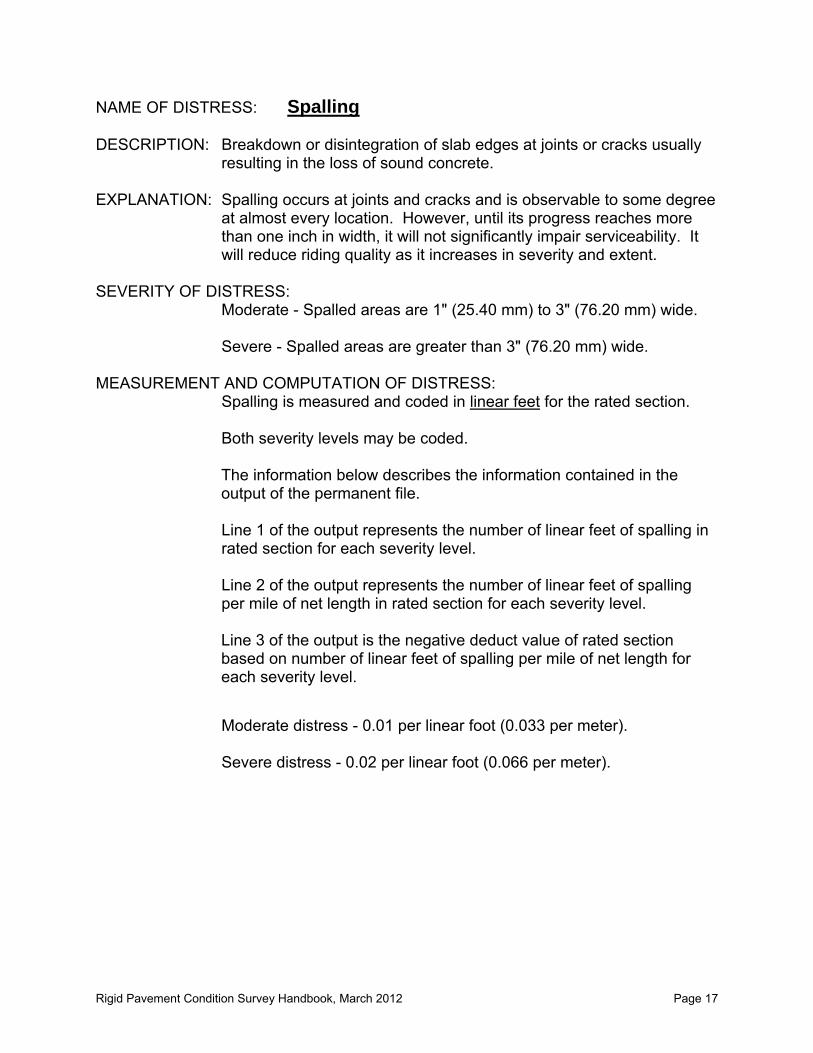
NAME OF DISTRESS: Spalling DESCRIPTION: Breakdown or disintegration of slab edges at joints or cracks usually
resulting in the loss of sound concrete. EXPLANATION: Spalling occurs at joints and cracks and is observable to some degree
at almost every location. However, until its progress reaches more than one inch in width, it will not significantly impair serviceability. It will reduce riding quality as it increases in severity and extent.
SEVERITY OF DISTRESS:
Moderate - Spalled areas are 1" (25.40 mm) to 3" (76.20 mm) wide.
Severe - Spalled areas are greater than 3" (76.20 mm) wide. MEASUREMENT AND COMPUTATION OF DISTRESS:
Spalling is measured and coded in linear feet for the rated section.
Both severity levels may be coded.
The information below describes the information contained in the output of the permanent file.
Line 1 of the output represents the number of linear feet of spalling in rated section for each severity level.
Line 2 of the output represents the number of linear feet of spalling per mile of net length in rated section for each severity level.
Line 3 of the output is the negative deduct value of rated section based on number of linear feet of spalling per mile of net length for each severity level.
Moderate distress - 0.01 per linear foot (0.033 per meter).
Severe distress - 0.02 per linear foot (0.066 per meter).
Page 18 Rigid Pavement Condition Survey Handbook, March 2012
FIGURE 3. SPALLING
Rigid Pavement Condition Survey Handbook, March 2012 Page 19
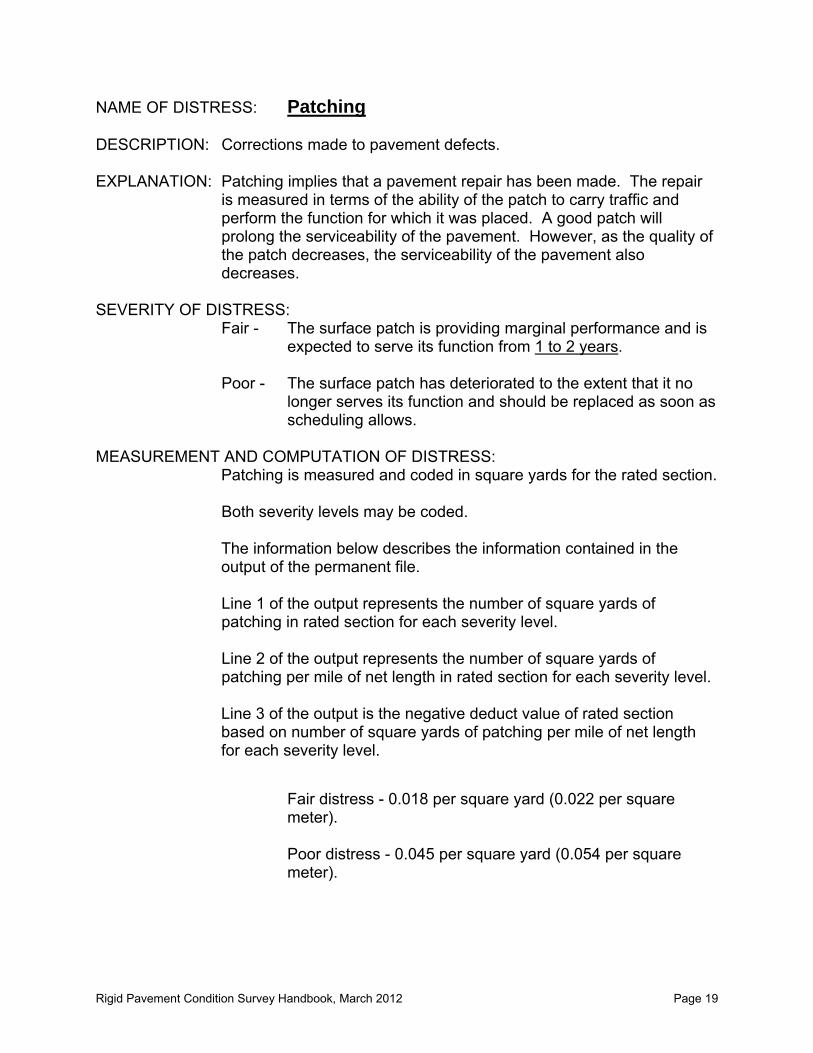
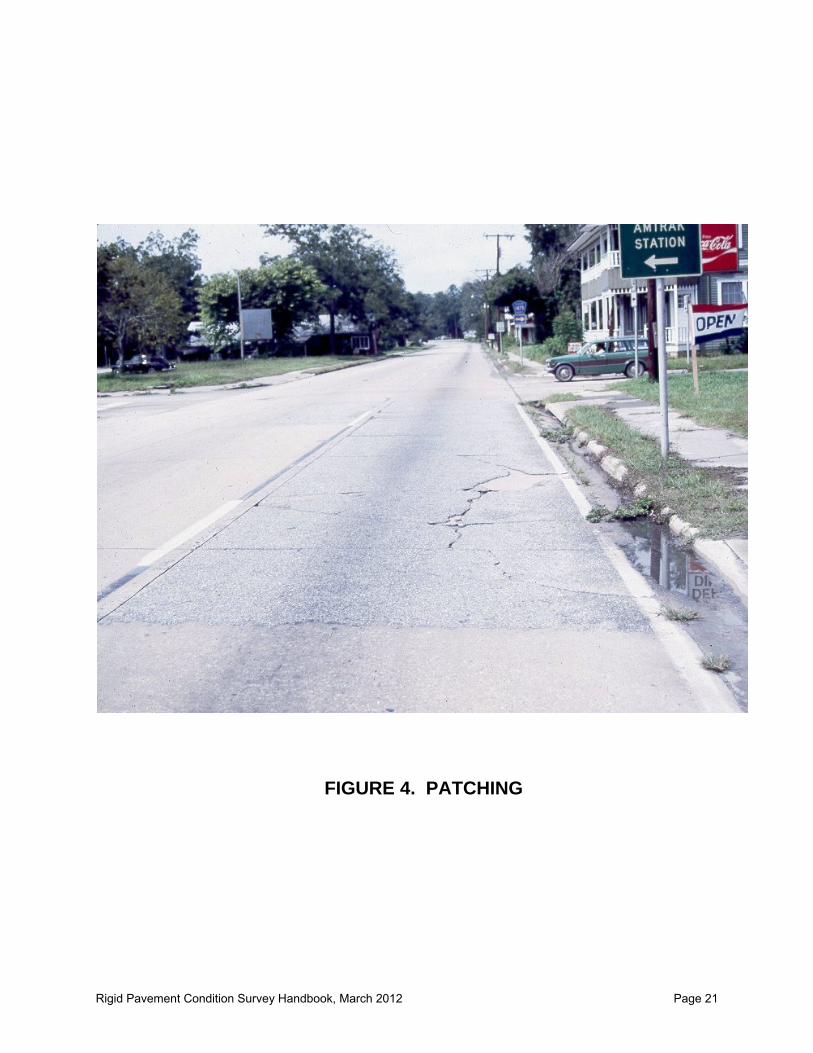
NAME OF DISTRESS: Patching DESCRIPTION: Corrections made to pavement defects. EXPLANATION: Patching implies that a pavement repair has been made. The repair
is measured in terms of the ability of the patch to carry traffic and perform the function for which it was placed. A good patch will prolong the serviceability of the pavement. However, as the quality of the patch decreases, the serviceability of the pavement also decreases.
SEVERITY OF DISTRESS:
Fair - The surface patch is providing marginal performance and is expected to serve its function from 1 to 2 years.
Poor - The surface patch has deteriorated to the extent that it no
longer serves its function and should be replaced as soon as scheduling allows.
MEASUREMENT AND COMPUTATION OF DISTRESS:
Patching is measured and coded in square yards for the rated section.
Both severity levels may be coded.
The information below describes the information contained in the output of the permanent file.
Line 1 of the output represents the number of square yards of patching in rated section for each severity level.
Line 2 of the output represents the number of square yards of patching per mile of net length in rated section for each severity level.
Line 3 of the output is the negative deduct value of rated section based on number of square yards of patching per mile of net length for each severity level.
Fair distress - 0.018 per square yard (0.022 per square meter).
Poor distress - 0.045 per square yard (0.054 per square meter).
Page 20 Rigid Pavement Condition Survey Handbook, March 2012
NOTES:
1) If a patch has cracking then both the patching and cracking should be counted.
2) If half or more of the slab is replaced, do not record as patching.
3) If less than half of the slab is replaced, record as patching.
Rigid Pavement Condition Survey Handbook, March 2012 Page 21
FIGURE 4. PATCHING
Page 22 Rigid Pavement Condition Survey Handbook, March 2012
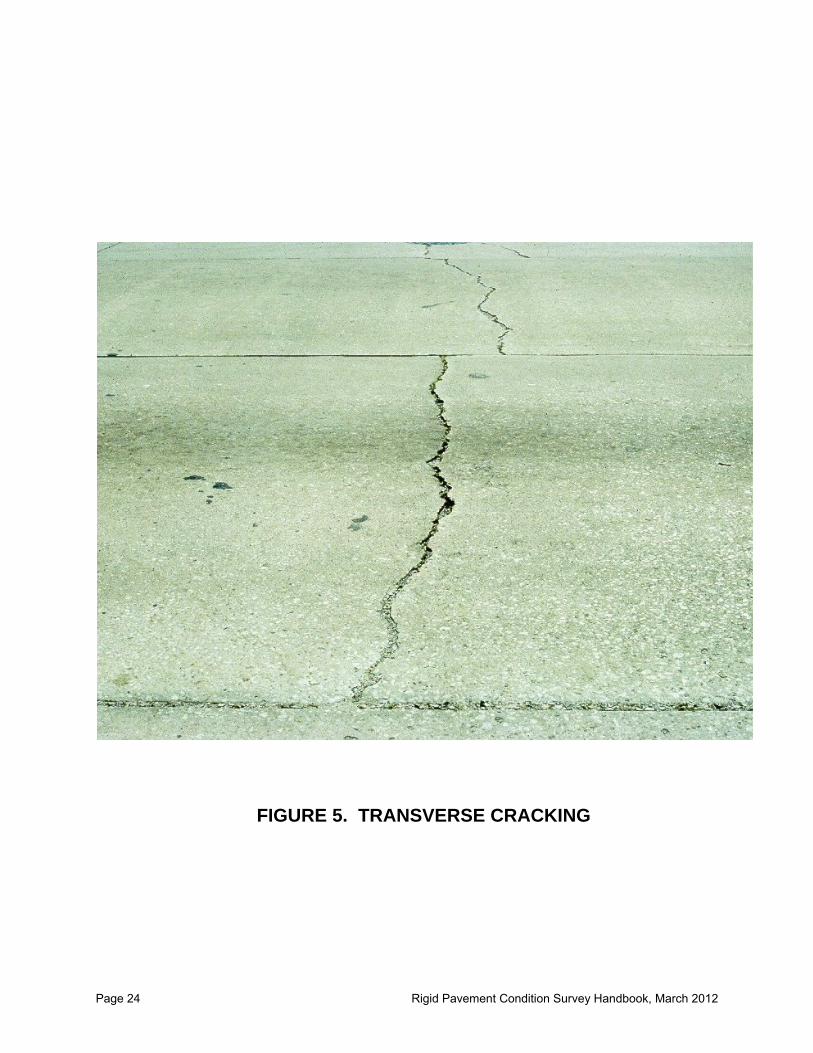
NAME OF DISTRESS: Transverse Cracking DESCRIPTION: A crack or break approximately at a right angle to the pavement
centerline. EXPLANATION: Thermal expansion and contraction along with normal shrinkage of a
slab may result in the formation of transverse cracking. Compared to longitudinal cracking, this category will have a greater effect upon the serviceability of the pavement because load transfer across the cracked slab results in a more rapid rate of deterioration. As long as the cracks are hairline or closed so as to prevent the intrusion of water and provide aggregate interlock, the cracks are not considered detrimental to pavement serviceability. However, cracks that open excessively permit the intrusion of water and cause the loss of aggregate interlock resulting in loss of load transfer between slabs.
SEVERITY OF DISTRESS:
Light - Visible cracks less than ⅛" (3.18 mm) wide that show no evidence of faulting, loss of aggregate interlock, or the intrusion of debris.
Moderate - Cracks ⅛" (3.18 mm) to ¼" (6.35 mm) wide that exhibit little or no faulting and no evidence of the intrusion of debris.
Severe - Cracks greater than ¼" (6.35 mm) that show loss of aggregate interlock and the obvious intrusion of water and debris. Faulting and spalling may also occur.
MEASUREMENT AND COMPUTATION OF DISTRESS:
Transverse cracks are measured and coded by the number of cracks for the rated section.
If a longitudinal joint separates the rated lane into two or more slabs, individual transverse cracks are counted as one crack unless the separation between transverse cracks along the longitudinal joint is more than one foot. When this separation is more than one foot, count each crack individually. Any or all of the severity levels may be coded.
The information below describes the information contained in the output of the permanent file.
Line 1 of the output represents the total number of transverse cracks in rated section for each severity level.
Rigid Pavement Condition Survey Handbook, March 2012 Page 23
Line 2 of the output represents the number of transverse cracks per mile of net length in rated section for each severity level.
Line 3 of the output is the negative deduct value of rated section based on transverse cracks per mile of net length for each severity level.
Light distress - 0.30 per crack
Moderate distress - 0.38 per crack
Severe distress - 0.50 per crack
NOTES:
1) When moderate or severe cracks have been sealed, they must be rated as light severity level. Only when there is partial loss of the sealant can crack be rated according to actual width.
2) Joints at replaced slabs will not be recorded as cracks.
Page 24 Rigid Pavement Condition Survey Handbook, March 2012
FIGURE 5. TRANSVERSE CRACKING
Rigid Pavement Condition Survey Handbook, March 2012 Page 25
NAME OF DISTRESS: Longitudinal Cracking DESCRIPTION: A crack or break approximately parallel to the pavement centerline. EXPLANATION: Although this category is unsightly, it is not necessarily detrimental to
the serviceability of the pavement. As long as the crack is not open or faulted to the extent that aggregate interlock is lost, load transfer across the crack will occur and the pavement will be serviceable. If the crack opens and permits the intrusion of water and/or debris, the deterioration of the pavement will be accelerated.
SEVERITY OF DISTRESS:
Light - Visible cracks less than ⅛" (3.18 mm) wide that show no evidence of faulting, loss of aggregate interlock or the intrusion of debris.
Moderate - Cracks ⅛" (3.18 mm) to ¼" (6.35 mm) wide that exhibit little or no faulting and no evidence of intrusion of debris.
Severe - Cracks greater than ¼" (6.35 mm) that show loss of aggregate interlock and the obvious intrusion of water and debris. Faulting and spalling may also occur.
MEASUREMENT AND COMPUTATION OF DISTRESS:
Longitudinal cracks are measured and coded by the number of cracks for the rated section.
Any or all of the severity levels may be coded.
The information below describes the information contained in the output of the permanent file.
Line 1 of the output represents the total number of longitudinal cracks in rated section for each severity level.
Line 2 of the output represents the number of longitudinal cracks per mile of net length in rated section for each severity level.
Line 3 of the output is the negative deduct value of rated section based on longitudinal cracks per mile of net length for each severity level.
Page 26 Rigid Pavement Condition Survey Handbook, March 2012
Light distress - 0.15 per crack
Moderate distress - 0.19 per crack
Severe distress - 0.25 per crack
NOTES:
1) When moderate or severe cracks have been sealed, they must be rated as light severity level. Only when there is partial loss of the sealant can crack be rated according to actual width.
2) Joints at replaced slabs will not be recorded as cracks.