Embed Size (px)
Citation preview
www.dot.state.fl.us
Florida Department of
TRANSPORTATION
Clearlake Road (SR 501) PD&E Study: Noise Study Report
(NSR) From Michigan Avenue to Industry Road
FPID: 433605‐1‐22‐01
ETDM #: 13120
January 2016

ES-1
Executive Summary The Florida Department of Transportation (FDOT) is conducting a Project Development and Environment (PD&E) Study to evaluate alternative improvements to provide increased capacity on Clearlake Road (SR 501) between Michigan Avenue and Industry Road, located in the City of Cocoa. The objectives of this Noise Study Report (NSR) are to identify noise sensitive receptors adjacent to the Clearlake Road project corridor, to project and evaluate future traffic noise levels at the receptors with and without the improvements, and to evaluate the need for, and effectiveness of, noise abatement measures. Additional objectives include the evaluation of construction noise and vibration impacts and the identification of noise impact “contours” adjacent to the project corridor. The analysis was performed following FDOT procedures that comply with Title 23 Code of Federal Regulations (CFR), Part 772, Procedures for Abatement of Highway Traffic Noise and Construction Noise. The evaluation uses methodologies established by the FDOT and documented in the PD&E Manual, Part 2, Chapter 17 (May 2011). The prediction of existing and future traffic noise levels with and without the roadway improvements was performed using the Federal Highway Administration’s (FHWA’s) Traffic Noise Model (TNM Version 2.5). Of the 109 evaluated noise-sensitive receptors (a representative location of a noise sensitive area), 108 were evaluated for residential land uses and one was evaluated for a sports area (tennis courts). The residences are located within the Clear Lake Terrace neighborhood, the Clearlake Pines Apartments, the Courtyard Condominiums, and the College Green Estates neighborhood. The tennis courts are located at an office complex on the east side of Clearlake Road. The results of the analysis indicate that existing (2014) exterior traffic noise levels range from 53.4 to 68.5 decibels on the “A”-weighted scale (dB(A)). In the future (2043) without the proposed improvements (No-Build), exterior traffic noise levels are predicted to range from 54.5 to 69.6 dB(A). In the future (2043) with the proposed improvements (Build), exterior traffic noise levels are predicted to range from 54.3 to 68.0 dB(A), with levels predicted to approach, meet, or exceed Noise Abatement Criteria (NAC) at 12 residences. The results of the analysis also indicate that when compared to existing conditions, traffic noise levels with the improvements would not increase more than 4.3 dB(A) above existing conditions at any of the evaluated noise-sensitive receptors. As such, the project would not substantially increase traffic noise (i.e., an increase of 15 dB(A) or more). Noise abatement measures were considered for the impacted residences. The measures were traffic management, alternative roadway alignments, and noise barriers. The review of these measures indicates that although feasible, traffic management and alternative roadway alignments are not reasonable methods of reducing predicted traffic noise impacts at the impacted sites. The results of an analysis to evaluate a noise barrier as an abatement measure indicate that a barrier is a potentially feasible and reasonable abatement measure for the impacted residences within College Green Estates. Application of the FDOT Standard Specifications for Road and Bridge Construction will minimize or eliminate potential construction noise and vibration impacts. Should unanticipated noise or vibration issues arise during the construction process, the Project Engineer, in coordination with the District Noise Specialist and the Contractor, will investigate additional methods of controlling these impacts.
ES-2
Land uses such as residences, motels, schools, places of worship, recreation areas, and parks are considered incompatible with highway noise levels exceeding the NAC. In order to reduce the possibility of additional noise-related impacts, noise level contours were developed for the future improved roadway facility. These noise contours delineate the distance from the improved roadway’s edge-of-pavement (EOP) where the NAC for each Activity Category (A through E) is expected to be approached (i.e., within one dB(A) of the NAC) in the design year 2043 with the proposed improvements. Local officials will be provided a copy of the Final NSR to promote compatibility between land development and Clearlake Road. Buffer zones, based on these contours, between the highway and future noise sensitive land uses should be implemented as part of the local land use planning process.
I
Table of Contents Executive Summary .................................................................................................................................. ES-1 Table of Contents ........................................................................................................................................... I 1.0 Introduction .................................................................................................................................. 1-1 1.1 Project Description .......................................................................................................... 1-1 1.2 Project Purpose and Need ............................................................................................... 1-3 1.3 Preferred Alternative ....................................................................................................... 1-3 2.0 Methodology ................................................................................................................................. 2-1 2.1 Evaluation Process ........................................................................................................... 2-1 2.2 Noise Model ..................................................................................................................... 2-1 2.3 Traffic Data ....................................................................................................................... 2-1 3.0 Noise Analysis ............................................................................................................................... 3-1 3.1 Noise-Sensitive Receptors ............................................................................................... 3-1 3.2 Measured Noise Levels .................................................................................................... 3-3 3.3 Results of the Noise Analysis ........................................................................................... 3-4 4.0 Evaluation of Abatement Alternatives .......................................................................................... 4-1 4.1 Traffic Management ........................................................................................................ 4-1 4.2 Alternative Roadway Alignment ...................................................................................... 4-1 4.3 Noise Buffer Zones ........................................................................................................... 4-1 4.4 Noise Barriers ................................................................................................................... 4-1 4.4.1 College Green Estates (CNE 4) ............................................................................. 4-2 4.4.2 Conclusions .......................................................................................................... 4-3
4.4.3 Viewpoint of Benefited Receptors ....................................................................... 4-4 5.0 Noise Contours .............................................................................................................................. 5-1 6.0 Construction Noise and Vibration ................................................................................................. 6-1 7.0 References .................................................................................................................................... 7-1
Tables
2-1 Traffic Data for Noise Analysis 3-1 FHWA/FDOT Noise Abatement Criteria 3-2 Typical Noise Levels 3-3 Validation Data 3-4 Predicted Traffic Noise Levels 4-1 CNE 4: Noise Barrier Results 4-2 Additional Barrier Considerations 4-3 Impacted and/or Benefited Residences within College Green Estates 5-1 Noise Contours Exhibits
1-1 Study Location Map 1-2 Proposed Typical Section 5-1 Noise Contours

II
Appendices
Appendix A Project Aerials Appendix B Traffic Data Appendix C Validation Documentation

1-1
1.0 Introduction The Florida Department of Transportation (FDOT) is conducting a Project Development and Environment (PD&E) Study to evaluate alternative improvements to provide increased capacity on Clearlake Road between Michigan Avenue and Industry Road, located in the City of Cocoa. A project location map is provided on Exhibit 1-1. The PD&E Study objectives include the following: determine proposed typical sections and develop preliminary conceptual design plans for proposed improvements while minimizing impacts to the environment; consider agency and public comments; and ensure study compliance with all applicable federal and state laws. Improvement alternatives will be identified which will improve safety and meet future transportation demand. This Noise Study Report (NSR) presents the assumptions, data, procedures, and results of the traffic noise study that was conducted to evaluate the proposed improvements to Clearlake Road. The objectives of the NSR are: • To identify noise sensitive receptors adjacent to the Clearlake Road project corridor, • To project and evaluate future traffic noise levels at the receptors with and without the
improvements, and • To evaluate the need for, and effectiveness of, noise abatement measures.
Additional objectives include the evaluation of construction noise and vibration impacts and the identification of noise impact “contours” adjacent to the project corridor.
1.1 Project Description Clearlake Road between Michigan Avenue to the south and Industry Road to the north is classified as an Urban Principle Arterial. For a short distance (0.137 miles) north of Michigan Avenue, the road has four lanes with a 12 foot paved median. For the next 0.457 miles northward, the roadway has one, 12 foot lane southbound with grass shoulders and two, 12 foot lanes with curb and gutter in the northbound direction. For the last 0.529 miles, the roadway has two, 12 foot lanes, one in each direction, with four foot paved shoulders. The posted speed limit along this section of Clearlake Road varies and is posted at 40 mph and 45 mph. The various typical sections found along this corridor is due in part to roadway improvements required of adjacent developers. There are signalized intersections at Michigan Avenue, Otterbein Avenue, and Industry Road. It is anticipated that the improved roadway will be a four lane urban typical section. Clearlake Road is not a Strategic Intermodal System (SIS) facility but Industry Road has an interchange with SR 528 (Beachline Expressway) located just to the north which is a designated SIS facility connecting the City of Orlando and the Orlando International Airport to the west with the Port of Port Canaveral to the east.

1-2
EXHIBIT 1-1: Study Location Map
1-3
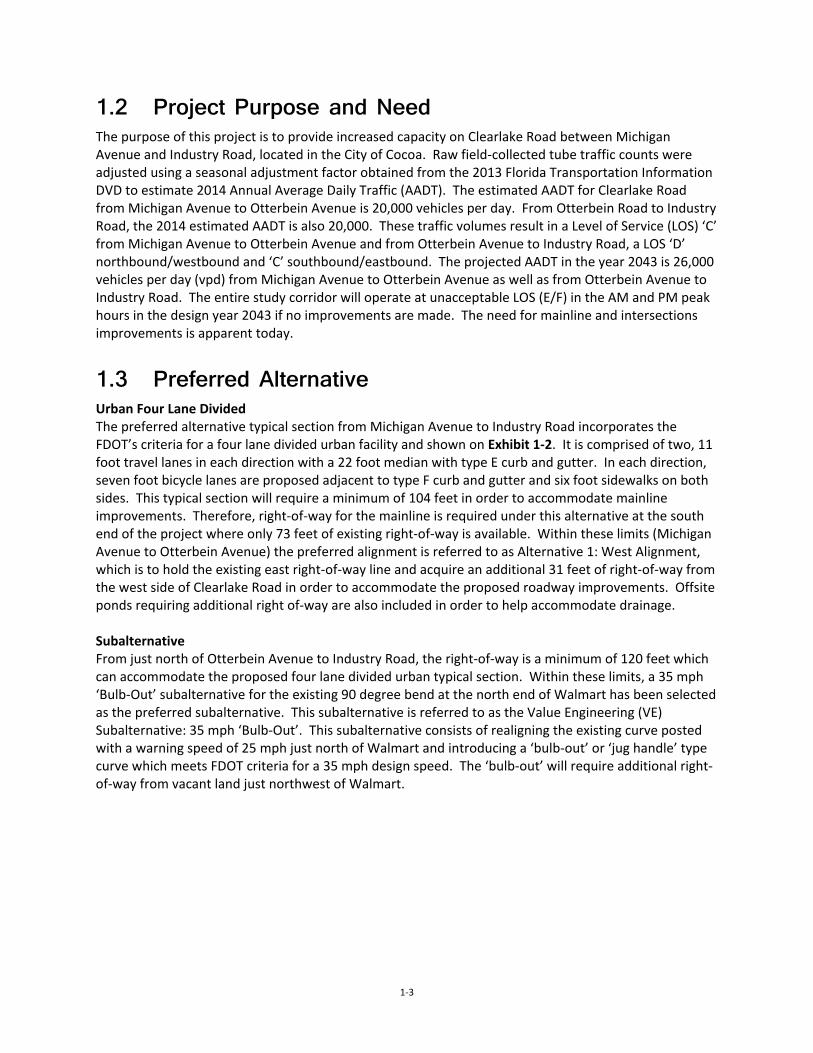
1.2 Project Purpose and Need The purpose of this project is to provide increased capacity on Clearlake Road between Michigan Avenue and Industry Road, located in the City of Cocoa. Raw field-collected tube traffic counts were adjusted using a seasonal adjustment factor obtained from the 2013 Florida Transportation Information DVD to estimate 2014 Annual Average Daily Traffic (AADT). The estimated AADT for Clearlake Road from Michigan Avenue to Otterbein Avenue is 20,000 vehicles per day. From Otterbein Road to Industry Road, the 2014 estimated AADT is also 20,000. These traffic volumes result in a Level of Service (LOS) ‘C’ from Michigan Avenue to Otterbein Avenue and from Otterbein Avenue to Industry Road, a LOS ‘D’ northbound/westbound and ‘C’ southbound/eastbound. The projected AADT in the year 2043 is 26,000 vehicles per day (vpd) from Michigan Avenue to Otterbein Avenue as well as from Otterbein Avenue to Industry Road. The entire study corridor will operate at unacceptable LOS (E/F) in the AM and PM peak hours in the design year 2043 if no improvements are made. The need for mainline and intersections improvements is apparent today.
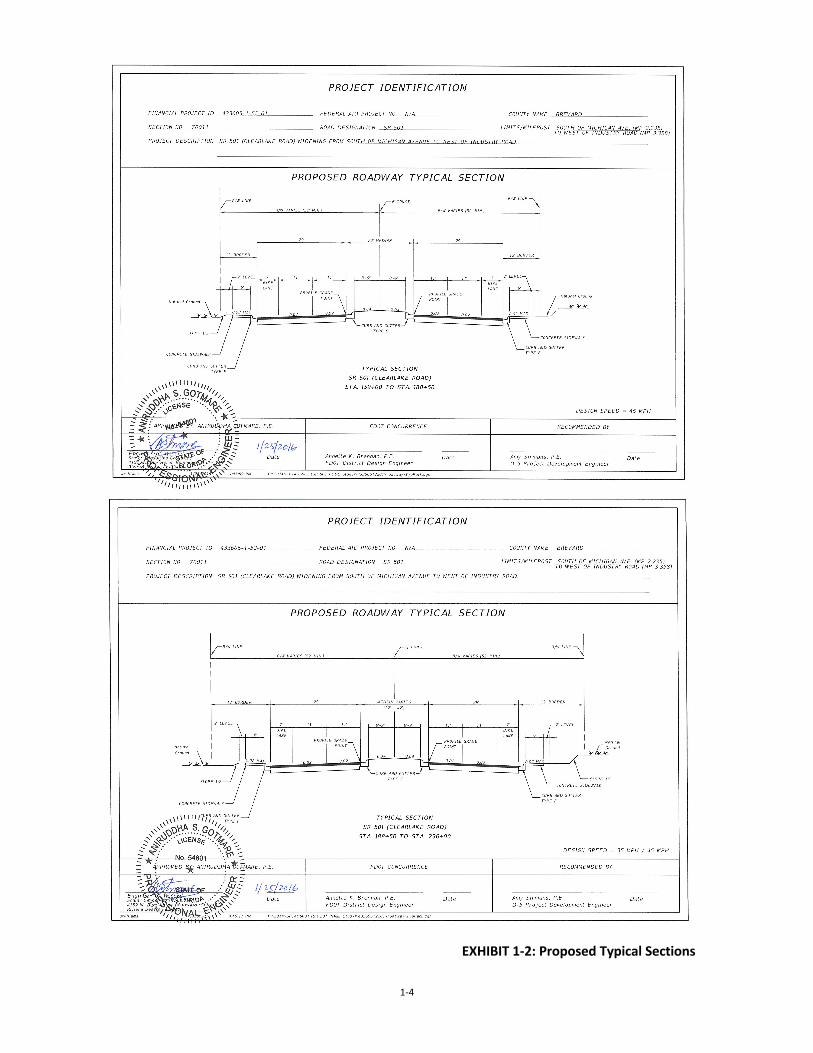
1.3 Preferred Alternative Urban Four Lane Divided The preferred alternative typical section from Michigan Avenue to Industry Road incorporates the FDOT’s criteria for a four lane divided urban facility and shown on Exhibit 1-2. It is comprised of two, 11 foot travel lanes in each direction with a 22 foot median with type E curb and gutter. In each direction, seven foot bicycle lanes are proposed adjacent to type F curb and gutter and six foot sidewalks on both sides. This typical section will require a minimum of 104 feet in order to accommodate mainline improvements. Therefore, right-of-way for the mainline is required under this alternative at the south end of the project where only 73 feet of existing right-of-way is available. Within these limits (Michigan Avenue to Otterbein Avenue) the preferred alignment is referred to as Alternative 1: West Alignment, which is to hold the existing east right-of-way line and acquire an additional 31 feet of right-of-way from the west side of Clearlake Road in order to accommodate the proposed roadway improvements. Offsite ponds requiring additional right of-way are also included in order to help accommodate drainage.
Subalternative From just north of Otterbein Avenue to Industry Road, the right-of-way is a minimum of 120 feet which can accommodate the proposed four lane divided urban typical section. Within these limits, a 35 mph ‘Bulb-Out’ subalternative for the existing 90 degree bend at the north end of Walmart has been selected as the preferred subalternative. This subalternative is referred to as the Value Engineering (VE) Subalternative: 35 mph ‘Bulb-Out’. This subalternative consists of realigning the existing curve posted with a warning speed of 25 mph just north of Walmart and introducing a ‘bulb-out’ or ‘jug handle’ type curve which meets FDOT criteria for a 35 mph design speed. The ‘bulb-out’ will require additional right-of-way from vacant land just northwest of Walmart.
1-4
EXHIBIT 1-2: Proposed Typical Sections
2-1
2.0 Methodology
2.1 Evaluation Process This traffic noise analysis was prepared in accordance with Title 23 CFR Part 772, Procedures for Abatement of Highway Traffic Noise and Construction Noise. The evaluation used methodologies established by FDOT and documented in the PD&E Manual, Part 2, Chapter 17 (May 2011) and the Traffic Noise Modeling and Analysis Practitioners Handbook (May 2015). The potential feasibility and reasonableness of providing noise barriers as an abatement measure for impacted non-residential land uses (e.g., an active sports area) was determined following guidance in FDOT’s publication, A Method to Determine Reasonableness and Feasibility of Noise Abatement at Special Use Locations.
The predicted noise levels presented in this report are expressed in dB(A). This scale most closely approximates the response characteristics of the human ear to traffic noise. All noise levels are reported as equivalent levels (Leq(h)), which is the equivalent steady-state sound level that contains the same acoustic energy as a time-varying sound level over a period of one hour.
2.2 Noise Model The prediction of existing and future traffic noise levels with and without the roadway improvements was performed using the FHWA’s computer model for highway traffic noise prediction and analysis – TNM Version 2.5. The TNM propagates sound energy, in one-third octave bands, between highways and nearby receptors taking the intervening ground’s acoustical characteristics/topography and rows of buildings into account.
2.3 Traffic Data Noise levels are low when traffic volumes are low (LOS A or B) or when traffic is so congested that movement is slow (LOS D, E, or F). Generally, the maximum hourly noise level occurs between these two conditions; therefore, traffic volumes used in the Clearlake Road analysis reflect either the design LOS C volumes or the demand volumes (if forecast demand levels meet the LOS A or B criteria), whichever is less. The Existing (2014), Future No-Build (2043), and Future Build Year (2043) traffic data used in the analysis are presented in Table 2-1. As noted in Table 2-1, vehicle speeds are based on posted speed limits. Documentation in support of the traffic data is provided in Appendix B.

2-2
TABLE 2-1 TRAFFIC DATA FOR NOISE ANALYSIS
Scenario
Peak Hour Volume
Peak Hour Peak Direction Volume
Peak Hour Off-Peak Direction Volume Posted
Speed (mph) LOS C Demand Cars MT HT B MC Cars MT HT B MC
Existing 3,411 1,800 940 26 22 8 0 760 21 18 6 0 40/452 No-Build 3,411 2,340 1,222 34 28 10 0 987 27 23 8 0 45 Build 3,411 2,430 1,269 35 30 11 0 1,025 28 24 9 0 45
1 Medium Trucks (MT) = 2.6%, Heavy Truck (HT) = 2.2%, Buses (B) = 0.8%, and Motorcycles (MC) = 0.0%. 2 The Existing speed limit is 40 mph from milepost (MP) 2.471 to MP 3.056. Source: FDOT, 2015.
3-1
3.0 Noise Analysis
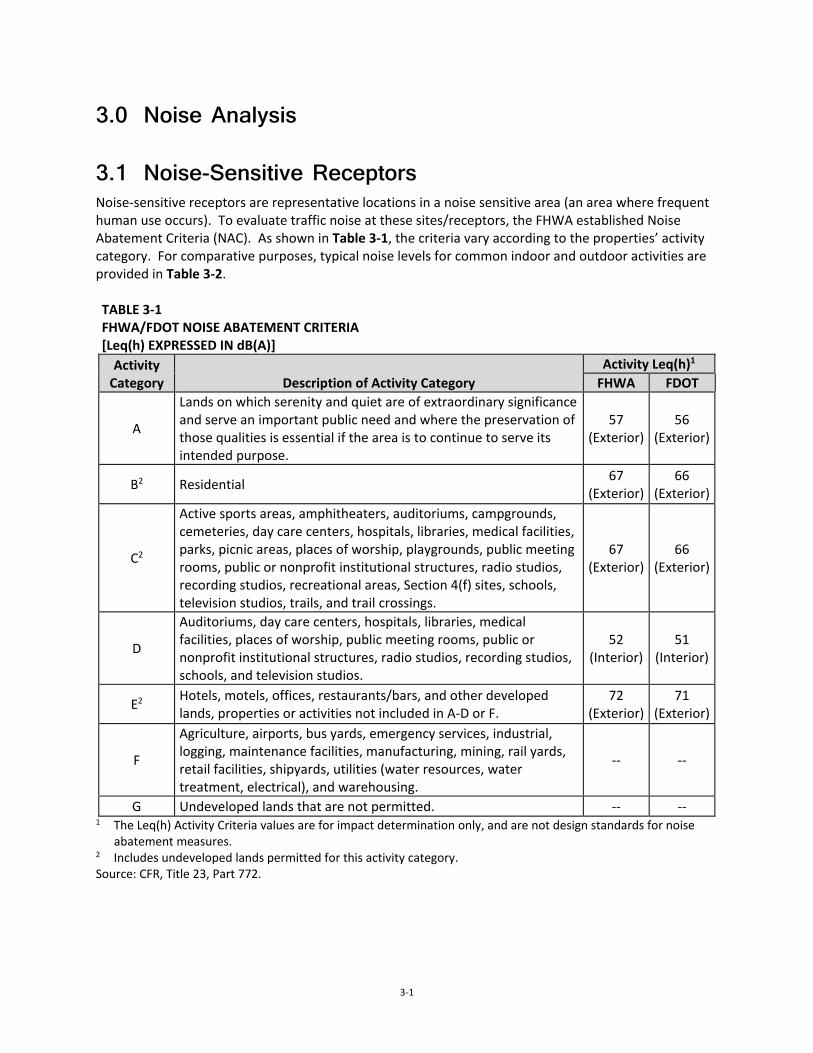
3.1 Noise-Sensitive Receptors Noise-sensitive receptors are representative locations in a noise sensitive area (an area where frequent human use occurs). To evaluate traffic noise at these sites/receptors, the FHWA established Noise Abatement Criteria (NAC). As shown in Table 3-1, the criteria vary according to the properties’ activity category. For comparative purposes, typical noise levels for common indoor and outdoor activities are provided in Table 3-2. TABLE 3-1 FHWA/FDOT NOISE ABATEMENT CRITERIA [Leq(h) EXPRESSED IN dB(A)]
Activity Category Description of Activity Category
Activity Leq(h)1 FHWA FDOT
A
Lands on which serenity and quiet are of extraordinary significance and serve an important public need and where the preservation of those qualities is essential if the area is to continue to serve its intended purpose.
57 (Exterior)
56 (Exterior)
B2 Residential 67 (Exterior)
66 (Exterior)
C2
Active sports areas, amphitheaters, auditoriums, campgrounds, cemeteries, day care centers, hospitals, libraries, medical facilities, parks, picnic areas, places of worship, playgrounds, public meeting rooms, public or nonprofit institutional structures, radio studios, recording studios, recreational areas, Section 4(f) sites, schools, television studios, trails, and trail crossings.
67 (Exterior)
66 (Exterior)
D
Auditoriums, day care centers, hospitals, libraries, medical facilities, places of worship, public meeting rooms, public or nonprofit institutional structures, radio studios, recording studios, schools, and television studios.
52 (Interior)
51 (Interior)
E2 Hotels, motels, offices, restaurants/bars, and other developed lands, properties or activities not included in A-D or F.
72 (Exterior)
71 (Exterior)
F
Agriculture, airports, bus yards, emergency services, industrial, logging, maintenance facilities, manufacturing, mining, rail yards, retail facilities, shipyards, utilities (water resources, water treatment, electrical), and warehousing.
-- --
G Undeveloped lands that are not permitted. -- -- 1 The Leq(h) Activity Criteria values are for impact determination only, and are not design standards for noise
abatement measures.
2 Includes undeveloped lands permitted for this activity category.
Source: CFR, Title 23, Part 772.

3-2
TABLE 3-2 TYPICAL NOISE LEVELS
Common Outdoor Activities Noise Level
dB(A) Common Indoor Activities 110 Rock band
Jet flyover at 1,000 feet
100
Gas lawnmower at 3 feet
90
Diesel truck at 50 feet at 50 mph
Food blender at 3 feet
80 Garbage disposal at 3 feet Noisy urban area daytime
Gas lawnmower at 100 feet 70 Vacuum cleaner at 10 feet Commercial area
Normal speech at 3 feet
Heavy traffic at 300 feet 60
Large business office
Quiet urban daytime 50 Dishwasher in next room
Quiet urban nighttime 40 Theater, large conference room (background)
Quiet suburban nighttime
30 Library
Quiet rural nighttime
Bedroom at night, concert hall (background) 20
Broadcast/recording studio
10
0 Source: California Dept. of Transportation Technical Noise Supplement, Nov. 2009, Page 2-21.
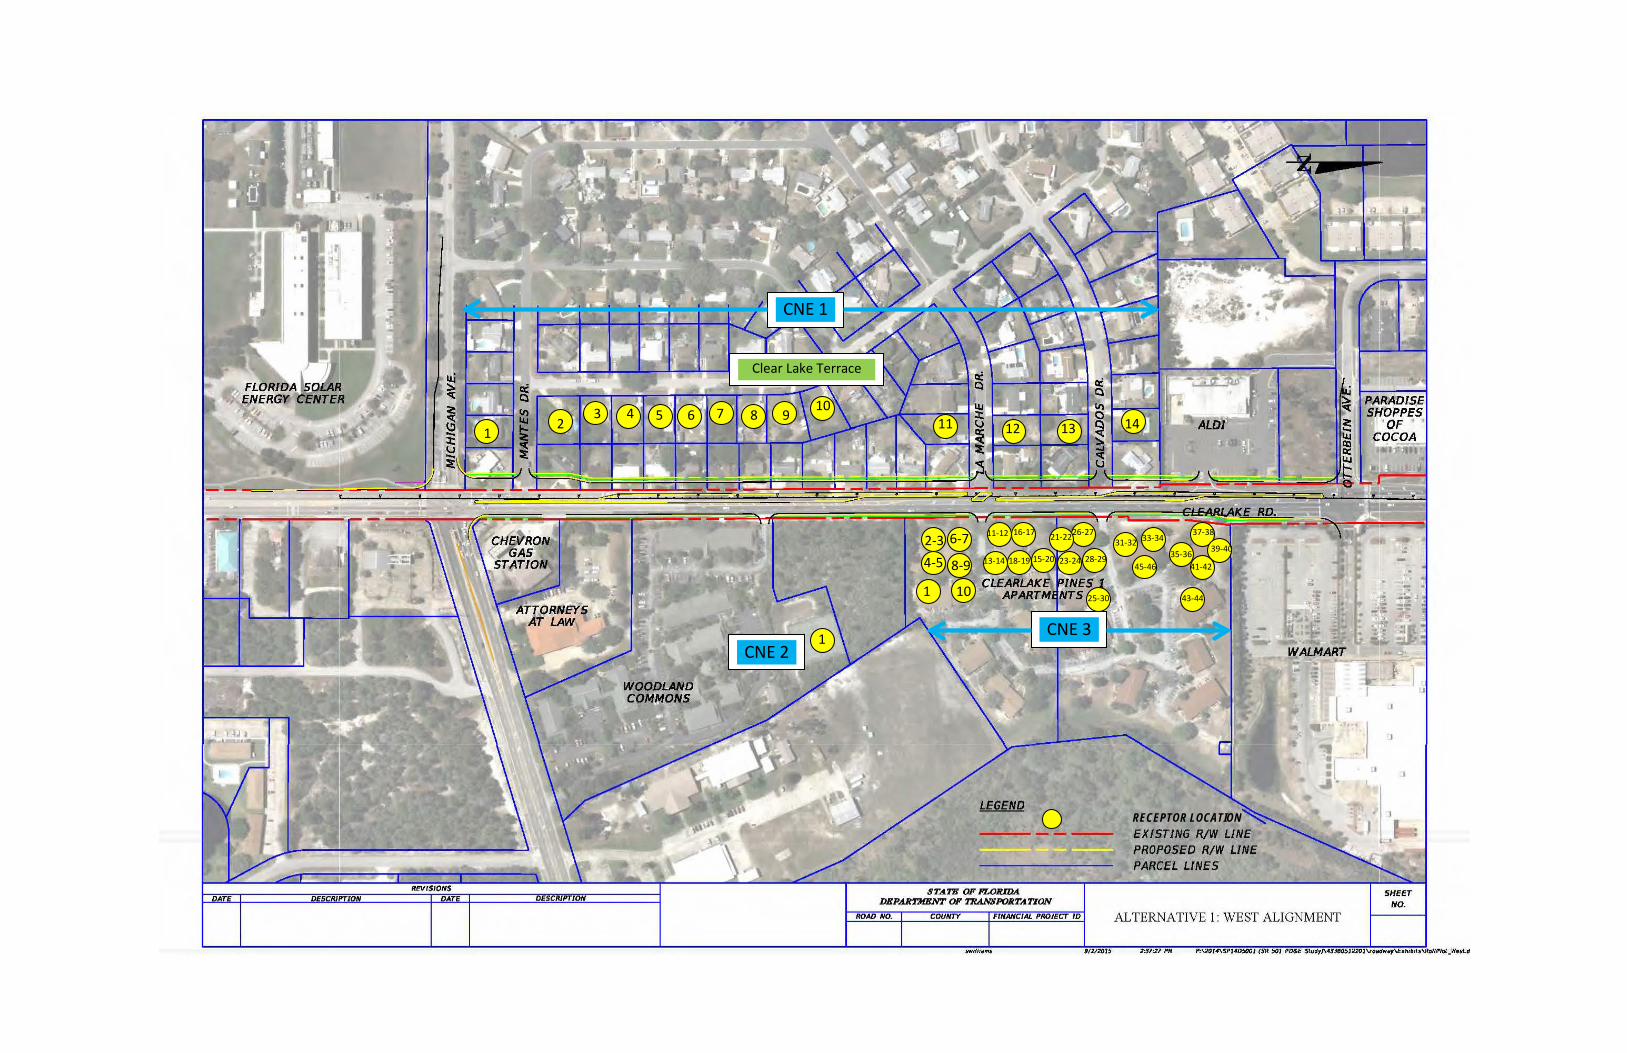
When predicted traffic noise levels “approach” or exceed the NAC, or when predicted future noise levels increase substantially from existing levels, the FHWA requires that noise abatement measures be considered. FDOT defines the word “approach” to mean within one dB(A) of the NAC. The FDOT’s NAC are also shown in Table 3-1. Additionally, the FDOT criteria states that a substantial increase would occur if traffic noise levels are predicted to increase 15 dB(A) or more above existing conditions as a direct result of a transportation improvement project. One hundred and nine noise sensitive receptors were evaluated within four common noise environments (CNEs). The location of the receptors is illustrated on project aerials in Appendix A. CNEs are groups of receptors of the same Activity Category and whose impacted receptors would benefit from the same noise barrier. The four CNEs are:

3-3
• CNE 1 – Residences within the Clear Lake Terrace neighborhood on the west side of Clearlake Road (SR 501) between Michigan Avenue and Otterbein Avenue.
• CNE 2 – The tennis courts at the office complex on the east side of Clearlake Road between Michigan Avenue and Otterbein Avenue.
• CNE 3 – Residences within the Clearlake Pines Apartments on the east side of Clearlake Road between Michigan Avenue and Otterbein Avenue.
• CNE 4 – Residences within The College Green Estates neighborhood and the Courtyard Condominiums on the south side of Clearlake Road and east of Industry Road.
Of the 109 evaluated receptors, 108 represented residential land uses (Activity Category B), and one represented a recreational (tennis courts) area (Activity Category C). For these land use categories, exterior traffic noise levels are considered to impact the uses of the sites and noise abatement measures are considered if the traffic noise levels are determined to be 66 dB(A) or more, or if exterior traffic noise levels were predicted to increase 15 dB(A) or more from existing levels.
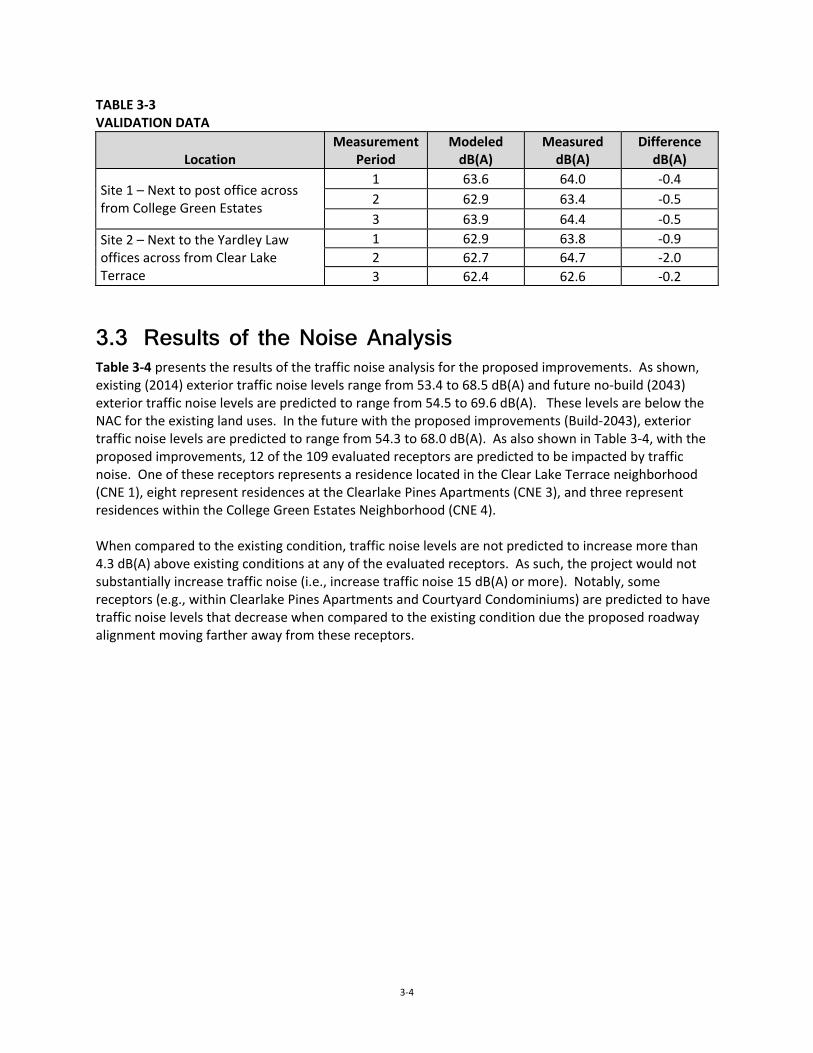
3.2 Measured Noise Levels As previously stated, existing and future noise levels with and without the proposed improvements were modeled using the TNM. To verify the accuracy of the predictions, the computer model was validated using measured noise levels adjacent to the project corridor. Traffic data including motor vehicle volumes, vehicle mix, vehicle speeds, and meteorological conditions were recorded during each measurement period. The field measurements were conducted in accordance with the FHWA’s Measurement of Highway-Related Noise. The measurements were obtained using a Larson Davis LxT Type II integrating sound level meter (SLM). The SLM was calibrated before and after the measurement periods with a Larson Davis CAL200 calibrator. The recorded traffic data were used as input for the TNM to determine if, given the topography and actual site conditions of the area, the computer model could “re-create” the measured levels with the existing roadway. Following FDOT guidelines, a noise prediction model is considered within the accepted level of accuracy if the measured and predicted noise levels are within a tolerance standard of three dB(A). Table 3-3 presents the field measurements and the validation results. As shown, the ability of the model to predict noise levels within the FDOT limits of plus or minus three dB(A) for the project was confirmed. Documentation in support of the validation is provided in Appendix C.
3-4
TABLE 3-3 VALIDATION DATA
Location Measurement
Period Modeled
dB(A) Measured
dB(A) Difference
dB(A)
Site 1 – Next to post office across from College Green Estates
1 63.6 64.0 -0.4 2 62.9 63.4 -0.5 3 63.9 64.4 -0.5
Site 2 – Next to the Yardley Law offices across from Clear Lake Terrace
1 62.9 63.8 -0.9 2 62.7 64.7 -2.0 3 62.4 62.6 -0.2
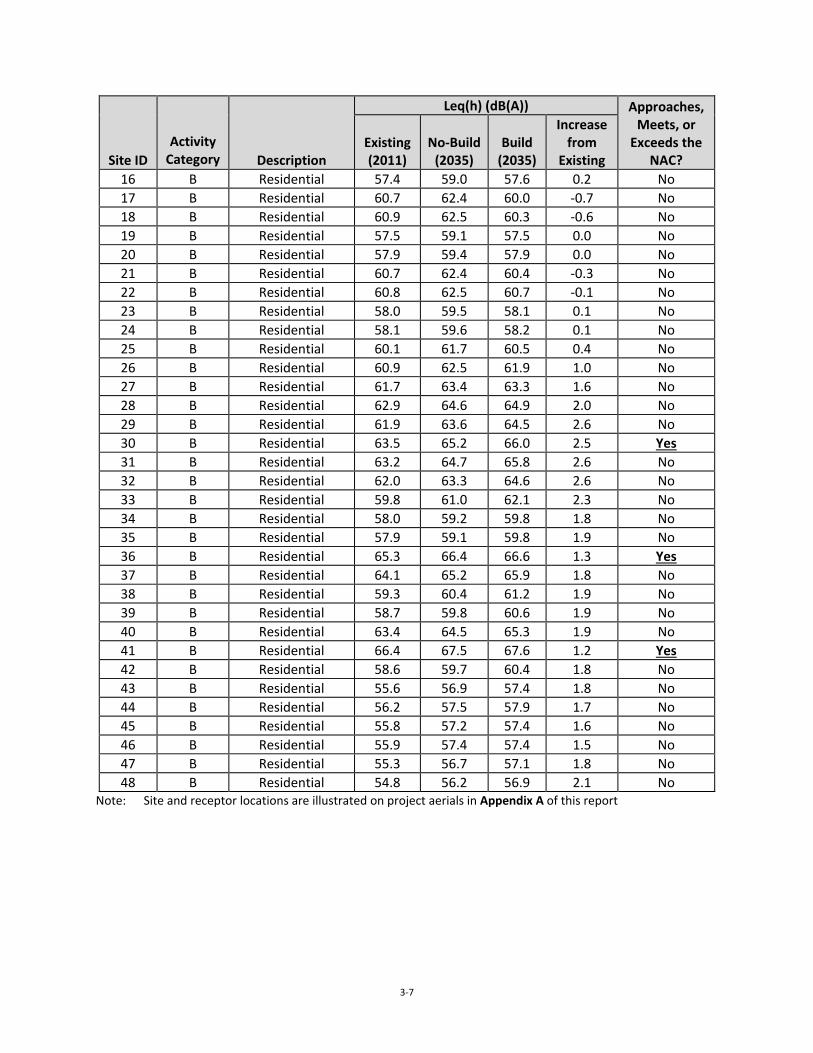
3.3 Results of the Noise Analysis Table 3-4 presents the results of the traffic noise analysis for the proposed improvements. As shown, existing (2014) exterior traffic noise levels range from 53.4 to 68.5 dB(A) and future no-build (2043) exterior traffic noise levels are predicted to range from 54.5 to 69.6 dB(A). These levels are below the NAC for the existing land uses. In the future with the proposed improvements (Build-2043), exterior traffic noise levels are predicted to range from 54.3 to 68.0 dB(A). As also shown in Table 3-4, with the proposed improvements, 12 of the 109 evaluated receptors are predicted to be impacted by traffic noise. One of these receptors represents a residence located in the Clear Lake Terrace neighborhood (CNE 1), eight represent residences at the Clearlake Pines Apartments (CNE 3), and three represent residences within the College Green Estates Neighborhood (CNE 4). When compared to the existing condition, traffic noise levels are not predicted to increase more than 4.3 dB(A) above existing conditions at any of the evaluated receptors. As such, the project would not substantially increase traffic noise (i.e., increase traffic noise 15 dB(A) or more). Notably, some receptors (e.g., within Clearlake Pines Apartments and Courtyard Condominiums) are predicted to have traffic noise levels that decrease when compared to the existing condition due the proposed roadway alignment moving farther away from these receptors.

3-5
TABLE 3-4 PREDICTED TRAFFIC NOISE LEVELS
Site ID
Activity Category Description
Leq(h) (dB(A)) Approaches, Meets, or
Exceeds the NAC?
Existing (2011)
No-Build (2035)
Build (2035)
Increase from
Existing Clear Lake Terrace (CNE 1)
1 B Residential 63.3 64.5 66.2 2.9 Yes 2 B Residential 60.2 61.3 62.8 2.6 No 3 B Residential 59.6 60.8 62.4 2.8 No 4 B Residential 59.9 61.1 63.0 3.1 No 5 B Residential 60.2 61.3 63.5 3.3 No 6 B Residential 59.6 60.8 62.5 2.9 No 7 B Residential 59.4 60.6 62.2 2.8 No 8 B Residential 60.3 61.5 63.5 3.2 No 9 B Residential 59.7 60.9 62.5 2.8 No
10 B Residential 59.0 60.2 61.4 2.4 No 11 B Residential 61.3 62.5 65.1 3.8 No 12 B Residential 61.4 62.6 65.1 3.7 No 13 B Residential 61.0 62.2 65.2 4.2 No 14 B Residential 59.9 61.1 64.2 4.3 No
Tennis Courts at Office Complex (CNE 2) 1 C Sports Area 56.7 57.9 57.5 0.8 No
Clearlake Pines Apartments (CNE 3) 1 C Residential 57.9 59.0 58.9 1.0 No 2 B Residential 67.4 68.5 67.2 -0.2 Yes 3 B Residential 62.9 64.1 63.9 1.0 No 4 B Residential 61.1 62.2 62.4 1.3 No 5 B Residential 59.7 60.8 60.9 1.2 No 6 B Residential 65.9 67.0 65.8 -0.1 No 7 B Residential 61.4 62.5 62.3 0.9 No 8 B Residential 59.6 60.7 60.9 1.3 No 9 B Residential 57.9 59.0 58.7 0.8 No
10 B Residential 56.9 58.0 57.2 0.3 No 11 B Residential 64.5 65.6 64.6 0.1 No 12 B Residential 60.9 62.0 62.0 1.1 No 13 B Residential 59.2 60.3 60.5 1.3 No 14 B Residential 57.5 58.6 58.4 0.9 No 15 B Residential 54.5 55.6 55.1 0.6 No 16 B Residential 68.5 69.6 68.0 -0.5 Yes 17 B Residential 64.0 65.1 64.5 0.5 No 18 B Residential 61.1 62.2 62.2 1.1 No 19 B Residential 59.2 60.3 60.1 0.9 No 20 B Residential 57.8 59.0 58.1 0.3 No 21 B Residential 65.3 66.4 65.4 0.1 No

3-6
Site ID
Activity Category Description
Leq(h) (dB(A)) Approaches, Meets, or
Exceeds the NAC?
Existing (2011)
No-Build (2035)
Build (2035)
Increase from
Existing 22 B Residential 61.4 62.5 62.3 0.9 No 23 B Residential 59.1 60.2 59.9 0.8 No 24 B Residential 57.6 58.8 58.0 0.4 No 25 B Residential 55.7 56.8 55.6 -0.1 No 26 B Residential 66.6 67.7 66.7 0.1 Yes 27 B Residential 61.8 62.9 62.8 1.0 No 28 B Residential 60.8 61.9 62.0 1.2 No 29 B Residential 59.1 60.2 59.3 0.2 No 30 B Residential 56.3 57.4 56.6 0.3 No 31 B Residential 65.2 66.3 66.1 0.9 Yes 32 B Residential 65.8 66.9 66.7 0.9 Yes 33 B Residential 66.5 67.6 67.2 0.7 Yes 34 B Residential 67.1 68.2 67.7 0.6 Yes 35 B Residential 60.0 61.1 61.5 1.5 No 36 B Residential 61.6 62.7 63.4 1.8 No 37 B Residential 63.8 64.9 65.2 1.4 No 38 B Residential 66.8 67.9 67.4 0.6 Yes 39 B Residential 60.2 61.4 61.7 1.5 No 40 B Residential 56.3 57.4 57.5 1.2 No 41 B Residential 55.3 56.4 56.4 1.1 No 42 B Residential 54.5 55.6 55.6 1.1 No 43 B Residential 55.1 56.3 56.2 1.1 No 44 B Residential 53.4 54.5 54.3 0.9 No 45 B Residential 54.3 55.4 55.0 0.7 No 46 B Residential 53.8 55.0 54.7 0.9 No
Courtyard Condominiums and College Green Estates (CNE 4) 1 B Residential 60.4 62.3 60.0 -0.4 No 2 B Residential 60.3 62.2 59.8 -0.5 No 3 B Residential 58.0 59.8 58.8 0.8 No 4 B Residential 57.9 59.6 58.6 0.7 No 5 B Residential 60.3 62.1 59.6 -0.7 No 6 B Residential 60.3 62.1 59.5 -0.8 No 7 B Residential 57.9 59.5 58.3 0.4 No 8 B Residential 57.8 59.4 58.1 0.3 No 9 B Residential 60.3 62.1 59.5 -0.8 No
10 B Residential 60.4 62.1 59.6 -0.8 No 11 B Residential 57.7 59.3 57.9 0.2 No 12 B Residential 57.4 59.0 57.5 0.1 No 13 B Residential 60.0 61.7 59.4 -0.6 No 14 B Residential 60.1 61.7 59.5 -0.6 No 15 B Residential 57.4 58.9 57.6 0.2 No
3-7
Site ID
Activity Category Description
Leq(h) (dB(A)) Approaches, Meets, or
Exceeds the NAC?
Existing (2011)
No-Build (2035)
Build (2035)
Increase from
Existing 16 B Residential 57.4 59.0 57.6 0.2 No 17 B Residential 60.7 62.4 60.0 -0.7 No 18 B Residential 60.9 62.5 60.3 -0.6 No 19 B Residential 57.5 59.1 57.5 0.0 No 20 B Residential 57.9 59.4 57.9 0.0 No 21 B Residential 60.7 62.4 60.4 -0.3 No 22 B Residential 60.8 62.5 60.7 -0.1 No 23 B Residential 58.0 59.5 58.1 0.1 No 24 B Residential 58.1 59.6 58.2 0.1 No 25 B Residential 60.1 61.7 60.5 0.4 No 26 B Residential 60.9 62.5 61.9 1.0 No 27 B Residential 61.7 63.4 63.3 1.6 No 28 B Residential 62.9 64.6 64.9 2.0 No 29 B Residential 61.9 63.6 64.5 2.6 No 30 B Residential 63.5 65.2 66.0 2.5 Yes 31 B Residential 63.2 64.7 65.8 2.6 No 32 B Residential 62.0 63.3 64.6 2.6 No 33 B Residential 59.8 61.0 62.1 2.3 No 34 B Residential 58.0 59.2 59.8 1.8 No 35 B Residential 57.9 59.1 59.8 1.9 No 36 B Residential 65.3 66.4 66.6 1.3 Yes 37 B Residential 64.1 65.2 65.9 1.8 No 38 B Residential 59.3 60.4 61.2 1.9 No 39 B Residential 58.7 59.8 60.6 1.9 No 40 B Residential 63.4 64.5 65.3 1.9 No 41 B Residential 66.4 67.5 67.6 1.2 Yes 42 B Residential 58.6 59.7 60.4 1.8 No 43 B Residential 55.6 56.9 57.4 1.8 No 44 B Residential 56.2 57.5 57.9 1.7 No 45 B Residential 55.8 57.2 57.4 1.6 No 46 B Residential 55.9 57.4 57.4 1.5 No 47 B Residential 55.3 56.7 57.1 1.8 No 48 B Residential 54.8 56.2 56.9 2.1 No
Note: Site and receptor locations are illustrated on project aerials in Appendix A of this report
4-1
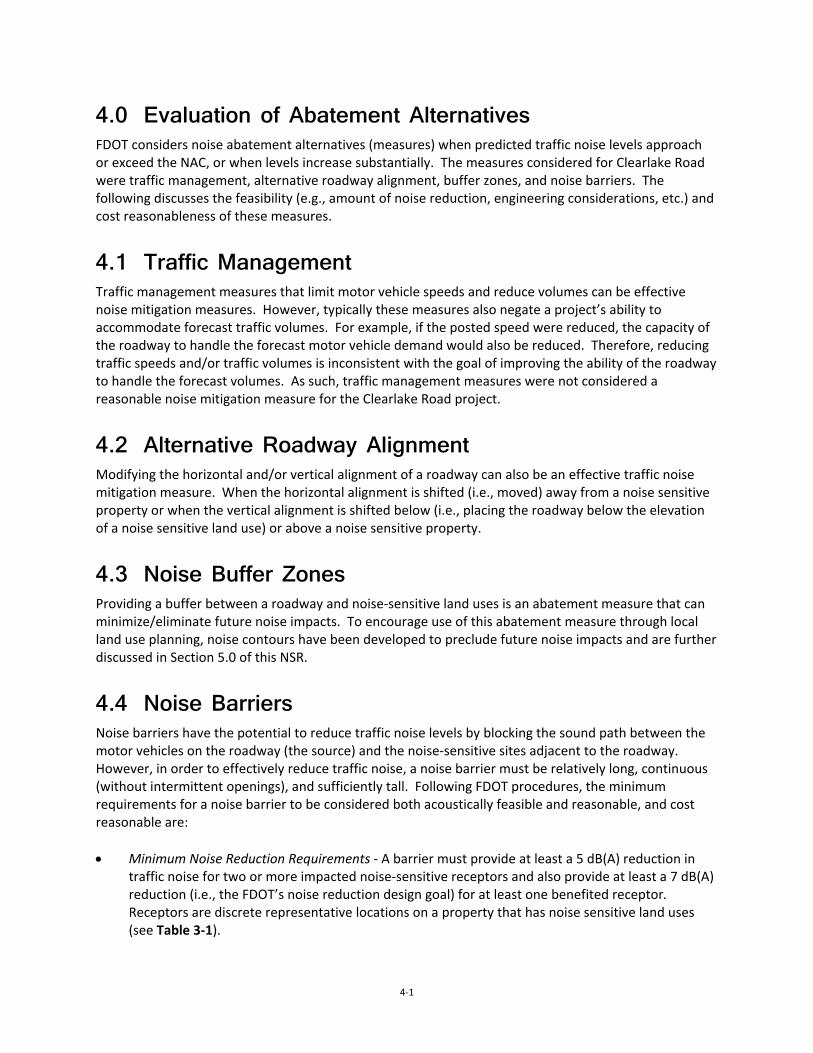
4.0 Evaluation of Abatement Alternatives FDOT considers noise abatement alternatives (measures) when predicted traffic noise levels approach or exceed the NAC, or when levels increase substantially. The measures considered for Clearlake Road were traffic management, alternative roadway alignment, buffer zones, and noise barriers. The following discusses the feasibility (e.g., amount of noise reduction, engineering considerations, etc.) and cost reasonableness of these measures.
4.1 Traffic Management Traffic management measures that limit motor vehicle speeds and reduce volumes can be effective noise mitigation measures. However, typically these measures also negate a project’s ability to accommodate forecast traffic volumes. For example, if the posted speed were reduced, the capacity of the roadway to handle the forecast motor vehicle demand would also be reduced. Therefore, reducing traffic speeds and/or traffic volumes is inconsistent with the goal of improving the ability of the roadway to handle the forecast volumes. As such, traffic management measures were not considered a reasonable noise mitigation measure for the Clearlake Road project.
4.2 Alternative Roadway Alignment Modifying the horizontal and/or vertical alignment of a roadway can also be an effective traffic noise mitigation measure. When the horizontal alignment is shifted (i.e., moved) away from a noise sensitive property or when the vertical alignment is shifted below (i.e., placing the roadway below the elevation of a noise sensitive land use) or above a noise sensitive property.
4.3 Noise Buffer Zones Providing a buffer between a roadway and noise-sensitive land uses is an abatement measure that can minimize/eliminate future noise impacts. To encourage use of this abatement measure through local land use planning, noise contours have been developed to preclude future noise impacts and are further discussed in Section 5.0 of this NSR.
4.4 Noise Barriers Noise barriers have the potential to reduce traffic noise levels by blocking the sound path between the motor vehicles on the roadway (the source) and the noise-sensitive sites adjacent to the roadway. However, in order to effectively reduce traffic noise, a noise barrier must be relatively long, continuous (without intermittent openings), and sufficiently tall. Following FDOT procedures, the minimum requirements for a noise barrier to be considered both acoustically feasible and reasonable, and cost reasonable are: • Minimum Noise Reduction Requirements - A barrier must provide at least a 5 dB(A) reduction in
traffic noise for two or more impacted noise-sensitive receptors and also provide at least a 7 dB(A) reduction (i.e., the FDOT’s noise reduction design goal) for at least one benefited receptor. Receptors are discrete representative locations on a property that has noise sensitive land uses (see Table 3-1).
4-2
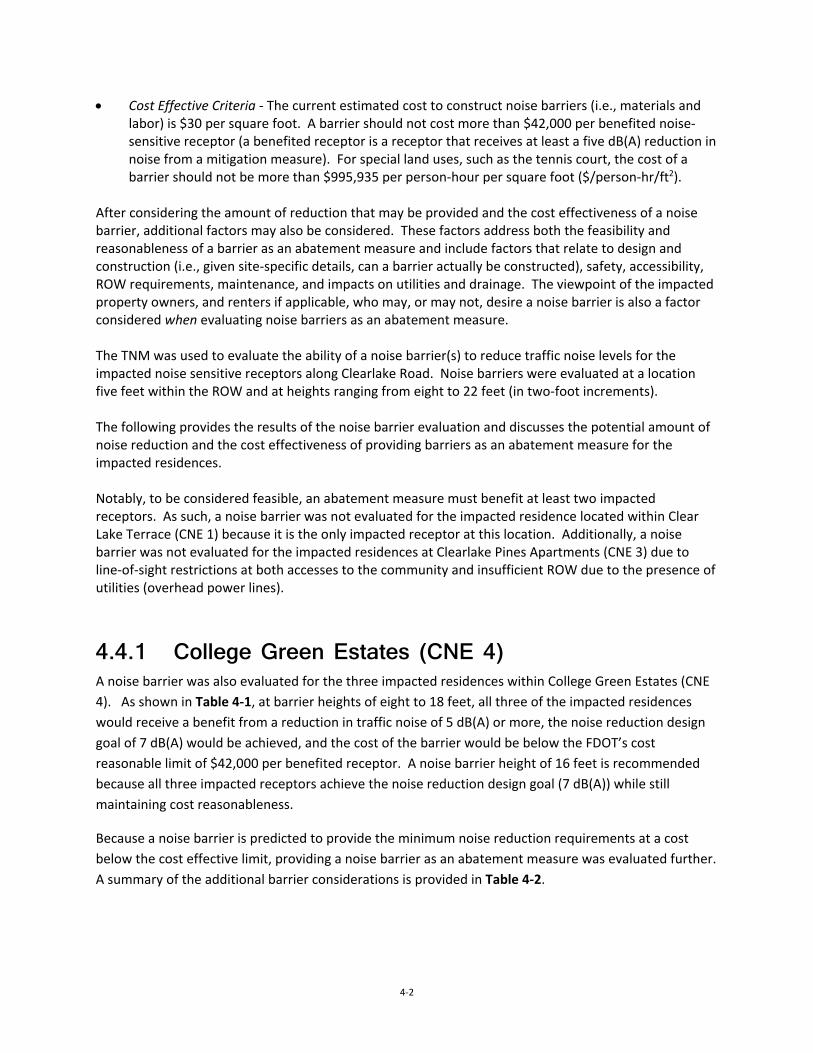
• Cost Effective Criteria - The current estimated cost to construct noise barriers (i.e., materials and labor) is $30 per square foot. A barrier should not cost more than $42,000 per benefited noise-sensitive receptor (a benefited receptor is a receptor that receives at least a five dB(A) reduction in noise from a mitigation measure). For special land uses, such as the tennis court, the cost of a barrier should not be more than $995,935 per person-hour per square foot ($/person-hr/ft2).
After considering the amount of reduction that may be provided and the cost effectiveness of a noise barrier, additional factors may also be considered. These factors address both the feasibility and reasonableness of a barrier as an abatement measure and include factors that relate to design and construction (i.e., given site-specific details, can a barrier actually be constructed), safety, accessibility, ROW requirements, maintenance, and impacts on utilities and drainage. The viewpoint of the impacted property owners, and renters if applicable, who may, or may not, desire a noise barrier is also a factor considered when evaluating noise barriers as an abatement measure. The TNM was used to evaluate the ability of a noise barrier(s) to reduce traffic noise levels for the impacted noise sensitive receptors along Clearlake Road. Noise barriers were evaluated at a location five feet within the ROW and at heights ranging from eight to 22 feet (in two-foot increments). The following provides the results of the noise barrier evaluation and discusses the potential amount of noise reduction and the cost effectiveness of providing barriers as an abatement measure for the impacted residences. Notably, to be considered feasible, an abatement measure must benefit at least two impacted receptors. As such, a noise barrier was not evaluated for the impacted residence located within Clear Lake Terrace (CNE 1) because it is the only impacted receptor at this location. Additionally, a noise barrier was not evaluated for the impacted residences at Clearlake Pines Apartments (CNE 3) due to line-of-sight restrictions at both accesses to the community and insufficient ROW due to the presence of utilities (overhead power lines).
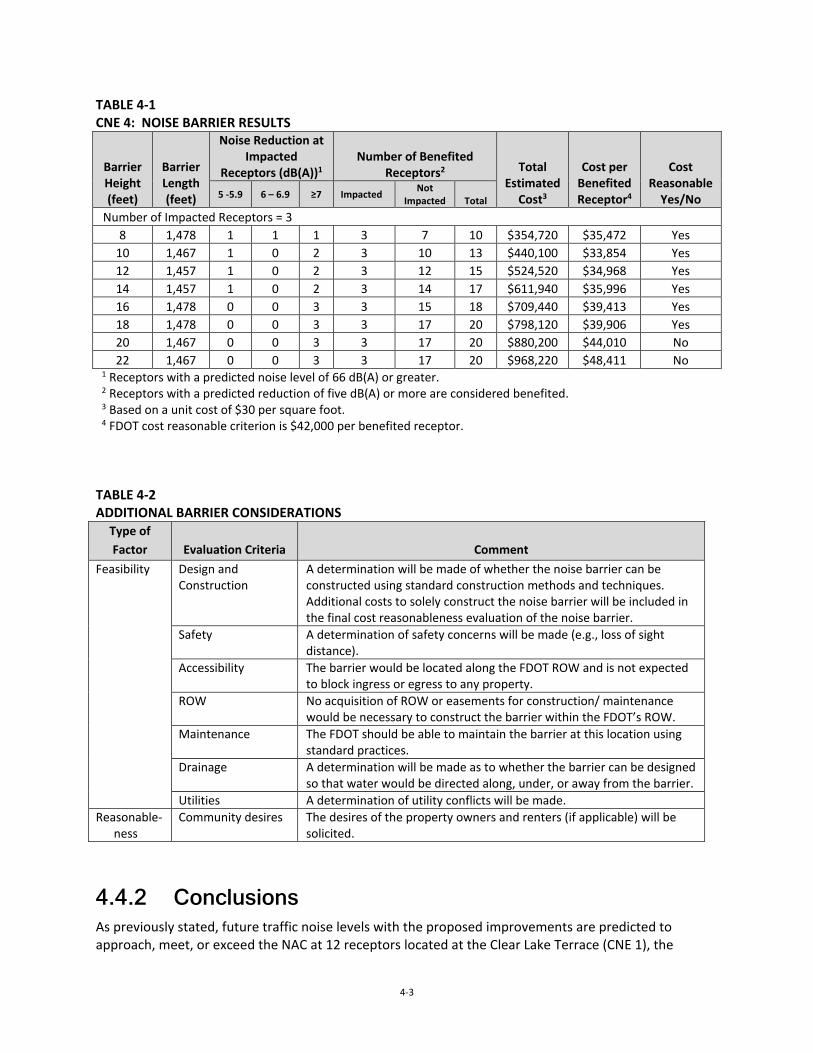
4.4.1 College Green Estates (CNE 4) A noise barrier was also evaluated for the three impacted residences within College Green Estates (CNE 4). As shown in Table 4-1, at barrier heights of eight to 18 feet, all three of the impacted residences would receive a benefit from a reduction in traffic noise of 5 dB(A) or more, the noise reduction design goal of 7 dB(A) would be achieved, and the cost of the barrier would be below the FDOT’s cost reasonable limit of $42,000 per benefited receptor. A noise barrier height of 16 feet is recommended because all three impacted receptors achieve the noise reduction design goal (7 dB(A)) while still maintaining cost reasonableness.
Because a noise barrier is predicted to provide the minimum noise reduction requirements at a cost below the cost effective limit, providing a noise barrier as an abatement measure was evaluated further. A summary of the additional barrier considerations is provided in Table 4-2.
4-3
TABLE 4-1 CNE 4: NOISE BARRIER RESULTS
Barrier Height (feet)
Barrier Length (feet)
Noise Reduction at Impacted
Receptors (dB(A))1 Number of Benefited
Receptors2 Total Estimated
Cost3
Cost per Benefited Receptor4
Cost Reasonable
Yes/No 5 -5.9 6 – 6.9 ≥7 Impacted Not Impacted Total
Number of Impacted Receptors = 3 8 1,478 1 1 1 3 7 10 $354,720 $35,472 Yes
10 1,467 1 0 2 3 10 13 $440,100 $33,854 Yes 12 1,457 1 0 2 3 12 15 $524,520 $34,968 Yes 14 1,457 1 0 2 3 14 17 $611,940 $35,996 Yes 16 1,478 0 0 3 3 15 18 $709,440 $39,413 Yes 18 1,478 0 0 3 3 17 20 $798,120 $39,906 Yes 20 1,467 0 0 3 3 17 20 $880,200 $44,010 No 22 1,467 0 0 3 3 17 20 $968,220 $48,411 No
1 Receptors with a predicted noise level of 66 dB(A) or greater. 2 Receptors with a predicted reduction of five dB(A) or more are considered benefited. 3 Based on a unit cost of $30 per square foot. 4 FDOT cost reasonable criterion is $42,000 per benefited receptor.
TABLE 4-2 ADDITIONAL BARRIER CONSIDERATIONS
Type of Factor Evaluation Criteria Comment
Feasibility Design and Construction
A determination will be made of whether the noise barrier can be constructed using standard construction methods and techniques. Additional costs to solely construct the noise barrier will be included in the final cost reasonableness evaluation of the noise barrier.
Safety A determination of safety concerns will be made (e.g., loss of sight distance).
Accessibility The barrier would be located along the FDOT ROW and is not expected to block ingress or egress to any property.
ROW No acquisition of ROW or easements for construction/ maintenance would be necessary to construct the barrier within the FDOT’s ROW.
Maintenance The FDOT should be able to maintain the barrier at this location using standard practices.
Drainage A determination will be made as to whether the barrier can be designed so that water would be directed along, under, or away from the barrier.
Utilities A determination of utility conflicts will be made. Reasonable-
ness Community desires The desires of the property owners and renters (if applicable) will be
solicited.
4.4.2 Conclusions As previously stated, future traffic noise levels with the proposed improvements are predicted to approach, meet, or exceed the NAC at 12 receptors located at the Clear Lake Terrace (CNE 1), the
4-4
Clearlake Pines Apartments (CNE3), and the College Green Estates (CNE 4). Based on the results of the noise barrier evaluation, a noise barrier appears to be a reasonable and feasible noise abatement method for the three impacted receptors at College Green Estates. There appear to be no reasonable or feasible methods to reduce predicted traffic noise for the impacted receptors within Clear Lake Terrace or Clearlake Pines Apartments.
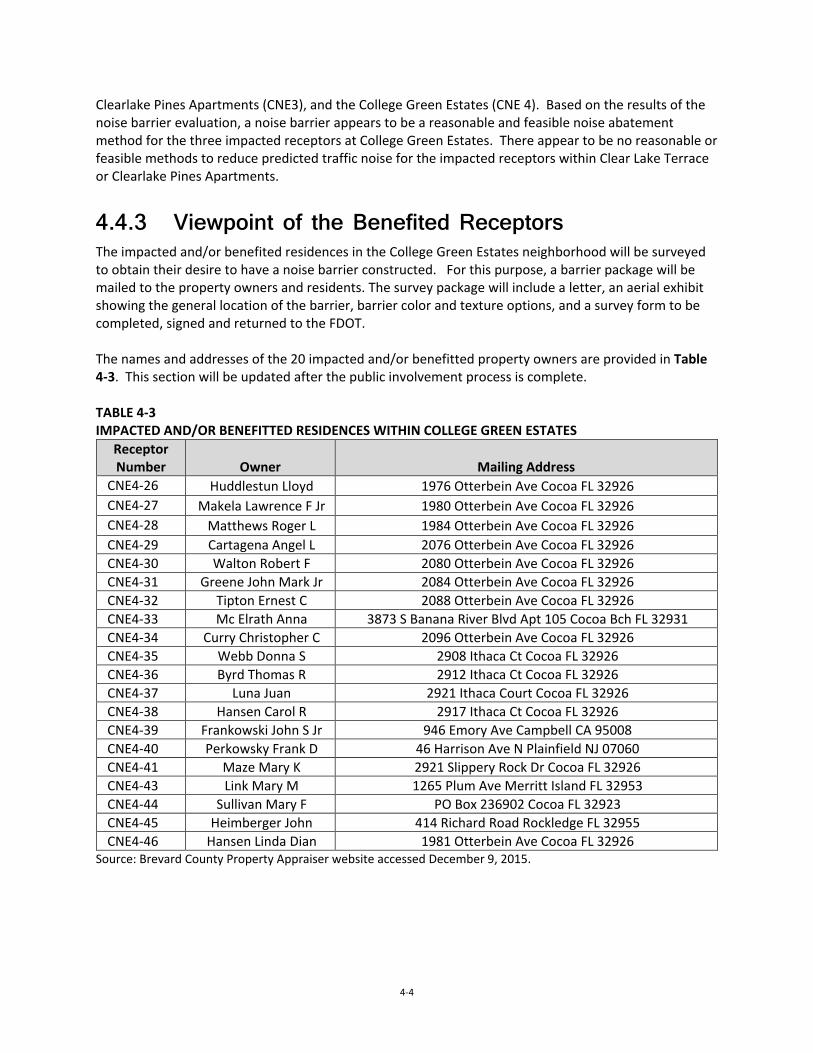
4.4.3 Viewpoint of the Benefited Receptors The impacted and/or benefited residences in the College Green Estates neighborhood will be surveyed to obtain their desire to have a noise barrier constructed. For this purpose, a barrier package will be mailed to the property owners and residents. The survey package will include a letter, an aerial exhibit showing the general location of the barrier, barrier color and texture options, and a survey form to be completed, signed and returned to the FDOT. The names and addresses of the 20 impacted and/or benefitted property owners are provided in Table 4-3. This section will be updated after the public involvement process is complete. TABLE 4-3 IMPACTED AND/OR BENEFITTED RESIDENCES WITHIN COLLEGE GREEN ESTATES
Receptor Number Owner Mailing Address
CNE4-26 Huddlestun Lloyd 1976 Otterbein Ave Cocoa FL 32926 CNE4-27 Makela Lawrence F Jr 1980 Otterbein Ave Cocoa FL 32926 CNE4-28 Matthews Roger L 1984 Otterbein Ave Cocoa FL 32926 CNE4-29 Cartagena Angel L 2076 Otterbein Ave Cocoa FL 32926 CNE4-30 Walton Robert F 2080 Otterbein Ave Cocoa FL 32926 CNE4-31 Greene John Mark Jr 2084 Otterbein Ave Cocoa FL 32926 CNE4-32 Tipton Ernest C 2088 Otterbein Ave Cocoa FL 32926 CNE4-33 Mc Elrath Anna 3873 S Banana River Blvd Apt 105 Cocoa Bch FL 32931 CNE4-34 Curry Christopher C 2096 Otterbein Ave Cocoa FL 32926 CNE4-35 Webb Donna S 2908 Ithaca Ct Cocoa FL 32926 CNE4-36 Byrd Thomas R 2912 Ithaca Ct Cocoa FL 32926 CNE4-37 Luna Juan 2921 Ithaca Court Cocoa FL 32926 CNE4-38 Hansen Carol R 2917 Ithaca Ct Cocoa FL 32926 CNE4-39 Frankowski John S Jr 946 Emory Ave Campbell CA 95008 CNE4-40 Perkowsky Frank D 46 Harrison Ave N Plainfield NJ 07060 CNE4-41 Maze Mary K 2921 Slippery Rock Dr Cocoa FL 32926 CNE4-43 Link Mary M 1265 Plum Ave Merritt Island FL 32953 CNE4-44 Sullivan Mary F PO Box 236902 Cocoa FL 32923 CNE4-45 Heimberger John 414 Richard Road Rockledge FL 32955 CNE4-46 Hansen Linda Dian 1981 Otterbein Ave Cocoa FL 32926
Source: Brevard County Property Appraiser website accessed December 9, 2015.
5-1
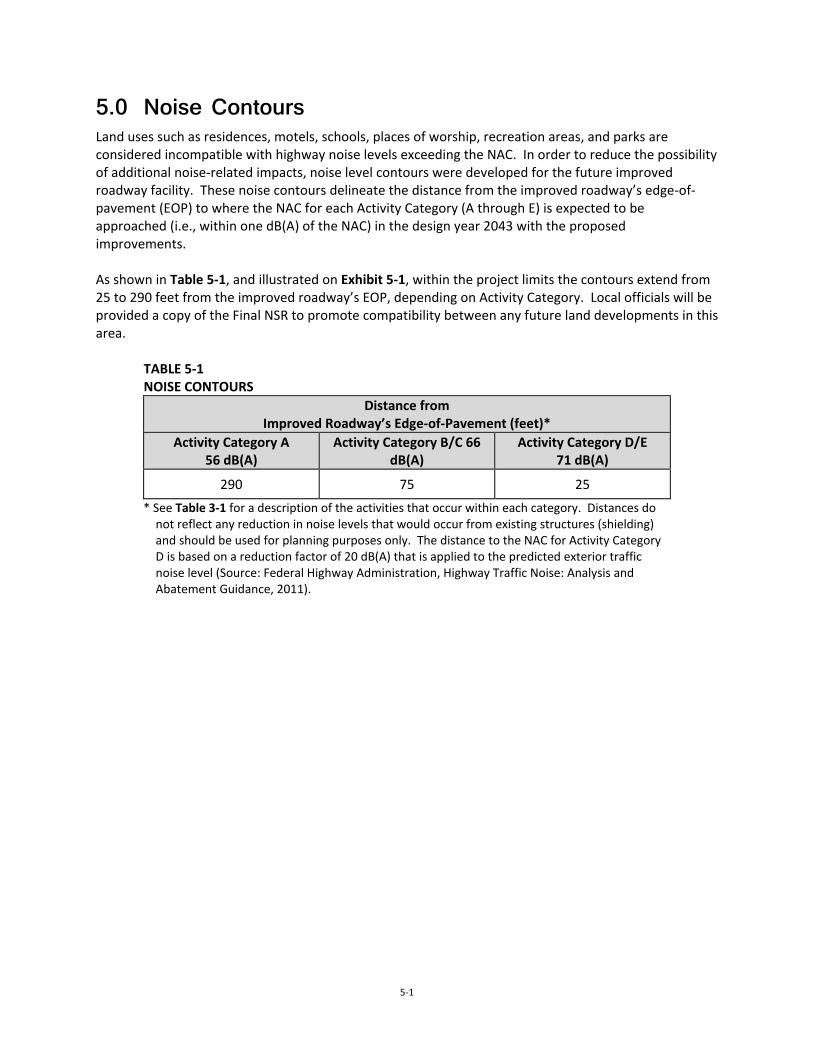
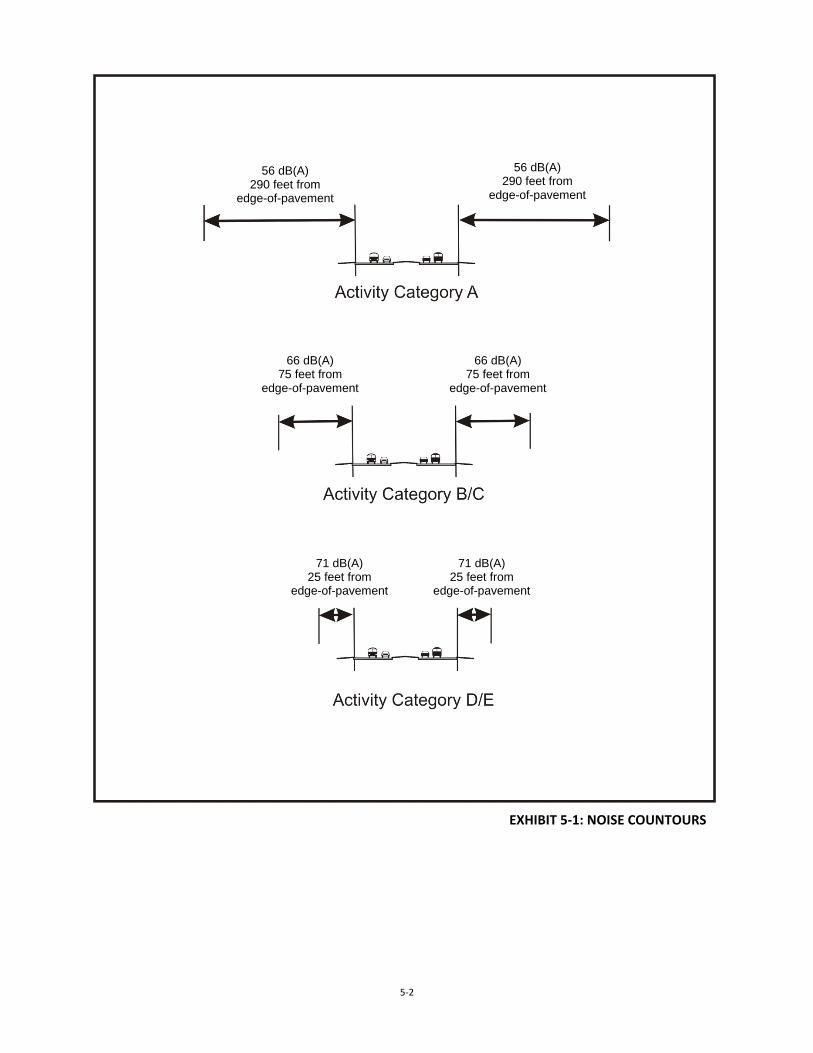
5.0 Noise Contours Land uses such as residences, motels, schools, places of worship, recreation areas, and parks are considered incompatible with highway noise levels exceeding the NAC. In order to reduce the possibility of additional noise-related impacts, noise level contours were developed for the future improved roadway facility. These noise contours delineate the distance from the improved roadway’s edge-of-pavement (EOP) to where the NAC for each Activity Category (A through E) is expected to be approached (i.e., within one dB(A) of the NAC) in the design year 2043 with the proposed improvements. As shown in Table 5-1, and illustrated on Exhibit 5-1, within the project limits the contours extend from 25 to 290 feet from the improved roadway’s EOP, depending on Activity Category. Local officials will be provided a copy of the Final NSR to promote compatibility between any future land developments in this area.
TABLE 5-1 NOISE CONTOURS
Distance from Improved Roadway’s Edge-of-Pavement (feet)*
Activity Category A 56 dB(A)
Activity Category B/C 66 dB(A)
Activity Category D/E 71 dB(A)
290 75 25 * See Table 3-1 for a description of the activities that occur within each category. Distances do
not reflect any reduction in noise levels that would occur from existing structures (shielding) and should be used for planning purposes only. The distance to the NAC for Activity Category D is based on a reduction factor of 20 dB(A) that is applied to the predicted exterior traffic noise level (Source: Federal Highway Administration, Highway Traffic Noise: Analysis and Abatement Guidance, 2011).
5-2
71 dB(A) 25 feet from
edge-of-pavement
71 dB(A) 25 feet from
edge-of-pavement
66 dB(A) 75 feet from
edge-of-pavement
66 dB(A) 75 feet from
edge-of-pavement
56 dB(A) 290 feet from
edge-of-pavement
56 dB(A) 290 feet from
edge-of-pavement
EXHIBIT 5-1: NOISE COUNTOURS

6-1
6.0 Construction Noise and Vibration The contractor’s application of the FDOT Standard Specifications for Road and Bridge Construction should minimize or eliminate any potential construction noise and vibration impacts. Should unanticipated noise or vibration issues arise during the construction process, the Project Engineer, in coordination with the District Noise Specialist and the Contractor, will investigate additional methods of controlling the impacts.
7-1
7.0 References Federal Highway Administration. U.S. Department of Transportation. July 13, 2010. Title 23 CFR, Part
772. Procedures for Abatement of Highway Traffic Noise and Construction Noise.
Federal Highway Administration. February 2004. Traffic Noise Model, Version 2.5.
Federal Highway Administration. December 2011. Highway Traffic Noise: Analysis and Abatement Guidance.
Federal Highway Administration. May 1996. Measurement of Highway-Related Noise. FHWA-PD-96-046.
Florida Department of Transportation. May 24, 2011. Project Development and Environment Manual, Part 2, Chapter 17 – Noise.
Florida Department of Transportation. July 22, 2009. A Method to Determine Reasonableness and Feasibility of Noise Abatement at Special Use Locations.
Florida Department of Transportation. 2014. Standard Specifications for Road and Bridge Construction.
Brevard County Property Appraiser’s Office. Map Search. Accessed December 9, 2015. https://www.bcpao.us/asp/ChooseWebMapApp.asp

APPENDIX A Project Aerials
CNE 3
Clear Lake Terrace
16-17 37-38
5 6 4 2
3 1
11-12
8-9 13-14
6-7 2-3 4-5
1
7 8 9 10
14 11 12 13
CNE 2
CNE 1
1
10
18-19 15-20
21-22
23-24
26-27
28-29
25-30
31-32 33-34
45-46 35-36
41-42
39-40
43-44
RECEPTOR LOCATION

Clearlake Road (SR 501) PD&E Study From Michigan Avenue To Industry Road
VE Subalternative: 35 mph ‘Bulb-Out’
Brevard County FPID: 433605-1-22-01 I ETDM: 13120
Courtyard Condominiums
College Green Estates Ithaca Ct Slippery Rock Dr
Otterbein Ave
CNE 4
48 47 45
43
28
44
26 25
46
27 22 21
23 24
18
20
17
19
14
16
13
15
10
12
9
11 8
5 6
7
42
41 40
35
36 37
34 38 39
29
33 32
31 30
4
2
3
1
RECEPTOR LOCATION
POTENTIAL NOISE BARRIER

APPENDIX B Traffic Data
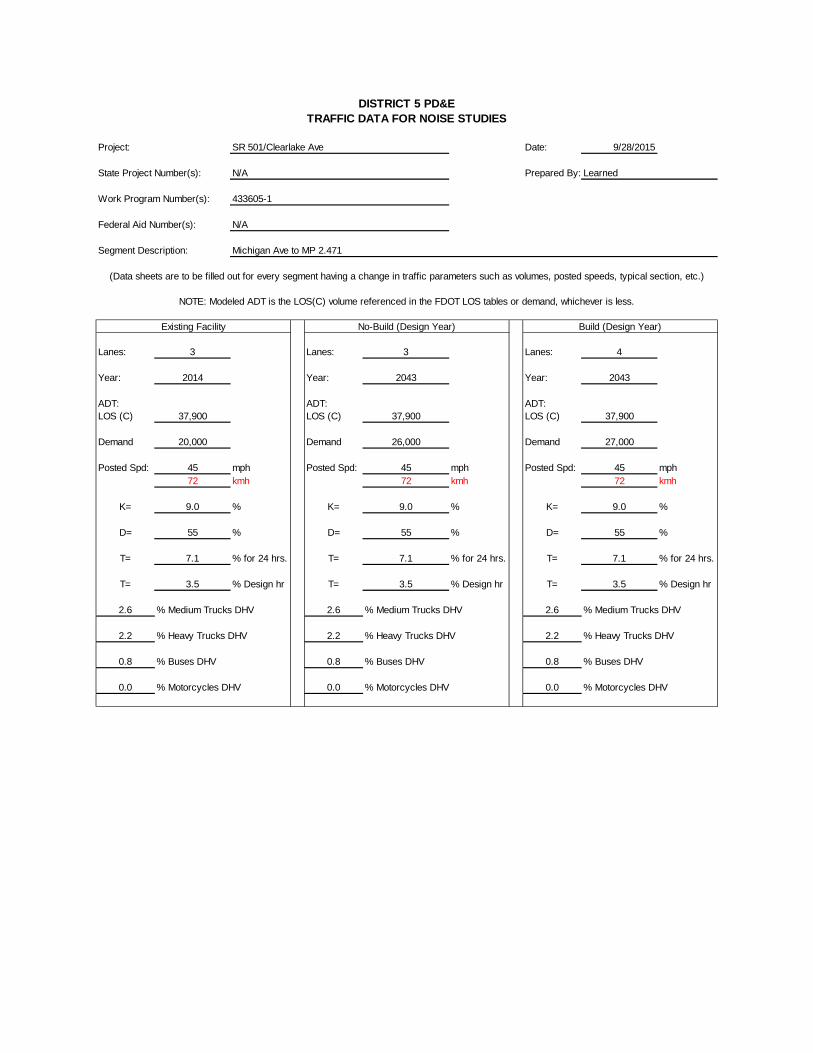
DISTRICT 5 PD&ETRAFFIC DATA FOR NOISE STUDIES
Project: SR 501/Clearlake Ave Date: 9/28/2015
State Project Number(s): N/A Prepared By: Learned
Work Program Number(s): 433605-1
Federal Aid Number(s): N/A
Segment Description: Michigan Ave to MP 2.471
(Data sheets are to be filled out for every segment having a change in traffic parameters such as volumes, posted speeds, typical section, etc.)
NOTE: Modeled ADT is the LOS(C) volume referenced in the FDOT LOS tables or demand, whichever is less.
Existing Facility No-Build (Design Year) Build (Design Year)
Lanes: 3 Lanes: 3 Lanes: 4
Year: 2014 Year: 2043 Year: 2043
ADT: ADT: ADT:LOS (C) 37,900 LOS (C) 37,900 LOS (C) 37,900
Demand 20,000 Demand 26,000 Demand 27,000
Posted Spd: 45 mph Posted Spd: 45 mph Posted Spd: 45 mph72 kmh 72 kmh 72 kmh
K= 9.0 % K= 9.0 % K= 9.0 %
D= 55 % D= 55 % D= 55 %
T= 7.1 % for 24 hrs. T= 7.1 % for 24 hrs. T= 7.1 % for 24 hrs.
T= 3.5 % Design hr T= 3.5 % Design hr T= 3.5 % Design hr
2.6 % Medium Trucks DHV 2.6 % Medium Trucks DHV 2.6 % Medium Trucks DHV
2.2 % Heavy Trucks DHV 2.2 % Heavy Trucks DHV 2.2 % Heavy Trucks DHV
0.8 % Buses DHV 0.8 % Buses DHV 0.8 % Buses DHV
0.0 % Motorcycles DHV 0.0 % Motorcycles DHV 0.0 % Motorcycles DHV

DISTRICT 5 PD&ETRAFFIC DATA FOR NOISE STUDIES
Project: SR 501/Clearlake Ave Date: 9/28/2015
State Project Number(s): N/A Prepared By: Learned
Work Program Number(s): 433605-1
Federal Aid Number(s): N/A
Segment Description: MP 2.471 to MP 3.056
(Data sheets are to be filled out for every segment having a change in traffic parameters such as volumes, posted speeds, typical section, etc.)
NOTE: Modeled ADT is the LOS(C) volume referenced in the FDOT LOS tables or demand, whichever is less.
Existing Facility No-Build (Design Year) Build (Design Year)
Lanes: 3 Lanes: 3 Lanes: 4
Year: 2014 Year: 2043 Year: 2043
ADT: ADT: ADT:LOS (C) 37,900 LOS (C) 37,900 LOS (C) 37,900
Demand 20,000 Demand 26,000 Demand 27,000
Posted Spd: 40 mph Posted Spd: 45 mph Posted Spd: 45 mph64 kmh 72 kmh 72 kmh
K= 9.0 % K= 9.0 % K= 9.0 %
D= 55 % D= 55 % D= 55 %
T= 7.1 % for 24 hrs. T= 7.1 % for 24 hrs. T= 7.1 % for 24 hrs.
T= 3.5 % Design hr T= 3.5 % Design hr T= 3.5 % Design hr
2.6 % Medium Trucks DHV 2.6 % Medium Trucks DHV 2.6 % Medium Trucks DHV
2.2 % Heavy Trucks DHV 2.2 % Heavy Trucks DHV 2.2 % Heavy Trucks DHV
0.8 % Buses DHV 0.8 % Buses DHV 0.8 % Buses DHV
0.0 % Motorcycles DHV 0.0 % Motorcycles DHV 0.0 % Motorcycles DHV

DISTRICT 5 PD&ETRAFFIC DATA FOR NOISE STUDIES
Project: SR 501/Clearlake Ave Date: 9/28/2015
State Project Number(s): N/A Prepared By: Learned
Work Program Number(s): 433605-1
Federal Aid Number(s): N/A
Segment Description: MP 3.056 to Industry Rd
(Data sheets are to be filled out for every segment having a change in traffic parameters such as volumes, posted speeds, typical section, etc.)
NOTE: Modeled ADT is the LOS(C) volume referenced in the FDOT LOS tables or demand, whichever is less.
Existing Facility No-Build (Design Year) Build (Design Year)
Lanes: 2 Lanes: 2 Lanes: 4
Year: 2014 Year: 2043 Year: 2043
ADT: ADT: ADT:LOS (C) 37,900 LOS (C) 37,900 LOS (C) 37,900
Demand 20,000 Demand 26,000 Demand 27,000
Posted Spd: 45 mph Posted Spd: 45 mph Posted Spd: 45 mph72 kmh 72 kmh 72 kmh
K= 9.0 % K= 9.0 % K= 9.0 %
D= 55 % D= 55 % D= 55 %
T= 7.1 % for 24 hrs. T= 7.1 % for 24 hrs. T= 7.1 % for 24 hrs.
T= 3.5 % Design hr T= 3.5 % Design hr T= 3.5 % Design hr
2.6 % Medium Trucks DHV 2.6 % Medium Trucks DHV 2.6 % Medium Trucks DHV
2.2 % Heavy Trucks DHV 2.2 % Heavy Trucks DHV 2.2 % Heavy Trucks DHV
0.8 % Buses DHV 0.8 % Buses DHV 0.8 % Buses DHV
0.0 % Motorcycles DHV 0.0 % Motorcycles DHV 0.0 % Motorcycles DHV

APPENDIX C Validation Documentation

NOISE MEASUREMENT DATA SHEET Measurements Taken By: Wayne Arner and Angel Martin Date: 10/21/15 Time Study Started: 9:45 am Time Study Ended: 10:20 am Project Identification:
Financial Project ID: 433605-1 Project Location: Clearlake Road (S.R. 501) from Michigan Avenue to Industry Road
Site Identification: Site 1 – next to post office across from College Green Estates Weather Conditions:
Sky: Clear Partly Cloudy X Other Temperature 76°F Wind Speed 2 mph Wind Direction E Humidity 84%
Equipment: Sound Level Meter:
Type: Larson Davis LxT Serial Number(s): 1843 Did you check the battery? Yes X No Calibration Readings: Start 114.0 End 113.9 Response Settings: Fast Slow X Weighting: A X Other
Calibrator: Type: Larson Davis CAL 200 Serial Number: 5592
Did you check the battery? Yes X No
TRAFFIC DATA
Roadway Identification Clearlake Road Westbound Clearlake Road Eastbound Vehicle Type Volume Speed (mph) Volume Speed (mph) Autos 67-86-86 46-43-43 96-67-110 46-42-45 Medium Trucks 2-4-6 45-43-42 1-3-1 39-45-40 Heavy Trucks 1-1-0 42-42-06 3-0-0 35-0-0 Buses 0-0-0 0-0-0 2-0-0 41-0-0 Motorcycles 0-0-1 0-0-42 0-0-2 0-0-50 Duration Three 10 minute measurements Three 10 minute measurements
RESULTS [dB(A)]
LEQ: 64.0/63.4/64.4 Lmax: 83.8/75.2/74.0 Background Noise: Birds chirping, traffic from SR 528 Major Sources: Clearlake Road motor vehicle traffic Unusual Events:
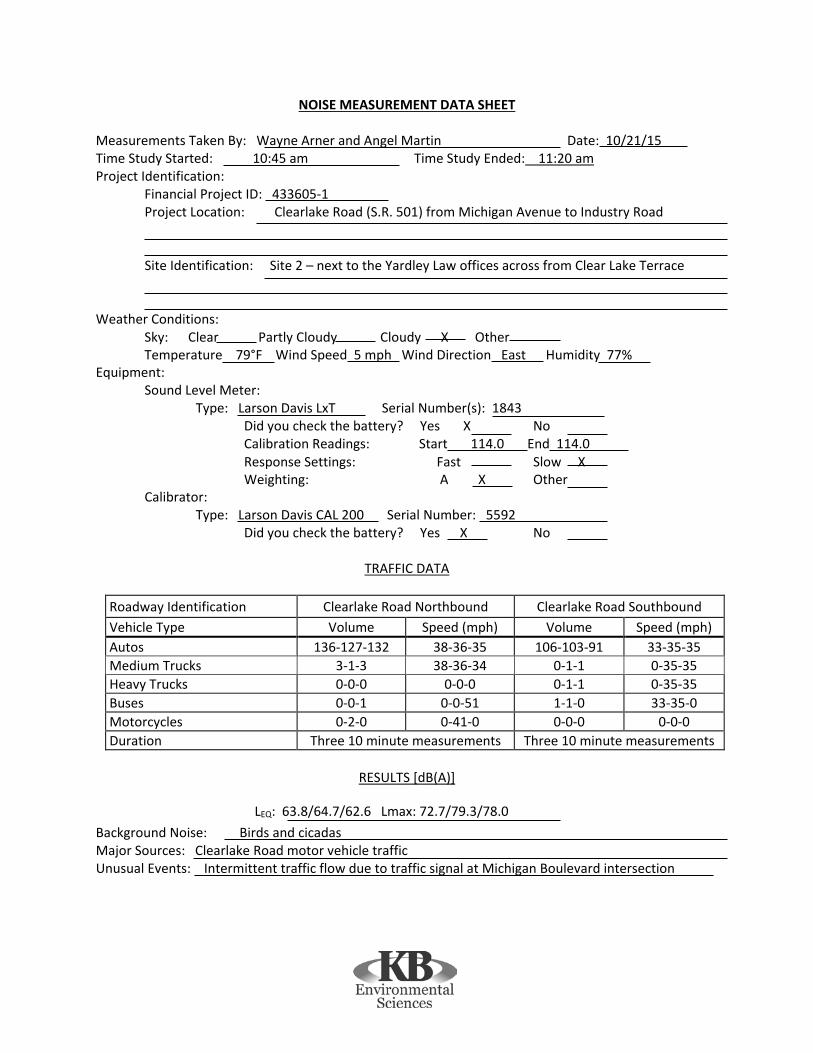
NOISE MEASUREMENT DATA SHEET Measurements Taken By: Wayne Arner and Angel Martin Date: 10/21/15 Time Study Started: 10:45 am Time Study Ended: 11:20 am Project Identification:
Financial Project ID: 433605-1 Project Location: Clearlake Road (S.R. 501) from Michigan Avenue to Industry Road
Site Identification: Site 2 – next to the Yardley Law offices across from Clear Lake Terrace Weather Conditions:
Sky: Clear Partly Cloudy Cloudy X Other Temperature 79°F Wind Speed 5 mph Wind Direction East Humidity 77%
Equipment: Sound Level Meter:
Type: Larson Davis LxT Serial Number(s): 1843 Did you check the battery? Yes X No Calibration Readings: Start 114.0 End 114.0 Response Settings: Fast Slow X Weighting: A X Other
Calibrator: Type: Larson Davis CAL 200 Serial Number: 5592
Did you check the battery? Yes X No
TRAFFIC DATA
Roadway Identification Clearlake Road Northbound Clearlake Road Southbound Vehicle Type Volume Speed (mph) Volume Speed (mph) Autos 136-127-132 38-36-35 106-103-91 33-35-35 Medium Trucks 3-1-3 38-36-34 0-1-1 0-35-35 Heavy Trucks 0-0-0 0-0-0 0-1-1 0-35-35 Buses 0-0-1 0-0-51 1-1-0 33-35-0 Motorcycles 0-2-0 0-41-0 0-0-0 0-0-0 Duration Three 10 minute measurements Three 10 minute measurements
RESULTS [dB(A)]
LEQ: 63.8/64.7/62.6 Lmax: 72.7/79.3/78.0 Background Noise: Birds and cicadas Major Sources: Clearlake Road motor vehicle traffic Unusual Events: Intermittent traffic flow due to traffic signal at Michigan Boulevard intersection