Embed Size (px)
Citation preview

Florida Education: The Next GenerationDRAFT
March 13, 2008Version 1.0
Florida’s K-12 Florida’s K-12 Education: The Next Education: The Next
GenerationGeneration
Presented by: Presented by: Dr. Frances HaithcockDr. Frances Haithcock
Chancellor, Division of Public SchoolsChancellor, Division of Public Schools
Florida Department of EducationFlorida Department of EducationDr. Eric J. Smith, Dr. Eric J. Smith,
CommissionerCommissioner

2Division of Public Schools (PreK -12) Florida Department of Education
Florida’s Foundation for Success
The Sunshine State Shines Nationally…
Education Week 2009 Quality Counts:
Ranked Florida’s education system top 10 in the nation.
Highest Quality Counts grade to date is a B-, which surpasses the national average of a C.
In 2008, ranking leaped from 31st in the nation to 14th, and now 10th.
U.S. News and World Report:
Seven Florida schools in the Top 100 High Schools in the nation.
3Division of Public Schools (PreK -12) Florida Department of Education
Florida’s Foundation for Success
Quality Counts in Florida and it’s producing National Results!
Advanced Placement (AP) Florida had the greatest one-year increase in the number of public
school AP Exam Takers and the greatest increase in the number of exams administered in the nation in 2008.
“Number 1” in the number of African-American students taking and passing AP exams.
Six Florida public schools are recognized in the 2008 AP Report to the Nation as having the best AP Courses in the nation. (More than any other state.)
National Assessment of Educational Progress (NAEP) Florida is one of only four states in the nation to improve significantly
in both fourth and eighth-grade NAEP reading. Florida is one of only five states that showed a significant narrowing of
the White/African American achievement gap in fourth-grade NAEP reading, and one of only seven states to do the same in eighth-grade NAEP math.

4Division of Public Schools (PreK -12) Florida Department of Education
Source: K20 Education Data WarehouseFlorida Department of Education, May 2009
FCAT Readingby Achievement Level
Grades 3, 4, and 5
Achievement Level 3 and Above(On Grade Level and Above)
Achievement Level 1
5456
6065
68 69 70 70 72
30 2824
20 18 16 16 16 15
0%
10%
20%
30%
40%
50%
60%
70%
80%
2001 2002 2003 2004 2005 2006 2007 2008 2009

5Division of Public Schools (PreK -12) Florida Department of Education
Source: K20 Education Data WarehouseFlorida Department of Education, May 2009
FCAT ReadingAchievement Level 3 and
Above(On Grade Level and Above)
Grades 3, 4, and 5
White Hispanic African American
67 6873
7679 79 81 81 83
4346
50
5661 63 64 64
67
3336
40
4751
54 53 5357
0%
10%
20%
30%
40%
50%
60%
70%
80%
90%
2001 2002 2003 2004 2005 2006 2007 2008 2009

6Division of Public Schools (PreK -12) Florida Department of Education
Retained Level 1 Third Grade StudentsOutperform Promoted Level 1 Students
on FCAT Reading Grade 4
Source: K20 Education Data WarehouseFlorida Department of Education, May 2009
Level 1 Third Grade Students Promoted to Fourth Grade
Level 1 Third Grade Students Retained, then Promoted to Fourth Grade
65
20
13
1 0
32
27
36
5
00%
10%
20%
30%
40%
50%
60%
70%
Achievement Level 1 Achievement Level 2 Achievement Level 3 Achievement Level 4 Achievement Level 5

7Division of Public Schools (PreK -12) Florida Department of Education
Source: K20 Education Data WarehouseFlorida Department of Education, May 2009
FCAT Readingby Achievement Level
Grades 6, 7, and 8
Achievement Level 3 and Above(On Grade Level and Above)
Achievement Level 1
48 4951 51 51
57 5861 62
30 2927 27 26
20 1917 16
0%
10%
20%
30%
40%
50%
60%
70%
2001 2002 2003 2004 2005 2006 2007 2008 2009

8Division of Public Schools (PreK -12) Florida Department of Education
Source: K20 Education Data WarehouseFlorida Department of Education, May 2009
FCAT ReadingAchievement Level 3 and
Above(On Grade Level and Above)
Grades 6, 7, and 8
White Hispanic African American
62 6264 64 63
68 6971
74
3539
41 40 41
50 5154 56
2528 30 30 31
39 3943 44
0%
10%
20%
30%
40%
50%
60%
70%
80%
2001 2002 2003 2004 2005 2006 2007 2008 2009

9Division of Public Schools (PreK -12) Florida Department of Education
Source: K20 Education Data WarehouseFlorida Department of Education, May 2009
FCAT Readingby Achievement Level
Grades 9 and 10
Achievement Level 3 and Above(On Grade Level and Above)
Achievement Level 1
32 32 33 33 34
3738
42 42
39 39 38 3837
3332
3028
0%
10%
20%
30%
40%
50%
2001 2002 2003 2004 2005 2006 2007 2008 2009

10Division of Public Schools (PreK -12) Florida Department of Education
Source: K20 Education Data WarehouseFlorida Department of Education, May 2009
FCAT ReadingAchievement Level 3 and
Above(On Grade Level and Above)
Grades 9 and 10
White Hispanic African American
44 4345 44
4648
50
5553
21 2123 23
25
2931
34 34
13 13 14 14 1517 18
22 22
0%
10%
20%
30%
40%
50%
60%
2001 2002 2003 2004 2005 2006 2007 2008 2009

11Division of Public Schools (PreK -12) Florida Department of Education
Source: K20 Education Data WarehouseFlorida Department of Education, May 2009
FCAT Mathematicsby Achievement Level
Grades 3-10
Achievement Level 3 and Above(On Grade Level and Above)
Achievement Level 1
50 5154 56
59 61 6365 67
29 2724 22 20 18 17 15 14
0%
10%
20%
30%
40%
50%
60%
70%
80%
2001 2002 2003 2004 2005 2006 2007 2008 2009

12Division of Public Schools (PreK -12) Florida Department of Education
Source: K20 Education Data WarehouseFlorida Department of Education, May 2009
FCAT Mathematicsby Achievement Level
Students With Disabilities Grades 3-10
Achievement Level 3 and Above(On Grade Level and Above)
Achievement Level 1
20 2023
2528
3133
36 38
6260
5654
51
4643 41 39
0%
10%
20%
30%
40%
50%
60%
70%
2001 2002 2003 2004 2005 2006 2007 2008 2009

13Division of Public Schools (PreK -12) Florida Department of Education
Source: K20 Education Data WarehouseFlorida Department of Education, May 2009
FCAT Scienceby Achievement Level
Grade 5
Achievement Level 3 and Above(On Grade Level and Above)
Achievement Level 1
28 29
3335
42 4346
38 37
29 29
2523
21
0%
10%
20%
30%
40%
50%
2003 2004 2005 2006 2007 2008 2009

14Division of Public Schools (PreK -12) Florida Department of Education
Source: K20 Education Data WarehouseFlorida Department of Education, May 2009
FCAT Scienceby Achievement Level
Grade 8
Achievement Level 3 and Above(On Grade Level and Above)
Achievement Level 1
28 28
3332
3840 41
36 36 36 35
31
27 27
0%
10%
20%
30%
40%
50%
2003 2004 2005 2006 2007 2008 2009

15Division of Public Schools (PreK -12) Florida Department of Education
Source: K20 Education Data WarehouseFlorida Department of Education, May 2009
FCAT Scienceby Achievement Level
Grade 11
Achievement Level 3 and Above(On Grade Level and Above)
Achievement Level 1
33
3537 38 3736
3230 29
31
0%
10%
20%
30%
40%
50%
2005 2006 2007 2008 2009

16Division of Public Schools (PreK -12) Florida Department of Education
Source: K20 Education Data WarehouseFlorida Department of Education, May 2009
FCAT ScienceAchievement Level 3 and
Above(On Grade Level and Above)
Grade 11
White Hispanic African American
4547
49 50 49
22
26 2729 29
1114 15 16 16
0%
10%
20%
30%
40%
50%
60%
2005 2006 2007 2008 2009

17Division of Public Schools (PreK -12) Florida Department of Education
Source: K20 Education Data WarehouseFlorida Department of Education, May 2009
FCAT Scienceby Achievement Level
English Language LearnersGrade 5
Achievement Level 3 and Above(On Grade Level and Above)
Achievement Level 1
5 4 6 710
13 13
77 77
6964 62
54 55
0%
10%
20%
30%
40%
50%
60%
70%
80%
90%
2003 2004 2005 2006 2007 2008 2009

18Division of Public Schools (PreK -12) Florida Department of Education
Source: K20 Education Data WarehouseFlorida Department of Education, May 2009
FCAT Scienceby Achievement Level
English Language LearnersGrade 11
Achievement Level 3 and Above(On Grade Level and Above)
Achievement Level 1
4 4 4 5 4
78 77 75 7579
0%
10%
20%
30%
40%
50%
60%
70%
80%
90%
2005 2006 2007 2008 2009

NAEP Achievement LevelsFlorida and the United StatesSnapshot of Grade 4
NAEP Reading Grade 4 Florida and U.S.
3 5 4 58 7 8
21 23 2227
32 3034
5350
53
60 63 6570
6 7 6 6 6 7 7 7
27 28 28 28 30 30 30 32
60 59 58 5762 62 62
66
0
10
20
30
40
50
60
70
80
90
100
1992 1994 1998 2000 2002 2003 2005 2007
FL % at Advanced FL % at or above Proficient FL % at or above Basic
US % at Advanced US % at or above Proficient US % at or above Basic

Reading VisualsNAEP Reading Grade 4 by Race
NAEP Reading Grade 4 Percent At or Above Basic by Race**
64
69
26
31
45
37
5962
69
2628
38
32
64
60
64
69
3134
46
36
55
69
3436
69
74 74
39 39
53
43
74
69
51
59
75 74
40 39
55
43
79
69
47
74
66
75 75
45
41
61
44
76
72
49
73
67
81
77
52
46
64
49
86
76
51
75
70
20
30
40
50
60
70
80
90
White FL White US Black FL Black US Hispanic FL Hispanic US Asian/Pacif icIslander FL
Asian/Pacif icIslander US
AmericanIndian FL*
AmericanIndian US
Unclassif iedFL
Unclassif iedUS
1992 1994 1998 2000 2002 2003 2005 2007

21Division of Public Schools (PreK -12) Florida Department of Education
Florida Education: The Next GenerationDRAFT
March 13, 2008Version 1.0
The Next Generation The Next Generation Sunshine State Sunshine State
StandardsStandards
Why Next Why Next Generation?Generation?

22Division of Public Schools (PreK -12) Florida Department of Education
The Next GenerationWhy?
11 districts have 0-1% of their students participating in AP courses.
21 districts have 1-9% of their students participating in AP courses.
Dual enrollment is flat for last several years.
College credit earned in high school increases the likelihood of graduation.
Industry-driven career curriculum supports state’s economic development.

23Division of Public Schools (PreK -12) Florida Department of Education
Twenty States and D.C. Now Require a College- and Career-Ready Diploma
ID
AZ
UT
MT
WY
NM
CO
AL
SC
TN
KY
INOH
NC
SD
KS
NE
MN
WI
IA
IL
MO
AR
MS
OK
ND
OR
CA NV
WA
TX
PA
VA
NY
CT
WV MD
NJ
VTNH
MA
DE
RI
HI
GA
FL
ME
MI
LA
AK
LEGEND
Mandatory College-& Career-ReadyDiplomaDefault College- &Career-ReadyDiploma
DC
Source: Achieve, Inc.
24Division of Public Schools (PreK -12) Florida Department of Education
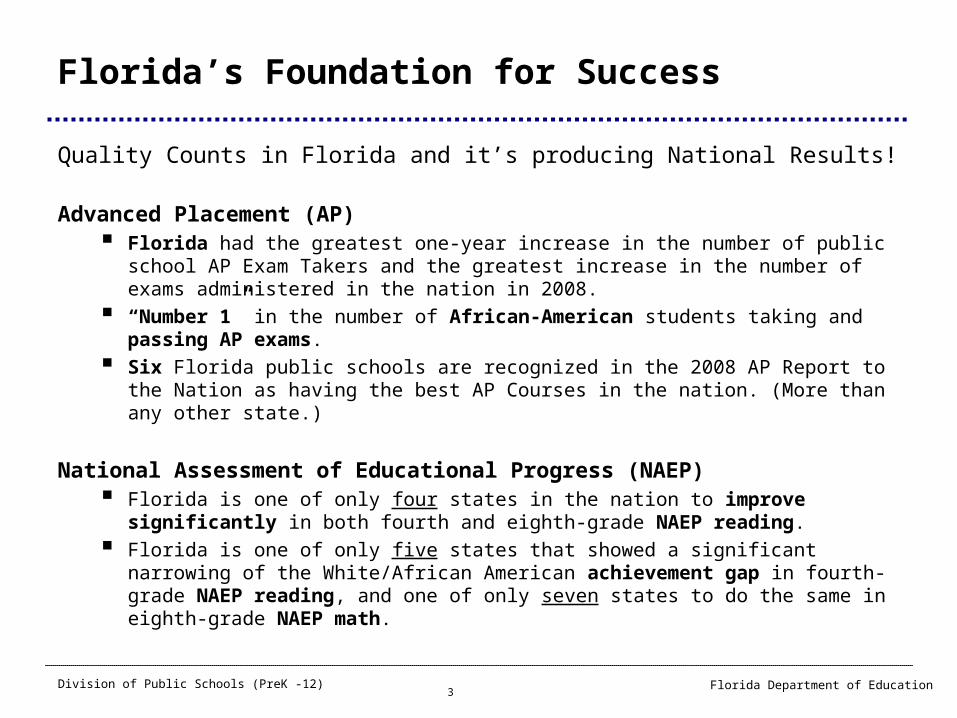
Nine States Have Now Built College- and Career-Ready Measures into Statewide Assessments
ID
AZ
UT
MT
WY
NM
CO
AL
SC
TN
KY
INOH
NC
SD
KS
NE
MN
WI
IA
IL
MO
AR
MS
OK
ND
OR
CA NV
WA
TX
PA
VA
NY
CT
WV MD
NJ
VTNH
MA
DE
RI
HI
GA
FL
ME
MI
LA
AK
DC
Source: Achieve, Inc.

25Division of Public Schools (PreK -12) Florida Department of Education
Too Many Students Graduate from High School Unprepared for College and Work
30% of first year students in postsecondary education are required to take remedial courses.
• In 2005-06, the total cost of postsecondary remediation was $129.8 million.
The State paid $70 million – more than half – of these costs.
Approximately 54% of recent high school graduates enrolled in community colleges did not meet the post-secondary readiness standard.
Faculty estimate 42% unprepared of first year students in credit-bearing courses.
Employers estimate 45% lack skills.
Quality Counts rates college readiness low.

26Division of Public Schools (PreK -12) Florida Department of Education
Student Achievement
ACT FL US Avg. State RankPercentage of Graduates Tested 52% 43% 26Reading Average, 2008 20.3 21.4 46
English Average, 2008 19.0 20.6 49
SAT FL US Avg. State Rank
Percentage of Graduates Tested 65% 48% 16 Critical Reading Average, 2008 496 502 39 Writing Average, 2008 481 494 43

27Division of Public Schools (PreK -12) Florida Department of Education
Writing
Findings
Thirty-five percent of high school graduates in college and 38% of high school graduates in the workforce feel their writing does not meet expectations for quality (Achieve, Inc., 2005).
Writing remediation costs American businesses as much as $3.1 billion annually (National Commission on Writing, 2004).

28Division of Public Schools (PreK -12) Florida Department of Education
2009 FCAT Writing
85 percent of grade 4 students scored 3.5 and above, representing an increase of eight percentage points compared to last year.
90 percent of grade 8 students scored 3.5 and above, representing a two percentage point increase compared to last year.
77 percent of grade 10 students scored 3.5 and above, representing a one percentage point decrease compared to last year.

29Division of Public Schools (PreK -12) Florida Department of Education
An Expectations Gap: We don’t expect high school graduates to be prepared
Academic standards were not aligned with postsecondary success.
Graduation requirements too low.
Assessments not meaningfully connected with students’ college or career aspirations.
Florida High Schools are held accountable for student performance on 10th grade FCAT, not postsecondary success.
RESULT: Students can earn a high school diploma without the skills necessary for success in college and high-skills, high-wage work.

30Division of Public Schools (PreK -12) Florida Department of Education
The Next GenerationRaising the Bar
[1] Lowest performing schools are defined as schools graded “F”.

31Division of Public Schools (PreK -12) Florida Department of Education
The Next Generation Initiatives: “Close Preparation and Expectation Gap” Next Generation Sunshine State Standards
Next Generation Assessments Balanced Specialized: EOC
Effective Teacher/Instruction
Next Generation Foundations: Bright Beginnings Reading/Math - VPK-3rd grade
Next Generation High School Accountability/Grading
Next Generation Elementary and Middle School Accountability/Grading
Graduation Requirements
Alignment, Alignment, Alignment College and/or high-skills, high-wage careers Zero remediation American Diploma Project (ADP)

32Division of Public Schools (PreK -12) Florida Department of Education
College Readiness
The Department has developed the Common Placement Testing and Remediation for High School Students webpage:
(http://www.fldoe.org/schools/CommonPlacementTesting.asp)
Assists with the implementation of the expanded postsecondary readiness testing and high school “readiness” opportunities.
Provides a link to the statute, technical assistance memos and high school remediation course descriptions.
Includes other useful information to help district high schools and partnering colleges develop policies and procedures in accordance with the statutory provisions.

33Division of Public Schools (PreK -12) Florida Department of Education
Writing for College Success - writing remediation
Writing for College Success - course number 1009370.
.5 high school credit (elective) will not count as English requirement.
Placement based on scores below CPT 83, SAT 440 and ACT 17.
Successful completion of this course (C or better and passing the Florida College Basic Skills Exit Test).

34Division of Public Schools (PreK -12) Florida Department of Education
Reading for College Success – reading remediation
Reading for College Success - course number 1608350.
.5 high school credit (elective) will not count as English requirement.
Placement based on scores below CPT 83, SAT 440 and ACT 18.
Successful completion of this course (C or better and passing the Florida College Basic Skills Exit Test).

35Division of Public Schools (PreK -12) Florida Department of Education
Back to the Future
Next Generation Sunshine State Standards for Language Arts
Commitment to increase rigor across grade levels.
Bloom’s Taxonomy at each grade level.
New strand of Informational Text - elements emphasized more explicitly.
New emphasis on the learning and writing techniques (a new standard).
Reading comprehension standard added to both the Literature strand and to Informational Text strands.

36Division of Public Schools (PreK -12) Florida Department of Education
Advance Core Reforms/Assurances
Continuous ImprovementInnovation
Transparency Scale

37Division of Public Schools (PreK -12) Florida Department of Education
The Next Generation Differentiated Accountability Support Requirements
PREVENT I – 270 Schools PREVENT II – 147 Schools
•SINIs 1, 2, and 3; and are•A, B, C, or Ungraded schools; and•Meet at least 80% of AYP criteria.•School directs intervention and District monitors progress.
•SINIs 1, 2, and 3; •That meet less than 80% of AYP criteria; and•All Title I D and F schools; and •All non-Title I D schools.•District and School directs intervention and State monitors progress.
CORRECT I – 377 Schools CORRECT II – 274 Schools
•SINIs 4 or 5+, schools planning for or implementing Restructuring; and are•A, B, C, or Ungraded schools; and•Meet at least 80% of AYP criteria. •District directs intervention and District monitors progress.
•SINIs 4 or 5+, schools planning for or implementing Restructuring;•That meet less than 80% of AYP criteria; and•All Title I D and F schools; and•All non-Title I Repeating F and F schools. •District directs intervention and State monitors progress (for Repeat F and F schools State and District directs intervention and State monitors progress).
INTERVENE – 12 Schools
•State and District directs intervention.

38Division of Public Schools (PreK -12) Florida Department of Education
Florida Education: The Next GenerationDRAFT
March 13, 2008Version 1.0
Questions?Questions?