Embed Size (px)
Citation preview

FLORIDA PUBLIC HEALTH RISK ASSESSMENT TOOL (FPHRAT)
User’s Guide
2014
Planning Program
Bureau of Preparedness and Response
Division of Emergency Preparedness and Community Support

Florida Public Health Risk Assessment Tool. User’s Guide
Page 2 of 55
Table of Contents
Getting to the Florida Public Health Risk Assessment Tool (FPHRAT) ............................................ 4
Logging In ................................................................................................................................................ 5
Using the FPHRAT ..................................................................................................................................... 8
Capability Assessment .......................................................................................................................... 9
Resources Worksheet ......................................................................................................................... 18
Risk Assessment .................................................................................................................................. 23
Charts and Outputs .............................................................................................................................. 25
Saving Charts ................................................................................................................................... 30
Open Charts ...................................................................................................................................... 30
Main Menu ................................................................................................................................................. 32
Informational Section ........................................................................................................................... 33
Hazard Information ........................................................................................................................... 33
Risk Assessment Explanation ........................................................................................................ 33
Tool Overview and Demonstration Presentation ......................................................................... 33
Social Vulnerability Publication ...................................................................................................... 33
Resilience Publication ..................................................................................................................... 33
Entered by Jurisdiction Section .......................................................................................................... 33
Select Jurisdiction ............................................................................................................................ 33
Capability Assessment Worksheet ................................................................................................ 33
Resources Worksheet ..................................................................................................................... 33
Finished Product Based on All Inputs. .............................................................................................. 34
Charts and Outputs .......................................................................................................................... 34
Risk Assessment .............................................................................................................................. 34
Aggregated Reports ......................................................................................................................... 34
Aggregated Reports and Data Interpretation ................................................................................... 35
Capability Assessment .................................................................................................................... 35
Capability Assessment Aggregated .............................................................................................. 36
Capability Assessment Worksheet ................................................................................................ 37

Florida Public Health Risk Assessment Tool. User’s Guide
Page 3 of 55
Capability Gap .................................................................................................................................. 38
Capability Gap Aggregated ............................................................................................................. 39
Capability Hazard Component ....................................................................................................... 40
Hazard Risk Index ............................................................................................................................ 42
Hazard Risk Index Aggregated ...................................................................................................... 43
Resource Gap (resource readiness gap) ..................................................................................... 44
Resource Gap Aggregated ............................................................................................................. 45
Resources Worksheet ..................................................................................................................... 46
Resources Worksheet Aggregated ................................................................................................ 47
Risk Assessment .............................................................................................................................. 48
Attachment 1. Risk Assessment Explanation .................................................................................. 49
Hazard ................................................................................................................................................ 49
Probability Score (0-5) ..................................................................................................................... 49
Social Vulnerability Index (1-4) ...................................................................................................... 49
Critical Infrastructure and Key Resources (1-2) .......................................................................... 50
Impact................................................................................................................................................. 50
Hazard Risk Index Score (0-24) ..................................................................................................... 52
Capabilities Index Score (1-4) ........................................................................................................ 52
Resources Index Score (1-4).......................................................................................................... 54
Community Resilience Score (1-4) ................................................................................................ 54
Residual Risk Index ......................................................................................................................... 55

Florida Public Health Risk Assessment Tool. User’s Guide
Page 4 of 55
Getting to the Florida Public Health Risk Assessment Tool (FPHRAT)
Getting to the FPHRAT is fairly simple. All you have to do is open up your internet browser and
enter the following website URL: https://flphrat.com
After that, you should see the following screen.

Florida Public Health Risk Assessment Tool. User’s Guide
Page 5 of 55
Logging In
Your login information is the email address and password created for your county, or the ones
that you request.
Each County Health Department has been assigned two accounts and corresponding login
information:
Data-input account (default)
Read-only account
The data-input account is only used to enter data for the Capabilities Assessment and the
Resources Assessment worksheets. The read-only account allows you to see the information
for your own county and for other jurisdictions, and to create queries.
Click on the login button in the top right hand corner to login to the website.
You should then see the following page.

Florida Public Health Risk Assessment Tool. User’s Guide
Page 6 of 55
Now just enter your login information.
Click on the “Log in” button to log into the website.
In order to protect the integrity of the database, you will be automatically logged out after 2
hours of inactivity.

Florida Public Health Risk Assessment Tool. User’s Guide
Page 7 of 55
You should now see the page below with a welcome statement at the top right hand corner
welcoming you to the tool.
Florida Public Health Risk Assessment Tool. User’s Guide
Page 8 of 55
Using the FPHRAT
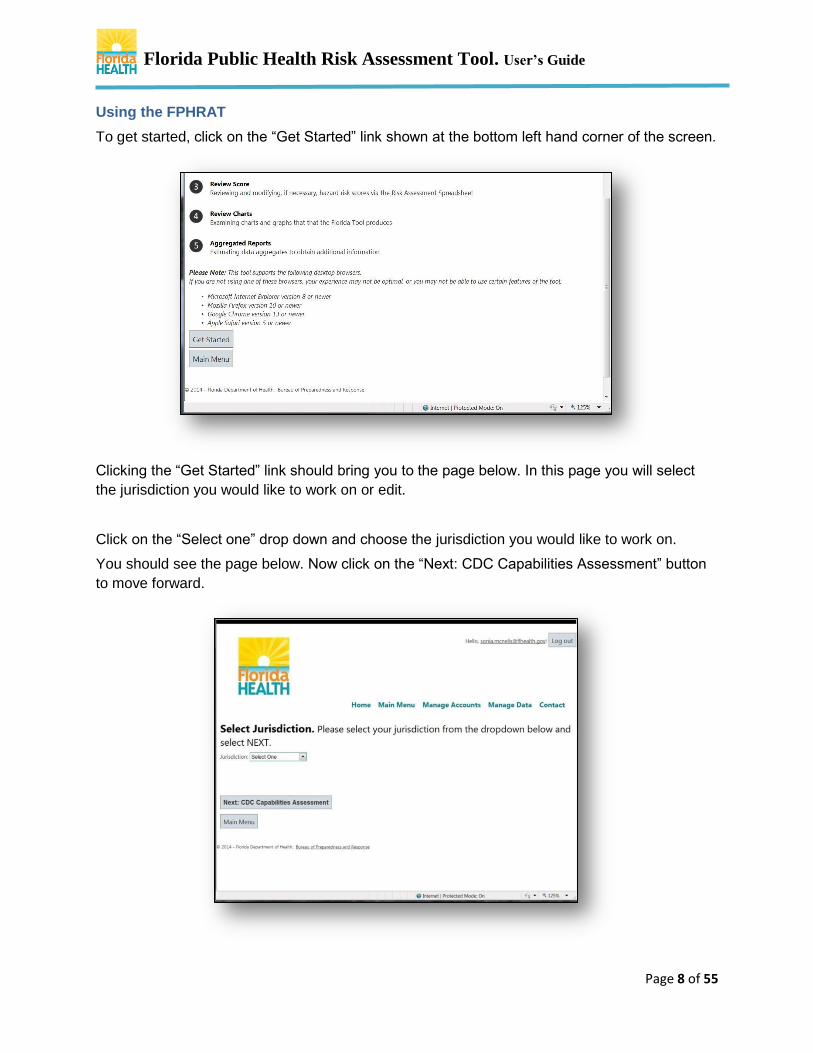
To get started, click on the “Get Started” link shown at the bottom left hand corner of the screen.
Clicking the “Get Started” link should bring you to the page below. In this page you will select
the jurisdiction you would like to work on or edit.
Click on the “Select one” drop down and choose the jurisdiction you would like to work on.
You should see the page below. Now click on the “Next: CDC Capabilities Assessment” button
to move forward.

Florida Public Health Risk Assessment Tool. User’s Guide
Page 9 of 55
Capability Assessment
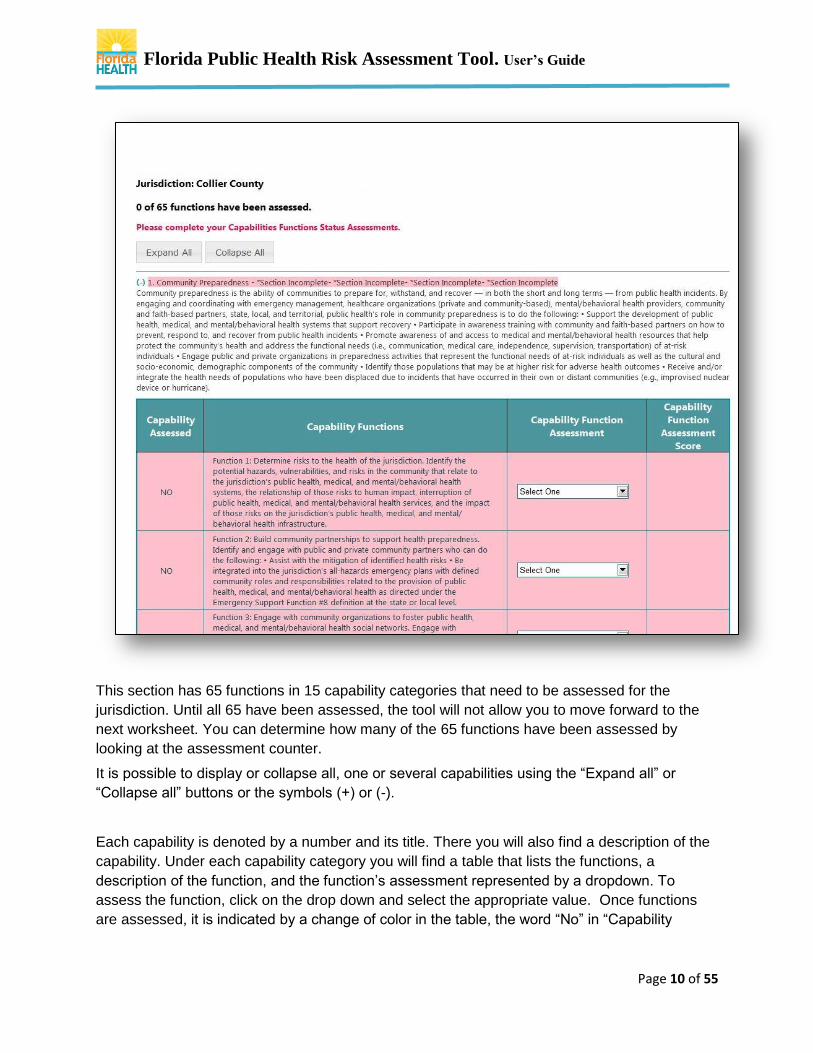
You should now see the page below. In this section you will assess and report on the
capabilities of the selected jurisdiction in regards to each of the specified functions.
Assessment Counter
Capability Category
Capability Function Table
Florida Public Health Risk Assessment Tool. User’s Guide
Page 10 of 55
This section has 65 functions in 15 capability categories that need to be assessed for the
jurisdiction. Until all 65 have been assessed, the tool will not allow you to move forward to the
next worksheet. You can determine how many of the 65 functions have been assessed by
looking at the assessment counter.
It is possible to display or collapse all, one or several capabilities using the “Expand all” or
“Collapse all” buttons or the symbols (+) or (-).
Each capability is denoted by a number and its title. There you will also find a description of the
capability. Under each capability category you will find a table that lists the functions, a
description of the function, and the function’s assessment represented by a dropdown. To
assess the function, click on the drop down and select the appropriate value. Once functions
are assessed, it is indicated by a change of color in the table, the word “No” in “Capability

Florida Public Health Risk Assessment Tool. User’s Guide
Page 11 of 55
Assessed” column disappears as well as the message near the capability title-“*Section
Incomplete”. The capabilities can be assessed in any order.
Note: The Capability Function Assessment may be preset to “No Ability/Capacity” and it
must be updated by each jurisdiction.
As you can see below, selecting a value has changed the function’s highlighted color from a
reddish hue to blue indicating it has been assessed. You will also find that the capability function
assessment score has been updated to a numeric value. This will be used by the tool later on in
the summary data.
Continue assessing all the functions for this capability category.

Florida Public Health Risk Assessment Tool. User’s Guide
Page 12 of 55
After assessing the capability functions for the first capability category, your screen should look
similar to the page below.
You should see underneath the first capability category the list of the other 14 capability
categories as shown in the picture above. They are currently collapsed, hiding their content. In
order to expand the first capability category for assessment, click on the branch symbol which
will change the symbol from (+) to (-).
Branch
Collapsed Capability Categories

Florida Public Health Risk Assessment Tool. User’s Guide
Page 13 of 55
You should now see the second capability expanded, as the first is completed allowing you to
continue assessing each of the 65 functions.
Continue through the page, expanding each capability category, and assess all functions listed.
Feel free to collapse any category that you are not currently working on.

Florida Public Health Risk Assessment Tool. User’s Guide
Page 14 of 55
As you come to completion with your assessments, you will get to the bottom of the screen
where you will find two buttons, “Save and Continue to Edit” and “Next: Resources Worksheet”.
As you can see, the “Next: Resources Worksheet” button is disabled. This is because all
functions have not yet been assessed. Once the last function is assessed, the “Next: Resources
Worksheet” will be enabled.

Florida Public Health Risk Assessment Tool. User’s Guide
Page 15 of 55
As you can see below, after the last assessment, the “Next: Resources Worksheet” button is
now enabled.
At any point and time during the assessment you can click the “Save and Continue to Edit”
button to save your work so far. Until this button is selected, your work has not been saved.
Please click on the “Save and Continue Edit” button.

Florida Public Health Risk Assessment Tool. User’s Guide
Page 16 of 55
After clicking on the button, your work is saved, and the page will refresh bringing you back to
the top of the page. At this point, you can scroll down and assess any functions or modify any
assessments before moving on.
The “Risk Assessment Explanation” is a document describing all the components of the Risk
Assessment including the Capability Hazard Component. The link to the document is on the
Capability Assessment page. See the picture above.

Florida Public Health Risk Assessment Tool. User’s Guide
Page 17 of 55
At the bottom of the Capability Assessment page, there is a link to the Capability Hazard
Component, which is an application that displays the capabilities’ functions associated with each
specific hazard.
Now that all functions have been assessed, let’s move on to the next step.
Click on the “Next: Resources Worksheet” button.

Florida Public Health Risk Assessment Tool. User’s Guide
Page 18 of 55
Resources Worksheet
This worksheet is used to report on a jurisdictional level of access to required resources for
each of the 36 hazards reported on by this tool.
Just as in the Capability Function Assessment, until all 36 hazards have been assessed, the
tool will not allow you to continue. You will also find a hazard-assessment counter that lets you
know how close you are to completion. On this page, you will find a scrollable window that
contains a table listing 36 hazards, their definitions, the Resource Assessment and Resource
Hazard Assessment Counter

Florida Public Health Risk Assessment Tool. User’s Guide
Page 19 of 55
Assessment Scores. Click on the first “Select One” dropdown for the first hazard and choose the
appropriate assessment.
As you can see, by assessing the hazard, the record changed from a reddish hue to white to
indicate the hazard’s resource has been assessed and the Hazard Assessment Counter has
increased by 1 and the word “No” in the Resource Assessed column will disappear to indicate
its completion.
Now do the same for all 36 hazards, making sure to scroll down so you don’t miss any of the
listed hazards.
Note: The Needed Resources Access may be preset to “Partially in Place: 0-25%” and it
must be updated by each jurisdiction.

Florida Public Health Risk Assessment Tool. User’s Guide
Page 20 of 55
As with the Capability Assessment, you have two buttons on the page: “Save and Continue to
Edit” and “Next: Risk Assessment”. As you can see, the “Next: Risk Assessment” button is
disabled because all hazards have not yet been assessed. Once the last hazard is assessed,
the “Next: Resources Worksheet” will be enabled.

Florida Public Health Risk Assessment Tool. User’s Guide
Page 21 of 55
As you can see below, after the last assessment, the “Next: Risk Assessment” button is now
enabled.
At any point and time during the assessment, you can click the “Save and Continue to Edit”
button to save your work so far. Until this button is selected, your work has not been saved.
Please click on the “Save and Continue Edit” button.

Florida Public Health Risk Assessment Tool. User’s Guide
Page 22 of 55
After clicking on the button, your work is saved and the page will refresh, bringing you back to
the top of the page. At this point, you can scroll down and assess any hazards or modify any
resource assessments you need to make before moving on.
Now that all functions have been assessed, let’s move on to the next step.
Click on the “Next: Risk Assessment” button.
Florida Public Health Risk Assessment Tool. User’s Guide
Page 23 of 55
Risk Assessment
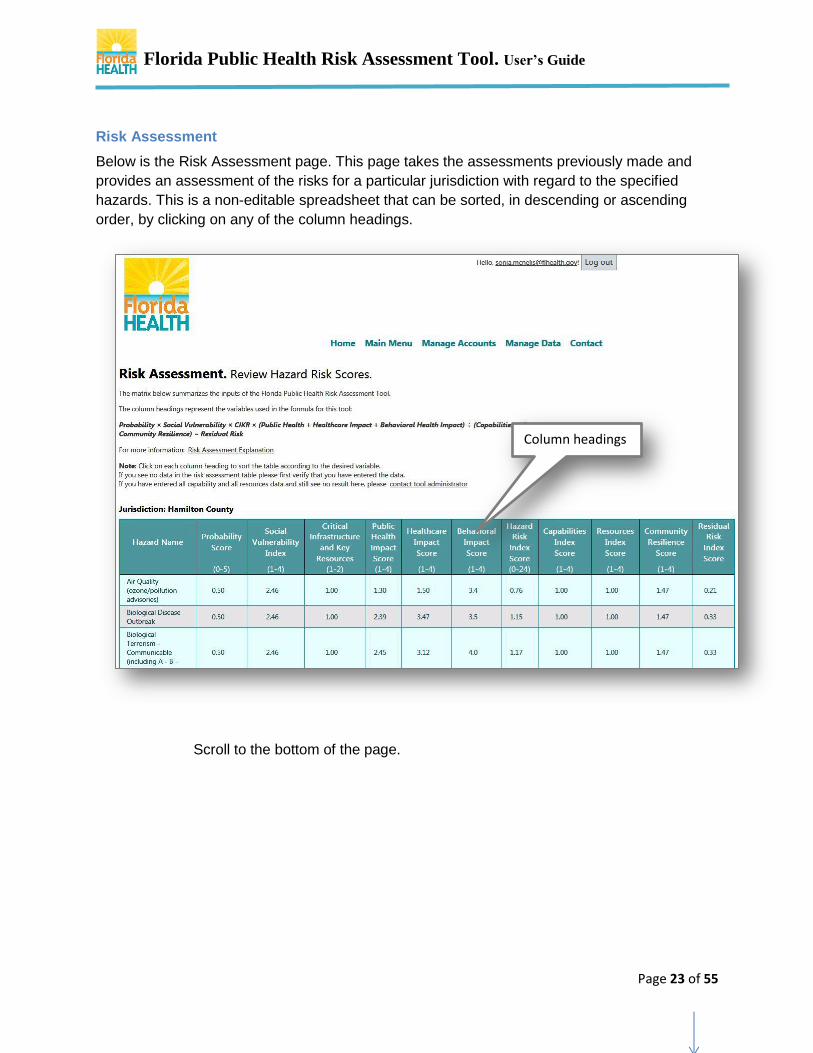
Below is the Risk Assessment page. This page takes the assessments previously made and
provides an assessment of the risks for a particular jurisdiction with regard to the specified
hazards. This is a non-editable spreadsheet that can be sorted, in descending or ascending
order, by clicking on any of the column headings.
Scroll to the bottom of the page.
Column headings
Florida Public Health Risk Assessment Tool. User’s Guide
Page 24 of 55
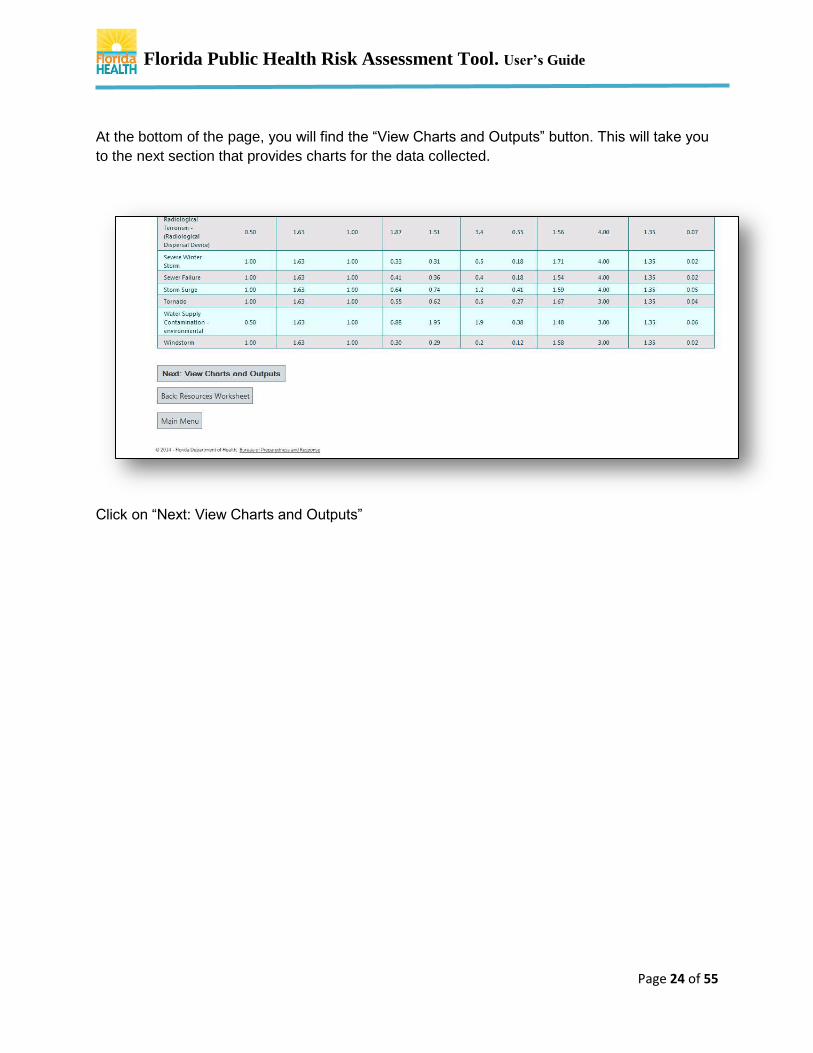
At the bottom of the page, you will find the “View Charts and Outputs” button. This will take you
to the next section that provides charts for the data collected.
Click on “Next: View Charts and Outputs”
Florida Public Health Risk Assessment Tool. User’s Guide
Page 25 of 55
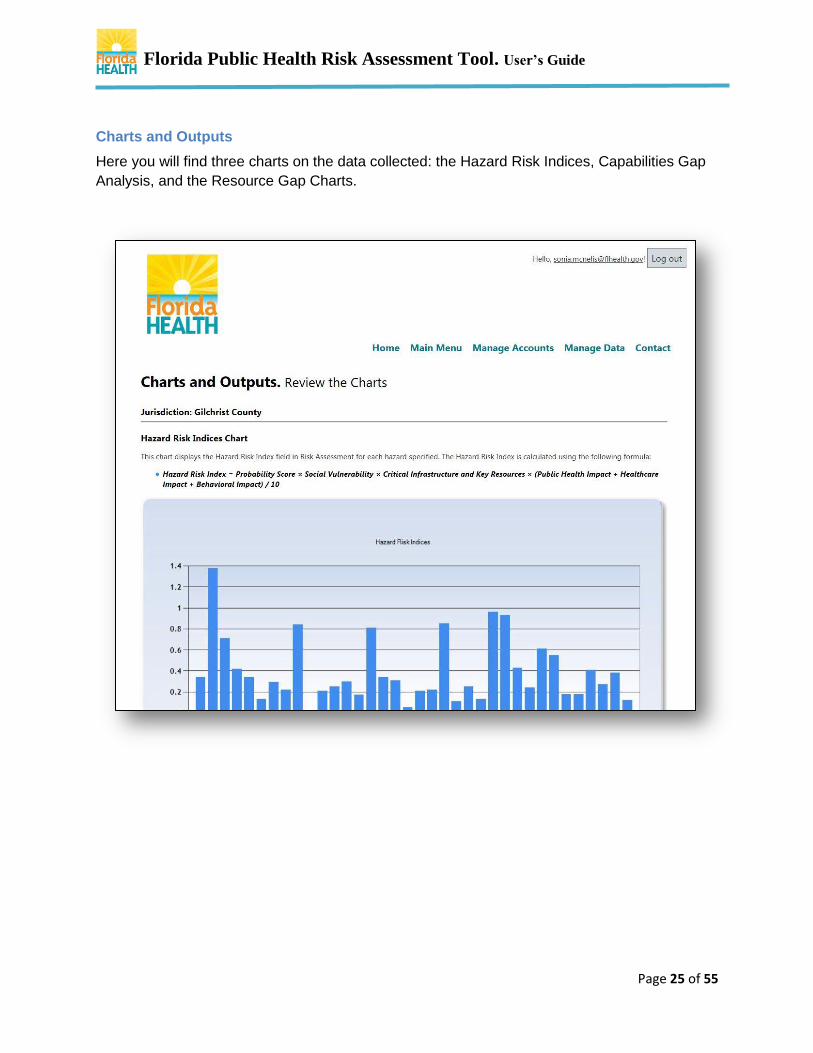
Charts and Outputs
Here you will find three charts on the data collected: the Hazard Risk Indices, Capabilities Gap
Analysis, and the Resource Gap Charts.

Florida Public Health Risk Assessment Tool. User’s Guide
Page 26 of 55
Hazard Risk Indices
The “Download Chart” button, allows you to download the chart as a JPG file.
Florida Public Health Risk Assessment Tool. User’s Guide
Page 27 of 55
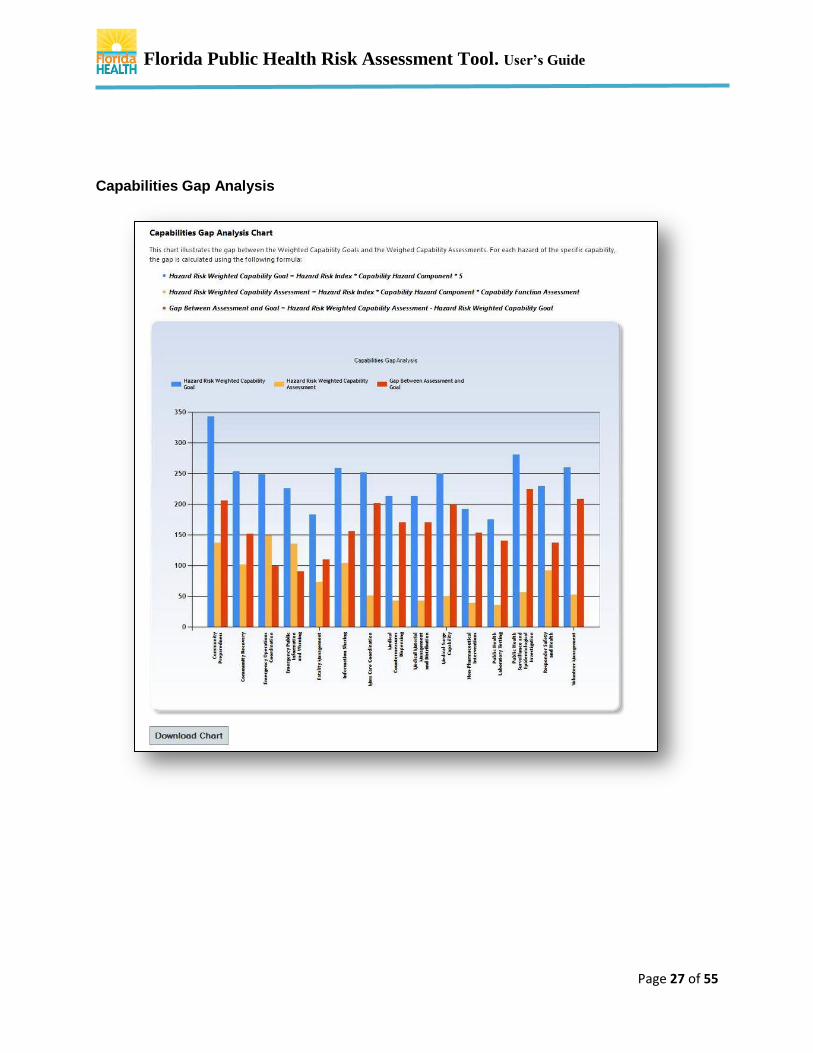
Capabilities Gap Analysis

Florida Public Health Risk Assessment Tool. User’s Guide
Page 28 of 55
Resource Gap

Florida Public Health Risk Assessment Tool. User’s Guide
Page 29 of 55
Scroll to the bottom of the screen. At the bottom of the page, you will find a “Download All as
PDF” button. This button will allow you to either open or save all three charts as a PDF.
Click on “Download All as PDF”.
After clicking on “Download All as PDF” a dialog box will appear. The appearance of the dialog
box may vary when different internet browsers are used. The example below displays a dialog
box from Mozilla Firefox.

Florida Public Health Risk Assessment Tool. User’s Guide
Page 30 of 55
Saving Charts
To save the PDF, click on the “Save” button, and then indicate where you would like the file
saved and click on the “Save” button.
Open Charts
To open the charts as a PDF file, click on “Download All as PDF”. The following dialog box
should open. Now select the “Open” button (the pictures below show the dialog box as it
appears in the Mozilla Firefox and Internet Explorer browsers).

Florida Public Health Risk Assessment Tool. User’s Guide
Page 31 of 55
The PDF should then open in a separate window to be viewed.
Florida Public Health Risk Assessment Tool. User’s Guide
Page 32 of 55
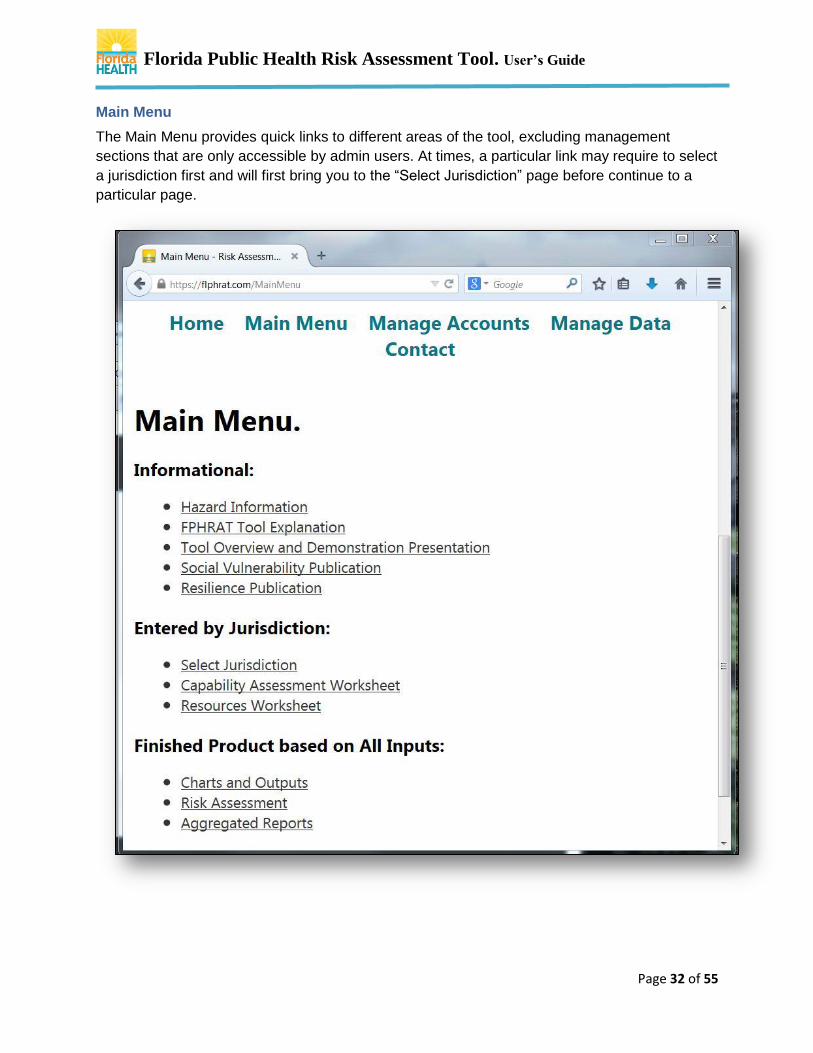
Main Menu
The Main Menu provides quick links to different areas of the tool, excluding management
sections that are only accessible by admin users. At times, a particular link may require to select
a jurisdiction first and will first bring you to the “Select Jurisdiction” page before continue to a
particular page.

Florida Public Health Risk Assessment Tool. User’s Guide
Page 33 of 55
Informational Section
This section contains informational materials for the user.
Hazard Information
The Hazard Information is a downloadable spreadsheet that contains information regarding 36
hazards with public health significance in Florida. The information in the table includes hazard
definition, source of the data utilized in the tool, corresponding capabilities engaged preparing or
responding to any given hazard, public health actions required to respond to any given hazard,
and links to agencies or data sets.
Risk Assessment Explanation
This document describes the concepts and equations utilized to estimate the risk assessment
and its measures for each county and hazard.
Tool Overview and Demonstration Presentation
This presentation was created by Dr. Chris Emrich from the Hazards and Vulnerability Research
Institute (HVRI) of the University of South Carolina. It describes the tool and explains how the
scores were calculated.
Social Vulnerability Publication
The Social Vulnerability to Environmental Hazards is an article published by members of the
HVRI. It describes the factors affecting a jurisdiction’s social vulnerability and the methodology
used to estimate it, and provides evidence and scientific support for the tool.
Resilience Publication
Disaster Resilience Indicators for Benchmarking Baseline Conditions is an article published by members of the HVRI, and it describes the role that community resilience plays on mitigating consequences of disasters, and the methodology to determine a community’s resilience.
Entered by Jurisdiction Section
Select Jurisdiction
This application of the tool allows users to select the jurisdiction to enter or edit information.
Capability Assessment Worksheet
The Main Menu allows selecting the Capability Assessment Worksheet in addition to the Get
Started button at the home page.
Resources Worksheet
The Main Menu allows selecting the Resources Worksheet in addition to the Get Started button
at the home page.
Florida Public Health Risk Assessment Tool. User’s Guide
Page 34 of 55
Finished Product Based on All Inputs.
Charts and Outputs
This feature is described previously in this document. Users can access it from the Main Menu
or from the button at the bottom of the Risk Assessment page.
Risk Assessment
From the Main Menu, users can access the Risk Assessment table created after completing the
Capability Assessment and Resources worksheets.
Aggregated Reports
The Aggregated Reports application allows users to see and export customized reports at the
county, multicounty, regional, and state level.

Florida Public Health Risk Assessment Tool. User’s Guide
Page 35 of 55
Aggregated Reports and Data Interpretation
The Aggregated Reports application allows users to customize queries at the county,
multicounty, regional, and state levels. The application is found in the section of the Main Menu
called Finished Product based on All Inputs. Aggregated reports may take longer to download
because the information is calculated on demand.
The data displayed in the pictures and reports is for educational purposes only. The
Aggregated Reports are:
Capability Assessment
Description: The capability assessment value is calculated from the scores assigned to each
capability function. Values are not aggregated.
Aggregation Levels: County.
Data: nonaggregated data for a single, multiple, or all counties.
Display / Downloads: Data is downloaded as a CSV file.
Interpretation: Indicates, in descending order, how well each capability can be performed
overall.

Florida Public Health Risk Assessment Tool. User’s Guide
Page 36 of 55
Capability Assessment Aggregated
Description: Display of the aggregated values of the capability assessment for selected counties as an average, where average or mean average is the sum of data divided by the number of items in the data. It also displays the maximum and minimum values for a specific selection.
Aggregation Levels: County, region, and state.
Data: County (Selecting only one county will not generate a chart and the values will be similar
to the nonaggregated Capability Assessment), region (aggregated data for one or more regions)
and state (aggregated data for all counties).
Display / Downloads: This application displays a chart and a table. The chart is downloadable
as a JPG file, and the table as a CSV file.
Interpretation: Average measure of how well each capability is performed by a selected group
of counties. The higher numbers reflect higher performance.

Florida Public Health Risk Assessment Tool. User’s Guide
Page 37 of 55
Capability Assessment Worksheet
Description: Display of the scores assigned by jurisdictions to the capability functions. This
report does not aggregate data. The picture below depicts scores preset to the minimum value:
1. No ability / capacity. Jurisdictions will assess each capability function and assign a true score.
Aggregation Levels: County.
Data: One, multiple, or all counties.
Display / Downloads: CSV file.
Interpretation: Scores from the assessment of each capability function. Data is displayed on a
table. Jurisdictions will be able to use the information for further analysis and comparison, for
example, creating a multicounty or state average of the scores. The data in the Capability
Assessment worksheet is not the same as the data produced by the Capability Assessment
report.
Florida Public Health Risk Assessment Tool. User’s Guide
Page 38 of 55
Capability Gap
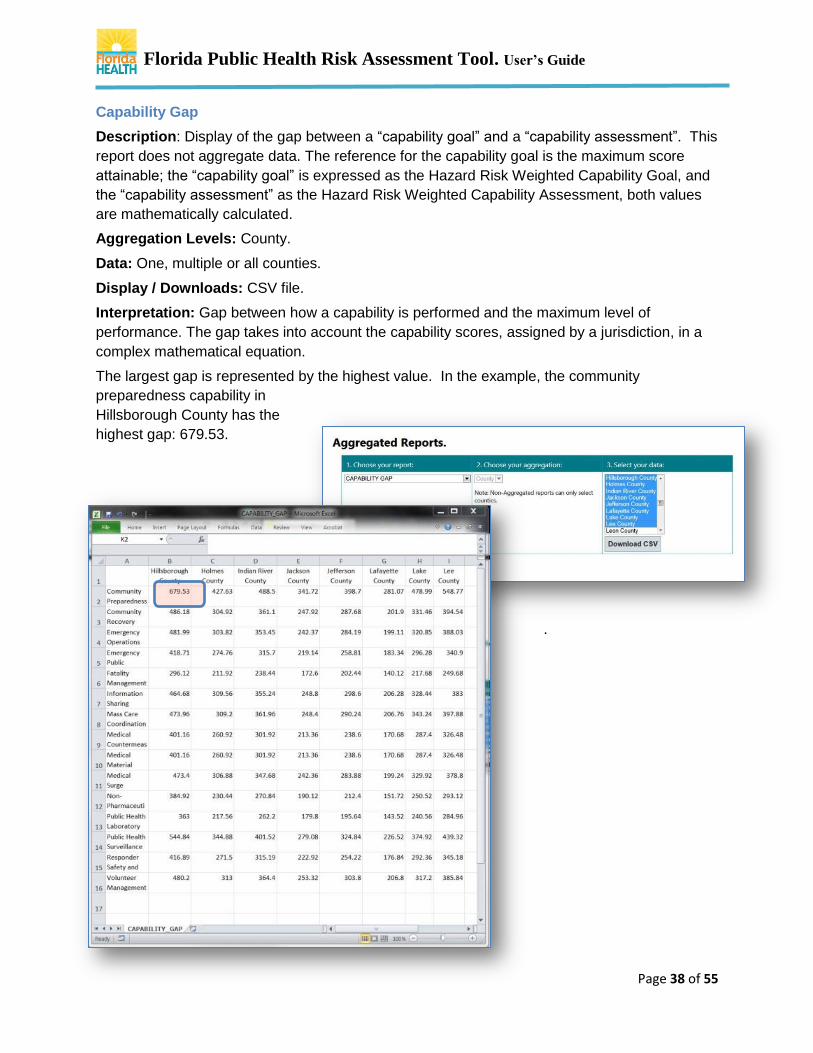
Description: Display of the gap between a “capability goal” and a “capability assessment”. This
report does not aggregate data. The reference for the capability goal is the maximum score
attainable; the “capability goal” is expressed as the Hazard Risk Weighted Capability Goal, and
the “capability assessment” as the Hazard Risk Weighted Capability Assessment, both values
are mathematically calculated.
Aggregation Levels: County.
Data: One, multiple or all counties.
Display / Downloads: CSV file.
Interpretation: Gap between how a capability is performed and the maximum level of
performance. The gap takes into account the capability scores, assigned by a jurisdiction, in a
complex mathematical equation.
The largest gap is represented by the highest value. In the example, the community
preparedness capability in
Hillsborough County has the
highest gap: 679.53.
.

Florida Public Health Risk Assessment Tool. User’s Guide
Page 39 of 55
Capability Gap Aggregated
Description: This report aggregates the capability gap data for selected jurisdictions and
calculates a unique value for all, expressed as average, where average or mean average is the
sum of data divided by the number of items in the data. It also displays the maximum and
minimum values for a specific selection.
Aggregation Levels: County, region, and state
Data: Aggregates data for multiple counties, one or more regions, and state.
Display / Downloads: Generates a chart downloadable as a JPG file, and a report exportable
as a CSV file.
Interpretation: Average of the gap values between the current capability’s performance and the
maximum level of performance attainable. The largest gap is represented by the highest value.
In the example below, the community preparedness capability has the highest gap average at
the state level: 467.84.
Florida Public Health Risk Assessment Tool. User’s Guide
Page 40 of 55
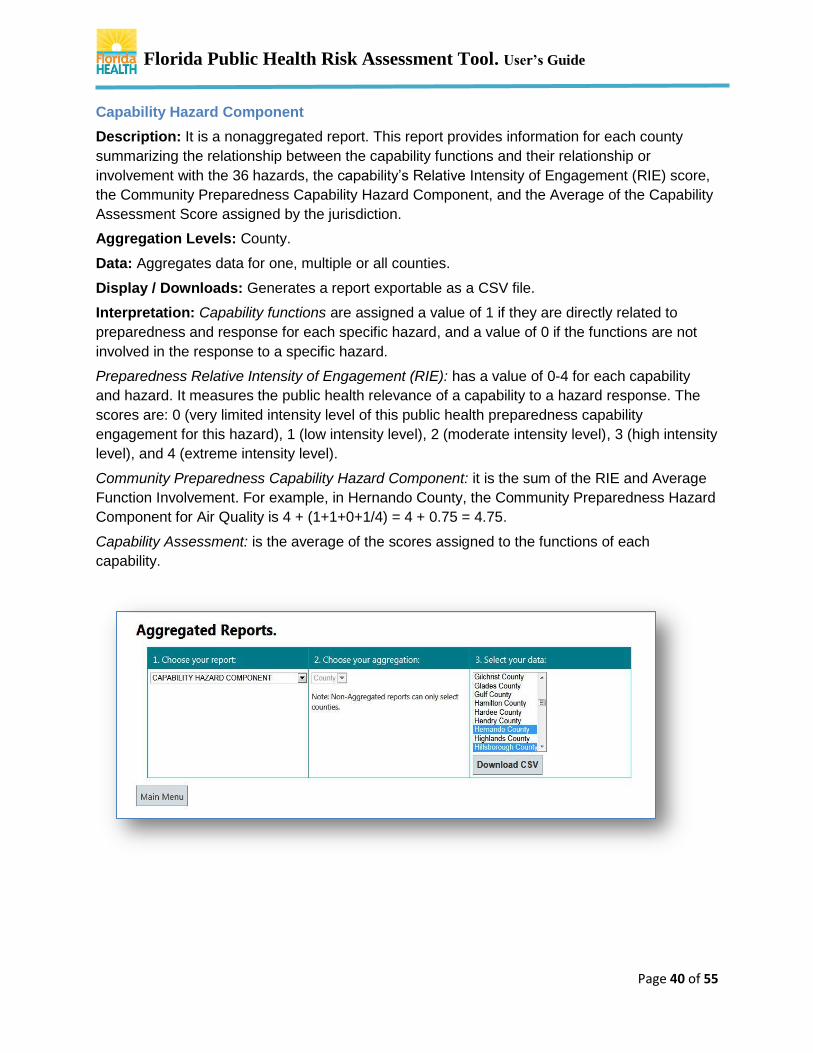
Capability Hazard Component
Description: It is a nonaggregated report. This report provides information for each county
summarizing the relationship between the capability functions and their relationship or
involvement with the 36 hazards, the capability’s Relative Intensity of Engagement (RIE) score,
the Community Preparedness Capability Hazard Component, and the Average of the Capability
Assessment Score assigned by the jurisdiction.
Aggregation Levels: County.
Data: Aggregates data for one, multiple or all counties.
Display / Downloads: Generates a report exportable as a CSV file.
Interpretation: Capability functions are assigned a value of 1 if they are directly related to
preparedness and response for each specific hazard, and a value of 0 if the functions are not
involved in the response to a specific hazard.
Preparedness Relative Intensity of Engagement (RIE): has a value of 0-4 for each capability
and hazard. It measures the public health relevance of a capability to a hazard response. The
scores are: 0 (very limited intensity level of this public health preparedness capability
engagement for this hazard), 1 (low intensity level), 2 (moderate intensity level), 3 (high intensity
level), and 4 (extreme intensity level).
Community Preparedness Capability Hazard Component: it is the sum of the RIE and Average
Function Involvement. For example, in Hernando County, the Community Preparedness Hazard
Component for Air Quality is 4 + (1+1+0+1/4) = 4 + 0.75 = 4.75.
Capability Assessment: is the average of the scores assigned to the functions of each
capability.

Florida Public Health Risk Assessment Tool. User’s Guide
Page 41 of 55

Florida Public Health Risk Assessment Tool. User’s Guide
Page 42 of 55
Hazard Risk Index
Description: It is a value (score) of the overall risk for each county hazard. This score is a
component of the Risk Assessment matrix. It is different from the Residual Risk Index which
includes mitigation factors. This score is calculated as follows:
Health Impact)
Aggregation Levels: County
Data: Displays non-aggregated data for one, multiple, or all counties.
Display / Downloads: Generates a CSV file.
Interpretation: Hazard Risk is the likelihood of a given hazard of a given level causing a
particular level of loss or damage. The hazard risk index is a complex value that takes into
account the hazard probability for a given county, the social vulnerability of the county, and the
combined scores from the public health impact, healthcare impact, and behavioral health impact
at a state level. The Critical Infrastructure and Key Resources Index (CIKR) has not been
calculated and its value is one for all counties; it will
be developed in the future. The index’s scores range
from 0-4, where 4 represents the highest risk.
Probability × Social Vulnerability ×
CIKR × (Public Health + Healthcare
Impact + Behavioral Health Impact)
Florida Public Health Risk Assessment Tool. User’s Guide
Page 43 of 55
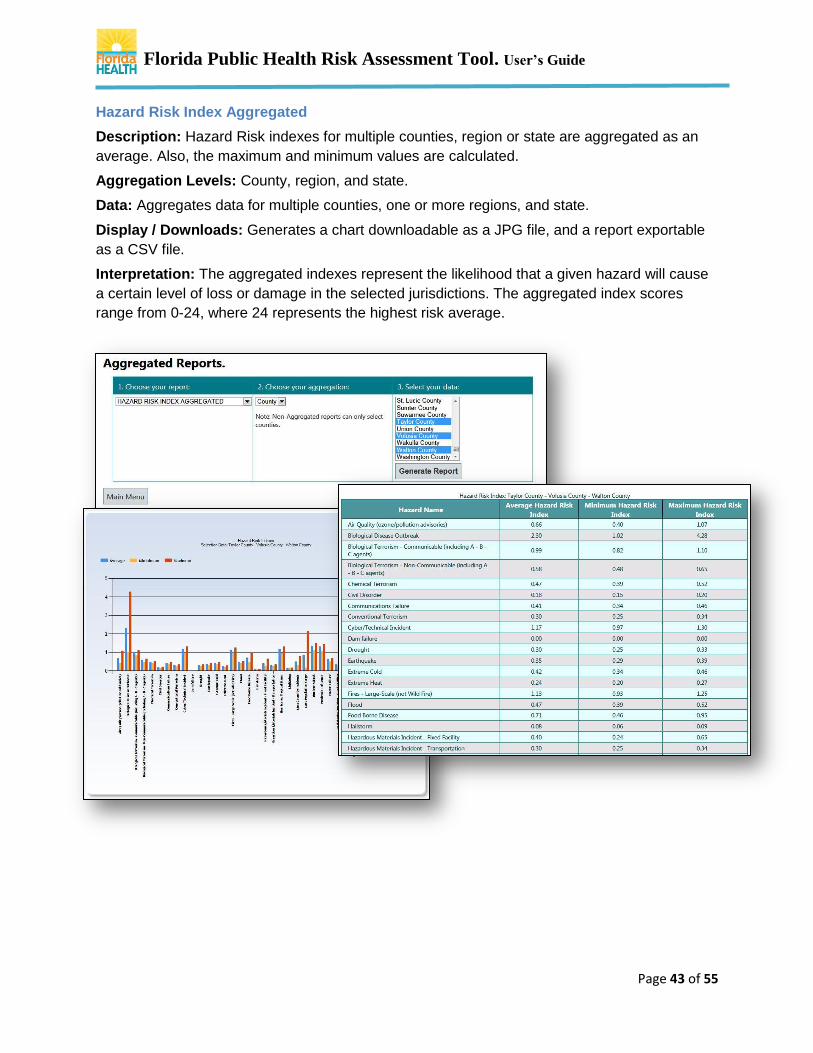
Hazard Risk Index Aggregated
Description: Hazard Risk indexes for multiple counties, region or state are aggregated as an
average. Also, the maximum and minimum values are calculated.
Aggregation Levels: County, region, and state.
Data: Aggregates data for multiple counties, one or more regions, and state.
Display / Downloads: Generates a chart downloadable as a JPG file, and a report exportable
as a CSV file.
Interpretation: The aggregated indexes represent the likelihood that a given hazard will cause
a certain level of loss or damage in the selected jurisdictions. The aggregated index scores
range from 0-24, where 24 represents the highest risk average.

Florida Public Health Risk Assessment Tool. User’s Guide
Page 44 of 55
Resource Gap (resource readiness gap)
Description: The values in this report represent the relationship between each hazard’s risk
index and the resources needed to address the hazard (represented by the resource
assessment score).
Aggregation Levels: County.
Data: Displays nonaggregated data for one, multiple, or all counties.
Display / Downloads: Generates a CSV file.
Interpretation: In addition to the resources available, the resource gap represents the
resources needed to counteract a hazard’s risk. In order to calculate the resource gap, it is
necessary to look at the resource assessment in relation to the hazard’s risk (this relationship is
called Resource score in proportion of hazard risk index). Subsequently, the resource gap is
calculated subtracting the hazard risk index minus the “Resource Score in Proportion of Hazard
Risk Index”.

Florida Public Health Risk Assessment Tool. User’s Guide
Page 45 of 55
Resource Gap Aggregated
Description: Average of the resource score in proportion of the hazard risk index for the
selected jurisdictions. This report also provides the maximum and minimum values.
Aggregation Levels: County, region, and state.
Data: Aggregates data for multiple counties, one or more regions, and state.
Display / Downloads: Generates a chart downloadable as a JPG file, and a report exportable
as a CSV file.
Interpretation: Average value of the resource assessment in relation to the hazard’s risk (this
relationship is called Resource Score in Proportion of Hazard Risk Index).
Florida Public Health Risk Assessment Tool. User’s Guide
Page 46 of 55
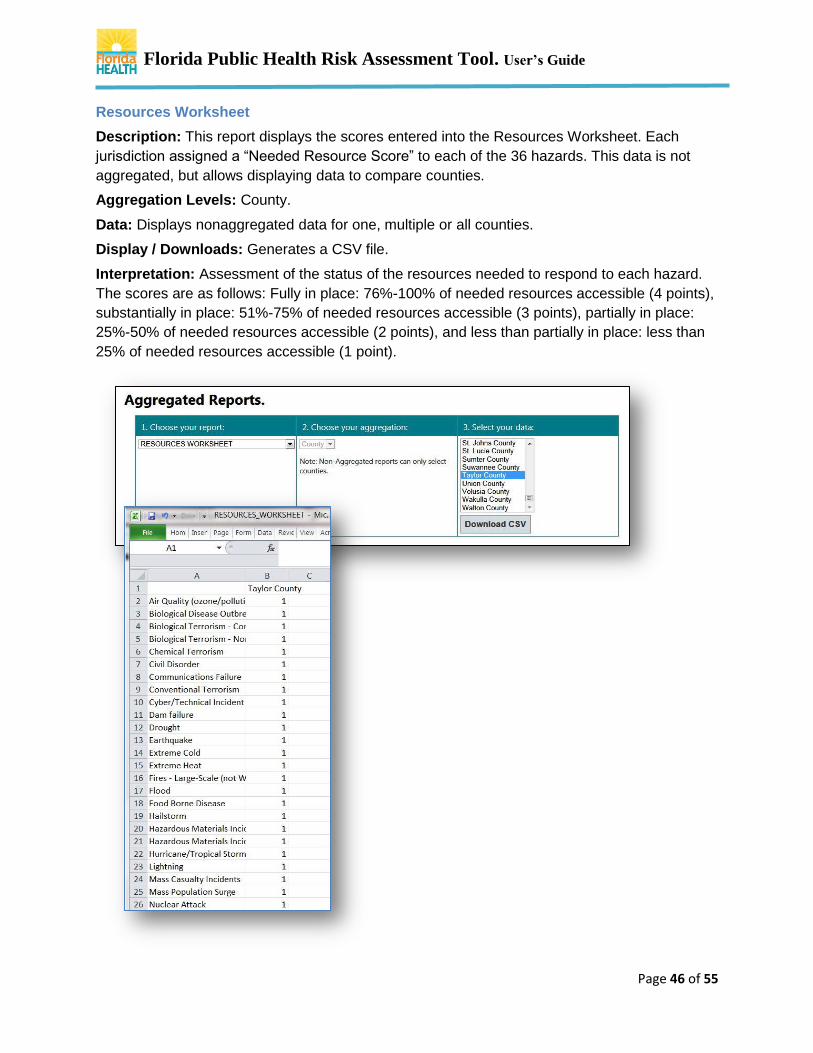
Resources Worksheet
Description: This report displays the scores entered into the Resources Worksheet. Each
jurisdiction assigned a “Needed Resource Score” to each of the 36 hazards. This data is not
aggregated, but allows displaying data to compare counties.
Aggregation Levels: County.
Data: Displays nonaggregated data for one, multiple or all counties.
Display / Downloads: Generates a CSV file.
Interpretation: Assessment of the status of the resources needed to respond to each hazard.
The scores are as follows: Fully in place: 76%-100% of needed resources accessible (4 points),
substantially in place: 51%-75% of needed resources accessible (3 points), partially in place:
25%-50% of needed resources accessible (2 points), and less than partially in place: less than
25% of needed resources accessible (1 point).

Florida Public Health Risk Assessment Tool. User’s Guide
Page 47 of 55
Resources Worksheet Aggregated
Description: Average of the Resources Worksheet scores entered in the worksheet for a
selected group of jurisdictions.
Aggregation Levels: County, region, and state
Data: Aggregates data for multiple counties, one or more regions, and state.
Display / Downloads: Generates a chart downloadable as a JPG file, and a report exportable
as a CSV file.
Interpretation: Average value of the Needed Resource Scores entered in the Resources
Worksheet by jurisdictions. In this report, the values are interpreted as the Average Resource
Status Assessment.

Florida Public Health Risk Assessment Tool. User’s Guide
Page 48 of 55
Risk Assessment
Description: Displays the Risk Assessment Matrix.
Aggregation Levels: County.
Data: County.
Display / Downloads: Matrix is downloadable as a CSV file.
Interpretation: Each component of the Risk Assessment Matrix is described in Attachment 1.

Florida Public Health Risk Assessment Tool. User’s Guide
Page 49 of 55
Attachment 1. Risk Assessment Explanation
The risk assessment sheet provides a summary of the many pieces of the Public Health Risk
Assessment Tool. Each of these elements is described here:
Hazard
Name of the hazard for which planning must account for.
Probability Score (0-5)
Hazard probability is a quantitative description of the likely occurrence of a particular event represented by the percent chance something will occur. This is also known as likelihood of occurrence. It is important for all users to understand not all events lend themselves to frequencies (e.g. terrorism) so subject matter experts used proxies. For example, subject matter experts identified of other types of funding that are provided for different threat assessments was used by to determine the likelihood of occurrence. Frequency scores can be modified by the jurisdiction, with documentation to support these changes. Frequencies were converted to the Likert scale (0-5) below:
5- Almost Certain: Is expected to occur in most circumstances; and /or high level of recorded incidents and/or strong anecdotal evidence and/or strong likelihood the event will recur; and or great opportunity, reason, or means to occur; has a 90% chance or greater of occurring once in a given year; may occur one or more times annually.
4- Likely: Will probably occur in most circumstances; and/or regular recorded incidents and strong anecdotal evidence; and/or considerable opportunity, reason, or means to occur; has a 50% - 89% chance of occurring once in a given year; may occur once every 2 years.
3- Possible: Might occur at some time; and/or few, infrequent, random recorded incidents or little anecdotal evidence; and/or very few incidents in associated or comparable organizations, facilities, or communities; and/or some opportunity, reason, or means to occur; has a 14% - 49% chance of occurring in a given year; may occur once every 3-7 years.
2- Unlikely: Is not expected to occur; and/or very few recorded incidents or anecdotal evidence; and/or no recent incidents in associated organizations, facilities, or communities; and/or little opportunity, reason, or means to occur; has a 4% - 13% chance of occurring in a given year; may occur once every 8-25 years.
1- Rare: May occur only in exceptional circumstances; has a less than 4% chance of occurring in a given year; may occur once every 26 years or more.
0- Not Possible: There is a zero or near zero chance the hazard will occur in the jurisdiction.
Social Vulnerability Index (1-4)
A Jurisdiction’s Social Vulnerability is its score from the Social Vulnerability Index
(SoVI®) (Cutter et al. 2003). SoVI® scores in Florida range from -7.42 (Monroe County)
to + 6.61 (Glades County). The SoVI® index is compiled across the United States and
incorporates sociometric variables that impact the ability of a community to prepare and
respond to disasters- details can be found on their website: www.sovius.org. In the

Florida Public Health Risk Assessment Tool. User’s Guide
Page 50 of 55
FPHRAT SoVI® scores were converted to a number in the range of 0 to 4 where 0 is low
vulnerability and 4 is high vulnerability.
Critical Infrastructure and Key Resources (1-2)
Currently there is insufficient data calculate the Critical Infrastructure and Key Resources
(CIKR). Therefore, in the FPHRAT, all values are set to one (1).
Impact
Impact on health was calculated using pre-populated information and is the sum of the
Public Health Impact, Healthcare Impact, and Behavioral Health Impact. Scores can
range from 0 to 12. This score is calculated for each of the 36 hazards and is constant
for all counties.
a. Public Health Impact (PHI) Score (1-4)
PHI is calculated from the harmonic mean for each Indicator. These means were
converted to normalized means on a scale of 0 to 4. These values were then
summed and divided by the y-intercept .
Equation of PHI for PHRAT
𝑃𝑢𝑏𝑙𝑖𝑐 𝐻𝑒𝑎𝑙𝑡ℎ 𝐼𝑚𝑝𝑎𝑐𝑡 =
( ∑𝐼𝑀𝑅 + 𝑃𝐸 + 𝑃𝑆 + 𝑃𝑅𝐼 + 𝑃𝑅𝑀𝐶 + 𝑃𝐻𝑅𝐶𝐼 + 𝑃𝑅𝑀𝐷 + 𝑃𝑅𝐿𝐻𝑇𝑀 + 𝑃𝑊𝑇𝐹𝐸 + 𝑃𝐹𝑆𝐸𝐸
+ 𝑃𝐼𝐿𝑆𝑇𝑇)/1
𝑌 𝐼𝑛𝑡𝑒𝑟𝑒𝑐𝑝𝑡 𝑜 𝑟 10.015
Where:
(IMR) - Incident Mortality Rate (per 1000)
(PS) – Number of people requiring a public shelter (per 1000)
(PE) – Number of people evacuating (per 1000)
(PSIP) - Number of people sheltering in place (per 1000)
(PRI) - Number of people requiring immunization (per 1000)
(PRMC) - Number of people requiring medical countermeasures (per 1000)
(PHRCI) - Number of health related case investigations (per 1000)
(PRMD) - Number of people requiring mass decontamination (per 1000)
(PRLTHM) - Number of people requiring long-term health monitoring (per 1000)
(PWTFE) - Percentage of water treatment facilities affected (%)
(PFSEE) - Percentage of food service establishments affected (%)
(PILSTT) - Increase in clinical laboratory samples for testing (%)

Florida Public Health Risk Assessment Tool. User’s Guide
Page 51 of 55
y-intercept - ∆𝑦 𝑖𝑠 4 (4-0) and ∆𝑥 𝑖𝑠 the maximum value of x (43.93) minus the minimum value of x (0). In this case slope (m) is less than 1 (m=0.09985) leading to a re-arrangement of the formula y=mx using the reciprocal to y=x/(1/m) leading to a final equation y=x/10.015 (1/m=1/0.09985=10.015).
b. Healthcare Impact (HI) Score (1-4)
HI is a weighted composite score based on normalized harmonic means for the
following survey derived impact data. Individual hazard impact indicators are
weighted based on scheme developed by the City of Houston Department of Health
and Human Services.
𝐻𝑒𝑎𝑙𝑡ℎ𝑐𝑎𝑟𝑒 𝐼𝑚𝑝𝑎𝑐𝑡 =
(𝐼𝑀𝑅 ∗ 0.4) + (𝐻𝑅 ∗ 0.3) + (𝐼𝑂𝑇𝐶 ∗ .05) + (𝑃𝐷 ∗ 0.1) + (𝑀𝐷 ∗ 0.1) + (𝐼𝐶𝐿𝑇 ∗ .05)
𝑠𝑙𝑜𝑝𝑒 𝑜𝑟 1.6618075785
Where:
(IRM) = Standardized (0-4) Incident Morbidity Rate (Number of people becoming ill or injured) (per 1000)
(HR) = Standardized (0-4) Hospitalization Rate (Number of people requiring hospitalization) (per 1000)
(IOTC) = Standardized (0-4) Increase in OTC/Pharmacy Purchases (%)
(PD) = Standardized (0-4) Number of people requiring dialysis stations due to hazard (per 1000)
(MD) = Standardized (0-4) Number of people requiring mass decontamination (per
1000)
(ICLT) = Standardized (0-4) Increase in clinical laboratory samples for testing (%)
Slope - 𝑖𝑠 4 (4-0) and ∆𝑥 𝑖𝑠 the maximum value of x (3.43) minus the minimum value of x (0). In this case slope (m) since slope is > 1 (m=1.166187058) no transformation using y-intercept was utilized.
c. Behavioral Impact (BI) Score (1-4)
BI is a composite score based on the harmonic means for the following survey
derived impact data.
𝐵𝑒ℎ𝑎𝑣𝑖𝑜𝑟𝑎𝑙 𝐼𝑚𝑝𝑎𝑐𝑡 = 𝑃𝑅𝑃𝐵 + 𝑃𝑅𝑀𝑀𝑃𝑀 + 𝐶𝑀𝐻𝐴 + 𝑃𝑅𝐼 + 𝑃𝑅𝐿𝑆𝐴𝑃
Where:
(PRPB) - Standardized (0-4) number of people requiring psychiatric beds.
(PRMMPM) - Standardized (0-4) number of people requiring methadone maintenance or psychotropic medications.
(CMHA) - Standardized (0-4) number of call to local mental health authority.
(PRI) - Standardized (0-4) number of people requiring intervention.
Florida Public Health Risk Assessment Tool. User’s Guide
Page 52 of 55
(PRLSAP) - Standardized (0-4) number of people requiring a licensed substance abuse provider.
Hazard Risk Index Score (0-24)
The hazard risk index score is based on data pre-populated in the FPHRAT.
𝐻𝑎𝑧𝑎𝑟𝑑 𝑅𝑖𝑠𝑘 𝐼𝑛𝑑𝑒𝑥 =
𝑃𝑟𝑜𝑏𝑎𝑏𝑖𝑙𝑖𝑡𝑦 𝑠𝑐𝑜𝑟𝑒 ∗ 𝑉𝑢𝑙𝑛𝑒𝑟𝑎𝑏𝑖𝑙𝑖𝑡𝑦 𝑠𝑐𝑜𝑟𝑒 ∗ 𝐶𝐼𝐾𝑅 𝑠𝑐𝑜𝑟𝑒 ∗ ∑(𝑃𝐻𝐼 + 𝐻𝐼 + 𝐵𝐼)/10
Theoretical values for hazard risk can be as high as 48 ([(5 × 4 × 2 × ( 4 + 4 + 4 ))/10] =
[480/10] = 48). In version 1.1 of FPHRAT the CIKR is fixed at 1 so the maximum score is
cut in half and is 24.
Capabilities Index Score (1-4)
Scores for the capability preparedness index can range from 1 to 4 and are based on a
series of calculations as described below.
4= Full ability / capability:
All of the tasks associated with this function can be performed even if continued resources may be required to sustain this level of performance. Evidence is readily available documenting the ability to perform this function.
3= Substantial ability / capability:
Most of the tasks associated with this function can be performed but a few program gaps or challenges remain. These remaining gaps are minor in nature and there is a resource plan developed to fill these gaps. The ability to perform this function is well established and stable.
2= Partially ability / capability:
Some of the tasks associated with this function can be performed but important program gaps or challenges remain. Remaining program gap areas are identified and a resource plan to fill these gaps is developed but not yet fully implemented
1= Limited or no ability / capability:
No or only preliminary efforts and plans are underway for this function. Required activities related to this function are identified and an action plan may be developed. Few, if any, of the tasks associated with this function can be performed. ess than Capable: less than 25% of needed resources accessible.
CDC Capabilities are composed of 15 general preparedness categories, each containing
several functions. The tool accepts user input to evaluate these capabilities at the
function level. The capabilities and their functions are then weighted according to
relevance to each of 36 hazards and evaluated as described below.
Function Assessments, CiFj = function scores for each capability, where capability
number i = 1 to 15 and function number j = 1 up to 6 (7 for healthcare capabilities).
These are a measure of how well each capability function can be performed, without
considering the hazard that initiated the response.

Florida Public Health Risk Assessment Tool. User’s Guide
Page 53 of 55
Jurisdiction’s Assessment Score for Capabilities is scored using CDC Public Health
Preparedness Capabilities Assessment, defined as follows:
5=Full Ability/Capability
4=Significant Ability/Capability
3=Some Ability/Capability
2=Limited Ability/Capability
1= No Ability/Capability
Capability Status, CiS (∑𝐽≤6
𝐽=1 CiFj)/j = Average of function assessments for each
capability.
Function involvement, CiIj = 0 for not involved or 1 for involved. This is a pre-
populated yes/no evaluation of each capability function’s relevance to a hazard
response.
Relative Intensity of Engagement, CiE = 0 to 4 for each capability and hazard.
Another measure of public health relevance of a capability to a hazard response, defined
as follows
0 = very limited intensity level of this Public health preparedness capability
engagement for this hazard
1 = Low intensity level
2 = Moderate intensity level
3 = High and intensity level
4 = Extreme intensity level
Capability Hazard Component is the sum of Relative Intensity Engagement and
Average Function Involvement,
Average Function Involvement, CiHk = 𝐶𝑖𝐸 + ((∑𝐽≤6
𝐽=1 CiFj)/j)
This is an overall measure of the relevance of a capability to a hazard response; i.e.,
fatality management is more relevant to nuclear attack than air quality. 0 to 5 for each
capability, Ci and each hazard, H k..
Each capability is evaluated for:
Hazard Risk Weighting, Qi = ∑37
𝑘=1 CiHk X Rk is the Hazard Risk Index for each hazard;
this pushes the following scores into the hundreds due to summing 36 hazard elements.
Hazard Risk Weighted Capability Goal = 5Qi. Maximum weighted score. Used on the Capability Gap Chart.
Hazard Risk Weighted Capability Assessment = CiHk X Qi Capability Hazard Component weighted score. Used on the Capability Gap Chart.

Florida Public Health Risk Assessment Tool. User’s Guide
Page 54 of 55
Hazard Component Weighted Capability Assessment is the Capability Status divided
by the goal of 5 points. It is not displayed but is a Capability Gap Graph sort option.
Each hazard is evaluated for:
Preparedness %. The sum of the product of Capability Hazard Component and
Capability Status for each capability divided by the sum of the Capability Hazard
Components for each capability multiplied by the goal of 4 points.
In equation form: PrepPct = ∑15
𝑖 = 1 𝐶𝑖𝐻𝑘 ∗ 𝐶𝑖𝑆/ ∑ 15
𝑖 = 1 5𝐶𝑖𝐻𝑘
This is the ratio of capability to goal for each hazard weighted for relevance expressed as a percentage. Capabilities Preparedness Index is the above percentage normalized for the 1 to 4 scale. This is the score that is presented on the risk assessment sheet as part of mitigation.
Resources Index Score (1-4)
Public Health resources available to respond are scored by hazard by each jurisdiction and entered into the tool. Scores range from 1 to 4 and are defined as follows:
4= Fully in place: 76%-100% of needed resources accessible
3= Substantially in place: 51%-75% of needed resources accessible
2= Partially in place-25%: 50% of needed resources accessible
1= Less than Partially in place: less than 25% of needed resources accessible
Community Resilience Score (1-4)
Community Resilience was pre-populated and is based on the Baseline Resilience
Indicators for Counties (BRIC) created by the Hazards and Vulnerability Research
Institute (Cutter et al, 2010). Community resilience scores range from a low of 1.75
(Glades County) to a high of 2.03 (Pinellas County). Resilience scores were normalized
between 1 – 4 for computational purposes. Score development is a composite of
indicators characterizing the following categories affecting community resilience to
disasters:
1. Social Resilience
2. Economic Resilience
3. Institutional Resilience
4. Infrastructure Resilience
5. Community Capital

Florida Public Health Risk Assessment Tool. User’s Guide
Page 55 of 55
Residual Risk Index
Residual risk scores incorporate both pre-populated information and information
provided by jurisdictions. The residual risk score incorporated the mitigation factors
present in jurisdictions and is represented by the CDC PHP Capabilities Assessment
and resources scores.
Residual Risk = (Hazard Probability * Severity of Consequences) / Mitigation
Severity of Consequences
Severity of consequences factors the population vulnerability and impact on health, both pre-populated elements of the FPHRAT.
Severity of Consequences = Population Vulnerability × Impact on Health
Mitigation
Mitigation is the sum of three elements: Capability to Respond, Available
Resources, and Community Resilience. Theoretically, the score can range from 3
to 12.
Mitigation = Capability Preparedness Index + Available Resources + Community
Resilience