Embed Size (px)
Citation preview
Florida Youth Substance Abuse SurveySanta Rosa County Report
Sponsored by
The Department of Children and FamiliesSubstance Abuse Program Office
in conjunction with
Developmental Research and Programs, Inc.
(c) 2000 Florida Department of Children & Families Florida Youth Substance Abuse Survey 2000 Santa Rosa County Report
Table of Contents
The Florida Youth Substance Abuse Survey......................................................................................1 The Participating Youth.................................................................................................................2 Survey Norms and Comparative Data............................................................................................3
Confidence Intervals..................................................................................................................3 The Validity of the Survey Data .....................................................................................................4 Demographics...............................................................................................................................5 Use of Alcohol, Tobacco, Marijuana, and Inhalants........................................................................6
Analysis by Sex.........................................................................................................................9 Analysis by Race/Ethnicity.........................................................................................................9
Use of Illicit Drugs.......................................................................................................................10 Prevalence of Antisocial Behavior................................................................................................11
Analysis by Sex.......................................................................................................................12 Risk and Protective Factor Profile................................................................................................12
Risk and Protective Factor Scale Scores..................................................................................13 Understanding the Graphs........................................................................................................14 State of Florida Risk and Protective Factor Profile ...................................................................15 Santa Rosa County Risk and Protective Factor Profile .............................................................16
Implications.................................................................................................................................18 Appendix A: Florida Youth Survey 2000 Sampling Methodology.....................................................20 Appendix B: Risk and Protective Factors and Selected Associated Survey Items..............................22 Appendix C: Confidence Interval Calculation...................................................................................25 Appendix D: References..................................................................................................................27
(c) 2000 Florida Department of Children & Families Florida Youth Substance Abuse Survey 2000 Santa Rosa County Report
List of Tables and Graphs
Table 1. Major demographic characteristics of Florida (N=62,146) and Santa Rosa County (n=1267) surveyed youth......................................................................................................... 29
Table 2a. Percentage of Florida (N=62,146) and Santa Rosa County (n=1267) surveyed youth who reported having used various drugs in their lifetime, by grade cohorts ........................ 30
Table 2b. Percentage of Florida (N=62,146) and Santa Rosa County (n=1267) surveyed youth who reported having used various drugs in their lifetime, by age cohorts............................ 31
Table 2c. Percentage of Florida (N=62,146) and Santa Rosa County (n=1267) surveyed youth who reported having used various drugs in their lifetime, by sex........................................ 32
Table 3a. Percentage of Florida (N=62,146) and Santa Rosa County (n=1267) surveyed youth who reported having used various drugs in the past 30-days, by grade cohorts ................. 33
Table 3b. Percentage of Florida (N=62,146) and Santa Rosa County (n=1267) surveyed youth who reported having used various drugs in the past 30-days, by age cohorts .................... 34
Table 3c. Percentage of Florida (N=62,146) and Santa Rosa County (n=1267) surveyed youth who reported having used various drugs in the past 30-days, by sex................................. 35
Table 4a. Mean Age of first substance use among Florida (N=62,146) and Santa Rosa County (n=1267) surveyed youth, by grade cohorts.................................................................. 36
Table 4b. Mean Age of first substance use among Florida (N=62,146) and Santa Rosa County (n=1267) surveyed youth, by age cohorts ..................................................................... 37
Table 4c. Mean Age of first substance use among Florida (N=62,146) and Santa Rosa County (n=1267) surveyed youth, by sex.................................................................................. 38
Table 5a. Percentage of Florida (N=62,146) and Santa Rosa County (n=1267) surveyed youth who reported engaging in delinquent behavior within the past 12 months, by grade cohorts........................................................................................................................... 39
Table 5b. Percentage of Florida (N=62,146) and Santa Rosa County (n=1267) surveyed youth who reported engaging in delinquent behavior within the past 12 months, by age cohorts .................................................................................................................................... 40
Table 5c. Percentage of Florida (N=62,146) and Santa Rosa County (n=1267) surveyed youth who reported engaging in delinquent behavior within the past 12 months, by sex............... 41
Table 6a. Percentage of Florida (N=62,146) and Santa Rosa County (n=1267) surveyed youth who reported perceptions of risk, being "cool," and harm, by grade cohorts ..................... 42
Table 6b. Percentage of Florida (N=62,146) and Santa Rosa County (n=1267) surveyed youth who reported perceptions of risk, being "cool," and harm, by age cohorts......................... 43
Table 6c. Percentage of Florida (N=62,146) and Santa Rosa County (n=1267) surveyed youth who reported perceptions of risk, being "cool," and harm, by sex..................................... 44
Table 7. Protective factor information for Florida (N=62,146), Santa Rosa County (n=1267), and counties like Santa Rosa County across the Community, Family, School and Individual-Peer Domains.................................................................................................... 45
Table 8. Risk factor information for Florida (N=62,146), Santa Rosa County (n=1267), and counties like Santa Rosa County across the Community, Family, School and Individual-Peer Domains .......................................................................................................... 46
(c) 2000 Florida Department of Children & Families Florida Youth Substance Abuse Survey 2000 Santa Rosa County Report
Table 9. Behavioral outcomes indices for Florida (N=62,146), Santa Rosa County (n=1267), and counties like Santa Rosa County........................................................................ 47
Graph 1. Protective factor scores for Santa Rosa County (n=1267) compared to National, State (N=62,146), and like-county averages............................................................................. 48
Graph 2a. Risk factor scores for Santa Rosa County (n=1267) compared to National, State (N=62,146), and like-county averages: Community, School and Family Domains ............. 49
Graph 2b. Risk factors scores for Santa Rosa County (n=1267) compared to National, State (N=62,146), and like-county averages in the Individual-Peer Domain, and, behavioral outcomes indices ..................................................................................................... 50
(c) 2000 Florida Department of Children & Families Florida Youth Substance Abuse Survey 2000 Santa Rosa County Report
1
Florida Youth Substance Abuse Survey 2000 Santa Rosa County Report
This report is one in a series of reports that describes the
administration, state-level findings, and county-level findings from the Florida Youth Substance Abuse Survey 2000 (FYSAS). As part of the Florida Youth Survey 2000 effort, the FYSAS was administered to select Florida youth jointly with the Florida Youth Tobacco Survey between December 1999 and February 2000. (Details of the Florida Youth Tobacco Survey can be obtained from the Florida Department of Health's Bureau of Epidemiology at (850) 245-4444).
The Florida Youth Survey effort was a collaboration among Florida departments of Health, Education, Children and Families, and Juvenile Justice, and the Florida Office of Drug Control. The Department of Children and Families contracted with Developmental Research and Programs, Inc., to conduct the survey.
A report on state-level findings has been produced and is available online at www.state.fl.us/cf_web/adm/, under "Publications & Reports." Findings specific to Santa Rosa County are provided in this report following discussion of the survey administration and methodology.
The Florida Youth Substance Abuse Survey The Florida Youth Substance Abuse Survey (FYSAS) was
based on the Communities That Care (CTC) Youth Survey, developed by Developmental Research & Programs, Inc. The CTC Youth Survey provides scientifically sound information to communities on the prevalence of alcohol, tobacco and other drug use, and risk and protective factors among youth. This information is essential to support effective substance abuse needs-assessment and service planning, and to measure performance outcomes at local and state levels.
Risk and protective factors are characteristics of the community, school, and family environments, and individual and peer characteristics of the youth themselves that are known to predict alcohol and other drug use, delinquency, and gang involvement among youth (Hawkins, Catalano and Miller, 1992). Besides measuring risk and protective factors, the CTC Youth Survey also assesses the current prevalence of these problem behaviors in the community.
The Florida Youth Survey effort was a collaboration among Florida departments of Health, Education, Children and Families, and Juvenile Justice, and the Florida Office of Drug Control. The Department of Children and Families contracted with Developmental Research and Programs, Inc., to conduct the survey. The Florida Youth Substance Abuse Survey (FYSAS) provides scientifically sound information to communities on the prevalence of alcohol, tobacco and other drug use, and risk and protective factors among youth.
(c) 2000 Florida Department of Children & Families Florida Youth Substance Abuse Survey 2000 Santa Rosa County Report
2
There are eighteen risk factors and ten protective factors measured by the CTC Youth Survey. Some of the risk factors are broad enough that they require two separate scales for adequate measurement. As a result, 24 separate risk-factor scales are used. Appendix B provides a complete list of the risk and protective factors, the corresponding risk-factor and protective-factor scales in the survey, and selected survey items associated with the factors.
The CTC Youth Survey was developed from normative data collected between 1994 and 1997 from over 72,000 6th through 12th grade students participating in statewide surveys in Kansas, Maine, Oregon, South Carolina, and Washington. An average of four survey items is used to measure each risk and protective factor scale. Reliability for the constructs was good. The average value for Cronbach's was alpha = .79. The survey, its uses, and its ongoing development were described in two recently published articles that provide a complete report on the survey's development and its psychometric properties (Pollard, Catalano, Hawkins, & Arthur, 1998; Pollard & Lofquist, 1998).
The Participating Youth The Florida Youth Survey 2000 used a two-stage cluster sample
design to obtain a representative sample of youth in public middle and high schools. The sampling frame for this survey consisted of all public schools with grades 6 through 12 in any combination, and was built on the sampling frame used by the Florida Youth Tobacco Survey. The Florida Youth Substance Abuse Survey and the Florida Youth Tobacco Survey were simultaneously administered as part of the Florida Youth Survey 2000 effort. Because counties in Florida vary so widely in size, sample selection methodology varied. Five hundred eighty schools in 64 counties participated in the survey. A total of 65,246 surveys were processed.
All data reported herein are based on analyses of a valid sub-set of these cases. The validation procedures are described below. For state-level estimates, cases were weighted by county and grade so as to reflect the population distribution in Florida. In the analyses, some cases were weighted more heavily, and some less heavily, so that overall statewide estimates were less biased by the response rate, and population size, within a given county. For county-level estimates, cases were weighted by grade, unless otherwise indicated.
Three counties that did participate in the survey administration are excluded from all statewide estimates; however, all counties that
Appendix B provides a complete list of the risk factors and protective factors, the corresponding ris-factor and protective-factor scales in the survey, and selected survey items associated with the factors. Five hundred eighty schools in 64 counties participated in the survey. A total of 65,246 surveys were processed.
(c) 2000 Florida Department of Children & Families Florida Youth Substance Abuse Survey 2000 Santa Rosa County Report
3
participated in the survey will be provided with county-level reports. In Baker, Franklin, and Glade counties, an insufficient number of surveys were available to make accurate and stable weighted-estimates for inclusion in the state-level report. Thus, the total number of surveys from these counties did not reach the criteria for inclusion in the statewide sample. Consequently, 61 counties are represented in all of the statewide estimates presented herein. The Florida Youth Substance Abuse Survey State Report contains extensive details of both survey findings and administration. Find the report online at www.state.fl.us/cf_web/adm/, under "Publications & Reports."
Survey Norms and Comparative Data Comparison data and survey norms for assessing the relative
meaning of the youth survey at the county level came from the state-level findings and an additional national survey of adolescent behavior. Comparisons for prevalence information came directly from the Florida Youth Substance Abuse Survey State Report. Comparison data for risk and protective factors were drawn from the CTC Six-State Study. The Six-State Study was funded by the Center for Substance Abuse Prevention, Department of Health and Human Services, during the years 1993-1997. This project supported the development of a student survey instrument measuring substance abuse prevalence as well as risk and protective factors predictive of alcohol, tobacco and other drug use, delinquency, gang involvement, and other problem behaviors in adolescents. School survey data were collected in five states: Kansas, Maine, Oregon, South Carolina, and Washington. One other state, Utah, participated in the CTC project, but school survey data were not collected in Utah. Normative data on risk and protective factor prevalence are drawn from the CTC Six-State Study.
Confidence Intervals
Confidence intervals provide a range of values within which the "true" population value can be found. A primer on confidence intervals, their calculation and interpretation, is presented in Appendix C. While confidence intervals are not provided for every estimate contained in this report, we do provide information that, along with the method described in Appendix C, would allow the reader to calculate an approximate confidence interval for each estimate.
Note that the confidence intervals calculated for the sample estimates at the state level were less than 1.0, indicating that the sample estimates are very close to the "true" population values. The
The Florida Youth Substance Abuse Survey State Report contains extensive details of both survey findings and administration. Find the report online at www.state.fl.us/cf_web/adm/, under "Publications & Reports." Comparisons for prevalence information come directly from the Florida Youth Substance Abuse Survey State Report . Comparison data for risk and protective factors are drawn from the CTC Six-State Study. The Six-State Study was funded by the Center for Substance Abuse Prevention, Department of Health and Human Services, during the years 1993-1997. Confidence intervals provide a range of values within which the "true" population value can be found. A primer on confidence intervals, their calculation and interpretation, is presented in Appendix C.
(c) 2000 Florida Department of Children & Families Florida Youth Substance Abuse Survey 2000 Santa Rosa County Report
4
high precision of the sample estimates is due to the following methodological conditions: (a) the final sample size of the survey effort, (b) survey interleaving as described in Appendix A, (c) occurrence of censuses in selected counties, and (d) the required levels of estimates, i.e., confidence intervals of less than 1.0. Based on these conditions, the state-level sample estimates have enough precision for use in policy-level decision making. For Santa Rosa County, the maximum 95% confidence interval estimate is ±4.2 for prevalence rates approximating 50% (such as alcohol or tobacco) while the maximum 95% confidence interval estimate is ±0.9 for prevalence rates less than 5% (such as cocaine or heroin).
The Validity of the Survey Data Three separate strategies were used to assess the validity of the
youth self-report survey data. Two eliminated the data of surveyed youth who appeared to exaggerate their substance use. In the first strategy, surveyed youth who reported the extreme levels of use for every illicit drug (except marijuana) were eliminated from the survey data set. In the second strategy, surveyed youth were asked whether they ever used a fictitious drug, "Derbisol," in their lifetimes and in the past 30 days, as well as how old the surveyed youth were when they first, if ever, used Derbisol. If the surveyed youth reported the use of Derbisol on two of these three questions, his or her survey was eliminated.
The third strategy identified surveyed youth who repeatedly reported logically inconsistent patterns of substance use. If, for example, a surveyed youth reported 10 uses of alcohol in the past 30 days, but no use in their lifetime, that logical inconsistency was noted and assessed for the following conditions: (a) they were inconsistent on two out of four of the following substances: alcohol, cigarettes, chewing tobacco and marijuana; or (b) they were inconsistent on five or more of the nine remaining illicit substances. This approach did not eliminate surveyed youth who make occasional clerical mistakes.
These three strategies have been shown to consistently identify most surveys that were completed in a random fashion, those that were not taken seriously, and/or those that are not valid for other reasons.
In the statewide analysis, good cooperation was obtained from Florida youth selected for participation. A total of 62,146 youth (95.2% of 65,246) completed valid survey forms. This level of cooperation is typical of most survey efforts based on the CTC Youth
For Santa Rosa County, the maximum 95% confidence interval estimate is ±4.2 for prevalence rates approximating 50% (such as alcohol or tobacco) while the maximum 95% confidence interval estimate is ±0.9 for prevalence rates less than 5% (such as cocaine or heroin). In the statewide analysis, good cooperation was obtained from Florida youth selected for participation. A total of 62,146 youth (95.2% of 65,246) completed valid survey forms.
(c) 2000 Florida Department of Children & Families Florida Youth Substance Abuse Survey 2000 Santa Rosa County Report
5
Survey. Over three thousand youth (3,100, or 4.8%) were identified by one or more of the three strategies described above as providing invalid survey results and were excluded from further analysis. Of the surveyed youth eliminated, 1,280 exaggerated illicit drug use (strategy 1), 2,229 reported the use of Derbisol (strategy 2), and 2,076 were identified because of logical inconsistencies in their answers (strategy 3). The three strategies' elimination totals sum to more than 3,100 because many of these youth were identified by more than one strategy.
For Santa Rosa County, above average cooperation was obtained. A total of 44 (3.4%) out of the 1,311 competed surveys was identified by one or more of the three strategies described above as not being valid. This level of cooperation is typical of most county-level survey efforts based on the CTC Youth Survey. Consequently, those responses identified as not valid were excluded from all further analysis. Of the eliminated surveys, 22 (1.7%) exaggerated illicit drug use (strategy 1), 33 (2.5%) reported the use of Derbisol (strategy 2), and 28 (2.1%) were excluded because of logical inconsistencies in their answers (strategy 3). Again, the three strategies' elimination totals sum to more than 44 because many surveys were identified by more than one strategy.
Demographics The demographics of the state and county student populations, as
estimated from the survey results, are presented in Table 1. Throughout this report, results are presented individually by grade cohort, sex, and age cohort. That is, grade-level results are aggregates for "Overall Middle School" and "Overall High School," and are sub-totals for grades 6-8 and 9-12, respectively. Similarly, age cohort are aggregated: ages 10-14 and 15-17 form the two groups.
For the state-level findings, a higher proportion of the respondents were female than male. In Santa Rosa County, there were slightly more males than females.
The distribution of age and grade are consistent, with an increasingly smaller percentage of older students and students in later grades. This can be attributed to dropout rates as well as to the larger percentage of students in later grades with irregular attendance (e.g., split work/school schedule). Note that although some surveyed youth report their age as 10 or 19, proportions of these youth are markedly smaller relative to the other age groups. That is, at the state level, only 0.2% (n=108) of surveyed youth reported being 10 years-old.
For Santa Rosa County, above average cooperation was obtained. A total of 44 (3.4%) of 1311 completed surveys were rejected. Throughout this report, results are presented by grade cohort, sex, and age cohort.
(c) 2000 Florida Department of Children & Families Florida Youth Substance Abuse Survey 2000 Santa Rosa County Report
6
Accurate and stable estimates are not possible with such relatively small numbers of surveyed youth. Consequently, the reported age cohorts are not truly representative of their intended cohort. There are too few 10 year- olds in the 10 to 14 year-old category. This cohort was defined this way in an effort to correspond to other data collected by the State of Florida.
Table 1 also shows the percentage estimates of the ethnic breakdown of Florida and Santa Rosa County's surveyed population. For the state-level findings, the highest proportions of students were self-identified as White, non-Hispanic (49.5%), or African American (19.2%). Almost 17% identified themselves as Hispanic/Latino. Note that approximately 11% of surveyed youth were classified as "Other." This may include youth of Hispanic/Latino descent who identify as Latino/White or Latino/Black, or it may include other ethnic groups such as Haitians.
The findings for Santa Rosa County show an ethnic distribution that is slightly different from the state. For Santa Rosa County, White non-Hispanic students represent a large majority, 77.3%, of the surveyed population. In Santa Rosa County no other ethnic group makes up more than 10% of the surveyed population.
Use of Alcohol, Tobacco, Marijuana, and Inhalants Results for drug usage rates are presented for two prevalence
periods: lifetime and past 30 days. Lifetime prevalence is defined as any occurrence of use throughout the life of the respondent. Thirty-day prevalence is defined as any occurrence of use in the past 30 days. For any drug, the lifetime prevalence rate is the best measure of experimentation while 30-day prevalence rate is a good measure of current use.
As is typical for almost all adolescent populations, alcohol is the most widely used substance (see Tables 2a-2c and 3a-3c). Just over half (52.6%) of Florida's youth have used alcohol in their lifetime. For Florida, the lifetime prevalence rate for alcohol ranges from 38.6% in middle school to 68.9% in high school. Overall, the Santa Rosa County lifetime prevalence rates of alcohol use appear higher than the state rates. In Santa Rosa County, 42.8% of middle school students and 71.9% of high school students reported having used alcohol in their lifetime. Overall, 56.0% of students in Santa Rosa County reported alcohol use in their lifetimes.
Current alcohol use was also assessed (see Tables 3a to 3c). Almost one-third (31.0%) of Florida's youth have used alcohol in the
For the state-level findings, the highest proportions of students were self-identified as White, non-Hispanic (49.5%), or African American (19.2%). Almost 17% identified themselves as Hispanic/ Latino. As shown on Table 1, 77.3% of youth surveyed in Santa Rosa County are White non-Hispanic, 4.5% are African American, and 3.2% are Hispanic/Latino. Lifetime prevalence is defined as any occurrence of use throughout the life of the respondent. Thirty-day prevalence is defined as any occurrence of use in the past 30 days.
(c) 2000 Florida Department of Children & Families Florida Youth Substance Abuse Survey 2000 Santa Rosa County Report
7
past 30 days while, in Santa Rosa County, a similar rate (30.7%) was found. This difference was consistent for both middle and high school students. Compared to the state, a similar proportion of students in Santa Rosa County have used alcohol in the past 30 days.
Finally, results from survey questions related to binge drinking (defined as consumption of five or more drinks in one sitting within the past two weeks) show that in Florida, 8.8% of middle school students and 23.3% of high school students have binged in the last two weeks. Again, in Santa Rosa County, these rates are similar to, or slightly higher than, state rates (Table 3a). Regardless of the comparison to the state, finding that 26.8% of Santa Rosa County high school students have consumed five or more drinks in one sitting, in the last two weeks, should be given due attention.
Tobacco (cigarettes and chewing tobacco) is usually the next most commonly used substance among adolescents on the national level; this is true in Florida and Santa Rosa County as well (see Tables 2a-2c and 3a-3c). Overall, 39.7% of the Florida youth have used cigarettes sometime in their lifetimes and 15.3% reported using cigarettes in the past 30 days. These state figures are lower than in Santa Rosa County, where the lifetime prevalence of cigarette use is 47.9% and 30-day use is 19.0%. Note that both lifetime and 30-day cigarette use among Florida's surveyed youth is lower than the national rates reported by Monitoring the Future (Johnston, O'Malley, & Bachman, 2000). When examined by grade cohort, the Florida lifetime prevalence of cigarette use for surveyed youth ranges from 28.9% in middle school to 52.3% in high school. Santa Rosa County's cigarette use rates are higher than the rates for Florida; 36.0% of Santa Rosa County's middle school student and 62.3% of high school students reported having smoked a cigarette in their lifetimes. Similarly, while the Florida rates for 30-day use of cigarettes ranges from 9.8% in middle school to 21.7% in high school, Santa Rosa County's rates are 12.3% and 27.1% for middle school and high school, respectively.
For both the state of Florida and Santa Rosa County, there was relatively low use of smokeless tobacco compared to cigarette use (see Tables 2a-2c and 3a-3c). This is often true of middle and high school age populations.
Nationally, marijuana use has been rising or remaining stable over the last five years for middle and high school students (Johnston, O'Malley, & Bachman, 2000). In their lifetimes, about 22.3% of Florida's youth have used marijuana, with use ranging from 10.0% in middle school to 36.6% in high school (see Table 2a). The prevalence
Almost one-third (31.0%) of Florida's youth have used alcohol in the past 30 days. In Santa Rosa County, a similar rate (30.7%) was found. While the Florida rates for 30-day use of cigarettes range from 9.8% in middle school to 21.7% in high school, Santa Rosa County's rates are 12.3% and 27.1% for middle school and high school, respectively.
(c) 2000 Florida Department of Children & Families Florida Youth Substance Abuse Survey 2000 Santa Rosa County Report
8
rates of marijuana use for Santa Rosa County are similar to the state's rates for high school, where 38.2% of Santa Rosa County high school students indicated that they have used marijuana in their lifetimes. A similar comparison between Florida and Santa Rosa County can be seen in the lifetime marijuana rates for middle schools students. While 10% of Florida middle school students reported use of marijuana in their lifetimes, the rate is 11.0% in Santa Rosa County.
For Florida, 30-day use of marijuana is 11.2% across all grades with 5.1% of middle school students and 18.3% of high school students indicating past 30-day use. Across grade cohorts in Santa Rosa County, rates are again similar to the state (5.2% and 17.4% for middle and high school, respectively). Overall, for Florida, lifetime and the past 30-day use of marijuana is lower than use reported in the Monitoring the Future study. While many of Florida's youth are currently using marijuana (11.2% overall), the rate is lower than would be expected based on national trends. This also is true for Santa Rosa County.
As Table 2a illustrates, lifetime prevalence of inhalant use peaks slightly in the middle school years for surveyed youth in both Santa Rosa County and Florida. This is a common pattern for inhalant use, which typically increases through middle school and then declines in high school. Comparing Florida and Santa Rosa County in lifetime prevalence rates reveals higher inhalant use among Santa Rosa County students (14.5% versus 11.8%). Thirty-day prevalence rates for inhalant use reveal few differences.
Rates of the most commonly used substances in Santa Rosa County--alcohol, tobacco, marijuana, and inhalants—are at levels that reflect, or slightly differ from, the current trends found at the statewide level.
Florida and Santa Rosa County share a serious youth alcohol abuse problem with the rest of the nation. It is by far the most frequently abused substance sampled. By the 6th grade, 11.7% of Florida's youth reported past month use, increasing to over half (51.2%) of 12th grade youth (DCF, 2000). In Santa Rosa County, 8.5% of middle school students and 26.8% of high school students reported an alcohol binge in the past two weeks. Another notable finding is that Santa Rosa County middle school students reported rates of cigarette use higher than middle school students in Florida reported. These findings highlight the need to target prevention of underage alcohol use to elementary school youth as well as to middle and high school youth.
For Florida, thirty-day use of marijuana is 11.2% across all grades with 5.1% of middle school students and 18.3% of high school students indicating past 30-day use. In Santa Rosa County, rates are again similar to the state (5.2% and 17.4% for middle- and high-school, respectively). In Santa Rosa County, 8.5% of middle school students and 26.8% of high school students reported an alcohol binge in the past two weeks.
(c) 2000 Florida Department of Children & Families Florida Youth Substance Abuse Survey 2000 Santa Rosa County Report
9
Analysis by Sex
Findings for all drugs are also broken down by sex. For both Florida and Santa Rosa County, few differences between males and females in alcohol involvement are apparent (see Tables 2b and 3b). Males were more likely than females (17.4% versus 14.0% in Florida, and 19.7% versus 14.6% in Santa Rosa County) to have engaged in binge drinking (i.e., had five or more drinks in one sitting in the last two weeks). This difference is larger in Santa Rosa than in the state of Florida overall.
Rates of cigarette use are consistent for males and females. Lifetime use of smokeless tobacco, however, was indicated by 18.1% of males and only 6.5% of females at the state-level and by 29.7% of males and 7.8% of females in Santa Rosa County. Additionally, males reported more current use of smokeless tobacco at state (7.3% versus 2.4%) and county (10.9% versus 1.7%) levels (see Table 3b).
A larger proportion of males than females had tried marijuana in their lifetimes at the state (24.6% versus 20.2%) and county (26.3% versus 20.6%) levels (see Table 2b). A similar pattern can be seen in the 30-day prevalence rate for marijuana. In Florida, 13.0% of males and 9.6% of females indicated use in the past 30 days. In Santa Rosa County, 13.2% of males and 8.5% of females reported past 30-day use of marijuana.
In terms of lifetime and 30-day use of inhalants, males and females in the sample reported involvement at approximately the same rate (see Tables 2b and 3b).
Analysis by Race/Ethnicity
County-level analysis of the data, by ethnicity, is not possible because the sample sizes are low and further aggregation makes the results less valuable. However, it is important to note that compared to any of the other national ethnic groups, African American youth have lower lifetime and past 30-day use for all substances sampled. At the state level, the lifetime prevalence rate for alcohol use among African American youth is 39.5%, while for White, non-Hispanic youth it is 58.7% (DCF, 2000). Those data are consistent with national trends that show that African American youth are among the least involved with alcohol, tobacco, and other drugs (Johnston, O'Malley & Bachman, 2000). As a result, it is important to consider the ethnic distribution whenever drug use trends are examined. Given Santa Rosa County's demographics, drug use rates higher than the state's are not surprising.
Males were more likely than females (17.4% versus 14.0% in Florida, and 19.7% versus 14.6% in Santa Rosa County) to have engaged in binge drinking (i.e., had five or more drinks in one sitting in the last two weeks). At the state level, the lifetime prevalence rate for alcohol use among African American youth is 39.5%, while for White, non-Hispanic youth it is 58.7% (DCF, 2000). Those data are consistent with national trends that show that African American youth are among the least involved with alcohol, tobacco, and other drugs (Johnston, O'Malley & Bachman, 2000).
(c) 2000 Florida Department of Children & Families Florida Youth Substance Abuse Survey 2000 Santa Rosa County Report
10
Use of Illicit Drugs Tables 2a-2c and 3a-3c also show the percentage of Florida
youth reporting the use of illicit drugs other than marijuana and inhalants (hallucinogens, methamphetamines, cocaine, crack cocaine, steroids, heroin, other narcotics, depressants), by grade cohort, sex, and age cohort, respectively.
Given that use rates of specific drugs in this category are low, it is useful to consider them in aggregate. Lower levels of use for specific illicit drugs (10% or less) are typical of adolescent populations. Also, the use of illicit drugs (other than inhalants) tends to be concentrated in the upper grade levels. While the use rates of these drugs are low, it is critical to note that any use of these extremely dangerous drugs should be taken into consideration when planning and developing prevention and treatment programs.
Tables 2a-3c include prevalence rates listed for four distinct drug groupings. The any illicit drug rate is the prevalence rate for any use of any drug except alcohol and tobacco. Thus, if a student reports use of any one of these substances, regardless of use of any of the other drugs, he or she would be classified as having used any illicit drug. Another category provided on Tables 2a-3c, any illicit drug use except marijuana, does not exclude marijuana users; rather, marijuana is simply not considered when calculating the prevalence rates. This rate is similar to any illicit drug, except marijuana is excluded from the calculation. Thus, these rates represent the use of specific illicit drugs over and above the use of marijuana. Consequently, rates are much lower. The difference in these two rates reflects the percentage of students who use marijuana exclusively. The alcohol only rate is the prevalence of the use of alcohol without the use of any other drug. Finally, the alcohol or any illicit drug rate is an indication of the use of any drug or alcohol. As with previous data, usage is reported for two time periods: lifetime (see Tables 2a-2c) and in the past 30 days (see Tables 3a-3c) and is grouped by grade cohort, sex and age cohort.
A variety of important findings can be seen in the aggregate drug rates. The percentage of surveyed youth in Florida reporting the lifetime use of any illicit drug (the rate that includes marijuana) rises from 20.6% in middle school to 41.5% in high school. Overall, 30.2% of Florida youth reported the use of at least one illicit drug in their lifetime. For Santa Rosa County, these rates are slightly higher: 33.7% of students (23.4% of middle school students and 46.1% of high school students) indicated lifetime use of any illicit drug.
The any illicit drug rate is the prevalence rate for any use of any drug except alcohol and tobacco. Another category provided on Tables 2a-3c, any illicit drug use except marijuana, does not exclude marijuana users; rather, marijuana is simply not considered when calculating the prevalence rates. The alcohol only rate is the prevalence of the use of alcohol without the use of any other drug. Finally, the alcohol or any illicit drug rate is an indication of the use of any drug or alcohol. Overall, 30.2% of Florida youth reported the use of at least one illicit drug in their lifetime. Santa Rosa County student report more use of these substances. As much as 33.7% of students (23.4% of middle school students and 46.1% of high school students) indicated lifetime use of an illicit substance.
(c) 2000 Florida Department of Children & Families Florida Youth Substance Abuse Survey 2000 Santa Rosa County Report
11
In Florida, 8.9% of students have used any illicit drug except marijuana in the last 30 days: 7.7% of middle school students and 10.4% of high school students (see Table 3a). In Santa Rosa County, the percentages of students who have used any illicit drug except marijuana in the last 30 days are 6.5% and 13.2%, for middle school and high school students, respectively, and 9.6% of all students. Thus, 13.2% of Santa Rosa County's high school students have used inhalants, hashish, LSD, methamphetamines, cocaine, crack cocaine, steroids, heroin, other narcotics or barbiturates in the last 30 days. Including marijuana use in this drug grouping brings the aggregate use rate up to 23.1% for high school students (see Table 3a) in Santa Rosa County.
Tables 2a-2c also show the lifetime and current use prevalence of alcohol only, and alcohol or any illicit drug use. These rates are categorized by grade cohort, sex, and age cohort. Just over 14.2% of all youth surveyed in Florida reported using only alcohol--no other drugs--in the past 30 days. A slightly lower percentage (12.0%) of Santa Rosa County youth reported using alcohol only in the past 30 days. Alcohol or any illicit drug use is defined by assessing whether surveyed youth reported alcohol use and/or use of any one of the other drugs (e.g., marijuana, inhalants). In Santa Rosa County, while 15.5% of surveyed youth reported past 30-day use of any illicit drug (see Table 3a), that rate more than doubles to 34.7% for surveyed youth who reported past 30-day use of alcohol or any illicit drug.
Prevalence of Antisocial Behavior Eight antisocial behaviors were assessed with the Florida Youth
Substance Abuse Survey. Information on antisocial behavior is only collected for one prevalence period, the past 12 months. See Tables 5a to 5c for specific findings by grade cohort, sex, and age cohort.
It is important to note that across the state, youth consistently reported that they have Attacked Someone with Intent to Harm, have been Suspended from School, or have been in Drunk or High at School in the last 12 months as their most common Antisocial Behaviors. In Florida, 15.3% reported having Attacked Someone with Intent to Harm, 14.7% reported being Suspended from School and 12.2% reported having been Drunk or High at School. These same three rates are also high in Santa Rosa County where 15.0% of students reported having Attacked Someone with Intent to Harm, 8.6% reported being Suspended from School and 15.0% reported having been Drunk or High at School.
In Santa Rosa County, while 15.5% of surveyed youth reported past 30-day use of any illicit drug (see Table 3a), that rate more than doubles to 34.7% for surveyed youth who report past 30-day use of alcohol or any illicit drug. In Florida, 15.3% of surveyed youth reported having Attacked Someone with Intent to Harm, 14.7% reported being Suspended from School and 12.2% reported having been Drunk or High at School. These three rates are also high in Santa Rosa County where 15.0% of students reported having Attacked Someone with Intent to Harm, 8.6% reported being Suspended from School and 15.0% reported having been Drunk or High at School.
(c) 2000 Florida Department of Children & Families Florida Youth Substance Abuse Survey 2000 Santa Rosa County Report
12
It should be noted that school suspension rates are difficult to interpret because school suspension policies vary substantially from district to district, so these rates should be viewed with caution. However, the other two problem behaviors are legitimate targets for prevention and intervention efforts given their relatively high rates.
The 12-month prevalence of a variety of delinquent behaviors increases with grade and, consequently, age. In Santa Rosa County, the percentage of adolescents who reported being Drunk or High at School is higher in high school, at 20.0% than in middle school 8.0% (see Table 5c for rates by age cohorts). One of the delinquent behaviors that seems unrelated to age is Attacked Someone with Intent to Harm. This prevalence rate is stable across age and grade cohorts. However, it should be noted that the underlying definition of this behavior may change over time. What it means for a middle school student to attack another student with intent to harm is probably qualitatively different from what it means to a high school student. Regardless of its underlying definition, the fact that around 15% of Florida's youth--across grade levels--indicated that they have attacked another person with intent to harm in the past 12 months is an important finding (see Table 5a). The same finding is evident in Santa Rosa County where the rate of having Attacked Someone with Intent to Harm is higher in high school (16.8%) than in middle school (12.8%).
Analysis by Sex
There are substantial differences between the sexes among these delinquent behaviors. In fact, males were more likely to indicate that they had committed all eight anti-social behaviors. These results are not surprising. The literature on delinquency indicates that males are more involved in delinquent behavior than females (Steffensmeier & Allan, 1995).
This difference was particularly pronounced for Carrying a Gun in the Neighborhood, Taking a Gun to School, and being Suspended from School. In each case, for both the state of Florida and Santa Rosa County, more than twice as many males as females reported these behaviors (see Table 5b).
Risk and Protective Factor Profile Research during the past 30 years supports the view that alcohol,
tobacco and other drug use, delinquency, school achievement, and other important outcomes in adolescence, are associated with specific aspects of the youth's community, school, family environments, and
Regardless of its underlying definition, the fact that around 15% of Florida's youth--across grade levels--indicated that they had attacked another person with intent to harm in the past 12 months is an important finding. In Santa Rosa County the difference between middle and high school students who had Attacked Someone with Intent to Harm is higher.
(c) 2000 Florida Department of Children & Families Florida Youth Substance Abuse Survey 2000 Santa Rosa County Report
13
individual characteristics. For our purpose, these characteristics are called risk factors or protective factors. Risk factors are characteristics that are known to increase the likelihood that a youth will engage in one or more problem behaviors. For example, a risk factor in the community environment is the existence of Laws and Norms that are Favorable to Alcohol, Tobacco and Other Drug Use. In those communities where there is acceptance or tolerance of drug use, youth are more likely to engage in alcohol, tobacco and other drug use. Protective factors are characteristics in the youth's community, school, family, and individual environments that are known to decrease the likelihood that a youth will engage in problem behaviors. For example, strong positive attachment or bonding to parents reduces the risk of an adolescent engaging in problem behaviors. The analysis of risk and protective factors is the most powerful paradigm available for understanding the genesis of both positive and negative adolescent behavioral outcomes. This analysis can then lead to the successful design of adolescent prevention programs (Hawkins, Catalano, & Miller, 1992).
A substantial amount of research shows that exposure of adolescents to a greater number of risk factors is associated with more substance use and delinquency. Research also shows that exposure to a number of protective factors is associated with lower prevalence of these problem behaviors (Bry, McKeon, & Pandina, 1982; Newcomb, Maddahian, & Skager, 1987; Newcomb & Felix-Ortiz, 1992; Newcomb, 1995; Pollard, et al., 1998; Pollard & Lofquist, 1998).
The aggregate levels of risk and protective factors in an adolescent population determine the levels of current and future negative and positive behaviors. However, it is specific risk factors or protective factors that are the targets for prevention programming. That is, the most effective prevention programs identify what risk factors are elevated in the student population, what protective factors are suppressed, and then implement prevention programming that specifically targets the identified risk or protective factors.
Risk and Protective Factor Scale Scores
To support this process, a risk-factor and protective-factor "profile" was developed for Florida surveyed youth by calculating the average value of each of the risk-factor and protective-factor scales. Tables 7, 8, and 9, and Graphs 1, 2a and 2b show the results for all risk-factor and protective-factor scale scores for Florida and Santa Rosa County.
Risk factors are characteristics that are known to increase the likelihood that a youth will engage in one or more problem behaviors. For example, a risk factor in the community environment is the existence of Laws and Norms Favorable to Alcohol, Tobacco and Other Drug Use. Protective factors are characteristics in the youth's community, school, family, and individual environments that are known to decrease the likelihood that a youth will engage in problem behaviors. For example, strong positive attachment or bonding to parents reduces the risk of an adolescent engaging in problem behaviors.
(c) 2000 Florida Department of Children & Families Florida Youth Substance Abuse Survey 2000 Santa Rosa County Report
14
In each case, risk-factor and protective-factor scales are measured on a 0-100 scale. A score of 50 represents the national average based on the CTC Six-State Study. This database is currently the best available data for adolescents in the United States. Scores above 50 indicate that youth (either youth in Florida or Santa Rosa County) are, on average, elevated in the specific risk or protective factors when compared to norms established in the CTC Six-State Study. Scores below 50 indicate that Florida youth are, on average, lower than the norms established in the CTC Six-State Study for specific risk or protective factors. Ideally, because of their relationship with current and future behavioral outcomes, all risk factors would be below the CTC Six-State Study average, and all protective factors would be above the CTC Six-State Study average.
Appendix B provides a complete list of the risk and protective factors, the corresponding risk-factor and protective-factor scales in the survey, and selected survey items associated with the factors.
Understanding the Graphs
Graphs 1, 2a, and 2b represent the risk and protective data graphically. These complex graphs are designed to convey multiple comparison groups for each risk-factor and protective-factor score that is estimated from the Santa Rosa County data. Comparisons are critical to the understanding of risk-factor and protective-factor data as the scale scores alone contain little intrinsic meaning. This is true of many psychosocial measures. An intelligence score (IQ), for instance, has little meaning without the knowledge that "average intelligence" is represented by a score of 100. Comparison points for risk-factor and protective-factor information is much the same. Many comparison points are provided so that effective evaluation of a specific score's meaning can be better understood.
Five aspects of each risk-factor or protective-factor score are represented on each graph. First, the 50 mark refers to the national average. Second, the yellow dot refers to the county that is analyzed in this report (in this case, Santa Rosa County). Next, the thin black line represents the average for Florida. Fourth, the gray, vertical, line represents the distribution of counties around the Florida average. Ninety-five percent of counties in Florida fall in the area covered by the gray line. Finally, the red 'X' represents counties that have been identified as "like" the county represented in the report in a single aspect: student population. Thus, for Santa Rosa County, the red 'X' represents the average risk-factor or protective-factor score for the larger counties in Florida. For Santa Rosa County, the counties that
Risk-factor and protective factor scales are measured on a 0-100 scale. A score of 50 represents the national average based on the CTC Six-State Study. Appendix B provides a complete list of the risk and protective factors, the corresponding risk and protective factor scales in the survey, and selected survey items associated with the factors. Graphs 1, 2a, and 2b represent the risk and protective data graphically. These complex graphs are designed to convey multiple comparison groups for each risk-factor and protective-factor score that is estimated from the Santa Rosa County data. Five aspects of each risk-factor or protective-factor score is represented on each graph: (1) the 50 mark refers to the national average, (2) the yellow dot refers to the county analyzed in this report, (3) the thin black line represents the average for Florida, (4) the gray, vertical line represents the distribution of counties around the Florida average, and, (5) the red 'X' represents counties "like" the county represented in the report in a single aspect: student population.
(c) 2000 Florida Department of Children & Families Florida Youth Substance Abuse Survey 2000 Santa Rosa County Report
15
are similar in terms of student population (10,000-24,999 students) are: Pasco, Escambia, Marion, Sarasota, Manatee, Osceola, Collier, Leon, Alachua, Clay, St. Lucie, Lake, and Bay.
State of Florida Risk and Protective Factor Profile
Tables 7, 8, and 9 display the risk-factor and protective-factor values for Santa Rosa County and Florida. Across all risk and protective factors, for all Florida students, the average risk-factor score was 49 and the average protective-factor score was 50.
Elevated risk scores are found at the state level in the Community Domain. Low Neighborhood Attachment, and Personal Transitions and Mobility scored at the 56 and 59 marks, respectively. These two risk factor scales measure youth's feelings of positive bonding to their home community. For example, the Low Neighborhood Attachment scale is measured by questions such as: "I like my neighborhood," or: "If I had to move, I would miss the neighborhood I now live in." Bonding with the community works to reduce the likelihood that students will adopt antisocial norms, attitudes, or values. The risk factor Personal Transitions and Mobility measures specifically the number of times students have moved homes or schools in the past year and the past five years.
The elevation of these two scales indicates that Florida surveyed youth, in general, are not feeling a positive attachment towards their home communities. These two risk factors may be jointly elevated for several reasons. One reason is that Florida surveyed youth are reporting that they are moving significantly more often than youth in other states. Also, if a large number of families are moving in and out of communities, this can decrease the strength of emotional attachments in the community, and make the community feel less organized and cohesive. As always, at the local level, there may be factors specific to the community that serve to increase these risks.
On the other hand, surveyed youth did show suppressed levels of two other Community Domain risk factors: Laws & Norms Favorable to Alcohol, Tobacco and Other Drug Use, and Perceived Availability of Alcohol, Tobacco and Other Substances. These two scales scored significantly below the 50 mark, showing scores of 43 and 42, respectively. In other words, Florida surveyed youth reported that their home communities were strongly opposed to alcohol, tobacco and other drug use, and that they were less likely than youth in the CTC Six-State Study to know where they could get drugs if they wanted them. This suggests that Florida has a strong normative ethic opposing drug use.
Elevated risk scores are found at the state level in the Community Domain. Low Neighborhood Attachment, and Personal Transitions and Mobility scored at the 56 and 59 marks, respectively. These two risk factor scales measure whether youth feel positively bonded to their home community. The elevation of these two scales indicates that Florida- surveyed youth, in general, are not feeling a positive attachment towards their home communities. Florida surveyed youth reported that their home communities were strongly opposed to alcohol, tobacco and other drug use, and that they were less likely than youth in the CTC Six-State Study to know where they could get drugs if they wanted them.
(c) 2000 Florida Department of Children & Families Florida Youth Substance Abuse Survey 2000 Santa Rosa County Report
16
Thus, taken as a whole, the set of Community Domain risk factors probably has counterbalancing effects, sometimes increasing alcohol, tobacco and other drug use, sometimes decreasing use. If the elevated risk factors in the Community Domain could be reduced, then this would improve the overall net impact of Community Domain variables, taking advantage of Florida's strong norms against drug use. Outside of the Community Domain, only one risk factor, School Academic Failure, was significantly elevated, showing a score of 60.
A handful of other risk factors were suppressed (see Table 8). These include: Rebelliousness; Peer Rewards for Antisocial Behavior; Attitudes Favorable to Antisocial Behavior; and Perceived Risks of Drug Use. For all of these scales, students reported attitudes clearly unfavorable to alcohol, tobacco and other drug use. Again, analyzing the risk factor profile as a whole, including the suppressed Community Domain risk factors, Florida surveyed youth have developed strong negative attitudes toward alcohol, tobacco and other drug use and antisocial behavior in general. This is a strong positive feature of Florida's overall risk and protective factor profile.
This summarizes the significant variation at the state level from established norms for the risk and protective factors. As noted earlier, much of the variation in risk and protective factor values occur at the local and community level; state-level profiles typically are not that informative. The county-level data will provide significantly more information to local prevention planners, enabling them to both understand their communities better and to identify the most appropriate prevention strategies. It is expected that at the county level, general Florida trends will be reflected, with additional county-level variations apparent in the overall risk-factor and protective-factor profiles. Further analysis of the risk-factor and protective-factor scores and their relationship to alcohol, tobacco and other drug use is beyond the scope of this report.
Santa Rosa County Risk and Protective Factor Profile
Tables 7, 8, and 9, and Graphs 1, 2a and 2b display the risk-factor and protective-factor values for Santa Rosa County and Florida. Across all risk and protective factors for Santa Rosa County the average risk-factor score is 49 and the average protective- factor score is 51.
As can be seen on Graphs 1, 2a, and 2b, the Santa Rosa County risk-factor and protective-factor profile distinguishes itself in some ways from the Florida statewide profile. Note that there are some risk
Outside of the Community Domain, only one risk factor, Academic Failure, is significantly elevated, showing a score of 60. Analyzing the risk factor profile as a whole, including the suppressed Community Domain risk factors, Florida surveyed youth have developed strong negative attitudes toward alcohol, tobacco and other drug use and antisocial behavior in general. This is a strong positive feature of Florida's overall risk-factor and protective-factor profile. As can be seen on Graphs 1, 2a, and 2b, the Santa Rosa County risk-factor and protective-factor profile distinguishes itself in some ways from the Florida statewide profile.
(c) 2000 Florida Department of Children & Families Florida Youth Substance Abuse Survey 2000 Santa Rosa County Report
17
factors and protective factors that show little variation from county-to-county. For example, 95% of counties fall between 47 and 53 on the risk factor, Poor Family Supervision. Consequently, it should be noted that the Florida risk-factor and protective-factor profile is an important one to consider when assessing the profile for Santa Rosa County. This section will refer specifically to how Santa Rosa County differs from Florida and its similarly sized counties.
In the Community Domain (Graph 2a), Santa Rosa County falls above the state average on one of the six risk factors, Perceived Availability. Note that Perceived Availability appears most elevated compared to the Florida and the like-county averages. Perceived Availability assesses students' feelings about the ease of access that they have to alcohol, tobacco and other drugs. It is measured by five statements on the survey. A sample survey statement is: "If you wanted to get some marijuana, how easy would it be for you to get some?" Additionally, Personal Transitions and Mobility, although similar to the like-counties and the state averages, is significantly elevated in comparison to the national average.
Within the Family Domain (Graph 2a), Santa Rosa County appears to mimic the state profile with one important exception. Santa Rosa County students reported experiencing higher levels of Family History of Antisocial Behavior than the average student in Florida. This risk factor is measured by items such as: "Has anyone in your family ever had a severe alcohol or drug problem?" and: "How many adults have you known personally who in the past year have sold or dealt drugs?" Each measures students' perceptions of adult behaviors around drugs and other antisocial behaviors.
Within the School Domain (Graph 2a), Santa Rosa County appears to fall below the state average for the risk factor, Academic Failure. Although Santa Rosa County falls below the state average of 50, Academic Failure is still elevated compared to the national average. Low School Commitment is another risk factor where Santa Rosa County differs slightly from both the state and national averages. Low School Commitment, surveyed by items such as: "How important do you think the things you are learning in school are going to be for your later life?" measures bonding to the school system.
Within the Individual-Peer Domain (Graph 2b), the students of Santa Rosa County report experiencing similar levels of the risk factors associated with drug use and other problem behaviors. However, Sensation Seeking is quite elevated compared to the national, like-counties, and state averages. Impulsiveness appears elevated for most
In the Community Domain, Santa Rosa County falls above the state average on one of the six risk factors, Perceived Availability. .
(c) 2000 Florida Department of Children & Families Florida Youth Substance Abuse Survey 2000 Santa Rosa County Report
18
counties in Florida (as shown by a score that falls above the "gray bar" on Graph 2b). Friends' Use of Drugs and Peer Rewards for Antisocial Behavior, are both elevated above the state averages although they both fall on or below the national average.
The behavioral outcomes indices (Table 9 and Graph 2b) are scale measures of current alcohol, tobacco, and drug use; current antisocial behavior; and gang involvement. Predictably, given elevated levels of involvement with ATOD (see above), the Current Alcohol, Tobacco and Other Drug Use scale is slightly elevated above the state average. The remaining two outcome scales, Current Antisocial Behavior and Gang Involvement, are at or below the state level.
In terms of protective factors, Santa Rosa County appears similar to, or higher than, the state averages (Table 7 and Graph 1). The protective factor that appears to be slightly suppressed compared to the national average is, School Rewards for Prosocial Involvement. This protective factor is measured by items such as: "My teacher(s) notices me when I am doing a good job and lets me know about it?" Students in Santa Rosa County feel less rewarded at school than does the average student in the state.
Implications The success of the Florida Youth Substance Abuse Survey is the
result of tremendous efforts undertaken by a variety of departments and agencies in the state of Florida. Cooperation among the various contractors, state agencies, and the Executive Office of the Governor was crucial to bringing this process to fruition. The cooperation at the local level, as measured by the rates of participation, is considered unprecedented for this sort of endeavor.
It is important to note that the Santa Rosa County youth, while sharing many of the characteristics of youth in the rest of Florida, also show unique behavior traits.
One of the primary benefits of conducting the Florida Youth Substance Abuse Survey is that the data can be used as the baseline from which future prevention and intervention efforts can be assessed. Repeated assessments of Florida's student population, at regular intervals, will make it possible to identify program successes and program areas that may need improvement. The measurement of changes over time in risk and protective factors, substance use, and delinquency will provide the State of Florida and Santa Rosa County with a valuable management tool. The difficult task of developing and
In terms of protective factors, Santa Rosa County appears similar compared to the state averages
(c) 2000 Florida Department of Children & Families Florida Youth Substance Abuse Survey 2000 Santa Rosa County Report
19
implementing effective prevention programming will reveal the value and usefulness of this management tool.
(c) 2000 Florida Department of Children & Families Florida Youth Substance Abuse Survey 2000 Santa Rosa County Report
20
Appendix A: Florida Youth Survey 2000 Sampling Methodology
The Florida Youth Survey (FYS) 2000 was a self-administered, school-based survey of Florida public school students attending grades 6 through 12. Data were collected between November 28, 1999, and January 28, 2000. Students had 50 minutes in which to complete surveys. Out of 67 counties, 65 participated in the survey.
The survey sample was selected in a two-stage sampling process that built upon schools participating in the 1998 Florida Youth Tobacco Survey (FYTS), conducted by the Florida Department of Health. The 1998 FYTS used a two-stage cluster sample design within each of seven geographic regions (i.e., selecting schools within regions and classrooms within schools) for public middle schools (grades 6-8) and for public high schools (grades 9-12) to obtain representative samples of middle and high school students. Within each school, classrooms were randomized to receive the survey or not, and all students within selected classrooms were surveyed. This sample of 266 schools, selected with probability proportionate to size within each region, was maintained for the FYTS and for the FYS. However, the sample was augmented for the FYS 2000 in order to obtain representative samples of students in each of Florida's 67 counties. Thus, a second stage of school selection occurred within each county, with probability of selection proportionate to size, where each original FYTS school had a probability of selection equal to 1.0.
Because Florida's counties vary widely in population, with the number of students enrolled in public schools varying from a low of 1,172 in Glades county to a high of 360,118 in Miami-Dade county, the school and within school sample selection methodology varied by county. In the smallest counties, all schools and all students were selected to complete the survey. In the largest counties, only a sample of schools and classrooms within schools were selected to participate. The goal of the FYS 2000 was to survey all students in counties with fewer than 2400 middle and high school students, approximately 2400 middle and high school students attending six middle and four high schools in counties with enrolled populations up to 50,000, and approximately 5,000 middle and high school students attending 14 middle schools and 10 high schools in counties with more than 50,000 students. In the largest county, 25 middle schools and 13 high schools were selected to participate.
The survey sample was selected in a two-stage sampling process that built upon schools participating in the 1998 Florida Youth Tobacco Survey (FYTS), conducted by the Florida Department of Health. The 1998 FYTS used a two-stage cluster sample design within each of seven geographic regions to obtain representative samples of middle and high school students. Because Florida's counties vary widely in population, the school and within school sample selection methodology varied by county.
(c) 2000 Florida Department of Children & Families Florida Youth Substance Abuse Survey 2000 Santa Rosa County Report
21
The FYS 2000 effort fielded two survey instruments: the Communities that Care® Youth Survey, and the Florida Youth Tobacco Survey. Within each selected classroom, students were randomized to receive one survey instrument or the other. Survey instruments had identical covers and an equal number of pages, so as to be indistinguishable as they were handed out in classrooms.
The survey response rate was calculated based on the school and student response rate. The number of schools in which students participated was divided by the total number of schools selected to calculate the school response rate. The number of students who completed a survey was divided by the total number of students selected (based on school reports of the number of students enrolled in the selected classes) to calculate the student response rate. The overall survey response rate is the product of the school and student response rates. These school, student and overall response rates were calculated for the entire statewide survey effort, for the regional data (based on the original 266 FYTS schools), and for each county.
The data were weighted to provide estimates that can be generalized to all public school students in grades 6-12 in the state, the 15 administrative districts, and the counties, and to account for survey non-response.
The FYS 2000 effort fielded two survey instruments: the Communities that Care® Youth Survey, and the Florida Youth Tobacco Survey.
(c) 2000 Florida Department of Children & Families Florida Youth Substance Abuse Survey 2000 Santa Rosa County Report
22
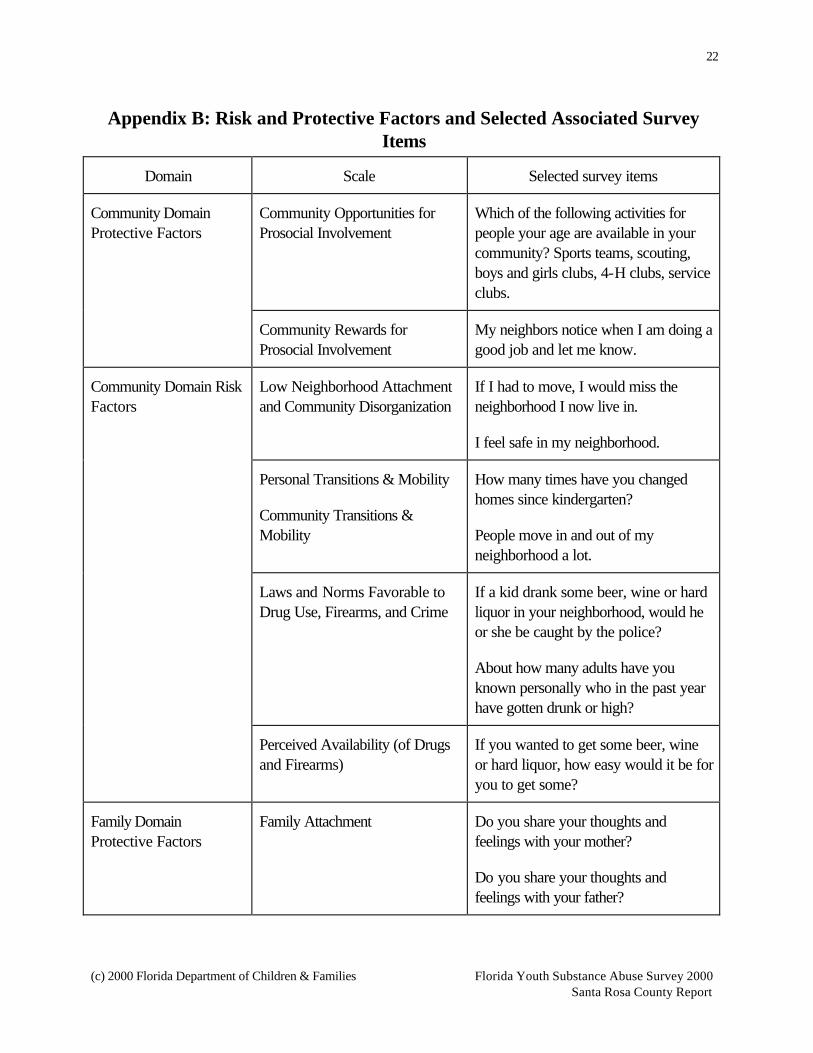
Appendix B: Risk and Protective Factors and Selected Associated Survey Items
Domain Scale Selected survey items
Community Domain Protective Factors
Community Opportunities for Prosocial Involvement
Which of the following activities for people your age are available in your community? Sports teams, scouting, boys and girls clubs, 4-H clubs, service clubs.
Community Rewards for Prosocial Involvement
My neighbors notice when I am doing a good job and let me know.
Community Domain Risk Factors
Low Neighborhood Attachment and Community Disorganization
If I had to move, I would miss the neighborhood I now live in.
I feel safe in my neighborhood.
Personal Transitions & Mobility
Community Transitions & Mobility
How many times have you changed homes since kindergarten?
People move in and out of my neighborhood a lot.
Laws and Norms Favorable to Drug Use, Firearms, and Crime
If a kid drank some beer, wine or hard liquor in your neighborhood, would he or she be caught by the police?
About how many adults have you known personally who in the past year have gotten drunk or high?
Perceived Availability (of Drugs and Firearms)
If you wanted to get some beer, wine or hard liquor, how easy would it be for you to get some?
Family Domain Protective Factors
Family Attachment Do you share your thoughts and feelings with your mother?
Do you share your thoughts and feelings with your father?
(c) 2000 Florida Department of Children & Families Florida Youth Substance Abuse Survey 2000 Santa Rosa County Report
23
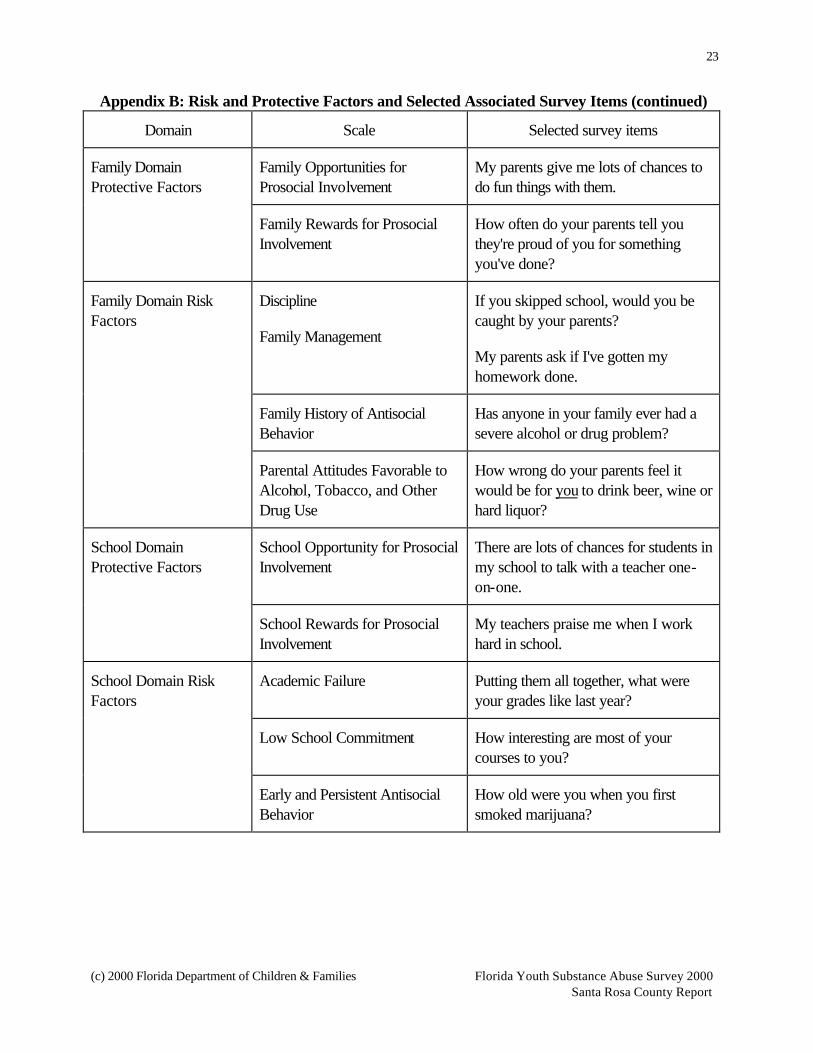
Appendix B: Risk and Protective Factors and Selected Associated Survey Items (continued)
Domain Scale Selected survey items
Family Domain Protective Factors
Family Opportunities for Prosocial Involvement
My parents give me lots of chances to do fun things with them.
Family Rewards for Prosocial Involvement
How often do your parents tell you they're proud of you for something you've done?
Family Domain Risk Factors
Discipline
Family Management
If you skipped school, would you be caught by your parents?
My parents ask if I've gotten my homework done.
Family History of Antisocial Behavior
Has anyone in your family ever had a severe alcohol or drug problem?
Parental Attitudes Favorable to Alcohol, Tobacco, and Other Drug Use
How wrong do your parents feel it would be for you to drink beer, wine or hard liquor?
School Domain Protective Factors
School Opportunity for Prosocial Involvement
There are lots of chances for students in my school to talk with a teacher one-on-one.
School Rewards for Prosocial Involvement
My teachers praise me when I work hard in school.
School Domain Risk Factors
Academic Failure Putting them all together, what were your grades like last year?
Low School Commitment How interesting are most of your courses to you?
Early and Persistent Antisocial Behavior
How old were you when you first smoked marijuana?
(c) 2000 Florida Department of Children & Families Florida Youth Substance Abuse Survey 2000 Santa Rosa County Report
24
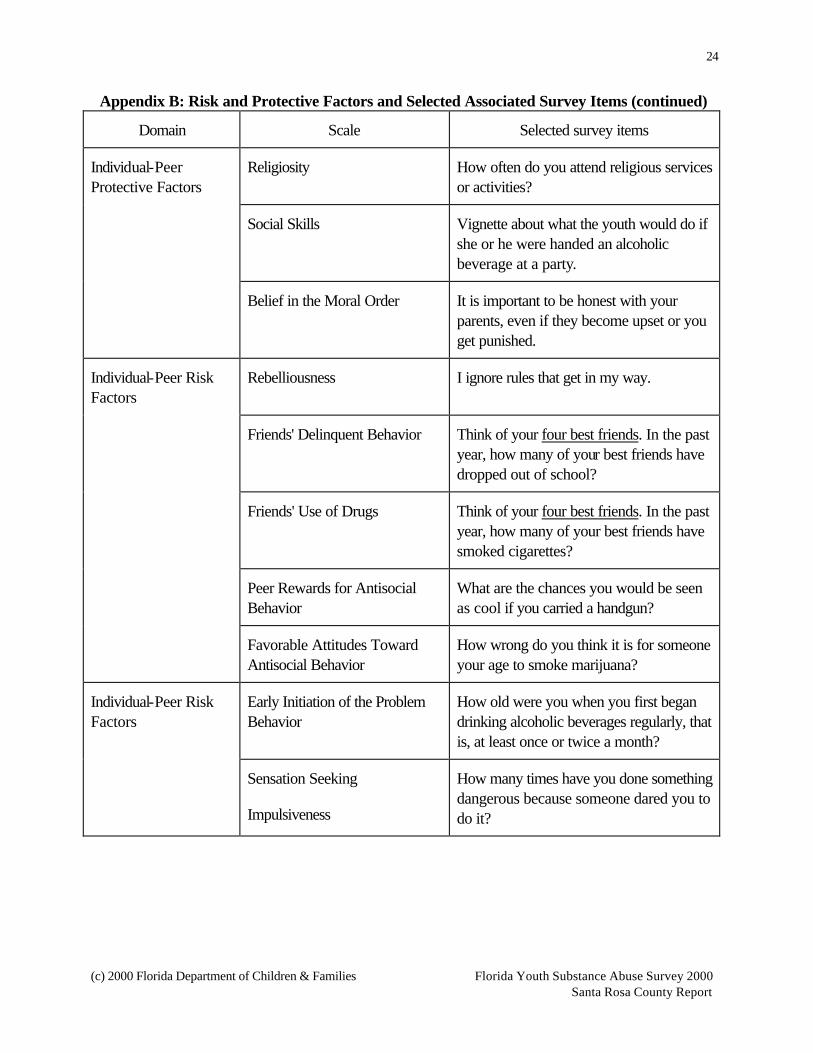
Appendix B: Risk and Protective Factors and Selected Associated Survey Items (continued)
Domain Scale Selected survey items
Individual-Peer Protective Factors
Religiosity How often do you attend religious services or activities?
Social Skills Vignette about what the youth would do if she or he were handed an alcoholic beverage at a party.
Belief in the Moral Order It is important to be honest with your parents, even if they become upset or you get punished.
Individual-Peer Risk Factors
Rebelliousness I ignore rules that get in my way.
Friends' Delinquent Behavior Think of your four best friends. In the past year, how many of your best friends have dropped out of school?
Friends' Use of Drugs Think of your four best friends. In the past year, how many of your best friends have smoked cigarettes?
Peer Rewards for Antisocial Behavior
What are the chances you would be seen as cool if you carried a handgun?
Favorable Attitudes Toward Antisocial Behavior
How wrong do you think it is for someone your age to smoke marijuana?
Individual-Peer Risk Factors
Early Initiation of the Problem Behavior
How old were you when you first began drinking alcoholic beverages regularly, that is, at least once or twice a month?
Sensation Seeking
Impulsiveness
How many times have you done something dangerous because someone dared you to do it?
(c) 2000 Florida Department of Children & Families Florida Youth Substance Abuse Survey 2000 Santa Rosa County Report
25
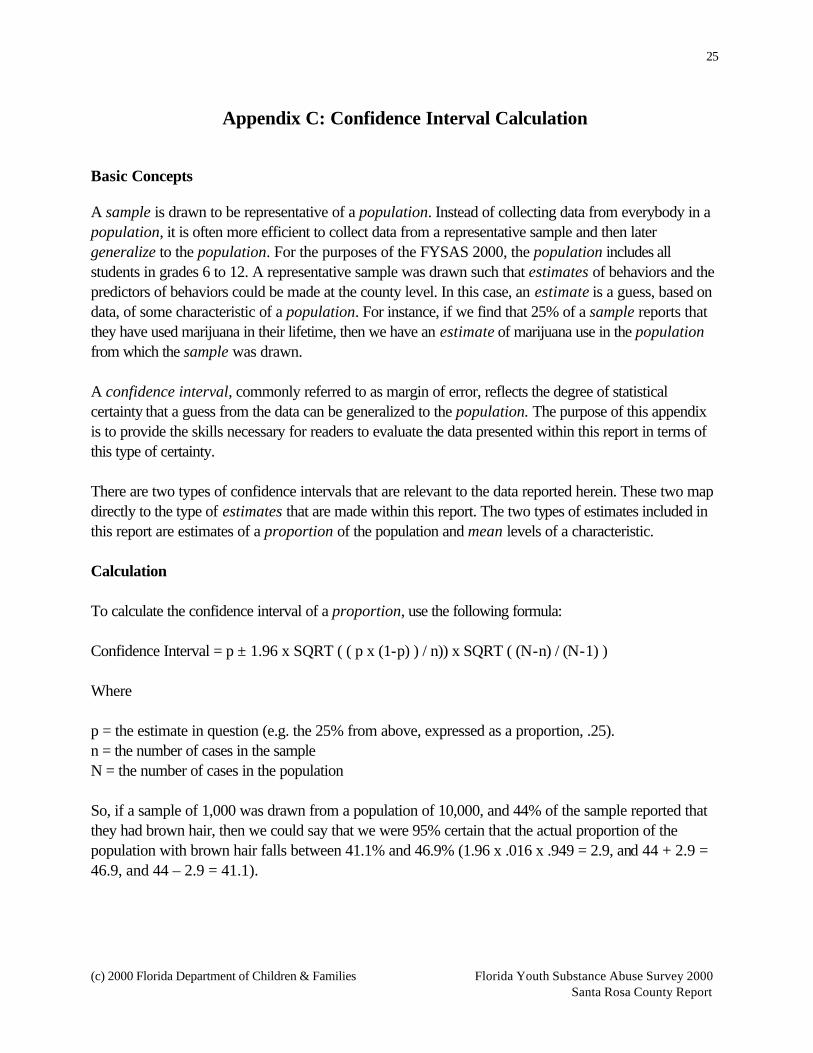
Appendix C: Confidence Interval Calculation Basic Concepts A sample is drawn to be representative of a population. Instead of collecting data from everybody in a population, it is often more efficient to collect data from a representative sample and then later generalize to the population. For the purposes of the FYSAS 2000, the population includes all students in grades 6 to 12. A representative sample was drawn such that estimates of behaviors and the predictors of behaviors could be made at the county level. In this case, an estimate is a guess, based on data, of some characteristic of a population. For instance, if we find that 25% of a sample reports that they have used marijuana in their lifetime, then we have an estimate of marijuana use in the population from which the sample was drawn. A confidence interval, commonly referred to as margin of error, reflects the degree of statistical certainty that a guess from the data can be generalized to the population. The purpose of this appendix is to provide the skills necessary for readers to evaluate the data presented within this report in terms of this type of certainty. There are two types of confidence intervals that are relevant to the data reported herein. These two map directly to the type of estimates that are made within this report. The two types of estimates included in this report are estimates of a proportion of the population and mean levels of a characteristic. Calculation To calculate the confidence interval of a proportion, use the following formula: Confidence Interval = p ± 1.96 x SQRT ( ( p x (1-p) ) / n)) x SQRT ( (N-n) / (N-1) ) Where p = the estimate in question (e.g. the 25% from above, expressed as a proportion, .25). n = the number of cases in the sample N = the number of cases in the population So, if a sample of 1,000 was drawn from a population of 10,000, and 44% of the sample reported that they had brown hair, then we could say that we were 95% certain that the actual proportion of the population with brown hair falls between 41.1% and 46.9% (1.96 x .016 x .949 = 2.9, and 44 + 2.9 = 46.9, and 44 – 2.9 = 41.1).
(c) 2000 Florida Department of Children & Families Florida Youth Substance Abuse Survey 2000 Santa Rosa County Report
26
The confidence interval for a mean (mean age, or mean levels of a specific risk, or protective, factor) requires the standard deviation of the mean to calculate. For the calculation of the confidence interval of a mean, use the following formula. Confidence Interval = 1.96 x standard deviation / SQRT(n) x SQRT ( (N-n) / (N-1) ) Interpretation Again, the confidence interval provides the reader with a level of statistical certainty about a given estimate. This certainty (or lack thereof) is an important consideration when talking about generalizing from a sample to a population. Whenever a sample is drawn, there is always the chance that bias can occur. Confidence intervals are generated to directly measure this chance. There is no right or wrong answer to the question "how wide is too wide" when it comes to confidence intervals. In some instances, an error can be disastrous or costly; in other instances, errors may not be so problematic. For instance, while an error of ±7% may be fine for estimating the number of people who like one political candidate or another, it is definitely not acceptable for decisions regarding the incidence of a disease within a population. Confidence intervals are also useful when comparing two estimates. For instance, if the estimate for marijuana use by males is 24% and the estimate for marijuana use by females is 30%, we know only that the difference is 6%. However, if we knew that the confidence interval around these estimates was ±2%, then we would be 95% sure that between 22% and 26% of males, and between 28% and 32% of females have used marijuana. Conversely, if the confidence interval was ±8%, then the results would overlap (males 16% to 32%; females 22% to 38%) and we would not be sure that the use rates of males and females in the population were really different or different just by chance.
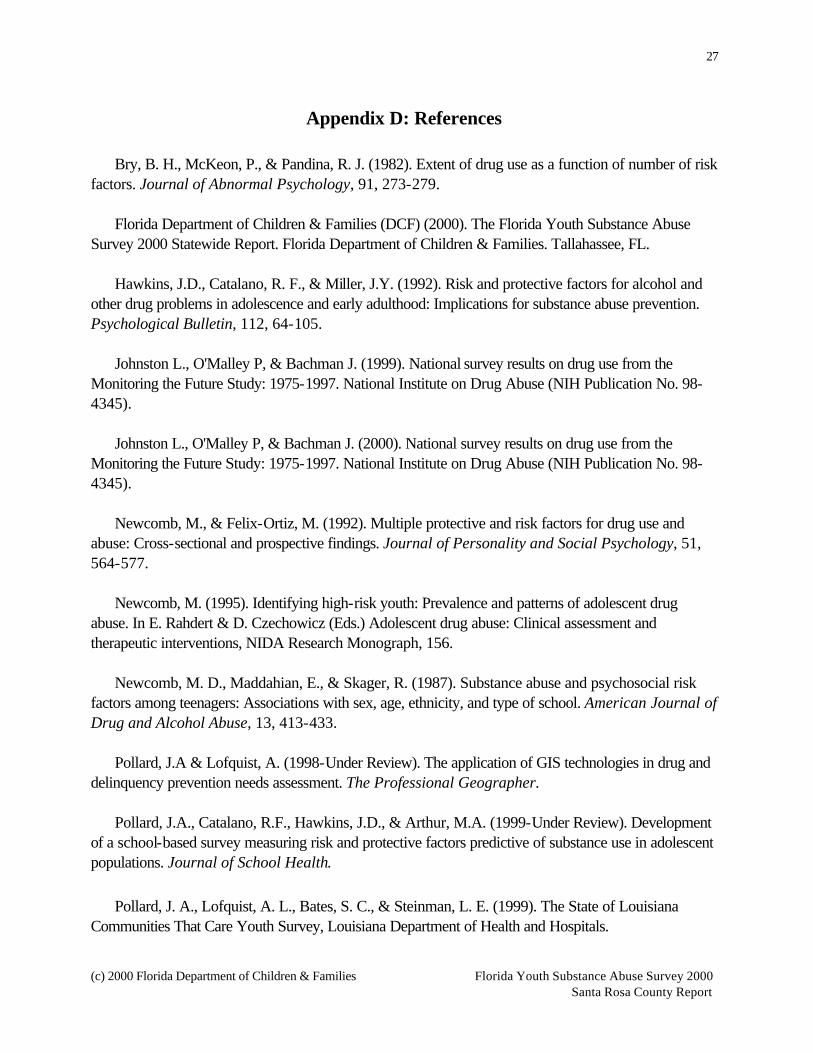
(c) 2000 Florida Department of Children & Families Florida Youth Substance Abuse Survey 2000 Santa Rosa County Report
27
Appendix D: References Bry, B. H., McKeon, P., & Pandina, R. J. (1982). Extent of drug use as a function of number of risk
factors. Journal of Abnormal Psychology, 91, 273-279. Florida Department of Children & Families (DCF) (2000). The Florida Youth Substance Abuse
Survey 2000 Statewide Report. Florida Department of Children & Families. Tallahassee, FL. Hawkins, J.D., Catalano, R. F., & Miller, J.Y. (1992). Risk and protective factors for alcohol and
other drug problems in adolescence and early adulthood: Implications for substance abuse prevention. Psychological Bulletin, 112, 64-105.
Johnston L., O'Malley P, & Bachman J. (1999). National survey results on drug use from the
Monitoring the Future Study: 1975-1997. National Institute on Drug Abuse (NIH Publication No. 98-4345).
Johnston L., O'Malley P, & Bachman J. (2000). National survey results on drug use from the
Monitoring the Future Study: 1975-1997. National Institute on Drug Abuse (NIH Publication No. 98-4345).
Newcomb, M., & Felix-Ortiz, M. (1992). Multiple protective and risk factors for drug use and
abuse: Cross-sectional and prospective findings. Journal of Personality and Social Psychology, 51, 564-577.
Newcomb, M. (1995). Identifying high-risk youth: Prevalence and patterns of adolescent drug
abuse. In E. Rahdert & D. Czechowicz (Eds.) Adolescent drug abuse: Clinical assessment and therapeutic interventions, NIDA Research Monograph, 156.
Newcomb, M. D., Maddahian, E., & Skager, R. (1987). Substance abuse and psychosocial risk
factors among teenagers: Associations with sex, age, ethnicity, and type of school. American Journal of Drug and Alcohol Abuse, 13, 413-433.
Pollard, J.A & Lofquist, A. (1998-Under Review). The application of GIS technologies in drug and
delinquency prevention needs assessment. The Professional Geographer. Pollard, J.A., Catalano, R.F., Hawkins, J.D., & Arthur, M.A. (1999-Under Review). Development
of a school-based survey measuring risk and protective factors predictive of substance use in adolescent populations. Journal of School Health.
Pollard, J. A., Lofquist, A. L., Bates, S. C., & Steinman, L. E. (1999). The State of Louisiana Communities That Care Youth Survey, Louisiana Department of Health and Hospitals.
(c) 2000 Florida Department of Children & Families Florida Youth Substance Abuse Survey 2000 Santa Rosa County Report
28
Steffensmeier, D. J., & Allan, E. (1995). Criminal Behavior: Gender and Age. In Joseph F. Sheley (Ed.), Criminology: A Contemporary Handbook (2nd Edition). Belmont, CA: Wadsworth.
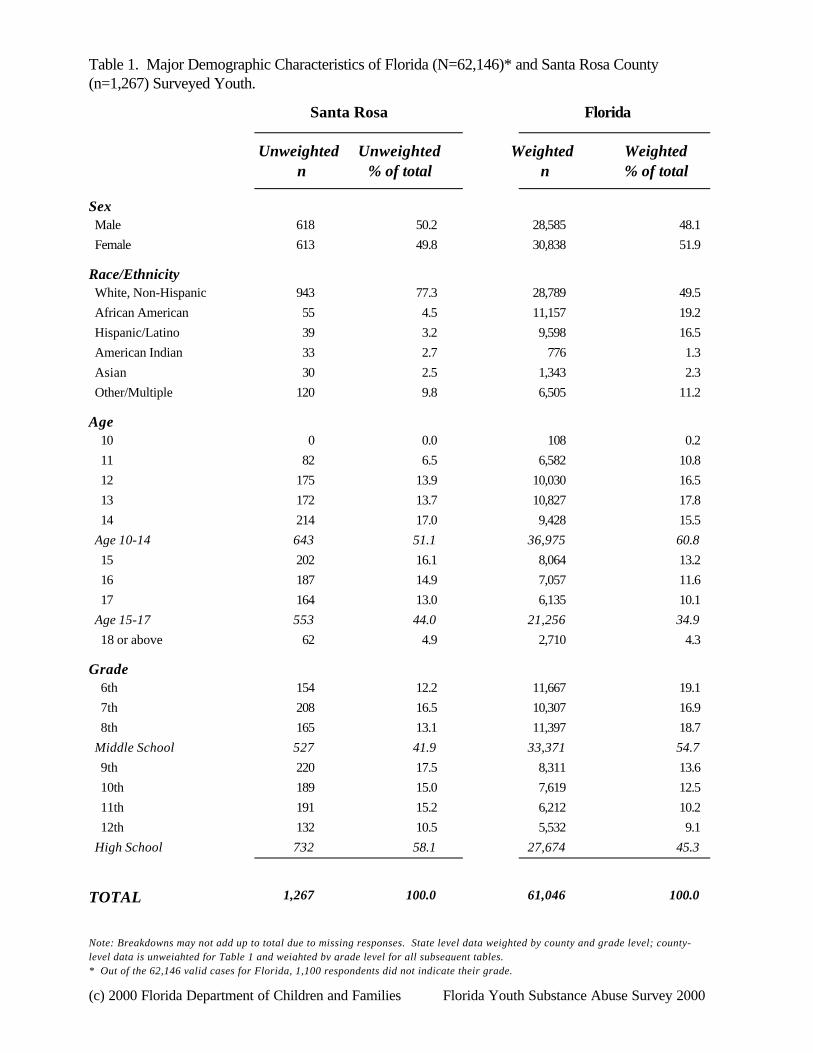
Santa Rosa Florida
Table 1. Major Demographic Characteristics of Florida (N=62,146)* and Santa Rosa County (n=1,267) Surveyed Youth.
Unweighted% of total n % of totaln
Unweighted Weighted Weighted
Sex Male 618 50.2 28,585 48.1 Female 613 49.8 30,838 51.9
Race/Ethnicity White, Non-Hispanic 943 77.3 28,789 49.5 African American 55 4.5 11,157 19.2 Hispanic/Latino 39 3.2 9,598 16.5 American Indian 33 2.7 776 1.3 Asian 30 2.5 1,343 2.3 Other/Multiple 120 9.8 6,505 11.2
Age 10 0 0.0 108 0.2 11 82 6.5 6,582 10.8 12 175 13.9 10,030 16.5 13 172 13.7 10,827 17.8 14 214 17.0 9,428 15.5 Age 10-14 643 51.1 36,975 60.8 15 202 16.1 8,064 13.2 16 187 14.9 7,057 11.6 17 164 13.0 6,135 10.1 Age 15-17 553 44.0 21,256 34.9 18 or above 62 4.9 2,710 4.3
Grade 6th 154 12.2 11,667 19.1 7th 208 16.5 10,307 16.9 8th 165 13.1 11,397 18.7 Middle School 527 41.9 33,371 54.7 9th 220 17.5 8,311 13.6 10th 189 15.0 7,619 12.5 11th 191 15.2 6,212 10.2 12th 132 10.5 5,532 9.1 High School 732 58.1 27,674 45.3
TOTAL 1,267 100.0 61,046 100.0
(c) 2000 Florida Department of Children and Families Florida Youth Substance Abuse Survey 2000
Note: Breakdowns may not add up to total due to missing responses. State level data weighted by county and grade level; county-level data is unweighted for Table 1 and weighted by grade level for all subsequent tables. * Out of the 62,146 valid cases for Florida, 1,100 respondents did not indicate their grade.
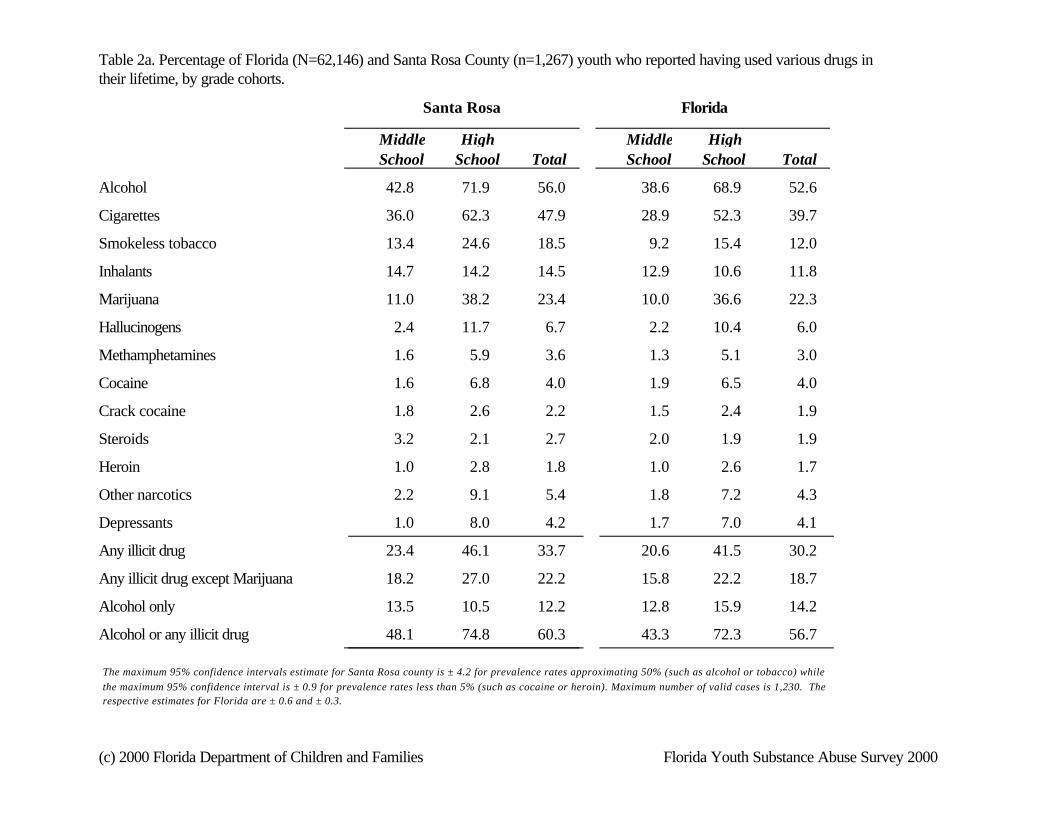
Table 2a. Percentage of Florida (N=62,146) and Santa Rosa County (n=1,267) youth who reported having used various drugs in their lifetime, by grade cohorts.
Santa Rosa Florida
TotalMiddle High
TotalSchool SchoolMiddle HighSchool School
Alcohol 42.8 71.9 56.0 38.6 68.9 52.6
Cigarettes 36.0 62.3 47.9 28.9 52.3 39.7
Smokeless tobacco 13.4 24.6 18.5 9.2 15.4 12.0
Inhalants 14.7 14.2 14.5 12.9 10.6 11.8
Marijuana 11.0 38.2 23.4 10.0 36.6 22.3
Hallucinogens 2.4 11.7 6.7 2.2 10.4 6.0
Methamphetamines 1.6 5.9 3.6 1.3 5.1 3.0
Cocaine 1.6 6.8 4.0 1.9 6.5 4.0
Crack cocaine 1.8 2.6 2.2 1.5 2.4 1.9
Steroids 3.2 2.1 2.7 2.0 1.9 1.9
Heroin 1.0 2.8 1.8 1.0 2.6 1.7
Other narcotics 2.2 9.1 5.4 1.8 7.2 4.3
Depressants 1.0 8.0 4.2 1.7 7.0 4.1
Any illicit drug 23.4 46.1 33.7 20.6 41.5 30.2
Any illicit drug except Marijuana 18.2 27.0 22.2 15.8 22.2 18.7
Alcohol only 13.5 10.5 12.2 12.8 15.9 14.2
Alcohol or any illicit drug 48.1 74.8 60.3 43.3 72.3 56.7
The maximum 95% confidence intervals estimate for Santa Rosa county is ± 4.2 for prevalence rates approximating 50% (such as alcohol or tobacco) while the maximum 95% confidence interval is ± 0.9 for prevalence rates less than 5% (such as cocaine or heroin). Maximum number of valid cases is 1,230. The respective estimates for Florida are ± 0.6 and ± 0.3.
(c) 2000 Florida Department of Children and Families Florida Youth Substance Abuse Survey 2000
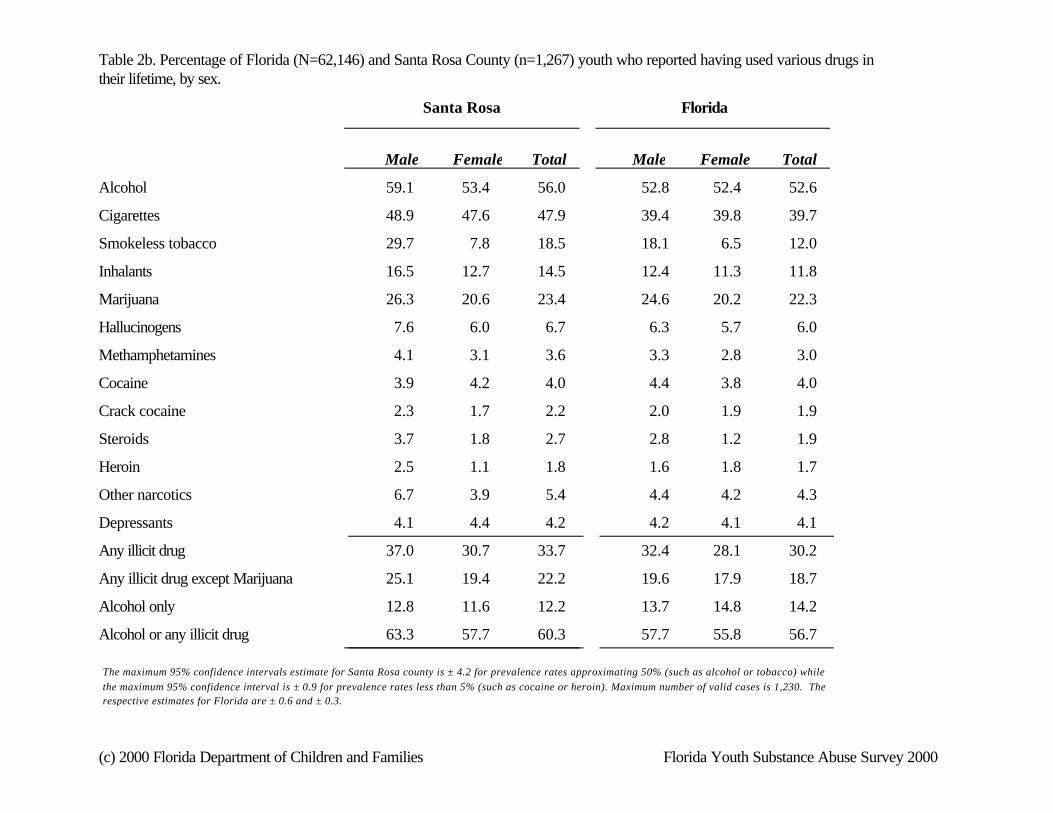
Table 2b. Percentage of Florida (N=62,146) and Santa Rosa County (n=1,267) youth who reported having used various drugs in their lifetime, by sex.
Santa Rosa Florida
Total TotalMale Female Male Female
Alcohol 59.1 53.4 56.0 52.8 52.4 52.6
Cigarettes 48.9 47.6 47.9 39.4 39.8 39.7
Smokeless tobacco 29.7 7.8 18.5 18.1 6.5 12.0
Inhalants 16.5 12.7 14.5 12.4 11.3 11.8
Marijuana 26.3 20.6 23.4 24.6 20.2 22.3
Hallucinogens 7.6 6.0 6.7 6.3 5.7 6.0
Methamphetamines 4.1 3.1 3.6 3.3 2.8 3.0
Cocaine 3.9 4.2 4.0 4.4 3.8 4.0
Crack cocaine 2.3 1.7 2.2 2.0 1.9 1.9
Steroids 3.7 1.8 2.7 2.8 1.2 1.9
Heroin 2.5 1.1 1.8 1.6 1.8 1.7
Other narcotics 6.7 3.9 5.4 4.4 4.2 4.3
Depressants 4.1 4.4 4.2 4.2 4.1 4.1
Any illicit drug 37.0 30.7 33.7 32.4 28.1 30.2
Any illicit drug except Marijuana 25.1 19.4 22.2 19.6 17.9 18.7
Alcohol only 12.8 11.6 12.2 13.7 14.8 14.2
Alcohol or any illicit drug 63.3 57.7 60.3 57.7 55.8 56.7
The maximum 95% confidence intervals estimate for Santa Rosa county is ± 4.2 for prevalence rates approximating 50% (such as alcohol or tobacco) while the maximum 95% confidence interval is ± 0.9 for prevalence rates less than 5% (such as cocaine or heroin). Maximum number of valid cases is 1,230. The respective estimates for Florida are ± 0.6 and ± 0.3.
(c) 2000 Florida Department of Children and Families Florida Youth Substance Abuse Survey 2000
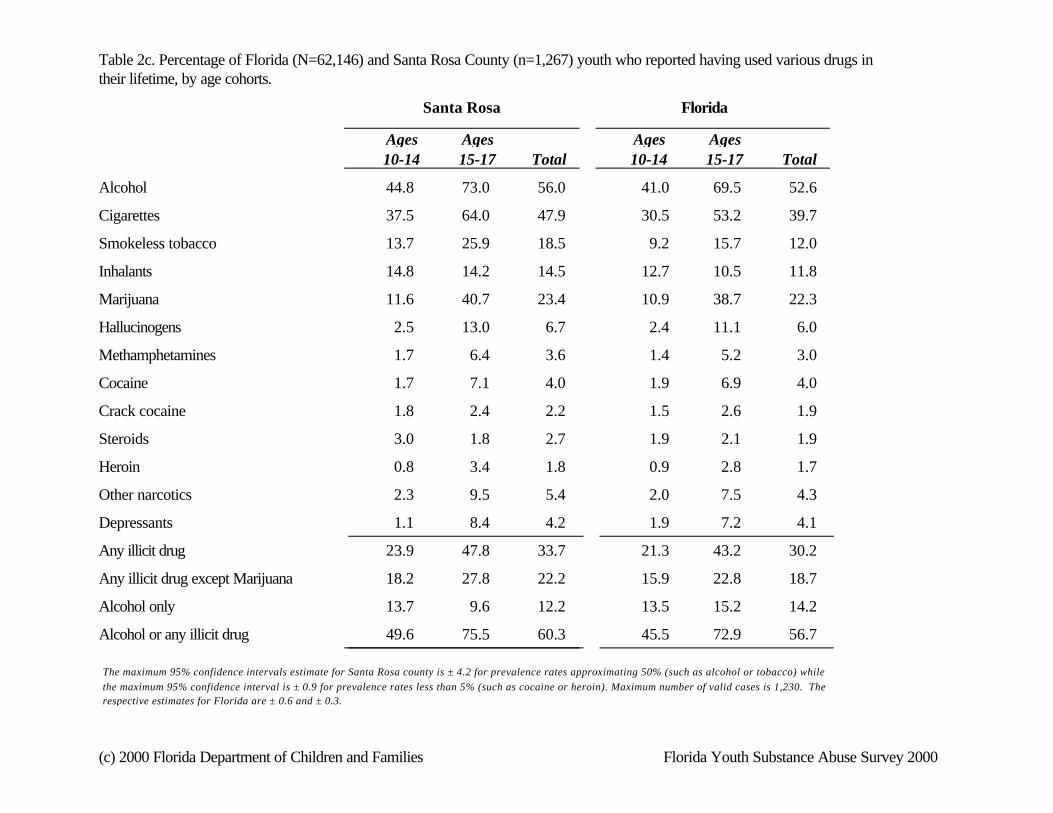
Table 2c. Percentage of Florida (N=62,146) and Santa Rosa County (n=1,267) youth who reported having used various drugs in their lifetime, by age cohorts.
Santa Rosa Florida
TotalAges Ages
Total10-14 15-17Ages Ages10-14 15-17
Alcohol 44.8 73.0 56.0 41.0 69.5 52.6
Cigarettes 37.5 64.0 47.9 30.5 53.2 39.7
Smokeless tobacco 13.7 25.9 18.5 9.2 15.7 12.0
Inhalants 14.8 14.2 14.5 12.7 10.5 11.8
Marijuana 11.6 40.7 23.4 10.9 38.7 22.3
Hallucinogens 2.5 13.0 6.7 2.4 11.1 6.0
Methamphetamines 1.7 6.4 3.6 1.4 5.2 3.0
Cocaine 1.7 7.1 4.0 1.9 6.9 4.0
Crack cocaine 1.8 2.4 2.2 1.5 2.6 1.9
Steroids 3.0 1.8 2.7 1.9 2.1 1.9
Heroin 0.8 3.4 1.8 0.9 2.8 1.7
Other narcotics 2.3 9.5 5.4 2.0 7.5 4.3
Depressants 1.1 8.4 4.2 1.9 7.2 4.1
Any illicit drug 23.9 47.8 33.7 21.3 43.2 30.2
Any illicit drug except Marijuana 18.2 27.8 22.2 15.9 22.8 18.7
Alcohol only 13.7 9.6 12.2 13.5 15.2 14.2
Alcohol or any illicit drug 49.6 75.5 60.3 45.5 72.9 56.7
The maximum 95% confidence intervals estimate for Santa Rosa county is ± 4.2 for prevalence rates approximating 50% (such as alcohol or tobacco) while the maximum 95% confidence interval is ± 0.9 for prevalence rates less than 5% (such as cocaine or heroin). Maximum number of valid cases is 1,230. The respective estimates for Florida are ± 0.6 and ± 0.3.
(c) 2000 Florida Department of Children and Families Florida Youth Substance Abuse Survey 2000
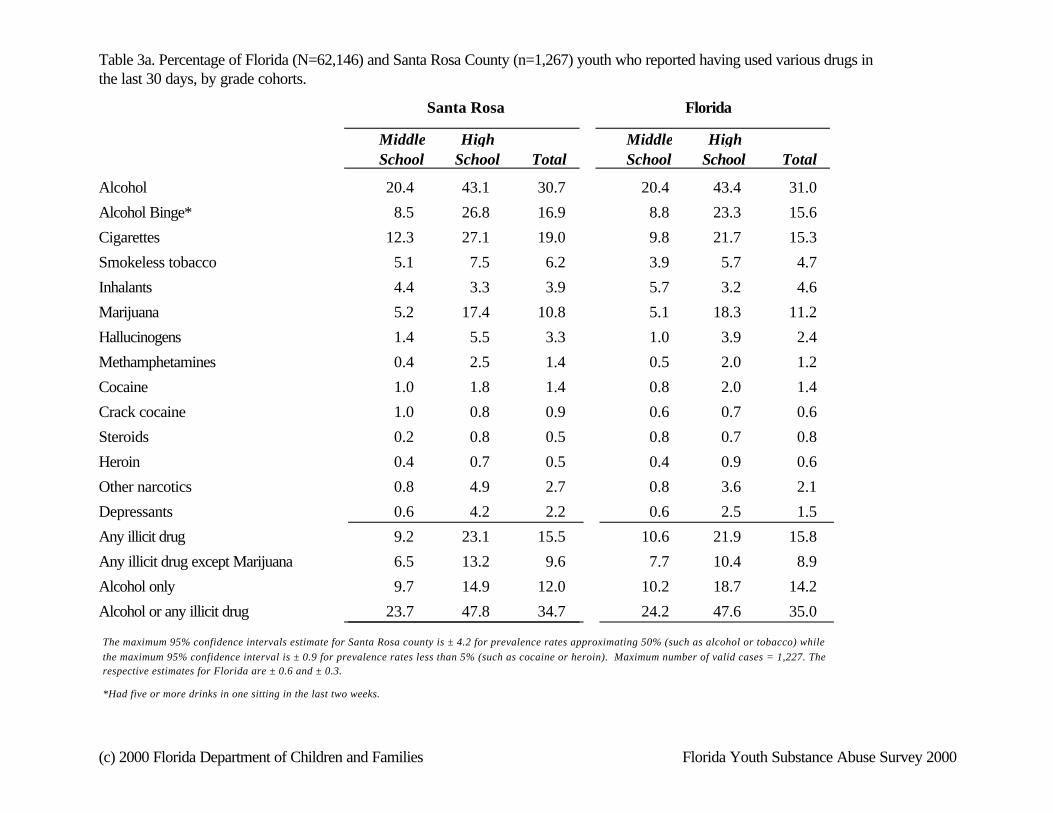
Table 3a. Percentage of Florida (N=62,146) and Santa Rosa County (n=1,267) youth who reported having used various drugs in the last 30 days, by grade cohorts.
Santa Rosa Florida
TotalMiddle High
TotalSchool SchoolMiddle HighSchool School
Alcohol 20.4 43.1 30.7 20.4 43.4 31.0
Alcohol Binge* 8.5 26.8 16.9 8.8 23.3 15.6
Cigarettes 12.3 27.1 19.0 9.8 21.7 15.3
Smokeless tobacco 5.1 7.5 6.2 3.9 5.7 4.7
Inhalants 4.4 3.3 3.9 5.7 3.2 4.6
Marijuana 5.2 17.4 10.8 5.1 18.3 11.2
Hallucinogens 1.4 5.5 3.3 1.0 3.9 2.4
Methamphetamines 0.4 2.5 1.4 0.5 2.0 1.2
Cocaine 1.0 1.8 1.4 0.8 2.0 1.4
Crack cocaine 1.0 0.8 0.9 0.6 0.7 0.6
Steroids 0.2 0.8 0.5 0.8 0.7 0.8
Heroin 0.4 0.7 0.5 0.4 0.9 0.6
Other narcotics 0.8 4.9 2.7 0.8 3.6 2.1
Depressants 0.6 4.2 2.2 0.6 2.5 1.5
Any illicit drug 9.2 23.1 15.5 10.6 21.9 15.8
Any illicit drug except Marijuana 6.5 13.2 9.6 7.7 10.4 8.9
Alcohol only 9.7 14.9 12.0 10.2 18.7 14.2
Alcohol or any illicit drug 23.7 47.8 34.7 24.2 47.6 35.0
The maximum 95% confidence intervals estimate for Santa Rosa county is ± 4.2 for prevalence rates approximating 50% (such as alcohol or tobacco) while the maximum 95% confidence interval is ± 0.9 for prevalence rates less than 5% (such as cocaine or heroin). Maximum number of valid cases = 1,227. The respective estimates for Florida are ± 0.6 and ± 0.3.
*Had five or more drinks in one sitting in the last two weeks.
(c) 2000 Florida Department of Children and Families Florida Youth Substance Abuse Survey 2000

Table 3b. Percentage of Florida (N=62,146) and Santa Rosa County (n=1,267) youth who reported having used various drugs in the last 30 days, by sex.
Santa Rosa Florida
Total TotalMale Female Male Female
Alcohol 32.5 29.3 30.7 31.2 30.7 31.0
Alcohol Binge* 19.7 14.6 16.9 17.4 14.0 15.6
Cigarettes 20.2 18.1 19.0 15.2 15.3 15.3
Smokeless tobacco 10.9 1.7 6.2 7.3 2.4 4.7
Inhalants 4.8 3.0 3.9 4.8 4.3 4.6
Marijuana 13.2 8.5 10.8 13.0 9.6 11.2
Hallucinogens 3.8 2.9 3.3 2.6 2.1 2.4
Methamphetamines 1.8 0.9 1.4 1.4 1.0 1.2
Cocaine 1.6 1.2 1.4 1.6 1.2 1.4
Crack cocaine 1.1 0.8 0.9 0.6 0.6 0.6
Steroids 0.8 0.3 0.5 1.1 0.5 0.8
Heroin 0.7 0.3 0.5 0.7 0.6 0.6
Other narcotics 3.5 1.7 2.7 2.2 2.0 2.1
Depressants 2.2 2.4 2.2 1.5 1.4 1.5
Any illicit drug 18.7 12.5 15.5 17.6 14.1 15.8
Any illicit drug except Marijuana 11.5 7.7 9.6 9.6 8.3 8.9
Alcohol only 10.7 13.1 12.0 13.2 15.0 14.2
Alcohol or any illicit drug 37.3 32.4 34.7 35.7 34.2 35.0
The maximum 95% confidence intervals estimate for Santa Rosa county is ± 4.2 for prevalence rates approximating 50% (such as alcohol or tobacco) while the maximum 95% confidence interval is ± 0.9 for prevalence rates less than 5% (such as cocaine or heroin). Maximum number of valid cases = 1,227. The respective estimates for Florida are ± 0.6 and ± 0.3.
*Had five or more drinks in one sitting in the last two weeks.
(c) 2000 Florida Department of Children and Families Florida Youth Substance Abuse Survey 2000
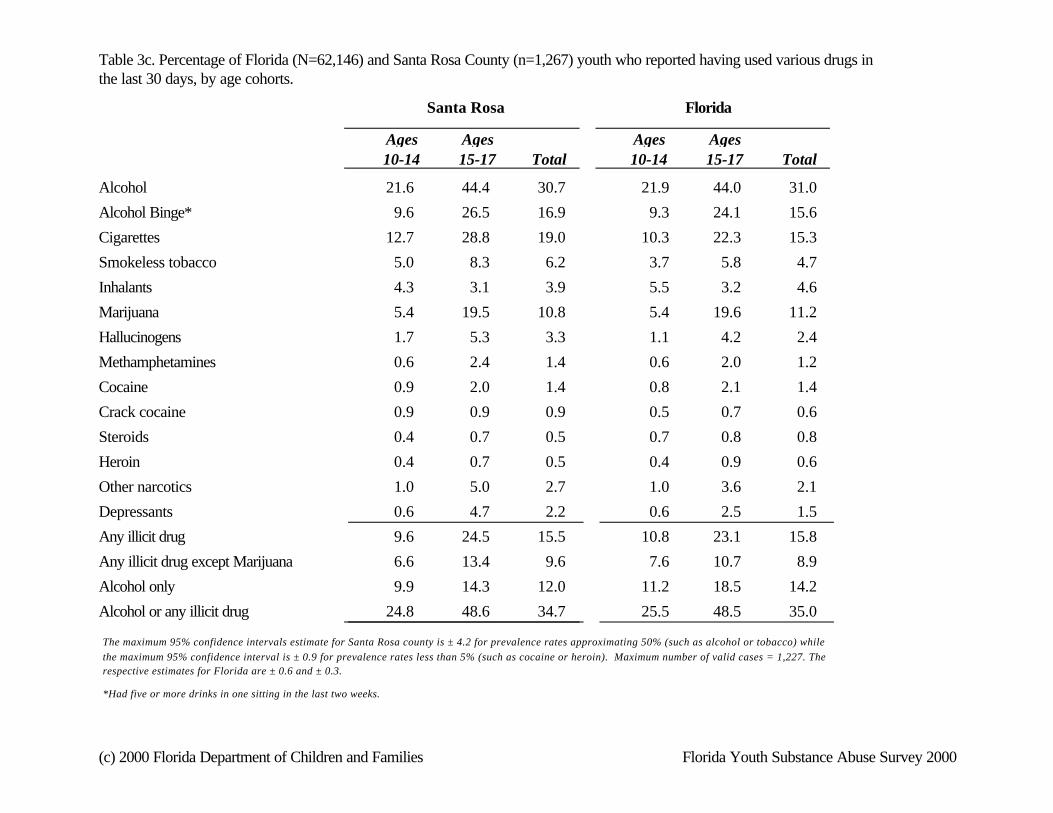
Table 3c. Percentage of Florida (N=62,146) and Santa Rosa County (n=1,267) youth who reported having used various drugs in the last 30 days, by age cohorts.
Santa Rosa Florida
TotalAges Ages
Total10-14 15-17Ages Ages10-14 15-17
Alcohol 21.6 44.4 30.7 21.9 44.0 31.0
Alcohol Binge* 9.6 26.5 16.9 9.3 24.1 15.6
Cigarettes 12.7 28.8 19.0 10.3 22.3 15.3
Smokeless tobacco 5.0 8.3 6.2 3.7 5.8 4.7
Inhalants 4.3 3.1 3.9 5.5 3.2 4.6
Marijuana 5.4 19.5 10.8 5.4 19.6 11.2
Hallucinogens 1.7 5.3 3.3 1.1 4.2 2.4
Methamphetamines 0.6 2.4 1.4 0.6 2.0 1.2
Cocaine 0.9 2.0 1.4 0.8 2.1 1.4
Crack cocaine 0.9 0.9 0.9 0.5 0.7 0.6
Steroids 0.4 0.7 0.5 0.7 0.8 0.8
Heroin 0.4 0.7 0.5 0.4 0.9 0.6
Other narcotics 1.0 5.0 2.7 1.0 3.6 2.1
Depressants 0.6 4.7 2.2 0.6 2.5 1.5
Any illicit drug 9.6 24.5 15.5 10.8 23.1 15.8
Any illicit drug except Marijuana 6.6 13.4 9.6 7.6 10.7 8.9
Alcohol only 9.9 14.3 12.0 11.2 18.5 14.2
Alcohol or any illicit drug 24.8 48.6 34.7 25.5 48.5 35.0
The maximum 95% confidence intervals estimate for Santa Rosa county is ± 4.2 for prevalence rates approximating 50% (such as alcohol or tobacco) while the maximum 95% confidence interval is ± 0.9 for prevalence rates less than 5% (such as cocaine or heroin). Maximum number of valid cases = 1,227. The respective estimates for Florida are ± 0.6 and ± 0.3.
*Had five or more drinks in one sitting in the last two weeks.
(c) 2000 Florida Department of Children and Families Florida Youth Substance Abuse Survey 2000
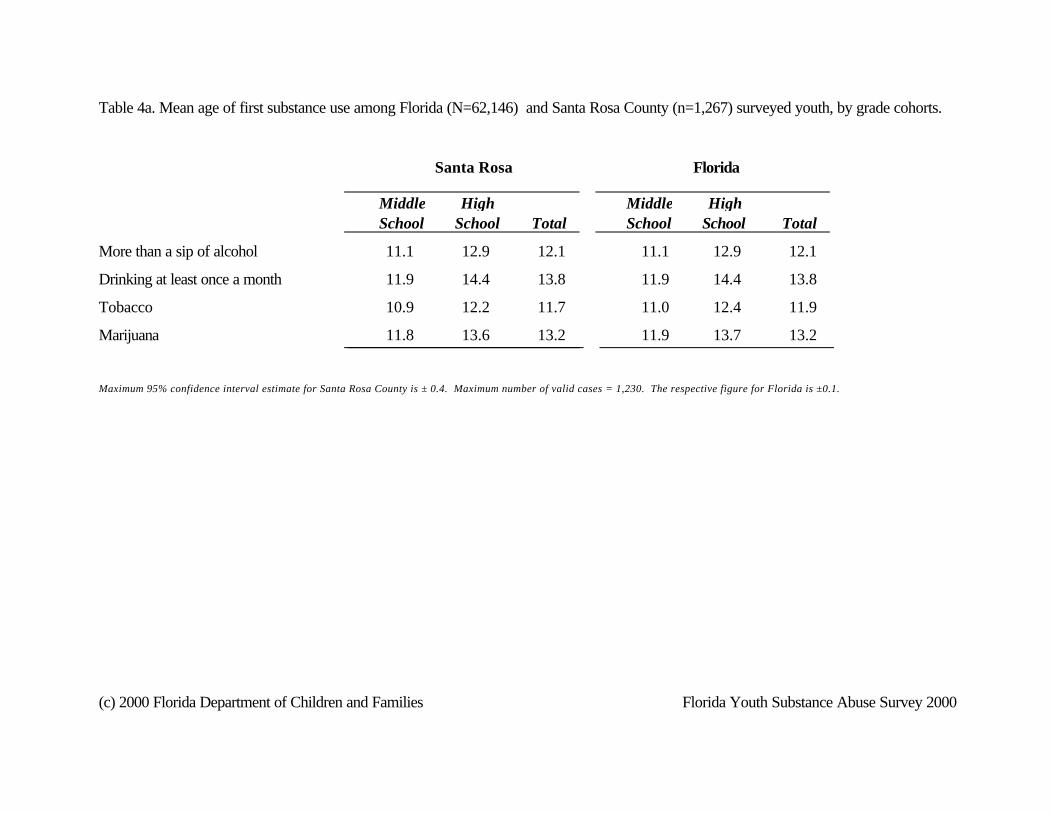
Table 4a. Mean age of first substance use among Florida (N=62,146) and Santa Rosa County (n=1,267) surveyed youth, by grade cohorts.
Santa Rosa Florida
TotalMiddle High
TotalSchool SchoolMiddle HighSchool School
More than a sip of alcohol 11.1 12.9 12.1 11.1 12.9 12.1
Drinking at least once a month 11.9 14.4 13.8 11.9 14.4 13.8
Tobacco 10.9 12.2 11.7 11.0 12.4 11.9
Marijuana 11.8 13.6 13.2 11.9 13.7 13.2
Maximum 95% confidence interval estimate for Santa Rosa County is ± 0.4. Maximum number of valid cases = 1,230. The respective figure for Florida is ±0.1.
(c) 2000 Florida Department of Children and Families Florida Youth Substance Abuse Survey 2000
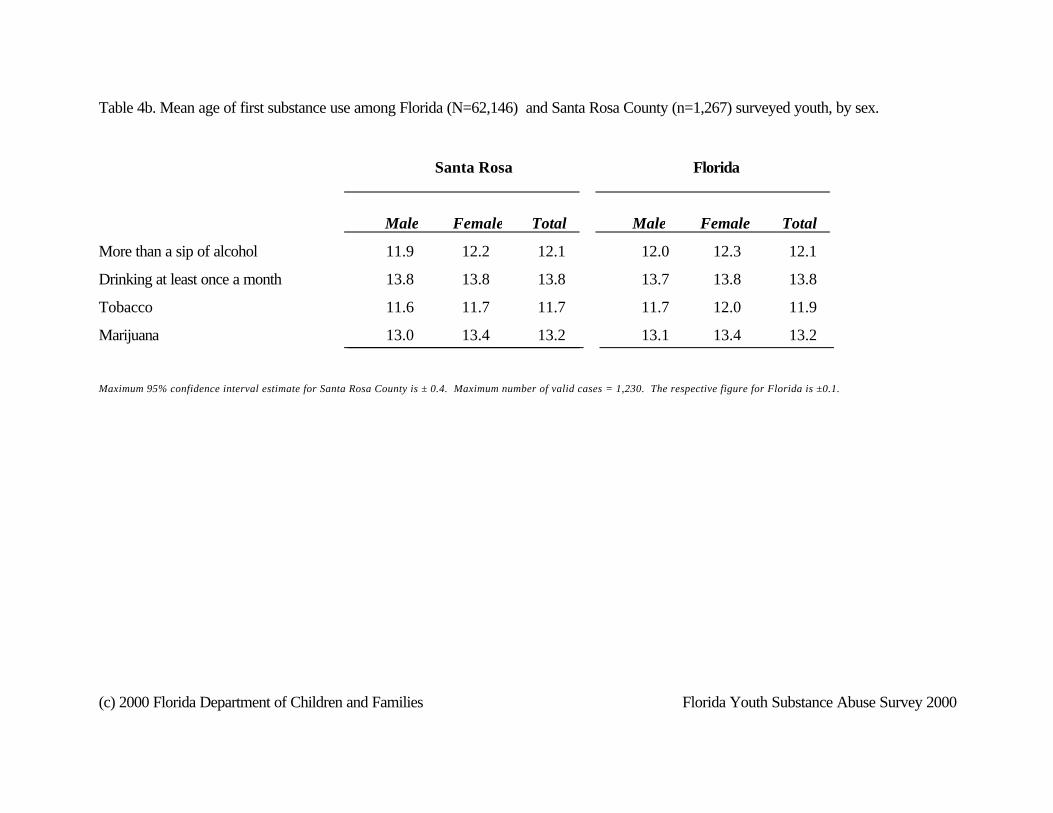
Table 4b. Mean age of first substance use among Florida (N=62,146) and Santa Rosa County (n=1,267) surveyed youth, by sex.
Santa Rosa Florida
Total TotalMale Female Male Female
More than a sip of alcohol 11.9 12.2 12.1 12.0 12.3 12.1
Drinking at least once a month 13.8 13.8 13.8 13.7 13.8 13.8
Tobacco 11.6 11.7 11.7 11.7 12.0 11.9
Marijuana 13.0 13.4 13.2 13.1 13.4 13.2
Maximum 95% confidence interval estimate for Santa Rosa County is ± 0.4. Maximum number of valid cases = 1,230. The respective figure for Florida is ±0.1.
(c) 2000 Florida Department of Children and Families Florida Youth Substance Abuse Survey 2000
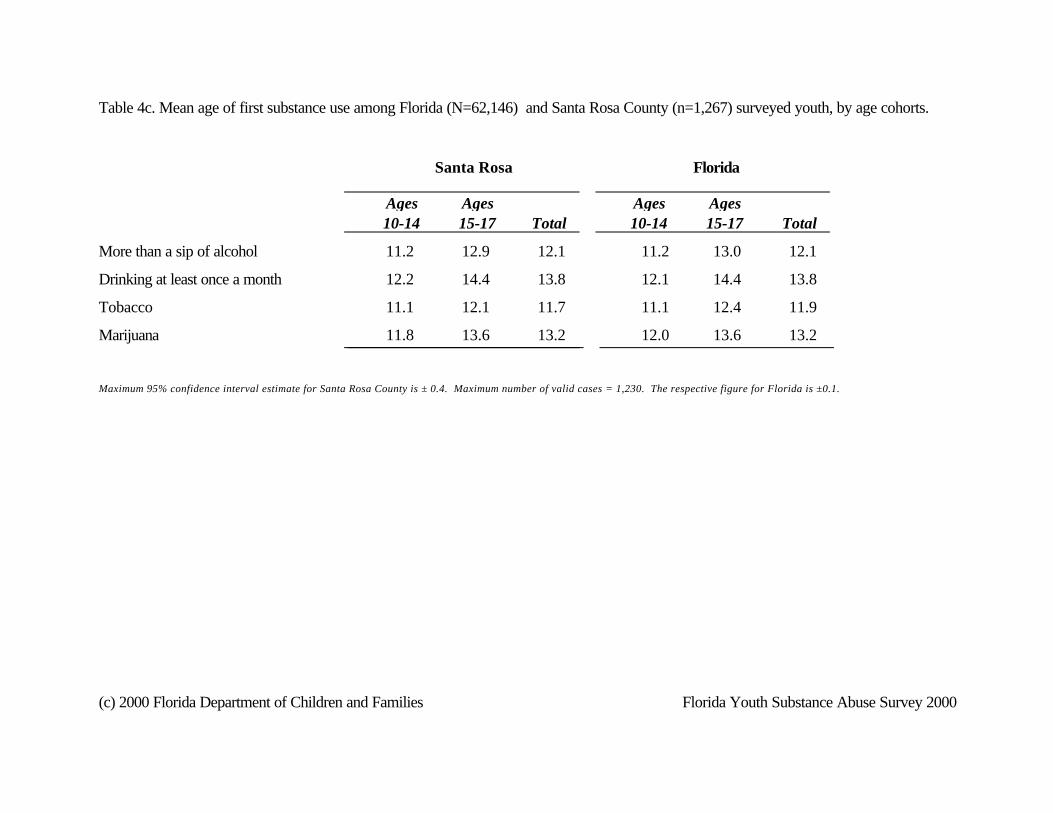
Table 4c. Mean age of first substance use among Florida (N=62,146) and Santa Rosa County (n=1,267) surveyed youth, by age cohorts.
Santa Rosa Florida
TotalAges Ages
Total10-14 15-17Ages Ages10-14 15-17
More than a sip of alcohol 11.2 12.9 12.1 11.2 13.0 12.1
Drinking at least once a month 12.2 14.4 13.8 12.1 14.4 13.8
Tobacco 11.1 12.1 11.7 11.1 12.4 11.9
Marijuana 11.8 13.6 13.2 12.0 13.6 13.2
Maximum 95% confidence interval estimate for Santa Rosa County is ± 0.4. Maximum number of valid cases = 1,230. The respective figure for Florida is ±0.1.
(c) 2000 Florida Department of Children and Families Florida Youth Substance Abuse Survey 2000
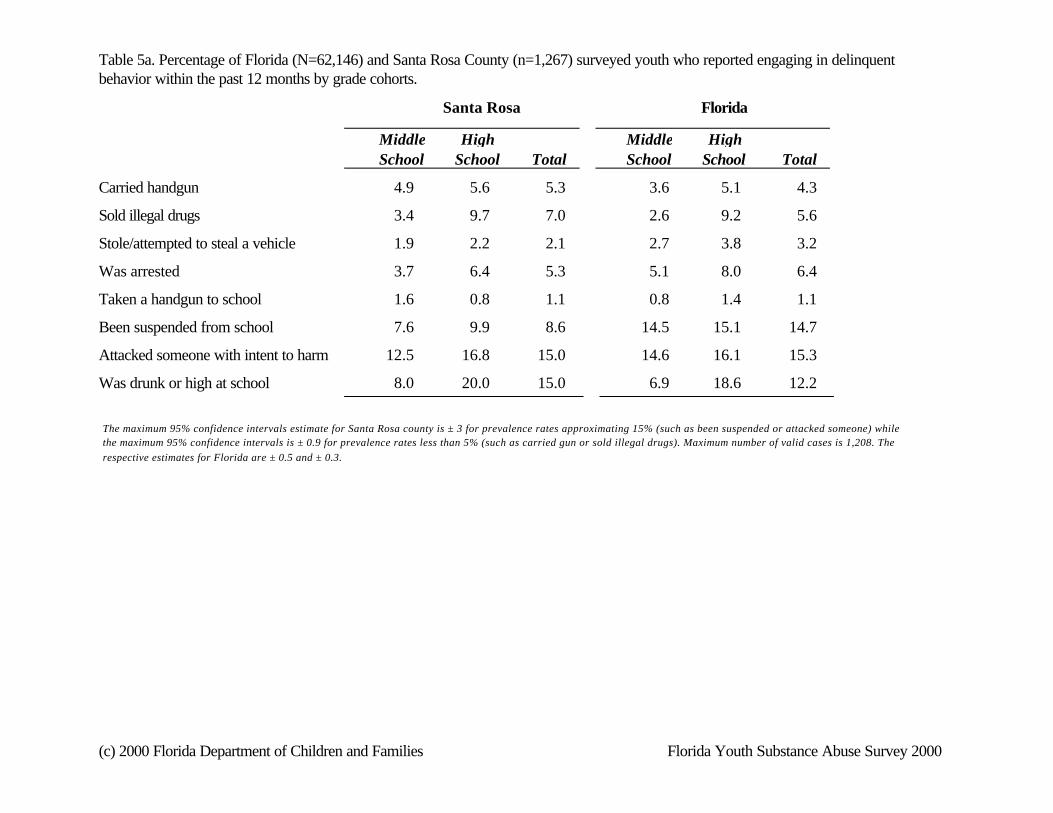
Table 5a. Percentage of Florida (N=62,146) and Santa Rosa County (n=1,267) surveyed youth who reported engaging in delinquent behavior within the past 12 months by grade cohorts.
Santa Rosa Florida
TotalMiddle High
TotalSchool SchoolMiddle HighSchool School
Carried handgun 4.9 5.6 5.3 3.6 5.1 4.3
Sold illegal drugs 3.4 9.7 7.0 2.6 9.2 5.6
Stole/attempted to steal a vehicle 1.9 2.2 2.1 2.7 3.8 3.2
Was arrested 3.7 6.4 5.3 5.1 8.0 6.4
Taken a handgun to school 1.6 0.8 1.1 0.8 1.4 1.1
Been suspended from school 7.6 9.9 8.6 14.5 15.1 14.7
Attacked someone with intent to harm 12.5 16.8 15.0 14.6 16.1 15.3
Was drunk or high at school 8.0 20.0 15.0 6.9 18.6 12.2
The maximum 95% confidence intervals estimate for Santa Rosa county is ± 3 for prevalence rates approximating 15% (such as been suspended or attacked someone) while the maximum 95% confidence intervals is ± 0.9 for prevalence rates less than 5% (such as carried gun or sold illegal drugs). Maximum number of valid cases is 1,208. The respective estimates for Florida are ± 0.5 and ± 0.3.
(c) 2000 Florida Department of Children and Families Florida Youth Substance Abuse Survey 2000
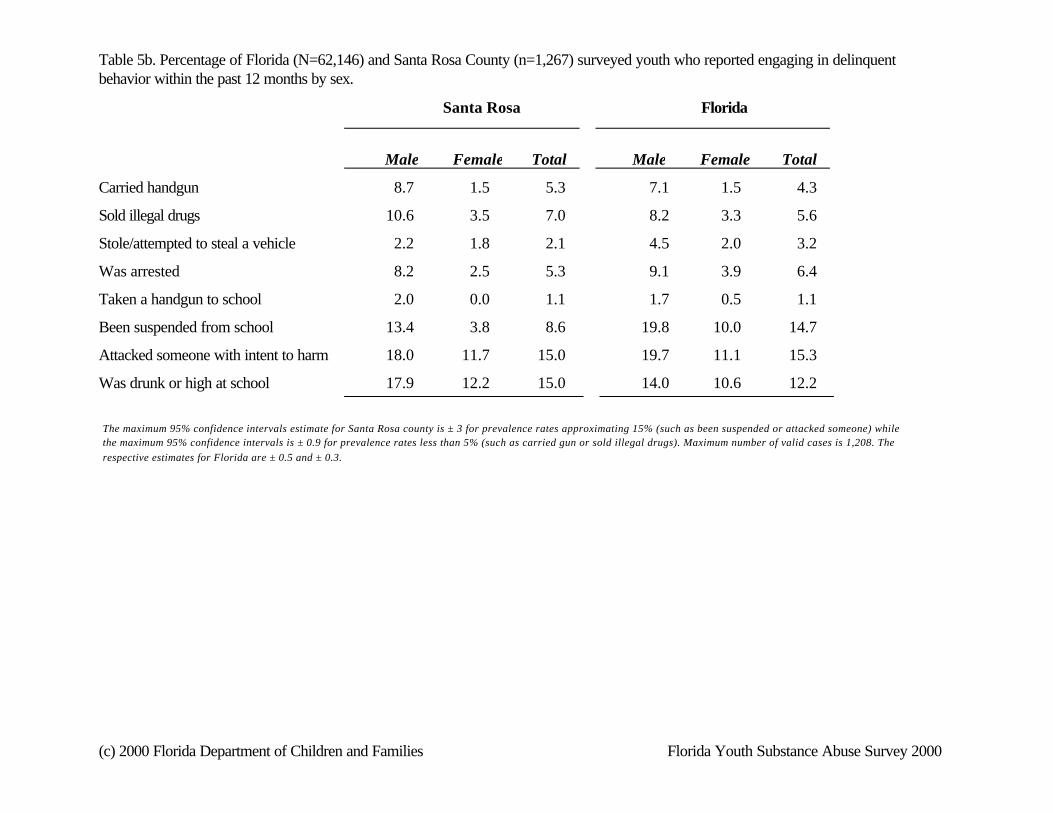
Table 5b. Percentage of Florida (N=62,146) and Santa Rosa County (n=1,267) surveyed youth who reported engaging in delinquent behavior within the past 12 months by sex.
Santa Rosa Florida
Total TotalMale Female Male Female
Carried handgun 8.7 1.5 5.3 7.1 1.5 4.3
Sold illegal drugs 10.6 3.5 7.0 8.2 3.3 5.6
Stole/attempted to steal a vehicle 2.2 1.8 2.1 4.5 2.0 3.2
Was arrested 8.2 2.5 5.3 9.1 3.9 6.4
Taken a handgun to school 2.0 0.0 1.1 1.7 0.5 1.1
Been suspended from school 13.4 3.8 8.6 19.8 10.0 14.7
Attacked someone with intent to harm 18.0 11.7 15.0 19.7 11.1 15.3
Was drunk or high at school 17.9 12.2 15.0 14.0 10.6 12.2
The maximum 95% confidence intervals estimate for Santa Rosa county is ± 3 for prevalence rates approximating 15% (such as been suspended or attacked someone) while the maximum 95% confidence intervals is ± 0.9 for prevalence rates less than 5% (such as carried gun or sold illegal drugs). Maximum number of valid cases is 1,208. The respective estimates for Florida are ± 0.5 and ± 0.3.
(c) 2000 Florida Department of Children and Families Florida Youth Substance Abuse Survey 2000
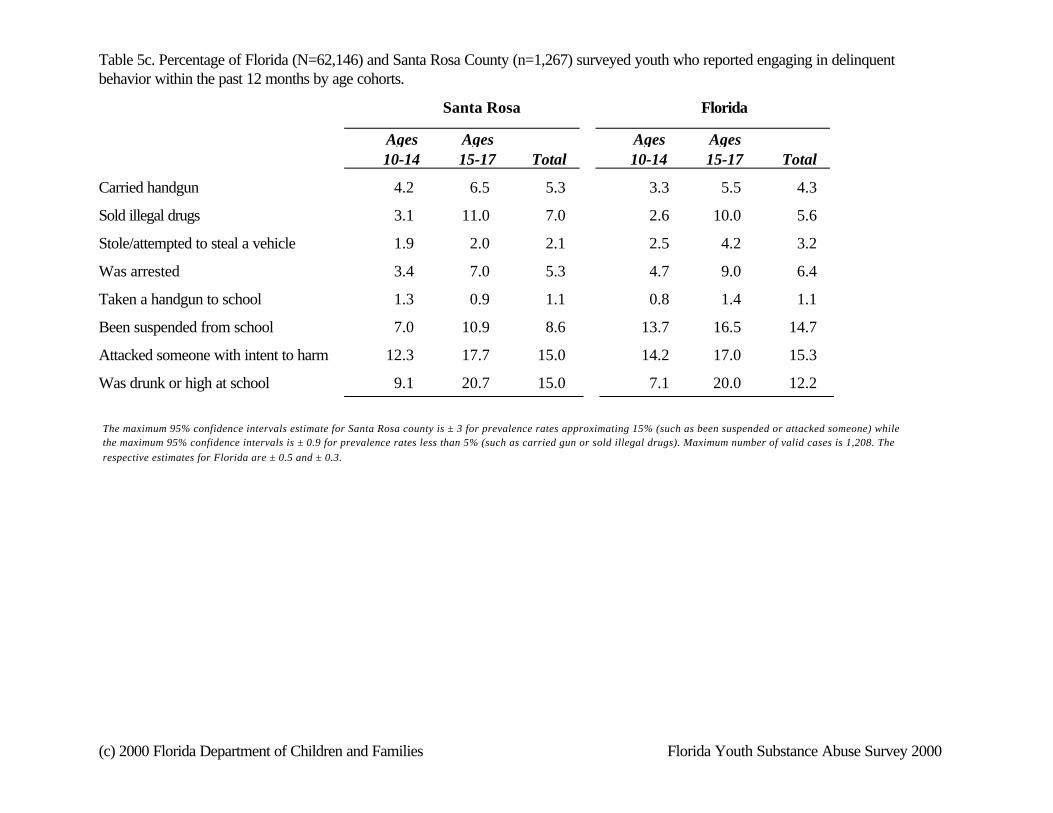
Table 5c. Percentage of Florida (N=62,146) and Santa Rosa County (n=1,267) surveyed youth who reported engaging in delinquent behavior within the past 12 months by age cohorts.
Santa Rosa Florida
TotalAges Ages
Total10-14 15-17Ages Ages10-14 15-17
Carried handgun 4.2 6.5 5.3 3.3 5.5 4.3
Sold illegal drugs 3.1 11.0 7.0 2.6 10.0 5.6
Stole/attempted to steal a vehicle 1.9 2.0 2.1 2.5 4.2 3.2
Was arrested 3.4 7.0 5.3 4.7 9.0 6.4
Taken a handgun to school 1.3 0.9 1.1 0.8 1.4 1.1
Been suspended from school 7.0 10.9 8.6 13.7 16.5 14.7
Attacked someone with intent to harm 12.3 17.7 15.0 14.2 17.0 15.3
Was drunk or high at school 9.1 20.7 15.0 7.1 20.0 12.2
The maximum 95% confidence intervals estimate for Santa Rosa county is ± 3 for prevalence rates approximating 15% (such as been suspended or attacked someone) while the maximum 95% confidence intervals is ± 0.9 for prevalence rates less than 5% (such as carried gun or sold illegal drugs). Maximum number of valid cases is 1,208. The respective estimates for Florida are ± 0.5 and ± 0.3.
(c) 2000 Florida Department of Children and Families Florida Youth Substance Abuse Survey 2000
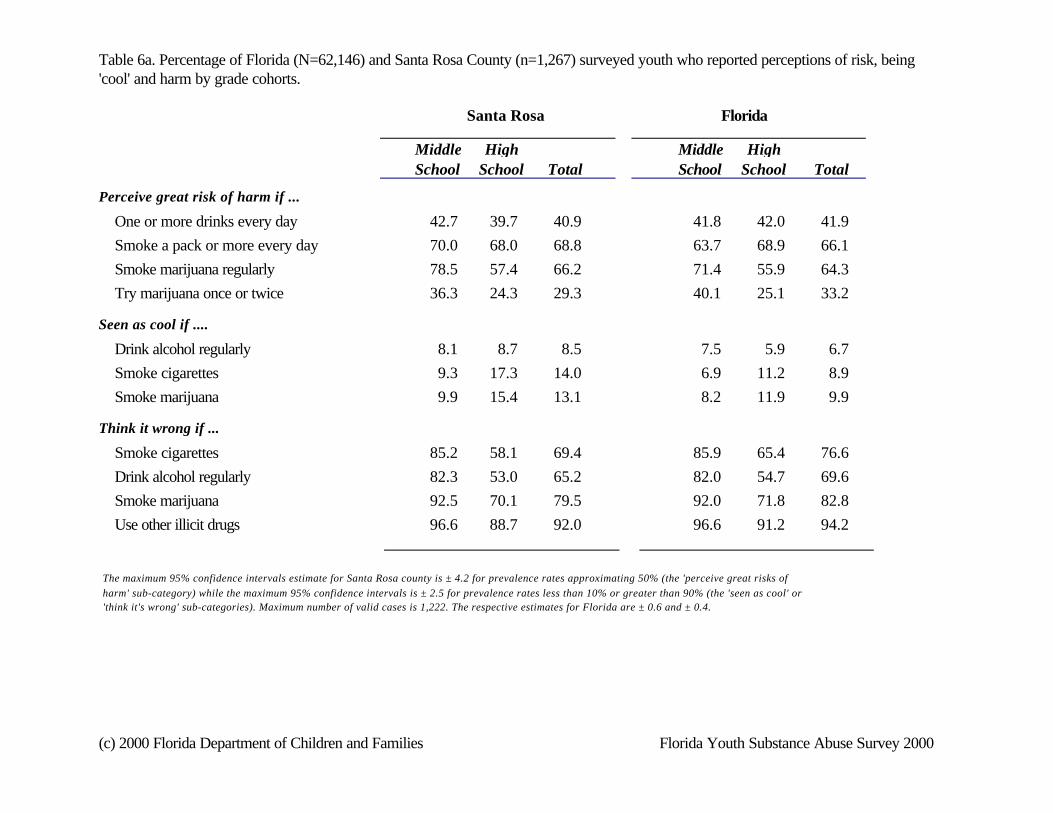
Table 6a. Percentage of Florida (N=62,146) and Santa Rosa County (n=1,267) surveyed youth who reported perceptions of risk, being 'cool' and harm by grade cohorts.
Santa Rosa Florida
TotalMiddle High
TotalSchool SchoolMiddle HighSchool School
Perceive great risk of harm if ...
One or more drinks every day 42.7 39.7 40.9 41.8 42.0 41.9Smoke a pack or more every day 70.0 68.0 68.8 63.7 68.9 66.1Smoke marijuana regularly 78.5 57.4 66.2 71.4 55.9 64.3Try marijuana once or twice 36.3 24.3 29.3 40.1 25.1 33.2
Seen as cool if ....
Drink alcohol regularly 8.1 8.7 8.5 7.5 5.9 6.7Smoke cigarettes 9.3 17.3 14.0 6.9 11.2 8.9Smoke marijuana 9.9 15.4 13.1 8.2 11.9 9.9
Think it wrong if ...
Smoke cigarettes 85.2 58.1 69.4 85.9 65.4 76.6Drink alcohol regularly 82.3 53.0 65.2 82.0 54.7 69.6Smoke marijuana 92.5 70.1 79.5 92.0 71.8 82.8Use other illicit drugs 96.6 88.7 92.0 96.6 91.2 94.2
The maximum 95% confidence intervals estimate for Santa Rosa county is ± 4.2 for prevalence rates approximating 50% (the 'perceive great risks of harm' sub-category) while the maximum 95% confidence intervals is ± 2.5 for prevalence rates less than 10% or greater than 90% (the 'seen as cool' or 'think it's wrong' sub-categories). Maximum number of valid cases is 1,222. The respective estimates for Florida are ± 0.6 and ± 0.4.
(c) 2000 Florida Department of Children and Families Florida Youth Substance Abuse Survey 2000
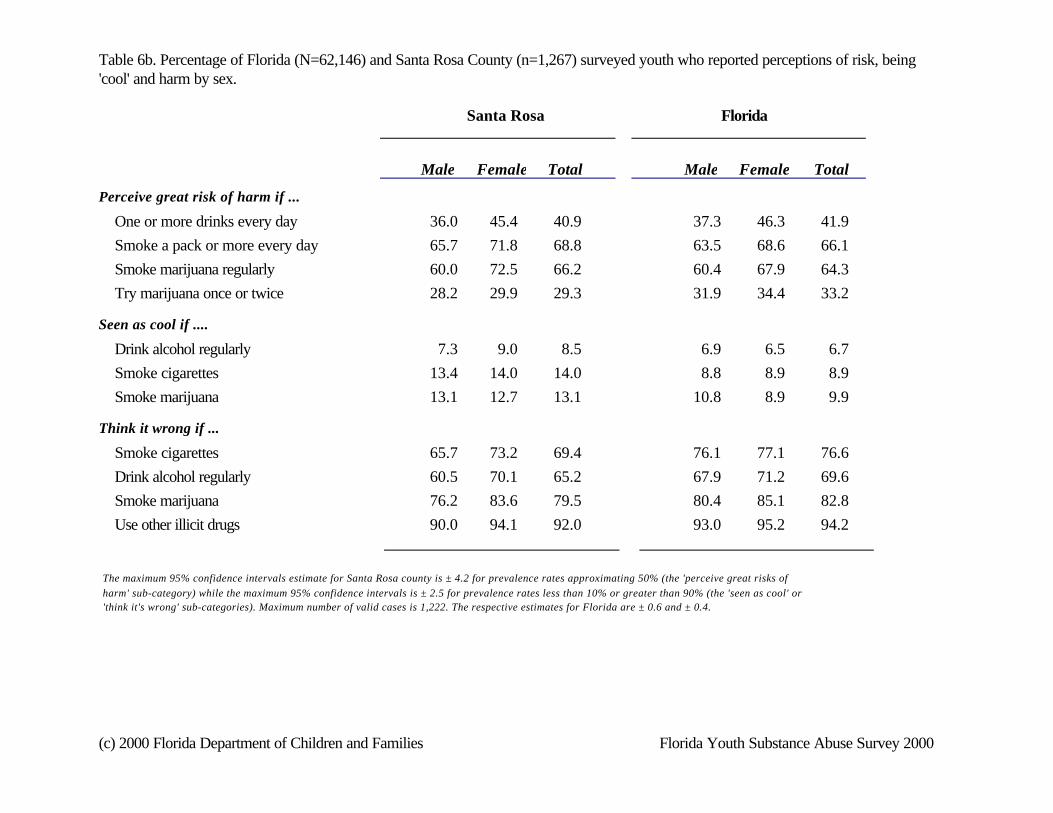
Table 6b. Percentage of Florida (N=62,146) and Santa Rosa County (n=1,267) surveyed youth who reported perceptions of risk, being 'cool' and harm by sex.
Santa Rosa Florida
Total TotalMale Female Male Female
Perceive great risk of harm if ...
One or more drinks every day 36.0 45.4 40.9 37.3 46.3 41.9Smoke a pack or more every day 65.7 71.8 68.8 63.5 68.6 66.1Smoke marijuana regularly 60.0 72.5 66.2 60.4 67.9 64.3Try marijuana once or twice 28.2 29.9 29.3 31.9 34.4 33.2
Seen as cool if ....
Drink alcohol regularly 7.3 9.0 8.5 6.9 6.5 6.7Smoke cigarettes 13.4 14.0 14.0 8.8 8.9 8.9Smoke marijuana 13.1 12.7 13.1 10.8 8.9 9.9
Think it wrong if ...
Smoke cigarettes 65.7 73.2 69.4 76.1 77.1 76.6Drink alcohol regularly 60.5 70.1 65.2 67.9 71.2 69.6Smoke marijuana 76.2 83.6 79.5 80.4 85.1 82.8Use other illicit drugs 90.0 94.1 92.0 93.0 95.2 94.2
The maximum 95% confidence intervals estimate for Santa Rosa county is ± 4.2 for prevalence rates approximating 50% (the 'perceive great risks of harm' sub-category) while the maximum 95% confidence intervals is ± 2.5 for prevalence rates less than 10% or greater than 90% (the 'seen as cool' or 'think it's wrong' sub-categories). Maximum number of valid cases is 1,222. The respective estimates for Florida are ± 0.6 and ± 0.4.
(c) 2000 Florida Department of Children and Families Florida Youth Substance Abuse Survey 2000
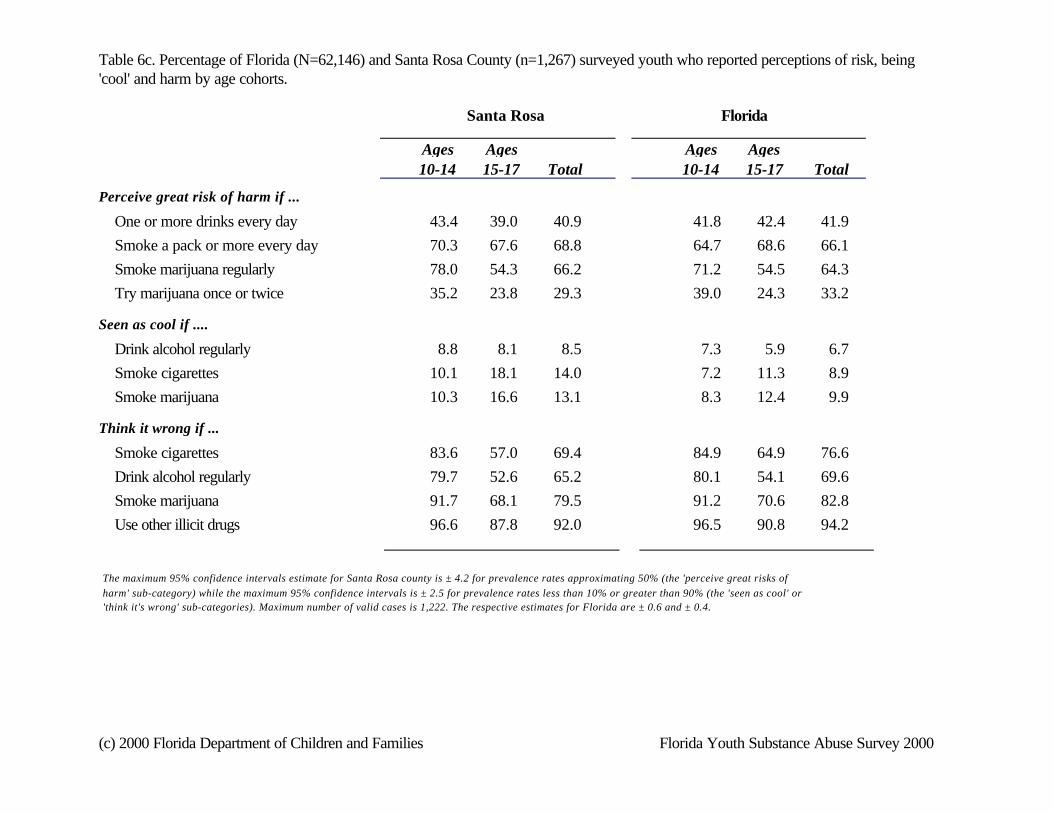
Table 6c. Percentage of Florida (N=62,146) and Santa Rosa County (n=1,267) surveyed youth who reported perceptions of risk, being 'cool' and harm by age cohorts.
Santa Rosa Florida
TotalAges Ages
Total10-14 15-17Ages Ages10-14 15-17
Perceive great risk of harm if ...
One or more drinks every day 43.4 39.0 40.9 41.8 42.4 41.9Smoke a pack or more every day 70.3 67.6 68.8 64.7 68.6 66.1Smoke marijuana regularly 78.0 54.3 66.2 71.2 54.5 64.3Try marijuana once or twice 35.2 23.8 29.3 39.0 24.3 33.2
Seen as cool if ....
Drink alcohol regularly 8.8 8.1 8.5 7.3 5.9 6.7Smoke cigarettes 10.1 18.1 14.0 7.2 11.3 8.9Smoke marijuana 10.3 16.6 13.1 8.3 12.4 9.9
Think it wrong if ...
Smoke cigarettes 83.6 57.0 69.4 84.9 64.9 76.6Drink alcohol regularly 79.7 52.6 65.2 80.1 54.1 69.6Smoke marijuana 91.7 68.1 79.5 91.2 70.6 82.8Use other illicit drugs 96.6 87.8 92.0 96.5 90.8 94.2
The maximum 95% confidence intervals estimate for Santa Rosa county is ± 4.2 for prevalence rates approximating 50% (the 'perceive great risks of harm' sub-category) while the maximum 95% confidence intervals is ± 2.5 for prevalence rates less than 10% or greater than 90% (the 'seen as cool' or 'think it's wrong' sub-categories). Maximum number of valid cases is 1,222. The respective estimates for Florida are ± 0.6 and ± 0.4.
(c) 2000 Florida Department of Children and Families Florida Youth Substance Abuse Survey 2000
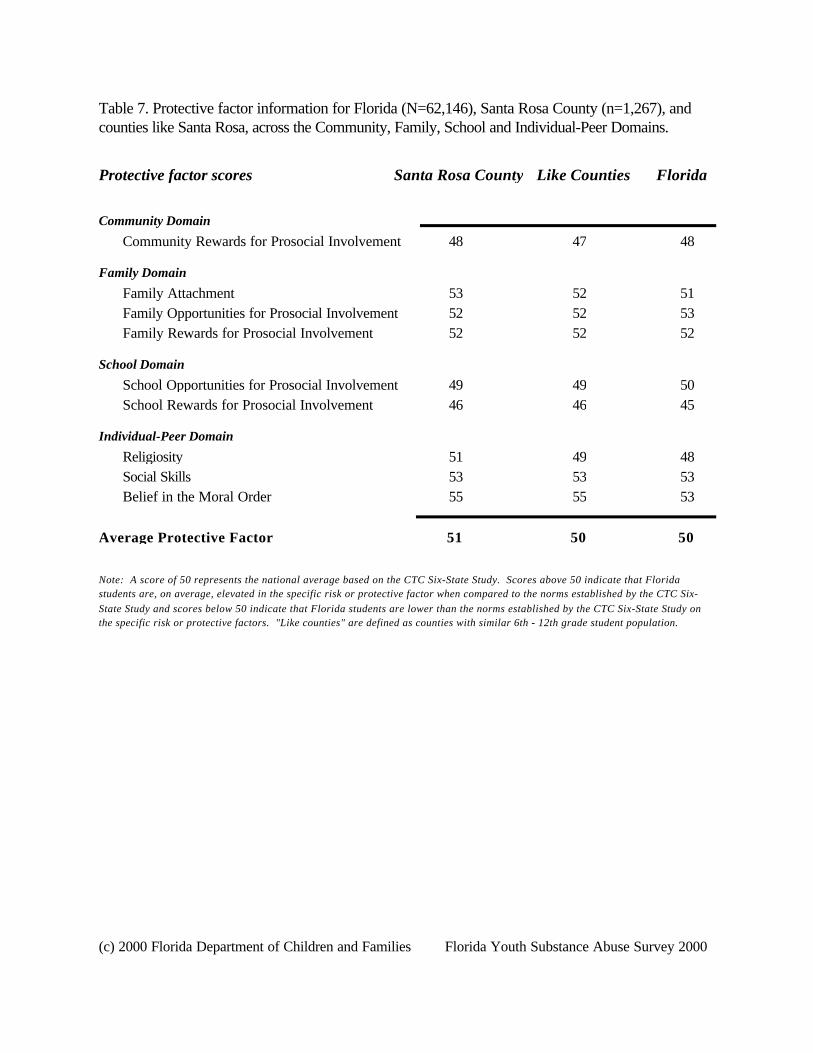
Like Counties FloridaProtective factor scores
Table 7. Protective factor information for Florida (N=62,146), Santa Rosa County (n=1,267), and counties like Santa Rosa, across the Community, Family, School and Individual-Peer Domains.
Santa Rosa County
Community Domain
Community Rewards for Prosocial Involvement 48 47 48
Family Domain
Family Attachment 53 52 51Family Opportunities for Prosocial Involvement 52 52 53Family Rewards for Prosocial Involvement 52 52 52
School Domain
School Opportunities for Prosocial Involvement 49 49 50School Rewards for Prosocial Involvement 46 46 45
Individual-Peer Domain
Religiosity 51 49 48Social Skills 53 53 53Belief in the Moral Order 55 55 53
Note: A score of 50 represents the national average based on the CTC Six-State Study. Scores above 50 indicate that Florida students are, on average, elevated in the specific risk or protective factor when compared to the norms established by the CTC Six-State Study and scores below 50 indicate that Florida students are lower than the norms established by the CTC Six-State Study on the specific risk or protective factors. "Like counties" are defined as counties with similar 6th - 12th grade student population.
51 50 50Average Protective Factor
(c) 2000 Florida Department of Children and Families Florida Youth Substance Abuse Survey 2000
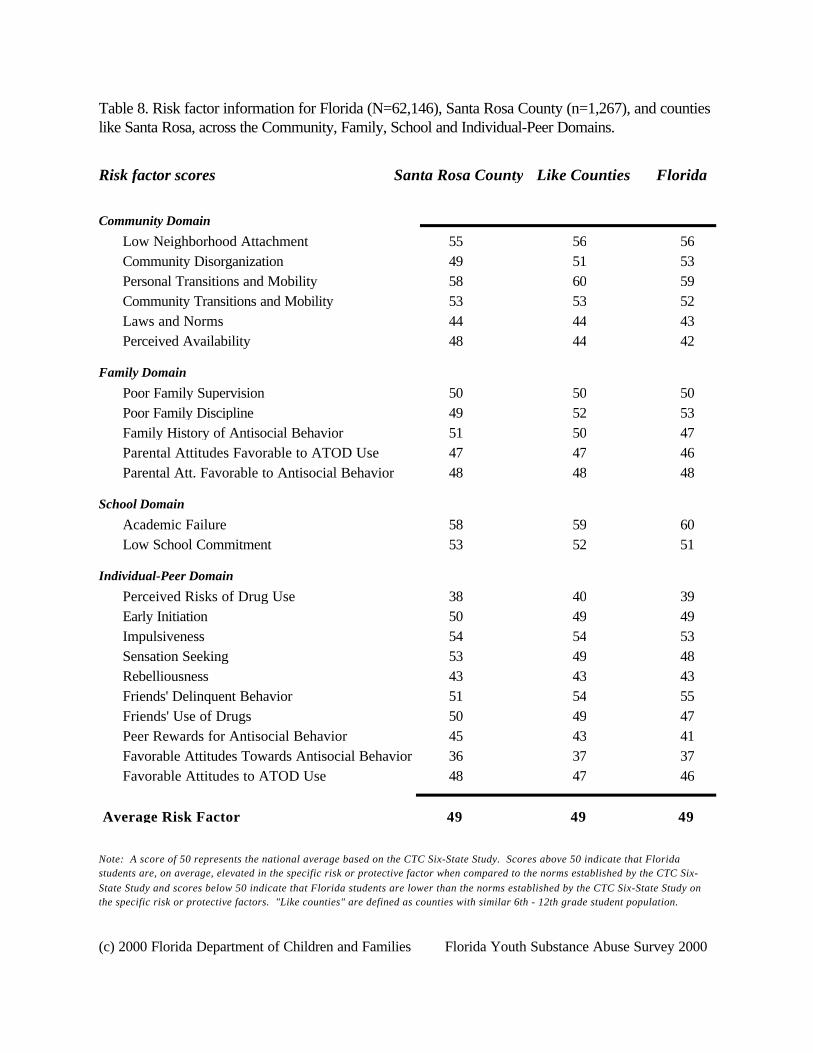
Like Counties FloridaRisk factor scores
Table 8. Risk factor information for Florida (N=62,146), Santa Rosa County (n=1,267), and counties like Santa Rosa, across the Community, Family, School and Individual-Peer Domains.
Santa Rosa County
Community Domain
Low Neighborhood Attachment 55 56 56Community Disorganization 49 51 53Personal Transitions and Mobility 58 60 59Community Transitions and Mobility 53 53 52Laws and Norms 44 44 43Perceived Availability 48 44 42
Family Domain
Poor Family Supervision 50 50 50Poor Family Discipline 49 52 53Family History of Antisocial Behavior 51 50 47Parental Attitudes Favorable to ATOD Use 47 47 46Parental Att. Favorable to Antisocial Behavior 48 48 48
School Domain
Academic Failure 58 59 60Low School Commitment 53 52 51
Individual-Peer Domain
Perceived Risks of Drug Use 38 40 39Early Initiation 50 49 49Impulsiveness 54 54 53Sensation Seeking 53 49 48Rebelliousness 43 43 43Friends' Delinquent Behavior 51 54 55Friends' Use of Drugs 50 49 47Peer Rewards for Antisocial Behavior 45 43 41Favorable Attitudes Towards Antisocial Behavior 36 37 37Favorable Attitudes to ATOD Use 48 47 46
Note: A score of 50 represents the national average based on the CTC Six-State Study. Scores above 50 indicate that Florida students are, on average, elevated in the specific risk or protective factor when compared to the norms established by the CTC Six-State Study and scores below 50 indicate that Florida students are lower than the norms established by the CTC Six-State Study on the specific risk or protective factors. "Like counties" are defined as counties with similar 6th - 12th grade student population.
49 49 49 Average Risk Factor
(c) 2000 Florida Department of Children and Families Florida Youth Substance Abuse Survey 2000
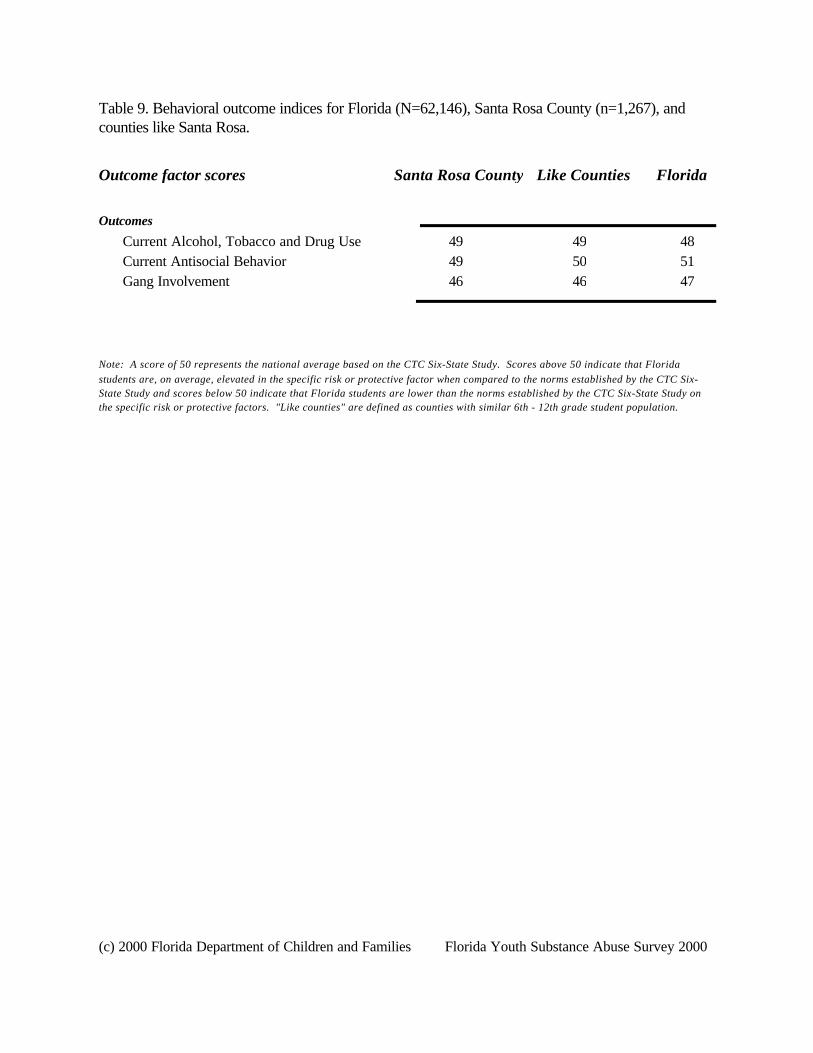
Like Counties FloridaOutcome factor scores
Table 9. Behavioral outcome indices for Florida (N=62,146), Santa Rosa County (n=1,267), and counties like Santa Rosa.
Santa Rosa County
Outcomes
Current Alcohol, Tobacco and Drug Use 49 49 48Current Antisocial Behavior 49 50 51Gang Involvement 46 46 47
Note: A score of 50 represents the national average based on the CTC Six-State Study. Scores above 50 indicate that Florida students are, on average, elevated in the specific risk or protective factor when compared to the norms established by the CTC Six-State Study and scores below 50 indicate that Florida students are lower than the norms established by the CTC Six-State Study on the specific risk or protective factors. "Like counties" are defined as counties with similar 6th - 12th grade student population.
(c) 2000 Florida Department of Children and Families Florida Youth Substance Abuse Survey 2000
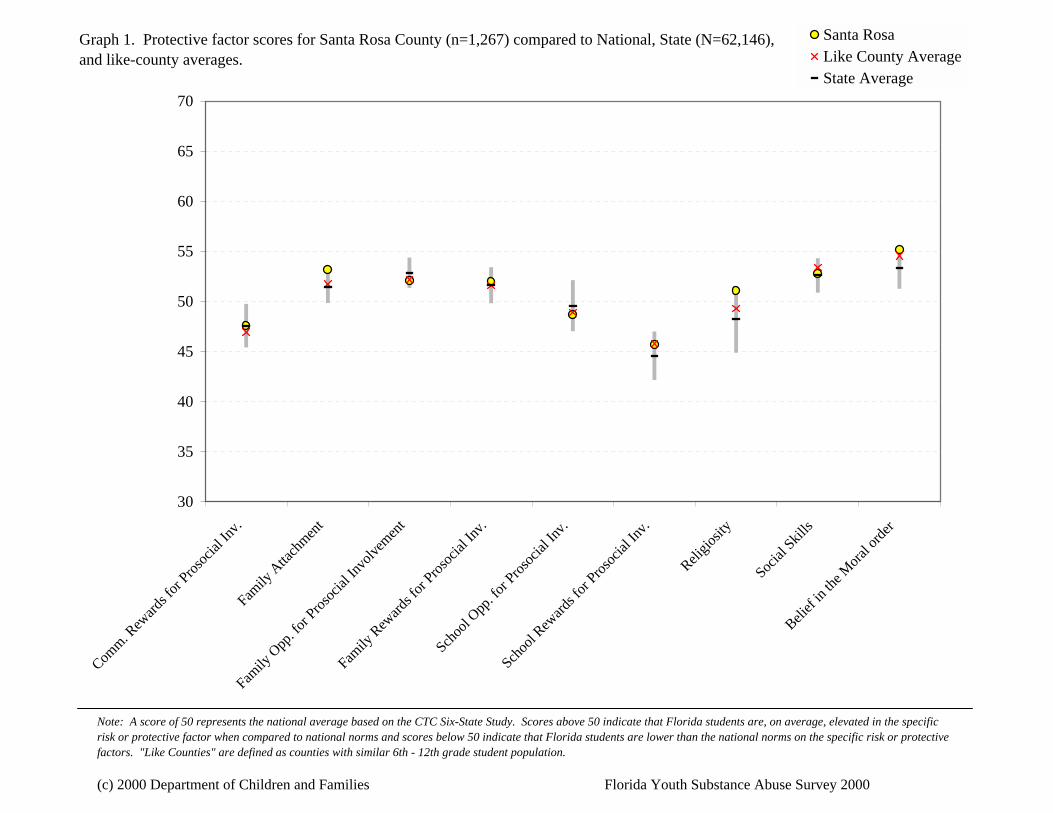
Graph 1. Protective factor scores for Santa Rosa County (n=1,267) compared to National, State (N=62,146), and like-county averages.
30
35
40
45
50
55
60
65
70
Com
m. Rew
ards f
or Pros
ocial
Inv.
Fam
ily A
ttach
ment
Fam
ily O
pp. fo
r Pros
ocial
Invo
lvemen
t
Fam
ily R
eward
s for
Prosoc
ial In
v.
Sch
ool O
pp. fo
r Pros
ocial
Inv.
Sch
ool R
eward
s for
Prosoc
ial In
v.
Reli
giosit
y
Soc
ial Skil
ls
Beli
ef in
the M
oral o
rder
Santa RosaLike County AverageState Average
Note: A score of 50 represents the national average based on the CTC Six-State Study. Scores above 50 indicate that Florida students are, on average, elevated in the specific risk or protective factor when compared to national norms and scores below 50 indicate that Florida students are lower than the national norms on the specific risk or protective factors. "Like Counties" are defined as counties with similar 6th - 12th grade student population.
(c) 2000 Department of Children and Families Florida Youth Substance Abuse Survey 2000
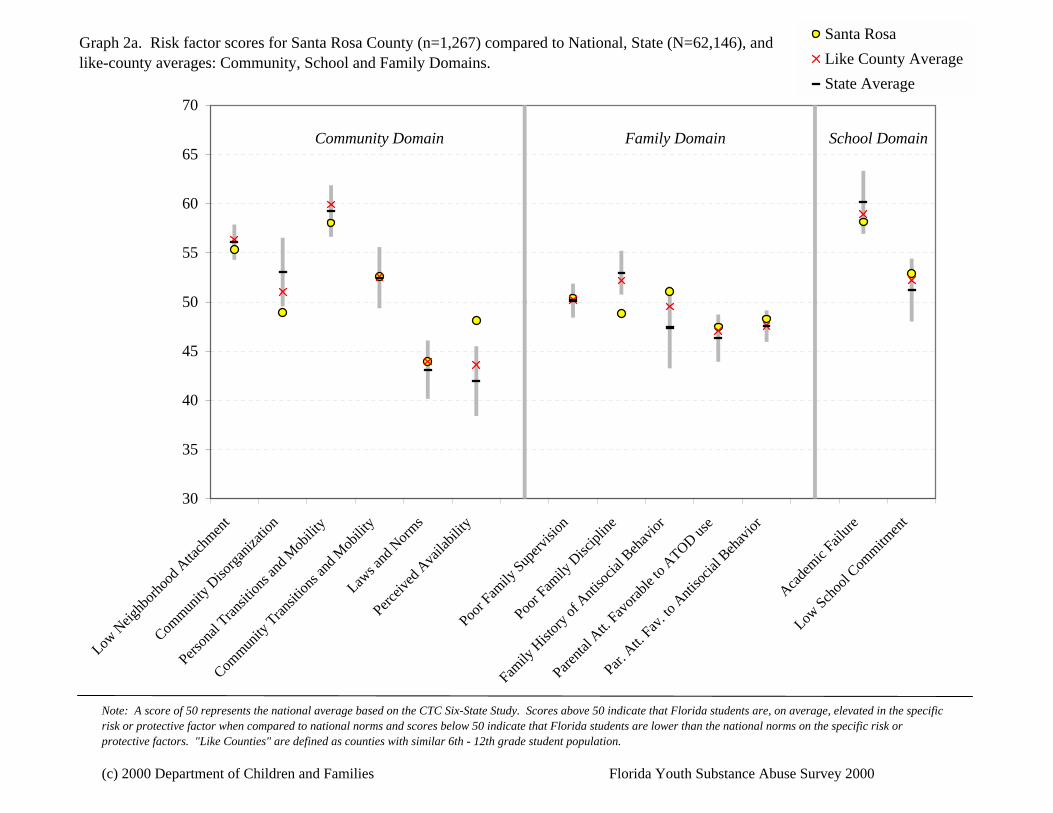
Graph 2a. Risk factor scores for Santa Rosa County (n=1,267) compared to National, State (N=62,146), and like-county averages: Community, School and Family Domains.
30
35
40
45
50
55
60
65
70
Low
Neig
hborh
ood A
ttach
ment
Com
munity
Diso
rganiz
ation
Pers
onal
Transit
ions a
nd M
obilit
y
Com
munity
Tran
sition
s and
Mob
ility
Law
s and
Norm
s
Perc
eived
Ava
ilabil
ity P
oor F
amily
Superv
ision
Poo
r Fam
ily D
iscipl
ine
Fam
ily H
istory
of A
ntiso
cial B
ehav
ior
Pare
ntal A
tt. Fav
orable
to A
TOD use
Par.
Att.
Fav. to
Anti
socia
l Beh
avior
Aca
demic
Failure
Low
Schoo
l Com
mitmen
t
Santa Rosa
Like County Average
State Average
Community Domain Family Domain School Domain
Note: A score of 50 represents the national average based on the CTC Six-State Study. Scores above 50 indicate that Florida students are, on average, elevated in the specific risk or protective factor when compared to national norms and scores below 50 indicate that Florida students are lower than the national norms on the specific risk or protective factors. "Like Counties" are defined as counties with similar 6th - 12th grade student population.
(c) 2000 Department of Children and Families Florida Youth Substance Abuse Survey 2000
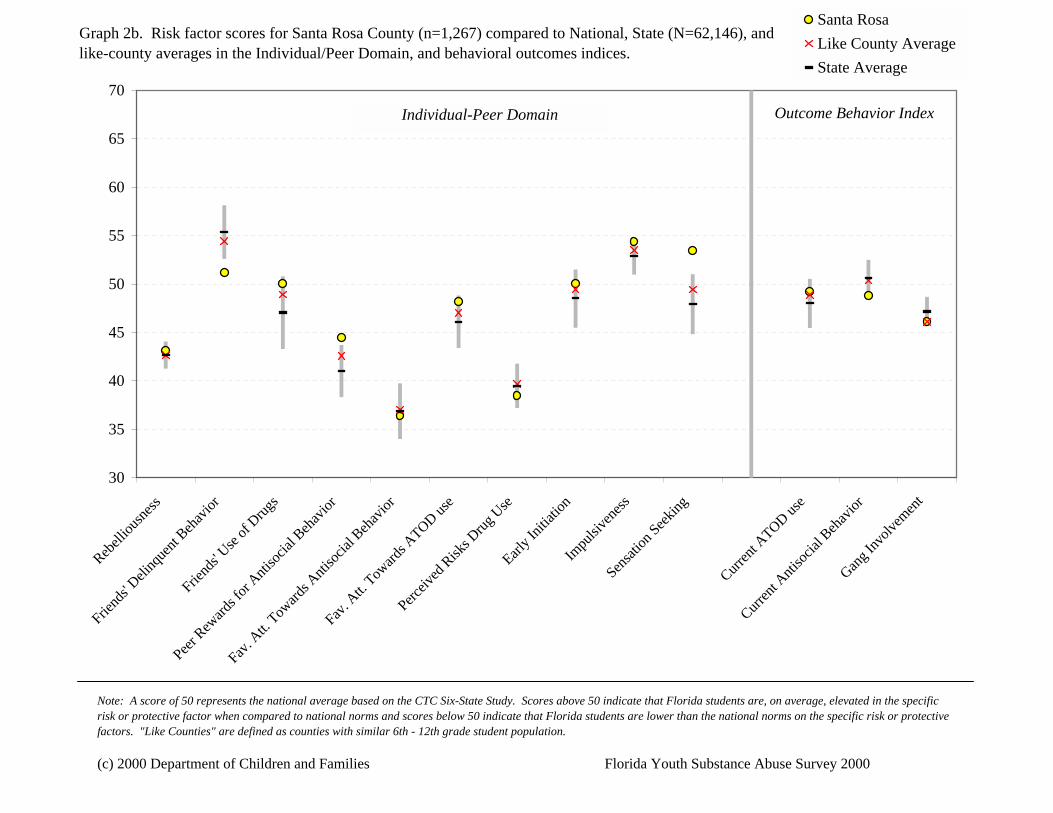
Graph 2b. Risk factor scores for Santa Rosa County (n=1,267) compared to National, State (N=62,146), and like-county averages in the Individual/Peer Domain, and behavioral outcomes indices.
30
35
40
45
50
55
60
65
70
Reb
elliou
sness
Frie
nds' D
elinq
uent
Behav
ior
Frie
nds' U
se of
Drugs
Pee
r Rew
ards f
or Anti
socia
l Beh
avior
Fav
. Att.
Toward
s Anti
socia
l Beh
avior
Fav
. Att.
Toward
s ATOD us
e
Perc
eived
Risk
s Drug
Use
Earl
y Init
iation
Impu
lsive
ness
Sen
sation
Seekin
g
Curren
t ATOD us
e
Curren
t Anti
socia
l Beh
avior
Gang I
nvolv
emen
t
Santa RosaLike County AverageState Average
Outcome Behavior IndexIndividual-Peer Domain
Note: A score of 50 represents the national average based on the CTC Six-State Study. Scores above 50 indicate that Florida students are, on average, elevated in the specific risk or protective factor when compared to national norms and scores below 50 indicate that Florida students are lower than the national norms on the specific risk or protective factors. "Like Counties" are defined as counties with similar 6th - 12th grade student population.
(c) 2000 Department of Children and Families Florida Youth Substance Abuse Survey 2000