Embed Size (px)
Citation preview

Florida’s Race to the Top
R e d a c t e
d
2
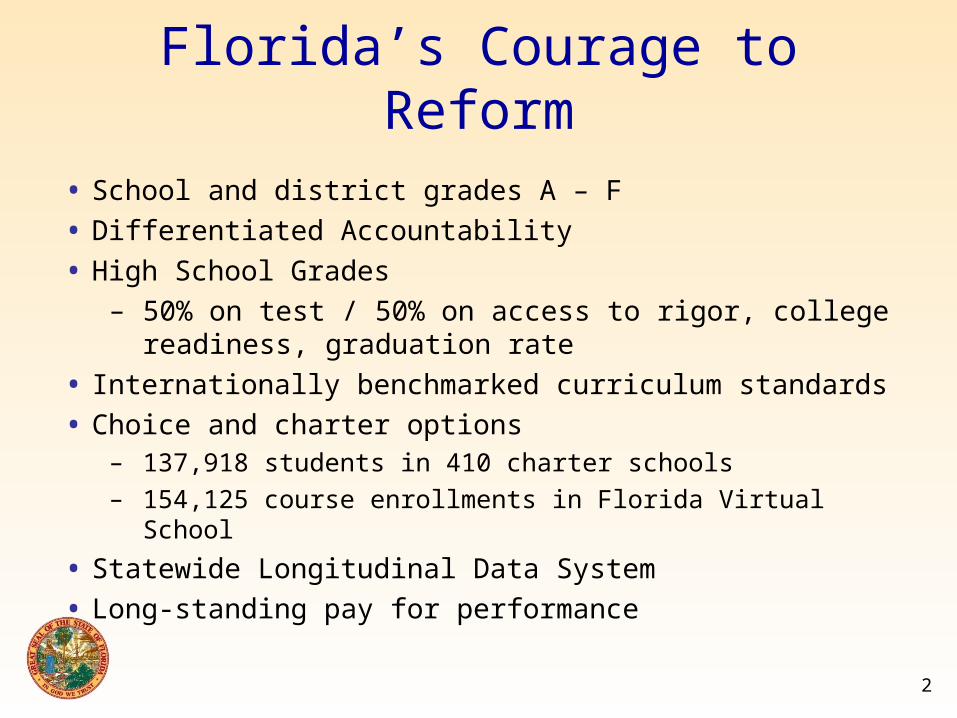
Florida’s Courage to Reform
• School and district grades A – F
• Differentiated Accountability
• High School Grades
– 50% on test / 50% on access to rigor, college readiness, graduation rate
• Internationally benchmarked curriculum standards
• Choice and charter options– 137,918 students in 410 charter schools– 154,125 course enrollments in Florida Virtual School
• Statewide Longitudinal Data System
• Long-standing pay for performance

3
Governor’s RTTT Working Group
MissionCollaborative, open, and transparent review of the State’s Memorandum of Understanding (MOU) required for the RTTT grant.
CompositionChair: Alberto Carvalho, Superintendent, Miami-Dade County
OutcomeRevised and strengthened MOU that passed with unanimous consent. Also recommended establishment of diversely composed Task Force to monitor implementation of RTTT grant.
4
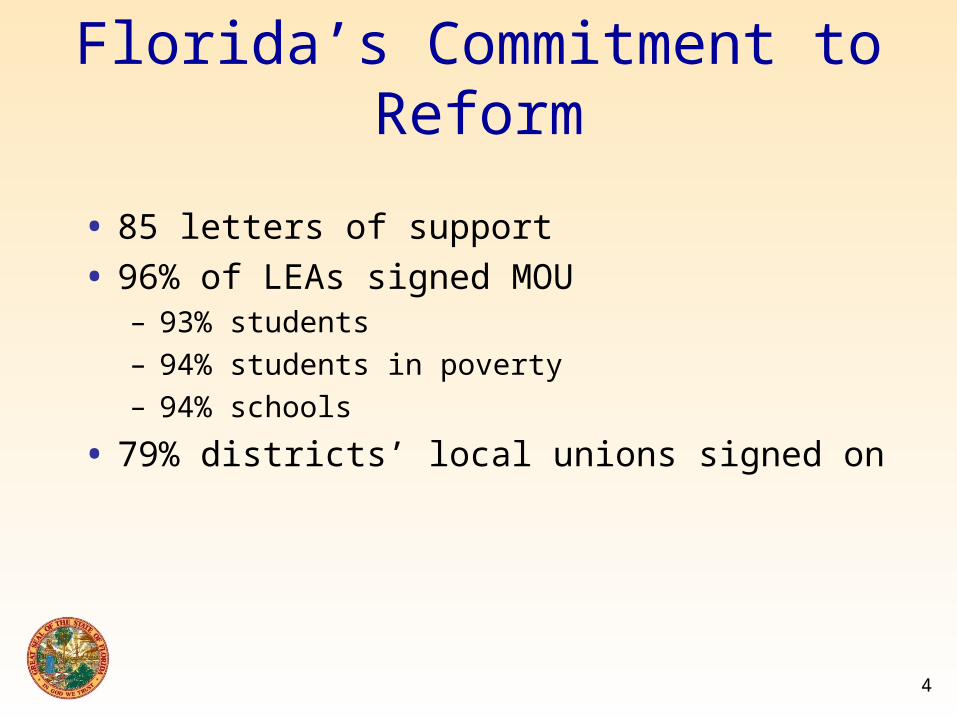
Florida’s Commitment to Reform
• 85 letters of support
• 96% of LEAs signed MOU– 93% students
– 94% students in poverty
– 94% schools
• 79% districts’ local unions signed on
5
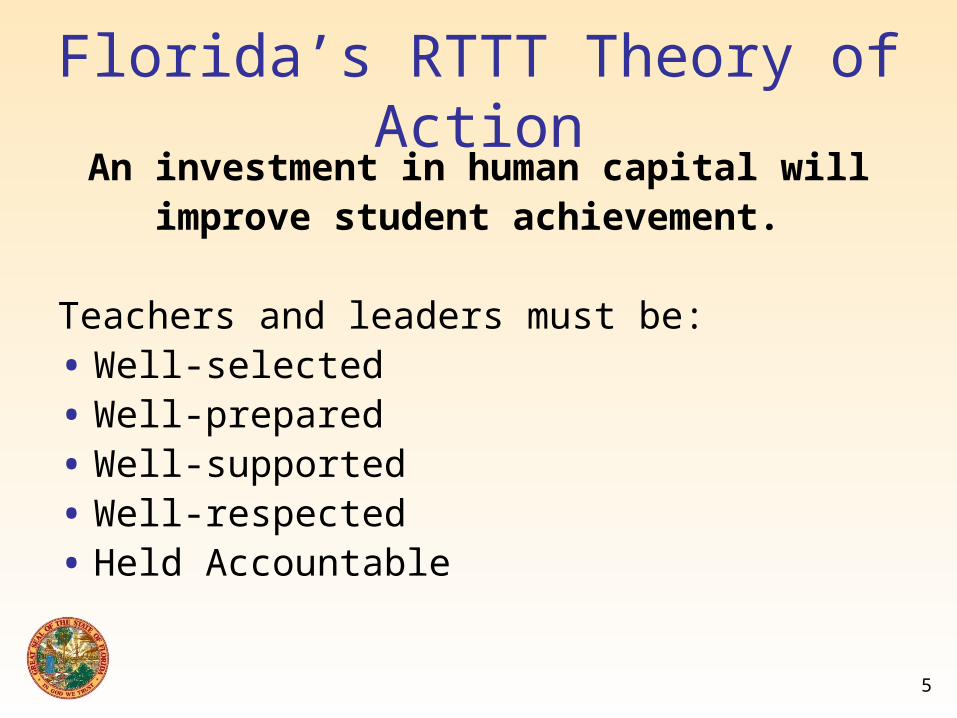
An investment in human capital willimprove student achievement.
Teachers and leaders must be:• Well-selected• Well-prepared• Well-supported• Well-respected• Held Accountable
Florida’s RTTT Theory of Action

6
Progress TowardFlorida’s Goals
7
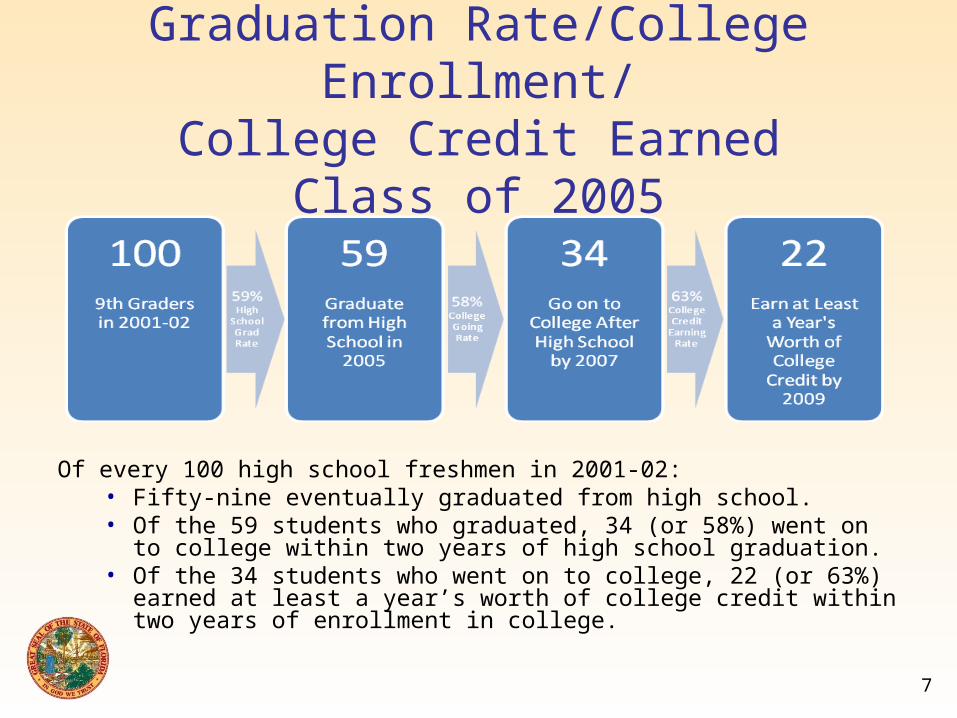
Graduation Rate/College Enrollment/College Credit Earned
Class of 2005
Of every 100 high school freshmen in 2001-02:• Fifty-nine eventually graduated from high school. • Of the 59 students who graduated, 34 (or 58%) went on to college
within two years of high school graduation. • Of the 34 students who went on to college, 22 (or 63%) earned at least
a year’s worth of college credit within two years of enrollment in college.
8
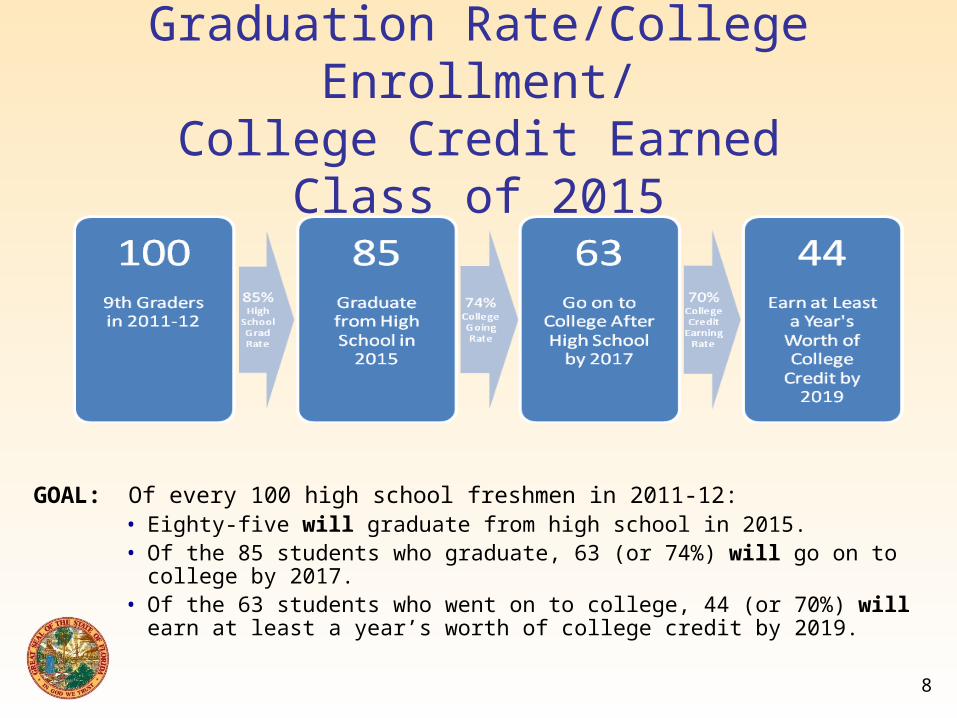
Graduation Rate/College Enrollment/College Credit Earned
Class of 2015
GOAL: Of every 100 high school freshmen in 2011-12: • Eighty-five will graduate from high school in 2015. • Of the 85 students who graduate, 63 (or 74%) will go on to college by 2017. • Of the 63 students who went on to college, 44 (or 70%) will earn at least a
year’s worth of college credit by 2019.
9
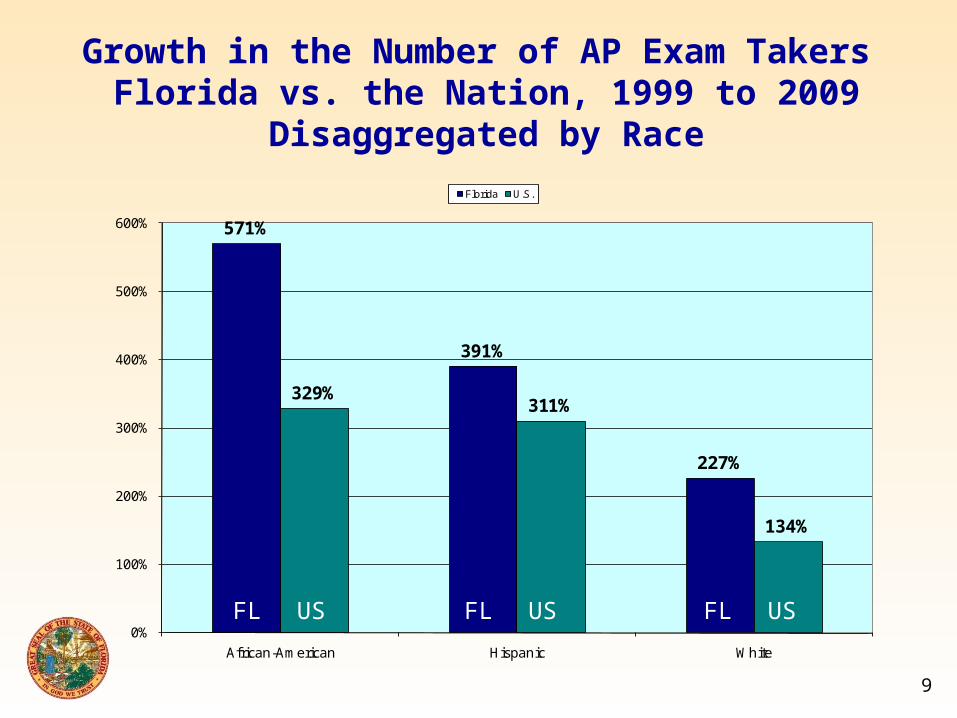
Growth in the Number of AP Exam Takers Florida vs. the Nation, 1999 to 2009
Disaggregated by Race
571%
391%
227%
329%311%
134%
0%
100%
200%
300%
400%
500%
600%
African-American Hispanic White
Florida U.S.
FL FL FLUS US US
10
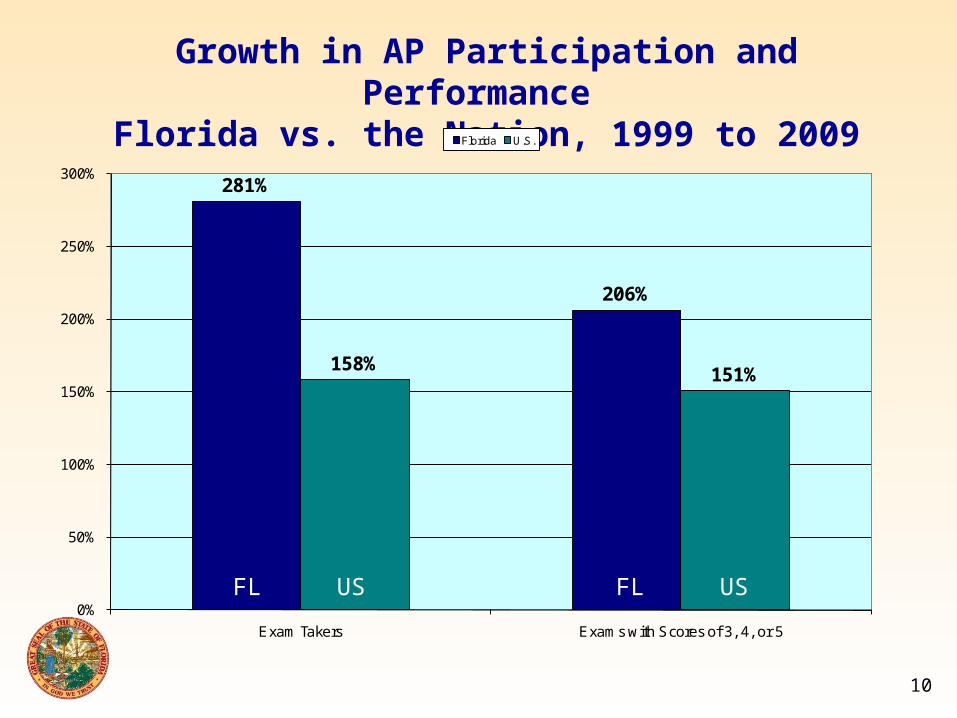
Growth in AP Participation and Performance Florida vs. the Nation, 1999 to 2009
281%
206%
158%151%
0%
50%
100%
150%
200%
250%
300%
Exam Takers Exams with Scores of 3, 4, or 5
Florida U.S.
FL US FL US
11
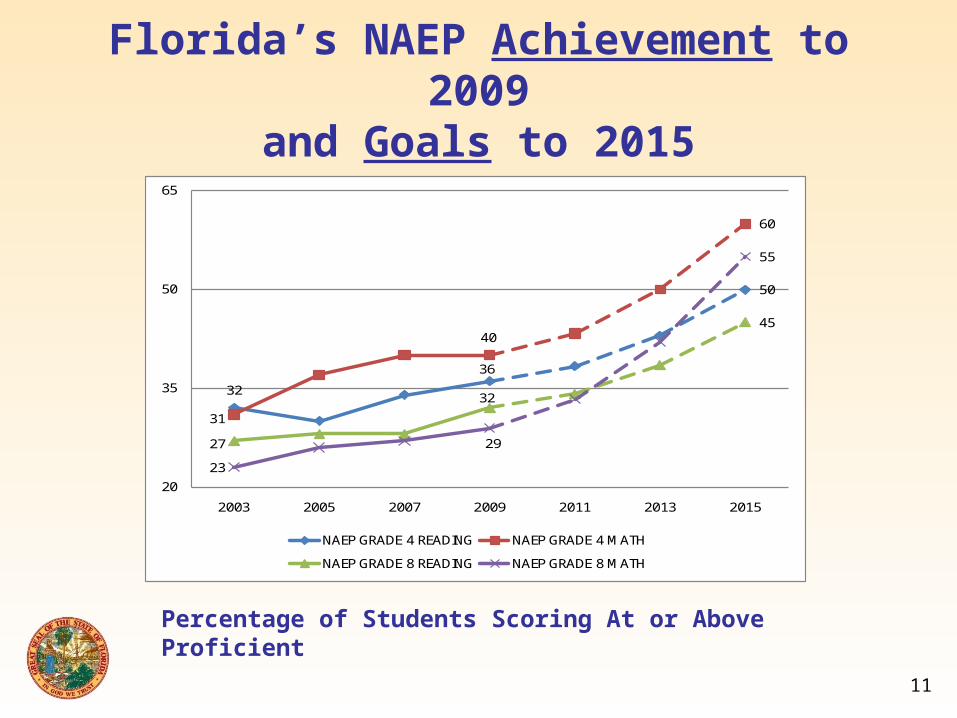
Florida’s NAEP Achievement to 2009and Goals to 2015
32
36
50
31
40
60
27
32
45
23
29
55
20
35
50
65
2003 2005 2007 2009 2011 2013 2015
NAEP GRADE 4 READING NAEP GRADE 4 MATH
NAEP GRADE 8 READING NAEP GRADE 8 MATH
Percentage of Students Scoring At or Above Proficient
12
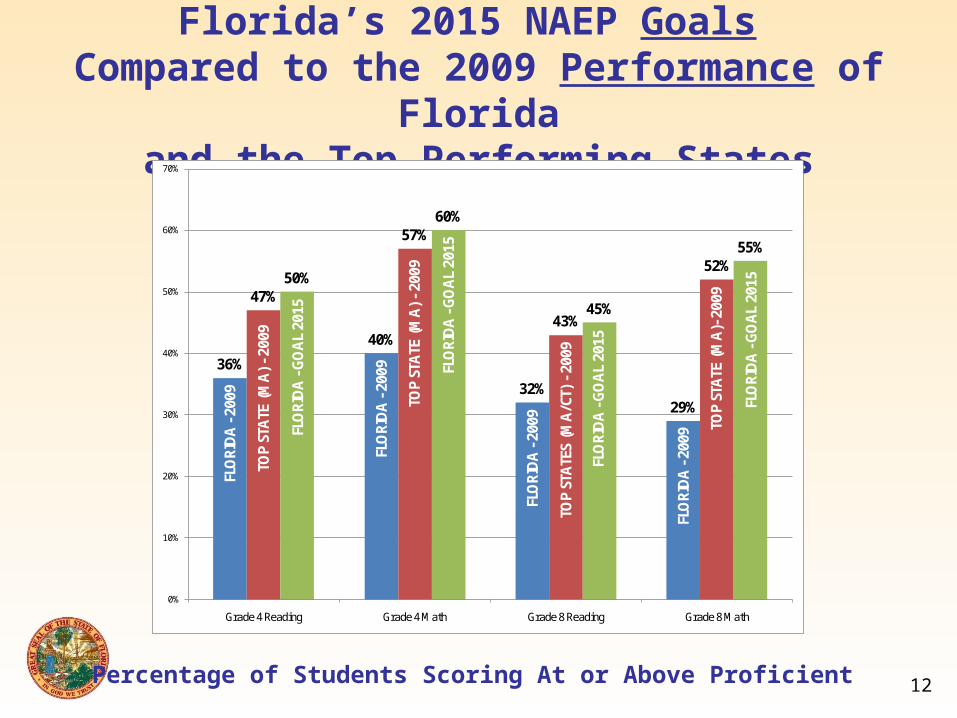
Florida’s 2015 NAEP Goals Compared to the 2009 Performance of Florida
and the Top Performing States
36%
40%
32%29%
47%
57%
43%
52%50%
60%
45%
55%
0%
10%
20%
30%
40%
50%
60%
70%
Grade 4 Reading Grade 4 Math Grade 8 Reading Grade 8 Math
FLO
RID
A -
2009
FLO
RID
A -
2009
FLO
RID
A -
2009
FLO
RID
A -
2009
TOP
STA
TE (
MA
)-20
09
TOP
STA
TE (
MA
)-20
09
TOP
STA
TES
(MA
/CT)
-20
09
TOP
STA
TE (
MA
) -20
09
FLO
RID
A -
GO
AL
2015
FLO
RID
A -
GO
AL
2015
FLO
RID
A -
GO
AL
2015
FLO
RID
A -
GO
AL
2015
-200
9
Percentage of Students Scoring At or Above Proficient
13
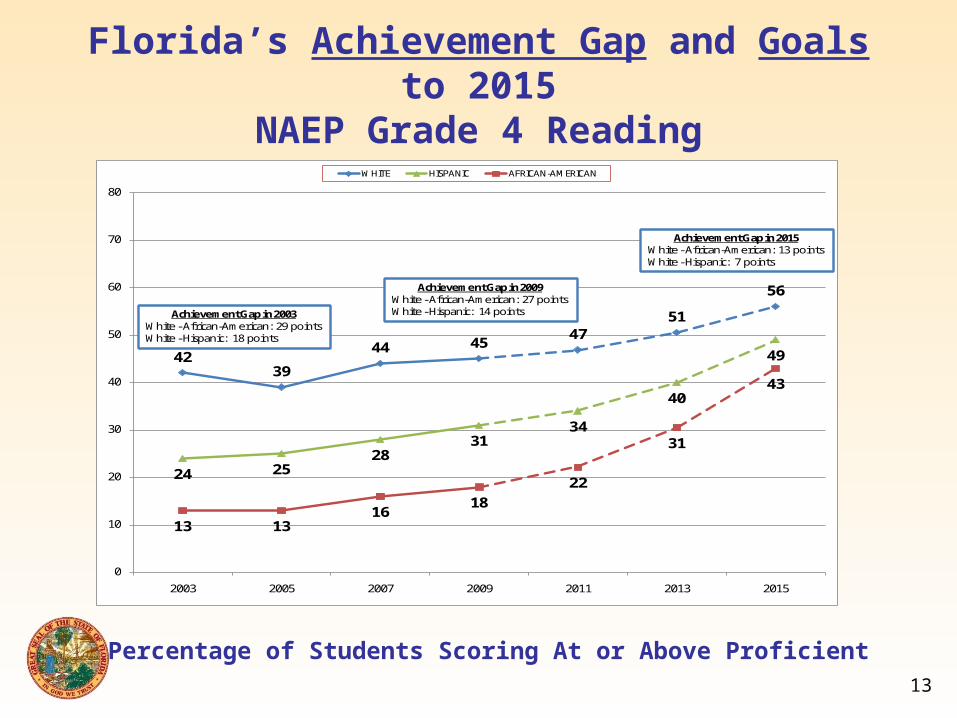
Florida’s Achievement Gap and Goals to 2015NAEP Grade 4 Reading
Percentage of Students Scoring At or Above Proficient
4239
44 4547
51
56
24 2528
3134
40
49
13 1316
1822
31
43
0
10
20
30
40
50
60
70
80
2003 2005 2007 2009 2011 2013 2015
WHITE HISPANIC AFRICAN-AMERICAN
Achievement Gap in 2015White - African-American: 13 pointsWhite - Hispanic: 7 points
Achievement Gap in 2009White - African-American: 27 pointsWhite - Hispanic: 14 pointsAchievement Gap in 2003
White - African-American: 29 pointsWhite - Hispanic: 18 points
14
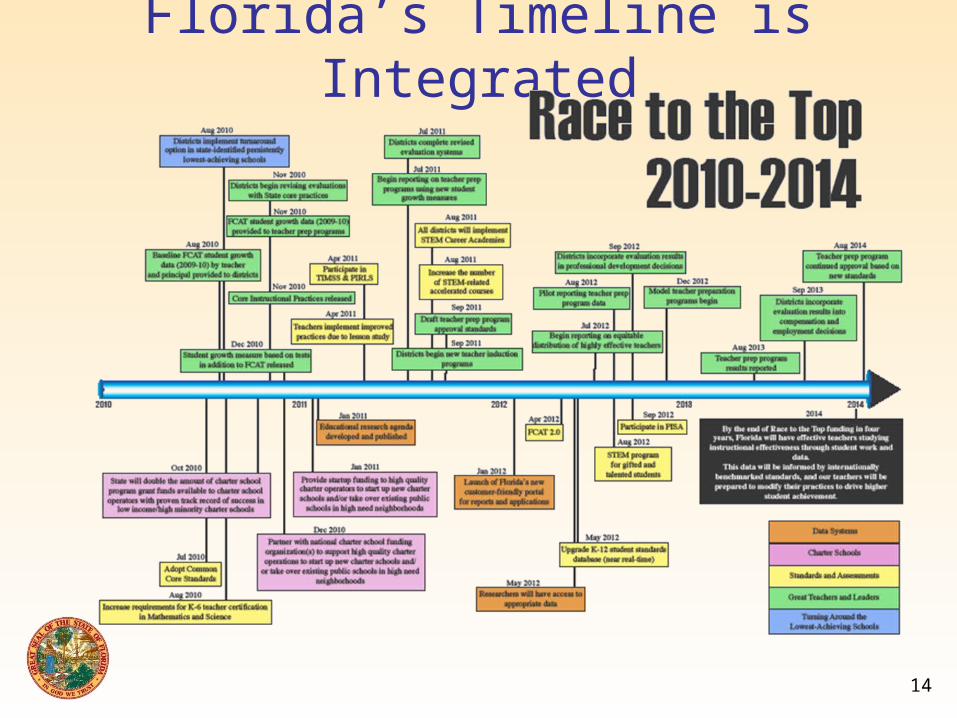
Florida’s Timeline is Integrated
15
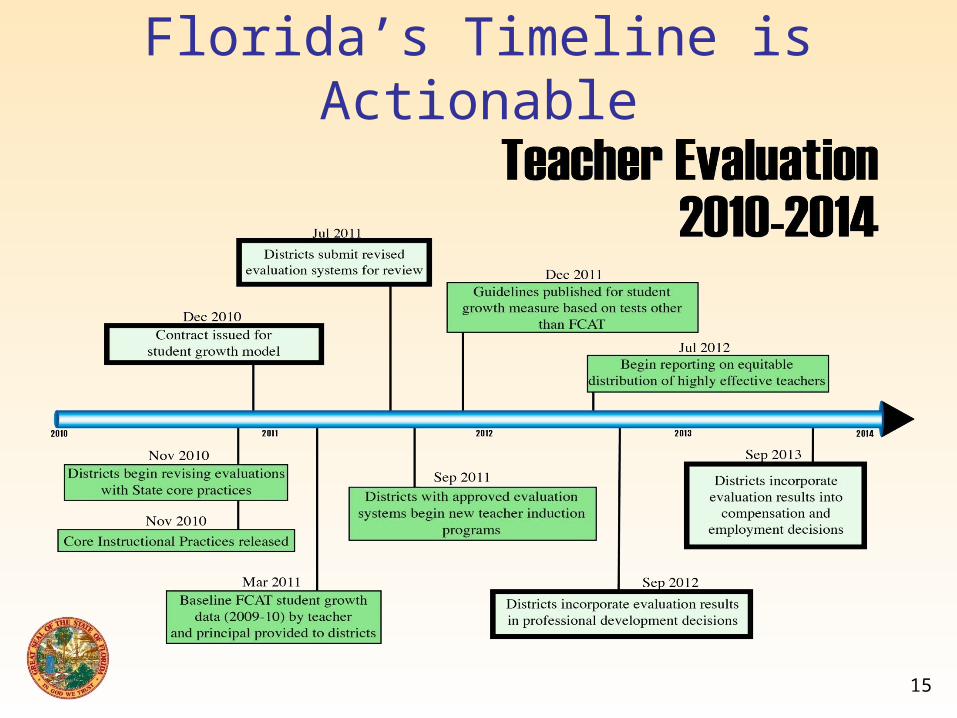
Florida’s Timeline is Actionable
16
Florida Will Sustain Reform: Race to the Top Becomes the
New Way of Work
• Use grant to develop systems and tools to build capacity
• Require district plans to address sustainability and alignment/reallocation of existing funds
• Collaborate with other states for economy of scale
• Use monitoring and project management
• Redefine new compensation system within existing resources

17
Florida Is a Good Investment:
Florida Will Deliver!
18
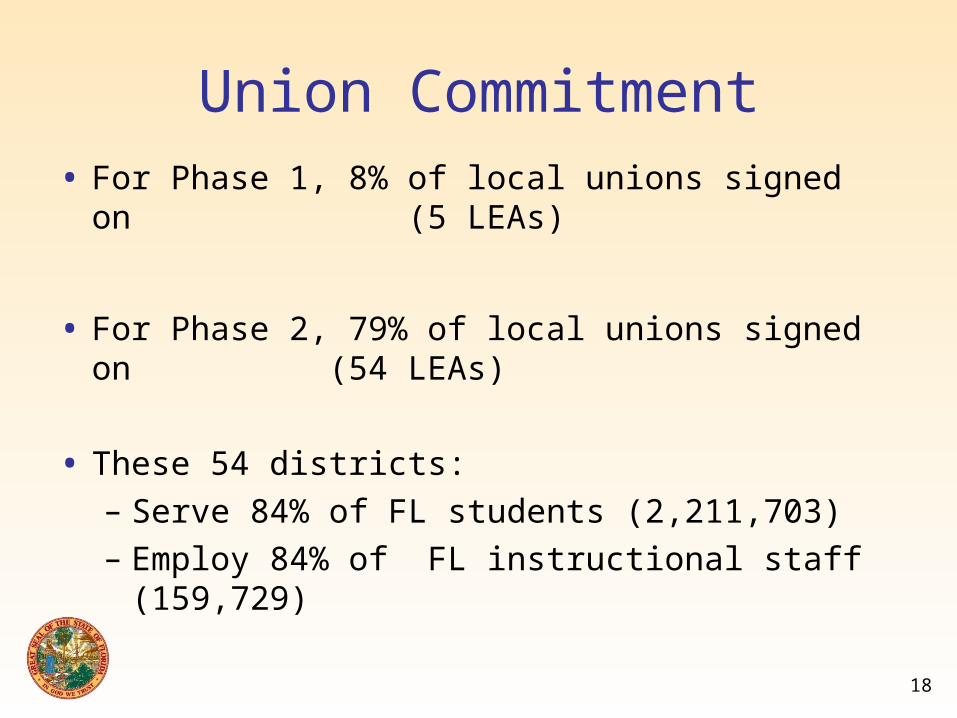
Union Commitment• For Phase 1, 8% of local unions signed on
(5 LEAs)
• For Phase 2, 79% of local unions signed on (54 LEAs)
• These 54 districts:
– Serve 84% of FL students (2,211,703)
– Employ 84% of FL instructional staff (159,729)

19
Broad Union Support

20
LEA Commitment
21
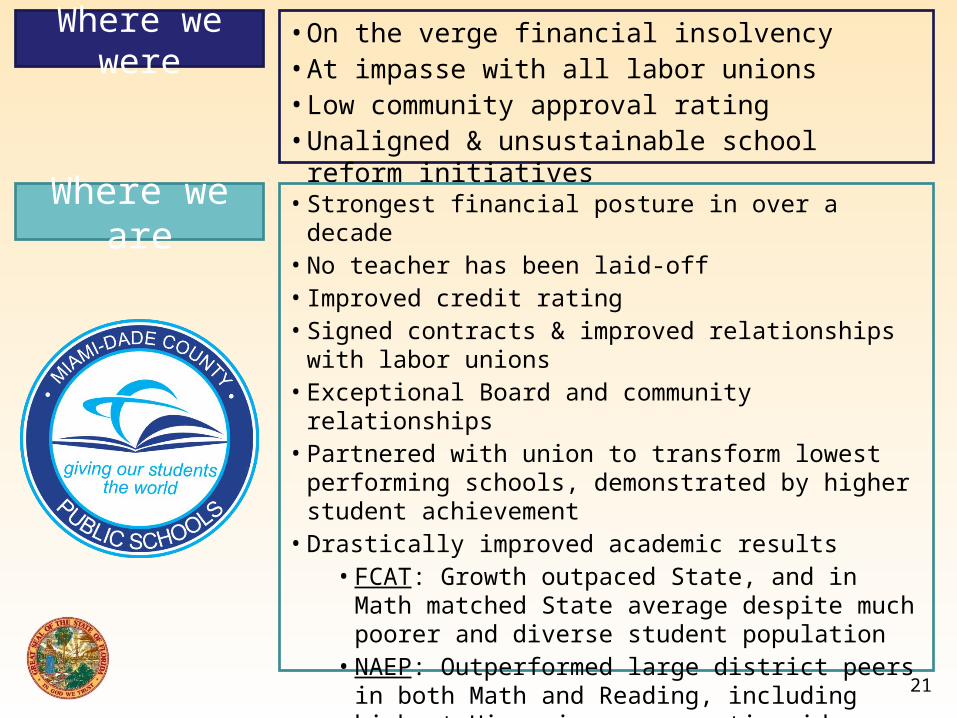
Where we were • On the verge financial insolvency• At impasse with all labor unions• Low community approval rating• Unaligned & unsustainable school reform initiatives
Where we are • Strongest financial posture in over a decade• No teacher has been laid-off• Improved credit rating• Signed contracts & improved relationships with labor
unions• Exceptional Board and community relationships• Partnered with union to transform lowest performing
schools, demonstrated by higher student achievement• Drastically improved academic results
• FCAT: Growth outpaced State, and in Math matched State average despite much poorer and diverse student population
• NAEP: Outperformed large district peers in both Math and Reading, including highest Hispanic scores nationwide

22
NAEP 8th Grade Reading ScoresMiami-Dade’s NAEP TUDA scores are higher than peer Districts across the board

23
Where we are going
A united and collaborative strategy focused on the core elements of human capital:
•Create a more robust and comprehensive data system to drive instruction and inform personnel decisions
•Develop human capital at administrative and teacher level to sustain and accelerate student achievement
•Refine compensation system to reflect and reward demonstrably effective performance
Teacher Effectiveness
Principal Effectiveness
Compensation Systems
R e d a c t e
d

24
Florida Is a Good Investment:
Florida Will Deliver!