Embed Size (px)
Citation preview

257257Braz. J. Biol., 2015, vol. 75, no. 3 (suppl.), p. S257-S276
http://dx.doi.org/10.1590/1519-6984.01814BM Original Article
Floristic and phytosociology in dense “terra firme” rainforest in the Belo Monte Hydroelectric Plant influence area, Pará, Brazil
Lemos, DAN.a,b*, Ferreira, BGA.c, Siqueira, JDP.b,c, Oliveira, MM.d,b and Ferreira, AM.b,c
aUniversity of La Coruña – UDC, Rúa da Maestranza, 9, 15001, La Coruña, SpainbSTCP Engenharia de Projetos Ltda., Rua Euzébio da Motta, 450, Juvevê, CEP 80530-260, Curitiba, PR, Brazil
cUniverside Federal do Paraná – UFPR, Rua dos Funcionários, 1540, Juvevê, CEP 80035-050, Curitiba, PR, BrazildInstituto Nacional de Pesquisas da Amazônia – INPA, Av. André Araújo, 2936, Aleixo,
CEP 69060-001, Manaus, AM, Brazil*e-mail: [email protected]
Received: May 5, 2014 – Accepted: March 20, 2015 – Distributed: August 31, 2015(With 3 figures)
AbstractThe objective of the present study was to characterise the floristic and phytosociological composition on a stretch of dense “Terra Firme” rainforest located in the Belo Monte hydroelectric plant area of influence, located in the state of Pará, Brazil. All trees with DAP > 10 cm situated in 75 permanent plots of 1 ha were inventoried. 27,126 individuals trees (361 ind.ha-1), distributed in 59 botanical families, comprising 481 species were observed. The families with the largest number of species were Fabaceae (94), Araceae (65) and Arecaceae (43), comprising 43.7% of total species. The species Alexa grandiflora (4.41), Cenostigma tocantinum (2.50) and Bertholletia excelsa (2.28) showed the highest importance values (IV). The ten species with greater IV are concentrated (22%). The forest community has high species richness and can be classified as diverse age trees, heterogeneous and of medium conservation condition.
Keywords: floristic survey, diversity, amazon species, rain forest.
Florística e fitossociologia de um trecho de Floresta ombrófila densa de terra firme na área de influência da Usina Hidrelétrica Belo Monte, Pará, Brasil
ResumoO presente estudo teve como objetivo caracterizar a composição florística e fitossociológica de um trecho de Floresta Ombrófila Densa de terra firme na área de influência da Usina Hidrelétrica Belo Monte, Pará, Brasil. Foram inventariadas todas as árvores com DAP > 10 cm em 75 parcelas permanentes de 1 ha. Foram observados 27.126 indivíduos arbóreos (361 ind.ha-1), distribuídos em 59 famílias botânicas, perfazendo 481 espécies. As famílias com maior número de espécies foram Fabaceae (94), Araceae (65) e Arecaceae (43), perfazendo 43,7% do total de espécies amostradas. As espécies Alexa grandiflora (4,41), Cenostigma tocantinum (2,50), Bertholletia excelsa (2,28), apresentaram os maiores valores de importância (VI), sendo que nas dez espécies com maiores IV, estão concentrados 22%. A comunidade florestal apresenta elevada riqueza florística e pode ser classificada como multiâneas, heterogêneas e com médio estado de conservação.
Palavra-chave: levantamento florístico, diversidade, espécies amazônicas, floresta tropical.
1. Introduction
Phytosociological studies have special interest in tropical forests due to the wide variety of patterns and processes related to their diversity. Tropical forests have gained importance in recent decades not only for their natural aspects but also for their social and economic aspects, leading to discussions in the scientific/ecological and social context (Lima et al., 2012). However, there are just a few studies on the floristic, structural and dynamics composition of these ecosystems. The consequences are major knowledge gaps in geographical terms, especially because there are found many floristically distinct forest
formations in regions of apparently homogeneous vegetation (Hopkins, 2007; Lima et al., 2012).
Among the tropical forests, dense rainforest is considered one of the most important ‘hot spots’ for its greatest richness and diversity (Laurance, 2008). Several studies have shown that plateau and slope forest environments exhibit high species diversity, represented by few individuals of each species and highly variable values of diversity and similarity (Lima Filho et al., 2004).
Information on forest structure and floristic composition obtained through forest inventories are among the main

Braz. J. Biol., 2015, vol. 75, no. 3 (suppl.), p. S257-S276258
Lemos, DAN. et al.
258
available tools to assess the potential of a forest and to choose the forest management strategies. In this context, the use of phytosociological criteria increases knowledge of species that belong to significant stretches of tropical forests. They enable the planning and execution of appropriate strategies for biodiversity conservation and development of more efficient environmental practices. Thus, the present study aimed to characterise the floristic and phytosociological composition on a stretch of dense “terra firme” rainforest situated in the Belo Monte hydroelectric plant area of influence, in the state of Pará, Brazil.
2. Material and Methods
The study site is located at a place called Volta Grande do Rio Xingu. It is situated in northern Brazil, at the Xingu River, a tributary on the right bank of the Amazon River in Pará state (03°26’ south latitude e 51°56’ west
longitude). Volta Grande do Rio Xingu is situated between the town of Altamira and the locations of Belo Monte and Belo Monte do Pontal, respectively located in the cities of Vitória do Xingu and Anapu. Forest types under study are characterised as Dense Rain Forest (FOD) “terra firme”. It is located in the direct and indirect area of influence of the Belo Monte Hydroelectric Plant (UHE Belo Monte). (Brasil, 2009) (Figure 1).
The region offers a variety of soil types like neossolos fluvic and lithic, ultisols, latosols, cambisoils, Haplic Gleysols and Nitosols Haplic (Brasil, 2009). According to Koppen’s classification, the area’s climate is tropical with monsoon rainfall. There is a short duration dry season which corresponds to (Am) classification and a humid tropical with a slightly pronounced dry season with very high rainfall (Amw) (Brasil, 2009).
Sampling and data collection followed RAPELD’s methodology described by the authors Magnusson et al.
Figure 1. Belo Monte hydroelectric plant’s area of influence and location of RAPELD sampling modules.
Braz. J. Biol., 2015, vol. 75, no. 3 (suppl.), p. S257-S276 259
Floristic and phytosociology in a dense rain forest “terra firme”’s stretch
259
(2005), which merges rapid assessments with long-term studies.
The sampling units were placed in the four compartments of Belo Monte as shown in Figure 1:
1) Xingu Reservoir (Modules 2/3),
2) Stretch of Low Flow (Modules 4/5),
3) Intermediate Reservoir (Modules 6/7), and
4) Stretch downstream of the main powerhouse (no intervention) (Modules 1/8).
Each RAPELD module is a 5 km2 area where two 5 km parallel transects were installed, 1 km apart, where 12 permanent 250m plots (6 in each transect) are installed. Those plots are 40 m wide, perpendicular to the transects and with a central axis following the contour line. However, from the 96 plots initially planned and required by the methodology (8 Modules x 12 plots per Module), it was not possible to install 13 due to land problems, thus making a total of 83 sampling units. From those, 75 were distributed in the dense “terra firme” rainforests (FOD). They were distributed in 8 RAPELD Modules. Floristic and phytosociological estimators were performed by sampling 75 permanent plots distributed in eight RAPELD modules. The plots were marked at 10 m from the transect in order to reduce the edge effect from the transect’s opening. Each parcel was 250m long and 40m wide (20 m on each side of the centerline) resulting in 1 ha per parcel. Individual trees sampled were at least 10cm breast height diameter (diameter measured at 1.30 m high).
To characterise the floristic composition of Belo Monte’s area of influence, the growth habits according to Raunkiaer classification (Raunkiaer, 1934) were considered. This was adapted to Brazilian conditions (IBGE, 2012) as follows: trees, shrubs, grass, holoepiphytes, hemiepiphytes, lianas and palms. Additionally, species richness was analysed based on the number of species and plant families found in this classification.
Data collection was carried out between March and December 2014. The dendometric quantified variables were breast height circumference (circumference at 1.30 m height above the ground) and height. Numbered metallic plates were used to identify the circumference measurements.
Tree species botanical identification occurred from the botanical collection of all sampled individuals. An average of 6 samples from each was collected. The botanical material was classified by family, genus and species. The reference was Angiosperm Phylogeny Group III. The unicata and a duplicate were deposited at the Emilio Goeldi Museum (MPEG); other duplicates were kept for the Federal University of Pará (UFPA) Campus Altamira and for the Botanical Museum of Curitiba City - Herbarium MBM collections.
To characterise the fragment’s horizontal structure, the following phytosociological parameters were analysed according to Müller-Dombois and Ellemberg (1974): absolute density (AD), relative density (RD), absolute
frequency (AF), relative frequency (RF), absolute dominance (ADo), relative dominance (RDo), coverage value (CV) and importance value (IV). The parameters were calculated at Microsoft Excel for Windows software 2007. Sample sufficiency was calculated by linear regression model with plateau response (REGRELRP), performed by the statistical program R (R Development Core Team, 2008).
3. Results
3.1. Floristic compositionThe sampled area revealed the presence of 726 species
in 297 genera and 79 botanical families for the eight RAPELD modules. Regarding species richness, families with greater representation were: Fabaceae (94 species) followed by the Araceae (65), Arecaceae (43), Sapotaceae (37), Moraceae (30), Orchidaceae (29), Marantaceae (26), Lauraceae (25), Lecythidaceae (21) and Annonaceae (21).
Rare families are considered those for which only one species was found. Very rare are those with a single species and a single individual found. Overall 26% of families can be classified as rare and 10% as very rare. The Fabaceae family is the botanical family with the greatest abundance.
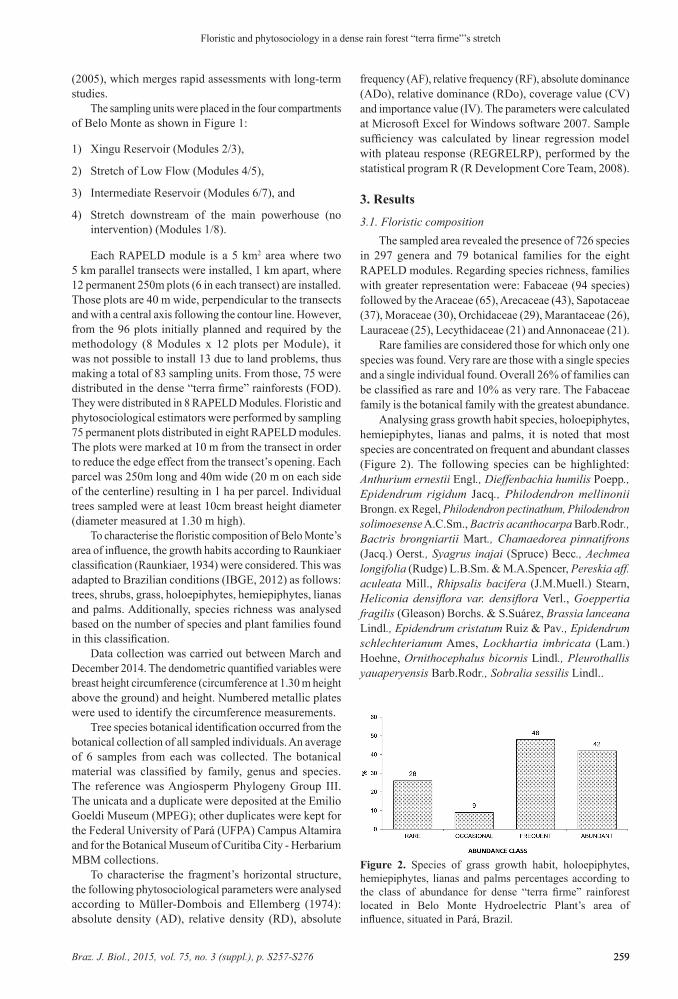
Analysing grass growth habit species, holoepiphytes, hemiepiphytes, lianas and palms, it is noted that most species are concentrated on frequent and abundant classes (Figure 2). The following species can be highlighted: Anthurium ernestii Engl., Dieffenbachia humilis Poepp., Epidendrum rigidum Jacq., Philodendron mellinonii Brongn. ex Regel, Philodendron pectinathum, Philodendron solimoesense A.C.Sm., Bactris acanthocarpa Barb.Rodr., Bactris brongniartii Mart., Chamaedorea pinnatifrons (Jacq.) Oerst., Syagrus inajai (Spruce) Becc., Aechmea longifolia (Rudge) L.B.Sm. & M.A.Spencer, Pereskia aff. aculeata Mill., Rhipsalis bacifera (J.M.Muell.) Stearn, Heliconia densiflora var. densiflora Verl., Goeppertia fragilis (Gleason) Borchs. & S.Suárez, Brassia lanceana Lindl., Epidendrum cristatum Ruiz & Pav., Epidendrum schlechterianum Ames, Lockhartia imbricata (Lam.) Hoehne, Ornithocephalus bicornis Lindl., Pleurothallis yauaperyensis Barb.Rodr., Sobralia sessilis Lindl..
Figure 2. Species of grass growth habit, holoepiphytes, hemiepiphytes, lianas and palms percentages according to the class of abundance for dense “terra firme” rainforest located in Belo Monte Hydroelectric Plant’s area of influence, situated in Pará, Brazil.

Braz. J. Biol., 2015, vol. 75, no. 3 (suppl.), p. S257-S276260
Lemos, DAN. et al.
260
3.2. Phytosociologycal compositionA total of 27,126 trees (361 ind.ha-1) were identified.
They are distributed in 59 families and 481 species. Species sampled on the 75 plots distributed at 8 RAPELD modules which are situated at UHE Belo Monte’s influence area are presented in alphabetical order in Table 1.
The highest absolute density species were: Cecropia obtusa (13.33), Theobroma speciosum (13.07), Alexa grandiflora (11.87), Cenostigma tocantinum (11.13), Guapira venosa (10.92), Vouacapoua americana (8.68), Mabea speciosa (7.03), Inga edulis (6.77), Cecropia membranacea (6.27) and Jacaranda copaia (6.15) (Table 1).
Overall, 3.4% are considered low occurrence species. In other words 16 species are represented by a single individual, amongst which can be mentioned Anacardium occidentale, Campsiandra laurifolia, Cariniana micranta, Copaifera multijuga and Dussia discolor. Among the species with higher relative dominance, Alexa grandiflora (8.82%), Bertholletia excelsa (5.39%), Cenostigma tocantinum (4.01%), Vouacapoua americana (3.65%), Cecropia obtusa (2.42%) and Inga edulis (2.01%) stand out.
The average basal area was 13.96 m2/ha. Basal area values were between 10 and 20 m2/ha. Distribution of trees by diameter class (Figure 3) demonstrate there is a
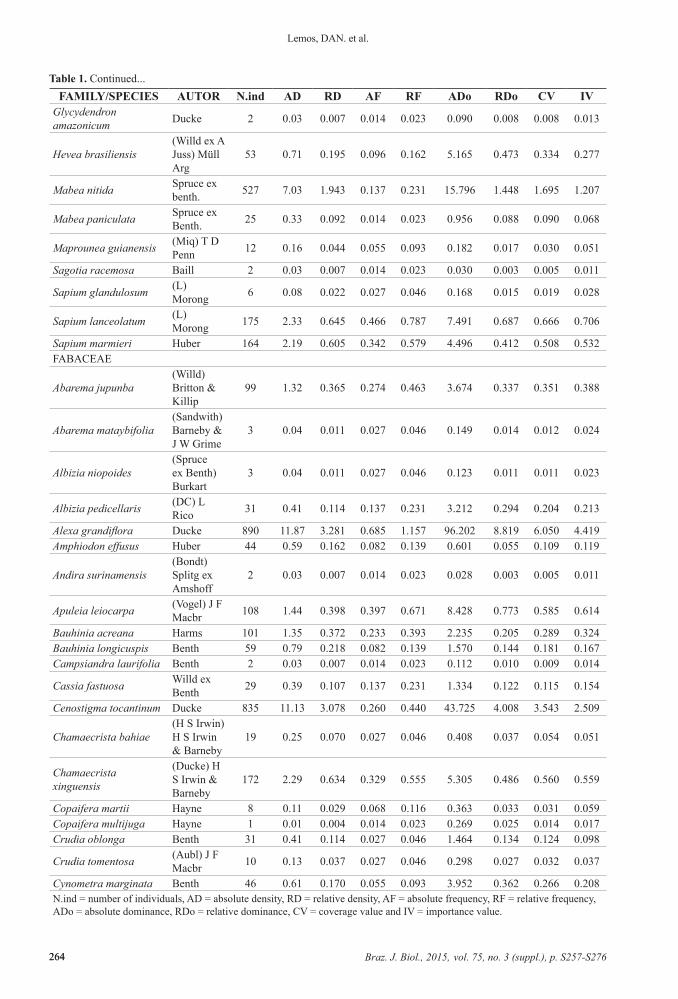
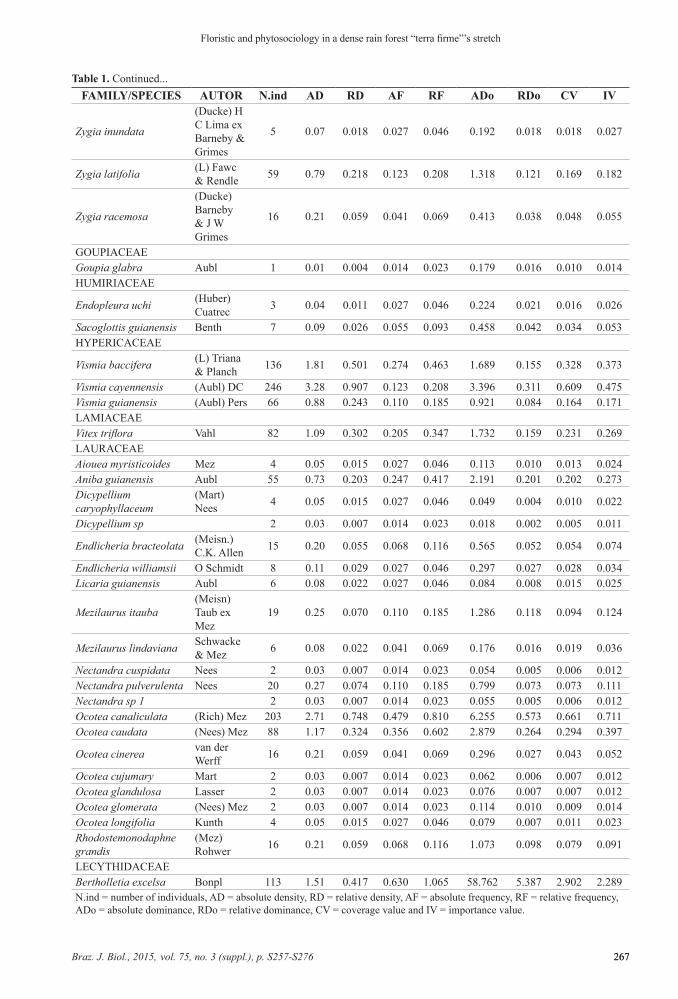
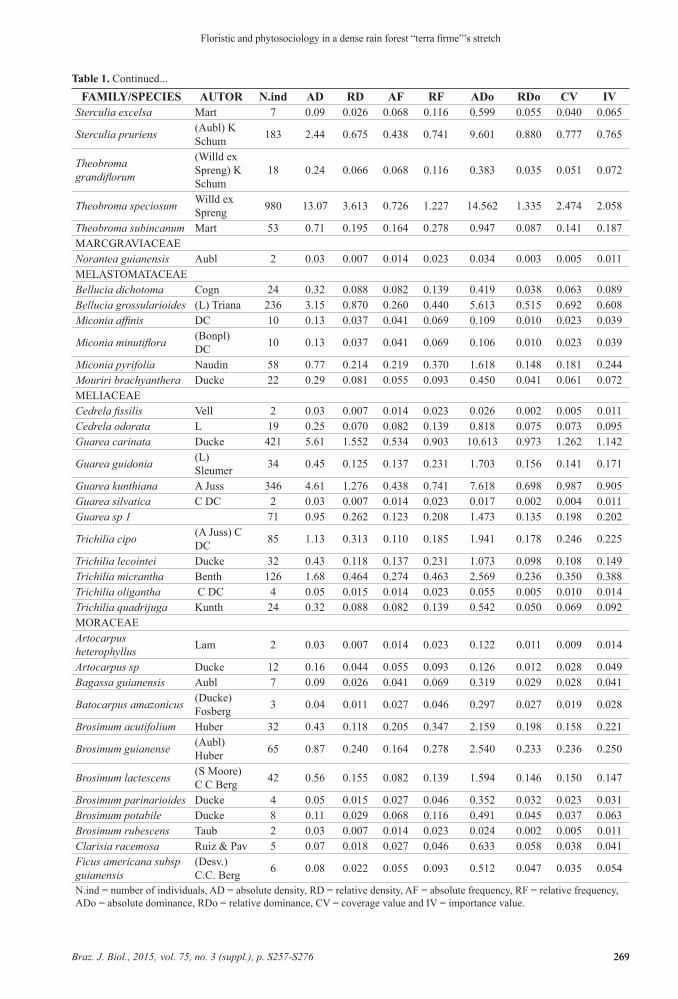
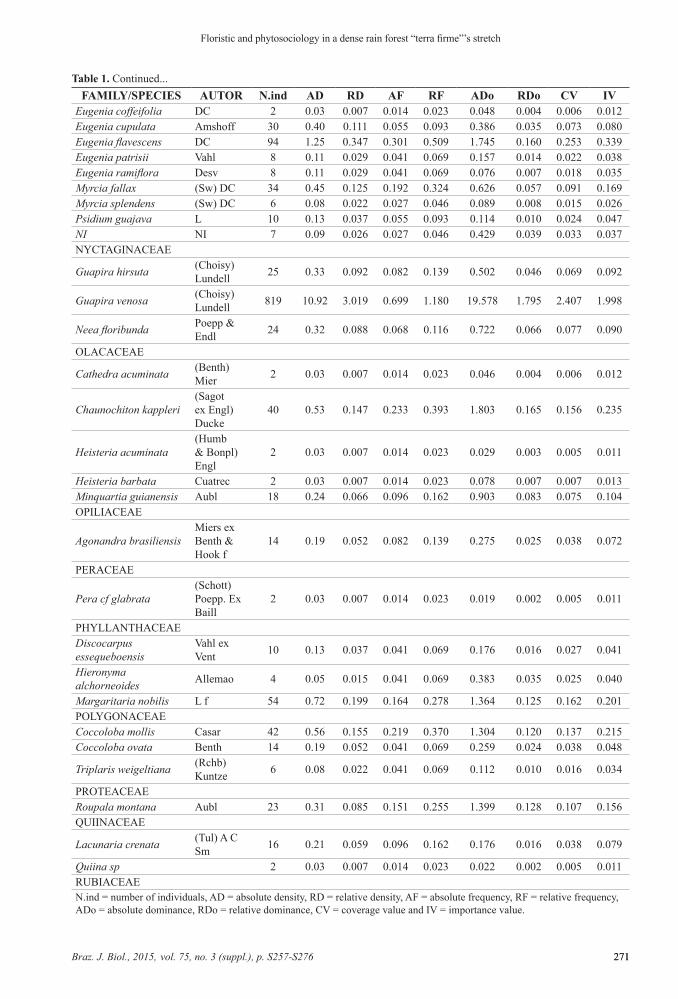
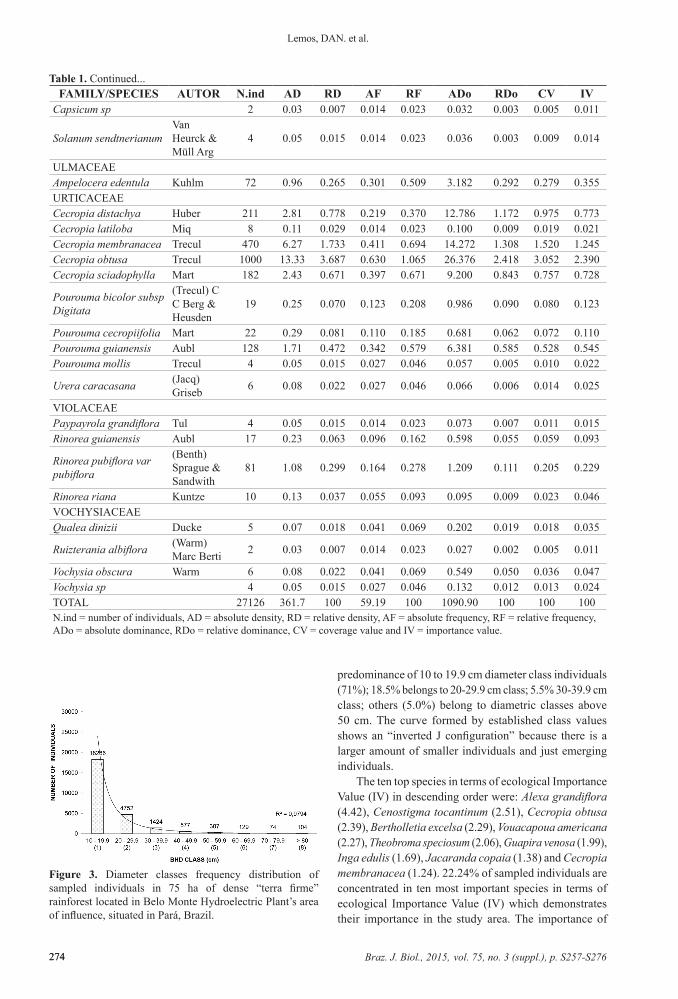
Table 1. List of family and species in alphabetical order and phytosociological descriptors estimation for the sampled tree comunities on 75 ha of dense “terra firme” rainforest located in Belo Monte Hydroelectric Plant’s area of influence, situated in Pará, Brazil.
FAMILY/SPECIES AUTOR N.ind AD RD AF RF ADo RDo CV IVACHARIACEAE
Lindackeria paludosa (Benth) Gilg 86 1.15 0.317 0.301 0.509 1.406 0.129 0.223 0.318
Mayna odorata Aubl 6 0.08 0.022 0.014 0.023 0.126 0.012 0.017 0.019ANACARDIACEAE
Anacardium giganteumW Hancock ex Engl
12 0.16 0.044 0.096 0.162 1.364 0.125 0.085 0.110
Anacardium occidentale L 1 0.01 0.004 0.014 0.023 0.078 0.007 0.005 0.011Anacardium spruceanum
Benth ex Engl 5 0.07 0.018 0.041 0.069 0.354 0.032 0.025 0.040
Astronium gracile Jacq 17 0.23 0.063 0.110 0.185 0.981 0.090 0.076 0.113Astronium lecointei Ducke 71 0.95 0.262 0.342 0.579 5.363 0.492 0.377 0.444Mangifera indica L 1 0.01 0.004 0.014 0.023 0.117 0.011 0.007 0.013Spondias mombin L 171 2.28 0.630 0.219 0.370 9.057 0.830 0.730 0.610Tapirira guianensis Aubl 67 0.89 0.247 0.274 0.463 2.667 0.244 0.246 0.318Thyrsodium spruceanum Benth 151 2.01 0.557 0.466 0.787 4.562 0.418 0.487 0.587ANNONACEAE
Anaxagorea prinoides (Dunal) A.DC 6 0.08 0.022 0.027 0.046 0.090 0.008 0.015 0.026
Annona edulis(Triana & Planch) H Rainer
9 0.12 0.033 0.055 0.093 0.234 0.021 0.027 0.049
Annona exsucca DC 131 1.75 0.483 0.329 0.555 2.115 0.194 0.338 0.411Annona hypoglauca Mart 4 0.05 0.015 0.014 0.023 0.043 0.004 0.009 0.014Annona montana Macfad 6 0.08 0.022 0.027 0.046 0.054 0.005 0.014 0.024Annona mucosa Jacq 4 0.05 0.015 0.027 0.046 0.047 0.004 0.010 0.022Cardiopetalum sp 6 0.08 0.022 0.027 0.046 0.072 0.007 0.014 0.025Duguetia echinophora R E Fr 12 0.16 0.044 0.027 0.046 0.266 0.024 0.034 0.038Duguetia flagellaris Huber 2 0.03 0.007 0.014 0.023 0.022 0.002 0.005 0.011Duguetia riparia Huber 4 0.05 0.015 0.027 0.046 0.198 0.018 0.016 0.026Fusaea longifolia (Aubl) Saff 74 0.99 0.273 0.178 0.301 2.199 0.202 0.237 0.258Guatteria poeppigiana Mart 146 1.95 0.538 0.438 0.741 4.171 0.382 0.460 0.554Guatteria schomburgkiana Mart 24 0.32 0.088 0.041 0.069 0.526 0.048 0.068 0.069
Guatteria sp 2 21 0.28 0.077 0.041 0.069 0.434 0.040 0.059 0.062Oxandra euneura Diels 232 3.09 0.855 0.288 0.486 3.751 0.344 0.600 0.562N.ind = number of individuals, AD = absolute density, RD = relative density, AF = absolute frequency, RF = relative frequency, ADo = absolute dominance, RDo = relative dominance, CV = coverage value and IV = importance value.
Braz. J. Biol., 2015, vol. 75, no. 3 (suppl.), p. S257-S276 261
Floristic and phytosociology in a dense rain forest “terra firme”’s stretch
261
Table 1. Continued... FAMILY/SPECIES AUTOR N.ind AD RD AF RF ADo RDo CV IV
Unonopsis guatterioides (A DC) R E Fr 16 0.21 0.059 0.068 0.116 0.205 0.019 0.039 0.064
Xylopia amazonica R E Fr 10 0.13 0.037 0.068 0.116 0.219 0.020 0.028 0.058Xylopia aromatica (Lam) Mart 33 0.44 0.122 0.137 0.231 0.816 0.075 0.098 0.143Xylopia nitida Dunal 55 0.73 0.203 0.260 0.440 2.179 0.200 0.201 0.281Xylopia sp 1 2 0.03 0.007 0.014 0.023 0.022 0.002 0.005 0.011APOCYNACEAEAspidosperma desmanthum
Benth ex Müll Arg 86 1.15 0.317 0.384 0.648 3.706 0.340 0.328 0.435
Aspidosperma excelsum Benth 58 0.77 0.214 0.329 0.555 5.844 0.536 0.375 0.435Aspidosperma sandwithianum Markgr 2 0.03 0.007 0.014 0.023 0.024 0.002 0.005 0.011
Aspidosperma sp 11 0.15 0.041 0.068 0.116 0.477 0.044 0.042 0.067Geissospermum sericeum Allemao 17 0.23 0.063 0.082 0.139 1.764 0.162 0.112 0.121
Geissospermum vellosii (Vell) Miers 25 0.33 0.092 0.137 0.231 0.816 0.075 0.083 0.133
Himatanthus sucuuba(Spruce ex Müll Arg) Woodson
36 0.48 0.133 0.164 0.278 1.029 0.094 0.114 0.168
Lacmellea aculeata (Ducke) Monach 13 0.17 0.048 0.055 0.093 0.492 0.045 0.046 0.062
Lacmellea arborescens (Müll Arg) Markgr 50 0.67 0.184 0.151 0.255 0.692 0.063 0.124 0.167
Parahancornia fasciculata
(Poir) Benoist 1 0.01 0.004 0.014 0.023 0.078 0.007 0.005 0.011
Tabernaemontana siphilitica
(L.f.) Leeuwenb. 6 0.08 0.022 0.027 0.046 0.049 0.004 0.013 0.024
ARALIACEAE
Schefflera morototoni
(Aubl) Maguire, Steyerm & Frodin
131 1.75 0.483 0.411 0.694 7.046 0.646 0.564 0.608
BIGNONIACEAE
Handroanthus impetiginosus
(Mart ex DC) Mattos
2 0.03 0.007 0.014 0.023 0.040 0.004 0.006 0.011
Handroanthus ochraceus
(Cham) Mattos 21 0.28 0.077 0.110 0.185 2.111 0.194 0.135 0.152
Handroanthus serratifolius
(A H Gentry) S Grose
30 0.40 0.111 0.123 0.208 1.047 0.096 0.103 0.138
Jacaranda copaia (Aubl) D Don 461 6.15 1.699 0.493 0.833 17.518 1.606 1.653 1.379
BIXACEAECochlospermum orinocense
(Kunth) Steud 155 2.07 0.571 0.110 0.185 3.544 0.325 0.448 0.360
BORAGINACEAECordia exaltata Lam 248 3.31 0.914 0.548 0.926 5.540 0.508 0.711 0.783Cordia goeldiana Huber 62 0.83 0.229 0.041 0.069 1.786 0.164 0.196 0.154Cordia nodosa Lam 24 0.32 0.088 0.137 0.231 0.288 0.026 0.057 0.115Cordia scabrifolia A DC 32 0.43 0.118 0.068 0.116 0.414 0.038 0.078 0.091Cordia sellowiana Cham 24 0.32 0.088 0.096 0.162 0.430 0.039 0.064 0.097N.ind = number of individuals, AD = absolute density, RD = relative density, AF = absolute frequency, RF = relative frequency, ADo = absolute dominance, RDo = relative dominance, CV = coverage value and IV = importance value.

Braz. J. Biol., 2015, vol. 75, no. 3 (suppl.), p. S257-S276262
Lemos, DAN. et al.
262
FAMILY/SPECIES AUTOR N.ind AD RD AF RF ADo RDo CV IVCordia tetrandra Aubl 29 0.39 0.107 0.027 0.046 2.242 0.206 0.156 0.120BURSERACEAE
Crepidospermum goudotianum
(Tul) Triana & Planch
76 1.01 0.280 0.247 0.417 2.938 0.269 0.275 0.322
Protium apiculatum Swart 162 2.16 0.597 0.288 0.486 3.686 0.338 0.468 0.474
Protium heptaphyllum (Aubl) Marchand 2 0.03 0.007 0.014 0.023 0.138 0.013 0.010 0.014
Protium pallidum Cuatrec 17 0.23 0.063 0.096 0.162 0.461 0.042 0.052 0.089Protium paniculatum Engl 2 0.03 0.007 0.014 0.023 0.016 0.001 0.004 0.011
Protium robustum (Swart) D M Porter 115 1.53 0.424 0.342 0.579 2.215 0.203 0.314 0.402
Protium subserratum (Engl) Engl 77 1.03 0.284 0.329 0.555 3.681 0.337 0.311 0.392Protium tenuifolium (Engl) Engl 110 1.47 0.406 0.219 0.370 2.814 0.258 0.332 0.345Protium trifoliatum Engl 7 0.09 0.026 0.027 0.046 0.218 0.020 0.023 0.031
Tetragastris altissima (Aubl) Swart 130 1.73 0.479 0.329 0.555 4.511 0.414 0.446 0.483
Tetragastris panamensis (Engl) Kuntze 355 4.73 1.309 0.356 0.602 15.721 1.441 1.375 1.117
Trattinnickia lawrancei Standl ex Swart 5 0.07 0.018 0.041 0.069 0.191 0.017 0.018 0.035
Trattinnickia rhoifolia Willd 31 0.41 0.114 0.123 0.208 1.355 0.124 0.119 0.149CALOPHYLLACEAECaraipa densifolia Mart 3 0.04 0.011 0.014 0.023 0.123 0.011 0.011 0.015CANNABACEAETrema micrantha (L) Blume 12 0.16 0.044 0.027 0.046 0.232 0.021 0.033 0.037CAPPARACEAECapparis amazonica (L) J Presl 14 0.19 0.052 0.041 0.069 0.193 0.018 0.035 0.046CARICACEAE
Jacaratia spinosa (Aubl) A DC 329 4.39 1.213 0.479 0.810 16.141 1.480 1.346 1.167
CARYOCARACEAECaryocar glabrum (Aubl) Pers 4 0.05 0.015 0.027 0.046 0.088 0.008 0.011 0.023Caryocar villosum (Aubl) Pers 2 0.03 0.007 0.014 0.023 0.019 0.002 0.005 0.011CELASTRACEAEMaytenus myrsinoides Reissek 2 0.03 0.007 0.014 0.023 0.094 0.009 0.008 0.013Maytenus sp 2 1 0.01 0.004 0.014 0.023 0.089 0.008 0.006 0.012CHRYSOBALANACEAECouepia guianensis Aubl 19 0.25 0.070 0.027 0.046 0.560 0.051 0.061 0.056
Hirtella bicornis Mart & Zucc 2 0.03 0.007 0.014 0.023 0.017 0.002 0.004 0.011
Hirtella eriandra Benth 102 1.36 0.376 0.219 0.370 2.851 0.261 0.319 0.336Hirtella hispidula Miq 8 0.11 0.029 0.027 0.046 0.144 0.013 0.021 0.030
Licania apetala (E Mey) Fritsch 4 0.05 0.015 0.027 0.046 0.074 0.007 0.011 0.023
Licania guianensis (Aubl) Griseb 15 0.20 0.055 0.110 0.185 0.922 0.084 0.070 0.108
Licania heteromorpha Benth 113 1.51 0.417 0.384 0.648 3.275 0.300 0.358 0.455
Licania longistyla (Hook f) Fritsch 22 0.29 0.081 0.055 0.093 0.583 0.053 0.067 0.076
Licania membranacea Sagot ex Laness 9 0.12 0.033 0.068 0.116 0.269 0.025 0.029 0.058
N.ind = number of individuals, AD = absolute density, RD = relative density, AF = absolute frequency, RF = relative frequency, ADo = absolute dominance, RDo = relative dominance, CV = coverage value and IV = importance value.
Table 1. Continued...

Braz. J. Biol., 2015, vol. 75, no. 3 (suppl.), p. S257-S276 263
Floristic and phytosociology in a dense rain forest “terra firme”’s stretch
263
Table 1. Continued... FAMILY/SPECIES AUTOR N.ind AD RD AF RF ADo RDo CV IV
Licania octandra
(Hoffmanns ex Roem & Schult) Kuntze
19 0.25 0.070 0.068 0.116 0.590 0.054 0.062 0.080
Licania sclerophylla (Hook f) Fritsch 2 0.03 0.007 0.014 0.023 0.045 0.004 0.006 0.012
Licania unguiculata Prance 3 0.04 0.011 0.027 0.046 0.223 0.020 0.016 0.026Parinari excelsa Sabine 54 0.72 0.199 0.192 0.324 3.086 0.283 0.241 0.269CLUSIACEAECarapa guianensis Aubl 157 2.09 0.579 0.260 0.440 10.377 0.951 0.765 0.657
Garcinia gardneriana(Planch & Triana) Zappi
12 0.16 0.044 0.055 0.093 0.120 0.011 0.028 0.049
Garcinia macrophylla Mart 45 0.60 0.166 0.164 0.278 0.926 0.085 0.125 0.176Moronobea candida Ducke 2 0.03 0.007 0.014 0.023 0.035 0.003 0.005 0.011Symphonia globulifera L f 5 0.07 0.018 0.041 0.069 0.259 0.024 0.021 0.037
Tovomita choisyana Planch & Triana 1 0.01 0.004 0.014 0.023 0.080 0.007 0.006 0.011
COMBRETACEAEBuchenavia grandis Ducke 5 0.07 0.018 0.041 0.069 2.428 0.223 0.121 0.103
Buchenavia oxycarpa (Mart) Eichler 12 0.16 0.044 0.014 0.023 0.324 0.030 0.037 0.032
Terminalia amazonia (J F Gmel) Exell 29 0.39 0.107 0.137 0.231 2.668 0.245 0.176 0.194
Terminalia argentea Mart 20 0.27 0.074 0.110 0.185 1.722 0.158 0.116 0.139Terminalia dichotoma E Mey 5 0.07 0.018 0.041 0.069 0.844 0.077 0.048 0.055CONNARACEAE
Connarus erianthus Benth ex Baker 2 0.03 0.007 0.014 0.023 0.016 0.001 0.004 0.011
EBENACEAEDiospyros artanthifolia Mart 12 0.16 0.044 0.055 0.093 0.175 0.016 0.030 0.051
Diospyros capreifolia Mart ex Hiern 4 0.05 0.015 0.014 0.023 0.073 0.007 0.011 0.015
Diospyros guianensis (Aubl) Gürke 9 0.12 0.033 0.055 0.093 5.478 0.502 0.268 0.209
Diospyros vestita Benoist 138 1.84 0.509 0.425 0.717 4.869 0.446 0.478 0.558ELAEOCARPACEAESloanea eichleri K Schum 5 0.07 0.018 0.027 0.046 0.252 0.023 0.021 0.029Sloanea garckeana K Schum 2 0.03 0.007 0.014 0.023 0.058 0.005 0.006 0.012Sloanea grandiflora Sm 63 0.84 0.232 0.192 0.324 1.429 0.131 0.182 0.229
Sloanea guianensis (Aubl) Benth 2 0.03 0.007 0.014 0.023 0.075 0.007 0.007 0.012
ERYTHROXYLACEAEErythroxylum amplum Benth 4 0.05 0.015 0.014 0.023 0.051 0.005 0.010 0.014EUPHORBIACEAEActinostemon amazonicus
Pax & K. Hoffm. 10 0.13 0.037 0.027 0.046 0.136 0.012 0.025 0.032
Alchornea schomburgkii Poepp 2 0.03 0.007 0.014 0.023 0.026 0.002 0.005 0.011Croton glandulosus L 20 0.27 0.074 0.041 0.069 0.308 0.028 0.051 0.057Croton sp 10 0.13 0.037 0.027 0.046 0.136 0.012 0.025 0.032
Dodecastigma integrifolium
(Lanj) Lanj & Sandwith
14 0.19 0.052 0.055 0.093 0.150 0.014 0.033 0.053
N.ind = number of individuals, AD = absolute density, RD = relative density, AF = absolute frequency, RF = relative frequency, ADo = absolute dominance, RDo = relative dominance, CV = coverage value and IV = importance value.
Braz. J. Biol., 2015, vol. 75, no. 3 (suppl.), p. S257-S276264
Lemos, DAN. et al.
264
Table 1. Continued... FAMILY/SPECIES AUTOR N.ind AD RD AF RF ADo RDo CV IV
Glycydendron amazonicum Ducke 2 0.03 0.007 0.014 0.023 0.090 0.008 0.008 0.013
Hevea brasiliensis(Willd ex A Juss) Müll Arg
53 0.71 0.195 0.096 0.162 5.165 0.473 0.334 0.277
Mabea nitida Spruce ex benth. 527 7.03 1.943 0.137 0.231 15.796 1.448 1.695 1.207
Mabea paniculata Spruce ex Benth. 25 0.33 0.092 0.014 0.023 0.956 0.088 0.090 0.068
Maprounea guianensis (Miq) T D Penn 12 0.16 0.044 0.055 0.093 0.182 0.017 0.030 0.051
Sagotia racemosa Baill 2 0.03 0.007 0.014 0.023 0.030 0.003 0.005 0.011
Sapium glandulosum (L) Morong 6 0.08 0.022 0.027 0.046 0.168 0.015 0.019 0.028
Sapium lanceolatum (L) Morong 175 2.33 0.645 0.466 0.787 7.491 0.687 0.666 0.706
Sapium marmieri Huber 164 2.19 0.605 0.342 0.579 4.496 0.412 0.508 0.532FABACEAE
Abarema jupunba(Willd) Britton & Killip
99 1.32 0.365 0.274 0.463 3.674 0.337 0.351 0.388
Abarema mataybifolia(Sandwith) Barneby & J W Grime
3 0.04 0.011 0.027 0.046 0.149 0.014 0.012 0.024
Albizia niopoides(Spruce ex Benth) Burkart
3 0.04 0.011 0.027 0.046 0.123 0.011 0.011 0.023
Albizia pedicellaris (DC) L Rico 31 0.41 0.114 0.137 0.231 3.212 0.294 0.204 0.213
Alexa grandiflora Ducke 890 11.87 3.281 0.685 1.157 96.202 8.819 6.050 4.419Amphiodon effusus Huber 44 0.59 0.162 0.082 0.139 0.601 0.055 0.109 0.119
Andira surinamensis(Bondt) Splitg ex Amshoff
2 0.03 0.007 0.014 0.023 0.028 0.003 0.005 0.011
Apuleia leiocarpa (Vogel) J F Macbr 108 1.44 0.398 0.397 0.671 8.428 0.773 0.585 0.614
Bauhinia acreana Harms 101 1.35 0.372 0.233 0.393 2.235 0.205 0.289 0.324Bauhinia longicuspis Benth 59 0.79 0.218 0.082 0.139 1.570 0.144 0.181 0.167Campsiandra laurifolia Benth 2 0.03 0.007 0.014 0.023 0.112 0.010 0.009 0.014
Cassia fastuosa Willd ex Benth 29 0.39 0.107 0.137 0.231 1.334 0.122 0.115 0.154
Cenostigma tocantinum Ducke 835 11.13 3.078 0.260 0.440 43.725 4.008 3.543 2.509
Chamaecrista bahiae(H S Irwin) H S Irwin & Barneby
19 0.25 0.070 0.027 0.046 0.408 0.037 0.054 0.051
Chamaecrista xinguensis
(Ducke) H S Irwin & Barneby
172 2.29 0.634 0.329 0.555 5.305 0.486 0.560 0.559
Copaifera martii Hayne 8 0.11 0.029 0.068 0.116 0.363 0.033 0.031 0.059Copaifera multijuga Hayne 1 0.01 0.004 0.014 0.023 0.269 0.025 0.014 0.017Crudia oblonga Benth 31 0.41 0.114 0.027 0.046 1.464 0.134 0.124 0.098
Crudia tomentosa (Aubl) J F Macbr 10 0.13 0.037 0.027 0.046 0.298 0.027 0.032 0.037
Cynometra marginata Benth 46 0.61 0.170 0.055 0.093 3.952 0.362 0.266 0.208N.ind = number of individuals, AD = absolute density, RD = relative density, AF = absolute frequency, RF = relative frequency, ADo = absolute dominance, RDo = relative dominance, CV = coverage value and IV = importance value.

Braz. J. Biol., 2015, vol. 75, no. 3 (suppl.), p. S257-S276 265
Floristic and phytosociology in a dense rain forest “terra firme”’s stretch
265
Table 1. Continued... FAMILY/SPECIES AUTOR N.ind AD RD AF RF ADo RDo CV IV
Dialium guianense (Aubl) Sandwith 172 2.29 0.634 0.493 0.833 4.863 0.446 0.540 0.638
Diplotropis purpurea (Rich) Amshoff 11 0.15 0.041 0.068 0.116 0.264 0.024 0.032 0.060
Dipteryx odorata (Aubl) Willd 16 0.21 0.059 0.110 0.185 0.976 0.089 0.074 0.111
Dussia discolor (Benth) Amshoff 3 0.04 0.011 0.027 0.046 0.200 0.018 0.015 0.025
Enterolobium maximum Ducke 12 0.16 0.044 0.110 0.185 1.584 0.145 0.095 0.125Enterolobium schomburgkii
(Benth) Benth 26 0.35 0.096 0.192 0.324 2.045 0.187 0.142 0.202
Erythrina fusca Lour 35 0.47 0.129 0.192 0.324 1.306 0.120 0.124 0.191
Hydrochorea corymbosa
(Rich) Barneby & J W Grimes
22 0.29 0.081 0.027 0.046 0.716 0.066 0.073 0.064
Hymenaea courbaril L 26 0.35 0.096 0.151 0.255 6.594 0.604 0.350 0.318Hymenaea intermedia Ducke 22 0.29 0.081 0.096 0.162 1.180 0.108 0.095 0.117Hymenaea oblongifolia Huber 17 0.23 0.063 0.055 0.093 0.649 0.059 0.061 0.072Hymenaea parvifolia Huber 7 0.09 0.026 0.055 0.093 0.619 0.057 0.041 0.058Hymenolobium petraeum Ducke 8 0.11 0.029 0.055 0.093 0.115 0.011 0.020 0.044
Inga alba (Sw) Willd 327 4.36 1.205 0.603 1.018 13.518 1.239 1.222 1.154Inga auristellae Harms 6 0.08 0.022 0.041 0.069 0.079 0.007 0.015 0.033Inga brachystachys Ducke 262 3.49 0.966 0.521 0.879 5.876 0.539 0.752 0.795Inga capitata Desv 57 0.76 0.210 0.233 0.393 1.181 0.108 0.159 0.237
Inga cayennensis Sagot ex Benth 39 0.52 0.144 0.151 0.255 0.970 0.089 0.116 0.162
Inga edulis Mart 505 6.73 1.862 0.712 1.203 21.884 2.006 1.934 1.690Inga gracilifolia Ducke 2 0.03 0.007 0.014 0.023 0.016 0.001 0.004 0.011Inga grandiflora Ducke 10 0.13 0.037 0.041 0.069 0.154 0.014 0.026 0.040Inga heterophylla Willd 115 1.53 0.424 0.397 0.671 2.713 0.249 0.336 0.448Inga laurina (Sw) Willd 28 0.37 0.103 0.137 0.231 0.619 0.057 0.080 0.130Inga nobilis Willd 16 0.21 0.059 0.055 0.093 0.191 0.018 0.038 0.056Inga paraensis Ducke 248 3.31 0.914 0.479 0.810 7.737 0.709 0.812 0.811Inga rubiginosa (Rich) DC 195 2.60 0.719 0.205 0.347 8.886 0.815 0.767 0.627Inga sapindoides Willd 2 0.03 0.007 0.014 0.023 0.019 0.002 0.005 0.011Inga sp 3 2 0.03 0.007 0.014 0.023 0.031 0.003 0.005 0.011Inga splendens Willd 16 0.21 0.059 0.082 0.139 0.255 0.023 0.041 0.074Inga thibaudiana DC 166 2.21 0.612 0.329 0.555 3.061 0.281 0.446 0.483Machaerium sp 1 1 0.01 0.004 0.014 0.023 0.165 0.015 0.009 0.014Machaerium sp 2 4 0.05 0.015 0.014 0.023 0.077 0.007 0.011 0.015Macrolobium acaciifolium Benth 4 0.05 0.015 0.014 0.023 0.047 0.004 0.010 0.014
Macrolobium bifolium (Aubl) Pers 4 0.05 0.015 0.027 0.046 0.152 0.014 0.014 0.025
Mora paraensis (Ducke) Ducke 12 0.16 0.044 0.014 0.023 1.487 0.136 0.090 0.068
Mucuna urens (L) Medik 4 0.05 0.015 0.027 0.046 0.098 0.009 0.012 0.023Ormosia coutinhoi Ducke 2 0.03 0.007 0.014 0.023 0.094 0.009 0.008 0.013
Ormosia flava (Ducke) Rudd 4 0.05 0.015 0.041 0.069 0.652 0.060 0.037 0.048
Ormosia paraensis Ducke 6 0.08 0.022 0.041 0.069 0.062 0.006 0.014 0.032N.ind = number of individuals, AD = absolute density, RD = relative density, AF = absolute frequency, RF = relative frequency, ADo = absolute dominance, RDo = relative dominance, CV = coverage value and IV = importance value.

Braz. J. Biol., 2015, vol. 75, no. 3 (suppl.), p. S257-S276266
Lemos, DAN. et al.
266
Table 1. Continued... FAMILY/SPECIES AUTOR N.ind AD RD AF RF ADo RDo CV IV
Parkia multijuga Benth 40 0.53 0.147 0.219 0.370 6.884 0.631 0.389 0.383
Parkia pendula(Willd) Benth ex Walp
12 0.16 0.044 0.110 0.185 3.865 0.354 0.199 0.195
Parkia ulei (Harms) Kuhlm 1 0.01 0.004 0.014 0.023 0.081 0.007 0.006 0.011
Parkia velutina Benoist 2 0.03 0.007 0.014 0.023 0.077 0.007 0.007 0.013Platymiscium filipes Benth 13 0.17 0.048 0.096 0.162 0.862 0.079 0.063 0.096
Pseudopiptadenia psilostachya
(DC) G P Lewis & M P Lima
40 0.53 0.147 0.164 0.278 3.796 0.348 0.248 0.258
Pseudopiptadenia suaveolens
(Miq) J W Grimes 3 0.04 0.011 0.027 0.046 0.153 0.014 0.013 0.024
Pterocarpus amazonum L’Her ex DC 17 0.23 0.063 0.014 0.023 0.576 0.053 0.058 0.046
Pterocarpus officinalis Jacq 115 1.53 0.424 0.233 0.393 9.248 0.848 0.636 0.555Pterocarpus rohrii Vahl 16 0.21 0.059 0.096 0.162 0.624 0.057 0.058 0.093Samanea saman (Jacq) Merr 3 0.04 0.011 0.014 0.023 0.287 0.026 0.019 0.020
Schizolobium parahyba var Amazonicum
(Huber ex Ducke) Barneby
315 4.20 1.161 0.315 0.532 18.452 1.691 1.426 1.128
Senegalia polyphylla(DC) Britton & Rose
155 2.07 0.571 0.247 0.417 4.442 0.407 0.489 0.465
Senna multijuga(Rich) H S Irwin & Barneby
234 3.12 0.863 0.315 0.532 6.523 0.598 0.730 0.664
Senna silvestris (Vell) H S Irwin & Barneby
6 0.08 0.022 0.014 0.023 0.136 0.012 0.017 0.019
Stryphnodendron adstringens
(Mart) Coville 45 0.60 0.166 0.137 0.231 0.877 0.080 0.123 0.159
Stryphnodendron guianense
(Aubl) Benth 107 1.43 0.394 0.315 0.532 3.759 0.345 0.370 0.424
Stryphnodendron paniculatum
Poepp & Endl 49 0.65 0.181 0.233 0.393 4.591 0.421 0.301 0.332
Stryphnodendron pulcherrimum
(Willd) Hochr 10 0.13 0.037 0.041 0.069 0.184 0.017 0.027 0.041
Swartzia arborescens (Aubl) Pittier 14 0.19 0.052 0.041 0.069 0.265 0.024 0.038 0.048
Swartzia flaemingii Raddi 42 0.56 0.155 0.178 0.301 0.745 0.068 0.112 0.175Swartzia laurifolia Benth 85 1.13 0.313 0.425 0.717 2.063 0.189 0.251 0.407Swartzia polyphylla DC 6 0.08 0.022 0.055 0.093 0.534 0.049 0.036 0.055Swartzia sp 5 0.07 0.018 0.041 0.069 0.308 0.028 0.023 0.039Tachigali chrysophylla Poepp 7 0.09 0.026 0.027 0.046 1.483 0.136 0.081 0.069
Tachigali myrmecophila (Ducke) Ducke 326 4.35 1.202 0.712 1.203 9.640 0.884 1.043 1.096
Tachigali paniculata Aubl 17 0.23 0.063 0.082 0.139 1.489 0.136 0.100 0.113Vataieropsis sp 19 0.25 0.070 0.055 0.093 0.818 0.075 0.073 0.079Vatairea guianensis Aubl 30 0.40 0.111 0.041 0.069 1.732 0.159 0.135 0.113Vouacapoua americana Aubl 651 8.68 2.400 0.438 0.741 39.868 3.655 3.027 2.265Zollernia paraensis Huber 33 0.44 0.122 0.151 0.255 1.523 0.140 0.131 0.172
Zygia cauliflora (Willd) Killip 19 0.25 0.070 0.055 0.093 0.305 0.028 0.049 0.064
N.ind = number of individuals, AD = absolute density, RD = relative density, AF = absolute frequency, RF = relative frequency, ADo = absolute dominance, RDo = relative dominance, CV = coverage value and IV = importance value.
Braz. J. Biol., 2015, vol. 75, no. 3 (suppl.), p. S257-S276 267
Floristic and phytosociology in a dense rain forest “terra firme”’s stretch
267
Table 1. Continued... FAMILY/SPECIES AUTOR N.ind AD RD AF RF ADo RDo CV IV
Zygia inundata
(Ducke) H C Lima ex Barneby & Grimes
5 0.07 0.018 0.027 0.046 0.192 0.018 0.018 0.027
Zygia latifolia (L) Fawc & Rendle 59 0.79 0.218 0.123 0.208 1.318 0.121 0.169 0.182
Zygia racemosa
(Ducke) Barneby & J W Grimes
16 0.21 0.059 0.041 0.069 0.413 0.038 0.048 0.055
GOUPIACEAEGoupia glabra Aubl 1 0.01 0.004 0.014 0.023 0.179 0.016 0.010 0.014HUMIRIACEAE
Endopleura uchi (Huber) Cuatrec 3 0.04 0.011 0.027 0.046 0.224 0.021 0.016 0.026
Sacoglottis guianensis Benth 7 0.09 0.026 0.055 0.093 0.458 0.042 0.034 0.053HYPERICACEAE
Vismia baccifera (L) Triana & Planch 136 1.81 0.501 0.274 0.463 1.689 0.155 0.328 0.373
Vismia cayennensis (Aubl) DC 246 3.28 0.907 0.123 0.208 3.396 0.311 0.609 0.475Vismia guianensis (Aubl) Pers 66 0.88 0.243 0.110 0.185 0.921 0.084 0.164 0.171LAMIACEAEVitex triflora Vahl 82 1.09 0.302 0.205 0.347 1.732 0.159 0.231 0.269LAURACEAEAiouea myristicoides Mez 4 0.05 0.015 0.027 0.046 0.113 0.010 0.013 0.024Aniba guianensis Aubl 55 0.73 0.203 0.247 0.417 2.191 0.201 0.202 0.273Dicypellium caryophyllaceum
(Mart) Nees 4 0.05 0.015 0.027 0.046 0.049 0.004 0.010 0.022
Dicypellium sp 2 0.03 0.007 0.014 0.023 0.018 0.002 0.005 0.011
Endlicheria bracteolata (Meisn.) C.K. Allen 15 0.20 0.055 0.068 0.116 0.565 0.052 0.054 0.074
Endlicheria williamsii O Schmidt 8 0.11 0.029 0.027 0.046 0.297 0.027 0.028 0.034Licaria guianensis Aubl 6 0.08 0.022 0.027 0.046 0.084 0.008 0.015 0.025
Mezilaurus itauba(Meisn) Taub ex Mez
19 0.25 0.070 0.110 0.185 1.286 0.118 0.094 0.124
Mezilaurus lindaviana Schwacke & Mez 6 0.08 0.022 0.041 0.069 0.176 0.016 0.019 0.036
Nectandra cuspidata Nees 2 0.03 0.007 0.014 0.023 0.054 0.005 0.006 0.012Nectandra pulverulenta Nees 20 0.27 0.074 0.110 0.185 0.799 0.073 0.073 0.111Nectandra sp 1 2 0.03 0.007 0.014 0.023 0.055 0.005 0.006 0.012Ocotea canaliculata (Rich) Mez 203 2.71 0.748 0.479 0.810 6.255 0.573 0.661 0.711Ocotea caudata (Nees) Mez 88 1.17 0.324 0.356 0.602 2.879 0.264 0.294 0.397
Ocotea cinerea van der Werff 16 0.21 0.059 0.041 0.069 0.296 0.027 0.043 0.052
Ocotea cujumary Mart 2 0.03 0.007 0.014 0.023 0.062 0.006 0.007 0.012Ocotea glandulosa Lasser 2 0.03 0.007 0.014 0.023 0.076 0.007 0.007 0.012Ocotea glomerata (Nees) Mez 2 0.03 0.007 0.014 0.023 0.114 0.010 0.009 0.014Ocotea longifolia Kunth 4 0.05 0.015 0.027 0.046 0.079 0.007 0.011 0.023Rhodostemonodaphne grandis
(Mez) Rohwer 16 0.21 0.059 0.068 0.116 1.073 0.098 0.079 0.091
LECYTHIDACEAEBertholletia excelsa Bonpl 113 1.51 0.417 0.630 1.065 58.762 5.387 2.902 2.289N.ind = number of individuals, AD = absolute density, RD = relative density, AF = absolute frequency, RF = relative frequency, ADo = absolute dominance, RDo = relative dominance, CV = coverage value and IV = importance value.

Braz. J. Biol., 2015, vol. 75, no. 3 (suppl.), p. S257-S276268
Lemos, DAN. et al.
268
Table 1. Continued... FAMILY/SPECIES AUTOR N.ind AD RD AF RF ADo RDo CV IV
Cariniana micrantha Ducke 1 0.01 0.004 0.014 0.023 1.611 0.148 0.076 0.058Couratari guianensis Aubl 68 0.91 0.251 0.260 0.440 5.514 0.505 0.378 0.399Couratari multiflora (Sm) Eyma 24 0.32 0.088 0.110 0.185 2.623 0.240 0.164 0.171
Couratari oblongifolia Ducke & Knuth 3 0.04 0.011 0.014 0.023 0.214 0.020 0.015 0.018
Couratari stellata A C Sm 13 0.17 0.048 0.027 0.046 0.398 0.037 0.042 0.044Eschweilera amazonica R Knuth 2 0.03 0.007 0.014 0.023 0.127 0.012 0.010 0.014
Eschweilera bracteosa(Poepp ex O Berg) Miers
12 0.16 0.044 0.041 0.069 0.314 0.029 0.037 0.047
Eschweilera coriacea (DC) S A Mori 196 2.61 0.723 0.452 0.764 7.230 0.663 0.693 0.716
Eschweilera grandiflora (Aubl) Sandwith 8 0.11 0.029 0.068 0.116 0.471 0.043 0.036 0.063
Eschweilera pedicellata (Rich) S A Mori 22 0.29 0.081 0.082 0.139 0.503 0.046 0.064 0.089
Eschweilera sp 5 0.07 0.018 0.027 0.046 0.222 0.020 0.019 0.028Gustavia augusta L 82 1.09 0.302 0.315 0.532 1.138 0.104 0.203 0.313Gustavia hexapetala (Aubl) Sm 246 3.28 0.907 0.521 0.879 3.584 0.329 0.618 0.705Holopixidium itacaiunensis Pires 213 2.84 0.785 0.301 0.509 5.488 0.503 0.644 0.599
Lecythis confertiflora (A C Sm) S A Mori 2 0.03 0.007 0.014 0.023 0.033 0.003 0.005 0.011
Lecythis corrugata Poit 197 2.63 0.726 0.205 0.347 5.192 0.476 0.601 0.516
Lecythis holcogyne (Sandwith) S A Mori 4 0.05 0.015 0.014 0.023 0.076 0.007 0.011 0.015
Lecythis idatimon Aubl 78 1.04 0.288 0.068 0.116 2.140 0.196 0.242 0.200
Lecythis lurida (Miers) S A Mori 104 1.39 0.383 0.233 0.393 3.464 0.318 0.350 0.365
Lecythis pisonis Cambess 21 0.28 0.077 0.123 0.208 3.738 0.343 0.210 0.209MALPIGHIACEAEByrsonima aerugo Sagot 21 0.28 0.077 0.055 0.093 0.658 0.060 0.069 0.077Byrsonima chrysophylla Kunth 9 0.12 0.033 0.068 0.116 0.304 0.028 0.031 0.059Byrsonima crispa A Juss 2 0.03 0.007 0.014 0.023 0.016 0.001 0.004 0.011Byrsonima densa (Poir) DC 2 0.03 0.007 0.014 0.023 0.083 0.008 0.007 0.013MALVACEAEApeiba echinata Gaertn 118 1.57 0.435 0.315 0.532 4.415 0.405 0.420 0.457Apeiba glabra Aubl 4 0.05 0.015 0.027 0.046 0.164 0.015 0.015 0.025Apeiba tibourbou Aubl 38 0.51 0.140 0.137 0.231 1.545 0.142 0.141 0.171Ceiba pentandra (L) Gaertn 40 0.53 0.147 0.274 0.463 6.548 0.600 0.374 0.404Eriotheca longipedicelata
(Ducke) A Robyns 95 1.27 0.350 0.329 0.555 2.961 0.271 0.311 0.392
Guazuma ulmifolia Lam 283 3.77 1.043 0.466 0.787 12.724 1.166 1.105 0.999
Luehea grandiflora Mart & Zucc 3 0.04 0.011 0.014 0.023 0.214 0.020 0.015 0.018
Matisia sp 28 0.37 0.103 0.219 0.370 3.606 0.331 0.217 0.268
Mollia lepidota Spruce ex Benth 72 0.96 0.265 0.068 0.116 3.825 0.351 0.308 0.244
Pachira aquatica Aubl 77 1.03 0.284 0.260 0.440 2.056 0.188 0.236 0.304
Patinoa paraensis (Huber) Cuatrec 121 1.61 0.446 0.110 0.185 5.961 0.546 0.496 0.393
Quararibea guianensis Aubl 392 5.23 1.445 0.342 0.579 5.672 0.520 0.983 0.848Sterculia apelata Ducke 14 0.19 0.052 0.123 0.208 2.228 0.204 0.128 0.155N.ind = number of individuals, AD = absolute density, RD = relative density, AF = absolute frequency, RF = relative frequency, ADo = absolute dominance, RDo = relative dominance, CV = coverage value and IV = importance value.
Braz. J. Biol., 2015, vol. 75, no. 3 (suppl.), p. S257-S276 269
Floristic and phytosociology in a dense rain forest “terra firme”’s stretch
269
Table 1. Continued... FAMILY/SPECIES AUTOR N.ind AD RD AF RF ADo RDo CV IV
Sterculia excelsa Mart 7 0.09 0.026 0.068 0.116 0.599 0.055 0.040 0.065
Sterculia pruriens (Aubl) K Schum 183 2.44 0.675 0.438 0.741 9.601 0.880 0.777 0.765
Theobroma grandiflorum
(Willd ex Spreng) K Schum
18 0.24 0.066 0.068 0.116 0.383 0.035 0.051 0.072
Theobroma speciosum Willd ex Spreng 980 13.07 3.613 0.726 1.227 14.562 1.335 2.474 2.058
Theobroma subincanum Mart 53 0.71 0.195 0.164 0.278 0.947 0.087 0.141 0.187MARCGRAVIACEAENorantea guianensis Aubl 2 0.03 0.007 0.014 0.023 0.034 0.003 0.005 0.011MELASTOMATACEAEBellucia dichotoma Cogn 24 0.32 0.088 0.082 0.139 0.419 0.038 0.063 0.089Bellucia grossularioides (L) Triana 236 3.15 0.870 0.260 0.440 5.613 0.515 0.692 0.608Miconia affinis DC 10 0.13 0.037 0.041 0.069 0.109 0.010 0.023 0.039
Miconia minutiflora (Bonpl) DC 10 0.13 0.037 0.041 0.069 0.106 0.010 0.023 0.039
Miconia pyrifolia Naudin 58 0.77 0.214 0.219 0.370 1.618 0.148 0.181 0.244Mouriri brachyanthera Ducke 22 0.29 0.081 0.055 0.093 0.450 0.041 0.061 0.072MELIACEAECedrela fissilis Vell 2 0.03 0.007 0.014 0.023 0.026 0.002 0.005 0.011Cedrela odorata L 19 0.25 0.070 0.082 0.139 0.818 0.075 0.073 0.095Guarea carinata Ducke 421 5.61 1.552 0.534 0.903 10.613 0.973 1.262 1.142
Guarea guidonia (L) Sleumer 34 0.45 0.125 0.137 0.231 1.703 0.156 0.141 0.171
Guarea kunthiana A Juss 346 4.61 1.276 0.438 0.741 7.618 0.698 0.987 0.905Guarea silvatica C DC 2 0.03 0.007 0.014 0.023 0.017 0.002 0.004 0.011Guarea sp 1 71 0.95 0.262 0.123 0.208 1.473 0.135 0.198 0.202
Trichilia cipo (A Juss) C DC 85 1.13 0.313 0.110 0.185 1.941 0.178 0.246 0.225
Trichilia lecointei Ducke 32 0.43 0.118 0.137 0.231 1.073 0.098 0.108 0.149Trichilia micrantha Benth 126 1.68 0.464 0.274 0.463 2.569 0.236 0.350 0.388Trichilia oligantha C DC 4 0.05 0.015 0.014 0.023 0.055 0.005 0.010 0.014Trichilia quadrijuga Kunth 24 0.32 0.088 0.082 0.139 0.542 0.050 0.069 0.092MORACEAEArtocarpus heterophyllus Lam 2 0.03 0.007 0.014 0.023 0.122 0.011 0.009 0.014
Artocarpus sp Ducke 12 0.16 0.044 0.055 0.093 0.126 0.012 0.028 0.049Bagassa guianensis Aubl 7 0.09 0.026 0.041 0.069 0.319 0.029 0.028 0.041
Batocarpus amazonicus (Ducke) Fosberg 3 0.04 0.011 0.027 0.046 0.297 0.027 0.019 0.028
Brosimum acutifolium Huber 32 0.43 0.118 0.205 0.347 2.159 0.198 0.158 0.221
Brosimum guianense (Aubl) Huber 65 0.87 0.240 0.164 0.278 2.540 0.233 0.236 0.250
Brosimum lactescens (S Moore) C C Berg 42 0.56 0.155 0.082 0.139 1.594 0.146 0.150 0.147
Brosimum parinarioides Ducke 4 0.05 0.015 0.027 0.046 0.352 0.032 0.023 0.031Brosimum potabile Ducke 8 0.11 0.029 0.068 0.116 0.491 0.045 0.037 0.063Brosimum rubescens Taub 2 0.03 0.007 0.014 0.023 0.024 0.002 0.005 0.011Clarisia racemosa Ruiz & Pav 5 0.07 0.018 0.027 0.046 0.633 0.058 0.038 0.041Ficus americana subsp guianensis
(Desv.) C.C. Berg 6 0.08 0.022 0.055 0.093 0.512 0.047 0.035 0.054
N.ind = number of individuals, AD = absolute density, RD = relative density, AF = absolute frequency, RF = relative frequency, ADo = absolute dominance, RDo = relative dominance, CV = coverage value and IV = importance value.

Braz. J. Biol., 2015, vol. 75, no. 3 (suppl.), p. S257-S276270
Lemos, DAN. et al.
270
Table 1. Continued... FAMILY/SPECIES AUTOR N.ind AD RD AF RF ADo RDo CV IV
Ficus maxima Mill 25 0.33 0.092 0.123 0.208 4.486 0.411 0.252 0.237Helicostylis pedunculata Benoist 22 0.29 0.081 0.096 0.162 0.424 0.039 0.060 0.094
Helicostylis scabra(J F Macbr) C C Berg
20 0.27 0.074 0.068 0.116 0.371 0.034 0.054 0.074
Helicostylis tomentosa(Poepp & Endl) Rusby
32 0.43 0.118 0.137 0.231 0.505 0.046 0.082 0.132
Maclura tinctoria (L) D Don ex Steud 23 0.31 0.085 0.055 0.093 0.612 0.056 0.070 0.078
Maquira calophylla(Poepp & Endl) C C Berg
6 0.08 0.022 0.027 0.046 0.081 0.007 0.015 0.025
Maquira coriacea (H Karst) C C Berg 13 0.17 0.048 0.068 0.116 0.231 0.021 0.035 0.062
Maquira guianensis Aubl 97 1.29 0.358 0.301 0.509 2.167 0.199 0.278 0.355
Maquira sclerophylla (Ducke) C C Berg 24 0.32 0.088 0.123 0.208 0.817 0.075 0.082 0.124
Naucleopsis caloneura (Huber) Ducke 27 0.36 0.100 0.096 0.162 0.359 0.033 0.066 0.098
Naucleopsis sp 2 0.03 0.007 0.014 0.023 0.023 0.002 0.005 0.011
Perebea mollis
(Poepp & Endl) Huber subsp mollis
255 3.40 0.940 0.575 0.972 5.087 0.466 0.703 0.793
Pseudolmedia laevigata Trecul 18 0.24 0.066 0.055 0.093 0.446 0.041 0.054 0.067
Pseudolmedia laevis(Ruiz & Pav) J F Macbr
10 0.13 0.037 0.055 0.093 0.151 0.014 0.025 0.048
Pseudolmedia macrophylla Trecul 28 0.37 0.103 0.110 0.185 1.241 0.114 0.108 0.134
Sorocea duckei W C Burger 4 0.05 0.015 0.027 0.046 0.142 0.013 0.014 0.025
Sorocea guilleminiana Gaudich 11 0.15 0.041 0.082 0.139 0.175 0.016 0.028 0.065Trymatococcus amazonicus
Poepp & Endl 14 0.19 0.052 0.096 0.162 0.160 0.015 0.033 0.076
MYRISTICACEAEIryanthera juruensis Warb 22 0.29 0.081 0.096 0.162 0.370 0.034 0.058 0.092Iryanthera laevis Markgr 2 0.03 0.007 0.014 0.023 0.052 0.005 0.006 0.012
Osteophloeum platyspermum
(Spruce ex A DC) Warb
6 0.08 0.022 0.041 0.069 0.136 0.012 0.017 0.035
Virola crebrinervia Ducke 8 0.11 0.029 0.041 0.069 0.212 0.019 0.024 0.039
Virola elongata (Benth) Warb 18 0.24 0.066 0.082 0.139 0.271 0.025 0.046 0.077
Virola michelii Heckel 199 2.65 0.734 0.452 0.764 9.803 0.899 0.816 0.799
Virola pavonis (A DC) A C Sm 14 0.19 0.052 0.055 0.093 0.741 0.068 0.060 0.071
Virola surinamensis(Rol ex Rottb) Warb
15 0.20 0.055 0.068 0.116 3.018 0.277 0.166 0.149
MYRTACEAECalyptranthes bipennis O Berg 67 0.89 0.247 0.205 0.347 1.150 0.105 0.176 0.233N.ind = number of individuals, AD = absolute density, RD = relative density, AF = absolute frequency, RF = relative frequency, ADo = absolute dominance, RDo = relative dominance, CV = coverage value and IV = importance value.
Braz. J. Biol., 2015, vol. 75, no. 3 (suppl.), p. S257-S276 271
Floristic and phytosociology in a dense rain forest “terra firme”’s stretch
271
Table 1. Continued... FAMILY/SPECIES AUTOR N.ind AD RD AF RF ADo RDo CV IV
Eugenia coffeifolia DC 2 0.03 0.007 0.014 0.023 0.048 0.004 0.006 0.012Eugenia cupulata Amshoff 30 0.40 0.111 0.055 0.093 0.386 0.035 0.073 0.080Eugenia flavescens DC 94 1.25 0.347 0.301 0.509 1.745 0.160 0.253 0.339Eugenia patrisii Vahl 8 0.11 0.029 0.041 0.069 0.157 0.014 0.022 0.038Eugenia ramiflora Desv 8 0.11 0.029 0.041 0.069 0.076 0.007 0.018 0.035Myrcia fallax (Sw) DC 34 0.45 0.125 0.192 0.324 0.626 0.057 0.091 0.169Myrcia splendens (Sw) DC 6 0.08 0.022 0.027 0.046 0.089 0.008 0.015 0.026Psidium guajava L 10 0.13 0.037 0.055 0.093 0.114 0.010 0.024 0.047NI NI 7 0.09 0.026 0.027 0.046 0.429 0.039 0.033 0.037NYCTAGINACEAE
Guapira hirsuta (Choisy) Lundell 25 0.33 0.092 0.082 0.139 0.502 0.046 0.069 0.092
Guapira venosa (Choisy) Lundell 819 10.92 3.019 0.699 1.180 19.578 1.795 2.407 1.998
Neea floribunda Poepp & Endl 24 0.32 0.088 0.068 0.116 0.722 0.066 0.077 0.090
OLACACEAE
Cathedra acuminata (Benth) Mier 2 0.03 0.007 0.014 0.023 0.046 0.004 0.006 0.012
Chaunochiton kappleri(Sagot ex Engl) Ducke
40 0.53 0.147 0.233 0.393 1.803 0.165 0.156 0.235
Heisteria acuminata(Humb & Bonpl) Engl
2 0.03 0.007 0.014 0.023 0.029 0.003 0.005 0.011
Heisteria barbata Cuatrec 2 0.03 0.007 0.014 0.023 0.078 0.007 0.007 0.013Minquartia guianensis Aubl 18 0.24 0.066 0.096 0.162 0.903 0.083 0.075 0.104OPILIACEAE
Agonandra brasiliensisMiers ex Benth & Hook f
14 0.19 0.052 0.082 0.139 0.275 0.025 0.038 0.072
PERACEAE
Pera cf glabrata(Schott) Poepp. Ex Baill
2 0.03 0.007 0.014 0.023 0.019 0.002 0.005 0.011
PHYLLANTHACEAEDiscocarpus essequeboensis
Vahl ex Vent 10 0.13 0.037 0.041 0.069 0.176 0.016 0.027 0.041
Hieronyma alchorneoides Allemao 4 0.05 0.015 0.041 0.069 0.383 0.035 0.025 0.040
Margaritaria nobilis L f 54 0.72 0.199 0.164 0.278 1.364 0.125 0.162 0.201POLYGONACEAECoccoloba mollis Casar 42 0.56 0.155 0.219 0.370 1.304 0.120 0.137 0.215Coccoloba ovata Benth 14 0.19 0.052 0.041 0.069 0.259 0.024 0.038 0.048
Triplaris weigeltiana (Rchb) Kuntze 6 0.08 0.022 0.041 0.069 0.112 0.010 0.016 0.034
PROTEACEAERoupala montana Aubl 23 0.31 0.085 0.151 0.255 1.399 0.128 0.107 0.156QUIINACEAE
Lacunaria crenata (Tul) A C Sm 16 0.21 0.059 0.096 0.162 0.176 0.016 0.038 0.079
Quiina sp 2 0.03 0.007 0.014 0.023 0.022 0.002 0.005 0.011RUBIACEAEN.ind = number of individuals, AD = absolute density, RD = relative density, AF = absolute frequency, RF = relative frequency, ADo = absolute dominance, RDo = relative dominance, CV = coverage value and IV = importance value.

Braz. J. Biol., 2015, vol. 75, no. 3 (suppl.), p. S257-S276272
Lemos, DAN. et al.
272
Table 1. Continued... FAMILY/SPECIES AUTOR N.ind AD RD AF RF ADo RDo CV IV
Capirona decorticans Spruce 20 0.27 0.074 0.082 0.139 0.440 0.040 0.057 0.084Chimarrhis turbinata DC 12 0.16 0.044 0.082 0.139 1.662 0.152 0.098 0.112Cinchona sp 4 0.05 0.015 0.014 0.023 0.055 0.005 0.010 0.014
Cordiera macrophylla (K Schum) Kuntze 2 0.03 0.007 0.014 0.023 0.021 0.002 0.005 0.011
Faramea cf. involucellata Müll.Arg. 14 0.19 0.052 0.096 0.162 0.297 0.027 0.039 0.080
Ferdinandusa chlorantha
(Wedd) Standl 24 0.32 0.088 0.068 0.116 0.840 0.077 0.083 0.094
Genipa americana L 13 0.17 0.048 0.055 0.093 0.360 0.033 0.040 0.058Psychotria sp L 2 0.03 0.007 0.014 0.023 0.023 0.002 0.005 0.011Randia armata (Sw) DC 2 0.03 0.007 0.014 0.023 0.046 0.004 0.006 0.012RUTACEAERaputia sp 12 0.16 0.044 0.014 0.023 0.161 0.015 0.030 0.027Zanthoxylum rhoifolium Lam 60 0.80 0.221 0.219 0.370 1.436 0.132 0.176 0.241Zanthoxylum riedelianum Engl 77 1.03 0.284 0.247 0.417 2.265 0.208 0.246 0.303
Zanthoxylum sp 1 6 0.08 0.022 0.027 0.046 0.094 0.009 0.015 0.026SALICACEAEBanara guianensis Aubl 14 0.19 0.052 0.027 0.046 0.154 0.014 0.033 0.037Casearia grandiflora Cambess 4 0.05 0.015 0.027 0.046 0.043 0.004 0.009 0.022Casearia javitensis Kunth 18 0.24 0.066 0.110 0.185 0.404 0.037 0.052 0.096Casearia pitumba Sleumer 32 0.43 0.118 0.055 0.093 0.404 0.037 0.078 0.083Casearia sylvestris Sw 4 0.05 0.015 0.014 0.023 0.063 0.006 0.010 0.015Hasseltia floribunda Kunth 27 0.36 0.100 0.068 0.116 0.770 0.071 0.085 0.095
Homalium guianense (Aubl) Oken 14 0.19 0.052 0.041 0.069 0.140 0.013 0.032 0.045
Laetia procera (Poepp) Eichler 25 0.33 0.092 0.137 0.231 1.314 0.120 0.106 0.148
SAPINDACEAECupania scrobiculata Rich 32 0.43 0.118 0.178 0.301 0.621 0.057 0.087 0.159
Matayba inelegans Spruce ex Radlk 46 0.61 0.170 0.082 0.139 0.617 0.057 0.113 0.122
Matayba sp Aubl 106 1.41 0.391 0.110 0.185 1.784 0.164 0.277 0.246
Pseudima frutescens (Aubl) Radlk 30 0.40 0.111 0.137 0.231 0.469 0.043 0.077 0.128
Talisia longifolia (Benth) Radlk 12 0.16 0.044 0.068 0.116 0.160 0.015 0.029 0.058
Talisia mollis Kunth ex Cambess 2 0.03 0.007 0.014 0.023 0.029 0.003 0.005 0.011
Talisia veraluciana Guarim 4 0.05 0.015 0.027 0.046 0.083 0.008 0.011 0.023Toulicia guianensis Aubl 69 0.92 0.254 0.205 0.347 1.091 0.100 0.177 0.234Vouarana guianensis Aubl 2 0.03 0.007 0.014 0.023 0.022 0.002 0.005 0.011SAPOTACEAEChrysophyllum argenteum Jacq 2 0.03 0.007 0.014 0.023 0.030 0.003 0.005 0.011
Chrysophyllum lucentifolium subsp pachycarpum
Pires & T D Penn 106 1.41 0.391 0.384 0.648 4.923 0.451 0.421 0.497
Chrysophyllum prieurii A DC 4 0.05 0.015 0.027 0.046 0.053 0.005 0.010 0.022Chrysophyllum venezuelanense
(Pierre) T D Penn 6 0.08 0.022 0.027 0.046 0.470 0.043 0.033 0.037
Ecclinusa guianensis Eyma 31 0.41 0.114 0.068 0.116 1.239 0.114 0.114 0.115N.ind = number of individuals, AD = absolute density, RD = relative density, AF = absolute frequency, RF = relative frequency, ADo = absolute dominance, RDo = relative dominance, CV = coverage value and IV = importance value.

Braz. J. Biol., 2015, vol. 75, no. 3 (suppl.), p. S257-S276 273
Floristic and phytosociology in a dense rain forest “terra firme”’s stretch
273
Table 1. Continued... FAMILY/SPECIES AUTOR N.ind AD RD AF RF ADo RDo CV IV
Manilkara amazonica (Huber) A Chev 4 0.05 0.015 0.027 0.046 0.042 0.004 0.009 0.022
Manilkara huberi Chevalier 22 0.29 0.081 0.123 0.208 1.935 0.177 0.129 0.156
Micropholis acutangula (Ducke) Eyma 44 0.59 0.162 0.164 0.278 2.725 0.250 0.206 0.230
Micropholis egensis (A DC) Pierre 2 0.03 0.007 0.014 0.023 0.033 0.003 0.005 0.011
Micropholis guyanensis (A DC) Pierre 14 0.19 0.052 0.082 0.139 0.219 0.020 0.036 0.070
Micropholis venulosa(Mart & Eichler) Pierre
12 0.16 0.044 0.068 0.116 0.305 0.028 0.036 0.063
Pouteria anibifolia (Engl) Eyma 6 0.08 0.022 0.041 0.069 0.050 0.005 0.013 0.032
Pouteria anomala (Pires) T D Penn 5 0.07 0.018 0.027 0.046 0.120 0.011 0.015 0.025
Pouteria caimito (Ruiz & Pav) Radlk 81 1.08 0.299 0.260 0.440 3.065 0.281 0.290 0.340
Pouteria cladantha Sandwith 35 0.47 0.129 0.164 0.278 1.264 0.116 0.122 0.174Pouteria decorticans T D Penn 19 0.25 0.070 0.082 0.139 0.999 0.092 0.081 0.100
Pouteria elegans (A DC) Baehni 6 0.08 0.022 0.027 0.046 0.105 0.010 0.016 0.026
Pouteria engleri Eyma 6 0.08 0.022 0.041 0.069 0.173 0.016 0.019 0.036
Pouteria eugeniifolia (Pierre) Baehni 12 0.16 0.044 0.068 0.116 0.709 0.065 0.055 0.075
Pouteria filipes Eyma 33 0.44 0.122 0.192 0.324 1.517 0.139 0.130 0.195Pouteria gongrijpii Eyma 68 0.91 0.251 0.151 0.255 1.873 0.172 0.211 0.226Pouteria guianensis Aubl 105 1.40 0.387 0.370 0.625 3.048 0.279 0.333 0.430Pouteria hispida Eyma 4 0.05 0.015 0.027 0.046 0.111 0.010 0.012 0.024
Pouteria jariensis Pires & T D Penn 123 1.64 0.453 0.301 0.509 2.634 0.241 0.347 0.401
Pouteria krukovii (A C Sm) Baehni 2 0.03 0.007 0.014 0.023 0.017 0.002 0.004 0.011
Pouteria macrophylla (Lam) Eyma 160 2.13 0.590 0.397 0.671 5.564 0.510 0.550 0.590
Pouteria oppositifolia (Ducke) Baehni 8 0.11 0.029 0.055 0.093 0.318 0.029 0.029 0.050
Pouteria pachycarpa Pires & T D Penn 16 0.21 0.059 0.096 0.162 0.238 0.022 0.040 0.081
Pouteria venosa (Mart) Baehn 30 0.40 0.111 0.082 0.139 0.690 0.063 0.087 0.104
Sarcaulus brasiliensis (A DC) Eyma 17 0.23 0.063 0.068 0.116 0.559 0.051 0.057 0.077
SIMAROUBACEAEPicramnia sp 7 0.09 0.026 0.055 0.093 0.160 0.015 0.020 0.044Simaba cedron Planch 170 2.27 0.627 0.370 0.625 2.900 0.266 0.446 0.506Simaba guianensis Aubl 6 0.08 0.022 0.041 0.069 0.072 0.007 0.014 0.033Simaba paraensis Ducke 3 0.04 0.011 0.027 0.046 0.330 0.030 0.021 0.029Simarouba amara Aubl 72 0.96 0.265 0.301 0.509 4.995 0.458 0.362 0.411SIPARUNACEAESiparuna guianensis Aubl 63 0.84 0.232 0.219 0.370 1.051 0.096 0.164 0.233Siparuna sp 25 0.33 0.092 0.110 0.185 0.463 0.042 0.067 0.107SOLANACEAEN.ind = number of individuals, AD = absolute density, RD = relative density, AF = absolute frequency, RF = relative frequency, ADo = absolute dominance, RDo = relative dominance, CV = coverage value and IV = importance value.
Braz. J. Biol., 2015, vol. 75, no. 3 (suppl.), p. S257-S276274
Lemos, DAN. et al.
274
Table 1. Continued... FAMILY/SPECIES AUTOR N.ind AD RD AF RF ADo RDo CV IV
Capsicum sp 2 0.03 0.007 0.014 0.023 0.032 0.003 0.005 0.011
Solanum sendtnerianumVan Heurck & Müll Arg
4 0.05 0.015 0.014 0.023 0.036 0.003 0.009 0.014
ULMACEAEAmpelocera edentula Kuhlm 72 0.96 0.265 0.301 0.509 3.182 0.292 0.279 0.355URTICACEAECecropia distachya Huber 211 2.81 0.778 0.219 0.370 12.786 1.172 0.975 0.773Cecropia latiloba Miq 8 0.11 0.029 0.014 0.023 0.100 0.009 0.019 0.021Cecropia membranacea Trecul 470 6.27 1.733 0.411 0.694 14.272 1.308 1.520 1.245Cecropia obtusa Trecul 1000 13.33 3.687 0.630 1.065 26.376 2.418 3.052 2.390Cecropia sciadophylla Mart 182 2.43 0.671 0.397 0.671 9.200 0.843 0.757 0.728
Pourouma bicolor subsp Digitata
(Trecul) C C Berg & Heusden
19 0.25 0.070 0.123 0.208 0.986 0.090 0.080 0.123
Pourouma cecropiifolia Mart 22 0.29 0.081 0.110 0.185 0.681 0.062 0.072 0.110Pourouma guianensis Aubl 128 1.71 0.472 0.342 0.579 6.381 0.585 0.528 0.545Pourouma mollis Trecul 4 0.05 0.015 0.027 0.046 0.057 0.005 0.010 0.022
Urera caracasana (Jacq) Griseb 6 0.08 0.022 0.027 0.046 0.066 0.006 0.014 0.025
VIOLACEAEPaypayrola grandiflora Tul 4 0.05 0.015 0.014 0.023 0.073 0.007 0.011 0.015Rinorea guianensis Aubl 17 0.23 0.063 0.096 0.162 0.598 0.055 0.059 0.093
Rinorea pubiflora var pubiflora
(Benth) Sprague & Sandwith
81 1.08 0.299 0.164 0.278 1.209 0.111 0.205 0.229
Rinorea riana Kuntze 10 0.13 0.037 0.055 0.093 0.095 0.009 0.023 0.046VOCHYSIACEAEQualea dinizii Ducke 5 0.07 0.018 0.041 0.069 0.202 0.019 0.018 0.035
Ruizterania albiflora (Warm) Marc Berti 2 0.03 0.007 0.014 0.023 0.027 0.002 0.005 0.011
Vochysia obscura Warm 6 0.08 0.022 0.041 0.069 0.549 0.050 0.036 0.047Vochysia sp 4 0.05 0.015 0.027 0.046 0.132 0.012 0.013 0.024TOTAL 27126 361.7 100 59.19 100 1090.90 100 100 100N.ind = number of individuals, AD = absolute density, RD = relative density, AF = absolute frequency, RF = relative frequency, ADo = absolute dominance, RDo = relative dominance, CV = coverage value and IV = importance value.
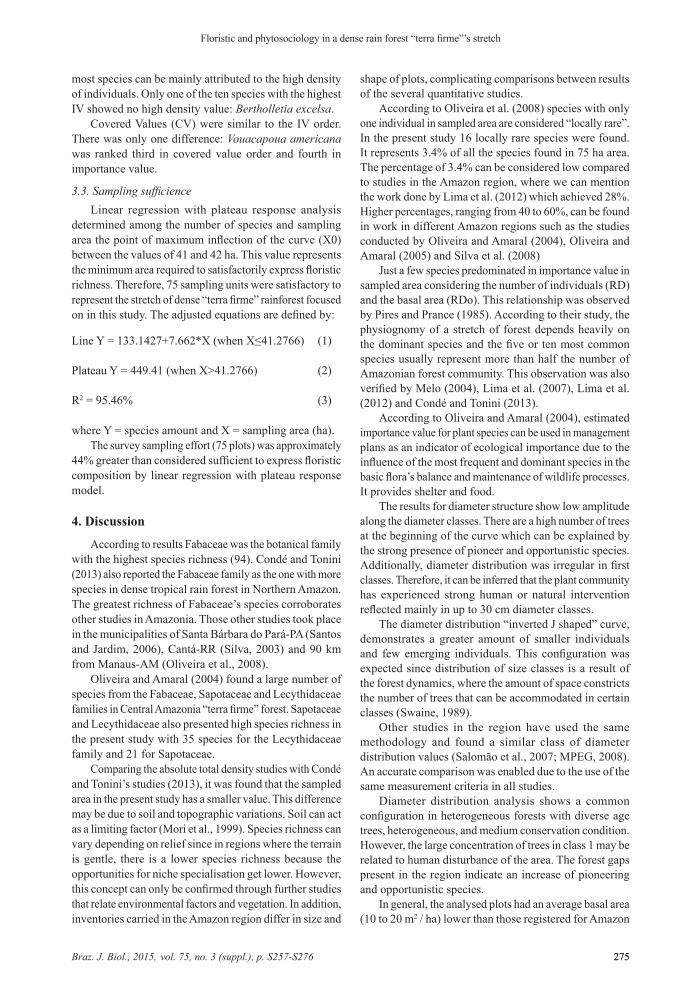
predominance of 10 to 19.9 cm diameter class individuals (71%); 18.5% belongs to 20-29.9 cm class; 5.5% 30-39.9 cm class; others (5.0%) belong to diametric classes above 50 cm. The curve formed by established class values shows an “inverted J configuration” because there is a larger amount of smaller individuals and just emerging individuals.
The ten top species in terms of ecological Importance Value (IV) in descending order were: Alexa grandiflora (4.42), Cenostigma tocantinum (2.51), Cecropia obtusa (2.39), Bertholletia excelsa (2.29), Vouacapoua americana (2.27), Theobroma speciosum (2.06), Guapira venosa (1.99), Inga edulis (1.69), Jacaranda copaia (1.38) and Cecropia membranacea (1.24). 22.24% of sampled individuals are concentrated in ten most important species in terms of ecological Importance Value (IV) which demonstrates their importance in the study area. The importance of
Figure 3. Diameter classes frequency distribution of sampled individuals in 75 ha of dense “terra firme” rainforest located in Belo Monte Hydroelectric Plant’s area of influence, situated in Pará, Brazil.
Braz. J. Biol., 2015, vol. 75, no. 3 (suppl.), p. S257-S276 275
Floristic and phytosociology in a dense rain forest “terra firme”’s stretch
275
most species can be mainly attributed to the high density of individuals. Only one of the ten species with the highest IV showed no high density value: Bertholletia excelsa.
Covered Values (CV) were similar to the IV order. There was only one difference: Vouacapoua americana was ranked third in covered value order and fourth in importance value.
3.3. Sampling sufficienceLinear regression with plateau response analysis
determined among the number of species and sampling area the point of maximum inflection of the curve (X0) between the values of 41 and 42 ha. This value represents the minimum area required to satisfactorily express floristic richness. Therefore, 75 sampling units were satisfactory to represent the stretch of dense “terra firme” rainforest focused on in this study. The adjusted equations are defined by:
Line Y = 133.1427+7.662*X (when X≤41.2766) (1)
Plateau Y = 449.41 (when X>41.2766) (2)
R2 = 95.46% (3)
where Y = species amount and X = sampling area (ha).The survey sampling effort (75 plots) was approximately
44% greater than considered sufficient to express floristic composition by linear regression with plateau response model.
4. Discussion
According to results Fabaceae was the botanical family with the highest species richness (94). Condé and Tonini (2013) also reported the Fabaceae family as the one with more species in dense tropical rain forest in Northern Amazon. The greatest richness of Fabaceae’s species corroborates other studies in Amazonia. Those other studies took place in the municipalities of Santa Bárbara do Pará-PA (Santos and Jardim, 2006), Cantá-RR (Silva, 2003) and 90 km from Manaus-AM (Oliveira et al., 2008).
Oliveira and Amaral (2004) found a large number of species from the Fabaceae, Sapotaceae and Lecythidaceae families in Central Amazonia “terra firme” forest. Sapotaceae and Lecythidaceae also presented high species richness in the present study with 35 species for the Lecythidaceae family and 21 for Sapotaceae.
Comparing the absolute total density studies with Condé and Tonini’s studies (2013), it was found that the sampled area in the present study has a smaller value. This difference may be due to soil and topographic variations. Soil can act as a limiting factor (Mori et al., 1999). Species richness can vary depending on relief since in regions where the terrain is gentle, there is a lower species richness because the opportunities for niche specialisation get lower. However, this concept can only be confirmed through further studies that relate environmental factors and vegetation. In addition, inventories carried in the Amazon region differ in size and
shape of plots, complicating comparisons between results of the several quantitative studies.
According to Oliveira et al. (2008) species with only one individual in sampled area are considered “locally rare”. In the present study 16 locally rare species were found. It represents 3.4% of all the species found in 75 ha area. The percentage of 3.4% can be considered low compared to studies in the Amazon region, where we can mention the work done by Lima et al. (2012) which achieved 28%. Higher percentages, ranging from 40 to 60%, can be found in work in different Amazon regions such as the studies conducted by Oliveira and Amaral (2004), Oliveira and Amaral (2005) and Silva et al. (2008)
Just a few species predominated in importance value in sampled area considering the number of individuals (RD) and the basal area (RDo). This relationship was observed by Pires and Prance (1985). According to their study, the physiognomy of a stretch of forest depends heavily on the dominant species and the five or ten most common species usually represent more than half the number of Amazonian forest community. This observation was also verified by Melo (2004), Lima et al. (2007), Lima et al. (2012) and Condé and Tonini (2013).
According to Oliveira and Amaral (2004), estimated importance value for plant species can be used in management plans as an indicator of ecological importance due to the influence of the most frequent and dominant species in the basic flora’s balance and maintenance of wildlife processes. It provides shelter and food.
The results for diameter structure show low amplitude along the diameter classes. There are a high number of trees at the beginning of the curve which can be explained by the strong presence of pioneer and opportunistic species. Additionally, diameter distribution was irregular in first classes. Therefore, it can be inferred that the plant community has experienced strong human or natural intervention reflected mainly in up to 30 cm diameter classes.
The diameter distribution “inverted J shaped” curve, demonstrates a greater amount of smaller individuals and few emerging individuals. This configuration was expected since distribution of size classes is a result of the forest dynamics, where the amount of space constricts the number of trees that can be accommodated in certain classes (Swaine, 1989).
Other studies in the region have used the same methodology and found a similar class of diameter distribution values (Salomão et al., 2007; MPEG, 2008). An accurate comparison was enabled due to the use of the same measurement criteria in all studies.
Diameter distribution analysis shows a common configuration in heterogeneous forests with diverse age trees, heterogeneous, and medium conservation condition. However, the large concentration of trees in class 1 may be related to human disturbance of the area. The forest gaps present in the region indicate an increase of pioneering and opportunistic species.
In general, the analysed plots had an average basal area (10 to 20 m2 / ha) lower than those registered for Amazon

Braz. J. Biol., 2015, vol. 75, no. 3 (suppl.), p. S257-S276276
Lemos, DAN. et al.
276
“terra firme” forests (30 to 40 m2 / ha) (Salomão et al., 2007). It is assumed this condition is related to anthropisation.
The UHE Belo Monte region has undergone considerable change from its original forest cover caused by the Trans-Amazon Highway’s (BR-230) zone of influence and its transverse roads. Human occupation has been intensively induced by agrarian colonisation projects in recent years (Salomão et al., 2007). This interference leads to major changes in forest structure.
The floristic and phytosociological survey helped identify, in part, species distribution in the area. Floristic richness and its species diversity are considered high when compared to other studies conducted in nearby areas. This may be due because of ecotonal character as environmental heterogeneity.
Acknowledgements
This work was conducted in cooperation with Norte Energia SA and STCP Engenharia de Projetos LTDA running the PBA UHE Belo Monte. The authors thank these companies for allowing access to the areas and to the data obtained from field samples. The authors also thank all field staff for data collection: José Maria do Nascimento Jr., Edimar Almeida Campos; Carlos da Silva Rosário; Almir de Oliveira Gomes; Eva Moda de Vasconcelos.
References
Brasil. Eletrobrás, 2009. Aproveitamento hidrelétrico Belo Monte: estudo de impacto ambiental. Rio de Janeiro: Eletrobrás. 36 vol.
CONDÉ, TM. and TONINI, H., 2013. Fitossociologia de uma Floresta Ombrófila Densa na Amazônia Setentrional, Roraima, Brasil. Acta Amazonica, vol. 43, no. 3, p. 247-260. http://dx.doi.org/10.1590/S0044-59672013000300002.
HOPKINS, MJG., 2007. Modelling the known and unknown plant biodiversity of the Amazon basin. Journal of Biogeography, vol. 34, no. 8, p. 1400-1411. http://dx.doi.org/10.1111/j.1365-2699.2007.01737.x.
Instituto Brasileiro de Geografia e Estatística – IBGE, 2012. Manual técnico da vegetação brasileira. Rio de Janeiro: IBGE. 275 p. Manuais técnicos em geociências, no. 1.
LAURANCE, WF., 2008. Conserving the hottest of the hostspots. Biological Conservation, vol. 142, no. 6, p. 1137. http://dx.doi.org/10.1016/j.biocon.2008.10.011.
LIMA, AJN., TEIXEIRA, LM., CARNEIRO, VMC., SANTOS, J. and HIGUCHI, N., 2007. Análise da estrutura e do estoque de fitomassa de uma floresta secundária da região de Manaus AM, dez anos após corte raso seguido de fogo. Acta Amazonica, vol. 37, no. 1, p. 49-54. http://dx.doi.org/10.1590/S0044-59672007000100005.
LIMA, RBA., SILVA, JAA., MARANGON, LC., FERREIRA, RLC. and SILVA, RKS., 2012. Fitossociologia de um trecho de floresta ombrófila densa na Reserva de Desenvolvimento Sustentável Uacari, Carauari, Amazonas. Scientia Plena, vol. 8, no. 1, p. 1-12.
LIMA FILHO, DA., REVILLA, J., AMARAL, IL., MATOS, FDA., COÊLHO, LS., RAMOS, JF., SILVA, GB. and GUEDES, JO., 2004. Aspectos florísticos de 13 hectares da área de Cachoeira Porteira-PA. Acta Amazonica, vol. 34, no. 3, p. 415-423. http://dx.doi.org/10.1590/S0044-59672004000300007.
MAGNUSSON, WE., LIMA, AP., LUIZÃO, R., LUIZÃO, F., COSTA, FRC., CASTILHO, CV. and KINUPP, VP., 2005. RAPELD: a modification of the Gentry method for biodiversity surveys in
long-term ecological research sites. Biota Neotropica, vol. 5, no. 2, p. 1-6. http://dx.doi.org/10.1590/S1676-06032005000300002.
MELO, MS., 2004. Florística, fitossociologia e dinâmica de duas florestas secundárias antigas com histórias de uso diferentes no nordeste do Pará - Brasil. Piracicaba: Escola Superior de Agricultura Luíz de Queiroz, Universidade de São Paulo. 116 p. Dissertação de Mestrado em Recursos Florestais.
MORI, SA., RABELO, BV., TSOU, C. and DALY, D., 1999. Composition and structure of an eastern amazonian forest at Camaipi, Amapá, Brazil. Boletim do Museu Paraense Emílio Goeldi. Série Botânica, vol. 5, no. 1, p. 3-18.
MÜLLER-DOMBOIS, D. and ELLEMBERG, H., 1974. Aims and methods for vegetation ecology. New York: John Wiley & Sons. 547 p.
Museu Paraense Emílio Goeldi – MPEG, 2008. Descrição e análise da flora da região do médio-baixo Rio Xingu. Belém: MPEG. 384 p.
OLIVEIRA, AN. and AMARAL, IL., 2004. Florística e fitossociologia de uma floresta de Vertente na Amazônia Central, Amazonas, Brasil. Acta Amazonica, vol. 34, no. 1, p. 21-34. http://dx.doi.org/10.1590/S0044-59672004000100004.
OLIVEIRA, AN. and AMARAL, IL., 2005. Aspectos florísticos, fitossociológicos e ecológicos de um sub-bosque de terra firme na Amazônia central, Amazonas, Brasil. Acta Amazonica, vol. 35, no. 1, p. 1-16. http://dx.doi.org/10.1590/S0044-59672005000100002.
OLIVEIRA, AN., AMARAL, IL., RAMOS, MBP., NOBRE, AD., COUTO, LB. and SAHDO, RM., 2008. Composição e diversidade florístico-estrutural de um hectare de floresta densa de terra firme na Amazônia Central, Amazonas, Brasil. Acta Amazonica, vol. 38, no. 4, p. 627-642. http://dx.doi.org/10.1590/S0044-59672008000400005.
PIRES, JM. and PRANCE, GT. 1985. The vegetation types of the Brazilian Amazon. In PRANCE, G. and LOVEJOY, TE. (Eds.). Key environments Amazônia. New York: Pergamon Press. p. 109-145.
R Development Core Team, 2008. R: A Language and Environment for Statistical Computing. Vienna: The R Foundation for Statistical Computing. Available from: <http://www.R-project.org/>. Access in: 5 May 2014.
RAUNKIAER, C., 1934. The life form of plants and statistical plant geography. Oxford: Claredon. 632 p.
SALOMÃO, RP., VIEIRA, ICG., SUEMITSU, C., ROSA, NA., ALMEIDA, SS., AMARAL, DD. and MENEZES, MPM., 2007. As florestas de Belo Monte na grande curva do rio Xingu, Amazônia Oriental. Boletim do Museu Paraense Emílio Goeldi. Ciências Naturais, vol. 2, no. 3, p. 57-153.
SANTOS, GC. and JARDIM, MAG., 2006. Florística e estrutura do estrato arbóreo de uma floresta de várzea no Município de Santa Bárbara do Pará, Estado do Pará, Brasil. Acta Amazonica, vol. 36, no. 4, p. 437-446. http://dx.doi.org/10.1590/S0044-59672006000400006.
SILVA, USC., 2003. Fitossociologia do componente arbóreo e não arbóreo de uma Floresta Tropical em Cantá – RR. Belém: Universidade Federal Rural da Amazônia. 63 p. Dissertação de Mestrado em Ciências Florestais.
SILVA, KE., MATOS, FDA. and FERREIRA, MM., 2008. Composição florística e fitossociológica de espécies arbóreas do Parque Fenológico da Embrapa Amazônia Ocidental. Acta Amazonica, vol. 38, no. 2, p. 213-222. http://dx.doi.org/10.1590/S0044-59672008000200004.
SWAINE, MD., 1989. Population dynamics of tree species in tropical forests. In HOLM-NIELSEN, LB., NIELSEN, IC. and BALSLEV, H. Tropical forests, botanical dynamics, speciation and diversity. Scotland: University of Aberdeen. p. 101-110. http://dx.doi.org/10.1016/B978-0-12-353550-4.50016-2.