Embed Size (px)
Citation preview
Energy Procedia 37 ( 2013 ) 3018 – 3030
1876-6102 © 2013 The Authors. Published by Elsevier Ltd.Selection and/or peer-review under responsibility of GHGTdoi: 10.1016/j.egypro.2013.06.188
GHGT-11
Flow Assurance Study Wolfgang Bösera,b*, Stefan Belfroidc
aROAD Maasvlakte CCS Project C.V., NL 3112 NA Schiedam, The Netherlands bE.ON Ruhrgas AG Brüsseler Platz 1, 45131 Essen, Germany
, cTNO, NL-2600 AD Delft, The Netherlands
Abstract
Generally large scale carbon capture projects require pipeline systems for the transporting of the CO2 from its point of capture to the storage site. The article will give information on the proposed operational management system. This has to work for all process situations, ranging from steady flow at varying injection conditions and flow rates, to start-up and shutdown procedures and also for emergency shutdown at the platform. In all these operational situations the phase behaviour of CO2 and the process conditions will be affected by differential pressures and the temperature losses in the pipeline. The study was carried out on the specifics of the ROAD project and has to find operational procedures on the intended conditions determined by the operation of a power plant and a storage side with changing conditions at the storage side during the project lifetime.
© 2013 The Authors. Published by Elsevier Ltd. Selection and/or peer-review under responsibility of GHGT Keywords: CO2 transport, Pipeline, Flow Assurance, Operation, Phase Transition
1. Introduction
The Rotterdam Afvang en Opslag Demonstratie Project (ROAD) (www.road2020.nl) is a 250MWe equivalent carbon capture and storage (CCS) demonstration project being developed by E.ON Benelux and GDF SUEZ Energy Nederland. They initiated the joint venture Maasvlakte CCS Project C.V. (MCP). Intended partners of MCP are GDF Suez E&P Nederland for the CO2 transport and TAQA Energy for the CO2 injection and permanent storage under the seabed of the North Sea. The ROAD project is co-financed by the European Commission within the framework of the European Energy Programme for Recovery (EEPR), the Government of the Netherlands and the Global CCS Institute. The capture plant will be
* Corresponding author. Tel.: +49-209-6013232; fax: +49-201-184248178. E-mail address: [email protected].
Available online at www.sciencedirect.com
© 2013 The Authors. Published by Elsevier Ltd.Selection and/or peer-review under responsibility of GHGT
Wolfgang Böser and Stefan Belfroid / Energy Procedia 37 ( 2013 ) 3018 – 3030 3019
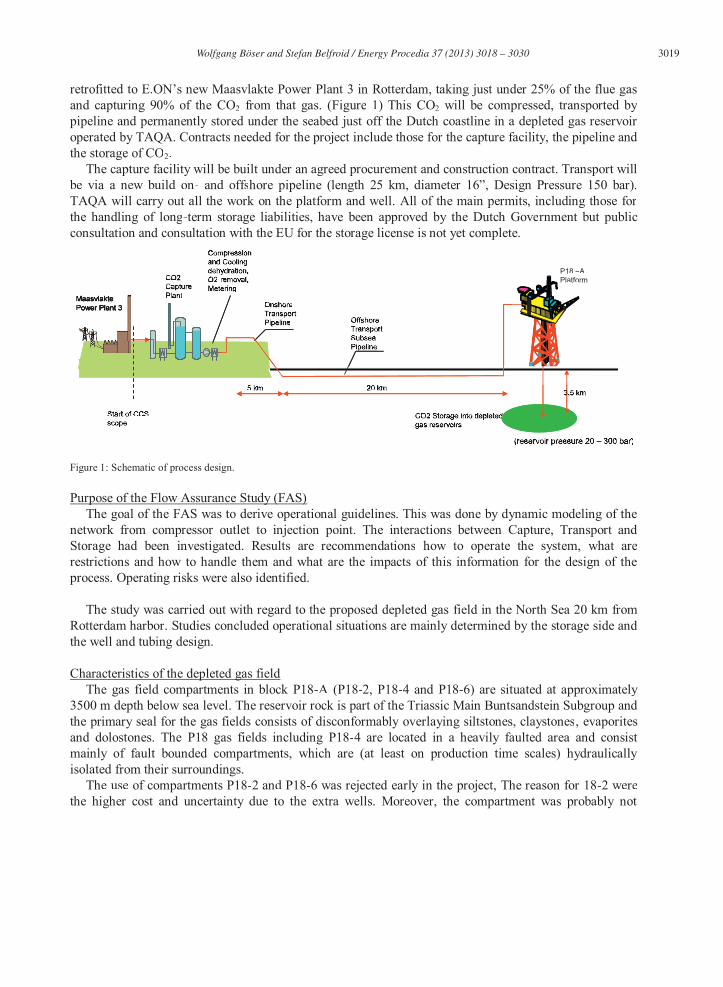
and capturing 90% of the CO2 from that gas. (Figure 1) This CO2 will be compressed, transported by pipeline and permanently stored under the seabed just off the Dutch coastline in a depleted gas reservoir operated by TAQA. Contracts needed for the project include those for the capture facility, the pipeline and the storage of CO2.
The capture facility will be built under an agreed procurement and construction contract. Transport willbe via a new build on- and offsTAQA will carry out all the work on the platform and well. All of the main permits, including those for the handling of long-term storage liabilities, have been approved by the Dutch Government but public consultation and consultation with the EU for the storage license is not yet complete.
Figure 1: Schematic of process design.
Purpose of the Flow Assurance Study (FAS)The goal of the FAS was to derive operational guidelines. This was done by dynamic modeling of the
network from compressor outlet to injection point. The interactions between Capture, Transport and Storage had been investigated. Results are recommendations how to operate the system, what are restrictions and how to handle them and what are the impacts of this information for the design of the process. Operating risks were also identified.
The study was carried out with regard to the proposed depleted gas field in the North Sea 20 km from Rotterdam harbor. Studies concluded operational situations are mainly determined by the storage side and the well and tubing design.
Characteristics of the depleted gas field The gas field compartments in block P18-A (P18-2, P18-4 and P18-6) are situated at approximately
3500 m depth below sea level. The reservoir rock is part of the Triassic Main Buntsandstein Subgroup and the primary seal for the gas fields consists of disconformably overlaying siltstones, claystones, evaporitesand dolostones. The P18 gas fields including P18-4 are located in a heavily faulted area and consist mainly of fault bounded compartments, which are (at least on production time scales) hydraulically isolated from their surroundings.
The use of compartments P18-2 and P18-6 was rejected early in the project, The reason for 18-2 were the higher cost and uncertainty due to the extra wells. Moreover, the compartment was probably not
CO2 Storage into depleted CO2 Storage into depletedd gas reservoirsgas reservoirs
MMMaasvlakteMaasvlaktePPPower Plant 3Power Plant 3
CO2 CO2Capture CapturePlantPlant
OnshoreOnshoreTransportTransport PipelinePipeline
P18 A Platform
OffshoreOffshoreTransport Transport SubseaSubseaPipelinePipelinep
5 km5 km 20 km20 km 3,5 km3,5 km333
CompressionCompressionand Coolingand Coolingdehydration, dehydration,O2O2--removal,removal,MeteringMetering
Start of CCS Start of CCSscopescope
(reservoir pressure 20 (reservoir pressure 20 300 bar)300 bar)
3020 Wolfgang Böser and Stefan Belfroid / Energy Procedia 37 ( 2013 ) 3018 – 3030
available early enough due to ongoing gas production. For P18-6 the reasons were limited capacity (approximately 1 Mton) and limited injectivity.
2. Design conditions
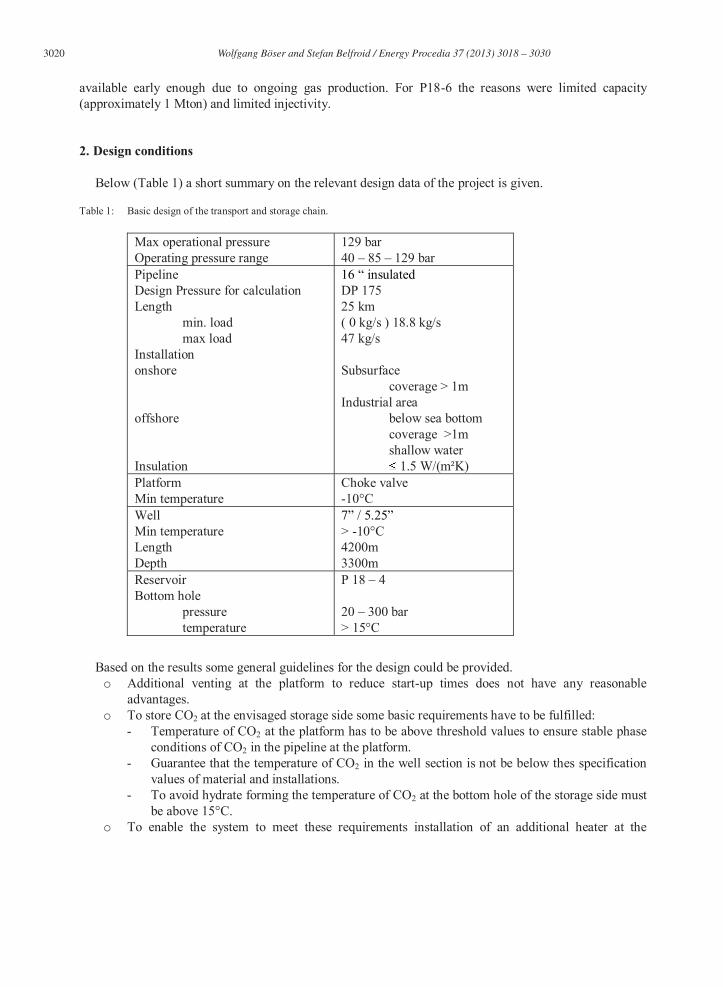
Below (Table 1) a short summary on the relevant design data of the project is given.
Table 1: Basic design of the transport and storage chain.
Max operational pressure Operating pressure range
129 bar 40 85 129 bar
Pipeline Design Pressure for calculation Length min. load max load Installation onshore offshore Insulation
DP 175 25 km ( 0 kg/s ) 18.8 kg/s 47 kg/s Subsurface coverage > 1m Industrial area below sea bottom coverage >1m shallow water 1.5 W/(m²K)
Platform Min temperature
Choke valve -10°C
Well Min temperature Length Depth
> -10°C 4200m 3300m
Reservoir Bottom hole pressure temperature
P 18 4 20 300 bar > 15°C
Based on the results some general guidelines for the design could be provided. o Additional venting at the platform to reduce start-up times does not have any reasonable
advantages. o To store CO2 at the envisaged storage side some basic requirements have to be fulfilled:
- Temperature of CO2 at the platform has to be above threshold values to ensure stable phase conditions of CO2 in the pipeline at the platform.
- Guarantee that the temperature of CO2 in the well section is not be below thes specification values of material and installations.
- To avoid hydrate forming the temperature of CO2 at the bottom hole of the storage side must be above 15°C.
o To enable the system to meet these requirements installation of an additional heater at the
Wolfgang Böser and Stefan Belfroid / Energy Procedia 37 ( 2013 ) 3018 – 3030 3021
platform was discussed. o Besides the requirements in respect of energy, deck space, weight of the fuel in the case of an oil
driven heater needed deck space at the platform and mechanical stability, simulation showed the limited benefit for operation. Instead of installation a heater at the platform it became obvious that operational procedures should be ramped up. To limit start up times at low reservoir pressure and to avoid restrictions by hydrate formation in the storage field, strategies using a heater installed at the platform were analyzed. Based on restrictions determined by the platform the heating capacity was limited to 4 MW. It was found that a 4 MW heater installed at the platform would not have enough capacity to ensure temperatures adequately high during start-up in order to reduce start-up time to less than a day. Only if the heater capacity were much higher it would be beneficial. Looking at the increase of the reservoir pressure due to the injection rate, a heater might be useful until the reservoir pressure is above 50 bar. Based on the proposed injection rate, an initial pressure for the project of 20 bar and injectivity of the storage side this period would be roughly less than 2 months. By developing start-up procedures which take longer (3.5 days at a most) installation of a heater was discarded.
o The valve section at the platform should be suitable for low temperatures to withstand effects caused by local pressure loses during opening of the valves and the Joule Thompson effect. By using valves of an Arctic design operational flexibility was gained.
3. Simulations model
Due to changes on pressures temperatures and well design during basic engineering, the study had to be constantly adapted. Based on the typical expected impurities for ROAD (Table 2) an analysis was carried out to investigate effects of these impurities on the condensation line compared to 100% of CO2. The effects found were minor and within the range of accuracy. It was decided to go on with simulation by using pure CO2.
Table 2: Impurities of CO2 fluid for ROAD.
N2 02 H2O Acetaldehyde Ar 350 ppmv 40 ppmv 40 ppmv 10 ppmv 7 ppmv
Simulations of the entire system were performed for a range of mass flow rates, reservoir pressures and inlet temperatures, starting from the inlet of the transport pipeline (onshore) up to the reservoir and down in the well. To understand the dynamics and the pipeline flow the transient multiphase flow simulator OLGA (SPT Group versions 7 and higher with different modules) was taken as the main simulation tool for FAS for the project. Transportation of large volumes of CO2 is preferably done in a dense phase condition. Transmission at a gaseous phase is not economical as the case with two-phase flow, in which high pressure losses particularly in hilly subsea terrain can occur.
OLGA is the worldwide leader and is the standard in dynamic simulation tools for multiphase simulation software. It is widely used in the industry for simulating multiphase pipe flows for the oil and gas industry. It also incorporates a CO2 module for accuracy in computing CO2 flows. The equation of state model used within OLGA for the CO2 single component module is the Span and Wagner Equation. The Span Wagner equation is a generalized corresponding states equation of state (EOS) that supersedes the earlier equations and now is generally recognised by industry as the most accurate representation of the available experimental pressure, volume and temperature data for CO2 and its mixtures.
The basis is a one dimensional, three-phase fully dynamic simulator including heat transfer. Fluid properties are based on external programs, such as PVTSIM, and are used in OLGA in the form of a
3022 Wolfgang Böser and Stefan Belfroid / Energy Procedia 37 ( 2013 ) 3018 – 3030
matrix in which all properties are tabulated. For use with CO2 systems, a single component module was added. The main difference between the single component and normal modules is the evaluation concerning phase transitions. In the base OLGA, the pressure, volume and temperature data is supplied to OLGA in the form of tab files. In general for oil and gas applications, the gas liquid fraction only gradually changes and forms a 2-phase envelope that is taken into account in OLGA. For a single component system, the tab file is generated in OLGA using the Wagner equation of state, which was setup specifically for pure CO2. For a single component, the phase transition region is not an envelope but a single line at which there is a discontinuity in the fluid enthalpy. Furthermore, as the critical point is in the normal operating range, a smoothing by numerical means needs to be done around this point. Around the critical point the fluid properties are extrapolated from the region boundaries. Like this singularities at the critical point could be avoided. This treatment of the phase envelope results in additional uncertainty as now a relaxation time in the condensation and boiling must be used to avoid unphysical results and to avoid numerical instabilities.
Except for the treatment of the phase diagram, there are no further modifications to the main OLGA code. This means that all normal multiphase correlations regarding slug initiation, entrainment rate, slip velocities etc. are maintained. With respect to the single phase flow, Kim et. al. made an inventory of available data on the pressure drop and heat transfer behaviour of CO2 including for the supercritical state [1]. Their conclusion was that currently insufficient data or reasons exist to believe that the dependence of heat transfer and pressure drop on fluid properties are not captured adequately by conventional single-phase turbulent flow correlations. Of course near the critical point large variation can occur. This means that all normal design tools can be used to design and dimension CO2 transport networks. Whether this is correct, with respect to multiphase is an unknown and too little open literature date is available at present. Due to the low surface tension and low viscosity of liquid CO2 compared to water and most oils, the multiphase flow behaviour is different and classic flow maps cannot be used to predict the actual flow regime. A lot of work is being done on the multiphase flow behaviour for CO2 boiling but mostly in smaller diameter tubes. Although for tubes larger than 1 mm in diameter they can be considered large for a two-phase CO2 flow. The results were that the flow maps deviated from the classic flow maps. Statoil recently presented some good prediction results using the Friedel relation recently [7]. With respect to the multiphase flow behaviour and especially the flow regime identification further research is required.
Groups such as Sintef , SPT group/IFE and CATO2 are currently working on that topic. While there is still uncertainty about the 2-phase aspects of a multiphase CO2 fluid flow, as long as no other validated dynamic tools are available, the use of OLGA for CO2 flow assurance is as good as one can get. However, the main uncertainties in the dynamic simulations using OLGA remain:
o Validity of two-phase models tuned and validated for oil-gas flow, for a CO2 stream. o Choice of thermodynamic non-equilibrium parameter. OLGA takes this phase transition
relaxation time by a parameter which determines the time delay with respect to the thermodynamic non-equilibrium. A low relaxation time means all phase transfer happens extremely fast. For simulation the default value of 1 sec is used for boiling and condensation. This is the value recommended by the SPT Group.
At the moment there is too limited a set of field data on the open literature to remove these uncertainties. For validation, field data or test data should be gathered or obtained.
4. Steady state operating conditions
4.1. Well behaviour
For injection into a well, the mass flow rate is determined by the upstream compressor or pump system, which means that at steady state the mass flow rate is given. As the reservoir pressure is also given at a given time, all other pressures throughout the system can be determined from these inputs,
Wolfgang Böser and Stefan Belfroid / Energy Procedia 37 ( 2013 ) 3018 – 3030 3023
including the bottom hole pressure, even though small variations in bottom hole pressure may occur due to variations in bottom hole temperatures. Furthermore, the wellhead temperature is determined by the pipeline heat losses and the pipeline inlet temperature. This means that for an injection scenario, the wellhead pressure is a result rather than a clear control parameter.
The pressure drop through the well is made up of two components: the gravitational and the frictional pressure drops:
Dugpp
zp
frictiongravity12
21 , (1)
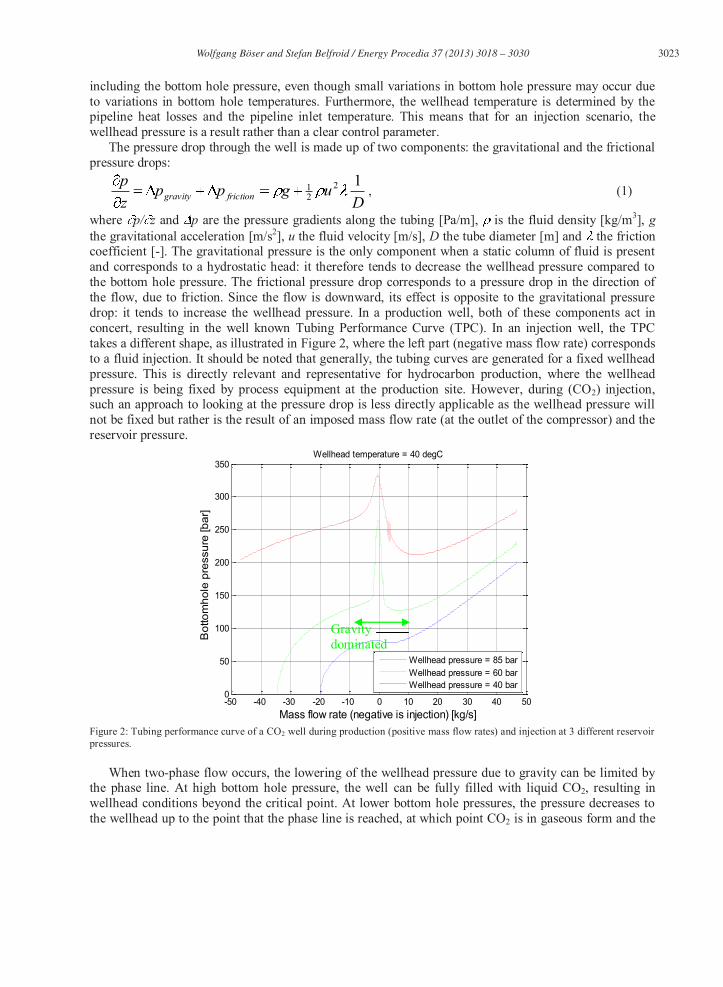
where p/ z and p are the pressure gradients along the tubing [Pa/m], is the fluid density [kg/m3], g the gravitational acceleration [m/s2], u the fluid velocity [m/s], D the tube diameter [m] and the friction coefficient [-]. The gravitational pressure is the only component when a static column of fluid is present and corresponds to a hydrostatic head: it therefore tends to decrease the wellhead pressure compared to the bottom hole pressure. The frictional pressure drop corresponds to a pressure drop in the direction of the flow, due to friction. Since the flow is downward, its effect is opposite to the gravitational pressure drop: it tends to increase the wellhead pressure. In a production well, both of these components act in concert, resulting in the well known Tubing Performance Curve (TPC). In an injection well, the TPC takes a different shape, as illustrated in Figure 2, where the left part (negative mass flow rate) corresponds to a fluid injection. It should be noted that generally, the tubing curves are generated for a fixed wellhead pressure. This is directly relevant and representative for hydrocarbon production, where the wellhead pressure is being fixed by process equipment at the production site. However, during (CO2) injection, such an approach to looking at the pressure drop is less directly applicable as the wellhead pressure will not be fixed but rather is the result of an imposed mass flow rate (at the outlet of the compressor) and the reservoir pressure.
-50 -40 -30 -20 -10 0 10 20 30 40 500
50
100
150
200
250
300
350
Mass flow rate (negative is injection) [kg/s]
Bot
tom
hole
pre
ssur
e [b
ar]
Wellhead temperature = 40 degC
Wellhead pressure = 85 barWellhead pressure = 60 barWellhead pressure = 40 bar
Figure 2: Tubing performance curve of a CO2 well during production (positive mass flow rates) and injection at 3 different reservoir pressures.
When two-phase flow occurs, the lowering of the wellhead pressure due to gravity can be limited by the phase line. At high bottom hole pressure, the well can be fully filled with liquid CO2, resulting in wellhead conditions beyond the critical point. At lower bottom hole pressures, the pressure decreases to the wellhead up to the point that the phase line is reached, at which point CO2 is in gaseous form and the
Gravity dominated
3024 Wolfgang Böser and Stefan Belfroid / Energy Procedia 37 ( 2013 ) 3018 – 3030
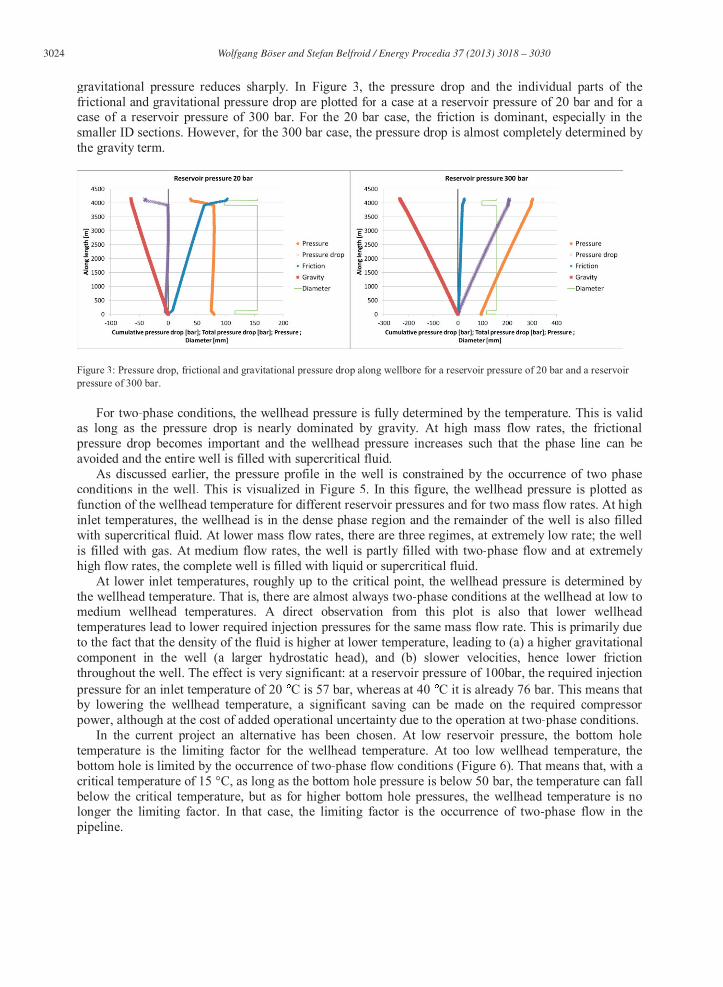
gravitational pressure reduces sharply. In Figure 3, the pressure drop and the individual parts of thefrictional and gravitational pressure drop are plotted for a case at a reservoir pressure of 20 bar and for a case of a reservoir pressure of 300 bar. For the 20 bar case, the friction is dominant, especially in thesmaller ID sections. However, for the 300 bar case, the pressure drop is almost completely determined by the gravity term.
Figure 3: Pressure drop, frictional and gravitational pressure drop along wellbore for a reservoir pressure of 20 bar and a reservoirpressure of 300 bar.
For two-phase conditions, the wellhead pressure is fully determined by the temperature. This is valid as long as the pressure drop is nearly dominated by gravity. At high mass flow rates, the frictionalpressure drop becomes important and the wellhead pressure increases such that the phase line can beavoided and the entire well is filled with supercritical fluid.
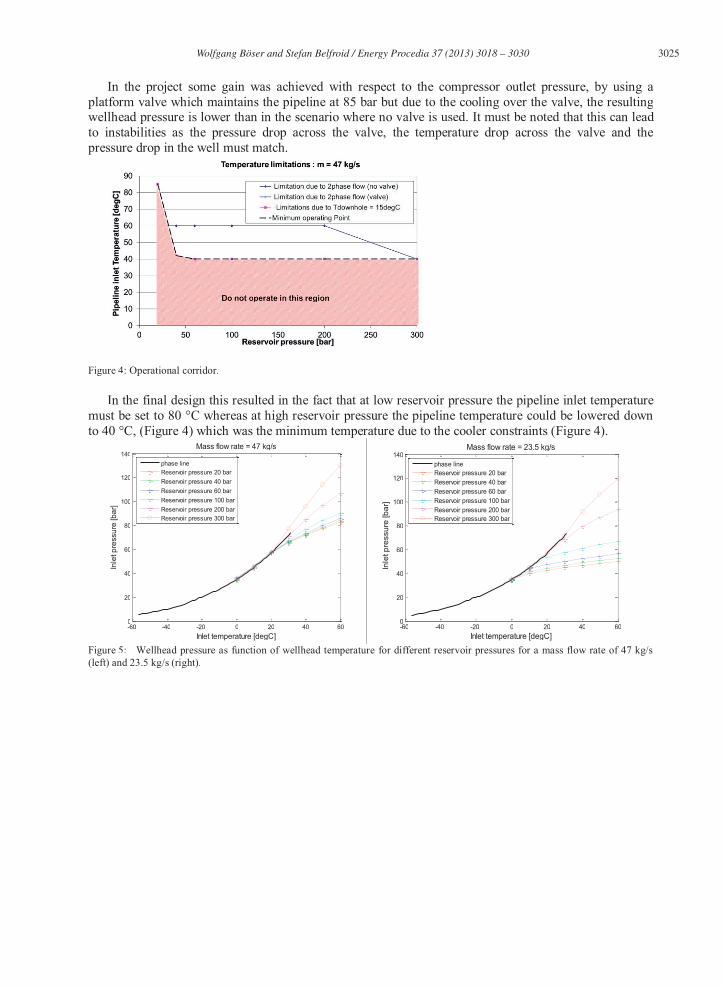
As discussed earlier, the pressure profile in the well is constrained by the occurrence of two phaseconditions in the well. This is visualized in Figure 5. In this figure, the wellhead pressure is plotted asfunction of the wellhead temperature for different reservoir pressures and for two mass flow rates. At highinlet temperatures, the wellhead is in the dense phase region and the remainder of the well is also filled with supercritical fluid. At lower mass flow rates, there are three regimes, at extremely low rate; the wellis filled with gas. At medium flow rates, the well is partly filled with two-phase flow and at extremely high flow rates, the complete well is filled with liquid or supercritical fluid.
At lower inlet temperatures, roughly up to the critical point, the wellhead pressure is determined by the wellhead temperature. That is, there are almost always two-phase conditions at the wellhead at low tomedium wellhead temperatures. A direct observation from this plot is also that lower wellhead temperatures lead to lower required injection pressures for the same mass flow rate. This is primarily dueto the fact that the density of the fluid is higher at lower temperature, leading to (a) a higher gravitationalcomponent in the well (a larger hydrostatic head), and (b) slower velocities, hence lower frictionthroughout the well. The effect is very significant: at a reservoir pressure of 100bar, the required injectionpressure for an inlet temperature of 20 C is 57 bar, whereas at 40C C it is already 76 bar. This means that Cby lowering the wellhead temperature, a significant saving can be made on the required compressorpower, although at the cost of added operational uncertainty due to the operation at two-phase conditions.
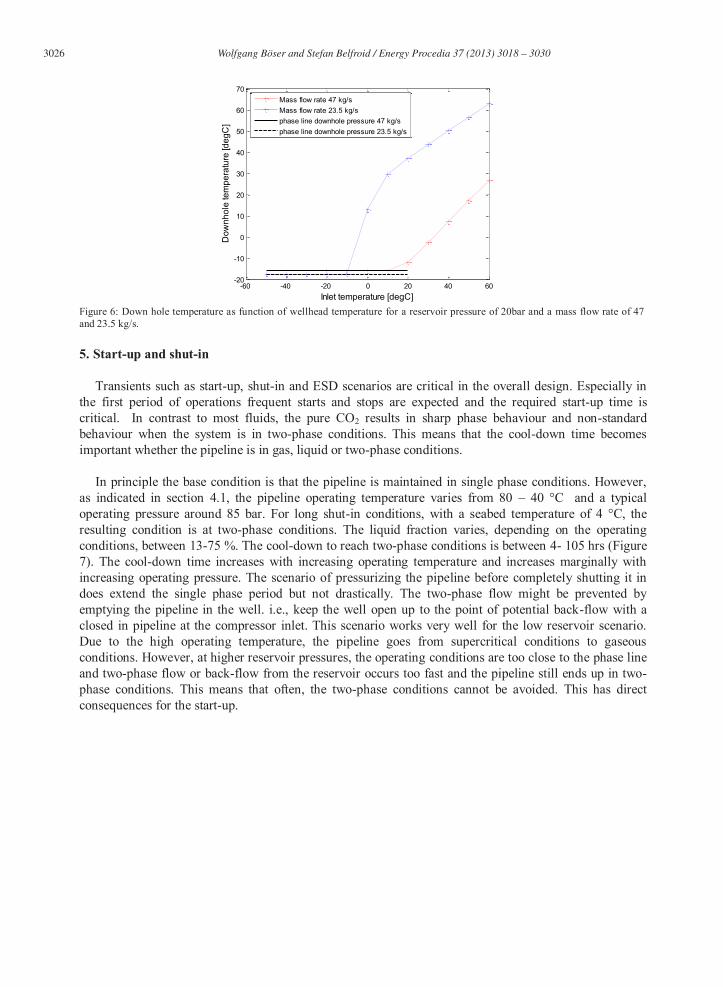
In the current project an alternative has been chosen. At low reservoir pressure, the bottom holetemperature is the limiting factor for the wellhead temperature. At too low wellhead temperature, thebottom hole is limited by the occurrence of two-phase flow conditions (Figure 6). That means that, with a critical temperature of 15 °C, as long as the bottom hole pressure is below 50 bar, the temperature can fall below the critical temperature, but as for higher bottom hole pressures, the wellhead temperature is nolonger the limiting factor. In that case, the limiting factor is the occurrence of two-phase flow in the pipeline.
Wolfgang Böser and Stefan Belfroid / Energy Procedia 37 ( 2013 ) 3018 – 3030 3025
In the project some gain was achieved with respect to the compressor outlet pressure, by using aplatform valve which maintains the pipeline at 85 bar but due to the cooling over the valve, the resulting wellhead pressure is lower than in the scenario where no valve is used. It must be noted that this can lead to instabilities as the pressure drop across the valve, the temperature drop across the valve and thepressure drop in the well must match.
Figure 4: Operational corridor.
In the final design this resulted in the fact that at low reservoir pressure the pipeline inlet temperaturemust be set to 80 °C whereas at high reservoir pressure the pipeline temperature could be lowered downto 40 °C, (Figure 4) which was the minimum temperature due to the cooler constraints (Figure 4).
-60 -40 -20 0 20 40 600
20
40
60
80
100
120
140
Inlet temperature [degC]
Inle
t pre
ssur
e [b
ar]
Mass flow rate = 47 kg/s
phase lineReservoir pressure 20 barReservoir pressure 40 barReservoir pressure 60 barReservoir pressure 100 barReservoir pressure 200 barReservoir pressure 300 bar
-60 -40 -20 0 20 40 600
20
40
60
80
100
120
140
Inlet temperature [degC]
Inle
t pre
ssur
e [b
ar]
Mass flow rate = 23.5 kg/s
phase lineReservoir pressure 20 barReservoir pressure 40 barReservoir pressure 60 barReservoir pressure 100 barReservoir pressure 200 barReservoir pressure 300 bar
Figure 5: Wellhead pressure as function of wellhead temperature for different reservoir pressures for a mass flow rate of 47 kg/s(left) and 23.5 kg/s (right).
3026 Wolfgang Böser and Stefan Belfroid / Energy Procedia 37 ( 2013 ) 3018 – 3030
-60 -40 -20 0 20 40 60-20
-10
0
10
20
30
40
50
60
70
Inlet temperature [degC]
Dow
nhol
e te
mpe
ratu
re [d
egC
]
Mass flow rate 47 kg/sMass flow rate 23.5 kg/sphase line downhole pressure 47 kg/sphase line downhole pressure 23.5 kg/s
Figure 6: Down hole temperature as function of wellhead temperature for a reservoir pressure of 20bar and a mass flow rate of 47 and 23.5 kg/s.
5. Start-up and shut-in
Transients such as start-up, shut-in and ESD scenarios are critical in the overall design. Especially in the first period of operations frequent starts and stops are expected and the required start-up time is critical. In contrast to most fluids, the pure CO2 results in sharp phase behaviour and non-standard behaviour when the system is in two-phase conditions. This means that the cool-down time becomes important whether the pipeline is in gas, liquid or two-phase conditions.
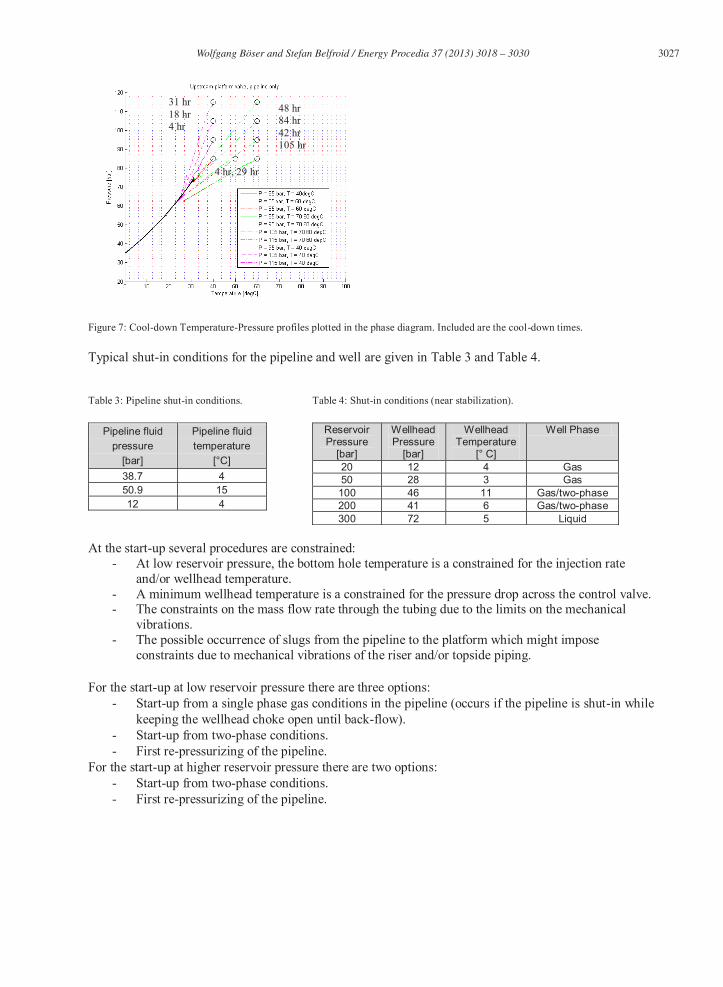
In principle the base condition is that the pipeline is maintained in single phase conditions. However, as indicated in section 4.1, the pipeline operating temperature varies from 80 40 °C and a typical operating pressure around 85 bar. For long shut-in conditions, with a seabed temperature of 4 °C, the resulting condition is at two-phase conditions. The liquid fraction varies, depending on the operating conditions, between 13-75 %. The cool-down to reach two-phase conditions is between 4- 105 hrs (Figure 7). The cool-down time increases with increasing operating temperature and increases marginally with increasing operating pressure. The scenario of pressurizing the pipeline before completely shutting it in does extend the single phase period but not drastically. The two-phase flow might be prevented by emptying the pipeline in the well. i.e., keep the well open up to the point of potential back-flow with a closed in pipeline at the compressor inlet. This scenario works very well for the low reservoir scenario. Due to the high operating temperature, the pipeline goes from supercritical conditions to gaseous conditions. However, at higher reservoir pressures, the operating conditions are too close to the phase line and two-phase flow or back-flow from the reservoir occurs too fast and the pipeline still ends up in two-phase conditions. This means that often, the two-phase conditions cannot be avoided. This has direct consequences for the start-up.
Wolfgang Böser and Stefan Belfroid / Energy Procedia 37 ( 2013 ) 3018 – 3030 3027
Figure 7: Cool-down Temperature-Pressure profiles plotted in the phase diagram. Included are the cool-down times.
Typical shut-in conditions for the pipeline and well are given in Table 3 and Table 4.
Table 3: Pipeline shut-in conditions.
Pipeline fluid pressure
[bar]
Pipeline fluid temperature
[°C] 38.7 4 50.9 15 12 4
Table 4: Shut-in conditions (near stabilization).
Reservoir Pressure
[bar]
Wellhead Pressure
[bar]
Wellhead Temperature
[° C]
Well Phase
20 12 4 Gas 50 28 3 Gas 100 46 11 Gas/two-phase 200 41 6 Gas/two-phase 300 72 5 Liquid
At the start-up several procedures are constrained:
- At low reservoir pressure, the bottom hole temperature is a constrained for the injection rate and/or wellhead temperature.
- A minimum wellhead temperature is a constrained for the pressure drop across the control valve. - The constraints on the mass flow rate through the tubing due to the limits on the mechanical
vibrations. - The possible occurrence of slugs from the pipeline to the platform which might impose
constraints due to mechanical vibrations of the riser and/or topside piping. For the start-up at low reservoir pressure there are three options:
- Start-up from a single phase gas conditions in the pipeline (occurs if the pipeline is shut-in while keeping the wellhead choke open until back-flow).
- Start-up from two-phase conditions. - First re-pressurizing of the pipeline.
For the start-up at higher reservoir pressure there are two options: - Start-up from two-phase conditions. - First re-pressurizing of the pipeline.
31 hr 18 hr 4 hr
48 hr 84 hr 42 hr 105 hr
4 hr, 29 hr
3028 Wolfgang Böser and Stefan Belfroid / Energy Procedia 37 ( 2013 ) 3018 – 3030
The start-up procedure is very dependent on the bottom hole pressure. As stated, at low reservoir pressure, there is a strict limit in the injection temperature to avoid dropping below the critical down hole temperature of 15 °C. That means that at low reservoir pressure, the injection rate must be limited at the start. The injection can be increased only if the wellhead temperature has increased enough. Due to the long pipeline this will take several days. Start-up from two-phase conditions at low reservoir pressure poses a problem as the pipeline pressure is much higher at a minimum of 39 bar compared to the wellhead pressure of 11 bar. If the control valve is opened at those conditions the pressure drop is such that the wellhead temperature drops to approximately -30 °C. This is too low for the design temperature unless Artic wellhead design constraint is taken. The same does not apply to the higher reservoir pressure scenarios as the wellhead pressure is in those cases near equal or higher than the pipeline shut-in pressure. In those cases start-up until stabilization takes in those cases about 20 hours (reservoir pressure of 100bar).
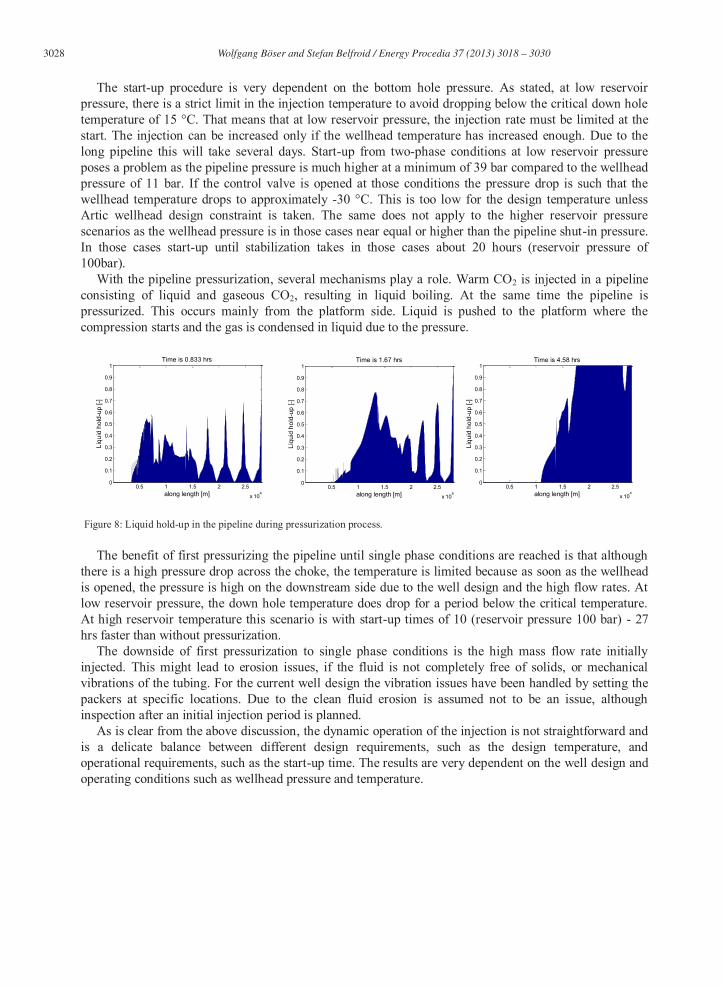
With the pipeline pressurization, several mechanisms play a role. Warm CO2 is injected in a pipeline consisting of liquid and gaseous CO2, resulting in liquid boiling. At the same time the pipeline is pressurized. This occurs mainly from the platform side. Liquid is pushed to the platform where the compression starts and the gas is condensed in liquid due to the pressure.
Figure 8: Liquid hold-up in the pipeline during pressurization process.
The benefit of first pressurizing the pipeline until single phase conditions are reached is that although there is a high pressure drop across the choke, the temperature is limited because as soon as the wellhead is opened, the pressure is high on the downstream side due to the well design and the high flow rates. At low reservoir pressure, the down hole temperature does drop for a period below the critical temperature. At high reservoir temperature this scenario is with start-up times of 10 (reservoir pressure 100 bar) - 27 hrs faster than without pressurization.
The downside of first pressurization to single phase conditions is the high mass flow rate initially injected. This might lead to erosion issues, if the fluid is not completely free of solids, or mechanical vibrations of the tubing. For the current well design the vibration issues have been handled by setting the packers at specific locations. Due to the clean fluid erosion is assumed not to be an issue, although inspection after an initial injection period is planned.
As is clear from the above discussion, the dynamic operation of the injection is not straightforward and is a delicate balance between different design requirements, such as the design temperature, and operational requirements, such as the start-up time. The results are very dependent on the well design and operating conditions such as wellhead pressure and temperature.
0.5 1 1.5 2 2.5
x 104
0
0.1
0.2
0.3
0.4
0.5
0.6
0.7
0.8
0.9
1
along length [m]
Liqu
id h
old-
up [-
]
Time is 1.67 hrs
0.5 1 1.5 2 2.5
x 104
0
0.1
0.2
0.3
0.4
0.5
0.6
0.7
0.8
0.9
1
along length [m]
Liqu
id h
old-
up [-
]
Time is 4.58 hrs
0.5 1 1.5 2 2.5
x 104
0
0.1
0.2
0.3
0.4
0.5
0.6
0.7
0.8
0.9
1
along length [m]
Liqu
id h
old-
up [-
]
Time is 0.833 hrs
Wolfgang Böser and Stefan Belfroid / Energy Procedia 37 ( 2013 ) 3018 – 3030 3029
6. Discussion
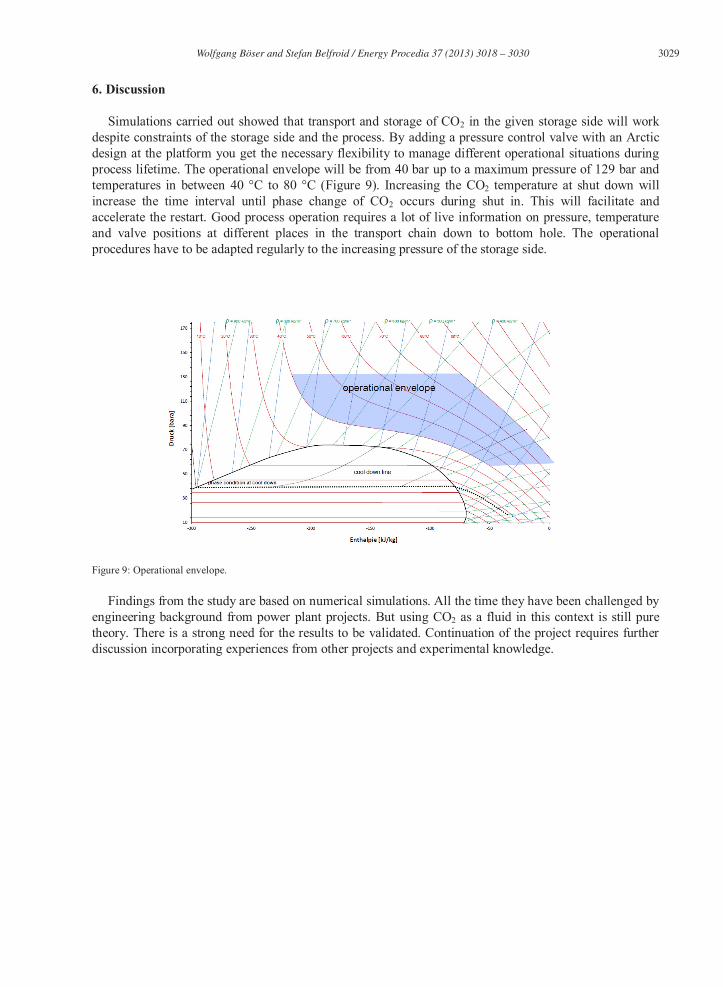
Simulations carried out showed that transport and storage of CO2 in the given storage side will work despite constraints of the storage side and the process. By adding a pressure control valve with an Arctic design at the platform you get the necessary flexibility to manage different operational situations during process lifetime. The operational envelope will be from 40 bar up to a maximum pressure of 129 bar and temperatures in between 40 °C to 80 °C (Figure 9). Increasing the CO2 temperature at shut down will increase the time interval until phase change of CO2 occurs during shut in. This will facilitate and accelerate the restart. Good process operation requires a lot of live information on pressure, temperature and valve positions at different places in the transport chain down to bottom hole. The operational procedures have to be adapted regularly to the increasing pressure of the storage side.
Figure 9: Operational envelope.
Findings from the study are based on numerical simulations. All the time they have been challenged by engineering background from power plant projects. But using CO2 as a fluid in this context is still pure theory. There is a strong need for the results to be validated. Continuation of the project requires further discussion incorporating experiences from other projects and experimental knowledge.
3030 Wolfgang Böser and Stefan Belfroid / Energy Procedia 37 ( 2013 ) 3018 – 3030
7. Acknowledgements
The flow assurance involved a great number of experts from GDF Suez and E.ON. Skills for numerical software simulation by TNO is acknowledged for the numerical work. Thanks goes to TAQA for sharing its specific experiences in the architecture of gas production side on a platform. They all provided valuable input for the ROAD project.
8. References
[1] Kim M-H, Pettersen F., Bullard C.W.,2004 Fundamental process and system design issues in CO2 vapor compression systems, Progress in Energy and Combustion Science 30 119-174 [2] Snøhvit LNG plant and CO2 transport R&D Dr. Gelein de Koeijer; Gassnova CO2 transport workshop; 7-11-2008, Porsgrunn [3] CATO2 WP2.1
-Phase Flow in Carbon D144847 [5] Havre K., Active Feedback Control as the Solution to Severe Slugging, SPE 71540, 2001 [6] Koeijer G. et al., Experiments and modeling of two phasetransient flow during CO2 pipeline deprerssurization, GHGT 9, Elsvier, Energy Procedia, 1683-1689, 2009 [7] Paterson L. et al., Numerical Modeling of Pressure and Temperature Profiles including Phase Transitions in Carbon Dioxide Wells, SPE 115946, 2008 [8] Pekot L. et al., Simulation of two-phase flow in carbon dioxide injection wells, SPE 144847, 2011 [9] Dugstad A. et al., Dense phase CO2 transport when is corrosion a threat, NACE International 2011 [10] Liljemark S. et al., Dynamic simulation of a carbon dioxide transfer pipeline for analysis of normal operation and failure modes, GHGT 10, Elsvier, Energy Procedia, 3040 3047, 2011 [11] Chaczykowski M., Osiadacz A., Dynamic simulation of pipeline containing dense /supercritical CO2-rich mixtures for carbon capture and storage, Elsevier, 446-456, 2012


![nienen böser, dann zu Rockwyl … - mennonitica.chmennonitica.ch/wp-content/uploads/2012/07/JBOAG_2007_145... · 2012. 8. 4. · ren] noch waffen bruchen, machet unbillich [erklärt](https://img.pdfslide.net/doc/110x75/612eb9361ecc51586942fe55/nienen-bser-dann-zu-rockwyl-2012-8-4-ren-noch-waffen-bruchen-machet.jpg)