Embed Size (px)
Citation preview

Chapter 6
© 2012 Pasqual et al., licensee InTech. This is an open access chapter distributed under the terms of the Creative Commons Attribution License (http://creativecommons.org/licenses/by/3.0), which permits unrestricted use, distribution, and reproduction in any medium, provided the original work is properly cited.
Flow Cytometry Applied in Tissue Culture
Moacir Pasqual, Leila Aparecida Salles Pio, Ana Catarina Lima Oliveira and Joyce Dória Rodrigues Soares
Additional information is available at the end of the chapter
http://dx.doi.org/10.5772/50986
1. Introduction
Flow cytometry is a powerful technology that allows for the simultaneous analysis of
multiple attributes of cells or particles in a liquid medium. The first cytometer used was
built during World War II, when [1] developed an equipment where particles flowed
through the system to diffuse light through a lens, producing electrical signals sensed by a
photodetector. The instrument could detect objects in the order of ~ 0.5 μm in diameter, and
is recognized as the first flow cytometer used for observation of biological cells [2]. This
would be possible to identify aerosols, bacteria that would possibly biological warfare
agents as well as check the efficiency of gas mask filters against particles. In 1950, the same
principle was applied to the detection and enumeration of blood cells. As hematology and
cellular immunology, two biological areas, that drove the development of flow cytometry
[3]. Later, with improved equipment and methods, this technique was adapted to other
areas of biology, including the plant kingdom [4]. Already in 1973 the German botanist
Friedrich Otto Heller used the Impulszytophotometrie (pulse cytophotometry in German).
This scientist did not imagine that it has launched a new field of scientific research, which
would later be called flow cytometry in plants.
In reference to [5] that developed a rapid and convenient method for the isolation of plant
nuclei by cutting the same tissue in a lysis buffer consisting of a buffer to destroy the cellular
and nuclear membranes of the cell allowing the release of DNA. Since then, this has been the
main and most reliable method of isolating nuclear plant in flow cytometry. Any type of
sample can be analyzed because its particles (cells, nuclei, chromosomes, cell organelles, or
other cell subparticles) are suspended and vary between 0.2 μm and 50 μm in size. Solid
tissues must be disaggregated and suspended before flow cytometry analysis. The
suspended particles are then placed into a flow cytometry device.
The studies on flow cytometry have used as base the plant tissue culture, including the
regeneration of plants subjected to chromosome doubling, for detection of somaclonal
Recent Advances in Plant in vitro Culture 110
variation in material micropropagated in various subcultures, viability of pollen grains, cell
cycles and the determination of ploidy. This chapter presents results obtained through flow
cytometry on plant tissue culture.
2. Preparation of material for analysis in flow cytometry
There are several methods that can be used to prepare plant material and to estimate the
DNA content by flow cytometry. The methodologies differ according to plant species, a
laboratory, with the brand and model flow cytometer used. In Tissue Culture Lab in the
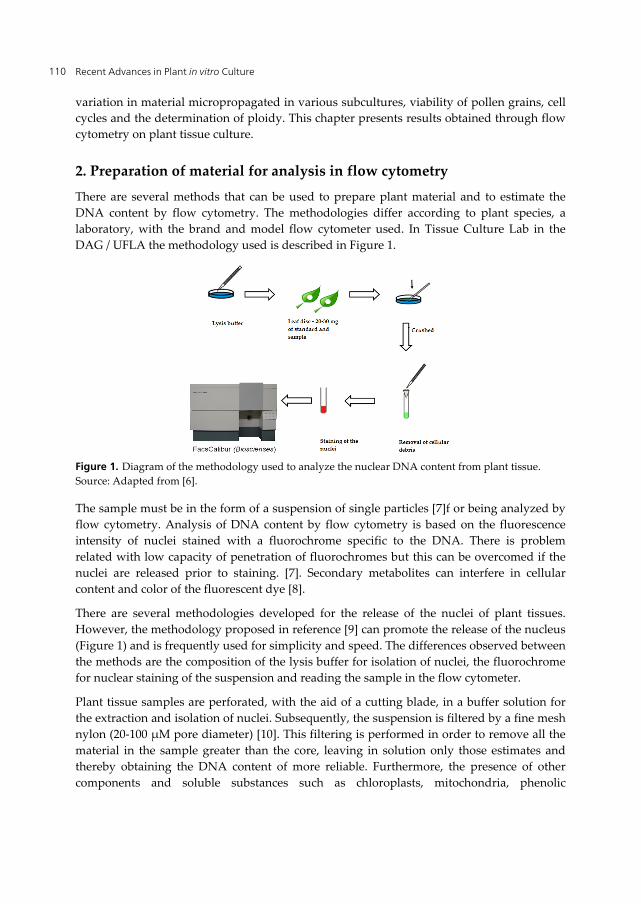
DAG / UFLA the methodology used is described in Figure 1.
Figure 1. Diagram of the methodology used to analyze the nuclear DNA content from plant tissue.
Source: Adapted from [6].
The sample must be in the form of a suspension of single particles [7]f or being analyzed by
flow cytometry. Analysis of DNA content by flow cytometry is based on the fluorescence
intensity of nuclei stained with a fluorochrome specific to the DNA. There is problem
related with low capacity of penetration of fluorochromes but this can be overcomed if the
nuclei are released prior to staining. [7]. Secondary metabolites can interfere in cellular
content and color of the fluorescent dye [8].
There are several methodologies developed for the release of the nuclei of plant tissues.
However, the methodology proposed in reference [9] can promote the release of the nucleus
(Figure 1) and is frequently used for simplicity and speed. The differences observed between
the methods are the composition of the lysis buffer for isolation of nuclei, the fluorochrome
for nuclear staining of the suspension and reading the sample in the flow cytometer.
Plant tissue samples are perforated, with the aid of a cutting blade, in a buffer solution for
the extraction and isolation of nuclei. Subsequently, the suspension is filtered by a fine mesh
nylon (20-100 μM pore diameter) [10]. This filtering is performed in order to remove all the
material in the sample greater than the core, leaving in solution only those estimates and
thereby obtaining the DNA content of more reliable. Furthermore, the presence of other
components and soluble substances such as chloroplasts, mitochondria, phenolic

Flow Cytometry Applied in Tissue Culture 111
compounds, DNAse, RNAse etc., which are released in the cytosol may through this filter
and compromise the quality of results. An alternative may be employed to remove such
debris is the washing of the nuclei using centrifugation and resuspension, and to modify the
components and / or pH of the buffer [11]. After filtering the samples are stained with a
fluorochrome specific, then the analysis of samples in the flow cytometer.
3. Factors that affect the quality of the sample
Several factors can affect the quality of the samples and consequently the reliability of
estimates of DNA content obtained by flow cytometry. Extraction buffer, reference standard,
fluorochrome, type of plant tissue used (chemical composition and the presence of
anthocyanin, phenolic compounds that inhibit DNA staining), quality of the sample (plant
age, presence of injuries, diseases ...), storage time of the plant tissue, care in preparation
and sample analysis are among the factors involved [12]. Thus, an appropriate methodology
is necessary for each species.
3.1. Nuclear extraction buffer
The extraction buffer is an appropriate solution that has the function to release the nuclei of
intact cells, preserving and ensuring the stability and integrity of nuclei during the
experiment, inhibiting the activity of nucleases, and providing optimal conditions for
staining of DNA by stoichiometry [13]. Approximately 25 caps are, but only eight are
commonly used in flow cytometry [14]. The six most commonly used buffers are shown in
Table 1.
Buffer Composition Standard
Galbraith 45 mM MgCl2; 30 mM citrato de sódio; 20 mM MOPS; 0.1% (v/v)
Triton X-100; pH 7.0 [15]
LB011 15 mM Tris; 2 mM Na2.EDTA; 0.5 mM espermina.4HCl; 80 mM KCl;
20 mM NaCl; 0.1% (v/v) Triton X-100; pH 7.5 [16]
Otto’s Otto I: 100 mM ácido citric mono hidratado; 0.5% (v/v) Tween 20
(pH approx. 2–3)
Otto II: 400 mM Na2PO4.12H2O (pH approx. 8–9)
[17], [18]
Tris.MgCl2 200 mM Tris; 4 mM MgCl2.6H2O; 0.5% (v/v) Triton X- 100; pH 7.5 [19]
Marie 50 mM glucose; 15 mM NaCl; 15 mM KCl; 5 mM Na2.EDTA; 50 mM
citrate de sódio; 0.5% Tween 20, 50 mM HEPES (pH 7.2), 1% (m/v)
polyvinylpyrrolidone-10 (PVP-10)
[20]
EDTA = ethylenediamine tetraacetic acid; HEPES = 4-2 ethanesulfonic Acid Hydroxyethyl-piperazine-1; MOPS = 3 -
(N-morpholino) propanesulfonic; = Tris (hidroximetril) aminomethane and PVP = polyvinyl pyrrolidone.
Table 1. Composition of extraction buffers commonly used in flow cytometry plant.
The caps have in their composition organic buffering substances, non-ionic detergents and
stabilizers of chromatin. The substances commonly used are buffers, MOPS, HEPES, and

Recent Advances in Plant in vitro Culture 112
TRIS, allowing the stabilization of pH 7-8 solutions, which is the pH range compatible to
most of the fluorochromes used.
The nonionic detergents are present in the buffer solutions with TRITON X-100 and Tween-
20, for cleaning of the cores and separation for avoiding that they add to each other or with
possible debris present in the sample.
Stabilizers used in the composition of the buffer are MgCl2, MgSO4 and spermine and
chelating agents such as EDTA and sodium citrate. These components bind divalent cations
which are cofactors endonuclease. The inorganic salts NaCl and KCl allow to achieve
adequate ionic strength [21].
Cytosolic compounds that are released during the isolation of nuclei, interact with nuclear
DNA and / or the fluorochrome, and affect the quality of the sample and cause
stoichiometric errors [22, 23, 24, 25].
In the literature there are few reports that compare the efficiency of different buffers for
nuclear extraction. There is a single buffer works optimally for all types or tissues and plant
species, previous studies are needed to identify the most appropriate buffer for each species
studied and contribute to a greater experimental precision [24].
3.2. Reference standards fluorochromes
The reference standard is a DNA of species whose amount already previously known, and
thus can be estimated by comparing the DNA content of any kind. There are a number of
reference patterns with a wide range of DNA content allowing coverage of a wide range of
genome. a species whose amount The use of these standards allows comparison of results
obtained in different laboratories.
Estimates of DNA content obtained by flow cytometry are always relative to a standard
whose DNA content is already established. This pattern receives two reference designations
internal standard, when extraction of the cores and the analysis of sample and standard are
performed simultaneously, or when an external standard is performed separately. The
internal standards are most recommended, especially in high-precision measurements,
because the peaks of the standard used and the sample appear in the same histogram and
are treated under identical conditions [26] thereby reducing possible errors due to
oscillation of the device during the evaluation of the samples. However [27] reported that
the simultaneous processing of the sample and the reference standard was not necessary to
obtain reliable estimates of DNA. It is common to use only one reference standard in all
analyzes of the same experiment, but this procedure carries the risk of error due to
nonlinearity [28, 29].
However, the choice and correct use of reference standards is a criterion that has been
largely neglected [30].
The researcher Jaroslav Doležel from Laboratory of Molecular Cytogenetics and Cytometry, of
the Czech Republic has set benchmarks with content from genomic DNA with different sizes.

Flow Cytometry Applied in Tissue Culture 113
Description DNA content (pg) References
Raphanus sativus cv Saxas 1,11 [31]
Solanum lycopersicum cv Stupické 1,96 [21]
Glycine max 2,5
Zea mays 5,72
Pisum sativum cv Ctirad 9,09 [32]
Secale cereale 16,19
Vicia faba 26,90
Allium cepa 34,89
Table 2. Content of DNA of known standards are used.
3.3. Fluorochromes
The choice of fluorochrome is another important factor that affects the reliability of
estimates of DNA content. The fluorochromes specifically bind to DNA and
stoichiometrically in accordance with the intensity of fluorescence of the nucleus or the cell
suspensions analyzed on flow is estimated for DNA content [6]. Fluorochromes used in
coloring cores are shown in Table 3.
Fluorochrome DNA binding mode Wave-length
Excitation Emission
Propidium iodide Interleaving 525 (Blue-green) 605 (Red)
Ethidium bromide Interleaving 535 (Blue-green) 602 (Red)
SYBR Green Interleaving 488 (Blue) 522 (Green)
DAPI Rich regions in AT 345 (UV) 460 (Blue)
Hoechst 33258 Rich regions in AT 360 (UV) 460 (Blue)
Chromomycin A3 Rich regions in GC 445 (Violet-blue) 520 (Green)
Mithramycin Rich regions in GC 445 (Violet-blue) 575 (Green)
Table 3. Fluorochromes used in flow cytometry to estimate the DNA content.
There are two classes of fluorochromes the intercalating and specific. The propidium iodide,
ethidium bromide and Sybr Green are intercalating fluorochrome, i.e., without preference of
base pairs and are the most adequate to estimate the DNA content [33 cited by 34].
DAPI, Hoechst 33258, Chromomycin A3 and Mithramycin fluorochromes are specific. The
Mithramycin, Chromomycin and the Olivomycins are fluorochromes which preferentially
bind regions of DNA in GC-rich [35]. While the fluorochrome DAPI and Hoechst (33342 and
33258) were also specific DNA binds to AT-rich regions [36]. Therefore, the use of these dyes
can lead to many incorrect estimates of the values of DNA content, since it is not known in
advance the ratio of AT GC in species to be estimated the DNA content.

Recent Advances in Plant in vitro Culture 114
The propidium iodide has the lowest coefficient of variation obtained in using the
fluorochrome is most suitable for determining the amount of genomic DNA in plants [37,
38, 39]. However, other authors reported propidium iodide and ethidium bromide are not
dye specifically the DNA, they dye RNA too, but to not compromise the efficiency of the
determination of content DNA can be used RNase [40].
4. Care use of cytometry
Below are listed some precautions that should be taken during the use of flow cytometry:
1. Avoid filling the tank of saline to their maximum capacity. When a tank is filled with
pressurized fluid is forced toward the air hose preventing adequate pressurisation of
the enclosure.
2. When working with propidium iodide, should be placed approximately 400 ml of
hypochlorite in the sewage tank, which has a capacity of 4 liters, since the chlorine
inactive molecules iodide.
3. It should be cleaned daily after use of the cytometer, the following steps: with the
"RUN" button, install the probe tubes containing 3 ml of 0.5% hypochlorite, left to run
on HI for 1 minute with the arm 5 minutes to open and close the arm. Select the fluid
control "STNDBY." Remove the tube and insert another tube containing 1 ml rince facs
(which is a detergent that helps remove waste from dyes into the machine) and let it
run for 2 minutes in HI, with the arm closed. Select the button again fluid control
"STNDBY" Remove everything and place another tube containing 3 ml of distilled
water and let it run one minute with the open arm in HI and 5 minutes with the arm
closed. Select button "STANDBY" and then install a tube containing no more than 1 ml
of distilled water in the probe, because it always returns to the saline and the tube
makes the volume of the tube exceeds its maximum capacity if it has more than 1 ml of
distilled water, and this can affect equipment performance.
4. The tube should remain in distilled water to prevent probe salt deposits are formed in
the sample injection tube
5. It should be cleaned monthly. This procedure is performed on the entire fluid system and
once a month, or more often as needed. It should be removed from the reservoir
containing saline solution and then install a different container with 1-2 liters of 0.5%
sodium hypochlorite, flush for 30 minutes, while in the probe set 3 ml of hypochlorite
solution at the same concentration . After this period must be installed to another
container containing 1 to 2 liters of distilled water and left to run for 30 minutes, while the
probe install a tube containing 3 ml of distilled water at the same concentration. During
this procedure, iodide should never pass through the filter of saline, as you may damage
it, so the hose to the filter should be disconnected during this process. Following the
procedure returns the brine tank to the right place and connect the hose from the filter.
6. If the equipment becomes more than a week without being used, the salt tank must be
replaced by distilled water and left to run for about 10 minutes to remove any salt of the
capillary tubes of the equipment, because the salt form crystals which can clog the
entire system.

Flow Cytometry Applied in Tissue Culture 115
7. Never replace the air tube into the sample if the button "HI" is on, the tubes should
always be replaced with the "STNDBY" button and you must not allow the sample to be
sucked through the probe, thus preventing air from fluid system.
8. All bubbles are displayed in the hoses from the tank and filter salt must be removed
before the reading of the samples, because it makes the reading very slow. If you
suspect bubbles within the system must press the "PRIME", because it injects a blast of
air across the system and then complete with saline, removing bubbles. This procedure
should be repeated 5 times to really solve the problem.
9. Should perform preventive maintenance on a flow cytometer, once a year by
specialized professionals.
5. How to troubleshoot an analysis of flow cytometry
Paul Kron of Integrative Biology University of Guelph 10 list of solutions to problems have a
histogram of quality estimates DNA content trusted. These solutions are listed below and
have some adjustments based on the experiences gained at work in the Laboratory of Tissue
Culture UFLA.
5.1. Verify that the flow cytometer is running well and is configured correctly
A quality control test should be performed daily and periodic maintenance by a
technician from the manufacturer. These precautions ensure the proper functioning of the
device.
Verify that the parameters were set by someone who is qualified to do so. Depending on
the application we can use fluorescence intensity (height) or integrated fluorescence
(area), linear or logarithmic scale and is vital to know the parameter most suitable for
your dye.
5.2. Use good quality plant tissues
For most samples sheets are used, which should be healthy, young and cool. Sheet that
shows any sign of senescence should be avoided; leaf collected at the end of the growing
season often does not work. Avoid using wilted leaves.
For some species the leaves can be stored in refrigerator for 1 to 5 days after collection,
since it kept in sealed plastic bag with some moist cotton. Do not leave the sample in
direct contact with ice, or excessive moisture. It is also possible to store dried tissue,
making use of desiccants substances. More tests are needed in this area to define protocols
desiccation.
5.3. Use the appropriate tissue
If the swatch does not work, it is possible to test embryos, shoots, roots, flower petals, fruit
or other healthy tissue. However, for certain species may occur the endopolyploidy, i.e. the

Recent Advances in Plant in vitro Culture 116
degree of ploidy may vary between tissues, several peaks appearing in the histogram. In this
case must be used whenever the first peak to DNA content.
In case of use of seeds is necessary to attend the endosperm and embryo differ in ploidy,
and the seeds may be hybrids [41].
5.4. Use the correct buffer
The choice of buffer can have a huge impact on the quality of data. This choice can influence
the relative fluorescence, and the quality peak [11].
It is necessary to test not only buffers, but also the consistency of results. It is possible that a
buffer can lead to production of very clean samples with low CV, but in highly variable
repetition of the measures of fluorescence [42].
The pH of the buffer must be between pH 7-8.
5.5. Ajuste the quantity of tissue and / or excessive cutting the sample
Excess sample is cut on a common problem and can overload the buffer, reducing their
ability to maintain the correct pH range, dark coloration and large amounts of precipitation
are not good signs. Keep samples on ice during cutting may help. It is possible to improve
the quality of the sample cut by at least increase the amount of buffer, or by reducing the
amount of tissue in the sample.
It is important to worry about getting good quality at the peaks (low CV), not number of
cores. One should not impair the quality of the sample in search of "10.000 colors." This
approach is often misapplied, and is more usual in analyzes of cell cycle. The core guide
1300 is the best for many applications [42]. A clean sample of 500 events per peak will
probably tell you more than 10.000 events with peaks of large particles and high CV
histogram very jagged.
5.6. Adjust the conditions of time and coloration.
After 2 hours of sample preparation buffer, the cores may begin to degrade. Ideally, the
sample should be read in a short time after staining with 10 minutes to 2 hours, as the
extreme limits.
During the stages of sample preparation, staining and reading is essential to keep them on
ice and then the color should keep them in the dark, not to lose fluorescence until the
moment you put them on the cytometer.
5.7. Try centrifugation
An alternative to improve the quality of the histograms is cut into a sample buffer,
centrifuged (slow speed for 05-10 min), remove the supernatant and suspended again the
pellet in 0.5 ml buffer, then filter and staining. This can clean up some samples.

Flow Cytometry Applied in Tissue Culture 117
5.8. Try a different pattern
Histogram bad when you are on a second species such as an internal standard, there may be
interference between the two species of plants used (for example, by the effect of secondary
metabolites) [24].
5.9. Make a gate in their samples
Even when the peaks are small and there is debris (dirt), the peaks can be measured with
appropriate software making Gates. However, the removal of debris through the gate can
affect how the curve fitting software analyzes of the histograms. Moreover, by making a
very large suppression of scattering nuclei generates peak with a CV that both subjective
and possibly artificially low, so methods of gate should be clearly described in any
publication.
The samples with large amounts of debris over the cores must be considered suspect
because the debris may be interfering in the coloring. Gate histograms in such poor quality
must be made only when all other options fail.
Some other things to consider:
Some tissue types may require special approaches. For example, pollen cores can be
difficult to extract, as well as cutting methods and may be required for a review, see
[43].
Not all flow cytometers are equal. Some may produce better results than others,
depending on factors such as size of the nuclei. If you have the opportunity to try more
than one machine, the results can be enlightening.
6. Applications of plant flow cytometry
6.1. Tissue culture
Flow cytometry and microsatellite analyses were used to evaluate the trueness-to-type of
somatic embryogenesis-regenerated plants from six important Spanish grapevine (Vitis
vinifera L.) cultivars. Tetraploid plants were regenerated through somatic embryogenesis
from all of the cultivars tested with the exception of ‘Merenzao’. In addition, an octoploid
plant was obtained in the cv. ‘Albarin˜o’, and two mixoploids in ‘Torronte´s’. The most
probable origin of these ploidy variations is somaclonal variation. The cv. ‘Brancellao’
presented significantly more polyploids (28.57%) than any other cultivar, but it must be
noted that 50% of the adult field-grown ‘Brancellao’ mother plants analysed were
mixoploid. Hence, it is probable that these polyploids originated either from somaclonal
variation or by separation of genotypically different cell layers through somatic
embryogenesis. Microsatellite analysis of somatic embryogenesis-regenerated plants
showed true-totype varietal genotypes for all plants except six ‘Torronte´s’ plants, which
showed a mutant allele (231) instead of the normal one (237) at the locusVVMD5. There was

Recent Advances in Plant in vitro Culture 118
not a clear relationship between the occurrence of the observed mutant regenerated plants
and the callus induction media composition, the developmental stage of the inflorescences,
the type of explant used for starting the cultures or the type of germination (precocious in
differentiation medium or normal in germination medium) in any of the cultivars tested,
except ‘Torronte´s’ [44].
In addition, flow cytometry was used in breeding programmes to determine ploidy status
after colchicine treatment of banana plants.
In reference [45] objective was to assess the colchicine and amiprophos-methyl (APM)
concentration and exposure period in the chromosome duplication of banana plants
diploids. Banana stem tips were used from the following genotypes: breed diploids (1304-04
[Malaccensis x Madang (Musa acuminata spp. Banksii)] and 8694-15 [0337-02 (Calcutta x
Galeo) x SH32-63]). Colchicine was used at concentrations of 0 (control treatment), 1.25, 2.5
and 5.0 mM, while APM was used at 0 (control treatment), 40 and 80 μM, in solution under
agitation (20 rpm), for 24 and 48 h periods. With the use of APM, 66.67% tetraploid plants
were obtained in the 1304-04 genotype using 40 μM for 24 h and 18.18% in 80 μM for 48 h,
while in the 8694-15 genotype using 40 and 80 μM colchicine for 48 h, 27.27 and 21.43%
tetraploid plants were observed, respectively. For colchicine, in the 1304-04 genotype, only
the 1.25 mM treatment for 48 h presented 25% tetraploid plants and in the 8694-15 genotype,
the 5.0 mM concentration for 48 h produced 50% tetraploid plants. APM for 24 h enabled the
tetraploid plant of the 1304-04 genotype to be obtained, while colchicine for 48 h resulted in
tetraploid plants in the 8694-15 genotype.
Further, the efficiency of production of doubled haploid plants in canola (Brassica napus L.)
breeding programmes is reduced when large numbers of haploid and infertile plants
survive until flowering. Cytometry was used to assess ploidy status and predict subsequent
fertility of microspore-derived plantlets from three canola genotypes, with or without
colchicine treatment of microspore suspensions. Young leaf tissue was sampled from
microspore-derived plantlets within 1 week of transfer to soil, and processed immediately
by flow cytometry. The process was repeated on the same plants 3–5 weeks later. Of the 519
plants transferred to soil, 57.2% were consistently haploid at both sample times, 33.5% were
consistently diploid at both sample times, and the remainder (9.2%) were uncertain or
inconsistent in ploidy status across sampling times. Of the 518 plants that survived to
flowering, 32.4% were diploid at both times of sampling and fertile (set seed) and 46.3%
were haploid at both sampling times and infertile. Another 10.8% were haploid at both
sampling times and fertile, but had low pollen viability and seed set, and some were triploid
or of uncertain ploidy level. Colchicine treatment of microspore suspensions significantly
increased the proportion of diploid plants from 9.7 to 69.7%, with significant variation
among genotypes. Evidence from simple sequence repeat marker loci indicated that diploid
and fertile plants from the control treatment (no colchicine) were derived from
spontaneously doubled haploid gametes, rather than unreduced gametes or somatic tissue.
Flow cytometry at the first sample time was very efficient in detecting diploid plants of
which 94.2% were subsequently fertile [46].

Flow Cytometry Applied in Tissue Culture 119
We conducted a study of the cell cycle of coconut palm tissues cultured in vitro in order to
regulate regeneration. Cell nuclei were isolated from various types of coconut palm tissues
with and without in vitro culture. After the nuclei were stained with propidium iodide,
relative fluorescence intensity was estimated by flow cytometry. Characterization of the cell
cycle reinforced the hypothesis of a block in the G0/G1 and G1/S phases of the coconut cells.
A time-course study carried out on immature leaves revealed that this block takes place
gradually, following the introduction of the material in vitro. Synchronization of in vitro-
cultured leaves cells using 60 μM aphidicholin revealed an increase in the number of nuclei
in the S phase after 108 h of treatment. The significance of these results is discussed in
relation to the ability of coconut tissue cultured in vitro to divide [52].
6.2. Other applications
Cytometry can be used to assess the degree of polysomaty and endoreduplication [48],
reproduction pathways [49], and cell cycle [47]. In reference [50] detected mixoploidy
(variable amounts of DNA in tissue) and aneuploidy (variations in a small number of
chromosomes) by flow cytometry [51].
Several protocols for measuring DNA have been developed, including bivariate analysis
related to cytokeratin/DNA analysis/DNA analysis of BrdU and a synthetic nucleoside
similar to thymine. These protocols are used to study the cell cycle and to obtain
multiparametric measurements of cellular DNA content; they were developed in tandem
with commercial software for analyzing the cell cycle [47].
7. Final considerations
Although flow cytometry significantly impacts several fields of plant research, various
methodological challenges must be overcome before its potential can be fully realized.
The research group in UFLA’s Department of Agriculture consistently attempts to use
methodologies for analyzing nuclear DNA content in plants, which removes some technical
constraints. We emphasize the importance of research, particularly in disseminating
knowledge on best practices, such as standardization type, fluorochrome selection, data
presentation, and quality outcome measures.
Author details
Moacir Pasqual, Leila Aparecida Salles Pio,
Ana Catarina Lima Oliveira and Joyce Dória Rodrigues Soares
Federal University of Lavras (UFLA), Department of Agriculture, Lavras, MG, Brazil
8. References
[1] Gucker FT. et al. photoelectric counter for colloidal particles. Am. J. Chem. 69:2422–
2431. 1947.

Recent Advances in Plant in vitro Culture 120
[2] Shapiro HM. The Evolution of Cytometers. Cytometry Part A, v.58A, p.13–20. 2004.
[3] Campos JMS. Obtenção de híbridos hexaplóides e análise genômica de Pennisetum sp.
por citometria de fluxo. 115p. PhD thesis. Federal University of Lavras. 2007.
[4] Doležel J. Applications of flow cytometry for the study of plant genomes. Journal of
Applied Genetics, v.38, p.285–302. 1997.
[5] Galbraith DW et al. Rapid flow cytometric analysis of the cell cycle in intact plant
tissues. Science, v.220, p.1049–1051. 1983.
[6] Loureiro JCM et al. Comparison of four nuclear isolation buffers for plant DNA flow
cytometry. Annals of Botany 2006b; 98 679–689.
[7] Doležel J. Flowcytometric analysis of nuclear DNA content in higher plants.
Hytochemical Analysis 1991; 2(4) 143-154.
[8] Robinson JP. Introduction to flow cytometry. Flow cytometry talks. USA: Purdue
University Cytometry Laboratory. http://www.cyto.purdue.edu/flowcyt/
educate/pptslide.html. 2006 (accessed 26 Juny 2011).
[9] Galbraith DW et al. Rapid flow cytometric analysis of the cell cycle in intact plant
tissues. Science 1993; 220 1049–1051.
[10] Ochatt SJ. Flow Cytometry in Plant Breeding. Cytometry Part A 2008; 73 581-598.
[11] Loureiro J et al. Two new nuclear isolation buffers for plant DNA flow cytometry: a test
with 37 species. Annals of Botany; 2007 100 875–888.
[12] Timbó ALO. Determinação de protocolo para duplicação cromossômica e identificação
do nível de ploidia utilizando citometria de fluxo em Brachiaria spp. PhD thesis.
Federal University of Lavras; 2010.
[13] Loureiro JCM, Santos C. Aplicação da citometria de fluxo ao estudo do genoma vegetal.
Boletim de Biotecnologia 2004; 77 18-29.
[14] Wan Y et al. Ploidy levels of plants regenerated from mixed ploidy maize callus
cultures. In Vitro Cellular and Developmental Biology 1992; 28(2) 87-89.
[15] Galbraith DW, Harkins KR, Maddox JM, Ayres NM, Sharma DP, Firoozabady E: Rapid
flow cytometric analysis of the cell cycle in intact plant tissues. Science 1983; 4601(220)
1049-1051.
[16] Doležel J, Binarová P, Lucretti S. Analysis of nuclear DNA content in plant cells by flow
cytometry. Biologia Plantarum 1989; 31 113–120.
[17] Otto FJ: DAPI staining of fixed cells for high-resolution flow cytometry of nuclear DNA
in methods in cell biology. In Methods in cell biology. Edited by Crissman HA,
Darzynkiewicz Z . New York: Academic Press,1990;105-110.
[18] Doležel J, Gohde W. Sex determination in dioecious plants Melandrium album and M.
rubrum using high-resolution flow cytometry. Cytometry 1995; 19 103–106.
[19] Pfosser, M. et al. Evaluation of sensitivity of flow cytometry in detecting aneuploidy in
wheat using disomic and ditelosomic wheat-rye addition lines. Cytometry 1995; 21(4)
387-393.
[20] Marie D, Brown SC. A cytometric exercise in plant DNA histograms, with 2c values for
seventy species. Biology of the Cell 1993; 78:41-51.
[21] Doležel J, Bartos J. Plant DNA flow cytometry and estimation of nuclear genome size.
Annals of Botany 2005; 95(1) 99-110.

Flow Cytometry Applied in Tissue Culture 121
[22] Noirot M. et al. Nucleus– cytosol interactions—A source of stoichiometric error in flow
cytometric estimation of nuclear DNA content in plants. Annals of Botany 2000; 86 309–
316.
[23] Pinto G et al. Analysis of the genetic stability of Eucalyptus globulus Labill. somatic
embryos by flow cytometry. Theoretical and Applied Genetics 2004; 109 580–587.
[24] Loureiro JCM et al. Flow cytometric and microscopic analysis of the effect of tannic acid
on plant nuclei and estimation of DNA content. Annals of Botany 2006a; 98 515–527.
[25] Walker D, Monino I, Correal E; Genome size in Bituminaria bituminosa (L.) C.H. Stirton
(Fabaceae) populations: separation of ‘true’ differences from environmental effects on
DNA determination. Environmental and Experimental Botany 2006; 55 258–265.
[26] Doležel J, Greilhuber J. Nuclear Genome Size: Are We Getting Closer? Cytometry Part
A 2010; 77 635-642.
[27] Price HJ, Hodnett G, Johnston JS. Sunflower (Helianthus annuus) leaves contain
compounds that reduce nuclear propidium iodide fluorescence. Annals of Botany 2000;
86 929–934.
[28] Gregory TR. Animal genome size database. http://www.genomesize.com. (accessed 18
December 2009).
[29] Bennett MD, Leitch IJ. Plant DNA C-values database (release 4.0, October 2005).
http://data.kew.org/cvalues/. (accessed 02 July 2011).
[30] Doležel J. et al.. Plant genome size estimation by flow cytometry: Inter-laboratory
comparison. Annals of Botany 1998; 82 17-26.
[31] Doležel J, Sgorbati S, Lucretti S. Comparison of three DNA fluorochromes for flow
cytometric estimation of nuclear DNA content in plants. Physiologia Plantarum 1992; 85
625–631.
[32] Doležel J, Binarová P, Lucretti S. Analysis of nuclear DNA content in plant cells by flow
cytometry. Biologia Plantarum 1989; 31(2) 113-120.
[33] Doležel J, Sgorbati S, Lucretti S. Comparison of three DNA fluorochromes for flow
cytometric estimation of nuclear DNA content in plants. Physiologia Plantarum, 1992;
85(4) 625-631
[34] Buitendijk JH, Boon EJ, Ramanna MS. Nuclear DNA content in twelve species of
Alstroemeria L. and some of their hybrids. Annals of Botany 1997; 79 343-353.
[35] Van Dyke WW, Dervan PB. Chromomycin, mithramycin and olivomycin binding sites
on heterogeneous deoxyribonucleic acid. Footprinting with (methidiumpropyl-
EDTA)iron(II). Biochemistry 1983; 22 2373–2377.
[36] Portugal J, Waring M. Assignment of DNA binding sites for dapi and bisbenzimide
(hoeschst 33258). Comparative footprinting study. Biochimea Biophysica Acta 1988; 949
158-168.
[37] Michaelson MJ, Price HJ, Ellison JR, Johnston JS. Comparison of plant DNA contents
determined by Feulgen Microspectrophotometry and Laser Flow Cytometry. American
Journal of Botany 1991; 78 183-188.
[38] Yanpaisan W, King NJ, Doran PM. Flow cytometry of plant cells with applications in
large-scale bioprocessing. Biotechnology Advanced 1999; 17 23–27.

Recent Advances in Plant in vitro Culture 122
[39] Johnston JS. et al. Reference standards for determination of DNA content of plant
nuclei. American Journal of Botany 1999; 86 609–613.
[40] Price HJ, Johnston JS. Influence of light on DNA content of Helinathus annuus Linnaeus.
Proceedings of the National Academy of Sciences of the USA 1996; 93 11264-11267.
[41] Sliwinska E, Zielinska E, Jedrzejczyk I. Are seeds suitable for flow cytometric estimation
of plant genome size? Cytometry Part A 2005; 64 72–79.
[42] Greilhuber J, Temsch E, Loureiro J. Nuclear DNA content measurement. Edited by
Doležel J, J Greilhuber J, Suda J, Flow Cytometry with Plant Cells: Analysis of Genes,
Chromosomes and Genomes. Weinheim: Wiley-VCH, 2007; 67-101.
[43] Suda J, Kron P, Husband BC, Trávnícek P. Flow cytometry and ploidy: applications in
plant systematics, ecology and evolutionary biology. Edited by Doležel J, J Greilhuber J,
Suda J, Flow Cytometry with Plant Cells: Analysis of Genes, Chromosomes and
Genomes. Weinheim: Wiley-VCH, 2007; 67-101.
[44] Prado MJ, Rodriguez E, Rey L, Gonzalez MV, Santos C, Rey M. Detection of somaclonal
variants in somatic embryogenesis regenerated plants of Vitis vinifera by flow cytometry
and microsatellite markers. Plant Cell Tissue and Organ Culture 2010; 103 49–59.
[45] Rodrigues FA, Soares JDR, Santos RRS, Pasqual M, Silva SOS. Colchicine and
amiprophos-methyl (APM) in polyploidy induction in banana plant. African Journal of
Biotechnology 2011; 10(62) 13476-13481.
[46] Takahita J, Cousin JA, Nelson MN, Cowling WA. Improvement in efficiency of
microspore culture to produce doubled haploid canola (Brassica napus L.) by flow
cytometry. Plant Cell Tissue and Organ Culture 2011; 104 51–59.
[47] Sandoval A, Hocker V, Verdeil JL. Flow cytometric analysis of the cell cycle in different
coconut palm (Cocos nucifera L.) tissues cultured in vitro. Plant Cell Reports 2003; 22
25–31.
[48] Barow M, Meister A. Lack of correlation between AT frequency and genome size in
higher plants and the effect of nonrandomness of base sequences on dye binding.
Cytometry 2003; 47 1–7.
[49] Matzk F, Meister A, Schubert I. An efficient screen for reproductive pathways using
mature seeds of monocot and dicots. The Plant Journal 2000; 21 97–108.
[50] Doležel J. Applications of flow cytometry for the study of plant genomes. Journal of
Applied Genetics 1997, 38 285–302.
[51] Roux N. et al. Rapid detection of aneuploidy in Musa using flow cytometry. Plant Cell
Reports 2003; 21 483–490.
[52] Nunez R. DNA Measurement and Cell Cycle Analysis by Flow Cytometry. Current
Issues in Molecular Biology 2001; 3(3) 67-70.