Embed Size (px)
Citation preview
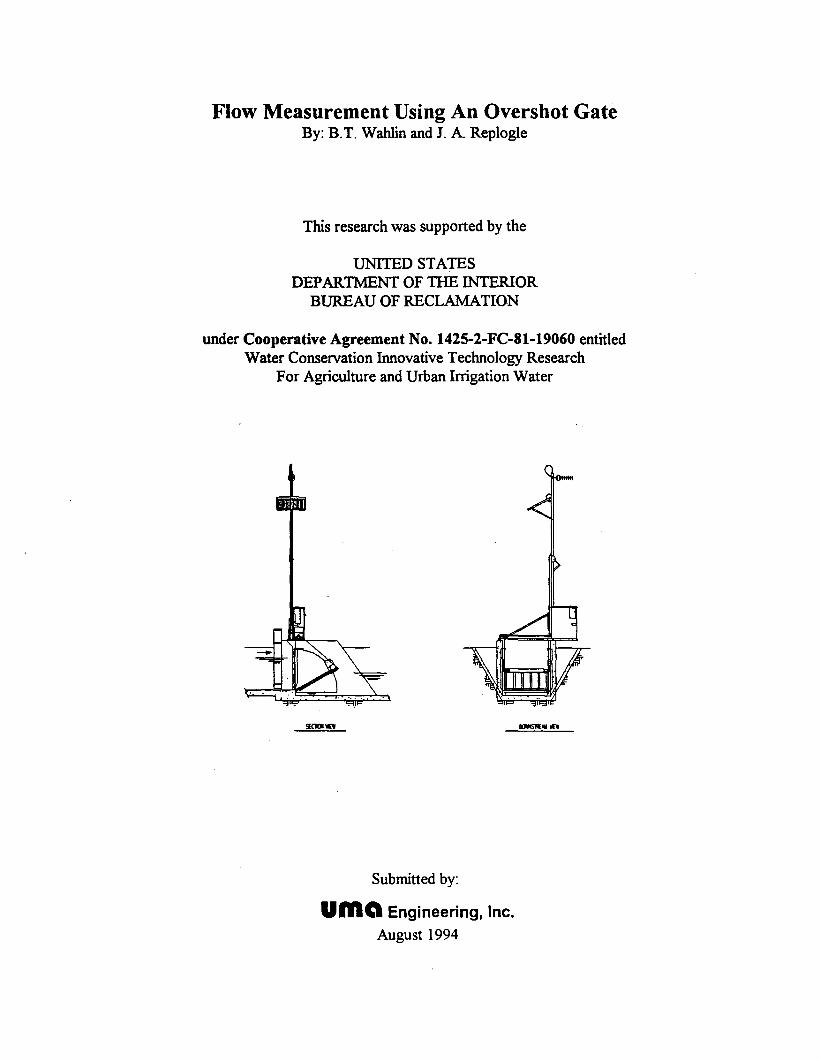
Flow Measurement Using An Overshot Gate By: B.T. Wahlin and J. A. Replogle
This research was supported by the
UNITED STATES DEPARTMENT OF THE INTERIOR
BUREAU OF RECLAMATION
under Cooperative Agreement No. 1425-2-FC-81-19060 entitled Water Conservation Innovative Technology Research
For Agriculture and Urban Irrigation Water
intormetion ia eatimeted to averaae 1 hour per raeponae, including the time tor r~viewing gathering end maintaining the date needed, and completing end reviewing the collection of
a u*n atimete a , other -et ot a coketion of intametion, inc~uding -om f a mdming Servim, Direetaate t a Intormetion Opmretiom md FiepbDom. 1216 Jettomon Devb Hbhw.y. Suit 1204,
d Bdwt . Paowwork Reducton hoon l070401881. Wnhinaton DC 20603. . . 2. REPORT DATE 3. REPORT TYPE AND DATES COVERED
August 1994 6. TITLE AND SUBTITLE
Flow Measurement Using an Overshot Gate 6. FUNDING NUMBERS
8. AUTHORtS)
B. T. Wahlin and J. A. Replogle
7. PERFORMING ORGANIZATION NAME(S) AND ADDRESS(ES)
UMA Engineering, Inc. I 8. PERFORMING ORGANIZATION REPORT NUMBER
8 . SPONSORING/MONITORING AGENCY NAME(S) AND ADDRESStES)
United States Department of the Interior Bureau of Recl amat i on PO Box 25007, D-8560 Denver CO 80225-0007
10. SPONSORINGIMONITORING AGENCY REPORT NUMBER
11. SUPPLEMENTARY NOTES
Research performed under Cooperative Agreement No. 1425-2-FC-81-19060 entitled Water Conservation Innovative Technology Research for Agriculture and Urban Irrigation Water.
1 2a. DISTRIBUTION/AVAILABlLlTY STATEMENT 12b. DISTRIBUTION CODE
I
13. ABSTRACT /Murh,un 200 words)
Overshot gates, or leaf gates as they are sometimes called, are becoming increasingly popular for control1 ing water levels in open canals. This popularity is partly due to the ability of the gates to handle flow surges with limited depth changes and the ease with which operators can understand the hydraulic behavior of the gates. While water level control is useful, operators a1 so need to know the flow rate at each gate to better operate the system. While existing theories provide some background for the overshot gate hydraulics, this study focused on information specific to inclined weirs. Equations derived from this study can be used to accurately determine flow rate in the field of a properly ventilated free-flow leaf gate to within 6.4 percent. Additional equations are provided to predict the discharge of a submerged overshot gate with an accuracy of roughly 10 percent.
14. SUBJECT TERMS 1 16. NUMBER OF PAGES
water measurement/canals/gates/laboratory testslfield tests/accuracy/free fl ow/submerged fl ow/di scharge coefficients 16. PRICE CODE +
NSN 7640-01 -280-6600 Standard From 208 (Rev. 2-80) R & M b ANSl Sd. m-111 298-102
20. LIMITATION OF ABSTRACT
10. SECURITY CLASSlFlCATION OF ABSTRACT
I 7. SECURITY CLASSIFICATION
OF REPORT
18. SECURITY CLASWFICATION OF THIS PAGE
Abstract:
Recently, overshot gates, or leaf gates as they are sometimes called, are becoming increasingly popular for controlling water levels in open channels. This popularity is partly due to the ability ofthe gates to handle flow surges with limited depth changes and the ease with which operators can understand the hydraulic behavior ofthe gates. With an overshot gate a 10- drop in gate height corresponds closely to a lO-cm drop in upstream water level. While water level control is useful, operators also need to know the flow rate at each gate to better operate the system. At high gate angles, the overshot gate appears to resemble a dupcmkd weir while at low gate angles it looks as if it might behave more like a free overfall.
While existing theories provide some background for the overshot gate hydraulics, this study focused on information specific to inclined wcirs. The theoretical evaluation was tested against hydraulic lab modeling and field investigations. Equations derived can be used to accurately determine the flow rate in the field of a properly ventilated free-flow leaf gate to within approximately 6.4% with a standard deviation of around 3.2%. These equations are valid for values of hllp less than 1.0 and for gate angles between 16.2O and 63.4O. Additional equations can be used to predict the discharge of a submerged overshot gate with an accuracy of roughly 10%.
List of Key Words:
water mta~umntntl canald gat& laboratory tests/ field tests/ accuracy1 free flowl submerged flowl discbarge coefficients

Flow Measurement Using An Overshot GateBy: B.T. Wahlin and J. A Replogle
TECHNICAL SUMMARY
Recently, overshot gates, or leaf gates as they are sometimes called, are becoming increasingly popular forcontrolling water levels in open channels. This popularity is partly due to the ability of the gates to handle flowsurges with limited depth changes and the ease with which operators can understand the hydraulic behavior of thegates.
The main purpose of most control gates is to maintain a constant water depth upstream so that orifice-basedofi\akes, usually located just upstream of the gates, will deliver water at a near-constant rate regardless of the flowrate in the main canal. The control gates themselves can either be orifice-based gates, such as sluice or radialgates, or weir-type gates. Generally, weirs are able to control water surfaces more closely than orifice gates becausethe water level upstream varies with the three-halves power of the head over the weir. Overshot gates are alsomore intuitive to operate because a lO-cm drop in gate height corresponds closely to a lO-cm drop in upstreamwater level.
While water level control is useful, operators also need to know the flow rate at each gate to better operate thesystem. At high gate angles, the overshot gate appears to resemble a sl1arp-crested weir while at low gate angles itlooks as if it might behave more like a free overfall.
Kindsvater and Carter (1959) presented a form of the discharge equation for either a fully or partially contractedsbarp-crested vertical weir. They considered the effect of the viscous and surface tension forces and introduced aneffective discharge coefficient, C.. The viscous and surface tension forces were accounted for by modifying thewidth of the weir and the head approaching the weir. The final form ofKindsvater and Carter's discharge equationis as follows:
Q = C :J...J2 g b hl.5. 3 . . [A]
where C. = effective discharge coefficient;g =gravitational acceleration (9.81 m/s2);
b. =effectivewidth of the weir; andh. = effective head on the weir.
The effective width of the weir is expressed in terms of an empirical constant, K", that depends on the ratio biB 1
(where be = width of the overshot gate and B 1=width of approach channel) as follows:
b. = be + K" [B]
In a similar way, the effective head can be expressed in terms of another empirical constant, K", as follows:
h. = h. + K" [C]
Kindsvater and Carter (1959) showed that the effective discharge coefficient varies linearly with biB, and h,lponly (wherep = height of weir from channel bottom to crest). The value of C. is assumed to be of the form:
1
C =m!!J.+b. p[D]
where m and b =empirical constants.
The overfall edge of a leaf gate is in an area of no side contraction; therefore, the effective discharge coefficient canbe calculated assuming no side contractions of the weir. Thus, Kindsvater and Carter (1959) use m =0.075 and b= 0.602 to calculate the effective discharge coefficient. Because it was assumed that there was no effects due toside contractions, a value of -0.001 m (-0.003 ft) can be assigned to Kb. Kindsvater and Carter (1959) alsorecommend that a constant value of 0.001 m (0.003 ft) be assigned to K" regardless of the flow rate or gate height.
It was found that Kindsvater and Carter's discharge equation for sharp~rested weirs will also apply to overshotgates if an appropriate value of C. is accurately determined with respect to the gate angle. Equation A was used tocalculate the discharge over a leaf gate by modifying it with another discharge coefficient as follows:
Q = CaC. t.J2i b.h~.5 [E]
where C"=correction factor for angle of the gate; and.
C. =effective discharge coefficient for a vertical weir.
An empirical expression for C" was determined from laboratory tests. For values of h1lp less than 1.0 and for gateangles between 16.2° and 63.4°, C" can be described as follows:
Ca = 1.0333 + 0.0038488 - 0.00004582 [F]
where 8 = gate angle in degrees.
When the overshot gate is operating under submerged conditions, Kindsvater and Carter's discharge coefficient isfurther modified as follows:
Q = C~aC. t.J2i b.h~.5 [G]
where CtIf=a drowned flow reduction factor.
Villemonte (1947) proposed the following form of CtIf:
[ (h
)
1.5
]
"C df =A 1-
h:[H]
where hI =upstream measured head;h2 = downstream measured head; andA and n = empirical coefficients.
The following empirical equations can be used to describe A and n if the value of h]lp is less than 1.0, the gateangle is between 16.2° and 63.4°, and the submergence ratio is less than 0.90:
A = -0.00138 + 1.0663A = 1.0
for ()< 60°for ()> 60°
[I]
2
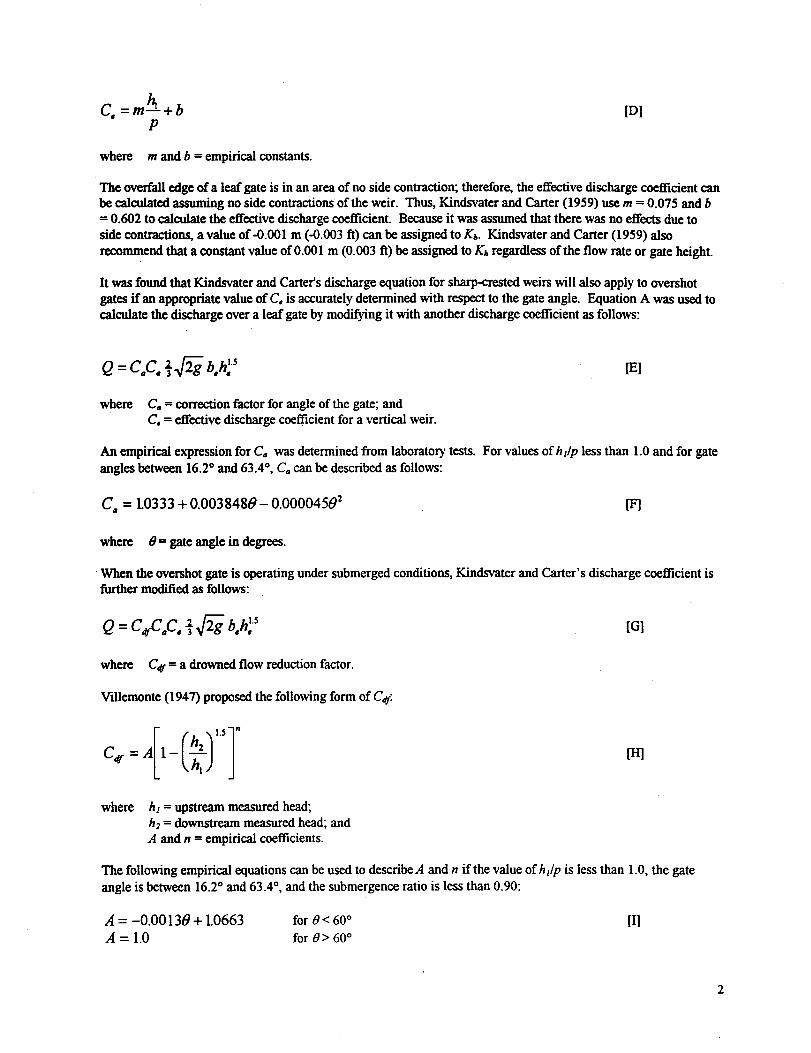
1.0 2.50.25 501 5050.50 1,456 1,444e 0.75 2,751 2,663-... 1.00 4,354 4,14701::1.25 5,863
1.50 7,796
n = 0.1525 + 0.006077 (}- 0.000045(}2 [1]
where () = gate angle in degrees.
From laboratory and field stUdies, it is believed that Equations E and F will provide field measurement accuracy of6.4% for typical field installations. We have insufficient field verification to judge the accuracy of submergedovershot gates. At this time, the accuracy of the submerged gates is roughly estimated to be 10%. This accuracyestimation does not include errors associated with head measurement. Errors in head measurement will be muchgreater under submerged conditions than under free-flow conditions, particularly due to the difficulty of makingdownstream head measurements.
TECHNICAL EXAMPLE
As an example, consider a leaf gate in the field that is 2 m wide, 3 m long, and is mounted on a 7.5 cm squarechannel. To determine the discharge, the head on the gate, hI, and the height of the crest above the channelbottom, p, must be determined. Because the value of CQand C. change very slowly with gate angle and hIIp, it ismore important to determine hI accurately thanp. To continue the example, assume that hI = 1.00 m andp = 2.00m. These two values yield an hllp of 0.50. The gate angle can then be calculated using the following equation:
(} = arCSin(p
~t) [K]
where ()= gate angle in degrees;p = height of gate crest above the channel bottom (2.00 m);t = height of square channel that the overshot gate is mounted on (0.075 m); andL = length of the overshot gate blade in the direction of flow (3 m).
Using Equation K, the gate angle is found to be equal to 39.9°. Because h/p is less than 1.0 and the gate angle isbetween 16.2° and 63.4°, Equation F can be used to determine that CQ= 1.115. Using Equation D, the C. can befound to equal 0.640. Finally, Equation E can be used to determine that the discharge is 4,216 Us. Table A is asample rating table for this example under free-flow conditions for various values of hI and p.
Next, consider the same gate operating under submerged conditions. Assume that hI and p are the same for thefree-flow case and that the downstream head, h2, is 0.30 m. Using these values, the submergence ratio (hihI) is0.30. Because hllp is less than 1.0, the submergence ratio is less than 0.90, and the gate angle is between 16.2°and 63.4°, Equations I and J can be used to estimate that A = 1.014 and n = 0.323. Using Equation H, thedrowned flow reduction factor can be found equal to 0.957, and the new discharge would therefore be 4,036 Us.
Table A: Discharge in Us of example free-flow overshot gate for a various values of hI andp.
3

Flow Measurement Using An Overshot GateBy: B.T. Wahlin and J. A. Replogle
This research was supported by the
UNITED STATESDEPARTMENT OF THE INTERIOR
BUREAU OF RECLAMATION
under Cooperative Agreement No. 1425-2-FC-81-19060 entitledWater Conservation Innovative Technology Research
For Agriculture and Urban Irrigation Water
S£CIOI >1('1 _11110
Submitted by:
uma Engineering, Inc.August 1994
ACKNOWLEDGEMENTS
This research was undertaken by a joint effort ofUMA Engineering and AgriculturalReserach Service (ARS), U.S. Water Conservation Lab in Phoenix. B.T. Wahlin and J.AReplogle completed alilaboatory research and were assisted in the field verification byDavid Bradshaw ofUMA Engineering. The efforts were coordinated and reviewed byAlbert 1. Clemmens, Research Leader (ARS) and John H Korinetz, Project Manager(UMA).
The Contracting Officer's Technical Representativie's were Danny L. King and Philip HBurgi. In addition to finiancial support the USBR also provided technical review, BrentMefford participated in technical review of the research.
Armtec Water Control Products provided a manual overshot gate for the laboratoryresearch.
The Imperial Irrigation District (lID) extended their cooperation to make the field testingpossible. Dave Merkley, John Van Bebber and the Holtville divison staff, provided liasonwith the irrrigators and provided district cooperation to the research.
NOTATIONS
"This manuscript is submitted for publication with theunderstanding that the United States Government is authorized to
reproduce and distribute reprints for governmental purposes."
"The views and conclusions contained in this document are thoseof the authors and should not be interpreted as necessarily
representing the offical policies. either express or implied, ofthe U.S. Government."
The United States Government does not endorse products or manufacturers. Trade or manufacturer'snames appear herein only because they are considered essential to the object of this document.

CONTENTS
Page
Introduction 1
Background Theory 2
Laboratory Tests 8
Results 11
Discussion of Results 18
Conclusions 24
Appendicies
Appendix I. - References
Appendix ll. - Glossary
Appendix ill. - Data for Free-overfall Anntec overshot gate
Appendix N. - Data for Free-overfall Anntec overshot gate w/side contractions
Appendix V. - Data for Submerged Anntec overshot gate
Appendix VI. - Data for Submerged Anntec overshot gate w/side contractions
Appendix VIT.-Data for Free-overfall USWCL overshot gate
Appendix Vill. - Data for Bazin's experiments on inclined weirs
Appendix IX. - Data for USBR's experiments on inclined weirs
Appendix X. - Data for Field experiments on tree-overfall inclined weirs

INTRODUCTION
Recently, overshot gates, or dropleaf gates as they are sometimes called; have become increasingly popularfor controlling water levels in open channels. This popularity is partly due to the ability of the gates tohandle flow surges with limited depth changes and the ease with which operators can understand thehydraulic behavior of the gates.
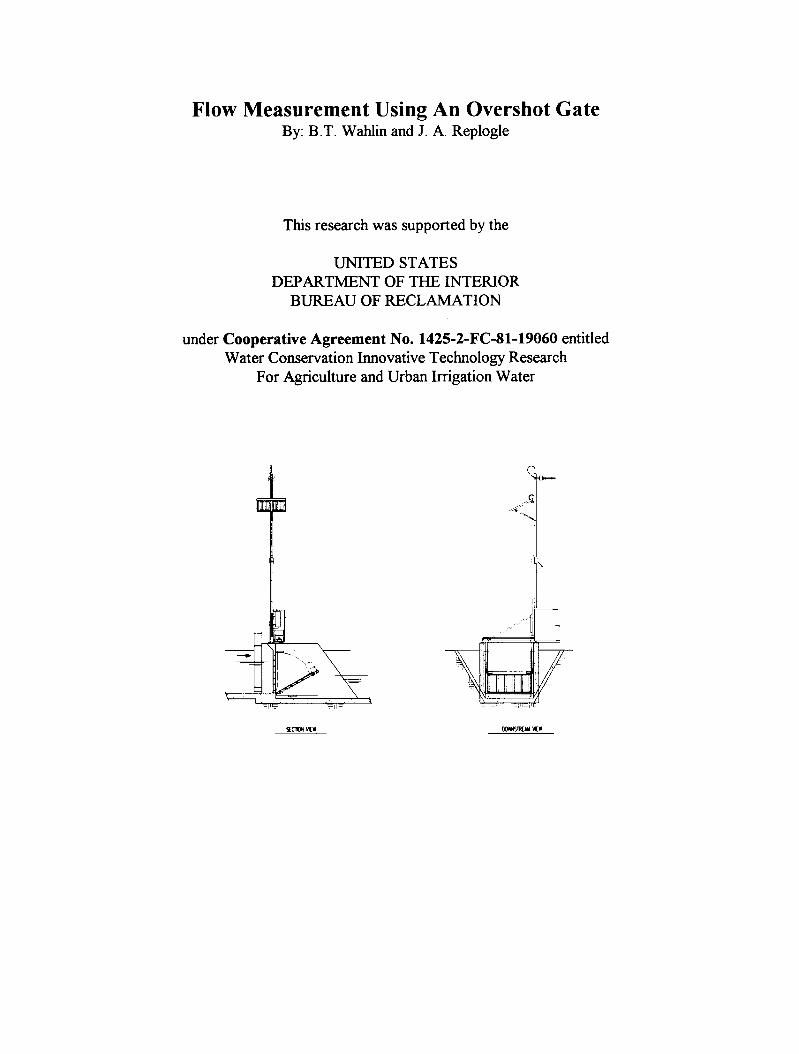
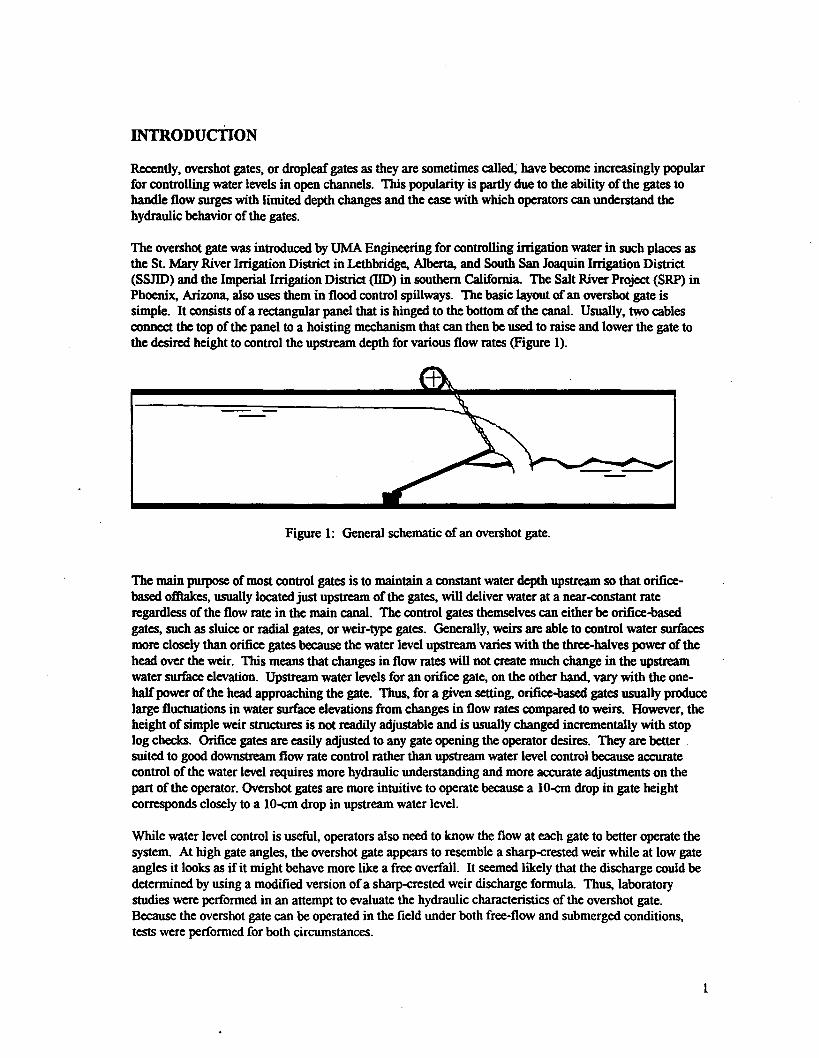
The overshot gate was introduced by UMA Engineering for controlling irrigation water in such places asthe St Mary River Irrigation District in Lethbridge, Alberta, and South San Joaquin Irrigation District(SSJID) and the Imperial Irrigation District (lID) in southern California. The Salt River Project (SRP) inPhoenix, Arizona. also uses them in flood control spillways. The basic layout of an overshot gate issimple. It consists of a rectangular panel that is hinged to the bottom of the canal. Usually, two cablesconnect the top of the panel to a hoisting mechanism that can then be used to raise and lower the gate tothe desired height to control the upstream depth for various flow rates (Figure 1).
Figure 1: General schematic of an overshot gate.
The main purpose of most control gates is to maintain a constant water depth upstream so that orifice-based offiakes, usually located just upstream of the gates, will deliver water at a near-constant rateregardless of the flow rate in the main canal. The control gates themselves can either be orifice-basedgates, such as sluice or radial gates, or weir-type gates. Generally, weirs are able to control water surfacesmore closely than orifice gates because the water level upstream varies with the three-halves power of thehead over the weir. This means that changes in flow rates will not create much change in the upstreamwater surface elevation. Upstream water levels for an orifice gate, on the other hand, vary with the one-half power of the head approaching the gate. Thus, for a given setting, orifice-based gates usually producelarge fluctuations in water surface elevations from changes in flow rates compared to weirs. However, theheight of simple weir structures is not readily adjustable and is usually changed incrementally with stoplog checks. Orifice gates are easily adjusted to any gate opening the operator desires. They are better.suited to good downstream flow rate control rather than upstream water level control because accuratecontrol of the water level requires more hydraulic understanding and more accurate adjustments on thepart of the operator. Overshot gates are more intuitive to operate because a 10-cm drop in gate heightcorresponds closely to a 10-cm drop in upstream water level.
While water level control is useful, operators also need to know the flow at each gate to better operate thesystem. At high gate angles, the overshot gate appears to resemble a sharp-crested weir while at low gateangles it looks as if it might behave more like a free overfall. It seemed likely that the discharge could bedetermined by using a modified version of a sharp-crested weir discharge formula. Thus, laboratorystudies were performed in an attempt to evaluate the hydraulic characteristics of the overshot gate.Because the overshot gate can be operated in the field under both free-flow and submerged conditions,tests were performed for both circumstances.
1
BACKGROUND THEORY
Free-Flow Weirs
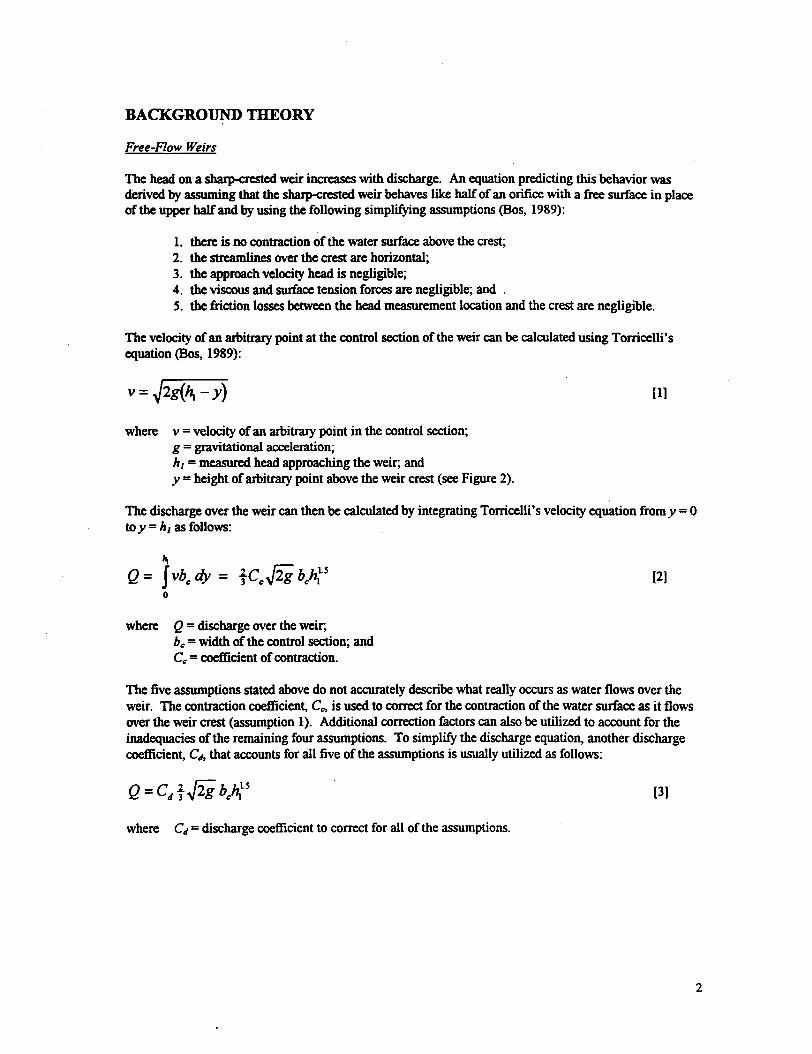
The head on a shaqH::rested weir increases with discharge. An equation predicting this behavior wasderived by assuming that the sharp-<:rested weir behaves like half of an orifice with a free surface in placeof the upper half and by using the following simplifying assumptions (Bos, 1989):
1. there is no contraction of the water surface above the crest;2. the streamlines over the crest are horizontal;3. the approach velocity head is negligible;4. the viscousand surfacetension forces are negligible;and .S. the friction losses between the head measurement location and the crest are negligible.
The velocity of an aIbitrary point at the control section of the weir can be calculated using Torricelli'sequation (Bos, 1989):
v =~2g(~ - y) [1]
where v =velocity of an aIbitrary point in the control section;g = gravitational acceleration;
hI = measured head approaching the weir, andy = height of aIbitrary point above the weir crest ' (see Figure 2).
The discharge over the weir can then be calculated by integrating Torricelli's velocity equation fromy =0to Y =hI as follows:
lit
Q = Jvbe dy = tceJ2i be~'S0
[2J
where Q = discharge over the weir,be = width of the control section; andCe = coefficient of contraction.
The five assumptions stated above do not accurately describe what really occurs as water flows over theweir. The contraction coefficient, Cc;,is used to correct for the contraction of the water surface as it flowsover the weir crest (assumption 1). Additional correction factors can also be utilized to account for theinadequacies of the remaining four assumptions. To simplify the discharge equation, another dischargecoefficient, Cd, that accounts for all five of the assumptions is usually utilized as follows:
Q = Cd tJ2i be~1.S [3J
where Cd=discharge coefficient to correct for all of the assumptions.
2
hI
. . . . .. !..t...
p
Figure 2: Definition of terms for a s~ed weir.
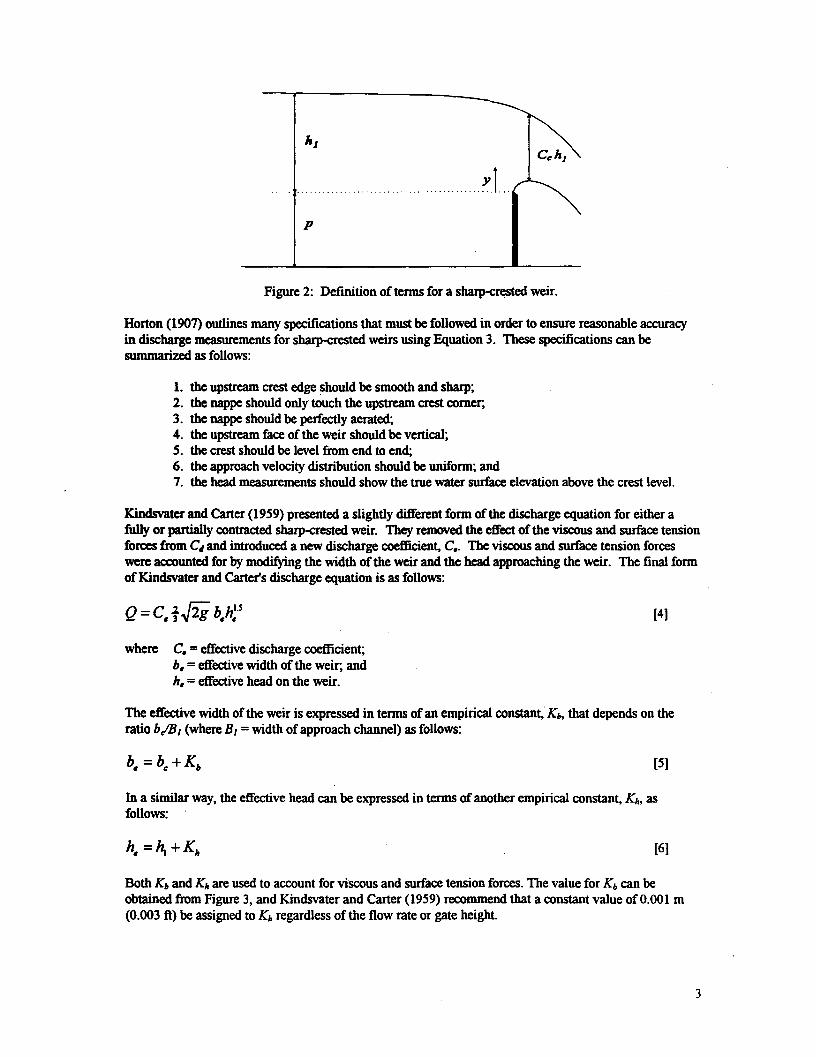
Horton (1907) outlines many specifications that must be followed in order to ensure reasonable accuracyin discharge measurements for sharp-crested weirs using Equation 3. These specifications can besununarized as follows:
1. the upstream crest edge should be smooth and sharp;2. the nappe should only touch the upstream crest comer,3. the nappe should be perfectly aerated;4. the upstream face of the weir should be vertical;5. the crest should be level from end to end;6. the approach velocity distribution should be uniform; and7. the head measurements should show the true water surface elevation above the crest level.
Kindsvater and Carter (1959) presented a slightly different form of the discharge equation for either afully or partially contracted s~ed weir. They removed the effect of the viscous and surface tensionforces from Cd and introduced a new discharge coefficient, C.. The viscous and surface tension forceswere accounted for by modifying the width of the weir and the head approaching the weir. The final formof Kindsvater and Carter's discharge equation is as follows:
Q = C. t.J2g b.h~.s [4]
where C. = effective discharge coefficient;b. = effective width of the weir, andh. = effective head on the weir.
The effective width of the weir is expressed in terms of an empirical constant, K", that depends on theratio bIBl (whereBl =width of approach channel) as follows:
b. = be + Kb [5]
In a similar way, the effective head can be expressed in terms of another empirical constant, Kit, asfollows: .
h. =~ +KII [6]
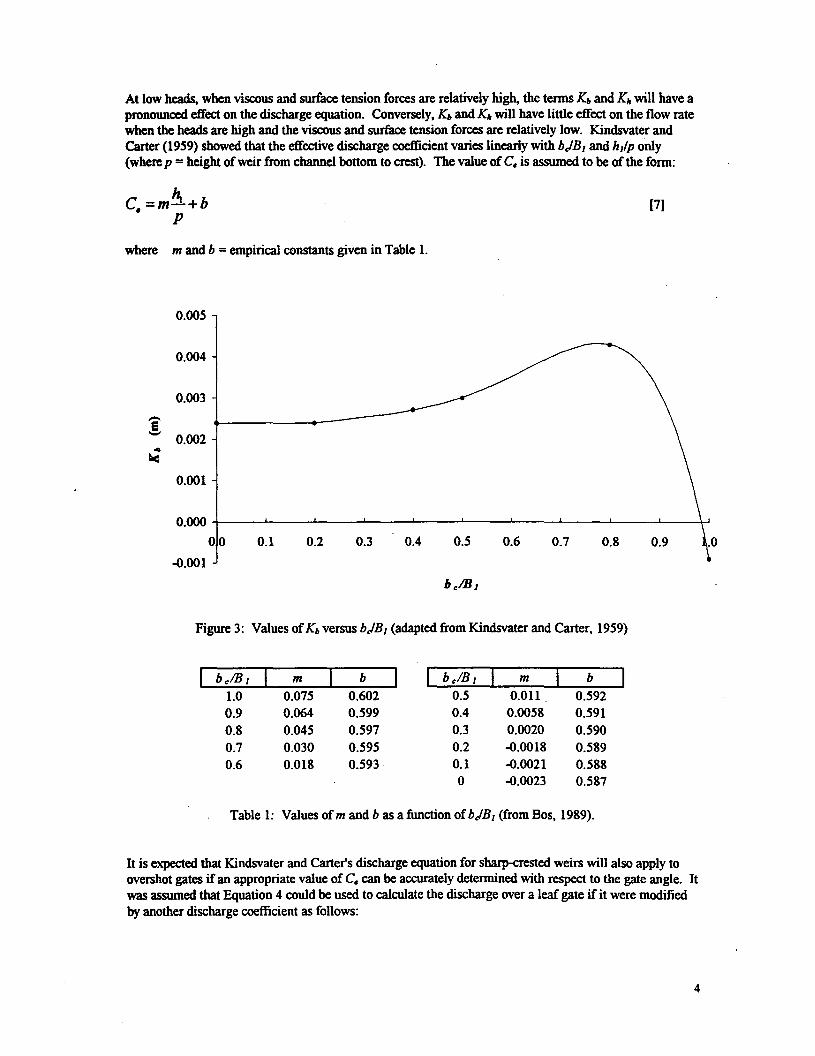
Both Kb and Kitare used to account for viscous and surface tension forces. The value for Kb can beobtained from Figure 3, and Kindsvater and Carter (1959) recommend that a constant value of 0.001 m(0.003 ft) be assigned to Kit regardless of the flow rate or gate height.
3
0.005
0.004
0.003
-.!0.002
..II<
0.001
0.000
00 0.1
-0.001
Ib elB t I m b
Ib elB t I m b
1.0 0.075 0.602 0.5 0.011 0.5920.9 0.064 0.599 0.4 0.0058 0.5910.8 0.045 0.597 0.3 0.0020 0.5900.7 0.030 0.595 0.2 -0.0018 0.5890.6 0.018 0.593 0.1 -0.0021 0.588
0 -0.0023 0.587
Table 1: Values of m and b as a function of bJB t (from Bos, 1989).
At low heads, when viscous and surface tension forces are relatively high, the terms Kb and K" will have apronounced effect on the discharge equation. Conversely, Kb and K" will have little effect on the flow ratewhen the heads are high and the viscous and surface tension forces are relatively low. Kindsvater andCarter (1959) showed that the effective discharge coefficient varies linearly with bJBt and http oDIy(where p = height of weir from channel bottom to crest). The value of C. is assumed to be of the form:
C =m~ +b. p[7]
where m and b = empirical constants given in Table 1.
0.2 0.3 0.4 0.5 0.6 0.90.7 0.8
b elB 1
Figure 3: Values of Kb versus bJBt (adapted from Kindsvater and Carter, 1959)
It is expected that Kindsvater and Carter's discharge equation for sharp-crested weirs will also apply toovershot gates if an appropriate value of C. can be accurately determined with respect to the gate angle. Itwas assumed that Equation 4 could be used to calculate the discharge over a leaf gate if it were modifiedby another discharge coefficient as follows:
4
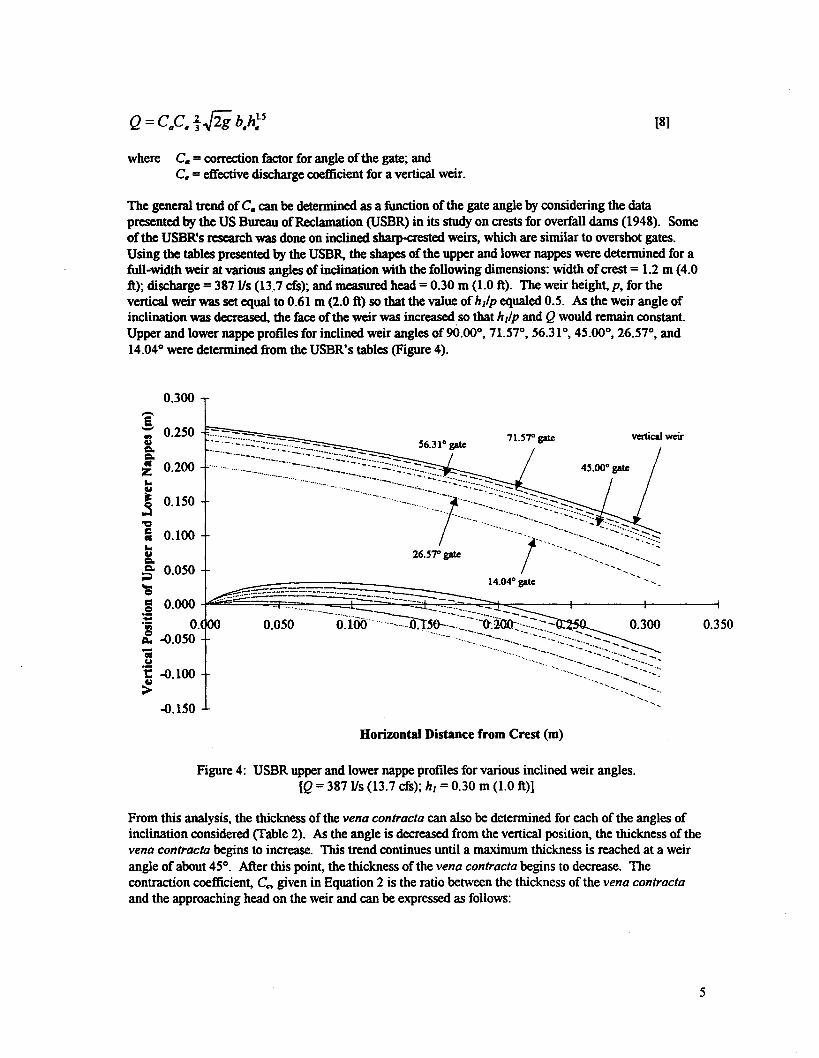
Q = CaC. t.J2i b.h;S [8]
where C" = correction factor for angle of the gate~ andC. = effective discharge coefficient for a vertical weir.
The general trend of C" can be determined as a function of the gate angle by considering the datapresented by the US Bureau of Reclamation (USBR) in its study on crests for overfall dams (1948). Someof the USBR's research was done on inclined sharp-crested weirs, which are similar to overshot gates.Using the tables presented by the USBR. the shapes of the upper and lower nappes were determined for afull-width weir at various angles of inclination with the following dimensions: width of crest = 1.2 m (4.0
ft)~ discharge = 387 Us (13.7 cfs)~ and measured head = 0.30 m (1.0 ft). The weir height, p, for the
vertical weir was set equal to 0.61 m (2.0 ft) so that the value of hl/p equaled 0.5. As the weir angle ofinclination was decreased, the face of the weir was increased so that hip and Q would remain constant.Upper and lower nappe profiles for inclined weir angles of 90.00°, 71.57°, 56.31°, 45.00°, 26.57°, and14.04° were determined from the USBR's tables (Figure 4).
0.300-e';;' 0.250~c.c..;. 0.200...~
! 0.150
."; 0.100...~c.~ 0.050
'5.~ 0.000.i o.:. -0.050..y
~ -0.100~
::_:~~~~~~~~~~:::::
t:~:':::~:~:'::-~'~-::~::::_:::'-
"""'" ..~'.~::~ ~:..~~.~~:.~~:~::~:~.~'2~.:.:.:::.~
2657°gatc ! "-"'-'" """"'..,.'-":
"""" -"".'-"
14.04° gate",
"--... - - :::".-:".:-"""-":----
0.050 O.IO<f- Ql~O '-"0-:100-.: =.:-- 0.300.._::::::=~::.~~~~~~~==~~:
""" "."""'''''....
0.350
-0.150
Horizontal Distance from Crest (m)
Figure 4: USBR upper and lower nappe profiles for various inclined weir angles.[Q = 387 Us (13.7 cfs); hI = 0.30 m (1.0 ft)]
From this analysis, the thickness of the vena contracta can also be determined for each of the angles ofinclination considered (fable 2). As the angle is decreased from the vertical position, the thickness of thevena contract a begins to increase. This trend continues until a maximum thickness is reached at a weirangle of about 45°. After this point, the thickness of the vena contracta begins to decrease. Thecontraction coefficient, Cn given in Equation 2 is the ratio between the thickness of the vena contractaand the approaching head on the weir and can be expressed as follows:
5
Angle Vena contracta Depth at Contractionlocation from vena contracta Coefficient
(°) crest (m) (m) Cc
10 20 30 40 50 60 70 80 90
Inclined Weir Angle (0)
Figure 5: Cc as a function ofUSBR inclined weir angle.
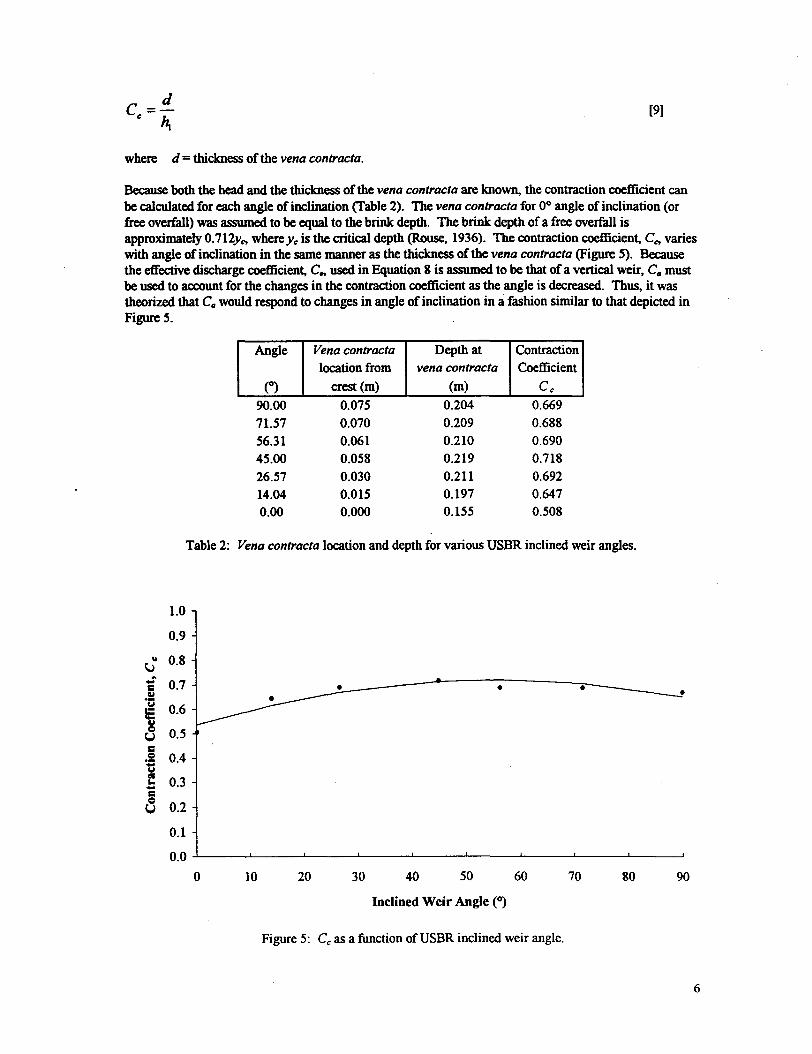
c=!!...c ~[9]
where d = thickness of the vena contracta.
Because both the head and the thickness of the vena contracta are known. the contraction coefficient canbe calculated for each angle of inclination (Table 2). The vena contracta for 0° angle of inclination (orfree overfall) was assumed to be equal to the brink depth. The brink depth of a free overfall isapproximately 0.712yc. where Yc is the critical depth (Rouse, 1936). The contraction coefficient, Cc. varieswith angle of inclination in the same manner as the thickness of the vena contracta (Figure 5). Becausethe effective discharge coefficient, C.. used in Equation 8 is assumed to be that of a vertical weir, Co mustbe used to account for the changes in the contraction coefficient as the angle is decreased. Thus, it wastheorized that Cowould respond to changes in angle of inclination in a:fashion similar to that depicted inFigure 5.
90.0071.5756.3145.0026.5714.040.00
0.0750.0700.0610.0580.0300.0150.000
0.2040.2090.2100.2190.2110.1970.155
0.6690.6880.6900.7180.6920.6470.508
Table 2: Vena contracta location and depth for various USBR inclined weir angles.
1.0
0.9
tJ" 0.8
;- 0.7CY'yIS 0.6
a 0.5=.S 0.4tiallb 0.3=8 0.2
. . .
0.1
0.00
6
Subme~ed Weirs
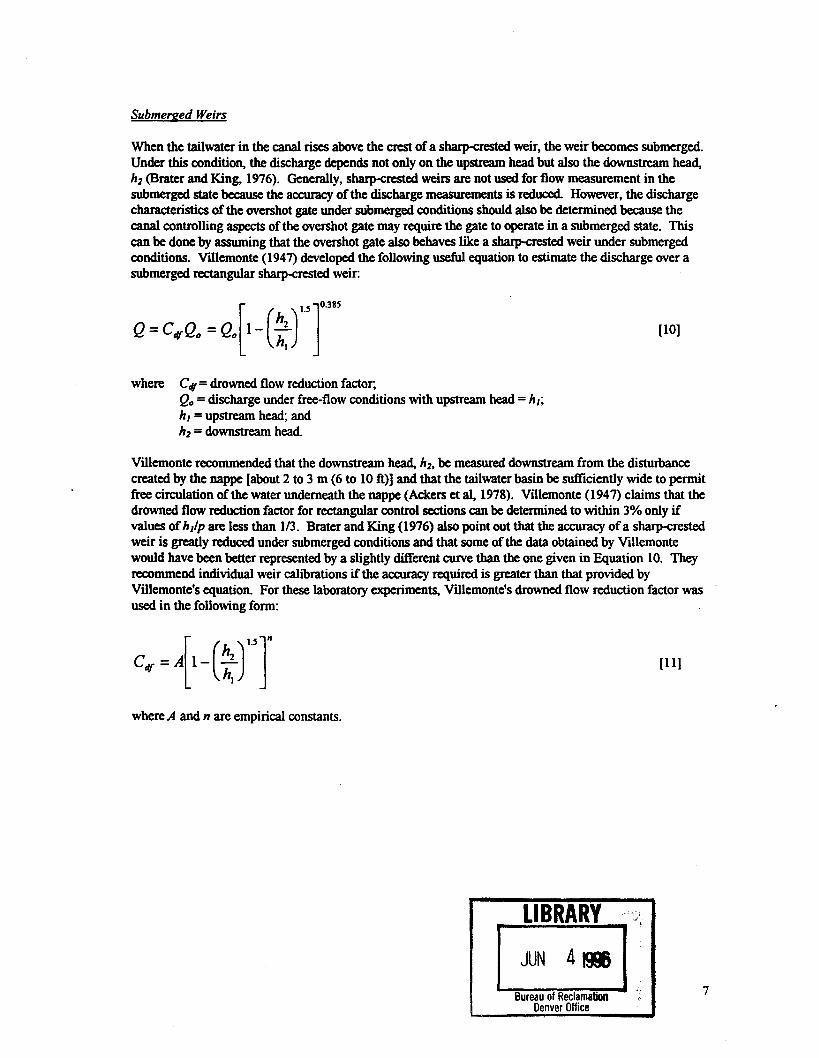
When the tailwater in the canal rises above the crest of a sharp-crested weir, the weir becomes submerged.Under this condition, the discharge depends not only on the upstream head but also the downstream head,h2 (Brater and King, 1976). Generally, sharp-crested weirs are not used for flow measurement in thesubmerged state because the accuracy of the discharge measurements is reduced. However, the dischargecharacteristics of the overshot gate under submerged conditions should also be determined because thecanal controlling aspects of the overshot gate may require the gate to operate in a submerged state. Thiscan be done by assuming that the overshot gate also behaves like a sharp-crested weir under submergedconditions. Vlllemonte (1947) developed the following useful equation to estimate the discharge over asubmerged rectangular sharp-crested weir:
[IS
J
OO38S
Q=C4'Q. =Q. l-(~).
where CtI/= drowned flow reduction factor,Qo = discharge under free-flow conditions with upstream head = hI;
hI = upstream head; andh2 = downstream head.
[10]
Villemonte recommended that the downstream head, h2, be measured downstream from the disturbancecreated by the nappe [about 2 to 3 m (6 to 10 ft)] and that the tailwater basin be sufficiently wide to permitfree circulation of the water underneath the nappe (Ackers et al, 1978). Villemonte (1947) claims that thedrowned flow reduction factor for rectangular control sections can be determined to within 3% only ifvalues of hIIp are less than 1/3. Brater and King (1976) also point out that the accuracy of a sharp-crestedweir is greatly reduced under submerged conditions and that some of the data obtained by Villemontewould have been better represented by a slightly different curve than the one given in Equation 10. Theyrecommend individual weir calibrations if the accuracy required is greater than that provided byVillemonte's equation. For these laboratory experiments, Villemonte's drowned flow reduction factor wasused in the following form:
C4'=+-(~rr
where A and n are empirical constants.
LIBRARY
~..Bureau of Reclamation .
Denver Office
[11]
7
LABORATORY TESTS
Laboratory tests were perfonned on two different overshot gates. The tests were perfonned in a glass-sided rectangular open channel that was 1.229 m (48-3/8 in) wide and 15 m (50 ft) long. Water waspumped from a large sump into a 3-m (IO-ft) diameter constant head tank. From there the water enteredthe glass-sided channel through a series ofbaffies that were used to straighten the flow in the channel andto create a unifonn flow profile. With no obstructions in the channel, a maximum flow rate of about 420Us (15 cfs) can be achieved. All flow rates were measured using a 25-ton weighing tank system, accurateto :to. 10/0.
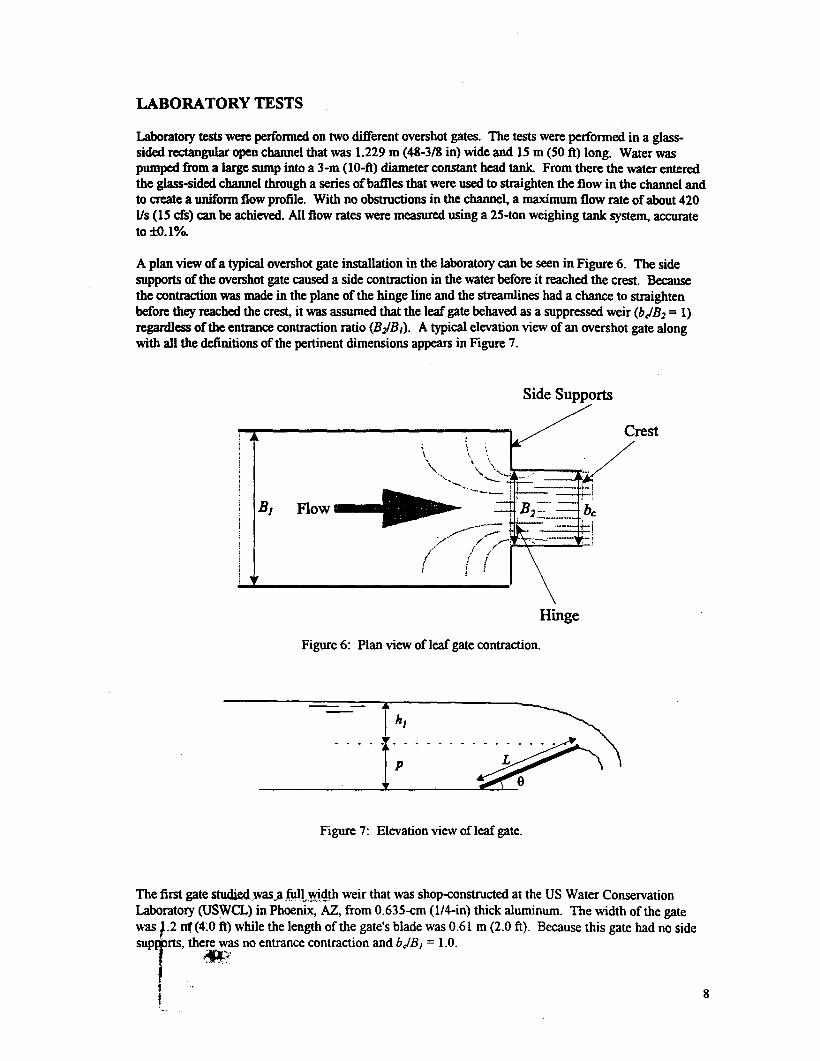
A plan view of a typical overshot gate installation in the laboratory can be seen in Figure 6. The sidesupports of the overshot gate caused a side contraction in the water before it reached the crest. Becausethe contraction was made in the plane of the hinge line and the streamlines had a chance to straightenbefore they reached the crest, it was assumed that the leaf gate behaved as a suppressed weir (bjB2 = 1)regardless of the entrance contraction ratio (BiB]). A typical elevation view of an overshot gate alongwith all the definitions of the pertinent dimensions appears in Figure 7.
Side Supports
B}
Hinge
Figure 6: Plan view of leaf gate contraction.
hJ
.'" '" '" '"
p
Figure 7: Elevation view of leaf gate.
The first gate studied:was~afuR~Qth weir that was shop-constructedat the US Water ConservationLaboratory(USWCL)in Phoenix, AZ, from 0.635-cm (l/4-in) thick aluminum. The width of the gatewas 1-2 nf(~tOft) while the length oftbe gate's blade was 0.61 m (2.0 ft). Because this gate had no side
1ns. ~'IP":"no entr.mcecontraction andbjB, = 1.0.
, -.i 8,
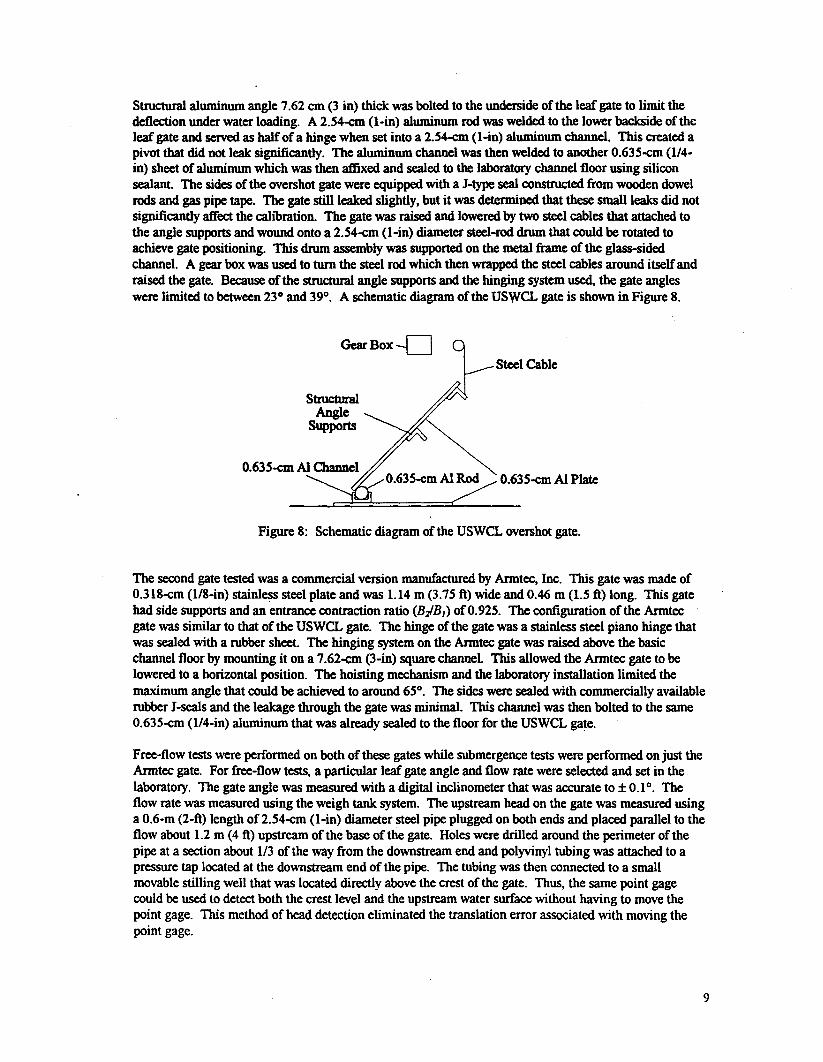
Structural aluminum angle 7.62 em (3 in) thick was bolted to the underside of the leaf gate to limit thedeflection under water loading. A 2.54-cm (I-in) aluminum rod was welded to the lower backside of theleaf gate and served as half of a hinge when set into a 2.54-cm (I-in) aluminum channel. This created apivot that did not leak significantly. The aluminum channel was then welded to another 0.635-cm (1/4-in) sheet of aluminum which was then affixed and sealed to the laboratoty channel floor using siliconsealant. The sides of the overshot gate were equipped with a J-type seal constructed from wooden dowelrods and gas pipe tape. The gate still leaked slightly, but it was determined that these small leaks did notsignificantly affect the calibration. The gate was raised and lowered by two steel cables that attached tothe angle supports and wound onto a 2.54-cm (I-in) diameter steel-rod drum that could be rotated toachieve gate positioning. This drum assembly was supported on the metal frame of the glass-sidedchannel. A gear box was used to turn the steel rod which then wrapped the steel cables around itself andraised the gate. Because of the structural angle supports and the hinging system used. the gate angleswere limited to between 23° and 39°. A schematic diagram of the USWCL gate is shown in Figure 8.
GearBox-oSteel Cable
~0.635-cm Ai Rod 0.635-cm Ai Plate
Figure 8: Schematic diagram of the USWCL overshot gate.
The second gate tested was a commercial version manufactured by Armtec, Inc. This gate was made of0.318-cm (1I8-in) stainless steel plate and was 1.14 m (3.75 ft) wide and 0.46 m (1.5 ft) long. This gatehad side supports and an entrance contraction ratio (B}B1) of 0.925. The configuration of the Armtec .
gate was similar to that of the USWCL gate. The hinge of the gate was a stainless steel piano hinge thatwas sealed with a robber sheet. The hinging system on the Armtec gate was raised above the basicchannel floor by mounting it on a 7.62-cm (3-in) square channel. This allowed the Armtec gate to belowered to a horizontal position. The hoisting mechanism and the laboratory installation limited themaximum angle that could be achieved to around 65°. The sides were sealed with commercially availablerobber J-seals and the leakage through the gate was minimal. This channel was then bolted to the same0.635-cm (1/4-in) aluminum that was already sealed to the floor for the USWCL gate.
Free-flow tests were performed on both of these gates while submergence tests were performed on just theArmtec gate. For free-flow tests, a particular leaf gate angle and flow rate were selected and set in thelaboratory. The gate angle was measured with a digital inclinometer that was accurate to :t 0.1°. Theflow rate was measured using the weigh tank system. The upstream head on the gate was measured usinga 0.6-m (2-ft) length of 2.54-cm (I-in) diameter steel pipe plugged on both ends and placed parallel to theflow about 1.2 m (4 ft) upstream of the base of the gate. Holes were drilled around the perimeter of thepipe at a section about 113of the way from the downstream end and polyvinyl tubing was attached to apressure tap located at the downstream end of the pipe. The tubing was then connected to a smallmovable stilling well that was located directly above the crest of the gate. Thus, the same point gagecould be used to detect both the crest level and the upstream water surface without having to move thepoint gage. This method of head detection eliminated the translation error associated with moving thepoint gage.
9
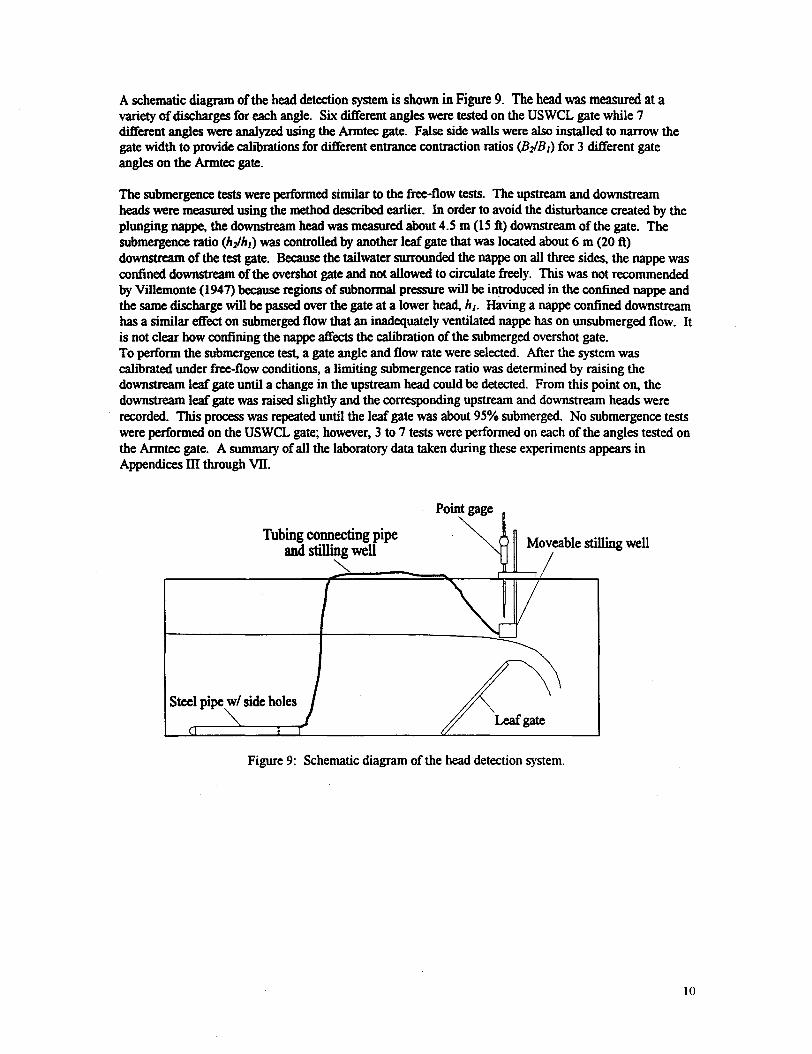
A schematic diagram of the head detection system is shown in Figure 9. The head was measured at avariety of discharges for each angle. Six different angles were tested on the USWCL gate while 7different angles were analyzed using the Armtec gate. False side walls were also installed to narrow thegate width to provide calibrations for different entrance contraction ratios (B]/B]) for 3 different gateangles on the Armtec gate.
The submergence tests were performed similar to the free-flow tests. The upstream and downstreamheads were measured using the method described earlier. In order to avoid the disturbance created by theplunging nappe, the downstream head was measured about 4.5 m (15 ft) downstream of the gate. Thesubmergence ratio (h/h]) was controlled by another leaf gate that was located about 6 m (20 ft)downstream of the test gate. Because the tailwater surrounded the nappe on all three sides, the nappe wasconfined downstream of the overshot gate and not allowed to circulate freely. This was not recommendedby Villemonte (1947) because regions of subnormal pressure will be introduced in the confined nappe andthe same discharge will be passed over the gate at a lower head, hI. Having a nappe confined downstreamhas a similar effect on submerged flow that an inadequately ventilated nappe has on unsubmerged flow. Itis not clear how confining the nappe affects the calibration of the submerged overshot gate.To perform the submergence test, a gate angle and flow rate were selected. After the system wascalibrated under free-flow conditions, a limiting submergence ratio was determined by raising thedownstream leaf gate until a change in the upstream head could be detected. From this point on, thedownstream leaf gate was raised slightly and the corresponding upstream and downstream heads wererecorded. This process was repeated until the leaf gate was about 95% submerged. No submergence testswere performed on the USWCL gate; however, 3 to 7 tests were performed on each of the angles tested onthe Armtec gate. A summary of all the laboratory data taken during these e~:periments appears inAppendices III through VII.
Tubingconnectingpipeand stillingwell
'"
Figure 9: Schematic diagram of the head detection system.
10
RESULTS
Adiustments to the Dischaf'J!e Equation
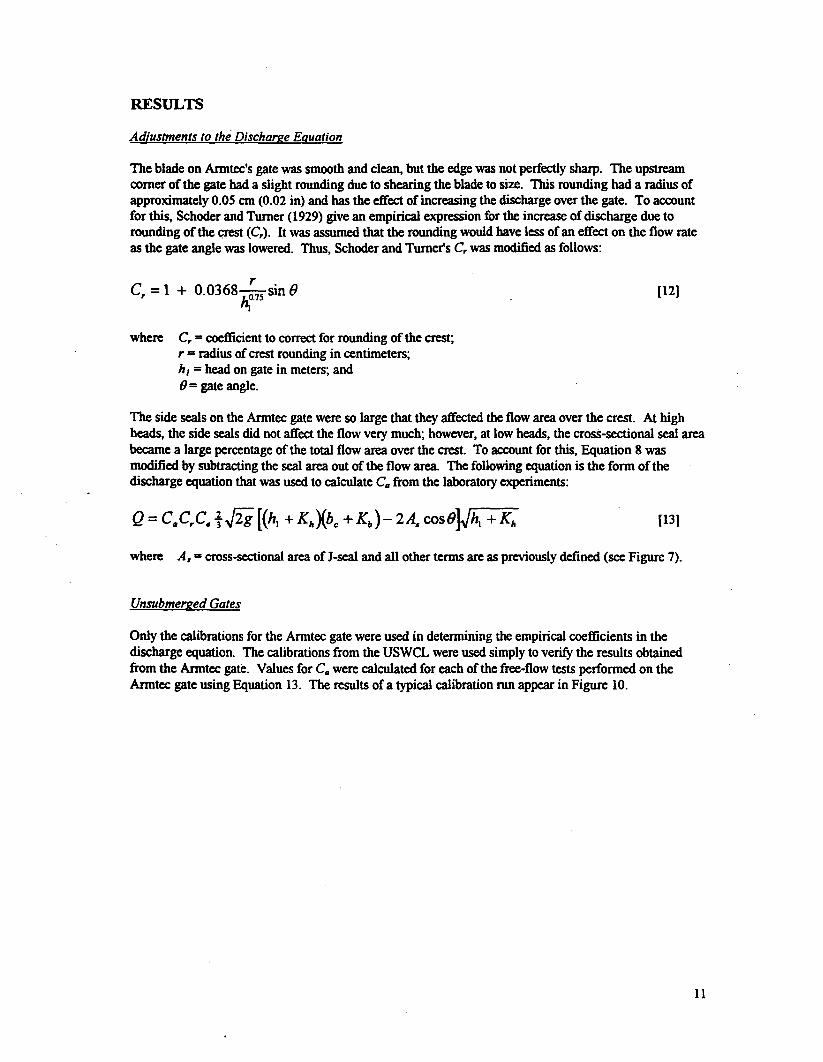
The blade on Armtec's gate was smooth and clean. but the edge was not perfectly sharp. The upstreamcomer of the gate had a slight rounding due to shearing the blade to size. This rounding had a radius ofapproximately 0.05 em (0.02 in) and has the effect of increasing the discharge over the gate. To accountfor this, Schader and Turner (1929) give an empirical expression for the increase of discharge due torounding of the crest (Cr). It was assumed that the rounding would have less of an effect on the flow rateas the gate angle was lowered. Thus, Schader and Turner's Cr was modified as follows:
Cr = 1 + 0.0368 ~~7Ssin B [12]
where Cr = coefficient to correct for rounding of the crest;r = radius of crest rounding in centimeters;hI = head on gate in meters; and() = gate angle.
The side seals on the Armtec gate were so large that they affected the flow area over the crest. At highheads, the side seals did not affect the flow very much; however, at low heads, the cross-sectional seal areabecame a large percentage of the total flow area over the crest. To account for this, Equation 8 wasmodified by subtracting the seal area out of the flow area. The following equation is the form of thedischarge equation that was used to calculate C" from the laboratory experiments:
Q=C"CrC.tJ2i[(h) +KIIXbc+Kb)-2A"cosB]Jh) +KII [13]
where A" = cross-sectional area of I-seal and all other terms are as previously defined (see Figure 7).
Unsubmerfled Gates
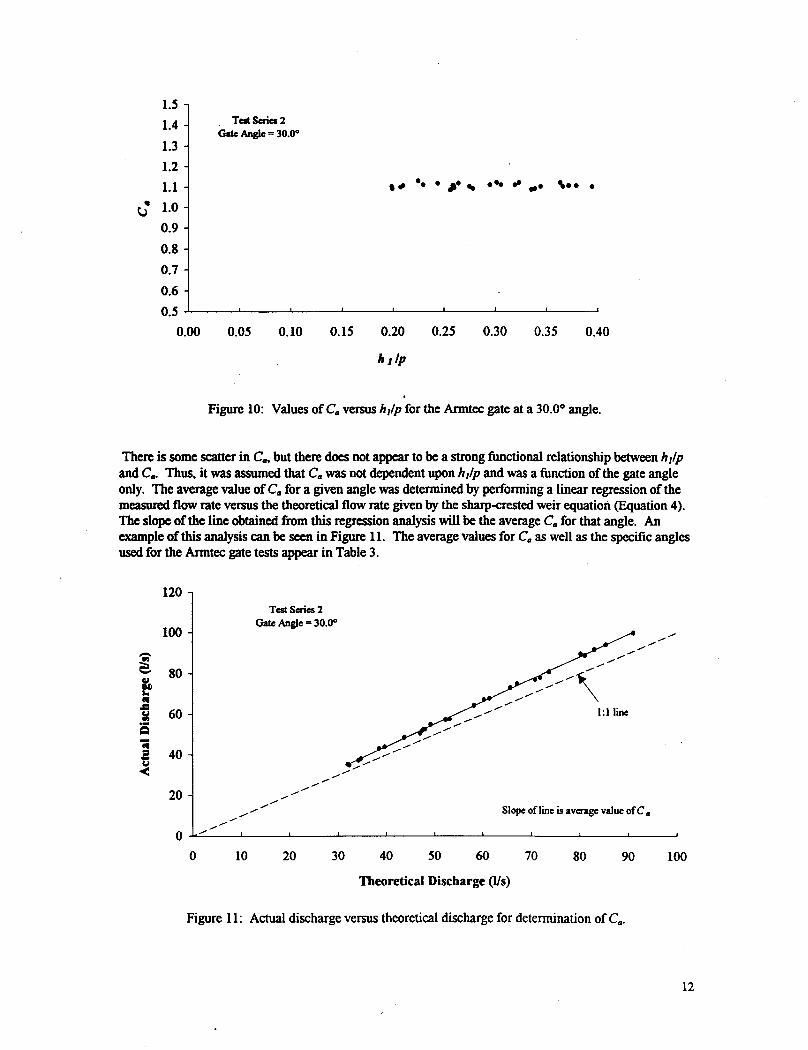
Only the calibrations for the Armtec gate were used in determining the empirical coefficients in thedischarge equation. The calibrations from the USWCL were used simply to verify the results obtainedfrom the Armtec gate. Values for CIIwere calculated for each of the free-flow tests performed on theArmtec gate using Equation 13. The results of a typical calibration run appear in Figure 10.
11
120
100
...C 80lm
".c 60~is
..S 40""<
20
00
1.5
1.4
1.3
1.2
1.1
r: 1.0
0.9
0.8
0.7
0.6
0.5
0.00
. Tat Series2Gate Angle = 30.0°
. 1#.. . ". ~ ... ".., ,.. .
0.05 0.15 0.25 0.400.300.20 0.350.10
hllp
Figure 10: Values of C" versus h1lp for the Anntec gate at a 30.0° angle.
There is some scatter in C", but there does not appear to be a strong functional relationship between h1lpand C". Thus, it was assumed that C" was not dependent upon h1lp and was a function of the gate angleonly. The average value of C" for a given angle was determined by performing a linear regression of themeasured flow rate versus the theoretical flow rate given by the sbarp-crested weir equation (Equation 4).The slope of the line obtained from this regression analysis will be the average C" for that angle. Anexample of this analysis can be seen in Figure 11. The average values for C" as well as the specific anglesused for the Anntec gate tests appear in Table 3.
Tat Series2Gate Angle = 30.0°
--------\---- 1:1 line--------------_.
------------Slope ofline is average value orc"
10 50 1006020 30 40 70 80 90
Theoretical Discharge (lis)
Figure 11: Actual discharge versus theoretical discharge for determination of C".
12
I
Gate(~gleI
Co Number
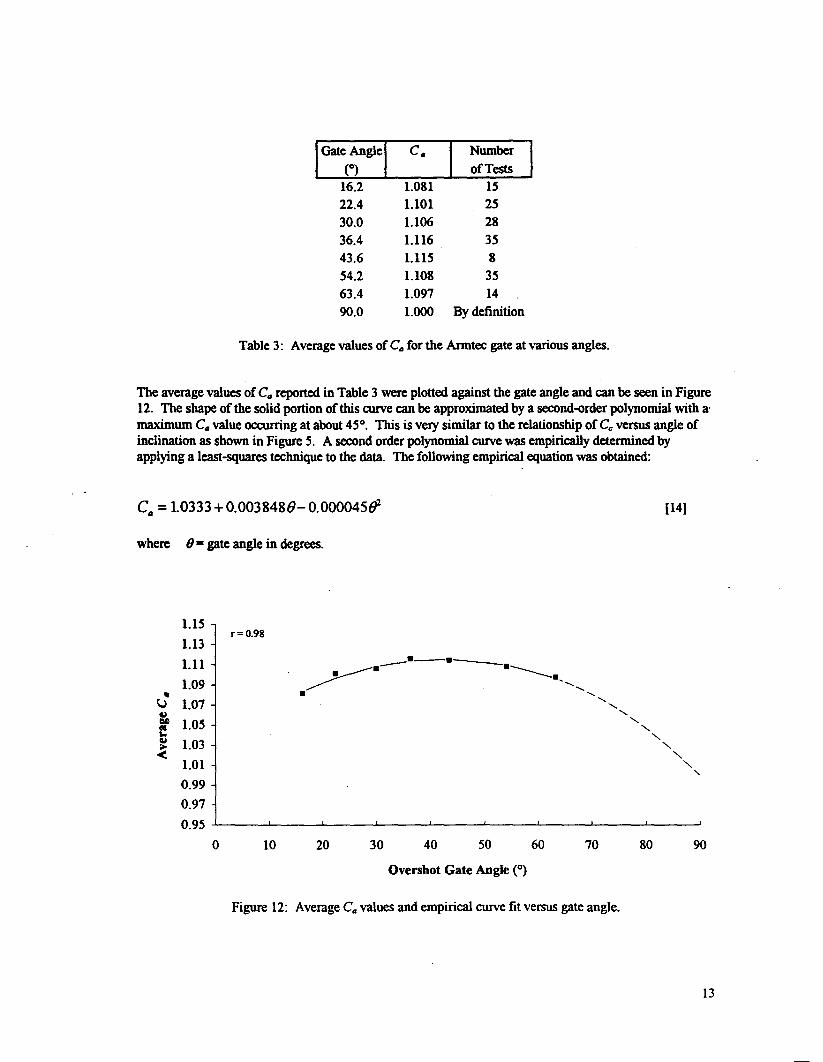
Iof Tests16.2 1.081 1522.4 1.101 2530.0 1.106 2836.4 1.116 3543.6 1.115 854.2 1.108 3563.4 1.097 1490.0 1.000 By definition
Table 3: Average values of Cofor the Anntec gate at various angles.
The average values of Co reported in Table 3 were plotted against the gate angle and can be seen in Figure12. The shape of the solid portion of this curve can be approximated by a second-order polynomial with a.maximum Covalue occurring at about 45°. This is very similar to the relationship of Cc versus angle ofinclination as shown in Figure 5. A second order polynomial curve was empirically determined byapplying a least-squares technique to the data. The following empirical equation was obtained:
Co = 1.0333 + 0.OO38480-0.00004Stf [14]
where () = gate angle in degrees.
1.15
1.13
1.11
1.09..
\,) 1.07~:1 1.05...
~ 1.03< 1.01
0.990.97
0.950
r = 0.98
.-.--.- . --------.~ -',.
"-"- .......
..............
.......
"-"-
"-""
"
10 20 30 40 50 60 70 80 90
Overshot Gate Angle (0)
Figure 12: Average Covalues and empirical curve fit versus gate angle.
13
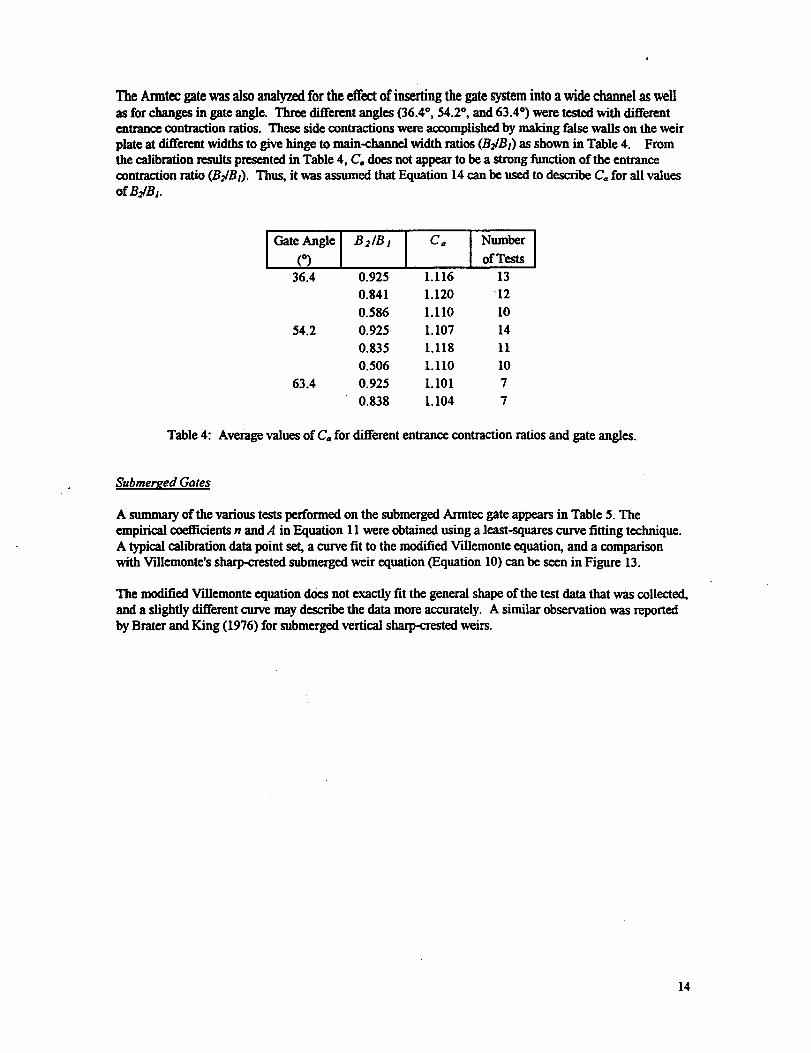
The Anntec gate was also analyzed for the effect of inserting the gate system into a wide channel as wellas for changes in gate angle. Three different angles (36.4°,54.2°, and 63.4°) were tested with differententrance contraction ratios. These side contractions were accomplished by making false walls on the weirplate at different widths to give hinge to main-channel width ratios (B;B]) as shown in Table 4. Fromthe calibration results presented in Table 4, Co does not appear to be a strong function of the entrancecontraction ratio (B;B I). Thus, it was assumed that Equation 14 can be used to describe Co for all valuesofB;B1.
Co
I :;;: I
13°121014111077
I
Gate(;gleI
B2/B I
I
36.4 0.9250.8410.5860.9250.8350.5060.9250.838
54.2
1.1161.1201.1101.1071.1181.1101.1011.104
63.4
Table 4: Average values of Co for different entrance contraction ratios and gate angles.
Subme17led Gates
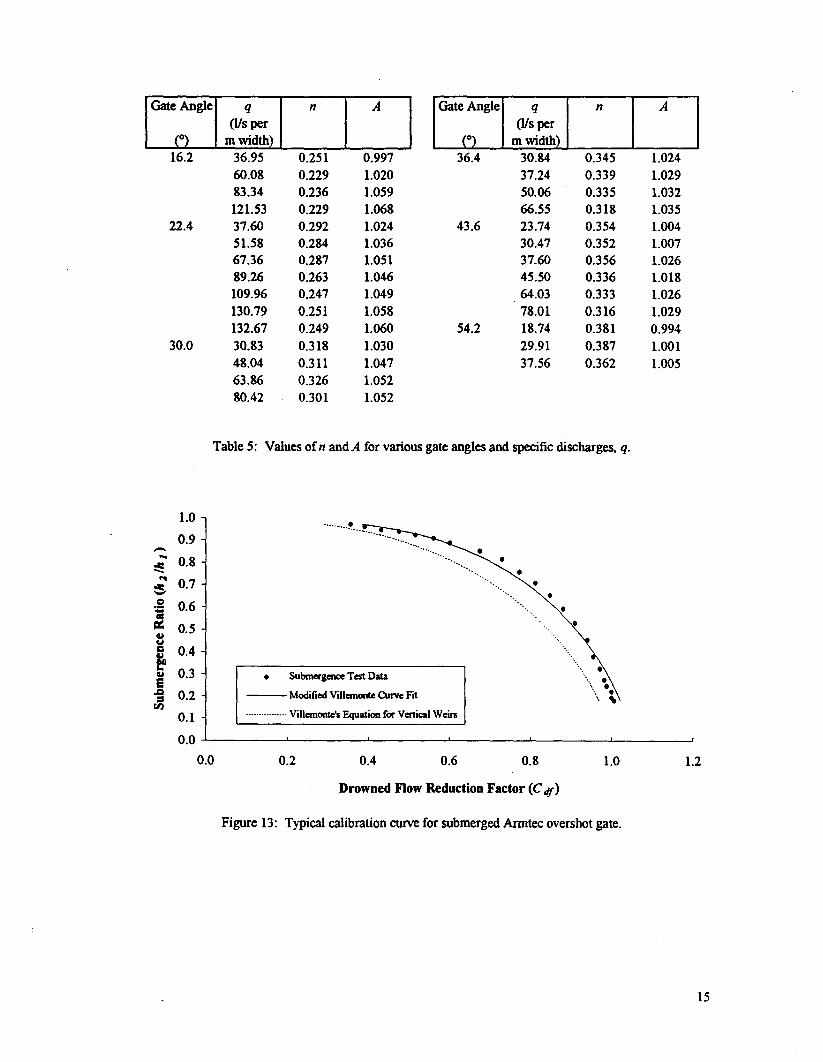
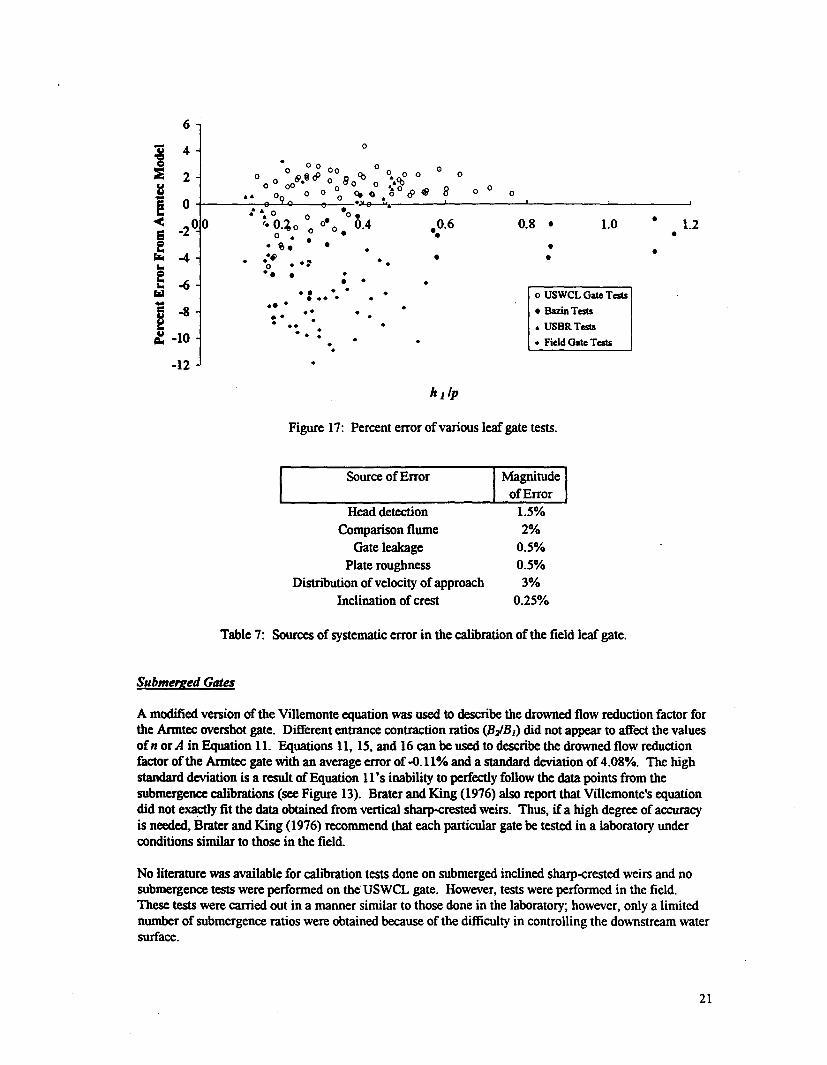
A summary of the various tests performed on the submerged Armtec gate appears in Table 5. Theempirical coefficients n and A in Equation II were obtained using a least-squares curve fitting technique.A typical calibration data point set, a curve fit to the modified Villemonte equation, and a comparisonwith Villemonte's sharp-crested submerged weir equation (Equation 10) can be seen in Figure 13.
The modified Villemonte equation dOes not exactly fit the general shape of the test data that was collected,and a slightly different curve may describe the data more accurately. A similar observation was reportedby Brater and King (1976) for submerged vertical sharp-crested weirs.
14
IGae;el :~)I
n A
16.2 36.95 0.251 0.99760.08 0.229 1.02083.34 0.236 1.059121.53 0.229 1.068
22.4 37.60 0.292 1.02451.58 0.284 1.03667.36 0.287 1.05189.26 0.263 1.046109.96 0.247 1.049130.79 0.251 1.058132.67 0.249 1.060
30.0 30.83 0.318 1.03048.04 0.311 1.04763.86 0.326 1.05280.42 0.301 1.052
Gate Angle q n A(Us per
(°) m width)36.4 30.84 0.345 1.024
37.24 0.339 1.02950.06 0.335 1.03266.55 0.318 1.035
43.6 23.74 0.354 1.00430.47 0.352 1.00737.60 0.356 1.02645.50 0.336 1.01864.03 0.333 1.02678.01 0.316 1.029
54.2 18.74 0.381 0.99429.91 0.387 1.00137.56 0.362 1.005
Table 5: Values ofn andA for various gate angles and specific discharges, q.
1.0
0.9-.; 0.8-.; 0.7-~ 0.6~. 0.5.,f.Ie 0.4OA)
t 0.3E-§ 0.2en
0.1
0.0
0.0
!!..._.................................
............................
".
. SubmergenceTestData
- Modified Villemontc Curve Fit..nn n Villemontc's Equation for Vertical Wein
0.2 0.4 0.6 0.8 1.0 1.2
Drowned Flow Reduction Factor (C df)
Figure 13: Typical calibration curve for submerged Anntec overshot gate.
15
I
Gore
r7~elB2/B]
I:~~)In A
54.2 0.508 32.05 0.366 0.9980.508 45.08 0.348 0.9990.508 64.49 0.342 0.9910.839 26.68 0.370 1.0020.839 46.40 0.357 1.007
36.4 0.588 79.58 0.311 1.0230.844 23.96 0.336 0.9950.844 41.29 0.310 1.0140.844 64.73 0.304 1.0330.844 97.10 0.280 1.032
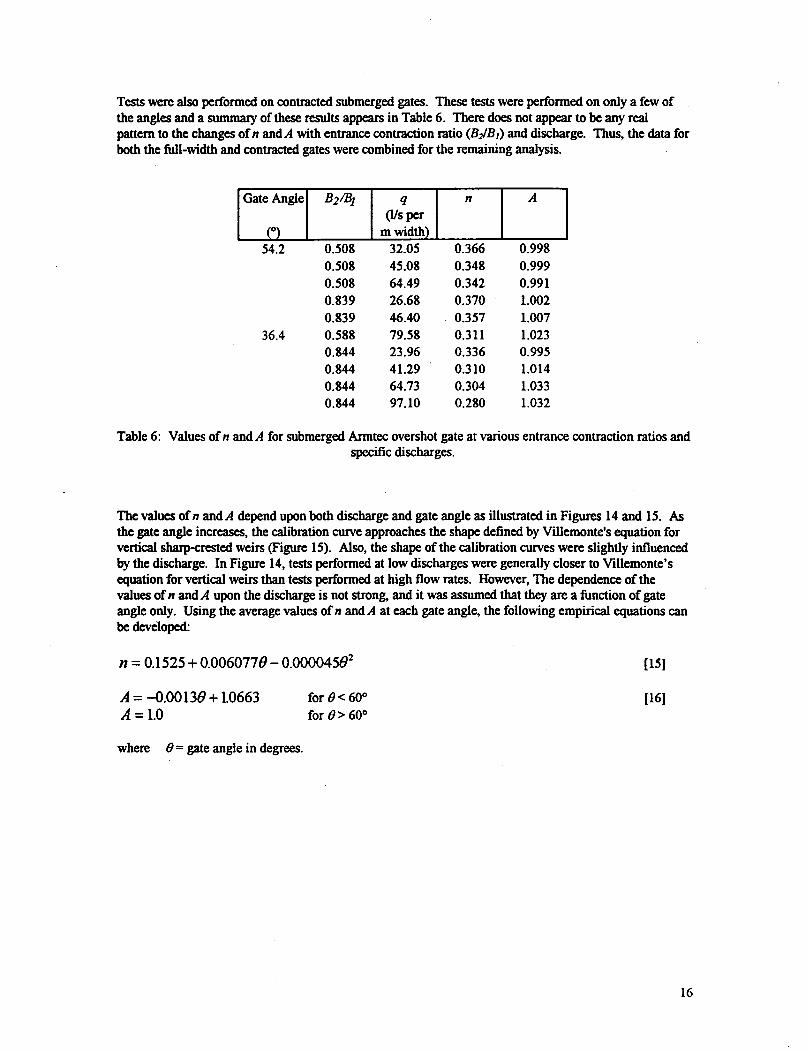
Tests were also performed on contrncted submerged gates. These tests were performed on only a few ofthe angles and a surnrnaIY of these results appears in Table 6. There does not appear to be any realpattern to the changes ofn andA with entrance contrnction ratio (B~B1) and discharge. Thus, the data forboth the full-width and contrncted gates were combined for the remaining analysis.
Table 6: Values of n and A for submerged Arrntec overshot gate at various entrance contrnction ratios andspecific discharges.
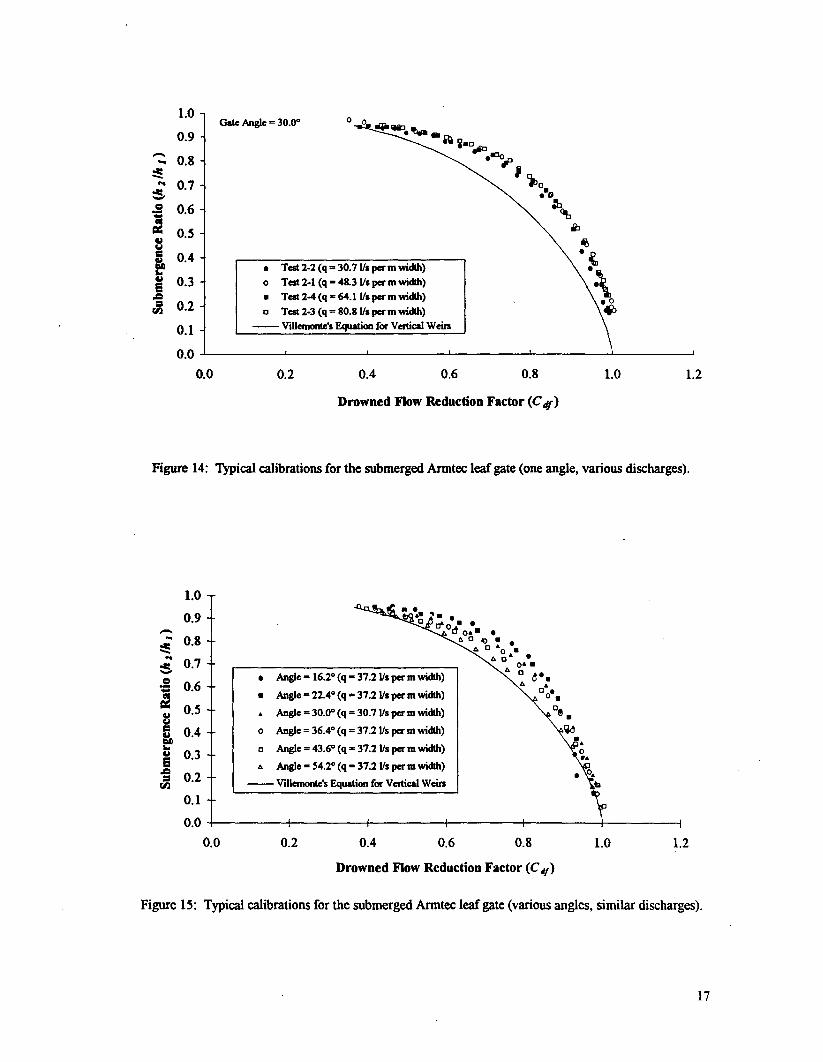
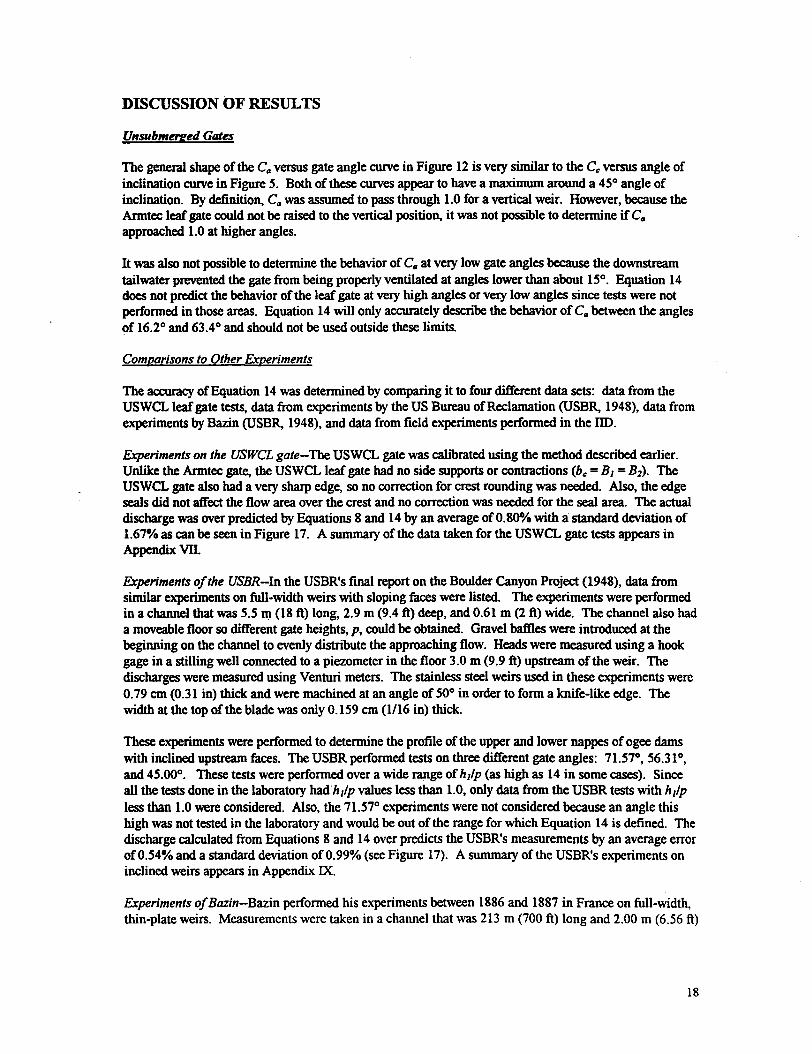
The values of n and A depend upon both discharge and gate angle as illustrnted in Figures 14 and 15. Asthe gate angle increases, the calibration curve approaches the shape defined by Villemonte's equation forvertical sharp-crested weirs (Figure 15). Also, the shape of the calibration curves were slightly influencedby the discharge. In Figure 14, tests performed at low discharges were generally closer to Villemonte'sequation for vertical weirs than tests performed at high flow rates. However, The dependence of thevalues of n and A upon the discharge is not strong, and it was assumed that they are a function of gateangle only. Using the average values of n and A at each gate angle, the following empirical equations canbe developed:
n =0.1525 + 0.006077 () - 0.000045(}2 [15]
A = -{).0013(}+ 1.0663
A =1.0for 0< 60°for 0> 60°
[16]
where 0 = gate angle in degrees.
16
1.0
0.9
"': 0.8~.; 0.7-,S 0.6...
&'. OS., .
""5 0.4f.I
~ 0.3~
JJ 0.2
0.1
0.0
0.0
.~ 8,.-.-.~i.°eliO.~ ,
~o..0
~~ib
~. 0'\J.~
.0~
Gate Angle = 30.0°0
0.6 0.8 1.2
. Test 2-2 (q = 30.7 III per m width)0 Test 2-1 (q =48.3 III per m width). Test2-4(q
= 64.1 III per m width)
0 Test 2-3 (q =80.8 III per m width)
- ViUcmonte'sEquation for Vertical Weirs
0.2 0.4
Drowned Flow Reduction Factor (C df)
1.0
Figure 14: Typical calibrations for the submerged Armtec leaf gate (one angle, various discharges).
1.0
0.9-.;, 0.8-.; 0.7-~ 0.6&'.., 0.5""Ii 0.4~is
0.3.g 0.2rn
0.1
0.0
0.0
" ~. ". .00"..°d0.. .to0 .., . .to0.0 .too. .O'.to 0
~..to .00..
o@.
. Angle = 16.2° (q = 37.2 III perm width)
. Angle= 22.4° (q - 37.2 III perm width). Angle = 30.0°(q = 30.7 lis perm width)
0 Angle = 36.4° (q = 37.2 lis perm width)
0 Angle =43.6° (q - 37.2 lis perm width)to Angle = S4.2°
(q= 37.2 lis perm width)
- ViIlcmonte's Equation for Vertical Weirs
0.2 0.4
Drowned Flow Reduction Factor (C 4/)
0.6 0.8 1.0 1.2
Figure IS: Typical calibrations for the submerged Armtec leaf gate (various angles, similar discharges).
17
DISCUSSION OF RESULTS
UnsubmD'1!ed Gates
The general shape of the CIIversus gate angle cwve in Figure 12 is very similar to the Ce versus angle ofinclination cwve in Figure 5. Both of these cwves appear to have a maximum around a 45° angle ofinclination. By definition, CIIwas assumed to pass through 1.0 for a vertical weir. However, because theArmtec leaf gate could not be raised to the vertical position, it was not possible to determine if CIIapproached 1.0 at higher angles.
It was also not possible to determine the behavior of CIIat very low gate angles because the downstreamtailwater prevented the gate from being properly ventilated at angles lower than about 15°. Equation 14does not predict the behavior of the leaf gate at very high angles or very low angles since tests were notperformed in those areas. Equation 14 will only accurately describe the behavior of CIIbetween the anglesof 16.2° and 63.4° and should not be used outside these limits.
ComDarisons to Other ExDeriments
The accuracy of Equation 14 was determined by comparing it to four different data sets: data from theUSWCL leaf gate tests, data from experiments by the US Bureau of Reclamation (USBR, 1948), data fromexperiments by Bazin (USBR, 1948), and data from field experiments performed in the lID.
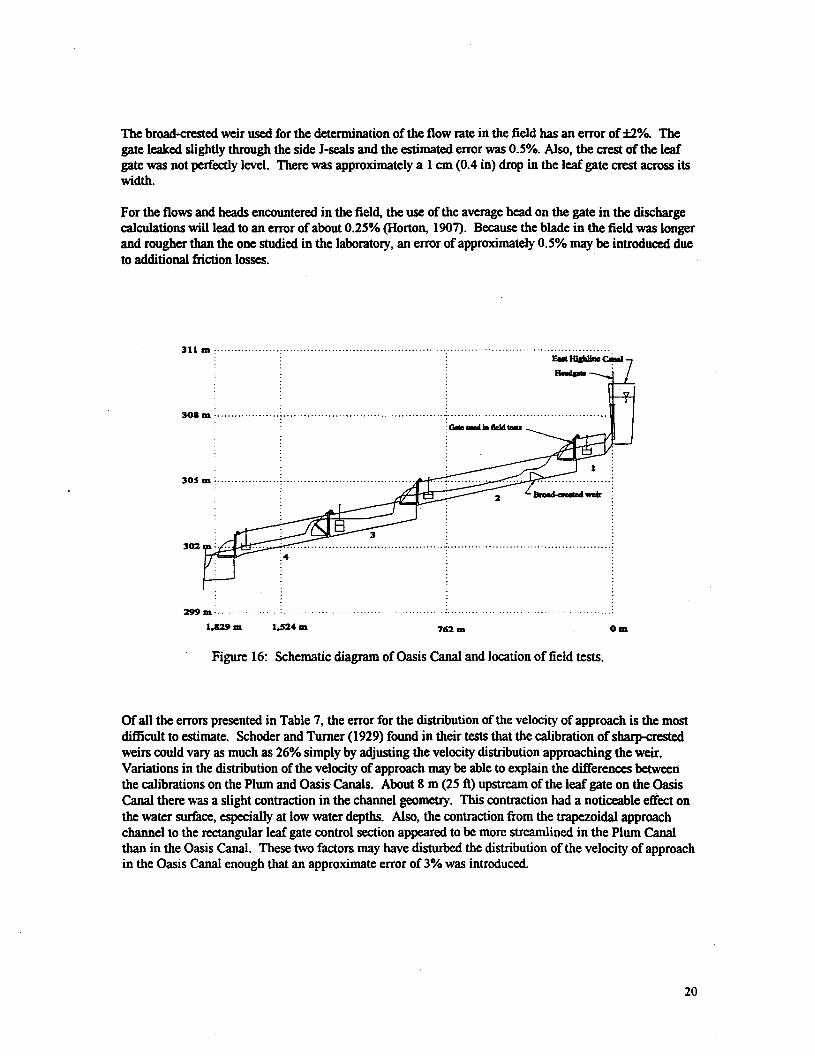
Experiments on the USWCL gate-The USWCL gate was calibrated using the method described earlier.Unlike the Armtec gate, the USWCL leaf gate had no side supports or contractions (be =B] =B2). TheUSWCL gate also had a very sharp edge, so no correction for crest rounding was needed. Also, the edgeseals did not affect the flow area over the crest and no correction was needed for the seal area. The actualdischarge was over predicted by Equations 8 and 14 by an average of 0.80010with a standard deviation of1.67% as can be seen in Figure 17. A summary of the data taken for the USWCL gate tests appears inAppendix VII.
Experiments of the USBR-In the USBR's final report on the Boulder Canyon Project (1948), data fromsimilar experiments on full-width weirs with sloping faces were listed. The experiments were performedin a channel that was 5.5 m (18 ft) long, 2.9 m (9.4 ft) deep, and 0.61 m (2 ft) wide. The channel also hada moveable floor so different gate heights, p, could be obtained. Gravel bafiles were introduced at thebeginning on the channel to evenly distribute the approaching flow. Heads were measured using a hookgage in a stilling well connected to a piezometer in the floor 3.0 m (9.9 ft) upstream of the weir. Thedischarges were measured using Venturi meters. The stainless steel weirs used in these experiments were0.79 em (0.31 in) thick and were machined at an angle of 50° in order to form a knife-like edge. Thewidth at the top of the blade was only 0.159 cm (1/16 in) thick.
These experiments were performed to determine the profile of the upper and lower nappes of ogee damswith inclined upstream faces. The USBR performed tests on three different gate angles: 71.57°,56.31°,and 45.00°. These tests were performed over a wide range of h]/p (as high as 14 in some cases). Sinceall the tests done in the laboratory had"h]/p values less than 1.0, only data from the USBR tests with h]/pless than 1.0 were considered. Also, the 71.57° experiments were not considered because an angle thishigh was not tested in the laboratory and would be out of the range for which Equation 14 is defined. Thedischarge calculated from Equations 8 and 14 over predicts the USBR's measurements by an average errorof 0.54% and a standard deviation of 0.99% (see Figure 17). A summary of the USBR's experiments oninclined weirs appears in Appendix IX.
Experiments ofBazin-Bazin performed his experiments between 1886 and 1887 in France on full-width,thin-plate weirs. Measurements were taken in a channel that was 213 m (700 ft) long and 2.00 m (6.56 ft)
18
wide. The weirs were made ofiron that was 0.70 em (0.276 in) thick and "carefully straightened." Forhis first 3 tests. Bazin measured the discharges volumetrically.After that, he calibrated the other weirs by comparing them to the first 3 "reference" weirs. The head wasmeasured using a hook gage in a stilling wen connected to a large piezometric tap that was 5.0 m (16.4 ft)upstream of the weir. Although"... Bazin's instrumentation was good and his technique was meticulous"(Kindsvater and Carter, 1959), his results differ from most other investigators. Questions have beenraised as to whether the crests in Bazin's experiments were truly straight or sharp (Schoder and Turner,1929).
The USBR's Boulder Canyon Project Final Report (1948) also presented some of the data fromexperiments performed by Bazin on weirs with sloping faces. Apart from the angles studied by the USBR,Bazin also performed experiments on gate angles of 26.57° and 14.04°. All ofBazin's data had h,/pvalues that were either near or below 1.0. Thus, all his data was used for comparison except for the datafrom the 71.57° angle tests. Equations 8 and 14 under predicted Bazin's data by an average 3.48% with astandard deviation of 2.29«'10(see Figure 17). Bazin's data on inclined weirs is summarized in AppendixVIII.
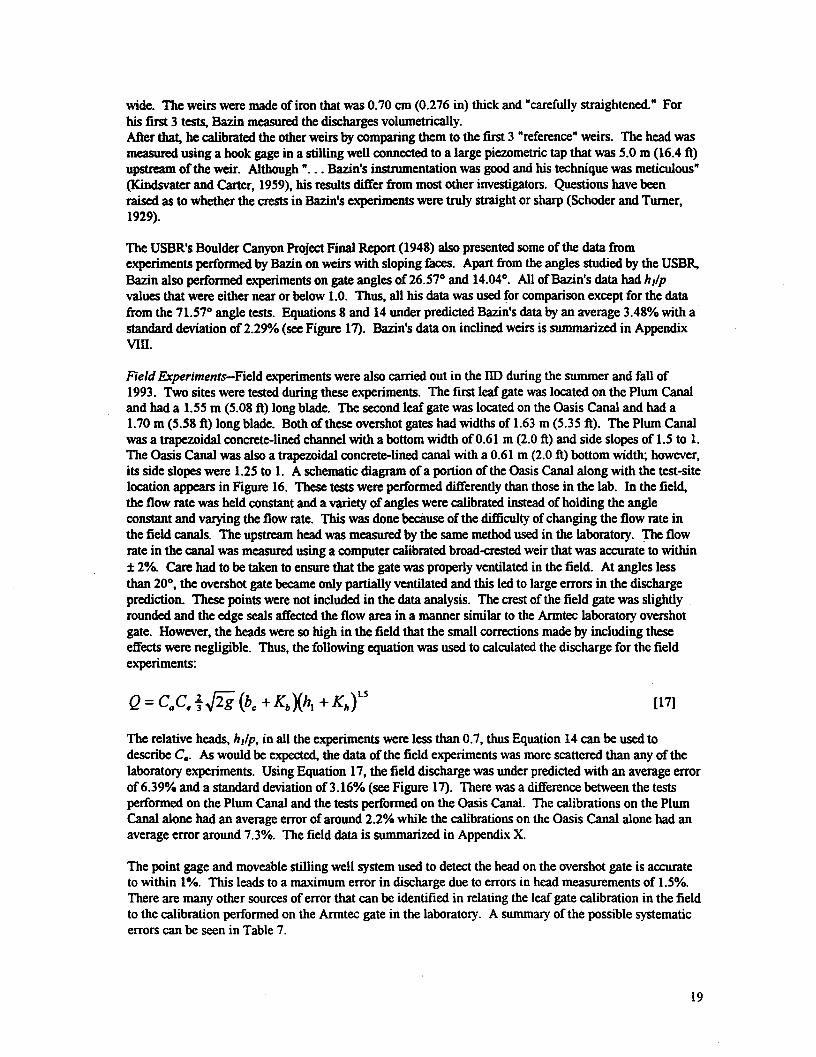
Field Experiments-Field experiments were also carried out in the lID during the summer and fall of1993. Two sites were tested during these experiments. The first leaf gate was located on the Plum Canaland had a 1.55 m (5.08 ft) long blade. The second leaf gate was located on the Oasis Canal and had a1.70 m (5.58 ft) long blade. Both of these overshot gates had widths of 1.63 m (5.35 ft). The Plum Canalwas a trapezoidal concrete-lined channel with a bottom width of 0.61 m (2.0 ft) and side slopes of 1.5 to 1.The Oasis Canal was also a trapezoidal concrete-lined canal with a 0.61 m (2.0 ft) bottom width; however,its side slopes were 1.25 to 1. A schematic diagram of a portion of the Oasis Canal along with the test-sitelocation appears in Figure 16. These tests were performed differently than those in the lab. In the field,the flow rate was held constant and a variety of angles were calibrated instead of holding the angleconstant and varying the flow rate. This was done beciuse of the difficulty of changing the flow rate inthe field canals. The upstream head was measured by the same method used in the laboratory. The flowrate in the canal was measured using a computer calibrated broad-crested weir that was accurate to withinf: 2%. Care had to be taken to ensure that the gate was properly ventilated in the field. At angles lessthan 20°, the overshot gate became only partially ventilated and this led to large errors in the dischargeprediction. These points were not included in the data analysis. The crest of the field gate was slightlyrounded and the edge seals affected the flow area in a manner similar to the Armtec laboratory overshotgate. However, the heads were so high in the field that the small corrections made by including theseeffects were negligible. Thus, the following equation was used to calculated the discharge for the fieldexperiments:
Q = CaC.t~2g (he+ KbXhl + Khrs [17]
The relative heads, h,/p, in all the experiments were less than 0.7, thus Equation 14 can be used todescribe Ca. As would be expected, the data of the field experiments was more scattered than any of thelaboratory experiments. Using Equation 17, the field discharge was under predicted with an average errorof 6.39«'10and a standard deviation of 3.16% (see Figure 17). There was a difference between the testsperformed on the Plum Canal and the tests performed on the Oasis Canal. The calibrations on the PlumCanal alone had an average error of around 2.2% while the calibrations on the Oasis Canal alone had anaverage error around 7.3%. The field data is summarized in Appendix X.
The point gage and moveable stilling well system used to detect the head on the overshot gate is accurateto within 1%. This leads to a maximum error in discharge due to errors in head measurements of 1.5%.There are many other sources of error that can be identified in relating the leaf gate calibration in the fieldto the calibration performed on the Armtec gate in the laboratory. A summary of the possible systematicerrors can be seen in Table 7.
19
The broad-aested weir used for the determination of the flow rate in the field bas an error of :t2%. Thegate leaked slightly through the side I-seals and the estimated error was 0.5%. Also, the crest of the leafgate was not perfectly level. There was approximately a 1 em (0.4 in) drop in the leaf gate crest across itswidth.
For the flows and heads encountered in the field, the use of the average head on the gate in the dischargecalculations will lead to an error of about 0.25% (Horton, 1907). Because the blade in the field was longerand rougher than the one studied in the laboratory, an error of approximately 0.5% may be introduced dueto additional friction losses.
311 m ,........... , , """""""""""
302 :..."""""""
308 m , ...: "'''''''''''' ".""""""""'"''''. .. .
305m: :....................................... .
299m:......
1.829 m""..'.-- ..'..-
1,524 m 762m Om
Figure 16: Schematic diagram of Oasis Canal and location of field tests.
Of all the errors presented in Table 7, the error for the distribution of the velocity of approach is the mostdifficult to estimate. Schoder and Turner (1929) found in their tests that the calibration of shaqH:restedweirs could vary as much as 26% simply by adjusting the velocity distribution approaching the weir.Variations in the distribution of the velocity of approach may be able to explain the differences betweenthe calibrations on the Plum and Oasis Canals. About 8 m (25 ft) upstream of the leaf gate on the OasisCanal there was a slight contraction in the channel geometry. This contraction had a noticeable effect onthe water surface, especially at low water depths. Also, the contraction from the trapezoidal approachchannel to the rectangular leaf gate control section appeared to be more streamlined in the Plum Canalthan in the Oasis Canal. These two factors may have disturbed the distribution of the velocity of approachin the Oasis Canal enough that an approximate error of 3% was introduced.
20
6
'i3 4'g~ 2~! 0-<
200
e -e~ -4..
~ -6IiIiI-Ii -8~~ -10
-12
Submet'1!ed Gates
0
00 0
00 00 0
000
@.@ &0 8 <b
"..~0
0 00 00 0
'..0 80 000 Qto 0 &tiJ.~ I
. .. .'"..
..0 0 o.
r. O.~o 0 d'0 0.40 ..
.. %. .
. .-Ii
"0 ..... .
0 00
.°.6.
1.0.
1.2.
0.8 .
.
.. .
.. .
.
. . .
.. .. . ... .. .
. 0 USWCLGateTests
. Bazin Tests
.. USBR Tests
. Field Gate Tests
... . .. ..
. .. .
..
.
.
h1lp
Figure 17: Percent error of various leaf gate tests.
I
Magnitude
Iof Error
1.5%2%
0.5%0.5%3%
0.25%
Source of Error
Head detection
Comparison flume
Gate leakage
Plate roughness
Distribution of velocity of approach
Inclination of crest
Table 7: Sources of systematic error in the calibration of the field leaf gate.
A modified version of the Ville monte equation was used to describe the drowned flow reduction factor forthe Anntec overshot gate. Different entrance contraction ratios (BiB I) did not appear to affect the valuesof n or A in Equation 11. Equations 11, 15, and 16 can be used to describe the drowned flow reductionfactor of the Anntec gate with an average error of -0.11% and a standard deviation of 4.08%. The highstandard deviation is a result of Equation II's inability to perfectly follow the data points from thesubmergence calibrations (see Figure 13). Brater and King (1976) also report that Villemonte's equationdid not exact1y fit the data obtained from vertical sharp-crested weirs. Thus, if a high degree of accuracyis needed, Brater and King (1976) recommend that each particular gate be tested in a laboratory underconditions similar to those in the field.
No literature was available for calibration tests done on submerged inclined sharp-crested weirs and nosubmergence tests were performed on theUSWCL gate. However, tests were performed in the field.These tests were carried out in a manner similar to those done in the laboratory; however, only a limitednumber of submergence ratios were obtained because of the difficulty in controlling the downstream watersurface.
21
Like the unsubmerged case, the errors due to rounding of the crest and interference from the side seals ofthe submerged gate are negligible because of the large heads encountered in the field. The followingequation was used to calculate the discharge for a submerged overshot gate in the field:
Q = C,qCaC.t.J2g (he+ KbXht + K"rs [18]
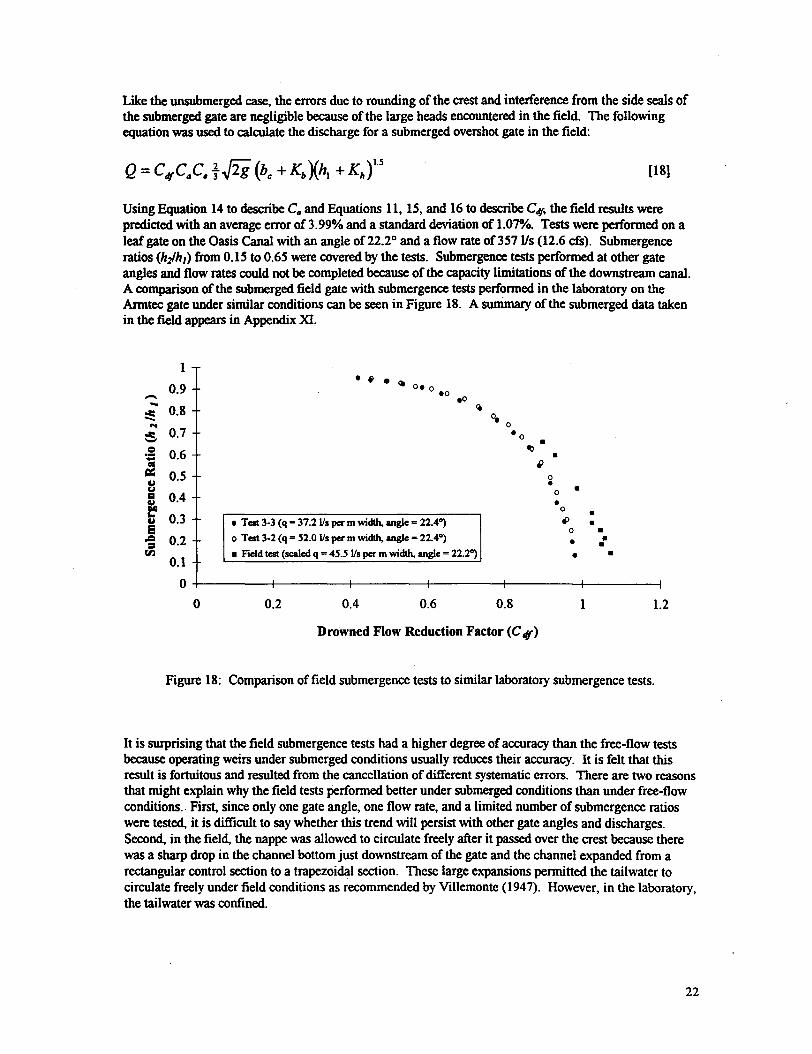
Using Equation 14 to describe CIIand Equations 11, IS, and 16 to describe Cdf,the field results werepredicted with an average error of 3.99010and a standard deviation of 1.07%. Tests were performed on aleaf gate on the Oasis Canal with an angle of 22.20 and a flow rate of 357 Us (12.6 cfs). Submergenceratios (hih1) from 0.15 to 0.65 were covered by the tests. Submergence tests performed at other gateangles and flow rates could not be completed because of the capacity limitations of the downstream canal.A comparison of the submerged field gate with submergence tests performed in the laboratory on theArmtec gate under similar conditions can be seen in Figure 18. A sunimary of the submerged data takenin the field appears in Appendix XI.
1
0.9-.; 0.8-.; 0.7-~ 0.612~
0.5CJ
5 0.4~~ 0.3E1 0.2{I)
0.1
0
0
. ~ .~ o. 0
.0 .0..
<>e0.0 .~ .
~
. Test 3-3 (q -37.21/s per m width, U1g1e = 22.4")
0 Test 3-2 (q= S2.0 I/s per m width, U1gIe - 22.4")
. Field test (scaled q = 4S.S I/s per m width, U1g1e = 22.2")
0. 0 ..0.,
0.
...... .
0.2 0.4 0.6 0.8 1 1.2
Drowned Flow Reduction Factor (C".)
Figure 18: Comparison offield submergence tests to similar laboratory submergence tests.
It is surprising that the field submergence tests had a higher degree of accuracy than the free-flow testsbecause operating weirs under submerged conditions usually reduces their accuracy. It is felt that thisresult is fortuitous and resulted from the cancellation of different systematic errors. There are two reasonsthat might explain why the field tests performed better under submerged conditions than under free-flowconditions.. First, since only one gate angle, one flow rate, and a limited number of submergence ratioswere tested, it is difficult to say whether this trend will persist with other gate angles and discharges.Second, in the field, the nappe was allowed to circulate freely after it passed over the crest because therewas a sharp drop in the channel bottom just downstream of the gate and the channel expanded from arectangular control section to a trapezoidal section. These large expansions permitted the tailwater tocirculate freely under field conditions as recommended by Villemonte (1947). However, in the laboratory,the tailwater was confined.
22
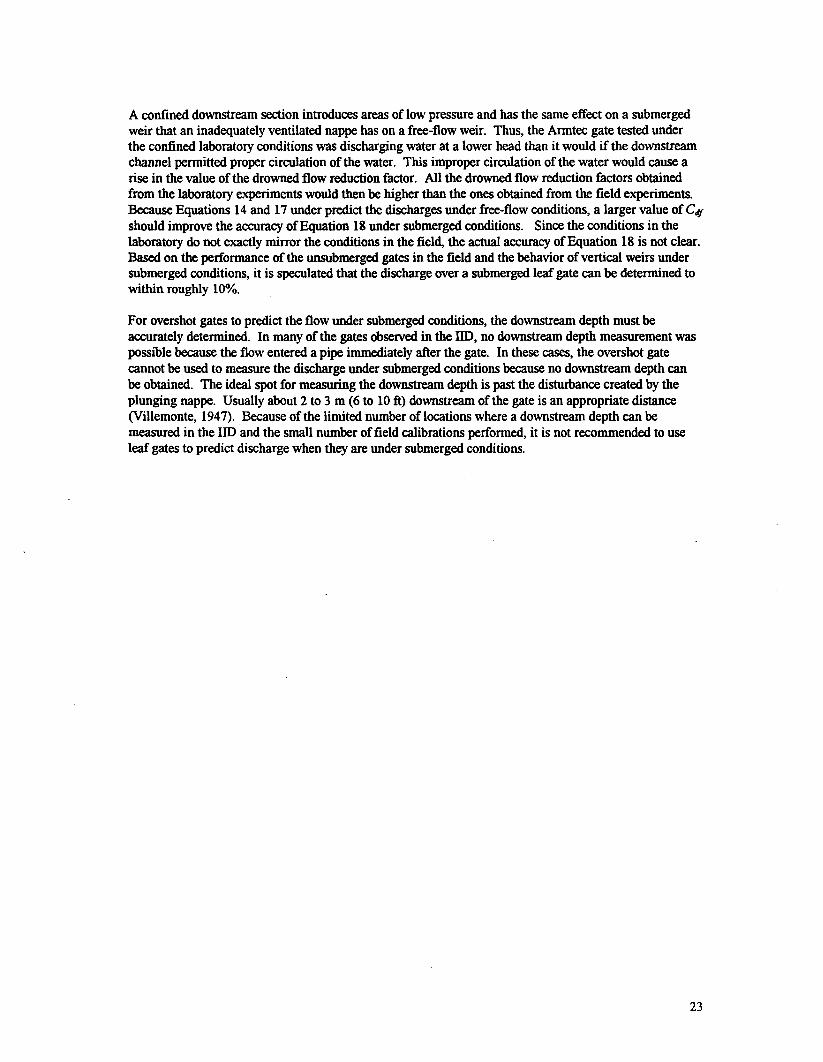
A confined downstream section introduces areas of low pressure and has the same effect on a submergedweir that an inadequately ventilated nappe has on a free-flow weir. Thus, the Armtec gate tested underthe confined laboratory conditions was discharging water at a lower head than it would if the downstreamchannel permitted proper circulation of the water. This improper circulation of the water would cause arise in the value of the drowned flow reduction factor. All the drowned flow reduction factors obtainedfrom the laboratory experiments would then be higher than the ones obtained from the field experiments.Because Equations 14 and 17 under predict the discharges under free-flow conditions, a larger value of Cdfshould improve the accuracy of Equation 18 under submerged conditions. Since the conditions in thelaboratory do not exactly mirror the conditions in the field. the actual accuracy of Equation 18 is not clear.Based on the performance of the unsubmerged gates in the field and the behavior of vertical weirs undersubmerged conditions, it is speculated that the discharge over a submerged leaf gate can be determined towithin roughly 10%.
For overshot gates to predict the flow under submerged conditions, the downstream depth must beaccurately determined. In many of the gates observed in the IID, no downstream depth measurement waspossible because the flow entered a pipe immediately after the gate. In these cases, the overshot gatecannot be used to measure the discharge under submerged conditions because no downstream depth canbe obtained. The ideal spot for measuring the downstream depth is past the disturbance created by theplunging nappe. Usually about 2 to 3 m (6 to 10 ft) downstream of the gate is an appropriate distance(Villemonte,1947). Because of the limited number of locations where a downstream depth can bemeasured in the lID and the small number of field calibrations performed, it is not recommended to useleaf gates to predict discharge when they are under submerged conditions.
23
CONCLUSIONS
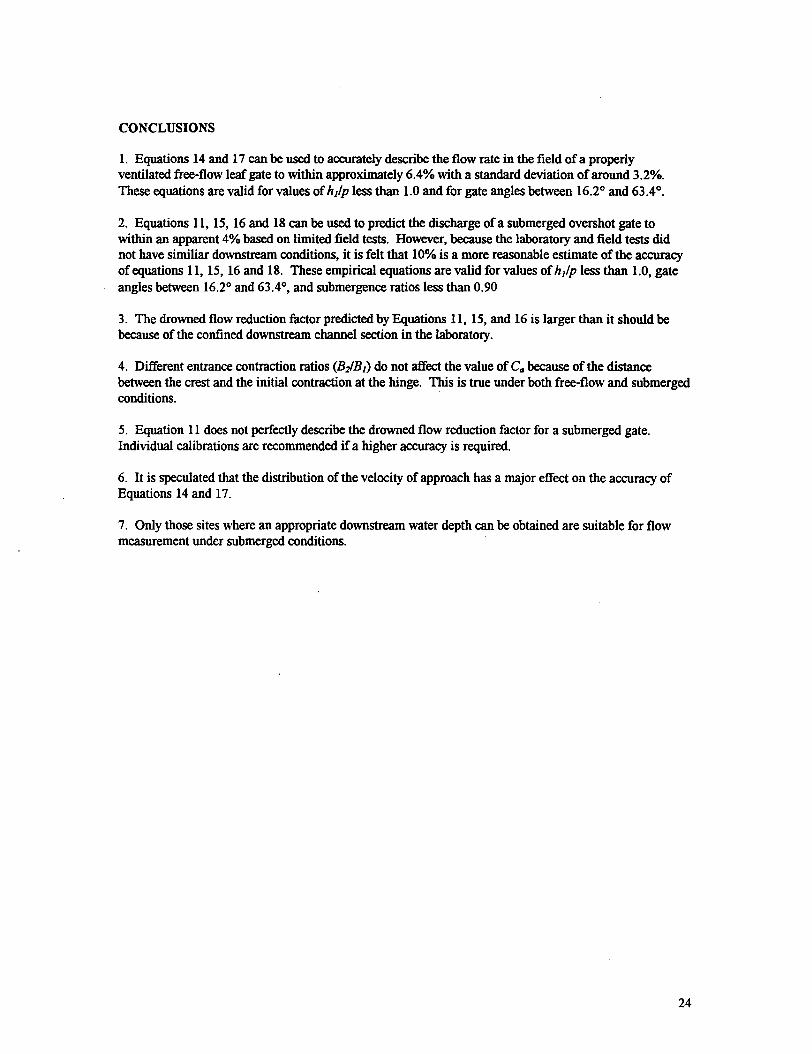
1. Equations 14 and 17 can be used to accurately describe the flow rate in the field of a properlyventilated free-flow leaf gate to within approximately 6.4% with a standard deviation of around 3.2%.These equations are valid for values of hip less than 1.0 and for gate angles between 16.2° and 63.4°.
2. Equations 11,15, 16 and 18 can be used to predict the discharge of a submerged overshot gate towithin an apparent 4% based on limited field tests. However, because the laboratory and field tests didnot have similiar downstream conditions, it is felt that 10% is a more reasonable estimate of the accuracyof equations 11, 15, 16 and 18. These empirical equations are valid for values of hip less than 1.0, gateangles between 16.2° and 63.4°, and submergence ratios less than 0.90
3. The drowned flow reduction factor predicted by Equations 11, 15, and 16 is larger than it should bebecause of the confined downstream channel section in the laboratory.
4. Different entrance contraction ratios (BJB 1) do not affect the value of CQbecause of the distancebetween the crest and the initial contraction at the hinge. This is true under both free-flow and submergedconditions.
5. Equation 11 does not perfectly describe the drowned flow reduction factor for a submerged gate.Individual calibrations are recommended if a higher accuracy is required.
6. It is speculated that the distribution of the velocity of approach has a major effect on the accuracy ofEquations 14 and 17.
7. Only those sites where an appropriate downstream water depth can be obtained are suitable for flowmeasurement under submerged conditions.
24
APPENDIX L REFERENCES
Ackers, P., White, W.R, Perkins, lA., and Harrison, A.I (1978). Weirs and Flumes/or FlowMeasurement. John Wiley & Sons, New York. 316 pp.
Bos, M.G. (1989). Discharge Measurement Structures. Publication No. 20, 3rd ed. InternationalInstitute for Land Reclamation and Improvement, Wageningen, The Netherlands. 401 pp.
Brater, E.F., and King, H.W. (1976). Handbook o/Hydraulics. 6th ed. McGraw-Hili, New York. 584pp.
Horton, Robert E. (1907). Weir Experiments, Coefficients, and Fonnulas. Water-Supply and IrrigationPaper No. 200, US Geological Swvey, 195 pp.
Kindsvater, C.E., and Carter, R W. (1959). "Discharge Characteristics of Rectangular Thin-PlateWeirs." Trans. Am. Soc. Civil Engrs., Vol. 124, p. 772-822.
"Overshot Gate: Simple but Effective." (August, 1990). Municipal and Industrial Water and PollutionControl, Vol. 128, p. 21-22.
Rouse, Hunter. (April, 1936). "Discharge Characteristics of the Free Overfall." Civil Engineering, Vol.6, p. 257-260.
Schader, E.W., and Turner, K.B. (1929). "Precise Weir Measurements." Trans. Am. Soc. Civil Engrs.,Vol. 93, p. 999-1110.
USBR (1948). Studies o/Crests/or Over/all Dams. Bulletin 3. Boulder Canyon Project, Final Report.US Bureau of Reclamation, US Dept. ofInterior, Denver, CO. 186 pp.
Villemonte, J.R (December 25,1947). "Submerged Weir Discharge Studies." Engineering NewsRecord, p. 866-869.

APPENDIX n. GLOSSARY
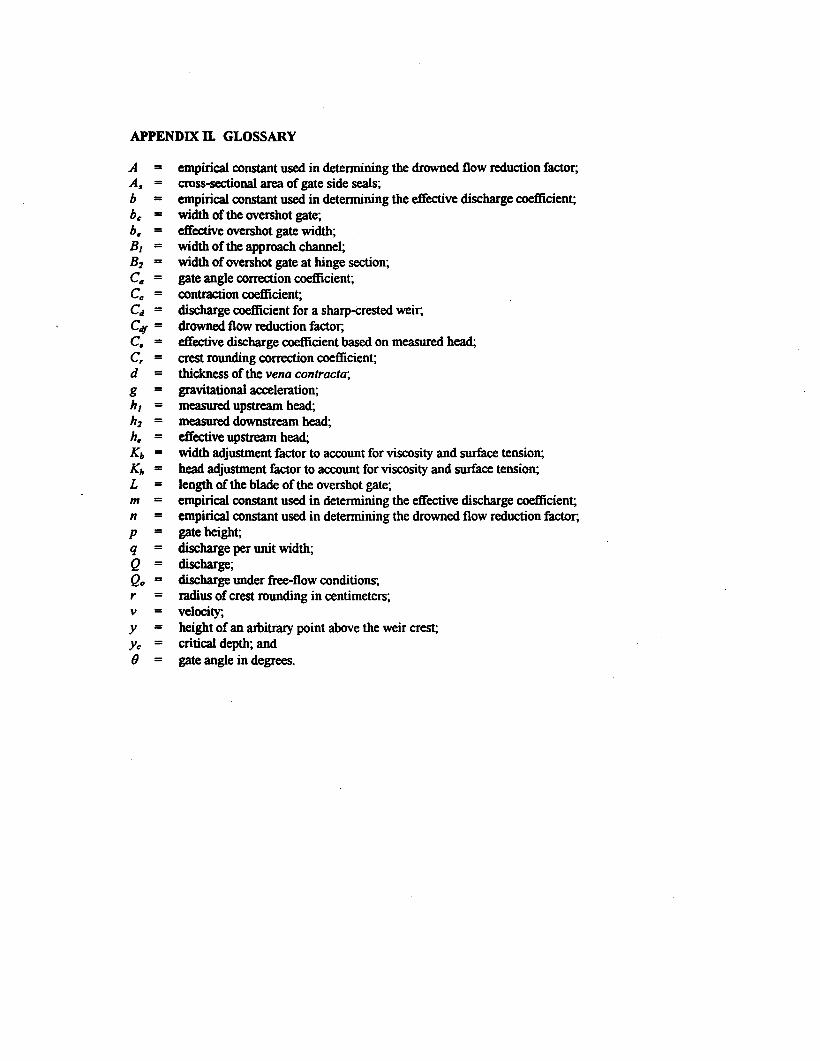
A = empirical constant used in determining the drowned flow reduction factor;A6 = cross-sectional area of gate side seals;b = empirical constant used in determining the effective discharge coefficient;be = width of the overshot gate;b. = effective overshot gate width;B 1 = width of the approach channel;B2 = width of overshot gate at hinge section;CII = gate angle correction coefficient;Ce = contractioncoefficient;Cd = discharge coefficient for a sharp-Crested weir;Ctif = drownedflowreductionfactor;C. = effective discharge coefficient based on measured head;Cr = crest rounding correction coefficient;d = thickness of the vena contracta;g = gravitationalacceleration;hI = measuredupstreamhead;h2 = measureddownstreamhead;h. = effective upstream head;
K" = width adjustment factor to account for viscosity and surface tension;Kit = head adjustment factor to account for viscosity and surface tension;L = length of the blade of the overshot gate;m = empirical constant used in determining the effective discharge coefficient;n = empirical constant used in determining the drownedflow reductionfactor;p = gate height;q = dischargeper unit width;Q = discharge;Qo = dischargeunder free-flowconditions;r = radius of crest rounding in centimeters;v = velocity;y = heightofan arbitI'alypointabovetheweircrest;Ye = critical depth; and(J = gateanglein degrees.

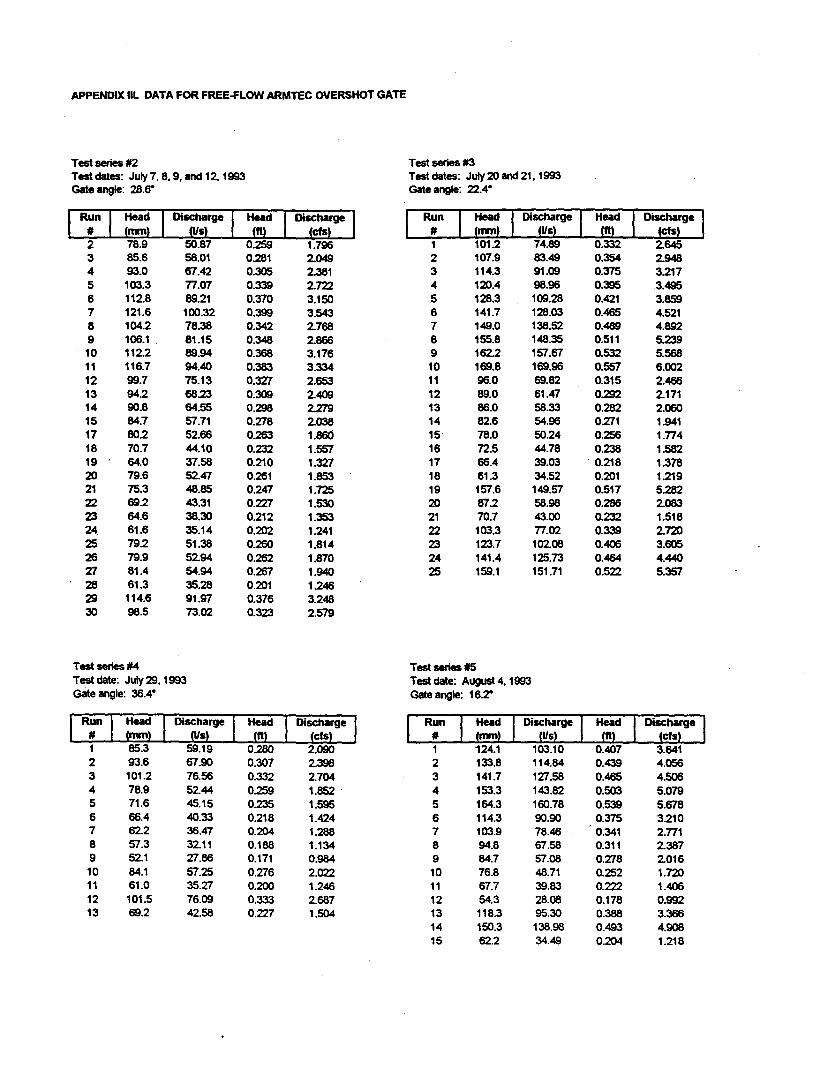
Test series iI2 Test series t3Test dates: July 7,8,9, and 12, 1993 Test dates: July 20 and 21, 1993Gate angle: 28.~ Gate angle: 22.4"
~HeadI
~~:rgeI
Head
I
~scharge
I I
Run
I
Head
I
Discharge
I
Head
I
Discharge
I(nwn) (ft) (cfs) # (nwn) (115) (ft) (cfs)
2 78.9 50.87 0.259 1.796 1 101.2 74.89 0.332 2.6453 85.6 58.01 0.281 2.049 2 107.9 83.49 0.354 2.9484 93.0 67.42 0.305 2.381 3 114.3 91.09 0.375 3.2175 103.3 77.07 0.339 2.722 4 120.4 98.96 0.395 3.4956 112.8 89.21 0.370 3.150 5 128.3 109.28 0.421 3.8597 121.6 100.32 0.399 3.543 6 141.7 128.03 0.465 4.5218 104.2 78.38 0.342 2.768 7 149.0 138.52 0.489 4.8929 106.1 81.15 0.348 2.866 8 155.8 148.35 0.511 5.23910 112.2 89.94 0.368 3.176 9 162.2 157.67 0.532 5.56811 116.7 94.40 0.383 3.334 10 169.8 169.96 0.557 6.00212 99.7 75.13 0.327 2.653 11 96.0 69.82 0.315 2.416613 94.2 68.23 0.309 2.409 12 89.0 61.47 0.292 2.17114 90.8 64.55 0.298 2.279 13 86.0 58.33 0.282 2.06015 84.7 57.71 0.278 2.038 14 82.6 54.96 0.271 1.94117 80.2 52.66 0.263 1.860 15 78.0 50.24 0.256 1.77418 70.7 44.10 0.232 1.557 16 12.5 44.78 0.238 1.58219 64.0 37.58 0.210 1.327 17 66.4 39.03 0.218 1.37820 79.6 52.47 0.261 1.853 18 61.3 34.52 0.201 1.21921 75.3 48.85 0.247 1.725 19 157.6 149.57 0.517 5.28222 69.2 43.31 0.227 1.530 20 87.2 58.98 0.286 2.08323 64.6 38.30 0.212 1.353 21 70.7 43.00 0.232 1.51824 61.6 35.14 0.202 1.241 22 103.3 77.02 0.339 2.72025 79.2 51.38 0.260 1.814 23 123.7 102.08 0.406 3.60526 79.9 52.94 0.262 1.870 24 141.4 125.73 0.464 4.44027 81.4 54.94 0.267 1.940 25 159.1 151.71 0.522 5.35728 61.3 35.28 0.201 1.24629 114.6 91.97 0.376 3.24830 98.5 73.02 0.323 2.579
APPENDIX III. DATA FOR FREE-FLOW ARMTEC OVERSHOT GATE
Test series #4Testdate: July 29, 1993Gate angle: 36.4"
~12345678910111213
Head1
DischargeI
(nwn) (115)85.3 59.1993.6 67.90101.2 76.5678.9 52.4471.6 45.1566.4 40.3362.2 36.4757.3 32.1152.1 27.8684.1 57.2561.0 35.27101.5 76.0969.2 42.58
Test series #5Test date: August 4,1993Gate angle: 16.2"
HeadI
Discharge
I(ft) (cfs)
0.280 2.0900.307 2.3980.332 2.7040.259 1.852 .
0.235 1.5950.218 1.4240.204 1.2880.188 1.1340.171 0.9840.276 2.0220.200 1.2460.333 2.6870.227 1.504
IR~n
123456789101112131415
1=124.1133.8141.7153.3164.3114.3
. 103.994.884.776.867.754.3118.3150.362.2
IDi~:~rge
I103.10114.84127.58143.82160.7890.9078.4667.5857.0848.7139.8328.0895.30138.9834.49
Head(ft)
0.4070.4390.4650.5030.5390.3750.3410.3110.2780.2520.2220.1780.3880.4930.204
I
Discharge
I(cIs)
3.6414.0564.5065.0795.6783.2102.7712.3872.0161.7201.4060.9923.3664.9081.218
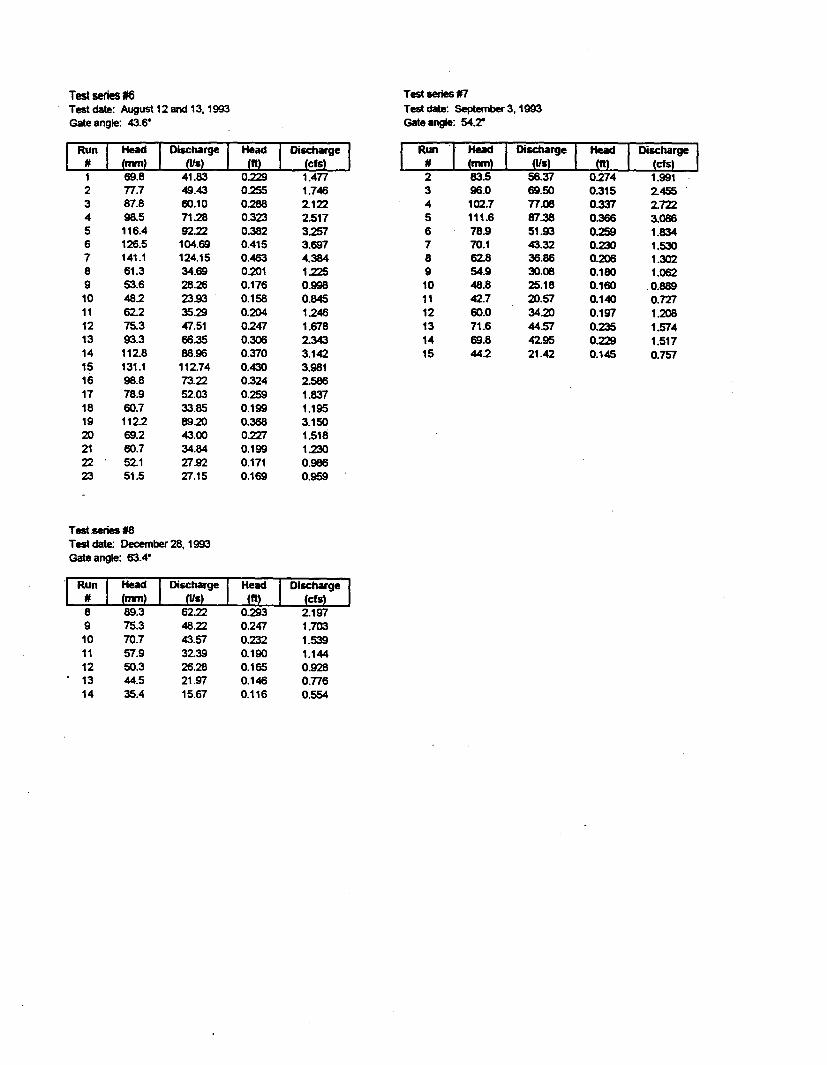
Test series 16Test date: August 12 and 13, 1993Gate angle: 43.6"
~12345678910111213141516171819202122'23
HeadI
DischargeI
Head(nml (usl (It)69.8 41.83 0.22977.7 49.43 0.25587.8 60.10 0.28898.5 71.28 0.323116.4 92.22 0.382126.5 104.69 0.415141.1 124.15 0.46361.3 34.69 0.20153.6 28.26 0.176482 23.93 0.15862.2 35.29 0.20475.3 47.51 024793.3 66.35 0.306112.8 88.96 0.370131.1 112.74 0.43098.8 73.22 0.32478.9 52.03 0.25960.7 33.85 0.199112.2 89.20 0.36869.2 43.00 0.22760.7 34.84 0.19952.1 XT.92 0.17151.5 XT.15 0.169
Test.series #8Test date: December 28, 1993Gate angle: 63.4"
.~89101112. 1314
I
Discharge
I(cfs)1.4771.7462.1222.5173.2573.6974.3841.2250.9980.84512461.6782.3433.1423.9812.5861.8371.1953.1501.5181.2300.9860.959
HeadI
DischargeI
(nm) (Usl89.3 62.2275.3 48.2270.7 43.5757.9 32.3950.3 26.2844.5 21.9735.4 15.67
Head1
Discharge
I(It) (cfs)
0.293 2.1970.247 1.7030.232 1.5390.190 1.1440.165 0.9280.146 0.7760.116 0.554
Test series tI7Test date: September3,1993Gate angle: 54.T
I
R;"
23456789101112131415
1=83.596.0102.7111.678.970.162.854.948.842.760.071.669.8442
I
Dis::rge1
56.3769.5077.0887.3851.9343.3236.8630.0825.1820.5734.2044.5742.9521.42
HeadI
DischargeI
(It) (cfs)
0.274 1.991.0.315 2.4550.337 2.7220.366 3.0860.259 1.8340.230 1.5300.206 1.3020.180 1.0620.160 0.8890.140 0.7270.197 1.2080.235 1.5740.229 1.5170.145 0.757
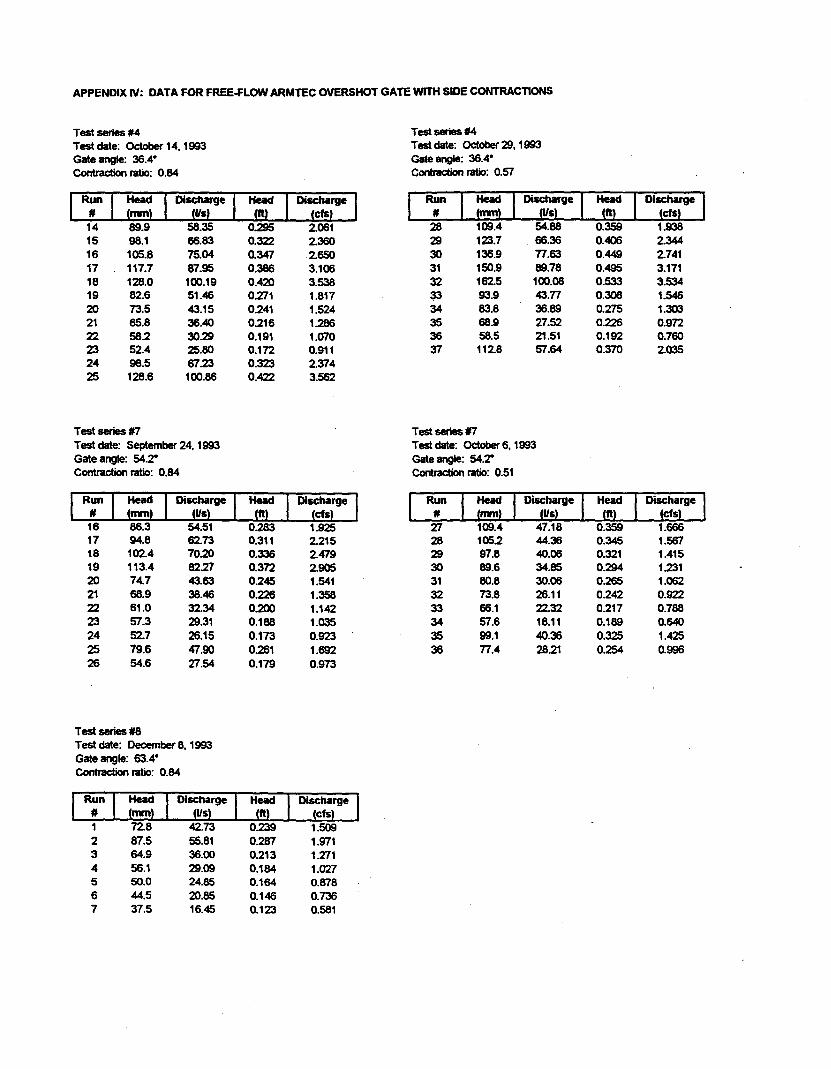
APPENDIX IV: DATA FOR FREE-FLOW ARMTEC OVERSHOT GATE WITH SIDE CONTRACTIONS
Test series tMTest date: October 14,1993Gate angle: 36.4-Contraction ratio: 0.84
~141516171819202122232425
:::;I
~-:rgeI
89.9 58.3598.1 66.83105.8 75.04117.7 87.95128.0 100.1982.6 51.4673.5 43.1565.8 36.4058.2 30.2952.4 25.8098.5 67.23128.6 100.86
Test series #7Test date: September 24, 1993Gate angle: 54.TContraction ratio: 0.84
~1617181920212223242526
HeadI
~schargeI(nm) (Us)
86.3 54.5194.8 62.13102.4 70.20113.4 82.2774.7 43.6368.9 38.4661.0 32.3457.3 29.3152.7 26.1579.6 47.9054.6 27.54
Test series #8Test date: December 8, 1993Gate angle: 63.4-Contraction ratio: 0.84
~1234567
HeadI
DischargeI
(nm) (115)
72.8 42.1387.5 55.8164.9 36.0056.1 29.0950.0 24.8544.5 20.8537.5 16.45
Head
I
~schargeI(11) (cfs)
0.295 2.0610.322 2.3600.347 2.6500.386 3.1060.420 3.5380.271 1.8170.241 1.5240.216 1.2860.191 1.0700.172 0.9110.323 2.3740.422 3.562
Head
I
Discharge
I(It) (cfs)
0.283 1.9250.311 2.2150.336 2.4790.372 2.9050.245 1.5410.226 1.3580.200 1.1420.188 1.0350.113 0.9230.261 1.6920.179 0.973
Head
I
Discharge
I(It) (cfs)
0.239 1.5090.287 1.9710.213 1.2710.184 1.0270.164 0.8780.146 0.7360.123 0.581
Test series tMTestdate: October29,1993Gate angle: 36.4-Contraction ratio: 0.57
I
Discharge1
(115)
54.8866.3677.6389.78100.0843.7736.8927.5221.5157.64
IR;n
28293031323334353637
1:=109.4123.7136.9150.9162.593.983.868.958.5112.8
Test series #7Testdate: October6,1993Gate angle: 54.TContraction ratio: 0.51
1
~n27282930313233343536
1=109.4105.297.889.680.813.866.157.699.177.4
IDiS:s~e
I
47.1844.3640.0634.8530.0626.1122.3218.1140.3628.21
HeadI
DischargeI(It) (cfs)
0.359 1.9380.406 2.3440.449 2.7410.495 3.1710.533 3.5340.308 1.5460.275 1.3030.226 0.9720.192 0.7600.370 2.035
Head1
Discharge
I(It) (cfs)
0.359 1.6660.345 1.5670.321 1.4150.294 1.2310.265 1.0620.242 0.9220.217 0.7880.189 0.6400.325 1.4250.254 0.996
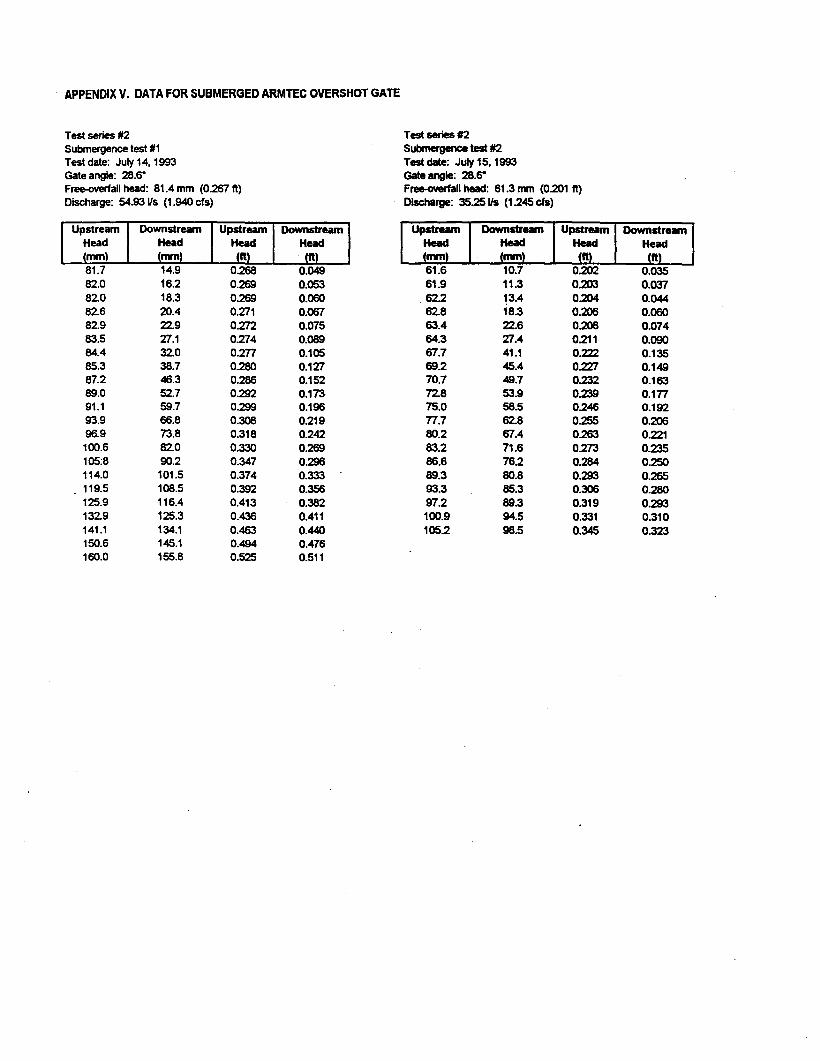
APPENDIX V. DATA FOR SUBMERGED ARMTEC OVERSHOT GATE
Test series #2Submergence test #1Test date: July 14, 1993Gate angle: 28.6"Free-overfall head: 81.4 mm (0.267 ft)Discharge: 54.93 Vs (1.940 cfs)
UpstreamHeadmm81.782.082082.682983.584.485.387.289.091.193.996.9100.6105:8114.0
. 119.5125.91329141.1150.6160.0
DownstreamHeadmm14.916.218.320.422.927.132038.746.352759.766.873.882.090.2
101.5108.5116.4125.3134.1145.1155.8
UpstreamHead
ft0.2680.2690.2690.2710.2720.2740.2770.2800.2860.2920.2990.3080.3180.3300.3470.3740.3920.4130.4360.4630.4940.525
DownstreamHead
ft0.0490.0530.0600.0670.0750.0890.1050.1270.1520.1730.1960.2190.2420.2690.2960.333 .
0.3560.3820.4110.4400.4760.511
Test series #2Submergence test #2Test date: July 15,1993Gate angle: 28.S-Free-overfallhead: 61.3 mm (0.201 ft)Discharge: 35.25 Vs (1.245 cfs)
1"=161.661.962.262.863.464.367.769.270.772.875.077.780.283.286.689.393.397.2100.9105.2
DownstreamHead(mm)10.711.313.418.322.627.441.145.449.753.958.562.867.471.676.280.885.389.394.598.5
1"=1-=-1(ft) (ft)
0.202 0.0350.203 0.0370.204 0.0440.206 0.0600.208 0.0740.211 0.0900.222 0.1350.227 0.1490.232 0.1630.239 0.1770.246 0.1920.255 0.2060.263 0.2210.273 0.2350.284 0.2500.293 0.2650.306 0.2800.319 0.2930.331 0.3100.345 0.323
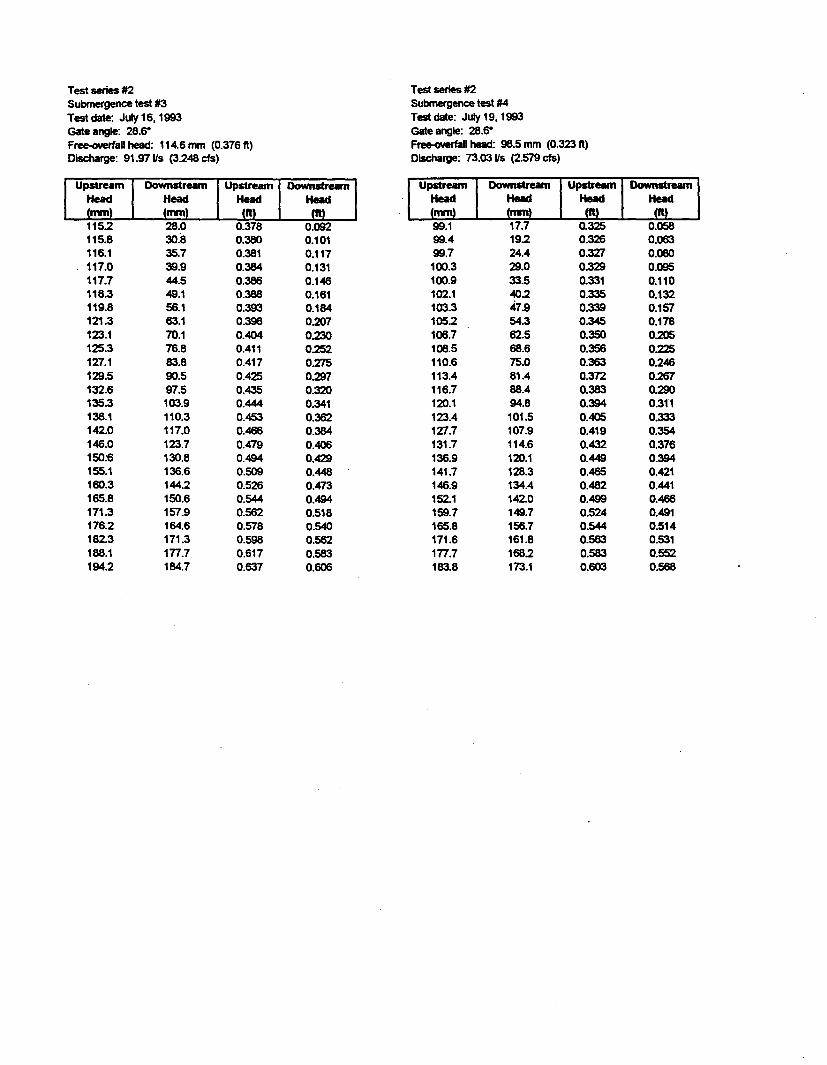
Test series #2Submergence test #3
Test date: July 16, 1993
Gate angle: 28.6"
Free-overfall head: 114.6 mm (0.376 ft)Discharge: 91.97 Us (3.248 cfs)
Test series #2Submergence test #4
Testdate: July 19,1993
Gate angle: 28.6"Free-overfall head: 98.5 mm (0.323 ft)Discharge: 73.03 Us (2.579 cfs)
1"=1(mm)
115.2115.8116.1
. 117.0117.7118.3119.8121.3123.1125.3127.1129.5132.6135.3138.1142.0146.0150:6155.1160.3165.8171.3176.2182.3188.1194.2
DownstreamHead(mm)
28.030.835.739.944.549.156.163.170.176.883.890.597.5103.9110.3117.0123.7130.8136.6144.2150.6157.9164.6171.3177.7184.7
1"=1-=-1(It) (It)
0.378 0.0920.380 0.1010.381 0.1170.384 0.1310.386 0.1460.388 0.1610.393 0.1840.398 0.2070.404 0.2300.411 0.2520.417 0.2750.425 0.2970.435 0.3200.444 0.3410.453 0.3620.466 0.3840.479 0.4060.494 0.4290.509 0.4480.526 0.4730.544 0.4940.562 0.5180.578 0.5400.598 0.5620.617 0.5830.637 0.606
I"E"I99.199.499.7100.3100.9102.1103.3105.2106.7108.5110.6113.4116.7120.1123.4127.7131.7136.9141.7146.9152.1159.7165.8171.6177.7183.8
DownstreamHead(mm)17.719.224.429.033.540.247.954.362.568.675.081.488.494.8101.5107.9114.6120.1128.3134.4142.0149.7156.7161.8168.2173.1
1""=1-=-1(It) (It)
0.325 0.0580.326 0.0630.327 0.0800.329 0.0950.331 0.1100.335 0.1320.339 0.1570.345 0.1780.350 0.2050.356 0.2250.363 0.2460.372 0.2670.383 0.2900.394 0.3110.405 0.3330.419 0.3540.432 0.3760.449 0.3940.465 0.4210.482 0.4410.499 0.4660.524 0.4910.544 0.5140.563 0.5310.583 0.5520.603 0.568
Test series #3 Test series #3
Submergence test #1 Submergence test#2Testdate: July 22,1993 Test date: July 23,1993Gate angle: 22.4. Gate angle: 22.4.Free-overfallhead: 157.6 mm (0.517 It) Fre4HM!rlallhead: fiT.2 mm (0.286 It)Discharge: 149.6115 (5.282 cfs) Discharge: 58.98 Us (2.083 cfs)
Upstream Downstream Upstream Downstream
r=1Downstream
I"VI~IHead Head Head Head Headrnn rnn ft ft (mm)
158.2 49.1 0.519 0.161 fiT.8 21.9 0.288 0.072158.2 SO.6 0.519 0.166 88.4 26.5 0.290 0.087158.8 56.4 0.521 0.185 89.0 31.1 0.292 0.102159.1 61.6 0.522 0.202 89.9 38.1 0.295 0.125160.3 67.7 0.526 0.222 91.1 45.1 0.299 0.148161.2 74.1 0.529 0.243 92.7 52.1 0.304 0.171162.5 80.8 0.533 0.265 94.2 58.8 0.309 0.193163.7 88.1 0.537 0.289 96.0. 65.5 0.315 0.215165.2 95.1 0.542 0.312 98.8 72.5 0.324 0.238166.4 101.8 0.546 0.334 101.8 78.9 0.334 0.259168.6 108.5 0.553 0.356 105.5 86.0 0.346 0.282171.3 118.6 0.562 0.389 109.1 93.0 0.358 0.305174.3 127.4 0.572 0.418 114.0 100.3 0.374 0.329178.0 137.2 0.584 0.450 118.6 107.0 0.389 0.351182.6 147.8 0.599 0.485 124.1 113.4 0.407 0.372186.2 153.3 0.611 0.503 129.8 120.1 0.426 0.394189.3 160.3 0.621 0.526 135.6 127.1 0.445 0.417193:5 167.3 0.635 0.549 143.3 135.6 0.470 0.445197.8 174.3 0.649 0.572
.204.2 183.2 0.670 0.601211.2 192.6 0.693 0.632217.3 202.1 0.713 0.663226.5 211.5 0.743 0.694232.9 221.6 0.764 0.727242.3 230.4 0.795 0.756
Test series #3 Test series #3Submergence test #3 Submergence test #4Test date: July 23, 1993 Test date: July 26, 1993Gate angle: 22.4. Gate angle: 22.4.Free-overfallhead: 70.7 mm (0.232 It) Free-overfallhead: 103.3 mm (0.339 ft)Discharge: 42.99115 (1.518 cfs) Discharge: 77.02115 (2.720 cfs)
Upstream Downstream Upstream Downstream
I"=1 Downstream I"VI~IHead Head Head Head Head
mm mm ft ft (rnn) (rnn)
71.0 9.4 0.233 0.031 103.9 25.0 0.341 0.08271.3 14.0 0.234 0.046 104.2 29.9 0.342 0.09872.2 20.7 0.237 0.068 105.2 37.2 0.345 0.12273.2 27.4 0.240 0.090 106.1 44.2 0.348 0.14574.1 34.7 0.243 0.114 107.3 51.8 0.352 0.17075.6 41.5 0.248 0.136 . 108.5 58.2 0.356 0.19177.1 48.8. 0.253 0.160 110.0 64.9 0.361 0.21379.6 55.5 0.261 0.182 111.6 71.9 0.366 0.23682.3 62.5 0.270 0.205 114.0 78.9 0.374 0.25985.6 69.2 0.281 0.227 116.4 86.0 0.382 0.28289.9 76.2 0.295 0.250 119.2 93.0 0.391 0.30594.2 82.9 0.309 0.272 122.8 100.0 0.403 0.32899.4 90.2 0.326 0.296 127.1 107.0 0.417 0.351105.2 96.9 0.345 0.318 131.1 113.4 0.430 0.372110.9 103.9 0.364 0.341 137.8 123.1 0.452 0.404117.0 110.3 0.384 0.362 144.8 131.7 0.475 0.432123.1 117.3 0.404 0.385 152.4 141.1 0.500 0.463
159.4 149.4 0.523 0.490167.3 157.6 0.549 0.517175.3 168.2 0.575 0.552
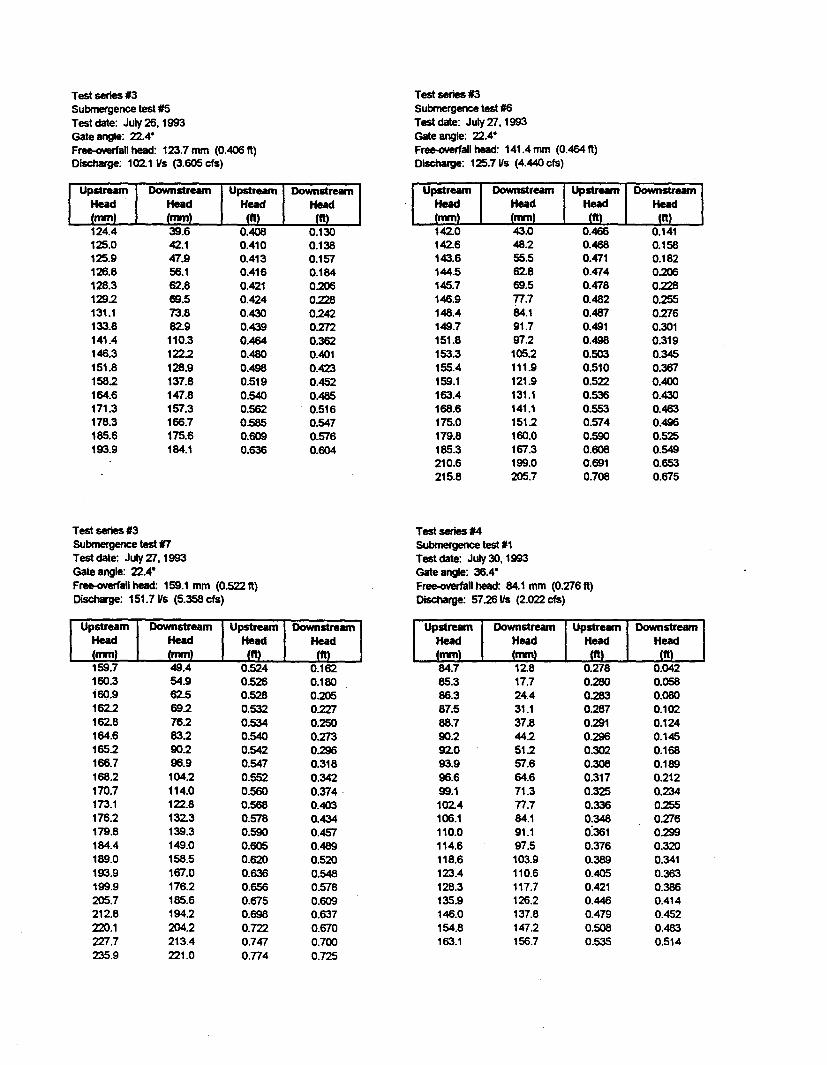
Test series #3 Test series #4Submergence test #7 Submergence test '1Test date: July 27. 1993 Test date: July 30.1993Gate angle: 22.4" Gate angle: 36.4"F~all head: 159.1 mm (0.522 ft) Free-overfanhead: 84.1 mm (0.276 ft)Discharge: 151.7 lis (5.358 Cfs) Discharge: 5726 I/s (2.022 cfs)
Upstream Downstream Upstream Downstream Upstream Downstream Upstream DownstreamHead Head Head Head Head Head Head Headnm nm ft ft nm mm ft ft
159.7 49.4 0.524 0.162 84.7 12.8 0.278 0.042160.3 54.9 0.526 0.180 85.3 17.7 0.280 0.058160.9 62.5 0.528 0.205 86.3 24.4 0.283 0.080162.2 692 0.532 0227 87.5 31.1 0.287 0.102162.8 76.2 0.534 0250 88.7 37.8 0.291 0.124164.6 832 0.540 0.273 90.2 44.2 0.296 0.145165.2 90.2 0.542 0.296 92.0 512 0.302 0.168166.7 96.9 0.547 0.318 93.9 57.6 0.308 0.189168.2 104.2 0.552 0.342 96.6 64.6 0.317 0.212170.7 114.0 0.560 0.374. 99.1 71.3 0.325 0234173.1 122.8 0.568 0.403 102.4 77.7 0.336 0.255176.2 132.3 0.578 0.434 106.1 84.1 0.348 0.276179.8 139.3 0.590 0.457 110.0 91.1 0:361 0.299184.4 149.0 0.605 0.489 114.6 97.5 0.376 0.320189.0 158.5 0.620 0.520 118.6 103.9 0.389 0.341193.9 167.0 0.636 0.548 123.4 110.6 0.405 0.363199.9 176.2 0.656 0.578 128.3 117.7 0.421 0.386205.7 185.6 0.675 0.609 135.9 126.2 0.446 0.414212.8 194.2 0.698 0.637 146.0 137.8 0.479 0.452220.1 204.2 0.722 0.670 154.8 147.2 0.508 0.483227.7 213.4 0.747 0.700 163.1 156.7 0.535 0.514235.9 221.0 0.774 0.725
Test series #3Submergence test #5
Test date: July 26. 1993Gate angle: 22.4"
F~all head: 123.7 mm (0.406 ft)Discharge: 102.11/s (3.605 cfs)
I":=-I124.4125.0125.9126.8128.3129.2131.1133.8141.4146.3151.81582164.6171.3178.3185.6193.9
I"=r°-;:n
1
(ft) (ft)
0.408 0.1300.410 0.1380.413 0.1570.416 0.1840.421 0.2060.424 02280.430 0.2420.439 02720.464 0.3620.480 0.4010.498 0.4230.519 0.4520.540 0.4850.562 0.5160.585 0.5470.609 0.5760.636 0.604
Test series #3Submergence test #6
Test date: July 27.1993
Gate angle: 22.4"Free-overfall head: 141.4 mm (0.464 ft)
Discharge: 125.7I/s (4.440 cfs)
fEnI
142.0142.6143.6144.5145.7
.146.9148.4149.7151.8153.3155.4159.1163.4168.6175.0179.8185.3210.6215.8
DownstreamHad(mm)
43.048.255.562.869.577.784.191.797.21052111.9121.9131.1141.1151.2160.0167.3199.0205.7
I~I~I0.466 0.1410.468 0.1580.471 0.1820.474 02060.478 0.2280.482 0.2550.487 0.2760.491 0.3010.498 0.3190.503 0.3450.510 0.3670.522 0.4000.536 0.4300.553 0.4630.574 0.4960.590 0.5250.608 0.5490.691 0.6530.708 0.675
DownstreamHead(nm)39.642.147.956.162.869.573.882.9110.31222128.9137.8147.8157.3166.7175.6184.1
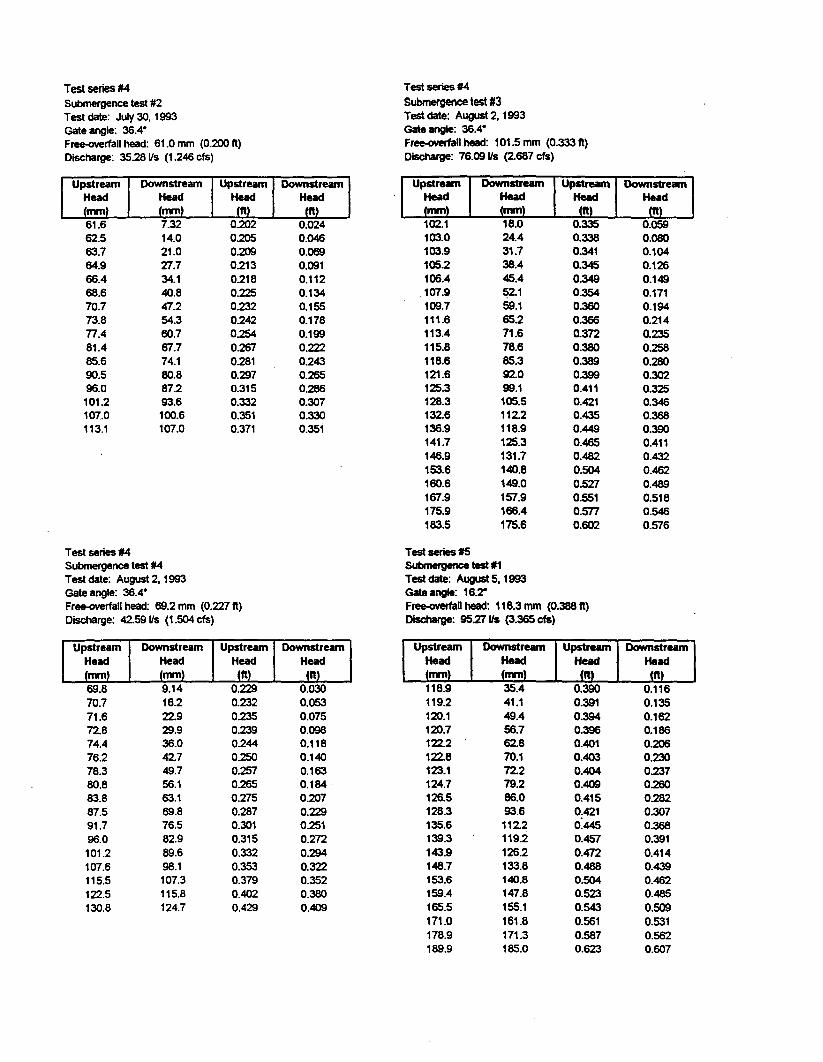
Test series#4 Test series #4
Submergence test #2 Submergence test #3
Test date: July 30, 1993 Test date: August 2, 1993Gate angle: 36.4" Gate angle: 36.4"Free-overfall head: 61.0 mm (0.200 1\) Free-overfall head: 101.5 mm (0.333 1\)Discharge: 35.28 Vs (1.246 cfs) Discharge: 76.09 Vs (2.687 cfs)
Upstream Downstream Upstream Downstream UpstreM'l Downstream Upstream DownstreamHead Head Head Head Head Head Head Headmm mm ft ft mm mm ft61.6 7.32 0.202 0.024 102.1 18.0 0.335 0.05962.5 14.0 0.205 0.046 103.0 24.4 0.338 0.08063.7 21.0 0.209 0.069 103.9 31.7 0.341 0.10464.9 27.7 0.213 0.091 105.2 38.4 0.345 0.12666.4 34.1 0.218 0.112 106.4 45.4 0.349 0.14968.6 40.8 0.225 0.134 107.9 ~1 0.354 0.17170.7 47.2 0.232 0.155 109.7 59.1 0.360 0.19413.8 54.3 0.242 0.178 111.6 65.2 0.366 0.21477.4 60.7 0.254 0.199 113.4 71.6 0.372 0.23581.4 67.7 0.267 0.222 115.8 78.6 0.380 0.25885.6 74.1 0.281 0.243 118.6 85.3 0.389 028090.5 80.8 0.297 0.265 121.6 92.0 0.399 0.30296.0 87.2 0.315 0.286 125.3 99.1 0.411 0.325101.2 93.6 0.332 0.307 128.3 105.5 0.421 0.346107.0 100.6 0.351 0.330 132.6 112.2 0.435 0.368113.1 107.0 0.371 0.351 136.9 118.9 0.449 0.390
141.7 125.3 0.465 0.411146.9 131.7 0.482 0.432153.6 140.8 0.504 0.462160.6 149.0 0.527 0.489167.9 157.9 0.551 0.518175.9 166.4 0.577 0.546183.5 175.6 0.602 0.576
Test series #4 Test series ISSubmergence test #4 Submergenc:e test .1Test date: August 2, 1993 Test date: August5,1993Gate angle: 36.4" Gate angle: 16.2"Free-overfall head: 69.2 mm (0.227 1\) Free-overfall head: 118.3 mm (0.388 1\)Discharge: 42.59 Vs (1.504 cfs) Discharge: 95.27 Vs (3.365 cfs)
Upstream Downstream Upstream Downstream Upstream Downstream Upstream DownstreamHead Head Head Head Head Head Head Headmm mm ft ft mm mm ft ft69.8 9.14 0.229 0.030 118.9 35.4 0.390 0.11670.7 16.2 0.232 0.053 119.2 41.1 0.391 0.13571.6 22.9 0.235 0.075 120.1 49.4 0.394 0.16212.8 29.9 0.239 0.098 120.7 56.7 0.396 0.18674.4 36.0 0244 0.118 122.2 62.8 0.401 0.20676.2 42.7 0.250 0.140 122.8 70.1 0.403 023078.3 49.7 0257 0.163 123.1 72.2 0.404 023780.8 56.1 0.265 0.184 124.7 79.2 0.409 0.26083.8 63.1 0.275 0.207 126.5 86.0 0.415 0.28287.5 69.8 0.287 0.229 128.3 93.6 0.421 0.30791.7 76.5 0.301 0.251 135.6 112.2 0.445 0.36896.0 82.9 0.315 0.212 139.3 119.2 0.457 0.391101.2 89.6 0.332 0.294 143.9 126.2 0.472 0.414107.6 98.1 0.353 0.322 148.7 133.8 0.488 0.439115.5 107.3 0.379 0.352 153.6 140.8 0.504 0.462122.5 115.8 0.402 0.380 159.4 147.8 0.523 0.485130.8 124.7 0.429 0.409 165.5 155.1 0.543 0.509
171.0 161.8 0.561 0.531178.9 171.3 0.587 0.562189.9 185.0 0.623 0.607
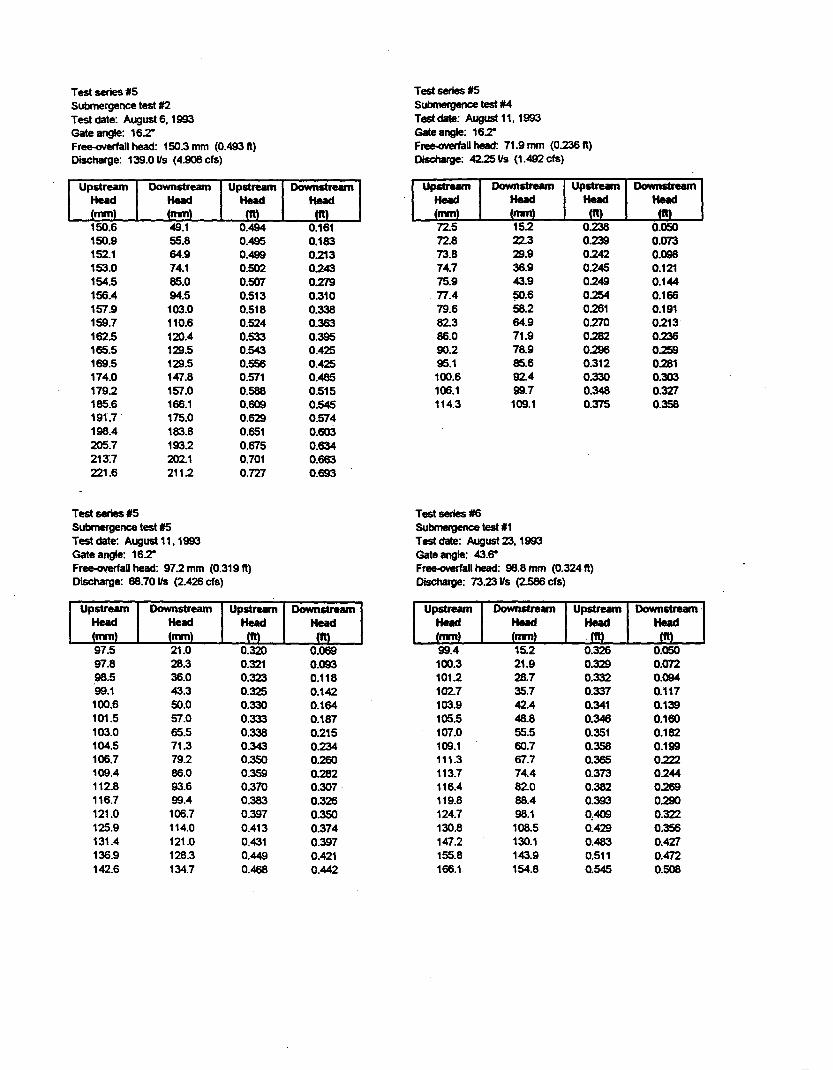
Test series #5 Test series #5Submergence test #2 Submergence test #4
Test date: August 6, 1993 Testdate: August 11,1993Gate angle: 16.T Gate angle: 16.TFree-overfallhead: 150.3 mm (0.493 ft) Free-overfall head: 71.9 mm (0.236 ft)Discharge: 139.0115 (4.908 cfs) Discharge: 42.25115 (1.492 cfs)
1"=1Downstream
I"VIDown~1 I"=-I Downstream
I"VITIHead Head(nm) (nm)
150.6 49.1 0.494 0.161 72.5 152 0.238 0.050150.9 55.8 0.495 0.183 72.8 22.3 0239 0.073152.1 64.9 0.499 0213 13.8 29.9 0.242 0.098153.0 74.1 0.502 0243 74.7 36.9 0245 0.121154.5 85.0 0.507 0.279 75.9 43.9 0249 0.144156.4 94.5 0.513 0.310 77.4 ~.6 0254 0.166157.9 103.0 0.518 0.338 19.6 58.2 0.261 0.191159.7 110.6 0.524 0.363 82.3 64.9 0.270 0213162.5 120.4 0.533 0.395 86.0 71.9 0282 0236165.5 129.5 0.543 0.425 90.2 78.9 0296 0259169.5 129.5 0.556 0.425 95.1 85.6 0.312 0.281174.0 147.8 0.571 0.485 100.6 92.4 0.330 0.303179.2 157.0 0.588 0.515 106.1 99.7 0.348 0.327185.6 166.1 0.609 0.545 114.3 109.1 0.375 0.358191'.7. 175.0 0.629 0.574198.4 183.8 0.651 0.603205.7 193.2 0.675 0.634213".7 202.1 0.701 0.663221.6 2112 0.727 0.693
Test series #5 Test series #6Submergence test #5 Submergence test #1Test date: August 11. 1993 Testdate: August 23. 1993Gate angle: 16.T Gate angle: 43.6"Free-overfallhead: 97.2 mm (0.319 ft) FnMMM!rfa1lhead: 98.8 mm (0.324 It)Discharge: 68.70 \Is (2.426 cfs) Discharge: 1323 115 (2.586 cfs)
Upstream Downstream Upstream Downstream
1=1Downstream
I"VI~IHead Head Head Head Headmm nm It (nm)
97.5 21.0 0.320 0.069 99.4 15.2 0.326 0.05097.8 28.3 0.321 0.093 100.3 21.9 0.329 0.07298.5 36.0 0.323 0.118 1012 28.7 0.332 0.09499.1 43.3 0.325 0.142 102.7 35.7 0.337 0.117100.6 50.0 0.330 0.164 103.9 42.4 0.341 0.139101.5 57.0 0.333 0.187 105.5 48.8 0.346 0.160103.0 65.5 0.338 0215 107.0 55.5 0.351 0.182104.5 71.3 0.343 0234 109.1 60.7 0.358 0.199106.7 79.2 0.350 0.260 111.3 67.7 0.365 0.222109.4 86.0 0.359 0.282 113.7 74.4 0.373 0244112.8 93.6 0.370 0.307. 116.4 82.0 0.382 0.269116.7 99.4 0.383 0.326 119.8 88.4 0.393 0290121.0 106.7 0.397 0.350 124.7 98.1 0:409 0.322125.9 114.0 0.413 0.374 130.8 108.5 0.429 0.356131.4 121.0 0.431 0.397 147.2 130.1 0.483 0.427136.9 128.3 0.449 0.421 155.8 143.9 0.511 0.472142.6 134.7 0.468 0.442 166.1 154.8 0.545 0.508
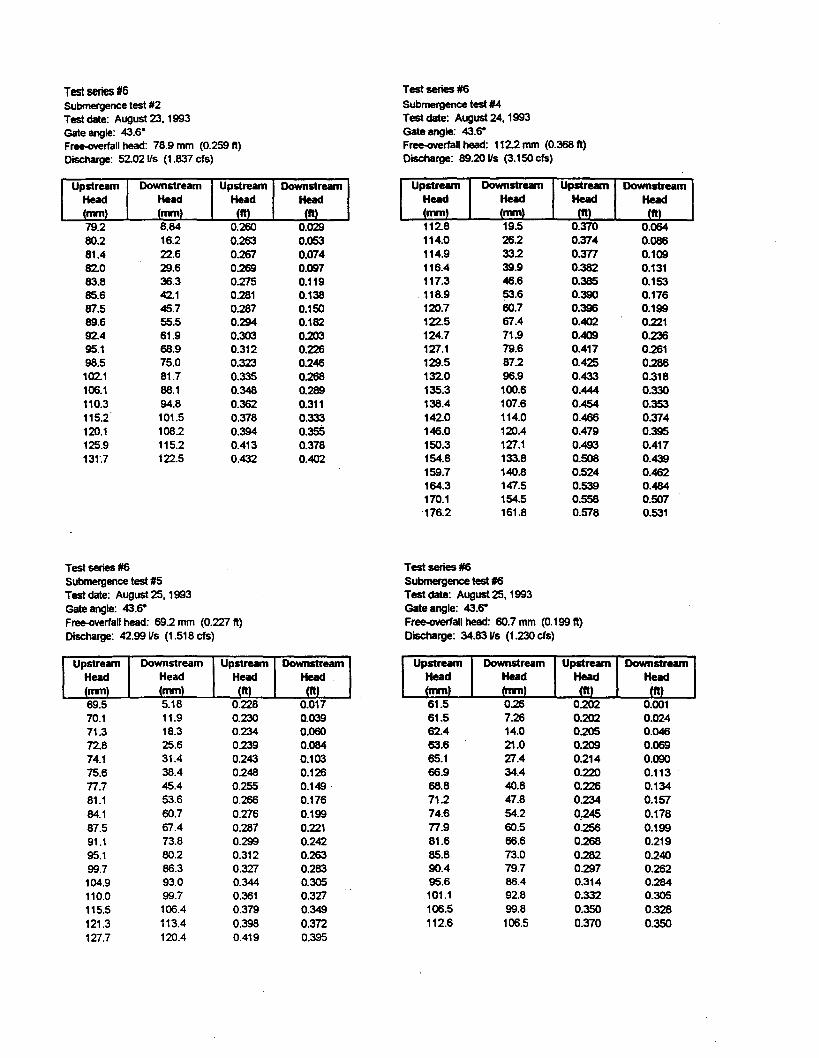
Test series tl6 Test series IS
Submergenee test #2 Submergence test #4
Test date: August23,1993 Test date: August 24,1993Gate angle: 43.6" Gate angle: 43.6"Free-overfall head: 78.9 mm (0.259 It) Free-overfall head: 112.2 mm (0.368 ft)Discharge: 52.02115 (1.837 efs) Discharge: 89.20 115(3.150 efs)
Upstream Downstream Upstream Downstream Upstream Downstream Upstream DownstreamHead Head Head Head Head Head Head Headmm mm ft ft AWn mm ft ft79.2 8.84 0.260 0.029 112.8 19.5 0.370 0.06480.2 16.2 0.263 0.053 114.0 26.2 0.374 0.08681.4 22.6 0.267 0.074 114.9 33.2 0.377 0.10982.0 29.6 0.269 0.097 116.4 39.9 0.382 0.13183.8 36.3 0.275 0.119 117.3 46.6 0.385 0.15385.6 42.1 0.281 0.138 118.9 53.6 0.390 0.17687.5 45.7 0.287 0.150 120.7 60.7 0.396 0.19989.6 55.5 0.294 0.182 122.5 67.4 0.402 0.22192.4 61.9 0.303 0.203 124.7 71.9 0.409 0.23695.1 68.9 0.312 0.226 127.1 19.6 0.417 0.26198.5 75.0 0.323 0.246 129.5 87.2 0.425 0.286102.1 81.7 0.335 0.268 132.0 96.9 0.433 0.318106.1 88.1 0.348 0.289 135.3 100.6 0.444 0.330110.3 94.8 0.362 0.311 138.4 107.6 0.454 0.353115.2 101.5 0.378 0.333 142.0 114.0 0.466 0.374120.1 108.2 0.394 0.355 146.0 120.4 0.479 0.395125.9 115.2 0.413 0.378 150.3 127.1 0.493 0.417131".7 122.5 0.432 0.402 154.8 133.8 0.508 0.439
159.7 140.8 0.524 0.462164.3 147.5 0.539 0.484170.1 154.5 0.558 0.507'176.2 161.8 0.578 0.531
Test series IS Test series ISSubmergence test #5 Submergence test #6Test date: August 25, 1993 Test date: August 25,1993Gate angle: 43.6" Gate angle: 43.6"Free-overfall head: 69.2 mm (0.227 It) Free-overfall head: 60.7 mm (0.199 ft)Discharge: 42.99 115(1.518 efs) Discharge: 34.83 115(1.230 efs)
Upstream Downstream Upstream Downstream Upstream Downstream Upstream DownstreamHead Head Head Head Head Head Head Headmm mm ft ft AWn mm ft ft69.5 5.18 0.228 0.017 61.5 0.26 0.202 0.00170.1 11.9 0.230 0.039 61.5 7.26 0.202 0.02471.3 18.3 0.234 0.060 62.4 14.0 0.205 0.04672.8 25.6 0.239 0.084 63.6 21.0 0.209 0.06974.1 31.4 0.243 0.103 65.1 27.4 0.214 0.09075.6 38.4 0.248 0.126 66.9 34.4 0.220 0.11377.7 45.4 0.255 0.149 68.8 40.8 0.226 0.13481.1 53.6 0.266 0.176 71.2 47.8 0.234 0.15784.1 60.7 0.276 0.199 74.6 54.2 0..245 0.17887.5 67.4 0.287 0.221 77.9 60.5 0.256 0.19991.1 73.8 0.299 0.242 81.6 66.6 0.268 0.21995.1 80.2 0.312 0.263 85.8 73.0 0.282 0.24099.7 86.3 0.327 0.283 90.4 79.7 0.297 0.262104.9 93.0 0.344 0.305 95.6 86.4 0.314 0.284110.0 99.7 0.361 0.327 101.1 92.8 0.332 0.305115.5 106.4 0.379 0.349 106.5 99.8 0.350 0.328121.3 113.4 0.398 0.372 112.6 106.5 0.370 0.350127.7 120.4 0.419 0.395
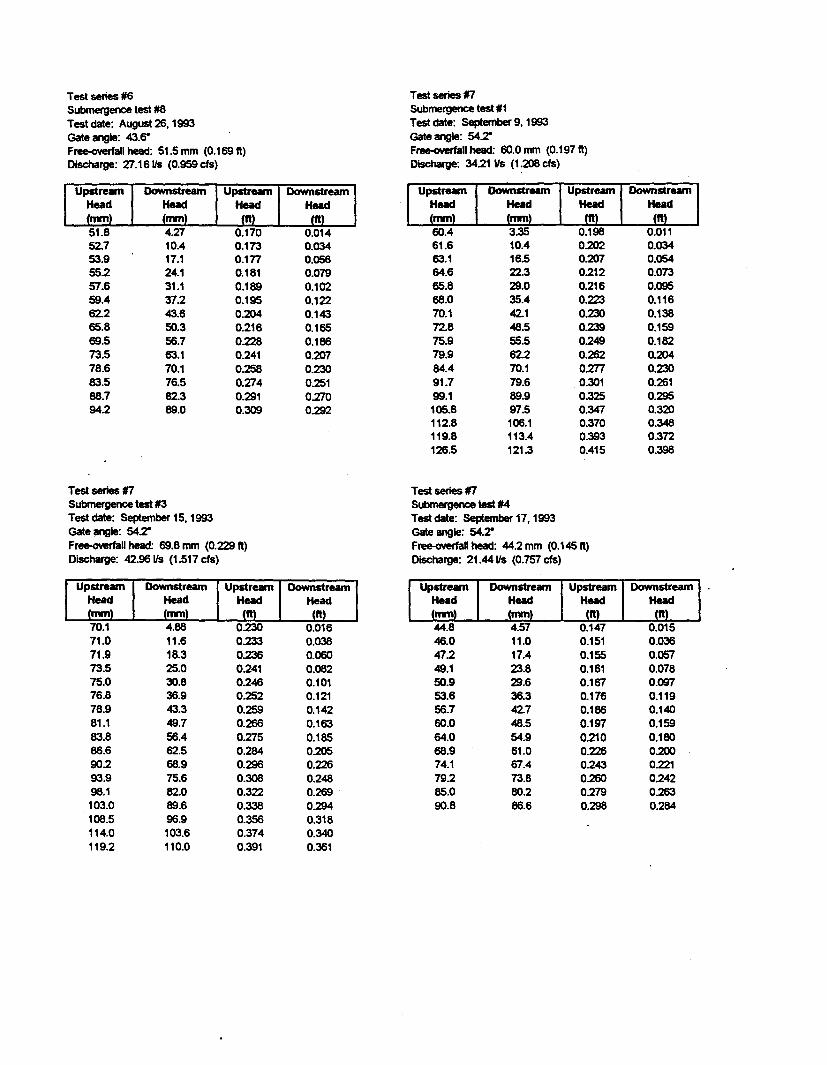
Test series tI6Submergence test #8
Test date: August 26, 1993
Gate angle: 43.6"
Free-overfall head: 51.5 mm (0.169 It)
Discharge: 27.16 lis (0.959 cfs)
1"=151.852.753.955.2~.659.462.265.869.573.578.683.588.794.2
Downstream
Head(mm.4.2710.417.124.131.137.243.650.356.763.170.176.582.389.0
I"=I~I(n) (ft)0.170 0.0140.173 0.0340.177 0.0560.181 0.0790.189 0.1020.195 0.1220.204 0.1430.216 0.1650.228 0.1860.241 0.2070.258 0.2300.274 0.2510.291 0.2700.309 0.292
Test series tnSubmergence test #3
Test date: September 15,1993
Gate angle: 54,28
Free-overfall head: 69.8 mm (0.229 It)Discharge: 42.96115 (1.517cf5)
UpstreamHeadnm70.171.071.973.575.076.878.981.183.886.690.293.998.1103.0108.5114.0119.2
DownstreamHeadmm4.8811.618.325.030.836.943.349.756.462.568.975.682.089.696.9103.6110.0
UpstreamHead
n0.2300.2330.2360.2410.2460.2520.2590.2660.2750.2840.2960.3080.3220.3380.3560.3740.391
DownstreamHead
n0.0160.0380.0600.0820.1010.1210.1420.1630.1850.2050.2260.2480.2690.2940.3180.3400.361
Test series tnSubmergence test #1
Test date: September 9, 1993
Gate angle: 54,28
Free-overfall head: 60.0 mm (0.197 It)Discharge: 34.21 lis (1.208 Cf5)
1"=1(nm)
60.461.663.164.665.868.070.172.875.979.984.491.799.1105.8112.8119.8126.5
DownstreamHeademm)3.3510.416.522.329.035.442.148.555.562.270.179.689.997.5106.1113.4121.3
I
"=I
Oowft:
Ien) en)0.198 0.0110.202 0.0340.207 0.0540.212 0.0730.216 0.0950.223 0.1160.230 0.1380.239 0.1590.249 0.1820.262 0.2040.277 0.230
. 0.301 0.2610.325 0.2950.347 0.3200.370 0.3480.393 0.3720.415 0.398
Test series tnSubmergence test #4
Test date: September 17. 1993Gate angle: 54.2"Free-overfall head: 44.2 mm (0.145 It)
Discharge: 21.44115 (0.757 cfs)
UpstreamHeadnm44.846.047.249.150.953.656.760.064.068.974.179.285.090.8
DownstreamHeadmm4.5711.017.423.829.636.342.748.554.961.067.473.880.286.6
UpstreamHead
n0.1470.1510.1550.1610.1670.1760.1860.1970.2100.2260.2430.2600.2790.298
Downstream .Head
n0.0150.0360.0570.0780.0970.1190.1400.1590.1800.2000.2210.2420.2630.284
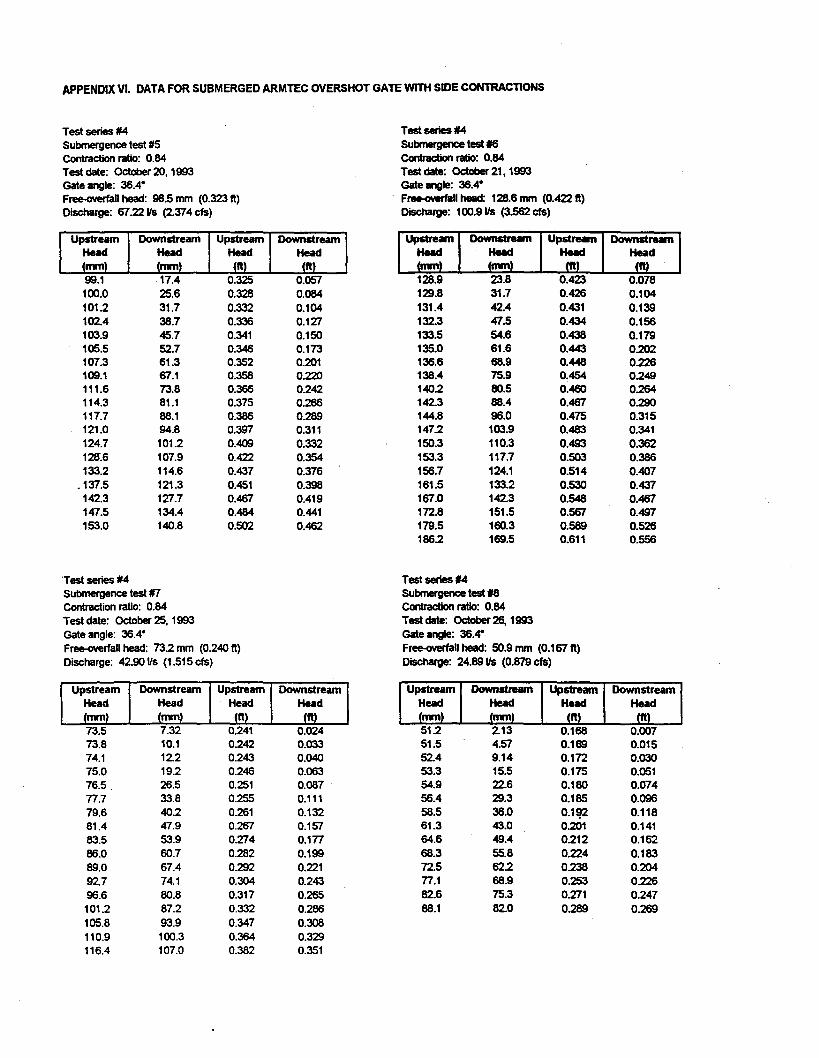
APPENDIX VI. DATA FOR SUBMERGED ARMTEC OVERSHOT GATE WITH SIDE CONTRACTIONS
Test series #4 Test series #4Submergence test #5 Submergence test 16Contraction ratio: 0.84 Contraction ratio: 0.84Test date: October 20,1993 Test date: October 21, 1993Gate angle: 36.4" Gate angle: 36.4"Free-overfallhead: 98.5 mm (0.323 ft)
. FretHMlrfallhead: 128.6 mm (0.422 ft)Discharge: 07.2211$ (2.374 cfs) Discharge: 1oo.911s (3.562 cfs)
Upstream Downstream Upstream Downstream I=-I Downstream I"=I-=--IHead Head Head Head Headmm mm It It (mm) (ft) (ft)
99.1 17.4 0.325 0.057 128.9 23.8 0.423 0.078100.0 25.6 0.328 0.084 129.8 31.7 0.426 0.104101.2 31.7 0.332 0.104 131.4 42.4 0.431 0.139102.4 38.7 0.336 0.127 132.3 47.5 0.434 0.156103.9 45.7 0.341 0.150 133.5 54.6 0.438 0.179105.5 52.7 0.346 0.173 135.0 61.6 0.443 0.202107.3 61.3 0.352 0.201 136.6 68.9 0.448 0.226109.1 07.1 0.358 0.220 138.4 75.9 0.454 0.249111.6 73.8 0.366 0.242 140.2 80.5 0.460 0.264114.3 81.1 0.375 0.266 142.3 88.4 0.407 0.290117.7 88.1 0.386 0.289 144.8 96.0 0.475 0.315121.0 94.8 0.397 0.311 147.2 103.9 0.483 0.341124.7 101.2 0.409 0.332 150.3 110.3 0.493 0.362128'.6 107.9 0.422 0.354 153.3 117.7 0.503 0.386133.2 114.6 0.437 0.376 156.7 124.1 0.514 0.407
.137.5 121.3 0.451 0.398 161.5 133.2 0.530 0.437142.3 127.7 0.407 0.419 107.0 142.3 0.548 0.407147.5 134.4 0.484 0.441 172.8 151.5 0.567 0.4971.53.0 140.8 0.502 0.462 179.5 160.3 0.589 0.526
186.2 169.5 0.611 0.556
Test series #4 Test series #4Submergence test tn Submergence test t8Contraction ratio: 0.84 Contraction ratio: 0.84Test date: October 25, 1993 Testdate: 0ct0ber26,1993Gate angle: 36.4" Gate angle: 36.4"Free-overfallhead: 73.2 mm (0.240 ft) Free-overfall head: 50.9 mm (0.107 ft)Discharge: 42.90 lis (1.515 cfs) Discharge: 24.89 lis (0.879 cfs)
Upstream Downstream Upstream Downstream Upstream Downstream Upstream DownstreamHead Head Head Head Head Head Head Headmm mm It It mm mm It ft73.5 7.32 0.241 0.024 51.2 2.13 0.168 0.00773.8 10.1 0.242 0.033 51.5 4.57 0.169 0.01574.1 12.2 0.243 0.040 52.4 9.14 0.172 0.03075.0 19.2 0.246 0.063 53.3 15.5 0.175 0.05176.5. 26.5 0.251 0.087 54.9 22.6 0.180 0.07477.7 33.8 0.255 0.111 56.4 29.3 0.185 0.09679.6 40.2 0.261 0.132 58.5 36.0 0.1~ 0.11881.4 47.9 0.207 0.157 61.3 43.0 0.201 0.14183.5 53.9 0.274 0.177 64.6 49.4 0.212 0.16286.0 60.7 0.282 0.199 68.3 55.8 0.224 0.18389.0 67.4 0.292 0.221 72.5 62.2 0.238 0.20492.7 74.1 0.304 0.243 77.1 68.9 0.253 0.22696.6 80.8 0.317 0.265 82.6 75.3 0.271 0.247101.2 87.2 0.332 0.286 88.1 82.0 0.289 0.269105.8 93.9 0.347 0.308110.9 100.3 0.364 0.329116.4 107.0 0.382 0.351
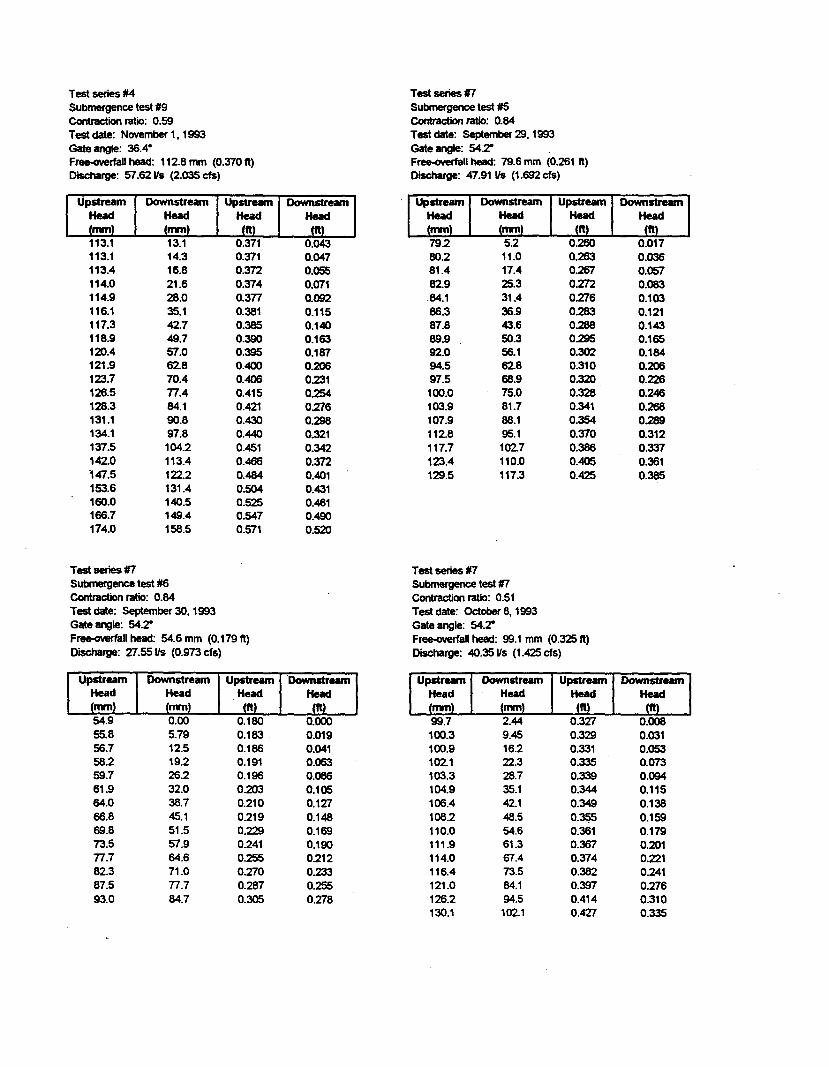
Test series #4Submergence test #9
Contraction ratio: 0.59
Test date: November 1. 1993
Gate angle: 36.4-Free-overfall head: 112.8 mm (0.370 ft)Discharge: 57.62115 (2.035 cfs)
1"=1113.1113.1113.4114.0114.9116.1117.3118.9120.4121.9123.7126.5128.3131.1134.1137.5142.0147.5153.6160.0166.7174.0
-'=I"~I~I13.1 0.371 0.04314.3 0.371 0.04716.8 0.372 0.05521.6 0.374 0.07128.0 0.377 0.09235.1 0.381 0.11542.7 0.385 0.14049.7 0.390 0.16357.0 0.395 0.18762.8 0.400 0.20670.4 0.406 0.23177.4 0.415 0.25484.1 0.421 0.27690.8 0.430 0.29897.8 0.440 0.321104.2 0.451 0.342113.4 0.466 0.372122.2 0.484 0.401131.4 0.504 0.431140.5 0.525 0.461149.4 0.547 0.490158.5 0.571 0.520
Test series #7Submergence test #6
Contraction ratio: 0.84Test date: September 30. 1993
Gate angle: 54.T
Free-overfall head: 54.6 mm (0.179 ft)Discharge: 27.55l1s (0.913 cts)
UpstreamHead
DownstreamHeadnm0.005.7912.519.226.232.038.745.151.557.964.671.077.784.7
'DownstreamHead
ft0.0000.0190.0410.0630.0860.1050.1270.1480.1690.1900.2120.2330.2550.278
UpstreamHead
ft0.1800.1830.1860.1910.1960.2030.2100.2190.2290.2410.2550.2700.2870.305
Test series #7
Submergence test #5
Contraction ratio: 0.84Test date: September 29,1993
Gate angle: 54.TFree-overfall head: 19.6 mm (0.261 ft)Discharge: 47.91 lis (1.692cfs)
r::179.280.281.482.9.84.186.387.889.992.094.597.5100.0103.9107.9112.8117.7123.4129.5
-=-I"'=" 1-=-1(nm) (ft) (ft)
5.2 0.260 0.01711.0 0.263 0.03617.4 0.267 0.05725.3 0.272 0.08331.4 0.276 0.10336.9 0.283 0.12143.6 0.288 0.14350.3 0.295 0.16556.1 0.302 0.18462.8 0.310 0.20668.9 0.320 0.22675.0 0.328 0.24681.7 0.341 0.26888.1 0.354 0.28995.1 0.370 0.312
102.7 0.386 0.337110.0 0.405 0.361117.3 0.425 0.385
Test series #7Submergence test #7
Contraction ratio: 0.51
Testdate: October8,1993Gate angle: 54.T
Free-overfall head: 99.1 mm (0.325 ft)
Discharge: 4O.35l1s (1.425 cts)
UpstreamHeadnm99.7100.3100.9102.1103.3104.9106.4108.2110.0111.9114.0116.4121.0126.2130.1
DownstreamHeadmm2.449.4516.222.328.735.142.146.554.661.367.413.584.194.5102.1
UpstreamHead
ft0.3270.3290.3310.3350.3390.3440.349O.~0.3610.3670.3740.3820.3970.4140.427
DownstreamHead
ft0.0080.0310.0530.0130.0940.1150.1380.1590.1190.2010.2210.2410.2760.3100.335
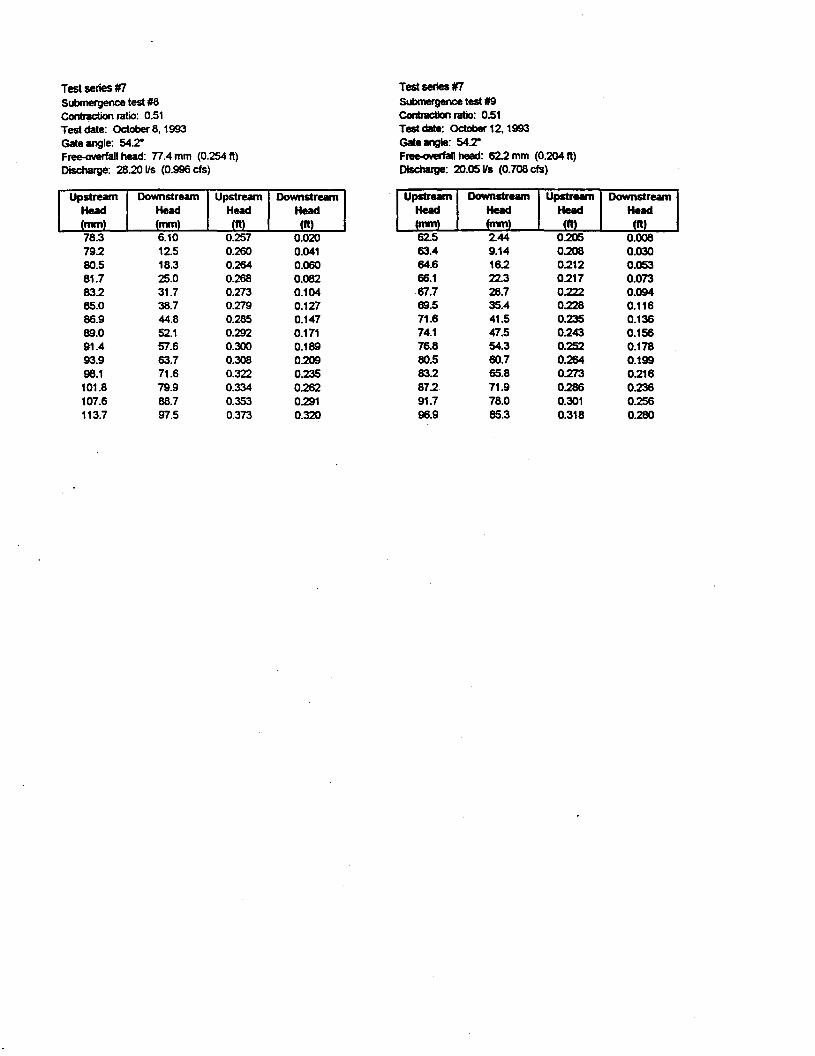
Test series #7Submergence test #8Contraction ratio: 0.51Test date: October 8,1993Gate angle: 54.TFree-overfall head: 77.4 mm (0.254 ft)Discharge: 28.20 Vs (0.996 cfs)
UpstreamHeadnm78.379.280.581.783.285.086.989.091.493.998.1101.8107.6113.7
DownstreamHead
UpstreamHead
It0.2570.2600.2640.2680.2730.2790.2850.2920.3000.3080.3220.3340.3530.373
DownstreamHead
It0.0200.0410.0600.0820.1040.1270.1470.1710.1890.2090.2350.2620.2910.320
Test series #7Submergence test #9ContractIon ratio: 0.51Test date: October 12.1993Gate angle: 54.TFree-oYeI'fall head: 62.2 mm (0.204 ft)Discharge: 20.05 Va (0.708 cfs)
t:rI=I1fITI62.5 2.44 0.205 0.00863.4 9.14 0.208 0.03064.6 16.2 0.212 0.05366.1 22.3 0.217 0.07367.7 28.7 0.222 0.09469.5 35.4 0.228 0.11671.6 41.5 0.235 0.13674.1 47.5 0.243 0.15676.8 54.3 0.252 0.17880.5 80.7 0.264 0.19983.2 65.8 0.273 0.21687.2 71.9 0.286 0.23691.7 78.0 0.301 0.25696.9 85.3 0.318 0.280
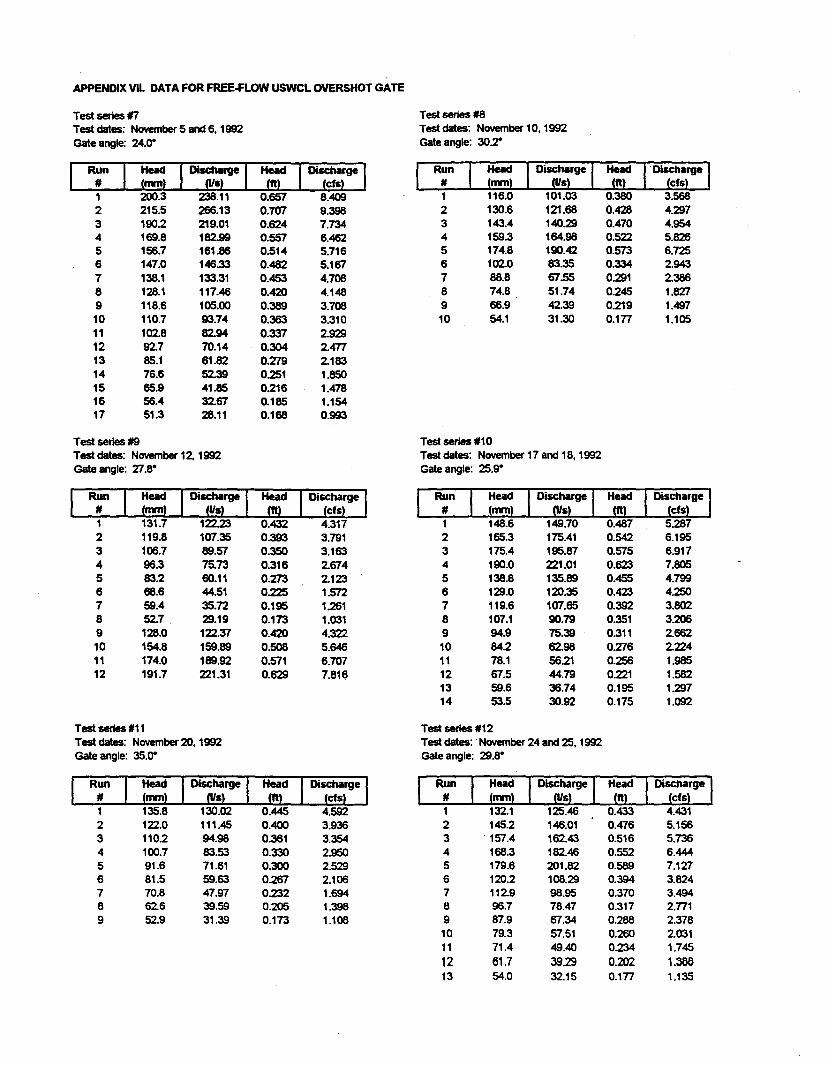
APPENDIXVII. DATAFOR FREE.fLOW USWCL OVERSHOT GATE
Test series t#7 Test series #8Testdates: November5and6,1992 Test dates: November 10,1992Gate angle: 24.0. Gate angle: 30.2"
RunI
Head I~rgel HudI
Discharge
I 1
RunI
Head
I
DischargeI
Head I.Discharge
I# (mm) (ft) (cfs) # (mm) (Us) (ft) (cfs)
1 200.3 238.11 0.657 8.409 1 116.0 101.03 0.380 3.5682 215.5 266.13 0.7f1T 9.398 2 130.6 121.68 0.428 4.2973 190.2 219.01 0.624 7.734 3 143.4 140.29 0.470 4.9544 169.8 182.99 0.557 6.462 4 159.3 164.98 0.522 5.8265 156.7 161.86 0.514 5.716 5 174.8 190.42 0.573 6.7256 147.0 146.33 0.482 5.167 6 102.0 83.35 0.334 2.9437 138.1 133.31 0.453 4.708 7 88.8 67.55 0.291 2.3868 128.1 117.46 0.420 4.148 8 74.8 51.74 0.245 1.8279 118.6 105.00 0.389 3.708 9 66.9 42.39 0219 1.49710 110.7 93.74 0.363 3.310 10 54.1 31.30 0.177 1.10511 102.8 82.94 0.337 2.92912 92.7 70.14 0.304 2.47713 85.1 61.82 0.279 2.18314 76.6 52.39 0.251 1.85015 65.9 41.85 0.216 1.47816 56.4 32.67 0.185 1.15417 51.3 28.11 0.168 0.993
Test series t9 Test series #10Test dates: November 12. 1992 Test dates: November 17 and 18, 1992Gate angle:. 27.8. Gate angle: 25.9"
Run
I
Head
I
m~a:rgeI
Head
I
mschargeI I
RunI
HeadI
Di~~rgeI
HeadI
Discharge
I# (mm) (ft) (cfs) # (mm) (ft) (cfs)
1 131.7 122.23 0.432 4.317 1 148.6 149.70 0.487 5.2872 119.8 107.35 0.393 3.791 2 165.3 175.41 0.542 6.1953 106.7 89.57 0.350 3.163 3 175.4 195.87 0.575 6.9174 96.3 75.73 0.316 2.674 4 190.0 221.01 0.623 7.8055 83.2 60.11 0.273 2.123 5 138.8 135.89 0.455 4.7996 68.6 44.51 0.225 1.572 6 129.0 120.35 0.423 4.2507 59.4 35.72 0.195 1.261 7 119.6 107.65 0.392 3.8028 52.7 29.19 0.173 1.031 8 107.1 90.79 0.351 3.2069 128.0 122.37 0.420 4.322 9 94.9 75.39 0.311 2.66210 154.8 159.89 0.508 5.646 10 84.2 62.98 0.276 2.22411 174.0 189.92 0.571 6.707 11 78.1 56.21 0.256 1.98512 191.7 221.31 0.629 7.816 12 67.5 44.79 0.221 1.582
13 59.6 36.74 0.195 1.29714 53.5 30.92 0.175 1.092
Test series #11 Test series #12Test dates: November 20,1992 Test dates: November 24 and 25, 1992Gate angle: 35.0" Gate angle: 29.8.
Run
I
Head
Im~:s~rge
IHead
I
mscharge
I I
Run
I
Head
IDi-::rge
I
Head
I
Discharge
I# (mm) (ft) (cfs) # (mm) (ft) (cfs)1 135.8 130.02 0.445 4.592 1 132.1 125.46 0.433 4.4312 122.0 111.45 0.400 3.936 2 145.2 146.01 0.476 5.1563 110.2 94.98 0.361 3.354 3 .157.4 162.43 0.516 5.7364 100.7 83.53 0.330 2.950 4 168.3 182.46 0.552 6.4445 91.6 71.61 0.300 2.529 5 179.6 201.82 0.589 7.1276 81.5 59.63 0.267 2.106 6 120.2 108.29 0.394 3.8247 70.8 47.97 0.232 1.694 7 112.9 98.95 0.370 3.4948 62.6 39.59 0.205 1.398 8 96.7 78.47 0.317 2.7719 52.9 31.39 0.173 1.108 9 87.9 67.34 0.288 2.378
10 79.3 57.51 0.260 2.03111 71.4 49.40 0.234 1.745
12 61.7 39.29 0.202 1.36613 54.0 32.15 0.177 1.135
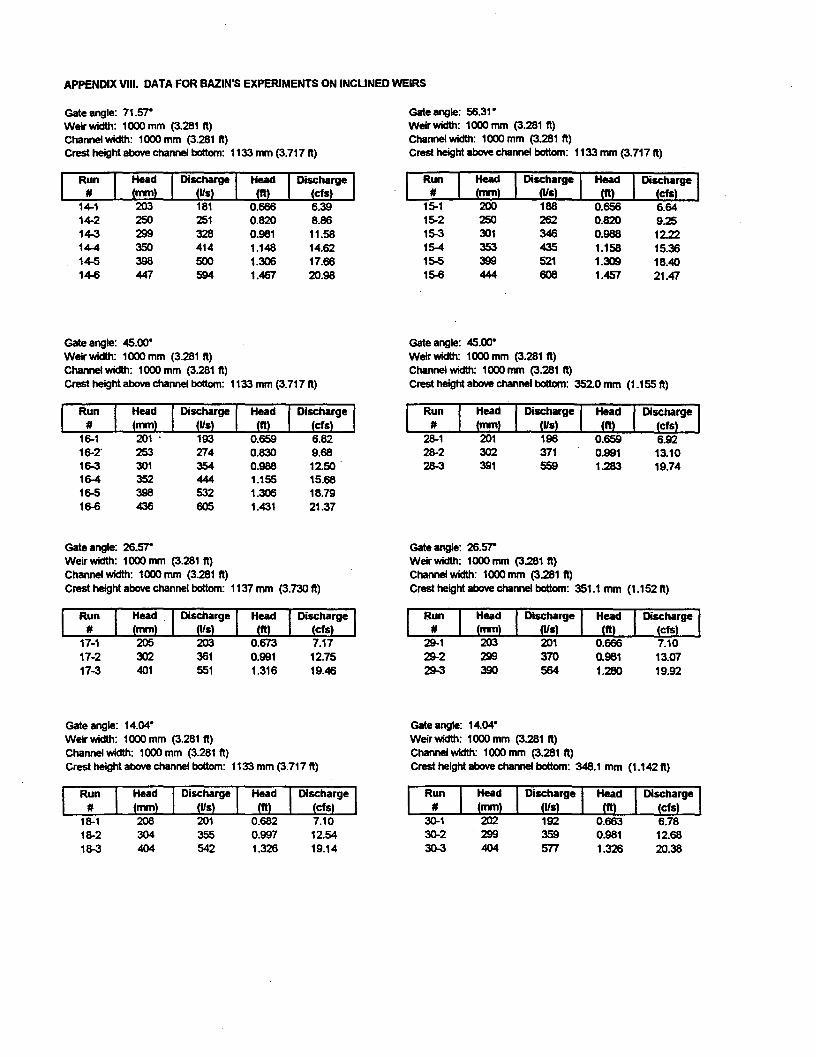
APPENDIX VIII. DATA FOR BAZIN"S EXPERIMENTS ON INCUNED WEIRS
Gate angle: 71.fjl"Weir width: 1000 mm (3.281 ft)Channel width: 1000 mm (3.281 ft)Crest height above channel bottom: 1133 mm (3.717 ft)
R~"I
14-114-214-314-414-514-6
Head
I
DischargeI
(mn) (115)
203 181250 251299 328350 414398 500447 594
Head
I
Discharge
I(ft) (ds)
0.666 6.390.820 8.860.981 11.581.148 14.621.306 17.661.467 20.98
Gate angle: 45.00"Weir width: 1000 mm (3.281 ft)Channel width: 1000 mm (3.281 ft)
Crest height above channel bottom: 1133 mm (3.717 ft)
R~"I
1~11~2.
1~1~1~51~
HeadI
Discharge
I(mn) (115)
201 . 193253 274301 354352 444398 532436 605
HeadI
Discharge
I(ft) (ds)
0.659 6.820.830 9.680.988 1250
.
1.155 15.681.306 18.791.431 21.37
Gate angle: 26.57"
Weirwidth: 1000mm (3.281 ft)Channel width: 1000 mm (3.281 ft)Crest height above channel bottom: 1137 mm (3.730 ft)
R~"I
17-117-217-3
Head
I
DischargeI
(mn) (115)
205 203302 361401 551
Head
I
Discharge
I(ft) (ds)
0.673 7.170.991 12.751.316 19.46
Gate angle: 14.04"Weir width: 1000 mm (3.281 ft)Channel width: 1000 mm (3.281 ft)Crest height above channel bottom: 1133 mm (3.717 ft)
Gate angle: 56.31"Weir width: 1000 mm (3.281 ft)Channel width: 1000 mm (3.281 ft)
Crest height above channel bottom: 1133 mm (3.717 ft)
R~nI
15-115-215-315-415-515-6
Head
I
Discharge
I(mn) (115)200 188250 262301 346353 435399 521444 608
Head
I
Discharge
I(ft) (cfs)
0.656 6.640.820 9.250.988 12221.158 15.361.309 18.401.457 21.47
Gate angle: 45.00"Weir width: 1000 mm (3.281 ft)Channel width: 1000 mm (3.281 ft)Crest height above channel bottom: 3520 mm (1.155 ft)
R:"I
28-128-228-3
:: I~~el201 196302 371391 559
Head
I
Discharge
I(ft) (ds)
0.659 6.920.991 13.101.283 19.74
Gate angle: 26.57"Weir width: 1000 mm (3.281 ft)Channel width: 1000 mm (3.281 ft)Crest height above channel bottom: 351.1 mm (1.152 ft)
R~"I
29-129-229-3
HeadI
DischargeI(mn) (115)
203 201
299 370
390 564
Head
I
Discharge
I(ft) (cfs)
0.666 7.100.981 13.071.280 19.92
Gate angle: 14.04"
Weir width: 1000 mm (3.281 ft)Channel width: 1000 mm (3.281 ft)
Crest height above channel bottom: 348.1 mm (1.142 ft)
R:"I
30-130-230-3
HeadI
Discharge
I(mn) (115)
202 192299 359
404 fjl7
Head
I
Discharge
I(ft) (cfs)
0.663 6.780.981 12.681.326 20.38
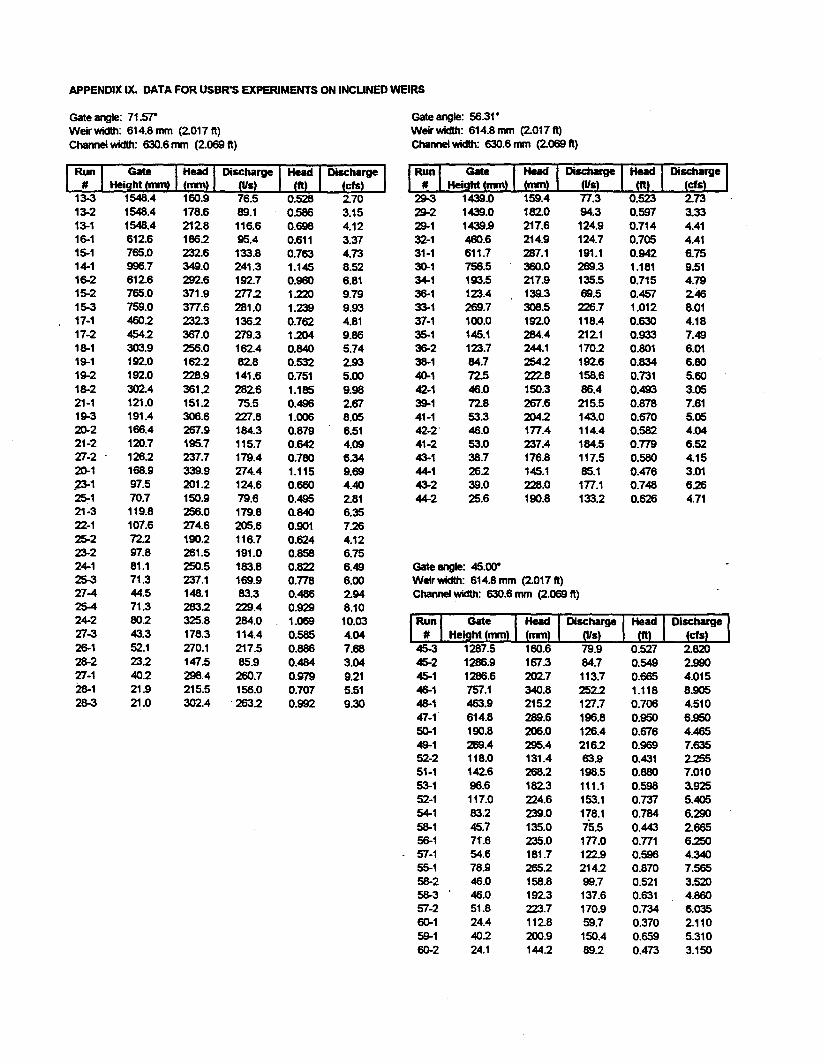
APPENDIX IX. DATA FOR USBR'S EXPERIMENTS ON INCUNED WEIRS
Gate angle: 71.'5rWeir width: 614.8 mm (2.017 ft)Channel width: 630.6 mm (2.069 ft)
[:B Hei:mn) ~ [H~:rge ~ [H~:~I
13-3 1548.4 160.9 76.5 0.528 2.7013-2 1548.4 178.6 89.1 0.586 3.1513-1 1548.4 212.8 116.6 0.698 4.1216-1 612.6 186.2 95.4 0.611 3.3715-1 765.0 232.6 133.8 0.763 4.7314-1 996.7 349.0 241.3 1.145 8.5216-2 612.6 292.6 192.7 0.960 6.8115-2 765.0 371.9 2772 1.220 9.7915-3 759.0 377.6 281.0 1.239 9.93
. 17-1 4602 232.3 136.2 0.762 4.8117-2 454.2 367.0 279.3 1204 9.8618-1 303.9 256.0 162.4 0.840 5.7419-1 192.0 162.2 82.8 0.532 2.9319-2 192.0 228.9 141.6 0.751 5.0018-2 302.4 3612 282.6 1.185 9.9821-1 121.0 1512 75.5 0.496 2.fJ119-3 191.4 306.6 227.8 1.006 8.0520-2 166.4 267.9 184.3 0.879 6.5121-2 120.7 195.7 115.7 0.642 4.0927-2' 1262 237.7 179.4 0.780 6.3420-1 168.9 339.9 274.4 1.115 9.69Z3-1 97.5 201.2 124.6 0.660 4.4025-1 70.7 150.9 79.6 0.495 2.8121-3 119.8 256.0 179.8 0.840 6.3522-1 107.6 274.6 205.6 0.901 7.2625-2 722 190.2 116.7 0.624 4.1223-2 97.8 261.5 191.0 0.858 6.7524-1 81.1 250.5 183.8 0.822 6.4925-3 71.3 237.1 169.9 0.778 6.0027-4 44.5 148.1 83.3 0.486 2.9425-4 71.3 283.2 229.4 0.929 8.1024-2 80.2 325.8 284.0 1.069 10.0327-3 43.3 178.3 114.4 0.585 4.0426-1 52.1 270.1 217.5 0.886 7.6828-2 23.2 147.5 85.9 0.484 3.0427-1 40.2 298.4 260.7 0.979 .9.2128-1 21.9 215.5 156.0 0.707 5.5128-3 21.0 302.4. 2632 0.992 9.30
Gate angle: 56.31.Weir width: 614.8 mm (2.017 ft)Channel width: 630.6 mm (2.069 ft)
~ Hei:;mn) I. 29-3 1439.0
29-2 1439.029-1 1439.932-1 460.631-1 611.730-1 756.534-1 193.536-1 123.433-1 269.737-1 100.035-1 145.136-2 123.738-1 84.740-1 72.542-1 416.039-1 72.841-1 53.342-2. 416.0
41-2 53.043-1 38.744-1 26243-2 39.044-2 25.6
HeadI
Discharge ~ Discharge
I(mn) (Vs) ft (cts)159.4 77.3 0.523 2.73 .
182.0 94.3 0.597 3.33217.6 124.9 0.714 4.41214.9 124.7 0.705 4.41287.1 191.1 0.942 6.75360.0 269.3 1.181 9.51217.9 135.5 0.715 4.79139.3 69.5 0.457 2.416308.5 226.7 1.012 8.01192.0 118.4 0.630 4.18284.4 212.1 0.933 7.49244.1 1702 0.801 6.012542 192.6 0.834 6.80222.8 158.6 0.731 5.60150.3 86.4 0.493 3.05267.6 215.5 0.878 7.61204.2 143.0 0.fJ10 5.05177.4 114.4 0.582 4.04237.4 184.5 0.779 6.52176.8 117.5 0.580 4.15145.1 85.1 0.476 3.01228.0 177.1 0.748 6.26190.8 133.2 0.626 4.71
Gate angle: 45.00.Weir width: 614.8 mm (2.017 ft)Channel width: 630.6 mm (2.069 ft)
~ Hei:':~) I
45-3 1287.545-2 1286.945-1 1286.646-1 757.148-1 463.947-1 614.850-1 190.849-1 269.452-2 118.051-1 142.653-1 96.652-1 117.054-1 83258-1 45.756-1 71.6
. 57-1 54.655-1 78.958-2 416.058-3' 416.057-2 51.860-1 24.459-1 40.260-2 24.1
Head
I
[Hscharge ~ DischargeI(mn) (115) ft. (cts)
160.6 79.9 0.527 2.8201fJ1.3 84.7 0.549 2.990202.7 113.7 0.665 4.015340.8 252.2 1.118 8.9052152 127.7 0.706 4.510289.6 196.8 0.950 6.950206.0 126.4 0.fJ16 4.465295.4 2162 0.969 7.635131.4 63.9 0.431 2.255268.2 198.5 0.880 7.010182.3 111.1 0.598 3.925224.6 153.1 0.737 5.405239.0 178.1 0.784 6290135.0 75.5 0.443 2.665235.0 177.0 0.771 6.250181.7 122.9 0.596 4.340265.2 2142 0.870 7.565158.8 99.7 0.521 3.520192.3 137.6 0.631 4.860223.7 170.9 0.734 6.035112.8 59.7 0.370 2.110200.9 150.4 0.659 5.310144.2 89.2 0.473 3.150
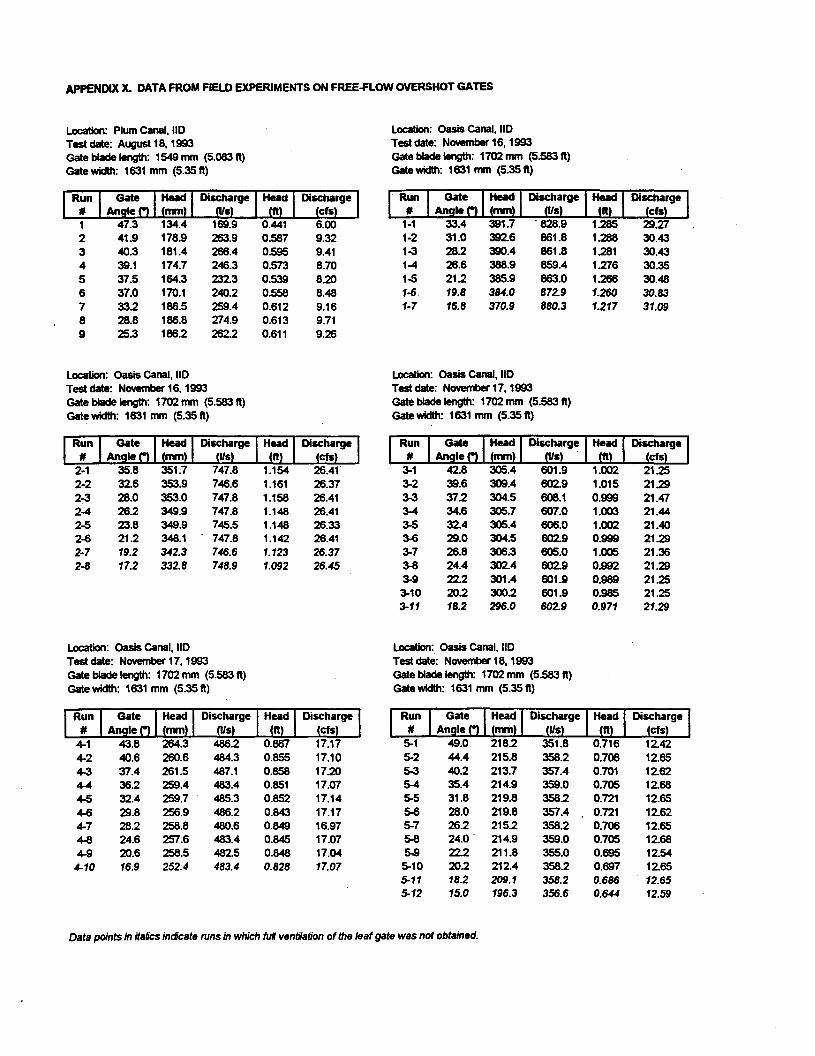
APPENDIX X. DATA FROM FIELD EXPERIMENTS ON FREE-FLOW OVERSHOT GATES
Location: Plum Canal, liDTest date: August 18, 1993Gate blade length: 1549 mm (5.083 ft)Gate width: 1631 mm (5.35 ft)
JRUril Gate fiiUdI Discharge fHUdl DischargeILU Angle n lJ!!!:&J (lis) lJ!!LJ (ds).
1 47.3 134.4 169.9 0.441 6.002 41.9 178.9 263.9 0.587 9.323 40.3 181.4 266.4 0.595 9.414 39.1 174.7 246.3 0.573 8.705 37.5 164.3 232.3 0.539 8.206 37.0 170.1 240.2 0.558 8.487 332 186.5 259.4 0.612 9.168 28.8 186.8 274.9 0.613 9.719 25.3 186.2 2622 0.611 9.26
Location: Oasis Canal, liD
Test date: November 16, 1993
Gate blade length: 1702 mm (5.583 ft)
Gate width: 1631 mm (5.35 ft)
JRUril Gate jHUdJ DischargeriiUdl DischargeILU Angle n lJ!!!:&J (lis) lJ!!LJ (cfs).
2-1 35.8 351.7 747.8 1.154 26.412-2 32.6 353.9 746.6 1.161 26.372-3 28.0 353.0 747.8 1.158 26.412-4 26.2 349.9 747.8 1.148 26.412-5 23.8 349.9 745.5 1.148 26.332-6 21.2 348.1 747.8 1.142 26.412-7 19.2 342.3 746.6 1.123 26.372-8 17.2 332.8 748.9 1.092 26.45
Location: OasIs Canal, liD
Test date: November 17,1993
Gate blade length: 1702 mm (5.583 ft)
Gate width: 1631 mm (5.35 ft)
Location: Oasis Canal, liD
Test date: November 16, 1993Gate blade length: 1702 mm (5.583 ft)Gate width: 1631 mm (5.35 ft)
fiUi11 Gate Ili88dl Discharge /HUdl Discharge
IL! J Angle n lJ!!!:&J (lis) lJ!!LJ (ds) .1-1 33.4 391.7
.828.9 1.285 29.27
1-2 31.0 392.6 861.8 1.288 30.431-3 282 390.4 861.8 1281 30.431-4 26.6 388.9 859.4 1276 30.351-5 212 385.9 863.0 1.266 30.481-6 19.8 384.0 872.9 1.260 30.831-7 16.8 370.9 880.3 1.217 31.09
Location: Oasis Canal, liD
Test date: November 17, 1993Gate blade length: 1702 mm (5.583 ft)
Gate width: 1631 mm (5.35 ft)
~ Gate
r:=JDischarge ~ Discharge
I# Angle n nm (lis) ft (cts)3-1 42.8 305.4 601.9 1.002 21253-2 39.6 309.4 602.9 1.015 21293-3 372 304.5 608.1 0.999 21.473-4 34.6 305.7 607.0 1.003 21.443-5 32.4 305.4 606.0 1.002 21.403-6 29.0 304.5 602.9 0.999 21293-7 26.8 306.3 605.0 1.005 21.363-8 24.4 302.4 602.9 0.992 21.293-9 222 301.4 601.9 0.989 2125
3-10 202 3002 601.9 0.985 21.253-11 18.2 296.0 602.9 0.971 21.29
Location: OasIs Canal, liD
Test date: November 18,1993Gate blade length: 1702 mm (5.583 ft)
Gate width: 1631 mm (5.35 ft)
Data points in italics indicate runs in which ful ventiation of the leaf gate was not obtained.
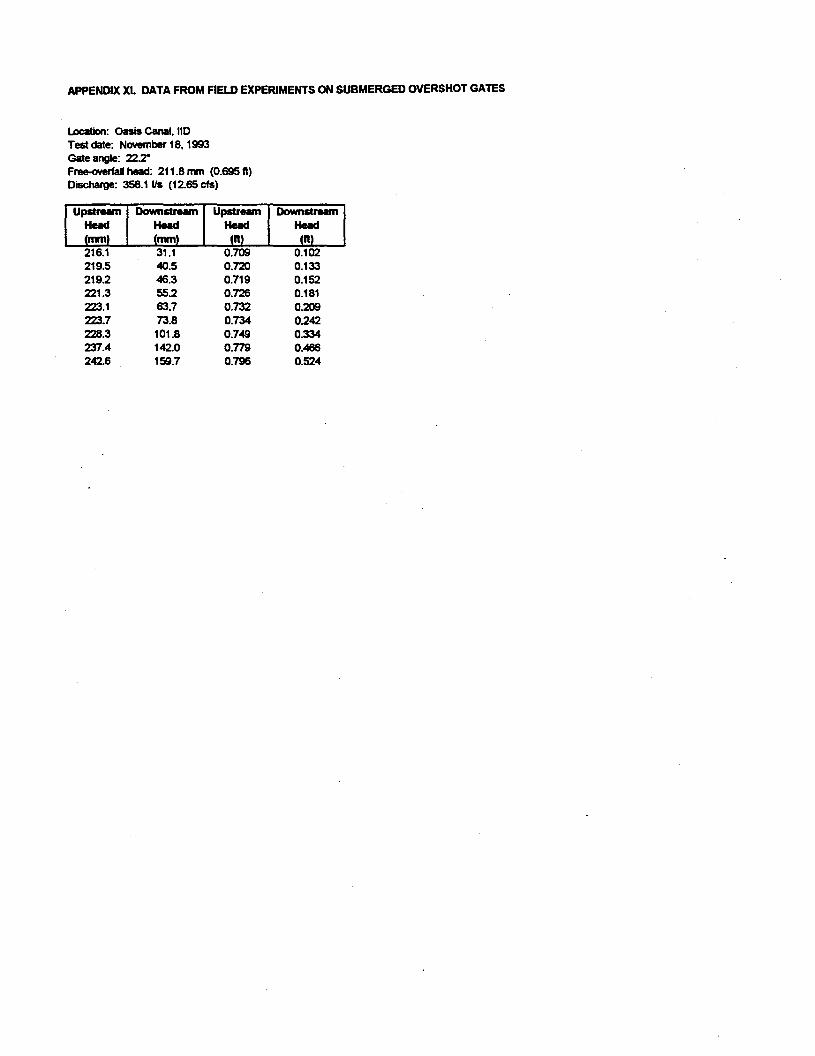
APPENDIX XI. DATA FROM FIELD EXPERIMENTS ON SUBMERGED OVERSHOT GATES
Location: Oasis Canal, 110
Test date: November 18,1993
Gate angle: 22.TFree-overfaU head: 211.8 mm (0.695 It)Discharge: 358.11/s (12.65 cfs)
I"ET"E-"I"V 1-:::-1
216.1 31.1 0.709 0.102219.5 40.5 0.720 0.1332192 416.3 0.719 0.152221.3 55.2 0.726 0.181223.1 63.7 0.732 0209223.7 13.8 0.734 0242228.3 101.8 0.749 0.334237.4 142.0 0.779 0.4166242.6 159.7 0.796 0.524