Embed Size (px)
Citation preview

i
FLOW OF CREDIT TO SMALL AND MARGINAL FARMERS IN HIMACHAL PRADESH
M.L. Sharma N.K. Sharma K.R. Sharma
Agro-Economic Research Centre H.P. University, Shimla-5
2001

ii
RESEARCH TEAM
Project Leader Dr. M.L. Sharma
Data collection Dr. M.L. Sharma
Sh. N.K. Sharma
Sh. K.R. Sharma
Sh. Satya Veer Singh
Data Tabulation Sh. N.K. Sharma
Sh. K.R. Sharma
Sh. Pravesh Sharma
Sh. Satya Veer singh
Analysis and report Writing Dr. M.L. Sharma
Sh. N.K. Sharma
Sh. K.R. Sharma
Word Processing Mrs. Meera Verma
Mrs. Nirmala Thakur
Photocopy Sh. Amer Chand Sharma
iii
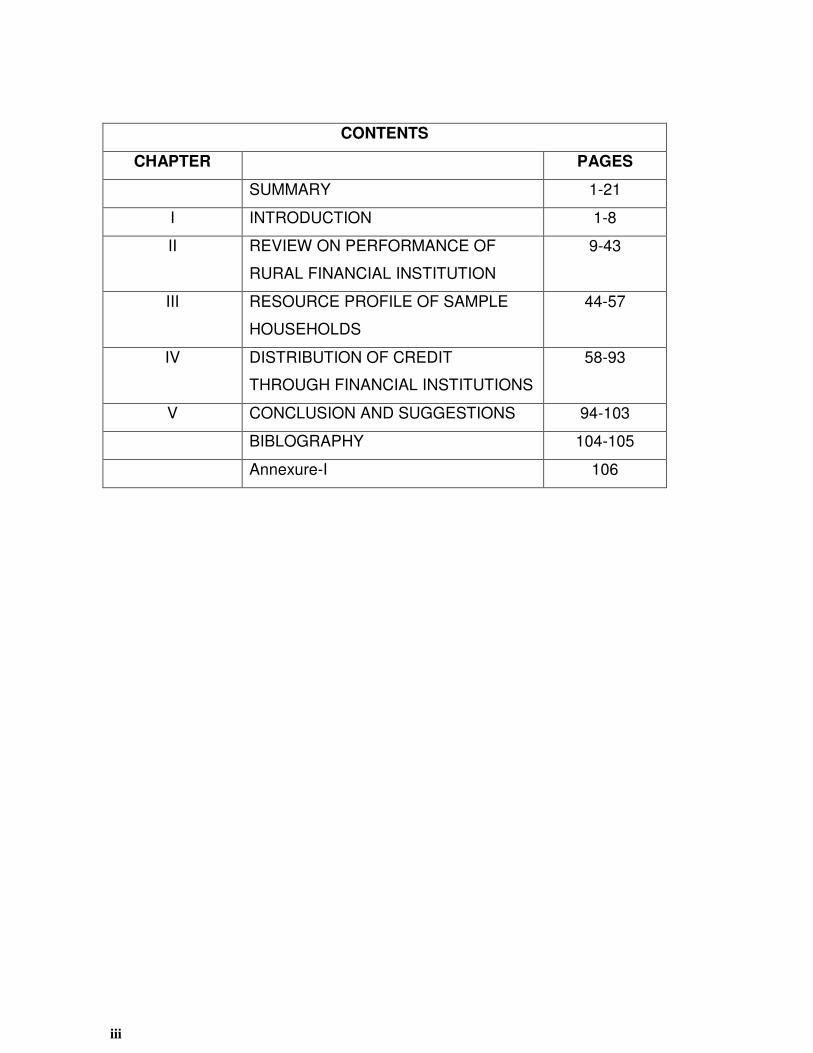
CONTENTS
CHAPTER PAGES
SUMMARY 1-21
I INTRODUCTION 1-8
II REVIEW ON PERFORMANCE OF
RURAL FINANCIAL INSTITUTION
9-43
III RESOURCE PROFILE OF SAMPLE
HOUSEHOLDS
44-57
IV DISTRIBUTION OF CREDIT
THROUGH FINANCIAL INSTITUTIONS
58-93
V CONCLUSION AND SUGGESTIONS 94-103
BIBLOGRAPHY 104-105
Annexure-I 106

1
SUMMARY
INTRODUCTION
The need for external financial services arises due to lack of simultaneity between
realization of income and act of expenditure. In India, agriculture is the mainstay of
the economy but rural household’s demand for credit has been growing fastly due to
their limited land resources operating under poor technology and hence, small base of
their economic activities on one hand and growing family size, increased consumption
requirements and social obligation etc. on the other. At the same time one can guage
the statistical importance of Indian agriculture which have 78.2 percent of marginal and
small holdings, (less than 2 ha.) sharing 32.5 per cent of the total land area. Among
these farmers there is a weakest section of marginal farmer households treated as
landless. All mentioned categories of these farmers have different economic activities
and demand for credit at right time, type and amount is the basic need of these
category of farm families. In Himachal Pradesh the position of marginalization of
farms is also similar to that of India as, marginal and small farmers account 83.65per
cent and cultivating on 44.01 per cent of the total operational holdings. Therefore,
keeping the demand of credit in view the present study is undertaken by following the
recommendations of the Parliamentary standing committee on agriculture to study the
flow of credit and it’s problems linked with small and marginal farmers for getting easy
and cheap credit from rural financial institutions. The rural financial system comprises
of not only traditional sources with in both formal and informal segment, but also new
generation institutions with emphasis on micro finance with in the same two segments
and attempt need to be made to cover the experiences of both traditional and new
generation components of the system.
OBJECTIVES
1. To review the credit experiences of traditional financial institutions with respect to vulnerable sections of the farming community based on existing literature and available documents in the coming.

2
2. To document through case studies the innovative credit experiments of new generation rural financial institutions, especially in private and co-operative sectors, in India, with respect to same target groups.
3. To identify and analyse the existing credit flow gaps and reasons there for the same target groups; and
4. To suggest measures at both economic policy level and enterprise level to
ensure smooth flow of credit on sustainable basis to this group.
METHODOLOGY
Because of varying altitudes, the agro economic conditions are also vary and
condition prevailing at one particular place may totally be different from another.
Under such conditions Directorate of Himachal Pradesh divided total geographical
area into low mid and high hills where cultivation of crops practiced between 500
meters to 2200 meters above mean see level. For the present study multistage
random sampling technique was adopted. Keeping this fact in mind at first stage on
the recommendation of Lead Bank of Himachal Pradesh district Shimla (without micro
finance) in high hill zone where concentration of fruit and vegetable is higher in the
state and district Kangra (with micro finance) in low hill zone where cereal based
farming is operating was selected. Further on the recommendation of lead banks of
both the districts two villages named Jheol (a village with micro finance) and Matiana
(a village without micro finance) were selected for the detailed study. As per
guidelines suggested by IIM Ahemedabad (coordinator of the study) both primary and
secondary data was collected and analysed. For this presentation a sample 25
farmers household belonging to the category of landless, marginal, small and medium
household were selected in each village (Table –1).

3
TABLE 1 CLASSIFICATION OF SAMPLE HOUSEHOLDS IN STUDY DISTRICTS OF H.P.
District Landless Marginal Small Medium Overall
Shimla 5(20.00) 10(40.00) 5(20.00) 5(20.00) 25(100.00)
Kangra 5(20.00) 13(52.00) 2(8.00) 5(20.00) 25(100.00)
All 10(20.00) 23(46.00) 7(14.00) 10(20.00) 50(100.00)
REVIEW ON PERFORMANCE OF FINANCING INSTITUTIONS
(i) Commercial Banks: Regarding the history of commercial banking in India the
establishment of the “The bank of Hindustan in 1770 and organised banking in a
regulated form however started in 1921. Imperial bank of India was nationalized in
1955 at the recommendation of committee of direction for the “All India Rural Credit
Survey”. The said bank is now known as state bank of India. Fourteen major
commercial banks were nationalized in 1969 and six more in 1980. These banks are
governed by the RBI’s banking act 1949.
All type of field level institutions like cooperative, regional rural banks and micro
financing falls under commercial banks. In fact, all these financial institutions lack the
require mechanism to assess poor farmer’s credit needs and perceive that most of
these are for non productive purposes. Another reason is that these institutions
hesitate to monitor large number of small accounts of poors with potential risks that
arises due to clients inability to provide collateral securing. As on 1990-91 out of 63
million operational holding below one hectare of land only, less than 25 per cent of
them had access to agricultural credit from formal institutions. Therefore, these poor
farmers continued to depend on informal agencies like money lender etc and pay
exorbitant rate of interest.

4
COMMERCIAL BANKS IN HIMACHAL PRADESH
As on March 2000, there were 19 Commercial Banks operating in Himachal
Pradesh through a net work of 648 branches of which 539 branches are located in
rural areas. The total number of bank branches in the state including the branches of
regional/cooperative banks were 1069 as on 31 March 2000. The total deposits of
banks aggregated Rs.7789.17 crore as on 31 March 2000 while outstanding advances
were to the tune of Rs.2110.04 crore. The CD ratio, which was 26.5 as on 31 March
1999, rose to 27.10 as on 31 March 2000 (Table 2).
TABLE 2 COMMERCIAL BANKS IN H.P. Particulars Numbers Amount
as on 31 March 2000
1.Total Commercial Banks 19 2. Total Bank Branches Including RRB/cooperatives
1069
3.Branches Located in rural Areas 539
4. Total Deposits (Rs. crores) 7789.17 5. Total Outstanding Advances (Rs. crores) 2110.04 6. C.D. Ratio 27.10
Source: NABARD, Shimla. H.P.
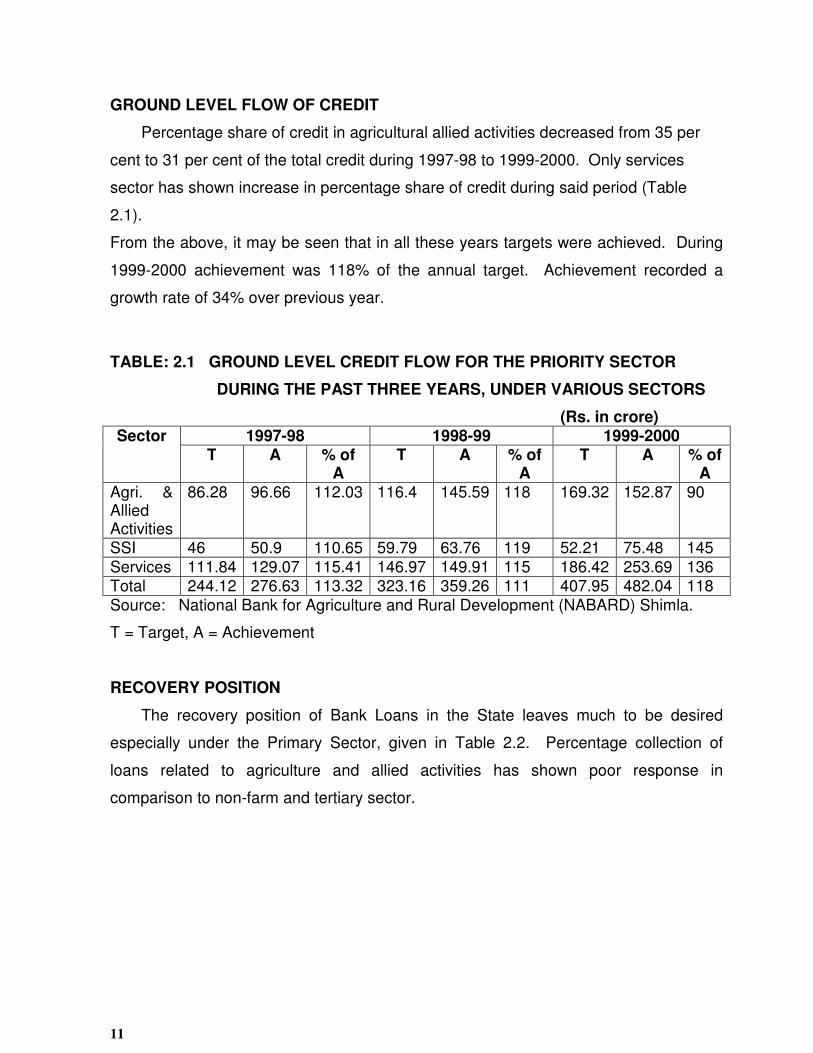
GROUND LEVEL FLOW OF CREDIT
In Table 3 percentage share of credit in agricultural and allied activities decreased
from 35 per cent to 31 per cent of the total credit during 1997-98 to 1999-2000. Only
service sector has shown increase in percentage share of credit during said period. In
this table it may also be seen that in all these years targets were achieved. During
1999-2000 achievement was 118% of the annual target. Achievement recorded a
growth of 34% over previous year.

5
TABLE:3 GROUND LEVEL CREDIT FLOW FOR THE PRIORITY SECTOR DURING THE PAST THREE YEARS, UNDER VARIOUS SECTORS
(Rs. in crore) Sector 1997-98 1998-99 1999-2000
T A % of A
T A % of A
T A % of A
Agri. & Allied Activities
86.28 96.66 112.03 116.4 145.59 118 169.32 152.87 90
SSI 46 50.9 110.65 59.79 63.76 119 52.21 75.48 145 Services 111.84 129.07 115.41 146.97 149.91 115 186.42 253.69 136 Total 244.12 276.63 113.32 323.16 359.26 111 407.95 482.04 118 Source: National Bank for Agriculture and Rural Development (NABARD) Shimla.
T = Target, A = Achievement
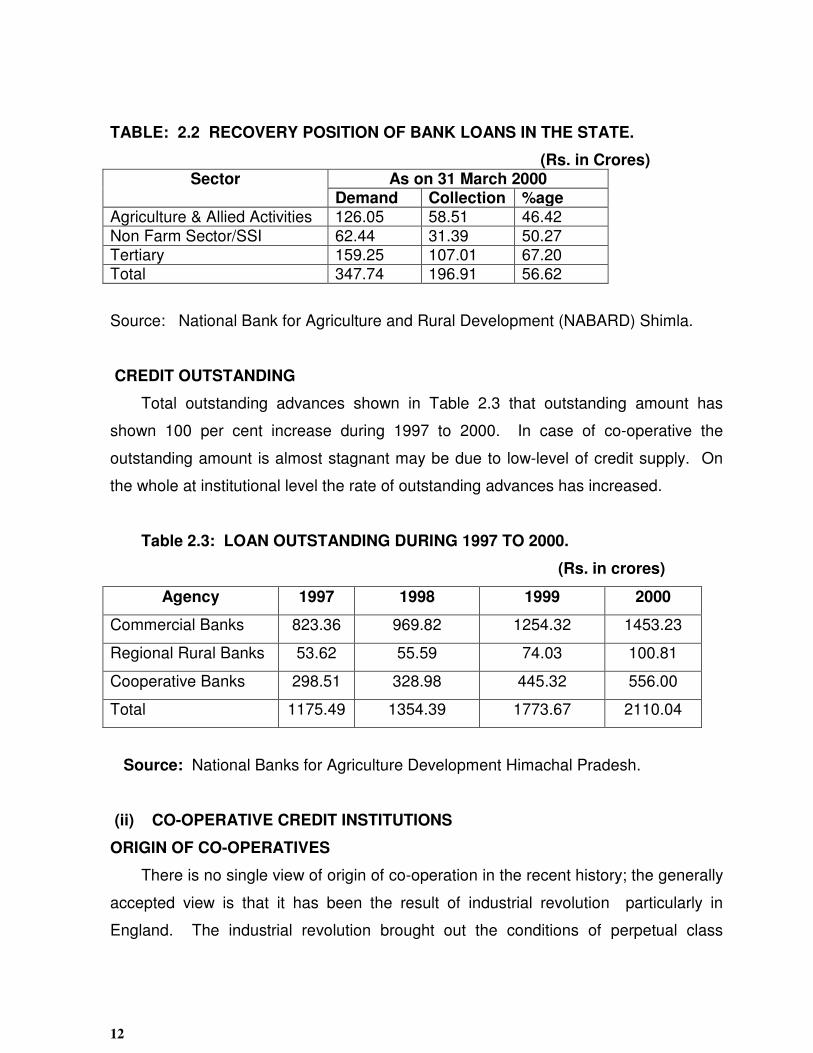
Recovery position of bank loans as on 31 March 2000 in the state leaves much to
be desired especially under the Primary Sector Table 4. Percentage collection of
loans related to agriculture and allied activities has shown poor response in
comparison to non farm and tertiary sector.
TABLE: 4 RECOVERY POSITION OF BANK LOANS IN THE STATE. (Rs.in Crores)
Sector As on 31 March 2000 Demand Collection %age
Agriculture & Allied Activities
126.05 58.51 46.42
Non Farm Sector/SSI 62.44 31.39 50.27 Tertiary 159.25 107.01 67.20 Total 347.74 196.91 56.62 Source: National Bank for Agriculture and Rural Development (NABARD) Shimla.

6
Regarding bank wise outstanding advances Table 5 shows that outstanding
amount has shown 79 per cent increase during 1997 to 2000. In this table it may also
be seen that cooperative banks have shown highest (107%) percentage increase of
outstanding advances followed by RRB (88%) and commercial bank (76%).
Table 5: LOAN OUTSTANDING DURING 1997 TO 2000.
(Rs. in crores)
Agency 1997 1998 1999 2000
Commercial Banks 823.36 969.82 1254.32 1453.23
Regional Rural
Banks
53.62 55.59 74.03 100.81
Cooperative Banks 298.51 328.98 445.32 556.00
Total 1175.49 1354.39 1773.67 2110.04
Source: National Banks for Agriculture Development Himachal Pradesh.
(ii) CO-OPERATIVE BANKS There is no single view of origin of co-operation in
the recent history; the generally accepted view is that it has been the result of
industrial revolution particularly in England. The industrial revolution brought out the
conditions of class conflict, labour unrest property-less, money-less and homeless.
Then, it would not be incorrect to conclude that co-operation ows its origin to situation
created by industrial revolution in great Britain. The prevailing conditions of
unemployment, illiteracy, low wages, long and inhuman working hours and conditions
etc. forced liberal and far sighted persons to lead working class to work out ambitious
systems of social reorganization. Thus, it is indicated that co-operatives were
conceived an answer to the wrong of capitalism.
The development of co-operatives in India can be traced back to 1883 when Sir
William Wedderburn and Justic Ranacle prepared a scheme for establishing an
Agricultural Bank in Poona to provide loans to farmers. Though this scheme was not
accepted in its totality its recommendations were incorporated in the Land

7
Improvement and Agriculturist Loans Act. (XIX of 1883 and XII of 1884). This Act is
accepted as foundation stone of co-operative movement in India.
CO-OPERATIVE IN HIMACHAL PRADESH
SHORT TERM CREDIT
(a) The primary credit societies at base level have extensive coverage extending
to all the 16916 villages in the state with a total membership of 11.58 lakhs at
the end of March 1999 covering thereby 100% of the villages Table 6.
Financing through PACS form a weak link of the short term (ST) credit system
in the state. The average ST loans outstanding per society is much lower
than the minimum loan business of Rs.10 lakhs required for viability of a
society. The state Government/State cooperative bank may, therefore, have
to identify all non viable societies and study the problem of their viability and
prepare a time bound action plan to make each society viable by way of re-
organizing their management.
TABLE 6: PRIMARY AGRICULTURE CREDIT SOCIETIES (PACS) A profile of PACS as of 31 March 1999 is given below :- Particulars Position of 1998-99 No. of Coop.Societies 4,403 Membership (In lacs) 11.85 Share Capital (Rs.lacs) 10,366.83
Working Capital (Rs.lacs) 279,384.78 Loans disbursed (Rs.lacs) 5,763.51 Distribution of Agricultural Inputs (Rs.lacs) 4,271.46 Distribution of consumer goods (Rs.lacs) 20461.30 Coverage of Rural Population in Coop. Fold
100%
Source: National Bank for Agriculture and Rural Development (NABARD) Shimla.
LONG TERM CREDIT STRUCTURE
The long term structure is unitary as well as federal in character. The Himachal
Pradesh State Co-operative Agricultural and Rural Development Bank
Ltd.(HPSCARDB) and Kangra Primary Cooperative Agriculture and rural Development

8
Bank Ltd. (KPCARDB) are operating in the State. Loan issued and outstanding
amount is given in Table 7 wherein it may seen that loan issued during 1998-99 to
1999-2000 through HPSCARDB has shown an increase of 47 per cent and loan
outstanding accounts an increase of 30 per cent. During this period loan issued
through KPCARB increased at the rate of 47 per cent and loan outstanding was
recorded 43 percent. This shows the range of outstanding loan is higher at KPCARDB
as compared to HPSVARDB.
TABLE :7 LOANS PORTFOLIOS OF HPSCARDB AND KPARDB DURING THE LAST TWO YEARS WERE AS UNDER:
(Rs.in lakh) Name of the
Bank/purpose Loans issued Loans out
standing Loans issued
Loans out standing
1998-99 1998-99 1999-2000 1999-2000 HPSCARDB 3224.00 10485.00 4784.00 13598.00 KPARDB 1396.00 3203.00 2053.00 4587.00
Source: National Bank for Agriculture and Rural Development (NABARD) Shimla.
(iii) REGIONAL RURAL BANKS IN HIMACHAL PRADESH
Regional rural banks were established in 1976. There share capital is contributed
by the Government of India, concerned state government and commercial banks in the
proportion of 50.15.35 respectively. In Himachal Pradesh there are two RRB named
Himachal Grawin Bank (HGB) and Parvatiya Grawin Bank (PGB) operating through
103 and 27 branches respectively in the state. Profile and performance of both these
banks presented in Table 8 & 9. In these tables it may be observed that HGB has
shown better performance in comparison to BGB when compared on profit ratio of
both banks. In case of CD ratio and recovery rate these are comparatively higher in
PGB as compared to HGB but accumulated losses are higher in HGB.

9
TABLE : 8 PROFILE & PERFORMANCE OF P.G.B. (Rs. in Lakh) Item As on 31.3.98 As on
31.3.1999 As on 31.3.2000
Share Capital 100 100 100 Branches 27 27 27
Deposits 3,838.48 5,616.58 6866.90 Investments 989.4 1189.40 5688.67 Advances 1.036.87 1,261.99 1659.76 Profit/Loss (+)46.64 (+)116.24 (+)160.53 Accumulated Losses
(-)314.07 (-)267.43 -
CD Ratio 29.00% 35.87 24.16
Recovery Rate 80.00% 66.56% NA Source: National Bank for Agriculture and Rural Development (NABARD), Shimla. TABLE : 9 PROFILE & PERFORMANCE OF H.G.B. (Rs. in Lakh) Items As on 31.3.98 As on 31.3.1999 As on
31.3.2000 Share Capital 996.75 - - Branches 102 103 103 Deposits 22,001 27,675 35,429.09 Investments 16,787 20,490 25,184.69
Advances 4,964 6,060 8,420.76 Profit/Loss (+)109.52 (+)265.65 (+)404.14 Accumulated Losses
(-)1005.79 (-)740.14 (-)336.00
CD Ratio 22.00% 21.9 23.77 Recovery Rate 68.00% 71.67% NA Source: National Bank for Agriculture and Rural Development (NABARD), Shimla.
(iv) MICRO-FINANCE/SHGs.
The initiation of the concept in 1987 followed by the launch of the Pilot Project in
1992 by NABARD and the RBI policy circular in 1996 are important milestones in the
progress of SHGs. The movement was strengthened by guidelines from RBI from
time to time and policy announcements by the GOI. In this direction, the
announcement by the Finance Minister in his budget speech to credit link one lakh
SHGs by SIDBI and NABARD during 2000-2001 and setting up of the Micro Finance
Development Fund of Rs.100 crores.

10
ALL INDIA SCENARIO OF SHGs
The SHGs now stand accepted as an important vehicle for alleviating rural
poverty. Till 31 March 2000, 111500 SHGs have been linked with cumulative banks
loans aggregating Rs.193 crores, benefiting almost 20 lakh families. At present 718
NGOs, 266 Banks many government agencies, 362 district in 24 states are now
associated with the programme, with 85% SHGs being of woman. The regional
spread of SHGs in India presented in Table 10 reveals that in southern states the
spread of SHGs accounts highest percentage (67%) in 1999-2000.
Table 10: Regional Spread of SHGs in India.
Regions Year 1998-99 Year 1999-
2000
South India 65 67
Central India 11 14
West India 10 8
East India 10 9
North India 4 2
Source: NABARD< Shimla.
MICRO CREDIT IN HIMACHAL PRADESH
The micro credit movement in Himachal Pradesh was initiated by NABARD in
1994 with the association of the Chinmaya Tapovan Trust Kangra the mother NGO of
H.P. Year wise linkage shows that there were only 164 linkages (cumulative 354) of
SHGs in the state which rised to 509 in 1999-2000 and jumped to 744 till date.
Performance during this period is given below:
1. Linkages in 1998-99 = 164 (cumulative 354)
2. Linkages in 1999-2000 = 509
3. Linkages till this year = 744

11
In these linkages the commercial bank has financed 51 percent followed by
cooperative banks 28 per cent and RRB 21 percent in the financial year of 1999-2000
and approximately the same proportion is obtained in 2000-2001.
(v) SWARNJAYANTI GRAM SWAROJGAR YOJANA
With a view to provide benefits to the poor eligible families through a single
window delivery system the Government of India has restructured the self employment
programmes and has merged IRDP, Trysem, DWCRA etc. into a new scheme namely
Swaranjayanti Gram Swarojgar Yojana which has been launched from the current
financial year. This Yojana is a holistic package covering all aspects of self
employment such as organization of poor in to SHGs, training, credit, technology,
infrastructure and marketing. The scheme aims at covering 30 percent of BPL families
in each block during next five years i.e. 1999-2000 to 2003-2004. The objective of
SGSY is to bring the assisted poor families above the poverty line in 3 years, by
providing them income generating assets. This scheme is a credit cum subsidy
programme. Subsidy under SGSY will be uniform at 30 per cent of the project cost
subject to a maximum limit of Rs.7500. During the year 1999, 6684 families were
assisted under IRDP/SGSY and Rs.412.29 lakh were given as subsidy to these
families up to 31.12.1999. Against the target of credit mobilization of Rs.19.70 crores
for the year, Rs.18.56 crores were disbursed as credit to these families.
(vi) REVIEW ON STUDY AREA LEVEL
VILLAGE WITH MICRO FINANCE
Along with direct loans the RRB and Commercial Banks are supplying credit
through SHGs whereas, co-operative is providing direct credit to the farmers. These
institutions are only supplying credit to small and marginal farmers because of the
reason that there are very few farmers who could be placed in the category of medium
and large category. In table 10 it may be seen that during 1999-2000 the total number
of loners vary to 305, 153 and 7 in RRB, commercial bank and co-operative society
respectively. The total loan supplied through RRB, commercial bank and co-operative
12
society varies to Rs.44 thousand, 23 thousand and 2.5 thousand respectively. In this
table it may further be seen that coverage of loan distribution is highest (44%) in the
category of marginal farms whereas, it is only 25 per cent in case of small farms.
Similarly co-operative society has covered 100 per cent of the marginal farms. In case
of commercial bank the concentration for supplying credit to marginal farms is only 14
per cent, which increased to 36 per cent in the households of small farms. The 34 and
50 per cent of the total loan distributed through RRB and commercial bank
respectively to all the category of farms under non-farm activities. Poor performance
of co-operative indicates that oldest method of credit has loosed faith of farmers
because of insignificant rate of distribution of credit to the farmers.
Purpose wise break-up of loan shows in Table 10 that out of total loan 40, 11 and
49 per cent of loan supplied to agricultural, animal husbandry and for non-farm
activities through RRB respectively. The said percentage stands to 32,13 and 55 per
cent in commercial bank whereas co-operative has covered only animal husbandry.
This shows out of total distribution about 50 per cent of the loan distributed for non-
farm activities.
Regarding default, recovery and over dues rate it may be seen from the table that
average annual default and over dues rates was highest 30 and 36 per cent
respectively in co-operative society followed by RRB and commercial bank.
VILLAGE WITHOUT MICRO-FINANCE
In this village single branch of commercial bank (SBI) has it’s monopoly over the
region and two private agencies supplying credit for input are also distributing credit to
the farmers. In Table 11 it may be observed that number of lonees vary to 453, 1025
and 723 in commercial bank, private agency first and second respectively.
Commercial bank has distributed credit at highest order (Rs.35143) followed by private
agency 1st (Rs.1025) and private agency second (Rs.727). In this table it may be seen
that percentage share of loan distributed to marginal, small and medium farm vary

13
between 12,14,10 per cent respectively. The low coverage of marginal and small farm
is due to the reason that these farmers are collecting required amount of income from
cash crops and are not interested to draw loan from banks. At the same time low
amount based requirement use to be fulfilled through private agencies where coverage
of small and marginal farmer is higher Table 11. Further table shows that commercial
bank of this village is supplying 64 per cent of the credit to non-farm activities
especially for vehicles. Whereas, this type of loan is not available with private
agencies. In this table it may also be observed that percentage share of agriculture,
off-farm and non-farm activities vary between 36, 3 and 61 per cent respectively.
Regarding average annual default, recovery and overdues rate table reveals that it is
fluctuating between 22,78 and 25 per cent respectively in commercial bank. In case of
private agencies default rate vary from 20 to 28 per cent in agency first whereas said
variation is between 17 to 20 per cent in private agency 2.

14
TABLE 11: PERCENTAGE DISTRIBUTION OF LOAN IN THE STUDY VILLAGES
DURING 1999-2000
Particulars VILLAGE WITH MICRO-FINANCE
VILLAGE WITHOUT MICRO-FINANCE
R.R.B. Commercial
Co-operative Society
Commercial
Private Agency 1
Private Agency 2
1.No. of lonees 305 153 7 453 1025 723 2. Loan distributed (per farm)
43941 22668 2257 35143 829 727
3.Percentage share of marginal farms
44 14 100 10 24 25
4. Percentage share of small farms
22 36 - 14 29 50
5.Percentage share of medium farmer
- - - 120 47 25
6. Percentage share of non farm activities
34 50 - 64 - -
7. Percentage share of Agricultural loan
40 32 - 36 100 100
8.Percentage share of off-farm loan
11 13 100 3 - -
9.Percentage share of non-farm loan
49 55 - 61 - -
10. Average annual default 18 17 30 22 20 17 11.Average annual recovery rate
82 83 70 78 80 83
12.Average annual overdues rate
30 27 36 25 28 20
RESOURCE PROFILE OF SAMPLE BORROWERS
Resource profile presented in Table 12 shows that in the sample size of 25
borrowers in each village the family size is higher (6.88 persons) in village without
micro finance as compared to 4.84 persons in village with micro finance. This may be
due to the reasons that in hilly topography of village without micro finance joint family
system is in higher rank which further be confirmed from the per farm higher
operational area (0.94 ha.) as compared to 0.83 in village with micro finance. At the
same time in village without micro-finance diversification towards cash crops like fruit
and vegetable required higher percentage of labour in agriculture as shown in the

15
Table 9 which ultimately leads to joint family system. In this regard it may be seen in
the table that in village without micro-finance percentage of working age members
mainly engaged in agriculture are higher (71.79%) as compared 42.19 per cent in
village with micro finance. Though, cropping intensity is in lower rate 1.34 percent in
village without micro finance but per head income is higher in said village. This is due
to the reason that physibility of apple orchard in village accounts single crop hence;
intensity is low when compared to village with micro finance. In this regard table
shows that in village with micro finance the percentage income derived from trade and
services accounts 60.71 per cent in comparison of 15.87 per cent in village without
micro finance. Four times higher per head provisional expenses in village without
micro finance reveals that a village with cash crops like fruit and vegetables has shown
more prosperity in comparison of village with micro finance.
TABLE: 12 RESOURCE PROFILE OF SAMPLE BORROWERS IN BOTH THE STUDY VILLAGES
Variables Village Type
Village W/O Micro Finance
Villages with Micro Finance
1. Sample size 25 25
2. Family size 6.88 4.84
3. Index of male education 2.96 2.20
4. Index of female education 1.80 1.60
5. Size of working age population 2.01 2.47
7. Percentage of actual working population 51.74 61.98
8. Percentage of working age member mainly engaged in agriculture
71.79 42.19
9. % of working age member mainly engaged as wage labour
7.86 8.97
10.% of working age member mainly engaged in trade and services
10.25 31.46
11. Operational area in Hect.(per farm) 0.94 0.83
12.G.C. in Hect. 1.26 1.31
13. % irrigated area - 0.63
14. Cropping intensity 1.34 1.58
15. Annual per head income 17890.33 11869.59
16. % age of income from agriculture & its allied activities
74.66 27.51
17. % age income from labour 3.22 8.36
18. % age income from trade and services 15.87 60.71
19. Per head annual provisional expenses in Rs. 4110.47 1114.05
16
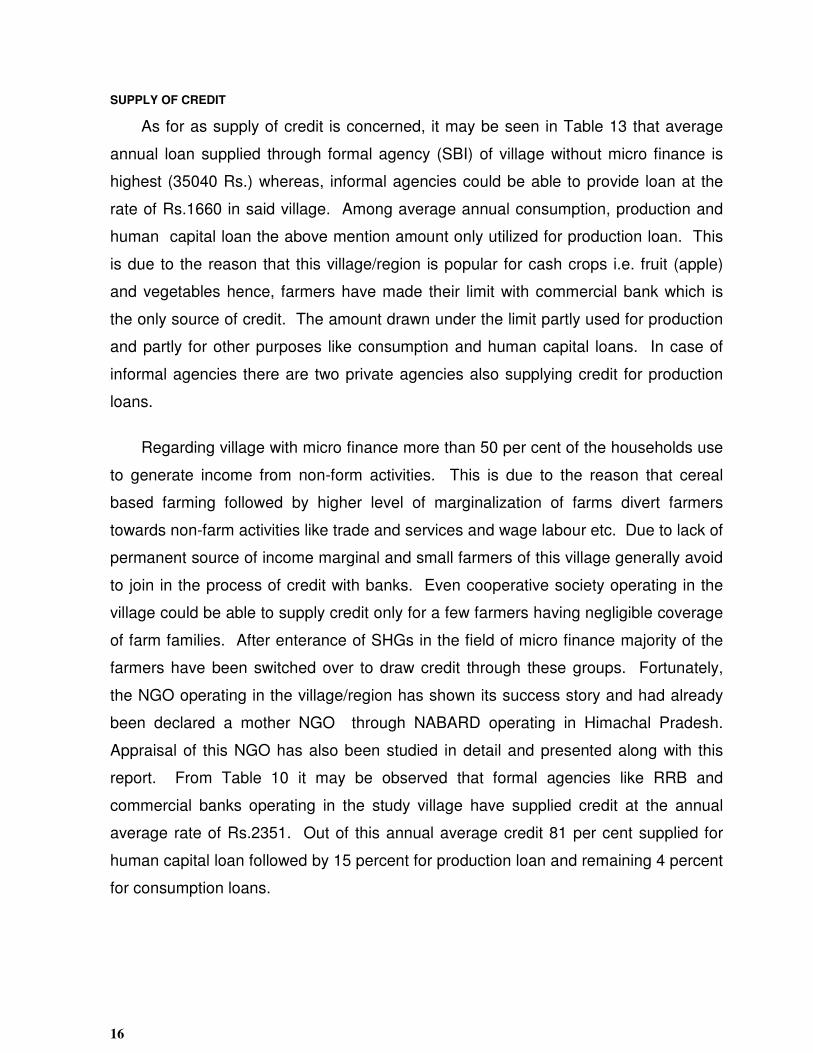
SUPPLY OF CREDIT
As for as supply of credit is concerned, it may be seen in Table 13 that average
annual loan supplied through formal agency (SBI) of village without micro finance is
highest (35040 Rs.) whereas, informal agencies could be able to provide loan at the
rate of Rs.1660 in said village. Among average annual consumption, production and
human capital loan the above mention amount only utilized for production loan. This
is due to the reason that this village/region is popular for cash crops i.e. fruit (apple)
and vegetables hence, farmers have made their limit with commercial bank which is
the only source of credit. The amount drawn under the limit partly used for production
and partly for other purposes like consumption and human capital loans. In case of
informal agencies there are two private agencies also supplying credit for production
loans.
Regarding village with micro finance more than 50 per cent of the households use
to generate income from non-form activities. This is due to the reason that cereal
based farming followed by higher level of marginalization of farms divert farmers
towards non-farm activities like trade and services and wage labour etc. Due to lack of
permanent source of income marginal and small farmers of this village generally avoid
to join in the process of credit with banks. Even cooperative society operating in the
village could be able to supply credit only for a few farmers having negligible coverage
of farm families. After enterance of SHGs in the field of micro finance majority of the
farmers have been switched over to draw credit through these groups. Fortunately,
the NGO operating in the village/region has shown its success story and had already
been declared a mother NGO through NABARD operating in Himachal Pradesh.
Appraisal of this NGO has also been studied in detail and presented along with this
report. From Table 10 it may be observed that formal agencies like RRB and
commercial banks operating in the study village have supplied credit at the annual
average rate of Rs.2351. Out of this annual average credit 81 per cent supplied for
human capital loan followed by 15 percent for production loan and remaining 4 percent
for consumption loans.

17
Regarding default rate it may be observed in Table 10 that in village without micro
finance where only a commercial bank is operating the percentage default rate is 5.88
per cent among sample borrowers. In case of informal resource private agencies
working in village without micro finance have shown 15 per cent default rate. In case
of village with micro finance there is no default rate as farmers are repaying 100
percent of their loan. Banks are also satisfied with 100 per cent repayment through
SHGs. Borrower’s experience with various institutions indicates that farmers of village
without micro finance has highest (11 years) experience whereas, other institution like
SHGs and private agencies supplying credit are working since 3-4 years. Farmers
those are participating in SHGs feel more comfort when compared to other institution.
This may be due to easy method of drawing credit from SHGs as compared to
commercial bank.
Regarding frequency of borrowers transactions it may be observed from the table
that in village without micro finance the annual frequency is about 1.80 whereas, the
said figure is 5.52 in village with micro finance. Less frequency of transaction in village
without micro finance is due to the reason that generally farmers use to market their
produce of fruit and vegetable twice in a year and use to repay their credit limit after
selling of produce. Whereas, small and marginal farmers of village with micro finance
have no such source of income and they use to repay their credit in more installments.
Regarding rescheduling there is no scope of loan rescheduling in commercial
bank but in case of SHGs there are little adjustment at NGO level. As for as total
transaction cost is concerned it accounts Rs.58 at village without micro finance. In this
comparison the total cost for a loan in village with micro finance is only Rs.1.70.
Number of days taken for drawing loan are about two days in commercial bank of
village without micro finance. These numbers of days are slightly less in village with
micro finance. Explicit amount of interest rate vary from 12 per cent in formal
institution to 15 per cent among informal agencies in village without micro finance.
The said rate of interest is 24 per cent per annum in SHGs. Out of 24 per cent 12 per
cent use to be paid to the bank and remaining 12 per cent shared by the members of a

18
group. Regarding leaving, shifting and adopting of institutions the response of both
the village borrowers is in favour of staying with existing institutions. This is due to the
reason that in village without micro finance there is a monopoly of commercial bank
(SBI) hence, question of choice does not arise. Whereas, in village with micro finance
marginal and small farmers have started their entrance for credit through SHGs.
Therefore, the borrowers of both the villages are satisfied with their infrastructure of
credit availability related with various financial institutions.
TABLE: 13 SUPPLY OF CREDIT THROUGH FORMAL AND INFORMAL AGENCIES TO BORROWERS IN BOTH THE STUDY VILLAGE.
Variables Village Type
Village w/o Micro Finance
Village with Micro Finance
Formal Informal Formal Informal
1. Frequency distribution of sample borrow 13.00 8.00 25.00 0.00
2. % share of lending institution 95.48 4.52 100.00 0.00
3. Average annual consumption loan (Rs.) 0.00 0.00 80.00 0.00
4. Average annual production loan 35040 1660 3.60 0.00
5. Average annual human capital 0.00 0.00 1911 0.00
6. Average size of loan 35040 1660 2351 0.00
7. Default rate 5.88 15.00 0.00 0.00
8. Borrower working experience with lender 11.00 4.00 3.00 0.00
9. Index of borrower comfortable level 0.52 0.10 1.00 0.00
10. Annual frequency of borrowers transactions 1.80 0.48 5.52 0.00
11.Rescheduling flexibility 0.06 0.00 0.50 0.00
12. Transaction cost per loan 15.40 4.10 0.00 0.00
13. Total transaction cost per loan 58.00 0.00 1.70 0.00
14.Average No. of days taken for loan 2.08 0.00 1.60 0.00
15.Average No. of collaterals 0.52 0.00 1.00 0.00
16. Repayment flexibility 2.52 2.60 1.00 0.00
17. Explicit amount interest rate (%) 12.00 15.00 24.00 0.00

19
TABLE: 14 POLICY MATRIX IN VILLAGE WITH AND WITHOUT MICRO- FINANCE.
VILLAGE WITH MICRO FINANCE Problems Broad suggestion Action point together with
agencies recommended for undertaking such
actions 1. Traditional cropping pattern
Introduction of cash (vegetable) crops
Agricultural Development office and block office
2. Seasonal unemployment Introduction of cottage industries in the villages assisted through formal institutions
Khadi Udyog and State Wool Federation
3. Less interest of farmers for credit from formal institutions
Awareness through formal agencies
Himachal Gramin Bank (RRB) and Commercial Banks
4. Large number of formalities in Banks
Banks should follow the idea of SHGs for collaterals etc.
Field staff of banks should follow the working of NGOs
5.Financial powers to NGOs
For direct linkages NGO should be provided powers for disbursement of loans
NABARD may intermine in the problem
6.Government support for social evils
Participation and demand for particular problems like wine drinking and exploitation of woman, government should delt the problem in priorities
Deputy Commissioner should involve for such problems.
7. Less devotion of commercial banks for linkages of SHGs
Commercial banks should given targets for micro-finance
NABARD may prove very helpful for involving commercial bank in the process of micro-finance
8. Non-Viable Farms Introduction of Flowericulture/Bee Keeping/Dairy development oriented schemes
District flowericulture Federation, Directorate of Horticulture and Agriculture
9. Villagers participation Developmental approach through NGOs
Financial powers to NGOs
20
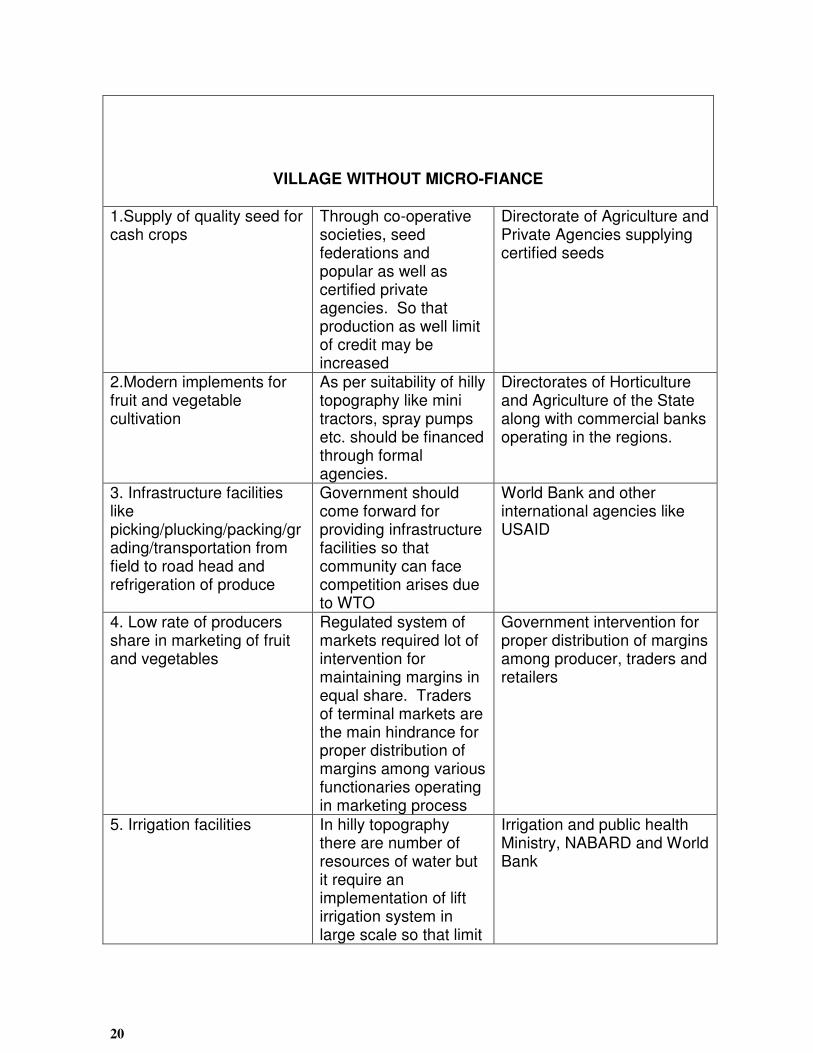
VILLAGE WITHOUT MICRO-FIANCE
1.Supply of quality seed for cash crops
Through co-operative societies, seed federations and popular as well as certified private agencies. So that production as well limit of credit may be increased
Directorate of Agriculture and Private Agencies supplying certified seeds
2.Modern implements for fruit and vegetable cultivation
As per suitability of hilly topography like mini tractors, spray pumps etc. should be financed through formal agencies.
Directorates of Horticulture and Agriculture of the State along with commercial banks operating in the regions.
3. Infrastructure facilities like picking/plucking/packing/grading/transportation from field to road head and refrigeration of produce
Government should come forward for providing infrastructure facilities so that community can face competition arises due to WTO
World Bank and other international agencies like USAID
4. Low rate of producers share in marketing of fruit and vegetables
Regulated system of markets required lot of intervention for maintaining margins in equal share. Traders of terminal markets are the main hindrance for proper distribution of margins among various functionaries operating in marketing process
Government intervention for proper distribution of margins among producer, traders and retailers
5. Irrigation facilities In hilly topography there are number of resources of water but it require an implementation of lift irrigation system in large scale so that limit
Irrigation and public health Ministry, NABARD and World Bank

21
from banks can be enhanced with increase in production
6. Extra facilities of credit far marketing of produce
Keeping in view the perishability of crops farmers should be provided credit in advance through formal institutions so that produce can be supplied up to market in a short period
Commercial Banks as well as State marketing corporations
7. Cold storage facilities Formal and informal institutions may finance for cold stores on the demand of group of farmers. So that perishability may be protected
World Bank NABARD and Commercial Banks
8. Processed product of fruits
Juice and wine factories should be financed in the region
Private agencies

1
CHAPTER -1
INTRODUCTION
Concerns for rural credit are age old and universal. But they seem to have
emerged more from the empathy for agriculture and its people rather than better
scientific temper to understand the role of credit. The need for external financial
services arises from three basic reasons. One, there is a lack of simultaneity between
realization of income and act of expenditure. In other words, these two do not arise at
the same point of time. This gap for farmer’s results from their incomes being once or
twice in a year though their expenditure is more continuous. Two, there is a problem
of indivisibility of fixed capital such as tractors, processing machinery, water harvesting
structures all of which requires large expenditure that cannot be divided into smaller
payments unless loan is available. And three, adoption of technological innovation for
agriculture itselfs facilitated by loan. In early days no intermediary was necessary
when the borrowing took place between individuals or between firms. But because of
changes in economic functioning, direct negotiations between savers and borrowers is
no longer feasible and this has given rise to financial institutions (Desai and
Namboodiri 2000).
For rural credit these institutions includes Reserve Bank of India (RBI), National
Bank for Agriculture and Rural Development (NABARD), three/two tier short term
State co-operative Credit Agencies, long term State co-Operative Land Development
Banks, Commercial Banks, and Regional rural (Banks). Major functions of these
banks are to get the funds from the savers to the users at places in amounts and at
the time they might need. Inspite of all rural development made by these financial
institutions in Indian economy in general and agricultural sector in particular, the
incidence of poverty in agricultural sector continued unabated due to marginalisation of
land holdings.

2
Although no precise figure is available to indicate the size of small and marginal
farmers in the country, one can guage their statistical importance from the fact that the
country had 83,481,000 such holdings (i.e. holding less than 2 hectare in size)
covering an area of 53,721,000 hectares as per in 1990-91 Agriculture Census. In
percentage terms, such plots constituted 78.2% of total agricultural land holdings with
a meager 32.5% share of the total land area. As per 1991 census, the country had a
rural population of 628.7 million (74.37 of the total population), of which about 314.1
million were rural workers. Assuming that the proportion of small and marginal
farmers was the same as the proportion of small and marginal holdings (i.e. 78.2%),
the country had an estimate 86.57 million small and marginal farmers (i.e. 27.53% of
the rural labour force) in 1991. This figure would rise to 161.17 millions (i.e. 51.33% of
rural labour force), if agricultural labourers are included, and to 290 million (i.e. 92.33%
of rural force), if other rural workers are also added. (Agricultural Statistics at a
glance, 2000). These statistical figures provide only a rough idea about the upper
bounds and lower bounds of the importance of small and marginal farmers as a
component of the rural labour force. The credit flow problem to this vast size of the
population obviously deserves special attention (Datta and Sriram 2001).
In this vast size of the population (marginal and small farmers) there are three sub
categories having variation in economic status which ultimately have difference in their
demand for credit. The first sub-category includes the weakest section of marginal
farmer households. These household can be treated as nearly landless. They supply
mostly seasonal agricultural labour, often supplying manual labour in diverse allied
and non-farm activities like forestry, mining, household industries, construction and
transport. The first and foremost requirement of this sub-category is consumption
credit during slack months. They may also need additional amounts of credit for
contingent consumption (during illness, marriages etc.), for working capital, and for
purchase of small productive assets like livestock, which provides an important
supplementary source of income. Catering to their credit needs often serves the rural
poverty alleviation goal of the country.

3
The second sub-category includes mainly marginal farm households. Though
agriculture is the main source of their income, some of them derive a part of their
income through wage employment in farm and non-farm (both rural and urban)
activities. Some of these households may be partly engaged in even petty self-
employment activities with in rural areas and their urban fringes. Although these
households may occasionally face short falls in consumption, their main need for credit
is working capital to increase production. They may of course need occasional and
additional credit for acquiring productive assets like pump set, bore wells, livestock,
work sheds and machines etc. This segment is poor, though not the poorest of the
rural community. So, catering to their credit needs meets partly the poverty alleviation
goal and partly the growth and diversification goal of the country. While the traditional
and formal credit institutions don’t generally meet the consumption credit needs of this
sub category of rural households, new generation institutions like self help groups
(SHGs) seem to have started addressing this problem.
The third sub-category includes the relatively affluent section of small farmer
households, which have gone for commercial production of crops (including cash
crops), besides engaging themselves in allied agricultural activities like animal
husbandry, fishery, farm forestry etc. Some of these households may be partly
engaged in rural non-farm activities like agro-processing, manufacturing, trading and
servicing (e.g. running provision stores, repair shops, tea stalls etc.) Although this sub
category has a steady demand for working capital as well as for term loans, they may
also suffer from inadequate access to credit, especially traditional formal sector credit.
Catering to their requirement would certainly serve the growth and diversification goals
of the economy. In this sub category the design of non-farm credit is generally
targeted in a direct manner towards creation of self-employment opportunities.
The above stated stratification is necessary not only for a better understanding of
the underlying issues on credit, but also for evolution of suitable policy options.
Moreover, credit is necessary for this section of the rural community not only for
meeting their basic economic needs at the present movement, but also for their future

4
socio-economic development. For example, use of child labour is a very common
problem especially among the first two sub-categories of the study.
In Himachal Pradesh the situation of marginalization of land holdings is also
similar to that of India. Out of the total geographical area of 55.67 lakh ha., 10.14
lakhs ha. is under agriculture, being cultivated by 8.44 lakh farmers. The average size
of land holdings (less than 1.0 ha.) accounts 5.38 lakhs having 2.18 lakhs of total area
(21.49 per cent of total area) showing 0.41 percent of average size of holdings.
Similarly small farmers (1.0 to 2.0 ha.) accounts 1.68 lakhs of holdings by covering
2.28 lakhs ha. of total area constituting 22.52 per cent of total area showing average
size of 1.36 ha. If small holdings included than marginal and small holdings account
83.65 percent cultivating on 44.01 percent of the total area (Table 1.1).
TABLE: 1.1 LAND HOLDINGS PATTERN IN HIMACHAL PRADESH
Size (Ha.) No. of holdings (In
lakhs)
Total area (Ha) (In lakhs)
% age Average size (Ha.)
Less than 1.0 5.38 2.18 21.49 0.41
1.0-2.0 1.68 2.28 22.52 1.36
2.0-4.0 0.46 2.61 25.74 2.72
4.0-100 0.37 2.07 20.39 5.66
More than 10.0 0.55 1 9.86 18.63
Total 8.44 10.14 100.00 1.20
Source: Agriculture Census 1990-91.
In such a scenario the availability of rural credit from rural financial institutions at
the right time, type and amount becomes a basic need of these people. Infact,
financing institutional agencies lack the requires mechanism to assess their credit
needs and perceive that most of these are for non-productive purpose. Another
reasons is that these institutions hesitate to monitor large number of small accounts of
5
poors with potential risks that arise due to clients inability to provide collateral security.
As on 1990-91 out of 63 million operational holdings in India below one hectare of land
only less than 25 percent of them had access to agricultural credit from the formal
institutions in India. Therefore, they continued to depend on informal agencies like
money lenders etc. by paying exorbitant rate of interest. All these problems led to
evolving supplementary credit delivery mechanism by landing at a group level the self-
help groups (SHGs) concept came into existence.
Success of credit thus depends not only on the evolution and smooth functioning
of a nation-wide insurance market to mitigate the effects of various contingencies, but
also on the supply of various borrower-specific complementary services in specific
local situations. This is a job where the new generation financial institutions with
emphasis on micro financing seem to be having comparative advantages, as
compared to their traditional counterparts. Although the rate of growth of micro
finance organizations is un-presses dented throughout the world, their importance and
significance are appreciated in the Indian context in recent times. These institutions
not only possess capabilities to provide various credit supporting services, but also
seem capable of over coming some of the well-known problems of traditional formal
sector institutions-mainly because of their familiarity with the details of local conditions.
The present study is undertaken following the recommendations of the
Parliamentary Standing Committee on Agriculture to study the credit flow problems of
only small and marginal farmers in getting easy and cheap credit from the rural
financial institutions. The study has to examine the credit flow problems of not only
pure cultivating households but also of impure categories of cultivators (selling labour
in the market) with in rural households owning less than 2 hectare of land. Although
landless households and households operating on 2 or more hectares of land are not
the target groups of the study it might be useful to include a small sample of such
households as control, not only for providing a contrast to the credit flow problems of
the later groups, but also for examining if there is any crowding out effect of credit
between small and marginal farmers, on one hand and medium and large farmers, on

6
the other. Moreover, as rural financial system comprises of not only traditional
sources with in both formal (like banks, government departments, co-operatives etc.)
and informal (e.g., rural money lenders) segments, but also new generation institutions
with emphasis on micro finance with in the same two segments, attempt need to be
made to cover the experiences of both traditional and new generation components of
the system. This is necessary to find out whether new generation institutions are
making a difference to the flow of credit to this target group of farmers.
Objectives of the Study:
The present study has the following four objectives:
1. To review the credit experiences of traditional financial institutions with
respect to the vulnerable sections of the farming community (i.e. small and marginal farmer households and labour households) based on the existing literature and available documents in the country.
2. To document through case studies the innovative credit experiments of new
generation rural financing institutions, especially in private and co-operative sectors, in India, with respect to the same target groups.
3. To identify and analyse the existing credit flow gaps and reasons there for
the same target groups; and
4. To suggest measures at both economic policy level and enterprise level to ensure smooth flow of credit on sustainable basis to this group.
METHODOLOGY
Himachal Pradesh, as have suggests, lies in the lap of Himalaya and the altitude
varies as one moves from north to south. Because of the varying altitude the agro-
climatic conditions also vary and the conditions prevailing at one particular place may
be totally different from another. This has important consequences as for as the input
structure and production pattern etc. are concerned. Therefore, the whole may have
important bearing on the viability of the farms. Under such conditions the Directorate
of Land Record of Himachal Pradesh divided total geographical area into three agro-
climatic zones (a) low hill zone (up to an elevation of 650 meters above mean sea
level; (b) mid hill zone (from 651 to 1800 meters above mean sea level; and (c) high

7
hill zone (from 1801 to 2200 meters above mean sea level). As for as cropping pattern
is concerned fruit and vegetable base farming in mid and high hill zone and cereal
based farming in low hill zone use to be practiced.
For the present study multistage random sampling technique was adopted. At
first stage on the recommendation of Lead Bank of Himachal Pradesh district Shimla
in high hill zone where concentration of fruit and vegetable is higher in the state and
district Kangra where cereal based farming is operating was selected.
Further on the recommendation of Lead Bank of selected district (Shimla and
Kangra) two villages named matiana (a cluster of three villages) and Jheol (a cluster of
four villages) respectively were selected for the detailed study. In Kangra district
village Jheol was selected on the recommendation of NGO i.e. Chinmaya Rural Health
Care and Training Centre, a health and rural development wing of Chinmaya Tapovan
Trust Kangra, a leading NGO in the State. Complete enumeration of the selected
villages was recorded in order to get not only an overall picture of credit but to draw an
idea of the context variables. First, the village households stratified on the basis of
their land holding size. Then a probability proportional type random sample of 15
agricultural households picked up from the group of small and marginal farmers. A
group of 5 pure labour households and 5 non-target group farmer households (i.e.
those having a land holding size of 2 or more hectare) picked up at random as control
group for each sample village to compare the credit experiences of the target groups
(Table 2). In this distribution 52 and 40 percent of the sample farms have been placed
under marginal category of farms in Kangra and Shimla districts respectively. A
detailed and structured questionnaire was used to collect borrowers household level
data.
Regarding secondary data, various credit institutions formal and informal having
juridition over the selected villages was conducted and information’s regarding credit
to various categories and activities was recorded on pre-tested schedule. Along with
8
these institution relevant data from NABARD and Lead Bank of the state as well as
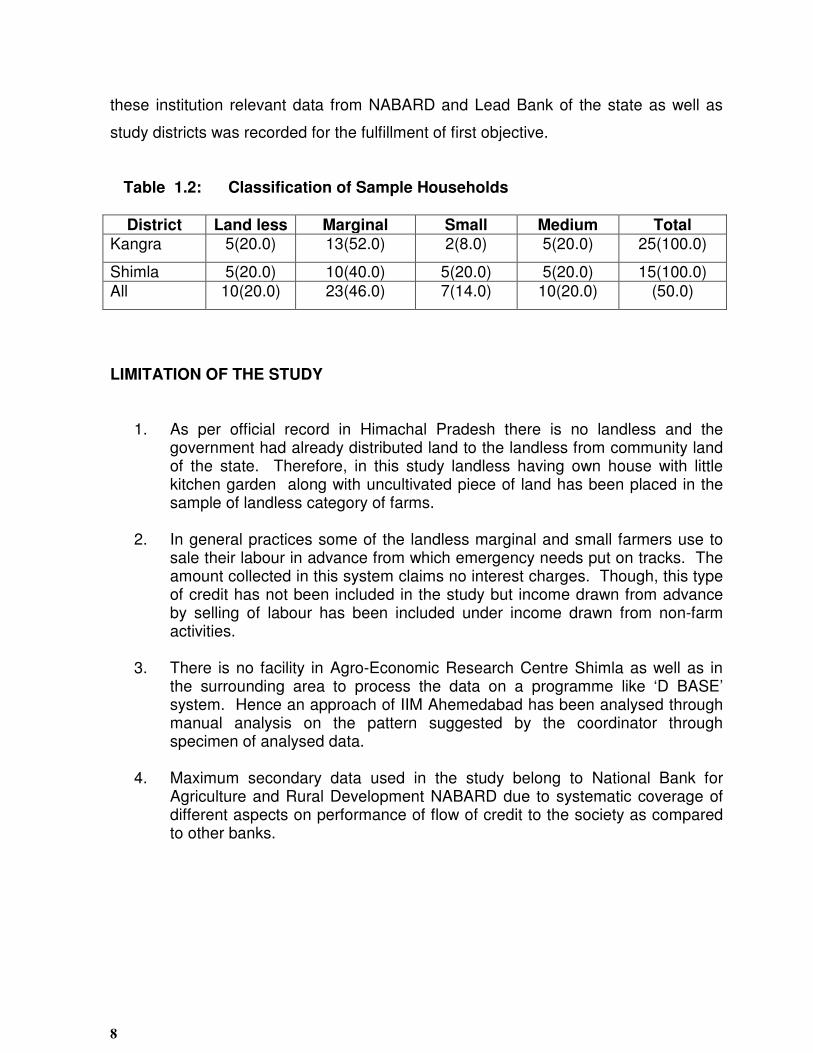
study districts was recorded for the fulfillment of first objective.
Table 1.2: Classification of Sample Households
District Land less Marginal Small Medium Total Kangra 5(20.0) 13(52.0) 2(8.0) 5(20.0) 25(100.0)
Shimla 5(20.0) 10(40.0) 5(20.0) 5(20.0) 15(100.0)
All 10(20.0) 23(46.0) 7(14.0) 10(20.0) (50.0)
LIMITATION OF THE STUDY
1. As per official record in Himachal Pradesh there is no landless and the government had already distributed land to the landless from community land of the state. Therefore, in this study landless having own house with little kitchen garden along with uncultivated piece of land has been placed in the sample of landless category of farms.
2. In general practices some of the landless marginal and small farmers use to
sale their labour in advance from which emergency needs put on tracks. The amount collected in this system claims no interest charges. Though, this type of credit has not been included in the study but income drawn from advance by selling of labour has been included under income drawn from non-farm activities.
3. There is no facility in Agro-Economic Research Centre Shimla as well as in
the surrounding area to process the data on a programme like ‘D BASE’ system. Hence an approach of IIM Ahemedabad has been analysed through manual analysis on the pattern suggested by the coordinator through specimen of analysed data.
4. Maximum secondary data used in the study belong to National Bank for
Agriculture and Rural Development NABARD due to systematic coverage of different aspects on performance of flow of credit to the society as compared to other banks.

9
CHAPTER –II
REVIEW ON PERFORMANCE OF RURAL FINANCIAL INSTITUTIONS
This chapter discusses the review on performance of both formal and informal
rural financial intermediaries (RFIs). Objectives are itself explanatory, analysis of
there performance is pursued to identify their strengths and weaknesses. Another
purpose is also to analyse what rural credit policies among other factors have
accomplished so that initiatives that are taken to change them under new economic
environment can be appraised. In this regard credit experiences of traditional financial
as well as new generation institutions have been discussed at national, state and at
study area level. In this chapter co-operative has been studied in more details due to
oldest source of credit and experiences gained from this institution may become the
strength for other traditional and new generation financial institutions. National Bank
for Agriculture and Rural Development (NABARD) was followed for secondary
information. Broadly, performance of co-operative, commercial bank, Regional Rural
Bank, NABARD and micro financing in generation schemes and other schemes have
been discussed in below mentioned order.
(i) COMMERCIAL BANKS
The history of Commercial Banking in India dates back to the establishment of
the “The Bank of Hindustan in 1770 however, organised banking in a regulated form,
started in 1921. This bank includes both nationalized (that is, public sector) and
private Banks. Imperial Bank of India was nationalized in 1955 at the recommendation
of the Committee of Direction for the All India Rural Credit survey. The bank is now
known as the State Bank of India (SBI) during 1956-60 eight state associated banks
were made subsidiaries of the SBI. Fourteen major commercial banks were
nationalized in 1969 and six more in 1980. But, until nationalization their operations

10
in rural areas were meager. These banks are also governed by the RBI’s banking act.
of 1949.
In case of institutional rural financial system it includes field-level institutions.
These are primary agricultural cooperative societies (PACS), cooperative land
development (CLDBs), Indian Scheduled Commercial Banks (ISCBs), and Regional
Rural Banks (RRBs) for ‘direct’ rural credit. For indirect credit there are state co-
operative banks (DCCBs), ISCBs, RRBs and rural electrification corporations (RECs).
For rural deposits they include co-operative land development banks (CLDBs),
besides SCBs, DCCBs, ISCBs and RRBs. The financial institutions required to
become multifunctional that is consistent with the financial services needs of not only
the farming community but also other agencies to support and accelerate investment
in real resources for agriculture. Above mentioned institutional rural financing system
has made positive contribution to the degree of agricultural progress and investments,
despite its performance. These institution will also prove helpful to micro financing in
new generation financial institutions i.e. self-help groups (SHGs).
COMMERCIAL BANKS IN HIMACHAL PRADESH
As on March 2000, there are 19 Commercial Banks operating in Himachal
Pradesh through a network of 648 branches of which 539 branches are located in rural
areas. SBI, PNB, UCO and SBOP are the major players with 551 branches.
The total number of bank branches in the State including the branches of
Regional Rural/Co-operative Banks was 1069 as on 31 March 2000.
Performance
The total deposits of banks aggregated Rs. 7789.17 crore as on 31 March 2000
while the outstanding advances were to the tune of Rs.2110.04 crore.
The CD Ratio, which was 26.5 as on 31 March 1999, rose to 27.10 as on 31 March
2000.
11
GROUND LEVEL FLOW OF CREDIT
Percentage share of credit in agricultural allied activities decreased from 35 per
cent to 31 per cent of the total credit during 1997-98 to 1999-2000. Only services
sector has shown increase in percentage share of credit during said period (Table
2.1).
From the above, it may be seen that in all these years targets were achieved. During
1999-2000 achievement was 118% of the annual target. Achievement recorded a
growth rate of 34% over previous year.
TABLE: 2.1 GROUND LEVEL CREDIT FLOW FOR THE PRIORITY SECTOR
DURING THE PAST THREE YEARS, UNDER VARIOUS SECTORS
(Rs. in crore) Sector 1997-98 1998-99 1999-2000
T A % of A
T A % of A
T A % of A
Agri. & Allied Activities
86.28 96.66 112.03 116.4 145.59 118 169.32 152.87 90
SSI 46 50.9 110.65 59.79 63.76 119 52.21 75.48 145
Services 111.84 129.07 115.41 146.97 149.91 115 186.42 253.69 136 Total 244.12 276.63 113.32 323.16 359.26 111 407.95 482.04 118
Source: National Bank for Agriculture and Rural Development (NABARD) Shimla.
T = Target, A = Achievement RECOVERY POSITION
The recovery position of Bank Loans in the State leaves much to be desired
especially under the Primary Sector, given in Table 2.2. Percentage collection of
loans related to agriculture and allied activities has shown poor response in
comparison to non-farm and tertiary sector.
12
TABLE: 2.2 RECOVERY POSITION OF BANK LOANS IN THE STATE.
(Rs. in Crores) Sector As on 31 March 2000
Demand Collection %age Agriculture & Allied Activities 126.05 58.51 46.42
Non Farm Sector/SSI 62.44 31.39 50.27 Tertiary 159.25 107.01 67.20 Total 347.74 196.91 56.62
Source: National Bank for Agriculture and Rural Development (NABARD) Shimla.
CREDIT OUTSTANDING
Total outstanding advances shown in Table 2.3 that outstanding amount has
shown 100 per cent increase during 1997 to 2000. In case of co-operative the
outstanding amount is almost stagnant may be due to low-level of credit supply. On
the whole at institutional level the rate of outstanding advances has increased.
Table 2.3: LOAN OUTSTANDING DURING 1997 TO 2000.
(Rs. in crores)
Agency 1997 1998 1999 2000
Commercial Banks 823.36 969.82 1254.32 1453.23
Regional Rural Banks 53.62 55.59 74.03 100.81
Cooperative Banks 298.51 328.98 445.32 556.00
Total 1175.49 1354.39 1773.67 2110.04
Source: National Banks for Agriculture Development Himachal Pradesh.
(ii) CO-OPERATIVE CREDIT INSTITUTIONS
ORIGIN OF CO-OPERATIVES
There is no single view of origin of co-operation in the recent history; the generally
accepted view is that it has been the result of industrial revolution particularly in
England. The industrial revolution brought out the conditions of perpetual class

13
conflict, labour unrest property-less, money-less and homeless. Then, it would not be
incorrect to conclude that co-operation ows its origin to situation created by industrial
revolution in great Britain. The prevailing conditions of unemployment, illiteracy, low
wages, long and inhuman working hours and conditions etc. forced liberal and
farsighted persons to lead working class to work out ambitious systems of social
reorganization. Thus, it is indicated that co-operatives were conceived an answer to
the wrong of capitalism.
CO-OPERATIVE IN INDIA
ANCIENT
According to some scholars, the co-operation took four principle forms in ancient
India. These were Kula (community), Grama (village), Shreni (class) and Jati (cast).
The Kula was the first form of co-operatives which was both political and socio-
economic in nature. The Grama emerged after Kula and took works for economic and
social progress of village. The Shreni is a later development and was co-operative
and economic organization of artisans, workers, merchants, traders etc. The co-
operation at Jati level was for social purpose.
MODERN The development of co-operatives in India can be traced back to
1883 when Sir William Wedderburn and Justic Ranacle prepared a scheme for
establishing an Agricultural Bank in Poona to provide loans to farmers. Though this
scheme was not accepted in its totality its recommendations were incorporated in the
Land Improvement and Agriculturist Loans Act. (XIX of 1883 and XII of 1884). This
Act is accepted as foundation stone of co-operative movement in India.
The twentieth century for co-operative movement in India started with passing of
Co-operative Credit societies Act on March 25, 1904. Under this Act societies could
be formed and registered as co-operative credit society by ten persons for the purpose
of thrift and self help. The societies were given legal personality and were authorized
to raise funds and carry on their business in a corporate capacity. The deficiencies of
this Act came into force and to take care of these the government passed Co-

14
operative Societies Act in 1912. As a result there was a rapid growth in number of co-
operative credit societies after 1912. Substantial growth was also visible in non-
agricultural credit societies and their membership. In the mean time government
wanted to take stock of the situation and to ascertain whether the movement was
spreading on sound lines or not. Accordingly, a committee was constituted under sir
Edward Maclagan to go in to the matter. The Committee submitted its report in 1915
emphasizing the necessity of guarding against dangers of granting credit too easily. It
also stressed that the pace of movement should not be unduly quickened from
outside.
On passing of Govt. of India Act (Montague-Chemsford Act) in 1919, co-operation
became a provincial subject to be administered by provincial governments. Bombay
led by passing the Co-operative Societies Act I of 1925 followed by Madras Act I of
1932, Bihar and Orissa Act VI of 1935. Coorg Act II of 1936 and Bengal Act XXI of
1940. The Act of 1919 gave a great boost to co-operative movement but
simultaneously problem of over-dues started increasing and a policy of rapid and
indiscriminate expansion was followed. This state of affairs led to appointment of
many Committees and Commissions. In 1930, the Central Banking enquiry
Committee recommended for deofficialisation of the movement.
The great economic depression of 1929, the world over, gave a severe jolt to the
co-operative movement in India. It suffered very seriously in Bihar, Bengal and many
other provinces. Thereafter the efforts were directed towards rehabilitation,
reconstruction and reorganization of movement rather-than further rapid expansion.
The establishment of Rural Credit Department in Reserve Bank of India (RBI) gave a
new lease to life of the movement. In 1936 a report prepared by RBI recommended
that all village credit societies should be converted to with purpose societies. No
farmer should be sanctioned loan more than once a year.
The abnormal conditions created by World War II led to substantial development
of co-operative sector in India. Many type of new co-operative societies e.g. weaver,

15
industrial milk vegetable growers, cane growers societies etc. came into being. During
1945-46 the movement touched 3.8% villages and covered 10 per cent of population.
The stress was also shifted from the credit aspect to productive and distributive
functions. The need was also felt to explore the multipurpose potentialities of the co-
operative sector.
Further, Agriculture Finance sub-Committee was appointed under Prof. D. R.
Gadgil which in 1945 recommended that the spread of co-operation would provide
effective and long lasting solution for most problems of rural economy and therefore
state should flow in larger amounts to co-operative sector. Substantiating this, R.G.
Saraiya in 1945 in a report of Co-operative Planning Committee recommended that
primary credit societies should be so reformed and reorganized so as to serve as
centres of general economic development of their members. Many of these
recommendations were accepted by the 15th Conference of Registrar of co-operative
Societies.
POST INDEPENDENT ERA
This phase of co-operative development began with appointment of All India rural
Credit survey Committee in 1951 which in its report in 1954 stated that “Co-operatives
are the best agency for supplying credit to agriculturists but the situation reveals a sad
picture”. To improve the situation, among other things, it recommended that economic
liability of co-operatives at village level was essential and the short term loans should
be given on the basis of expectancy of crop rather than the security of land etc.
PLAN PERIODS
During the different five year plans the co-operative movement continued to get
due attention from the planners, though some scholars differ on this. During first five
year plan the co-operation was recognized as an instrument of planned economic
action in democracy. It was stated that co-operative form of organization is capable of
yielding the advantages of corporate sector without some of its disadvantages. All
form of co-operative enterprises became focus of govt. policy. The plan emphasized

16
fees development of co-operative farming, marketing and processing of raw material in
rural areas, provisions of adequately trained staff and to bring 50 per cent of villages
and 30 per cent of population under co-operative cover.
The second five years plan was drawn, as far as co-operative sector is concerned,
on the basis of recommendation of All India rural Credit survey committee. The co-
operation was assigned the important role of bringing out sizeable increase in national
income, rapid industrialization, increasing employment opportunities and reduction in
socio-economic inequalities. During this plan Agricultural Produce Development and
warehousing corporation act was passed in 1956, as a result National Co-operative
Development and warehousing Board was established. The Central Warehousing
Corporation was established in 1957 whose 40 per cent paid up share capital was
owned by National Co-operative Development Corporation (NCDC). NCDC in its
resolution in 1958 emphasized the rural economy rebuilding through co-operatives.
Subsequently, a working group was set up by Central govt. to consider administrative
and organizational needs for implementing NCDC resolution. This led to policy letter to
States during 1959 indicating the broad out lines to be followed in case of co-operative
development. These guidelines were discussed at Mysore Conference of state
ministers of co-operation and were accepted. The movement was further
strengthened by Committee on Co-operative Credit in 1960 and working group of
panchayats and co-operatives, 1961.
The highlights of co-operative movement during third five year plan was the
setting up of Committee on Co-operative Administration, 1963, Committee on co-
operative Marketing in 1964 and Committee on co-operation in 1964. The reports of
these Committees had some far reaching recommendations aimed at development of
co-operative sector.
The fourth plan witnessed the Conference of State Ministers of Co-operation in
1969 and All India Rural Credit Review Committee in the same year. The important
recommendation included setting up of Agricultural Credit Board, Small farmers

17
Development Agency, Rural electrification Corporation, and bigger role of Agricultural
Refinance Corporation.
One of the major achievement of co-operative development during fifth five year
plan was the National Co-operative Policy Resolution in 1977. The resolution aimed at
development of co-operatives as shield of weak through its development at national
basis and gradual reduction in regional imbalances. the movement should be
autonomous, self-reliant movement and should be based on generation of internal
resources.
In fifth five year plan major emphasis was given to increase in credit advances to
small and marginal farmers and other weaker sections. This objective was duly
achieved and share of such farmers increased from 29 to 40 percent during 1973-74.
At the end of this plan the CRAFICARD Committee was constituted which reviewed
the institutional arrangements for agricultural and other credit necessary for
development of rural people. The Committee suggested that primary societies should
be made viable and multiple co-operative societies should work on multipurpose
objectives. At the same time, committee also suggested the establishment of National
Bank for Agricultural and rural Development (NABARD).
In Sixth Five Year Plan it was decided that primary co-operative societies, the
commercial banking and the Regional rural Banks would be the three main agencies
which were to be involved for provision of credit for agriculture and allied sectors.
During this plan period many weaknesses were noticed e.g. over dues exceeded up to
40 per cent. Major development in the field of credit during this plan was the setting
up of National Bank for Agriculture and Rural Development in July, 1982.
In seventh five year plan the emphasis was given to (1) the development of
primary agricultural credit societies; (2) realignment of the policies and procedures to
expand the flow of credit and ensure supply of inputs and services particularly to the
weaker sections; (3) special programmes for the North-Eastern Region; (4)

18
strengthening of the consumer co-operative movement in urban as well as rural areas
and (5) promoting professional management.
During this plan, the National co-operative Development Corporation (NCDC)
evolved a very useful scheme of Integrated Co-operative Development Project (ICDP).
The first project was introduced in Nadia district of West Bengal state and the second
project was introduced in Bilaspur district of Himachal Pradesh. Such projects have
also been introduced in other states of the country. a high level committee called
Agricultural Rural Credit Survey Committee constituted through Reserve Bank of India
under the chairmanship of Prof. Khusro in 1986 and submitted its report on 1989. The
suggestion of the Committee was to restructure the co-operative movement in which
control of government was objected.
As a result, the eighth five year plan envisages to give more autonomy and
democratic spirit to the co-operatives. In 1991 the Reserve Bank of India set up a
Financial Reforms Committee under the Chairmanship of Mr.Narsihamam called
Narsihamam Committee to suggest the financial sector reforms. Another development
of this era is the Draft of Model Co-operative Law, brought forward by the Planning
Commission (May, 1991) based on the report of the committee headed by Chaudhary
Braham Prakash, former Union Minister.
The approach paper to the Ninth Five-Year Plan (1997-2000) which has been
approved by the National Development Council, has inter-alia laid emphasis on
evolving an environment in which co-operatives will become efficient viable and
competitive. It is also proposed to activate this through professionalization,
diversification of activities including market opportunities and effective recovery
system. At the same time the Deputy Chairman, Planning commission highlighted
various issues like amendment in the Multi State Co-operative Societies Act; Need for
expeditious issue of license to Co-operative Bank of India (COBI); Rehabilitation of
sick co-operative units; exception of co-operation of co-operatives from the imposition
of income tax and their entry into the insurance sector.

19
CO-OPERATIVES IN HIMACHAL PRADESH
In Himachal Pradesh, the Co-operative Movement started way back in 1892. The
first society was constituted at a place called Panjavar in district Una. This was an
agricultural co-operative society. The co-operative societies in the state prior to 1956
functioned under the provisions of Central co-operative societies Act. Of 1912 when
Himachal Pradesh co-operative societies act was passed and enforced. Presently the
co-operative societies in the state are regulated by Himachal Pradesh Co-operative
Societies Act of 1968 which came in to force during 1971.
CO-OPERATIVE BANKS
Short-Term Credit Structure
The Himachal Pradesh State co-operative Bank Ltd. (HPSCB) is an apex bank
under short-term credit structure. It has a network of 124 branches as on 31 March
2000 in 6 districts of Himachal Pradesh viz. Shimla, Kinnaur, Bilaspur, Mandi, Sirmour
and Chamba. The HPSCB Ltd. Extends direct finance to co-operative credit societies
under the two-tier structure. There are two Central co-operative Banks in the State
namely Kangra central co-operative Bank Ltd. (KCCB) and Jogindra Central co-
operative Bank Ltd. (JCCB). While KCCB with 120 branches operates in five district
viz. Kangra, Hamirpur, Kullu, Una and Lahaul & spiti, JCCB with 19 branches covers
Solan district.
The primary credit societies at base level have extensive coverage extending to
all the 16916 villages in the State with a total membership of 11.85 lakh at the end of
March 1999 covering thereby 100% of the villages (Table 2.4).
However, financing PACS forms a weak link of the Short-term (ST) credit system
in the State. The average ST loan outstanding per society is much lower than the
minimum loan business of Rs.10.00 lakh required for viability of a society. The State
Government/State Cooperative Bank may, therefore, have to identify all non-viable

20
societies and study the problem of their viability and prepare a time bound action plan
to make each society viable by way of reorganizing their management.
TABLE 2.4 PRIMARY AGRICULTURE CREDIT SOCIETIES (PACS)
A profile of PACS as of 31 March 1999 is given below :-
Particulars Position of 1998-99
No. of Coop.Societies 4,403
Membership (In lacs) 11.85
Share Capital (Rs.lacs) 10,366.83
Working Capital (Rs.lacs) 279,384.78
Loans disbursed (Rs.lacs) 5,763.51
Distribution of Agricultural Inputs (Rs.lacs) 4,271.46
Distribution of consumer goods (Rs.lacs) 20461.30
Coverage of Rural Population in Coop.
Fold
100%
Source: National Bank for Agriculture and Rural Development (NABARD) Shimla.
NON-COMPLIANCE WITH THE MINIMUM INVOLVEMENT CONDITION
All the cooperative banks i.e. SCB/CCBs have not complied with the MI
stipulations as fixed by National Bank NABARD as may be seen from the details on
Table 2.1.
MI level fixed for 1997-98, 1998-99 and 1999-2000 together with achievements for
the said years is indicated in Table 2.5.
Due to their surplus resource position vis-avis low level of agricultural lending, the
Cooperative Banks have not been able to achieve ML level stipulated by NABARD and
as such they have not been able to seek short-term credit limits from NABARD.

21
TABLE : 2.5 YEAR WISE ACHIEVEMENTS AND MI LEVEL. (Rs. in lakh) Name of the banks 1997-98 1998-99 1999-2000
(up to Oct.1999)
HPSCB Himachal Pradesh State Co-operative Bank
8.095 (143.61)
9,851.32 (229.91)
12539 (110.87)
KCCB Kangra Central Co-operative Bank
12,168.6 (98.93)
13,551,34 (127.12)
18275 (61.85)
JCCB Jogindra Central co-operative Bank
1,108.29 (15.55)
1,115.13 (24.83)
1499 (28.01)
Source: National Bank for Agriculture and Rural Development (NABARD) Shimla.
Note: Figures in bracket indicate achievements.
LONG-TERM CREDIT STRUCTURE
The present LT structure is unitary as well as federal in character. The Himachal
Pradesh State Co-operative Agriculture and Rural Development Bank Ltd.
(HPSCARDB) with 28 branches operating in 9 districts while Kangra Primary
Cooperative Agriculture & Rural Development Bank Ltd. Dharamshala (KPARDB) with
12 branches covers the remaining three districts, namely Una, Hamirpur and Kangra
(Table 2.6).
TABLE : 2.6 LOANS PORTFOLIOS OF HPSCARDB AND KPARDB DURING THE LAST TWO YEARS WERE AS UNDER:
(Rs.in lakh) Name of the
Bank/purpose Loans issued Loans
outstanding Loans issued Loans
outstanding 1998-99 1998-99 1999-2000 1999-2000 HPSCARDB 3224.00 10485.00 4784.00 13598.00
KPARDB 1396.00 3203.00 2053.00 4587.00 Source: National Bank for Agriculture and Rural Development (NABARD) Shimla.

22
While the deposits of Cooperative Banks registered a meager growth of 4 per cent in
1999-2000, the outstanding advances rose by 23 per cent increasing the CD Ratio,
which stood at 33.7 per cent as on 31 March 2000 (Table 2.7).
TABLE: 2.7 THE PERFORMANCE OF CO-OPERATIVE BANKS (EXCLUDING HPSCARDB) DURING LAST TWO YEARS WAS AS FOLLOWS: (Rs. in crore) Name of the banks
Deposits Advances (O/S) CDR 31.03.99 31.03.00 31.03.99 31.03.00 31.03.99 31.03.00
HPSCB 843.79 761.33 180.58 254.02 21.40 33.40
KCCB 675.58 813.24 121.64 123.87 18.01 15.20 JCCB 63.60 73.82 35.52 42.87 55.85 58.10 TOTAL 1582.97 1648.39 337.74 420.76 28.13 33.70 GROWTH 35% 4% 42.70% 23% - -
REGIONAL RURAL BANKS
Regional rural banks were established in 1976. Their share capital is contributed
by the Government of India, concerned state governments and commercial banks in
the proportion of 50:15:35 respectively. These banks are also scheduled commercial
banks supported by the government but sponsored by the commercial banks. RRBs
are located in district headquarters with branches within the district. Some of them
serve more than one district. They were introduced to lend exclusively to landless
labourers, marginal farmers, small farmers and artisans, though they can mobilize
deposits from all.
REGIONAL RURAL BANKS IN HIMACHAL PRADESH
There are two Regional Rural Banks (RRBs) in the State, namely, Himachal
Gramin Bank (HGB) and Parvatiya Gramin Bank (PGB) with Head Offices at Mandi
and Chamba respectively. As on 31 March 2000, while HGB had 103 branches
spread over Mandi, Kangra and Kullu districts, PGB had 27 branches covering
Chamba district only.

23
PROFILE & PERFORMANCE
Profiles of PGB and HGB together with their performance during the last 3 years
are indicated in the Tables indicates that HGB has shown better performance in
comparison to BGB when compared on profit ratio of both banks. Profile and
performance of these banks is given in Table 2.8 and 2.9.
TABLE : 2.8 PROFILE & PERFORMANCE OF P.G.B. (Rs. in Lakh) Item As on 31.3.98 As on
31.3.1999 As on 31.3.2000
Share Capital 100 100 100 Branches 27 27 27
Deposits 3,838.48 5,616.58 6866.90 Investments 989.4 1189.40 5688.67 Advances 1.036.87 1,261.99 1659.76 Profit/Loss (+)46.64 (+)116.24 (+)160.53 Accumulated Losses
(-)314.07 (-)267.43 -
CD Ratio 29.00% 35.87 24.16 Recovery Rate 80.00% 66.56% NA
Source: National Bank for Agriculture and Rural Development (NABARD), Shimla. TABLE : 2.9 PROFILE & PERFORMANCE OF H.G.B. (Rs. in Lakh) Items As on 31.3.98 As on 31.3.1999 As on 31.3.2000 Share Capital 996.75 - - Branches 102 103 103 Deposits 22,001 27,675 35,429.09 Investments 16,787 20,490 25,184.69
Advances 4,964 6,060 8,420.76 Profit/Loss (+)109.52 (+)265.65 (+)404.14 Accumulated Losses
(-)1005.79 (-)740.14 (-)336.00
CD Ratio 22.00% 21.9 23.77 Recovery Rate 68.00% 71.67% NA Source: National Bank for Agriculture and Rural Development (NABARD), Shimla.

24
(iii) NABARD’S REFINANCE UNDER SCHEMATIC LENDING IN HIMACHAL
PRADESH
NABARD provides refinance support to Commercial Bank, Regional rural Banks
and Cooperative Banks operating in Himachal Pradesh. Refinance support is
available for Production Credit and Investment Credit both under Farm Sector and
Non-Farm Sector.
YEAR-WISE DISBURSEMENTS
Reference assistance extended by Shimla RO of NABARD increased from
Rs.1000.00 lac in 1991-92 to Rs.7611.00 lac in 1999-2000. Year wise disbursements
of refinance are given in Table 2.10.
Number of schemes have been introduced by the various tiers of administration
since independence to alleviate rural poverty. However, there has been a wide gap
between expected results and actual achievements. Various studies indicated the
need to extend the outreach of the institutional credit system to that segment of the
population which has remained isolated from the mainstream of economic benefits.
The participation of the rural poor at the grass root level and developing financial
services and products which were compliable with their means and also address their
consumption and investment needs were decided upon as a viable route for increasing
the outreach of the institutional credit system.
The initiation of the concept in 1987 followed by the launch of the Pilot Project in
1992 by NABARD and the RBI policy circular in 1996 are important milestones in the
progress of the SHG concept. The movement was strengthened by guidelines from
RBI from time to time and policy announcements by the GOI. In this direction, the
announcement by the Finance Minister in his budget speech to credit link one lakh
SHGs by SIDBI and NABARD during 2000-01 and setting up of the Micro Finance
Development Fund with a corpus of Rs.100 crore again underlines the importance of
micro credit.

25
NABARD essentially has been vested with the responsibility for promoting and
upscaling the SHG movement in the nation.
TABLE: 2.10 YEAR WISE DISTRIBUTION OF FINANCE THROUGH NABARD.
(Rs. lacs)
Year Amount of Refinance Target Achievement %age of
Achievement %age increase over previous year
1995-96 2443.00 2484.10 101.68 17.83
1996-97 3575.00 3576.37 100.04 43.97
1997-98 4789.00 5056.96 105.60 41.40
1998-99 5555.00 6428.61 115.72 26.87%
1999-2000 7125.00 7611.00 105.93% 15.11%
2000-2001* 8500.00 4701.14 55.31
Source: National Bank for Agriculture and Rural Development (NABARD), Shimla.
* As on 30 November 2000.
(iv) CONCEPT OF SHG & CHARACTERISTICS
OBJECTIVES
NABARD had communicated in 1992 to the Banks that the SHG movement has been
initiated for achieving the following objectives:
- To evolve supplementary credit strategies for meeting the credit needs of the
poor by combining the flexibility, sensitivity and responsiveness of the
informal credit system with the strength of technical, administrative
capabilities and financial resources of the formal credit institutions.
- To build mutual trust and confidence between the bankers and the rural poor.

26
- To encourage banking activity, both on thrift as well as credit sides, in a
segment of a population that formal financial institutions usually find difficult
to cover.
This was because of the high transaction cost for banks in dealing with a vast
segment, limitations of the legal framework, weakness of the project approach for the
poor and risk perceptions. It must be noted that the dividing line between credit for
consumption and productive purposes is blurred in the complex socio-economic
scenario in which the poor operate.
SHG- Defined – The fundamental precept is that the customer profile should
essentially be of those who have been by passed or are likely to be by passed by the
banking system. The Self Help group formed by the rural poor, is a voluntary
association of rural people, with an almost homogeneous social and economic
background with the objective of improving their quality of life. A SHG, both by
definition and by practice, is a group of individual members, who by free association,
come together for a common collective purpose. Pertinently, they must have certain
pre-group social linking factors.
The main principles of this are:
- The poor can save and are bankable
- Participative management is efficient and responsive
- Convergence is the key to capacity building at low cost.
SHG CHARACTERISTICS
A SHG has the following characteristics, making it eligible for recognition and credit
linkage;
- The SHG should have been in active existence for at least a period of six
month
- The SHG members should have successfully undertaken savings and credit
operations from their own resources
27
- Democratic working of the group wherein all members feel that they have a
say, should be evident
- The SHG is to maintain proper accounts/records.
- The SHG should demonstrate a genuine need to help each other and work
together amongst its members
- The SHPI is to make evident its concern for the SHG, by way of training,
guidance, skill up gradation etc.
ALL INDIA SCENARIO OF SHGs
The SHG concept now stands accepted as an important vehicle for alleviating
rural poverty and various budget pronouncements have only reemphasized it the goal
for the nation is to have 10 lakh SHGs credit linked by the Financial Year 2007-2008.
till 31 March 2000, 111500 SHGs have been linked (81000 in the Financial Year 1999-
2000 itself) with cumulative banks loans aggregating Rs.193 crores, benefiting almost
20 lakh families. However, the regional spread is a matter of concern Table 2.11.
Significant progress has been reported in Uttar Pradesh, Tamil Nadu and
Andhra Pradesh. In the North, HP is the leader with cumulative 1000 linkages (as on
31 March 2000) with aggregate bank loan of Rs.87 lakhs. This is however, much
below the state’s potential.
Overall the SHG approach has now come to stay as a strong supplementary
credit delivery system, but it is at different stages of implementation in different states
and regions.
718 NGOs, 266 Banks, many Govt. Agencies, 362 district in 24 states are now
associated with the programme, with 85% SHGs being of women.

28
TABLE: 2.11 REGIONAL SPREAD OF SHGS IN INDIA.
(In % age)
Regions Year 1998-99 Year 1999-2000
South 65 67
Central 11 14
West 10 8
East 10 9
North 4 2
Source: National Bank for Agriculture and Rural Development (NABARD), Shimla.
SHG FORMATION AND FINANCE
The formation of SHGs in today’s social context is not an easy task, especially
with the poor. It requires social commitment, zeal and intensive mobilization over a
period of atleast six months. This is where the role of community based NGO’s or Self
Help Promoting Institutions is required and is being played. The costs of such
mobilization are fairly high initially, but go down as the concept is found to be
beneficial by the local population.
The SHG could be financed by the following methods
- Bank to SHG
- Bank to SHG (Facilitation by Govt.Agency/NGO/Bank)
- Bank to NGO/MFI-SHG
- Bank to NGO/MFI-Federation/Cluster-SHG
- NSBARD to NGO/MFI-SHG (called RFA)
The savings and interest plus seed money (internalized) plus fines and penalties
constitute the corpus which becomes the determinant for finance. The proportion of
savings to loan could vary from 1:1 to 1:4 depending upon the assessment of the
SHG. Banks are requested to maintain close liaison with the SHPI and the SHG and
also vice versa.

29
BULK LENDING TO NGOs
Bulk lending to NGO’s (also called RFA) can be considered on a highly selective
basis in pockets of the state where banks are scattered and far away from the
SHG’s/NGO HQs. The bank may not be an effective intermediary in the context of its
location. Hence the concept of Bulk lending to the NGO
the un-scaling of the movement. The credibility of the NGO is of paramount
importance – its financial honesty/transparency, Commitment, balance sheet strength
would be the main criteria.
MICRO CREDIT IN HP
The micro credit movement in Himachal Pradesh was initiated by NABARD in
1994 with the active association of the Chinmaya rural Health Care and Training
Centre, a health and rural development wing of the Chinmaya tapovan trust, Kangra.
The objective was to ground the programme, evolve state specific and location specific
strategies and then implement it as a demonstrative motivational tool. The CRPHC
and TC dovetailed its Health, nutrition, social educational programmes with the SHG
concept and today 750 SHG’s in 282 villages have Rs.69.86 lakhs as savings, have
availed Rs.88.86 lakhs as loans and individual loans to the extent of Rs.1705 lakhs.
100% repayment has been reported.
The above description depicts the success possible, both for institutions and
SHGs, through a programme with a strong local flavour, with patience and empathy in
extensive follow up. A sharp change in mindset amongst the agencies associated with
the movement is also called for.
APPLICABILITY TO HIMACHAL PRADESH
The CRPHC & TC experiment, as also its successful replication in other districts
through varied agencies lead to the realization that the real significance of the SHG
concept lies in its ability to tackle poverty alleviation with cost effectiveness, more so in
Himachal Pradesh due to the following factors:

30
- Geographical conditions – Hilly and difficult terrain
- Scattered and sparse population
- Bank Branches at a longer distance.
Hence there is a need to establish alternative credit delivery systems through SHGs.
The objective in HP is to achieve 2500-3000 credit linkages a year upto the financial
year 2003 and thereafter 5000 credit linkages a year.
CURRENT POSITION
As of now, the movement has attained a healthy momentum in Kangra, Solan, Shimla
districts and is moving towards attaining stability in Kullu, Mandi and Hamirpur Table
2.13.
As is evident, credit linkages are now occurring in seven districts but more important,
SHG formation has attained a significant mass in ten districts.
Another pertinent aspect is the performance of last few years:
Linkages in 1998-99 164 (cumulative 354)
Linkages in 1990-2000 509
Linkages till date this year 744
The exponential growth indicates progress. The Commercial Banks accounted for
51% of linkages, with Cooperative Banks accounting for 28% linkages and Gramin
banks 21% linkages in the financial Year 1999-2000 and approximately the same
proportion obtained in the 2000 the banks have loaned out Rs.97.75 lakhs. The loans
have been extended for both consumption and production purposes. 90% of the
SHGs are women SHGs – which is a pointer to their empowerment and initiation into
the development process. 50 NGOs are actively associating with the movement while
the Department of welfare has emerged as a significant partner agency in the current
Financial year. The CRPHC & TC at Mandi and Chamba are also important partner
agencies.
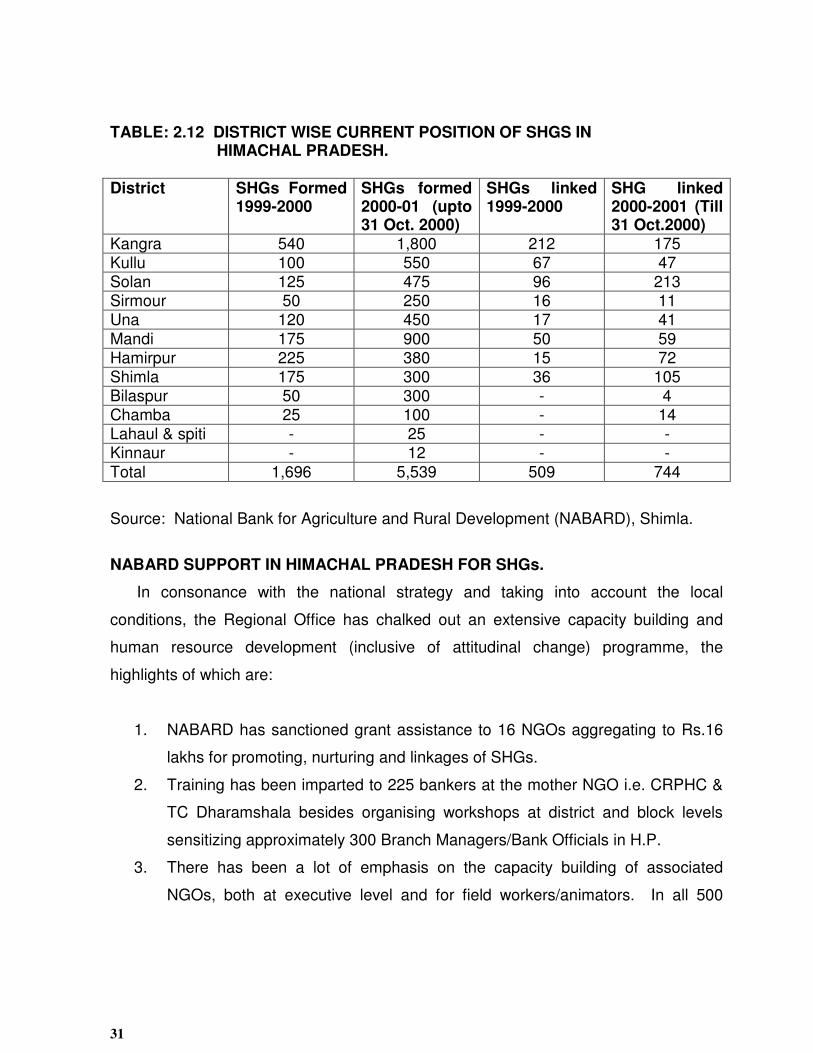
31
TABLE: 2.12 DISTRICT WISE CURRENT POSITION OF SHGS IN HIMACHAL PRADESH.
District SHGs Formed 1999-2000
SHGs formed 2000-01 (upto 31 Oct. 2000)
SHGs linked 1999-2000
SHG linked 2000-2001 (Till 31 Oct.2000)
Kangra 540 1,800 212 175 Kullu 100 550 67 47 Solan 125 475 96 213 Sirmour 50 250 16 11 Una 120 450 17 41
Mandi 175 900 50 59 Hamirpur 225 380 15 72 Shimla 175 300 36 105 Bilaspur 50 300 - 4 Chamba 25 100 - 14 Lahaul & spiti - 25 - - Kinnaur - 12 - -
Total 1,696 5,539 509 744
Source: National Bank for Agriculture and Rural Development (NABARD), Shimla.
NABARD SUPPORT IN HIMACHAL PRADESH FOR SHGs.
In consonance with the national strategy and taking into account the local
conditions, the Regional Office has chalked out an extensive capacity building and
human resource development (inclusive of attitudinal change) programme, the
highlights of which are:
1. NABARD has sanctioned grant assistance to 16 NGOs aggregating to Rs.16
lakhs for promoting, nurturing and linkages of SHGs.
2. Training has been imparted to 225 bankers at the mother NGO i.e. CRPHC &
TC Dharamshala besides organising workshops at district and block levels
sensitizing approximately 300 Branch Managers/Bank Officials in H.P.
3. There has been a lot of emphasis on the capacity building of associated
NGOs, both at executive level and for field workers/animators. In all 500

32
executive and employees/volunteers were trained/sensitized by NABARD at
CRPHC & TC up to November 2000.
4. There is increased involvement of govt. agencies/departments and 12
workshops and training programmes were organised in the State, out of which
9 were organised in the district. This helped in sensitizing 270 employees for
implementing the SHG programme.
5. Recently, volunteers from Farmers club (FC) have been involved to promote
SHGs and their efforts in forming and nurturing SHGs are compensated.
These volunteers and concerned Bank branch officials are imparted training
also.
6. NABARD has promoted Himachal Gramin Bank (HGB) as Self Help Promoting
Institution (SHPI) to enable the bank branches to promote SHGs directly. The
necessary training and support from experienced NGOs is aided by NABARD
7. The training modules were prepared and sent to various banks for training
their branch managers and officials in controlling offices in their respective
training establishments.
8. The concept of Vikas Volunteer Vahini (VVV) as SHPI has also been
introduced from the current financial year i.e. Farmers clubs can also promote
SHGs and upto 10 SHGs per FC normally and financial assistance to
compensate their efforts shall be extended.
NGO RELATED ACTION POINTS
1. Operations of NGOs at field level to be further deepened
2. NGOs to ensure close relationships with banks branches in their area of
operations, and keep the branch posted with details for timely linkages.
3. NGOs to assess own training needs in view of up scaling of the programme and
to take it up with NABARD.
4. Block level training of SHGs to be conducted by NGOs. Bankers to be invited to
training sessions. Good faculty to be identified for training.
5. To utilize VVV concept also for up scaling the micro-credit movement.
6. Training for credit plus activities to be arranged by NGOs.

33
7. Self-sustaining markets/hats for local produce may be tapped as marketing
outlets for SHGs.
8. NGOs are to develop a mechanism and process to nurture/supervise/follow-up
extensively with all SHGs promoted by them – Documenting success stories.
9. NGOs to monitor and evaluate their staff associated with micro credit as also
SHGs promoted by them regularly. Quality of SHGs is of paramount
importance.
10. Relationship Building with Bankers/Govt. Agencies.
11. NGOs may use the SHG concept as a vehicle to add-on other socio-economic
programmes to further gain credibility for their work.
STATE AND CENTRALLY SPONSORED DEVELOPMENTAL PROGRAMME
As per department of economics and statistic H.P. the following state and centrally
sponsored developmental schemes and programmes remained under implementation
during 1999-2000.
(v) SWARANJAYANTI GRAM SWAROZGAR YOJANA
With a view to provide benefits to the poor eligible families through a single
window delivery system, the Government of India has restructured the self
employment programmes and has merged IRDP, TRYSEM, DWCRA, SITRA, GKY
and MWS into a new scheme namely “SWARANJAYANTI GRAM SWAROZGAR
YOJANA” which has been launched from the current financial year. This yojana is a
holistic package covering all aspects of self employment such as organization of poor
into self help groups, training, credit, technology, infrastructure and marketing. The
beneficiaries technology, infrastructure and marketing. The beneficiaries under this
scheme would be called as “Swarozgaris”. The scheme aims at covering 30 per cent
of BPL families in each block during next five years i.e. 1999-2000 to 2003-2004. The
objective of SGSY is to bring the assisted poor families above the poverty line in 3
years, by providing them income generating assets. This scheme is a credit-cum-

34
subsidy programme. Subsidy under SGSY will be uniform at 30 per cent of the project
cost subject to a maximum limit of Rs.7,500. In respect of SCs/STs. However, these
will be 50 per cent subject to a maximum limit of Rs.10,000. For groups of
swarozgaris (SHGs), the subsidy would be at 50 per cent of the cost of schemes,
subject to a maximum of Rs.1.25 lakh. SGSY will particularly focus on the vulnerable
groups among the rural poor. Accordingly, the SCs/STs will account for the 50 per
cent of swarozgaris, women for 40 per cent and the disabled for 3 per cent. This
scheme will be funded by Central and State Governments on 75:25 sharing pattern.
During the year 1999, 6,684 families were assisted under IRDP/SGSY and
Rs.412.29 lakh were given as subsidy to these families up to 31.12.1999. Against the
target of credit mobilization of Rs.19.70 crore for the year, Rs.18.56 crore were
disbursed as credit to these families.
IRD families were entitled to avail loan @ 12.50 per cent interest per annum
whereas the State Government decided to give loan to all IRD families @ 4 per cent
per annum and the difference in interest rate was being met out of the funds provided
under expanded IRD programme. Capital differential subsidy and interest subsidy will
continue to be given to individual Swarozgari under SGSY also on the pattern of IRDP.
For this purpose an amount of Rs.125.00 lakh has been approved in the State Plan.
(vi) FLOW OF CREDIT AT STUDY AREA LEVEL
In this section issues related with credit from various financial (formal and
informal) institutions have been discussed. In this discussions review of oldest
financial institution like co-operative followed by commercial bank, regional rural bank
and latest i.e. new generation financial institutions were considered which have their
jurisdiction over the study area.

35
DISTRIBUTION OF CREDIT IN VILLAGE WITH MICRO-FINANCE
In table 2.13 it can be observed that during 1997-98 to 1999-2000 farmers of
village with micro-finance could be able to draw credit at the rate of Rs.29 thousand to
Rs.44 thousand (per farmer) from Himachal Gramin Bank (RRB) and the said range
vary between 18 thousand to 22 thousand in Central Bank of India. The per farm
availability of credit from co-operative bank vary between 2 thousand to 4 thousand
during said period. Comparatively availability of credit at per farm level through RRB
in village with micro-finance is higher on the household engaged in non-farm activities
followed by farm activities. Similar trend may be seen in the supply of credit from
Central Bank of India but, concenteration on small farmers is higher as compared to
RRB where availability of credit is higher to marginal farmers. In case of co-operative
society only the marginal farmers are availing credit from this institution.
Regarding percentage distribution of credit among total household of different
categories, it may be observed from Table 2.13 that Himachal Gramin Bank (RRB) has
shown higher percentage of credit distribution to marginal farmers varying from 44 to
48 per cent fallowed by household engaged in non-farm activities and small farmers.
Whereas, in case of Central Bank of India priority has given to non-farm activities (48
to 50%). This may be due to the reason that RRB being a new establishment in the
state has shown more concenteration on low level of credit. Co-operative society has
shown its focus on marginal farms but the amount distribution has shown insignificant
value when compared to other financial institutions.

36
TABLE: 2.13 PERCENTAGE DISTRIBUTION OF CREDIT TO VARIOUS CATEGORYOF FARMERS IN THE STUDY AREA OF VILLAGE WITH MICRO-FINANCE.
Categories RRB Commercial Bank Co-operative Society
1997-98 1998-99 1999-
2000
1997-98 1998-99 1999-
2000
1997-
98
1998-99 1999-
2000
Large & Medium Farmer
- - - - - - - - -
Small Farmer 20.00
(25773)
20.00
(27108)
22.00
(51821)
15.00
(16482)
13.00
(11568)
14.00
(19156)
- - -
Marginal Farmer 45.00
(30609)
48.00
(36254)
44.00
(40865)
37.00
(14302)
37.00
(12349)
36.00
(175443)
100.00
(1712)
100.00
(4667)
100.00
(2557)
Land Less - - - - - - - - -
Household engaged in non-farm activities
35.00
(31154)
32.00
(35433)
34.00
(43769)
48.00
(24925)
50.00
(56600)
50.00
(30861)
- - -
Total credit(Rs.lacs)
46.550
(29650)
64.650
(33672)
90.080
(43941)
34.560
(18481)
33.980
(19988)
34.680
(22668)
0.137
(1712)
0.140
(4667)
0.179
(2557)
Total No. of loanees
157 192 305 1.87 170 153 8 3 7
Source: (i) Himachal Gramin Bank Branch at Matour (RRB), Central Bank of India at
Yol and Primary agricultural co-operative society of Jheal of District Kangra H.P.
(ii) Figures in parenthesis are the per farm availability of credit in rupees.
PURPOSE WISE BREAK UP OF CREDIT IN VILLAGE WITH MICRO-FINANCE
Purpose wise percentage distribution of credit indicates in Table 2.14 that
Himachal Gramin Bank (RRB) has given crop loans at maximum level varying
between 36 to 41 percent of the total loan distributed followed by transportation (31 to
34%), animal husbandry (11 to 15%), farm assets (2 to 4%), small and tiny industries
(2 to 5%), consumption loans to SHGs which jumped from 2 per cent in 1997-98 to
11per cent in 1999-2000. In case of Commercial Bank i.e Central Bank of India
supplying credit at higher order on transport loans vary from 43 to 51% during 1997-98
to 1999-2000 followed by crop loan (27 to 33%) animal husbandry (13%) and others.
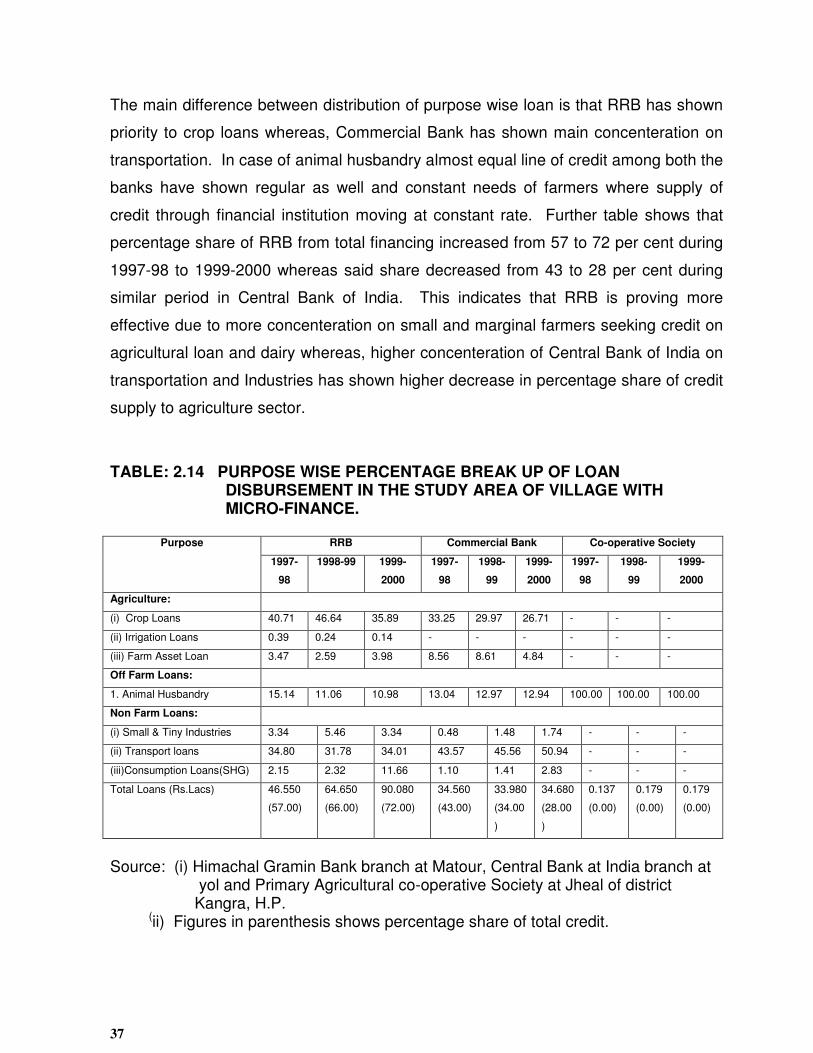
37
The main difference between distribution of purpose wise loan is that RRB has shown
priority to crop loans whereas, Commercial Bank has shown main concenteration on
transportation. In case of animal husbandry almost equal line of credit among both the
banks have shown regular as well and constant needs of farmers where supply of
credit through financial institution moving at constant rate. Further table shows that
percentage share of RRB from total financing increased from 57 to 72 per cent during
1997-98 to 1999-2000 whereas said share decreased from 43 to 28 per cent during
similar period in Central Bank of India. This indicates that RRB is proving more
effective due to more concenteration on small and marginal farmers seeking credit on
agricultural loan and dairy whereas, higher concenteration of Central Bank of India on
transportation and Industries has shown higher decrease in percentage share of credit
supply to agriculture sector.
TABLE: 2.14 PURPOSE WISE PERCENTAGE BREAK UP OF LOAN DISBURSEMENT IN THE STUDY AREA OF VILLAGE WITH MICRO-FINANCE.
Purpose RRB Commercial Bank Co-operative Society
1997-
98
1998-99 1999-
2000
1997-
98
1998-
99
1999-
2000
1997-
98
1998-
99
1999-
2000
Agriculture:
(i) Crop Loans 40.71 46.64 35.89 33.25 29.97 26.71 - - -
(ii) Irrigation Loans 0.39 0.24 0.14 - - - - - -
(iii) Farm Asset Loan 3.47 2.59 3.98 8.56 8.61 4.84 - - -
Off Farm Loans:
1. Animal Husbandry 15.14 11.06 10.98 13.04 12.97 12.94 100.00 100.00 100.00
Non Farm Loans:
(i) Small & Tiny Industries 3.34 5.46 3.34 0.48 1.48 1.74 - - -
(ii) Transport loans 34.80 31.78 34.01 43.57 45.56 50.94 - - -
(iii)Consumption Loans(SHG) 2.15 2.32 11.66 1.10 1.41 2.83 - - -
Total Loans (Rs.Lacs) 46.550
(57.00)
64.650
(66.00)
90.080
(72.00)
34.560
(43.00)
33.980
(34.00
)
34.680
(28.00
)
0.137
(0.00)
0.179
(0.00)
0.179
(0.00)
Source: (i) Himachal Gramin Bank branch at Matour, Central Bank at India branch at yol and Primary Agricultural co-operative Society at Jheal of district Kangra, H.P. (ii) Figures in parenthesis shows percentage share of total credit.

38
Above discussion concludes that in village with micro-finance on an average per
household farmers engaged in non-farm activities are getting more credit this may be
due to low level of returns from agriculture because of traditional cropping pattern
where farming is based on cereal cultivation. Financial institutions are showing more
interests on SHGs due to 100 per cent repayment capacity of the SHGs. As per the
opinion of co-operative secretary of the society the main reason of failure of co-
operative in the study area is of exemption of loan by Govt. followed by enterance of
SHGs.
CREDIT DISTRIBUTION IN VILLAGE WITHOUT MICRO-FINANCE
In this comparison village without micro-finance has shown inverse picture
especially in case of marginal farmers who have been placed at lower side both in
terms of percentage distribution of credit as well as per farm availability of credit Table
2.15. In this village per farm availability of credit is higher among households
engaged in non-farm activities varying from Rs.49 to 56 thousand followed by medium
farmers (46 to 50 thousand), small farmers (Rs.27 to 34 thousand) and marginal
farmers (Rs.12 to 16 thousand). The reason behind low level of credit distribution to
marginal farmers is enterance of cash crops i.e. fruit and vegetable crops. In fact,
marginal farmers are capable to generate sufficient required income from cash crops
by putting higher labour whereas farmers with large holdings required huge amount for
input purchase, which required higher amount of credit. Along with Commercial Bank
of India there are two private agencies in the study area providing credit for input
purchase to the farmers. In this concern table 2.16 reveals that like banks these
institution too are providing higher percentage as well of per farm credit to the medium
farmers followed by small and marginal farms. Though the availability of credit from
these agencies is low as compared to banks but coverage of marginal and small
farmers who hesitate to draw loan from banks are availing credit from these agencies.
On an average availability of credit to small and marginal farmers through private
agencies is less than one thousand and about two thousand among large farmers.
This shows small scale of credit requirement available from these agencies to small

39
and marginal holdings is compensating their lower financial requirement. Perhaps
enterance of SHGs will prove successful in this study area.
Table: 2.15 Percentage Distribution of Credit to Different Category of Farmers in Study Area of Village Without Micro-Finance. Categories Commercial bank Private agency1
1997-98
1998-99
1999-2000
1997-98 1998-99
1999-2001
Large and medium farmers%
9.00 (46896)
8.00 (50556)
12.00 (46395)
46.00 (2000)
44.00 (2000)
47.00 (2667)
Small farmers%
17.00 (34816)
17.00 (30096)
14.00 (27837)
31.00 (5717)
25.00 (470)
29.00 (588)
Marginal farmers%
5.00 (11657)
10.00 (16155)
10.00 (13452)
23.00 (428)
31.00 (625)
24.00 (500)
Land less - - - - - - Household engaged in non-farm activities%
69.00 (56187)
65.00 (54911)
64.00 (49471)
- - -
Total credit (Rs. lacs)
15575200
(4255)
15058960
(39838)
15919760
(35143)
650000 (765)
800000
(800)
850000 (829)
No. of loans 366 378 453 850 1000 1025 Private Agency -2 Large and medium farmers%
46.00 (2000)
35.00 (1750)
25.00 (2500)
- - -
Small farmers%
36.00 (667)
35.00 (700)
50.00 (800)
- - -
Marginal farmers%
18.00 (444)
30.00 (750)
25.00 (500)
- - -
Land less - - - - - - Household engaged in non-farm activities%
- - - - - -
Total credit (Rs. lacs)
550000 (846)
500000 (909)
400000 (727)
- - -
No. of loans 650 550 550 - - -
Source: State Bank of India branch of Matiana.

40
PURPOSE WISE BREAK UP OF CREDIT IN VILLAGE WITHOUT MICRO-FINANCE
The supply of credit during 1997-98 to 1999-2000 in village without micro-finance
indicate in Table 2.16 that State Bank of India have its monopoly in distribution of
credit as there is no other bank except two private agencies supplying input to the
farmers. On an average SBI is holding 93 per cent of the total supply of credit.
Purpose wise break up indicates in table 4 that Commercial Bank (SBI) supplied credit
at the rate of 59 per cent on transport and 31 per cent on crop loans and the remaining
10 per cent supplied to small industries (6%) followed by animal husbandry 4 per cent.
Private agencies are operating on 7 per cent of the total supply of credit and supplying
credit only for purchase of input. The Shimla district is leading in production of fruit
and vegetable in the state and farmers in the study area have good transaction of
money. Each of the farmers is generally generating a good amount of income from
cash crops and their needs for consumption and construction of building have
increased. To fulfill such needs farmers use to draw loan from the bank which they
utilized partly for input purchase and marketing and partly for domestic use.
Regarding supply of credit from private agencies 100 per cent of the credit supplied to
crop loans. In fact, supply of credit for input purchase proved very suitable for
marginal farmers who needs less amount of credit for input and avoid risk far drawing
credit from bank.

41
TABLE 2.16 PURPOSE WISE BREAKUP OF LOAN DISBURSEMENTS IN THE STUDY AREA OF DISTRICT SHIMLA
Purpose Commercial Bank Private agency1
1997-98 1998-99 1999-2000
1997-98
1998-99
1999-2000
Agriculture 1. Crop loan 28.00 31.00 33.00 100.00 100.00 100.0
0 2.Irrigation loan 3.00 3.00 3.00 - - - 3.Farm Asset loans
Off-farm Loans 1.Animal husbandry 4.00 4.00 3.00 - - - Non-Farm Loans i. Small and tiny industries
6.00 5.00 1.00 - - -
ii. Transport loans 59.00 57.00 60.00 - - - iii. Consumption loans - - - - - - Total loans 1557520
0 (93.00)
15058960
(92.00)
15919760
(93.00)
650000
(4.00)
800000
(5.00)
850000
(5.00)
Private Agency -2 Agriculture 1. Crop loan 100.00 100.00 100.00 - - - 2.Irrigation loan - - - - - - 3.Farm Asset loans - - - - - - Off-farm Loans - - -
1.Animal husbandry - - - - - - Non-Farm Loans - - - i. Small and tiny industries
- - - - - -
ii. Transport loans - - - - - - iii. Consumption loans - - - - - - Total loans 55000
0 (3.00)
500000
(3.00)
400000 (2.00)
- - -
Source: State Bank of India branch of Matiana and Private Agencies Operating in Jurisdiction of study area.

42
From above discussion it can be concluded that Himachal Gramin Bank (RRB) in
village with micro-finance has shown more coverage and concenteration on supply of
credit to marginal farms whereas, Commercial Bank like Central Bank in Kangra and
SBI in Shimla have shown their interests on household engaged in non-farm activities
specially transportation. The said difference may be due to the reason that RRB is
newly established in the state and developing flow of credit from low level to fulfill
need of sub-marginal and marginal farmers. Whereas, Commercial Bank always in
favour of large amount of credit for earning better returns. Regarding co-operative
credit, it is almost insignificant in the study area.
DEFAULT RATE IN BOTH VILLAGES
Regarding annual default rate and over dues rate Table 2.17 & 2.18 reveals that
in village with micro-finance default rate remained higher during 1997-98 to 1999-2000
in co-operative ranging between 30 to 37 per cent followed by Central Bank of India
(17 to 31%) and RRB (18 to 25%) Similar trend may be observed in recovery and over
dues rate in this village. Further table shows that except co-operative the default rate
in village with micro-finance is reducing regularly during 1997-98 to 1999-2000. But in
village without micro-finance the picture is quite apposite where default rate has
increased among different financial institution during above period. Therefore, it can
be concluded that society with poor base of income in village with micro-finance has
shown less rate of default rate whereas, society with rich base of income in village
without micro-finance shows higher default rate among formal institutions. In case of
over dues rate State Bank of India has shown less rate in comparison of Himachal
Gramin Bank (RRB), Central Bank of India and Co-operative Credit Society. Though,
private agencies supplying credit for input has shown slightly less rate of defaulters but
increasing regularly after 1997-98.

43
TABLE: 2.17 AVERAGE ANNUAL DEFAULT, RECOVERY AND OVERDUES RATE OF SAMPLE FARMERS IN VILLAGE WITH MICRO- FINANCE.
Years RRB Commercial Bank Co-operative Society Default
rate %
Recovery rate
%
Over due rate
Default rate
%
Recovery rate %
Over due rate
Default
rate %
Recovery rate
%
Over due rate
Kangra
1997-98 25.00 75.00 38.00 31.00 69.00 39.00 32.00 68.00 43.00
1998-99 20.00 80.00 28.00 25.00 75.00 35.00 37.00 63.00 38.00
1999-2000
18.00 82.00 30.00 17.00 83.00 27.00 30.00 70.00 36.00
TABLE: 2.18 AVERAGE ANNUAL DEFAULT, RECOVERY AND OVERDUES RATE OF SAMPLE FARMERS IN VILLAGE WITHOUT MICRO- FINANCE.
Years Commercial Bank Private Agency 1 Private Agency 2 Default rate
%
Recovery rate %
Over due rate
Default
rate %
Recover
y rate %
Over due rate
Default rate
%
Recovery
rate %
Over due rate
Kangra
1997-98 18.00 82.00 25.00 12.00 88.00 22.00 6.00 94.00 25.00
1998-99 19.00 81.00 22.00 20.00 80.00 24.00 8.00 92.00 18.00
1999-2000 22.00 78.00 25.00 20.00 88.00 27.00 17.00 83.00 20.00

44
CHAPTER –III
RESOURCE PROFILE OF SAMPLE HOUSEHOLDS
CHARACTERISTICS OF BORROWERS HOUSEHOLDS
Characteristics of borrowers households in Table 3.1 indicate that village without
micro finance having higher number of persons in a family showing 6.88 persons in
comparison of 4.84 persons of village with micro finance. This shows marginalisation
of farms is higher in the village with micro finance whereas joint family approach
seems higher in village without micro finance. Further table indicates that villages
with less number of persons with micro financing have large percentage of working
population (61.98%) along with higher rate of percentage of working females as
compared to the village without micro-finance. At the same time trade and business
sector has shown higher percentage of workers up to the age of 12-60 years in the
village with micro financing. Further table shows that percentage of members mainly
engaged in wage labour and percentage of unemployed working age members are
showing almost equal ratio vary from 7.86 to 8.97 percent in both the village.
Discussion concluded that village without micro finance have dependency on
agriculture whereas, village with micro finance showing comparatively higher
concenteration on non agriculture along with higher proportion of size of working age
population.
Category wise picture shows that only marginal category of farm have lowest
(4.82) household size along with size of working population (2.67) whereas, household
size and size of working age group is highest i.e. 8.40 and 5.36 persons among
medium farms respectively. Marginal and small farmers have shown higher
percentage of actual working population as compared to landless and medium size
group of farms.
Percentage of wage labour and unemployed workers of the marginal category of
farms have shown the highest percentage i.e. 44 and 16 percent respectively followed
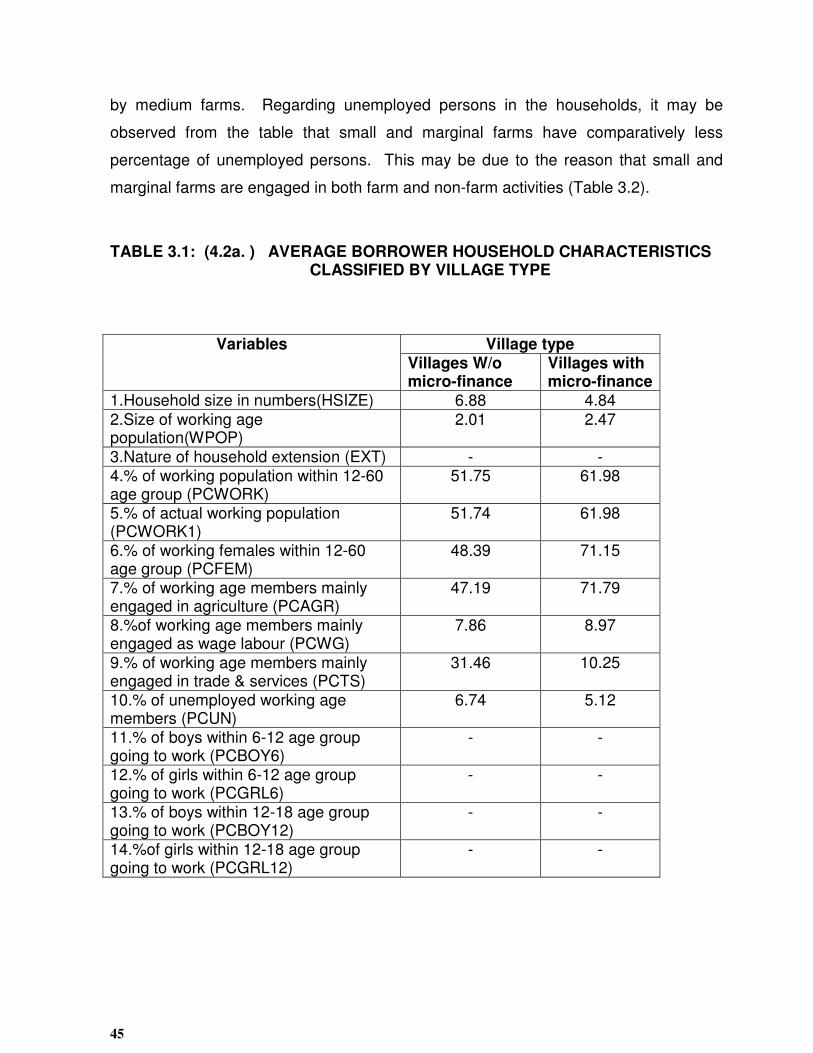
45
by medium farms. Regarding unemployed persons in the households, it may be
observed from the table that small and marginal farms have comparatively less
percentage of unemployed persons. This may be due to the reason that small and
marginal farms are engaged in both farm and non-farm activities (Table 3.2).
TABLE 3.1: (4.2a. ) AVERAGE BORROWER HOUSEHOLD CHARACTERISTICS CLASSIFIED BY VILLAGE TYPE
Variables Village type Villages W/o micro-finance
Villages with micro-finance
1.Household size in numbers(HSIZE) 6.88 4.84
2.Size of working age population(WPOP)
2.01 2.47
3.Nature of household extension (EXT) - - 4.% of working population within 12-60 age group (PCWORK)
51.75 61.98
5.% of actual working population (PCWORK1)
51.74 61.98
6.% of working females within 12-60 age group (PCFEM)
48.39 71.15
7.% of working age members mainly engaged in agriculture (PCAGR)
47.19 71.79
8.%of working age members mainly engaged as wage labour (PCWG)
7.86 8.97
9.% of working age members mainly engaged in trade & services (PCTS)
31.46 10.25
10.% of unemployed working age members (PCUN)
6.74 5.12
11.% of boys within 6-12 age group going to work (PCBOY6)
- -
12.% of girls within 6-12 age group going to work (PCGRL6)
- -
13.% of boys within 12-18 age group going to work (PCBOY12)
- -
14.%of girls within 12-18 age group going to work (PCGRL12)
- -

46
TABLE 3.2: (4.2b.) AVERAGE BORROWER HOUSEHOLD CHARACTERISTICS
BY BORROWER’S LAND HOLDING STATUS
Variables Borrower’s landholding status
Landless
Marginal
Small Medium &
Large 1.Household size in numbers (HSIZE)
5.00 4.82 6.85 8.40
2.Size of working age population(WPOP)
5.00 2.67 4.22 5.36
3.Nature of household extension (EXT)
- - - -
4.%of working population within 12-60 age group (PCWORK)
50.00 61.26 60.42 53.57
5.%of actual working population (PCWORK1)
50.00 61.26 63.64 53.57
6.%of working females within 12-60 age group(PCFEM)
54.17 59.32 47.92 50.00
7.%of working age members mainly engaged in agriculture (PCAGR)
0.00 41.44 3.45 34.52
8.%of working age members mainly engaged as wage labour (PCWG)
44.00 11.76 20.69 20.00
9.%of working age members mainly engaged in trade & services (PCTS)
40.00 13.24 20.69 28.89
10.%of unemployed working age members (PCUN)
16.00 4.41 0.00 6.67
11.%of boys within 6-12 age group going to work (PCBOY6)
0.00 0.00 0.00 0.00
12.% of girls within 6-12 age group going to work (PCGRL6)
0.00 0.00 0.00 0.00
13.%of boys within 12-18 age group going to work (PCBOY 12)
0.00 0.00 0.00 0.00
14.%of girls within 12-18 age group going to work (PCGRL 12)
16.67 9.09 5.56 0.00

47
LITERACY LEVEL OF BORROWERS
Literacy level of borrower households classified by villages with and without
micro-finance is presented in Table 3.3. In this table it can be observed that
percentage literacy among male and female as well as overall literacy is higher in
village with micro finance. This may be due to the reasons that since long people of
this region use to migrate to other state for seeking job and at the same time service in
Indian Army remained the most attractive source of income to this region which
uplifted the standard of education of the rural people. On the other hand village
without micro finance situated at high attitude where number of schools are less and at
the same time these people could be able to diversify their cropping pattern since last
two decades. Prior to diversification of cropping pattern there was more poverty as
compared to low hills. With these reason it can be concluded that in the age group of
12.60 years the level of literacy remained higher in village with micro finance.
TABLE 3.3 (4.1a.) LITERACY LEVEL OF BORROWER HOUSEHOLDS CLASSIFIED BY VILLAGE WITH AND WITHOUT MICRO- FINANCE
Variables Village type Villages W/o micro-finance
Villages with micro-finance
1.Index of male education (MEDU) 2.96 2.20 2.Index of female education (FEDU)
1.80 1.60
3.%of male literacy within 12-18 years of age (PCMLIT)
21.51 50.72
4.% of female literacy within 12-18 years of age (PCFLIT)
26.88 50.00
5.% of overall literacy within 12-18 years of age (PCFLIT)
24.41 50.41
Category wise picture reveals in Table 3.4 that small and medium farms are
leading in the index of male and female education. But, when literacy is measured in
percentage terms the literacy among male is higher (42.30%) in small farms but in

48
case of female the percentage of literacy is higher among marginal farms. Discussion
concludes that household’s level of education is competing well irrespective of
category of farms.
TABLE: 3.4 (4.1b.) LITERACY LEVEL OF BORROWER HOUSEHOLDS CLASSIFIED BY ACROSS BORROWER’S LANDHOLDING STATUS
Variables Borrower’s landholding status Landles
s Margina
l Small Medium
& Large 1.Index of male education (MEDU)
2.30 1.87 3.00 4.20
2.Index of female education (FEDU)
2.10 1.87 2.29 3.80
3.%of male literacy within 12-18 years of age (PCMLIT)
34.61 32.69 42.30 34.09
4.% of female literacy within 12-18 years of age (PCFLIT)
25.00 37.28 31.81 40.00
5.% of overall literacy within 12-18 years of age (PCFLIT)
30.00 35.13 37.50 36.90
Note: MWDU & FEDU vary within [1-6]. For details, see questionnaire and explanations given inside the text (AER Centres: develop explanations based on relevant computer programmes)
TANGIBLE ASSETS
Holding of tangible assets is directly related with standard of living of the people,
in this regard results shown in Table 3.5 indicate that each of the household have
their own dwelling house. The village without micro finance have shown higher level
of energy and furniture use in comparison of village with micro finance. Though both
the village are utilizing luxury items on almost equal line but it may be observed from
the table that village without micro finance have shown better standard of living in
comparison to village with micro finance. This may be due to the reasons of higher
level of household income in the village without micro finance. Further table shows
that index of deposit is higher in the village with micro finance. This may be due to the
reason of higher coverage of self help groups in said village.

49
TABLE: 3.5 (4.3a.) SPECIFIC TYPES OF TANGIBLE ASSETS HELD BY BORROWER HOUSEHOLDS CLASSIFIED BY VILLAGE TYPE
Variables type Village type Villages W/o micro-finance
Villages with micro-finance
1.Type of dwelling house index(DWEL) 1.00 1.00
2.Energy use index (ENERG) 0.96 0.44 3.Type of furniture use index (FURNI) 1.92 1.80 4.Type of luxury items used index (LUX) 1.48 1.56 5.Index of deposit holding with Post Office/Banks/Coops/NBFCs/Chit Funds/SHGs(DEPO)
1.64 2.76
6.Index of investment in gold(GOLD) 1.00 1.00 7.Index of investment in bonds(BOND) 0.00 0.00
TABLE:3.6 (4.3b.) SPECIFIC TYPES OF TANGIBLE ASSETS HELD BY BORROWER HOUSEHOLDS CLASSIFIED BY BORROWER’S LANDHOLDING STATUS
Variables Borrower’s landholding status Landle
ss Margin
al Small Medium
& Large 1.Type of dwelling house index(DWEL)
1.10 1.00 1.00 1.00
2.Energy use index(ENERG) 0.60 0.67 0.86 1.00 3.Type of furniture u: index(FURNI) 1.40 1.43 2.00 2.80 4.Type of luxury items used index(LUX)
1.60 0.83 1.99 2.60
5.Index of deposit holding with Post Office /Bans/Coops/NBFCs/Chit Funds/ SHGs (DEPO)
0.40 0.48 1.00 1.00
6.Index of investment in bonds(BOND)
1.00 1.00 1.00 1.00
7.Index of investment in bonds(BOND)
0.00 0.00 0.00 0.00
AGRICULTURAL AND NON-AGRICULTURAL CHARACTERISTICS
Village wise results on agriculture and non-agricultural characteristics presented in
Table 3.7 wherein, it may be observed that in village without micro financing 100 per
cent of the GCA devoted to cash crops. In this comparison village with micro-financing

50
has devoted its 76 per cent of area under food crops and only 24 per cent on cash
crops. Fruits and vegetables i.e. apple, cauliflower, cabbage, peas and potato are
among the cash crops grown in village without micro finance. Whereas, only potato
use to be grown in village with micro-finance. Though, operational area is about 0.11
per cent higher in village without micro-finance but GCA and cropping intensity is less
in the said village when compared to village with micro-finance. This may be due the
reason of presence of apple orchards which accounts single crop in both the seasons.
The annual expenditure on purchased inputs shows in Table 3.7 that village
without micro finance use to purchase inputs at the rate of Rs.6992.68 per annum
whereas, the said expenditure is only Rs.770.55 at village with micro finance. The
village with micro-finance use to purchase only fertilizer whereas, expenditure on
insecticides/pesticides, seed and fertilizer are the main heads of input expenditure at
village without micro-finance. Further table shows that value of produce per hectare of
land in village without micro-finance is Rs.40163.42 in comparison of Rs.13362.09 in
village with micro-finance. Regarding percentage input purchased out of credit it is
about 50 per cent in village without micro-finance. During the course of study it was
observed that farmers in the village of without micro-financing have framed a limit of
credit against their produce of cash crops but out of total credit these households use
to spent 50 per cent of their credit on input purchase and remaining amount utilize for
other needs like construction of house etc. whereas, village with micro-financing has
minor amount of credit and they utilize credit partly for fertilizer purchased and partly
on education and other emergency needs. Due to better return from cash crops,
households of village without micro-finance use to repay about 90 per cent of the
credit from sale value of the produce. Due to cultivation of cash crops, the use of
modern implements is comparatively higher in the village without micro-finance. As for
as number of bullocks are concerned bullock per hectare of land are insignificant in
said village this is due to the reason of cultivation of cash crops in small fields of hilly
terrain where manual operations use to be practiced for preparation and sowing of
crops and at the same time orchard required only manual labour. Whereas in village
with micro financing the number of bullock per hectare of land is 1.15.

51
TABLE : 3.7 (4.4a.) AVERAGE NON-AGRICULTURAL & AGRICULTURAL OPERATIONAL CHARACTERISTICS OF BORROWER HOUSEHOLDS CLASSIFIED BY VILLAGE TYPE.
Variables type Village type
Villages W/o micro-finance
Villages with micro-finance
1.Nature of ownership of property (SOWN) 1.00 1.00
2.Use of modern implements (MODO) 2.00 0.84
3.Irrigation implements (IRRO) 0.00 0.00
4.Nature of transportation equipment owned (TRANS) 0.00 0.32
5.Operational area in ha.(AREA) 0.94 0.83
6.Gross cropped area in ha.(GCA) 1.26 1.31
7.% irrigated area (PCIR) 0.00 0.63
8.Cropping intensity (CROPINT=GCA/AREA) 1.34 1.58
9.No. of bullocks per ha.(PBULL) 0.04 1.15
10.No. of milch animals per head (PMILK) 1.68 0.78
11.No. of goats, Sheep, pigs & poultry birds per head (PMEAT)
0.00 0.48
12.Annual expenditure in Rs. on purchased inputs per ha. of GCA (PTINPUT)
6992.68 770.55
13.%of GCA devoted to food crops (PCFOOD) 0.00 75.76
14.% of GCA devoted to cash crops(PCCASH) 100.00 24.24
15.price of paddy realized in Rs./kg.(PADP) 0.00 5.60
16.Price of wheat/kg.(WHTP) - 6.00
17.Yield of paddy in kgs/ha (PADY) - -
18.Yield of edible oilseeds in kgs/ha.(EDIY) - -
19.Yield of pulses in kgs/ha(PULY) - -
20.Yield of wheat in kgs/ha (WHTY) - -
21.Value of all produce in Rs./ha of operational land (PVPROD)
40163.42 13362.09
22.Value of produce in Rs./ha. of GCA (PVPROD1) 13234.51 5419.70
23.Value of by-product in Rs./ha of operational land (PVBPROD)
- 1533.03
24.Value of by-product/ha of GCA (PVBPROD1) - 621.80
25.%of inputs purchased out of credit (PCINPUT) - -
26.%of credit adjusted against sale value of output (PCOUT)
- -
27.%of credit adjusted against sale value of by-product (PCBOUT)
0.00 0.00
Category wise average non-agricultural and agricultural characteristics of
borrowers households presented in Table 3.8 wherein it may be observed that
marginal and small farmers are operating in 0.43 and 1.26 hectare of land respectively
whereas, size of holding is 2.55 hectare among medium and large farms. Regarding
percentage of GCA devoted to food crops it vary between 37.11 to 41.10 per cent
among marginal, small and medium farms whereas, percentage area devoted to cash
crops vary between 58.90 to 62.89 per cent among these farms. Regarding value of

52
all produce indicate in Table 3.8 that marginal small and medium category of farms are
availing 4 to 6 lacs of rupees from per hectare of operational land. In case of value of
produce from per hectare of GCA, marginal and small farms are generating 3 lacs
rupees each whereas, the said figure recorded 22 lacs in the category of medium
farms. Percentage inputs purchased from credit ranges to 65, 67 and 44 per cent
among marginal, small and medium farms respectively. Adjustment of credit against
sale value of produce indicates that it is higher 44.29 per cent among small farms
followed by marginal farms (20.83%) and medium farms (19.30%). In this table it may
be observed that marginal category of farms have owned highest number of bullocks
(1.62) per hectare of land whereas said number is almost insignificant among medium
categories of farms. The higher number of bullocks in the category of marginal farms
shows that these farmers use to plough the land of other category of farms and
earning better returns from tending bullock. In fact, tending bullock is not viable
enterprise hence, marginal farmers started generating income through tending bullock
on commercial lines. Further table shows that per head number of milch animals are
highest 1.43 in the category of medium farms followed by small and marginal farms.
In case of sheep, goat, pigs and poultry birds these are highest (2.42) in number
among small farms followed by medium and marginal farms.

53
Table 3.8: (4.4b.) OPERATIONAL CHARACTERISTICS OF BORROWER HOUSEHOLDS CLASSIFIED BY THEIR LANDHOLDING STATUS
Variables type Borrower’s landholding status
Landless Marginal Small Medium & Large
1. Nature of ownership of property(SOWN) 1.10 1.00 1.00 0.90
2.Use of modern implements (MODO) 0.00 2.17 2.57 4.70
3.Irrigation implements (IRRO) 0.00 0.00 6.00 0.00
4.Nature of transportation equipment owned (TRANS)
0.00 0.00 0.00 0.30
5.Operational area in has.(AREA) 0.00 0.43 1.26 2.55
6.Gross cropped area in ha.(GCA) 0.00 0.72 1.71 3.56
7.%irrigated area (PCIR) 0.00 27.53 32.13
8.Cropping intensity (ROPINT=GCA/AREA) 0.00 1.68 1.35 2.52
9.No. of bullocks per ha.(PBULL) 0.00 1.62 0.45 0.20
10.No. of milch animals per head (PMILK) 1.50 0.92 1.43 1.50
11.No. of goats, sheep, pigs & poultry birds per head (PMEAT)
0.00 0.35 2.42 0.40
12.Annual expenditure in Rs. on purchased inputs per ha. Of GCA (PTINPUT)
0.00 3115.00 8105.00
11622.00
13.% of GCA devoted to food crops (PCFOOD) 0.00 41.10 40.15 37.11
14.% of GCA devoted to cash crops (PCCASH) 0.00 58.90 59.85 62.89
15.Price of paddy realized in Rs./kg. (PADP) 0.00 5.60 5.60 5.60
16.Price of wheat/kg.(WHTP) 0.00 6.00 6.00 6.00
17.Yield of paddy in kgs/ha.(PADY) 0.00 2200.00 962250.00
2175.00
18.Yield of edible oilseeds in kgs/ha (EDIY) - - - -
19.Yield of pulses in kgs/ha.(PULY) - - - -
20.Yield of wheat in kgs/ha.(WHTY) - 1620.00 1700.00
1750.00
21.Value of all produce in Rs./ha. of operational land (PVPROD)
0.00 433843 436659
611667
22.Value of produce in Rs./ha. of GCA(PVPROD1)
- 321044 310027.89
2183651.19
23.value of by-product in Rs./ha of operational land (PVBPROD)
- 903.31 1462.50
518.13
24.Value of by-product/ha. of GCA (PVBPROD1) - 383.80 586.96 192.26
25.%of credit adjusted against sale value of output(PCOUT)
- 65.00 67.14 44.00
26.%of credit adjusted against sale value of output (PCOUT)
- 20.83 44.29 19.30
27.%of credit adjusted against sale value of by-product (PCBOUT)
- 0.00 0.00 0.00
Note: As SOWN is 0 if no property is owned, 1 if property is owned jointly and 2 if property is individually owned, a higher value means a larger order of individualistic ownership of property. Similarly, MODO and IRRO vary from 0 to 2, a higher value indicating a higher order of ownership (here a value of 1 means only hired equipments) of costly agricultural equipments like power tiller, tractor and thresher, and irrigation equipment like pump set, respectively. As the composition of crops vary across regions, specific centres are advised to display variation in the prices of crops relevant to their areas.

54
NATURE AND EXTENT OF INTANGIBLE ASSETS
Nature and extent of intangible assets holding of borrowing households classified
by village type presented in Table 3.9. In this table it may be observed that village with
micro financing is leading in all the variables i.e. index of ownership of intangible
assets, extent of ownership of intangible assets, extent of familiarity with important
village personal and index of familiarity with gramsavak/extention officer as compared
to village without micro financing. This shows village with micro financing have more
access to local level organizations followed by local extension facilities and familiarity.
This may be due to variation in topography in which villagers of foot hills with micro
finance have easy access to above mentioned variable due to plain area whereas, in
hilly topography jurisdiction of institutions are scattered at large area generally divided
into ridges.
TABLE 3.9 (4.3a.) NATURE & EXTENT OF INTANGIBLE ASSET HOLDING
OF BORROWING HOUSEHOLDS CLASSIFIED BY VILLAGE TYPE
Variables type Village type Villages W/o micro-finance
Villages with micro-finance
1.Index of ownership of intangible assets (INTAN)
2.92 4.00
2.extent of ownership of intangible assets (INTAN1)
0.28 1.04
3.Extent of familiarity with important village personnel (FAM)
2.64 2.96
4.Index of familiarity with gramesevak/ extension officer(EXTEN)
1.00 1.00
Note: While INTAN and EXTEN vary from 0 to 1, indicating the degree of access to local level organizations and to local extension facilities, respectively, indicating the breadth of local connections and familiarity.
Further nature and extent of intangible assets holding of households classified by
their land holding size is presented in Table 3.10. In this table it may be seen that
except extent of familiaring with important village personal in all the categories have

55
shown poor response such as access to local level organizations, local extension
facilities as well as index of familiaring with gramsavak/extension officer. This may be
due to the reasons that gramsavaks are almost abolished in the state and in case of
extension officers they have limited their job up to office instead of paying visits in the
fields of the rural people due to financial constraints.
TABLE 3.10(4.3b.) NATURE & EXTENT OF INTANGIBLE ASSET HOLDING OF BRROWING HOUSEHOLDS CLASSIFIED BY VILLAGE TYPE
Variables Borrower’s landholding status Landle
ss Margin
al Small Medium
& Large 1.Index of ownership of intangible assets (INTAN)
1.5 0.13 0.43 1.20
2.Extent of ownership of intangible assets (INTAN1)
2.1 3.04 2.86 3.00
3.Extent of familiarity with important village personnel (FAM)
1.00 1.00 1.00 1.00
4.Index of familiarity with gramsevak / extension officer(EXTEN)
0.00 0.09 0.29 0.30
Note: While INTAN and EXTEN vary from 0 to 1, indicating the degree of access to local level organizations and to local extension facilities, respectively, indicating the breadth of local connections and familiarity.
INCOME AND EXPENDITURE OF BORROWERS HOUSEHOLDS
Village wise income and expenditure of borrowers households is presented in
Table 3.11 . In village without micro financing per head annual income recorded is
17890 rupees out of which 74.66 per cent income is generated from agriculture and its
allied activities. On the other hand per head income recorded is 11869 rupees in
village with micro finance from which 27.51 per cent belongs to the income generated
from agricultural and allied activities. The said different in percentage of income is due
to cereal based farming in village with micro finance as compared to fruit and
vegetable based farming in village without micro-finance. Due to unviable cereal
based farming in village with micro finance the farmers use to generate 60.71 per cent
of the income from trade and services Table 3.11. Prosperity in village without micro
finance further indicates in the table that per head annual expenses on provisional

56
items are rupees 4110 as compared to village with micro finance where said expenses
are rupees 1114 only.
TABLE 3.11: (4.5a.) PER HEAD INCOME AND EXPENDITURE, AND PERCENTAGE-WISE SOURCE OF INCOME ACROSS VILLAGE TYPE
Variables type Village type Villages W/o micro-finance
Villages with micro-finance
1.Annual per head income in Rs.(PY) 11869.59 17890.33 2.%of income from agriculture & % allied activities (PCAGR)
74.66 27.51
3.%of labour income (PCLAB) 3.22 8.36 4.%of income from trade & services (PCTSR)
15.87 60.71
5.Per head annual provisional expenses in Rs.(PPROVI)
4110.47 1114.05
6.Average annual per head expenses on purchase of durable assets in Rs.(PCDUR)
0.00 845.04
Income and expenditure of borrowers household as per their landholding status
indicate in Table 3.12 that per head income in the category of medium farms is highest
(Rs.20554) followed by landless (13126) small (11493 Rs. and marginal (Rs.14457. It
is very interesting to note that per head income of landless is higher as compared to
marginal and small farms. This shows returns from cereal crops are less when
compared to the returns from trade and service from which percentage of income is
highest (79.23%) in the category of landless farms. Due to this reason average per
head expenses on purchase of durable assets is highest (Rs.275) among landless
when compared to marginal and small farmers.

57
TABLE 3.12: (4.5b.) PER HEAD INCOME AND EXPENDITURE, AND PERCENTAGE
WISE SOURCE OF INCOME ACROSS VILLAGE TYPE
Variables type Borrower’s landholding status Landless Margina
l Small Medium
& Large 1.Annual per head income in Rs.(PY) 13126.00 11457.4
8 11492.71 20554.40
2.%of income from agriculture & % allied activities (PCAGR)
- 39.98 69.07 71.25
3.%of labour income (PCLAB) 12.59 9.14 - 2.78 4.%of income from trade & services (PCTSR)
79.23 44.91 20.48 24.56
5.Per head annual provisional expenses in Rs. (PPROVI)
2494.00 3175.68 4012.50 2047.62
6.Average annual per head expenses on purchase of durable assets in Rs.(PCDUR)
275.00 220.72 312.50 583.33

58
CHAPTER – IV
DISTRIBUTION OF CREDIT THROUGH FINANCIAL INSTITUTIONS
In this chapter supply of credit and its various aspects have been discussed.
Before explaining these aspects it is essential to discuss about the financial institutions
working in the field of supply of credit in both the study villages. In village without
micro-finance only a branch of State Bank of India and two private agencies are
supplying credit to different section of society. Whereas, a branch of regional rural
bank and central bank of India supplying credit through self-help groups in village with
micro-finance. The main features of flow of credit in Himachal Pradesh reflects that
poor farmers never wants to indulge in the process of drawing credit from formal
institutions except in case of subsidy oriented programmes. Introduction of SHGs in
village with micro-finance and cultivation of commercial crops in village without micro-
finance helped rural poors for drawing credit from banks. In this chapter source-wise
average annual loans default rate, borrowers working experience their comfort level,
transaction costs, collaterals use and perceptions about lenders have been discussed
in detail.
FREQUENCY DISTRIBUTION OF SAMPLE BORROWERS
Frequency distribution of sample borrowers across sources of loan and village
type is presented in Table 4.1. This table reveals that at overall level of 50 borrowers,
76 per cent are availing credit from formal resources whereas, it is 24 per cent through
informal lenders. In this distribution the coverage of SHGs is higher accounting 50 per
cent followed by commercial bank 26 per cent and informal lenders 16 per cent.
Village wise results shows that in village without micro-finance about 52 percent of the
total burrowers are drawing credit from commercial bank followed by informal lenders
accounting 32 per cent. The remaining 16 per cent of the borrowers belonging to
landless status have not drawn loan from any sources. On the other side village with
micro-finance have availed 100 per cent of credit through SHGs already linked with
regional and commercial bank operating in the jurisdiction of study area. In Himachal
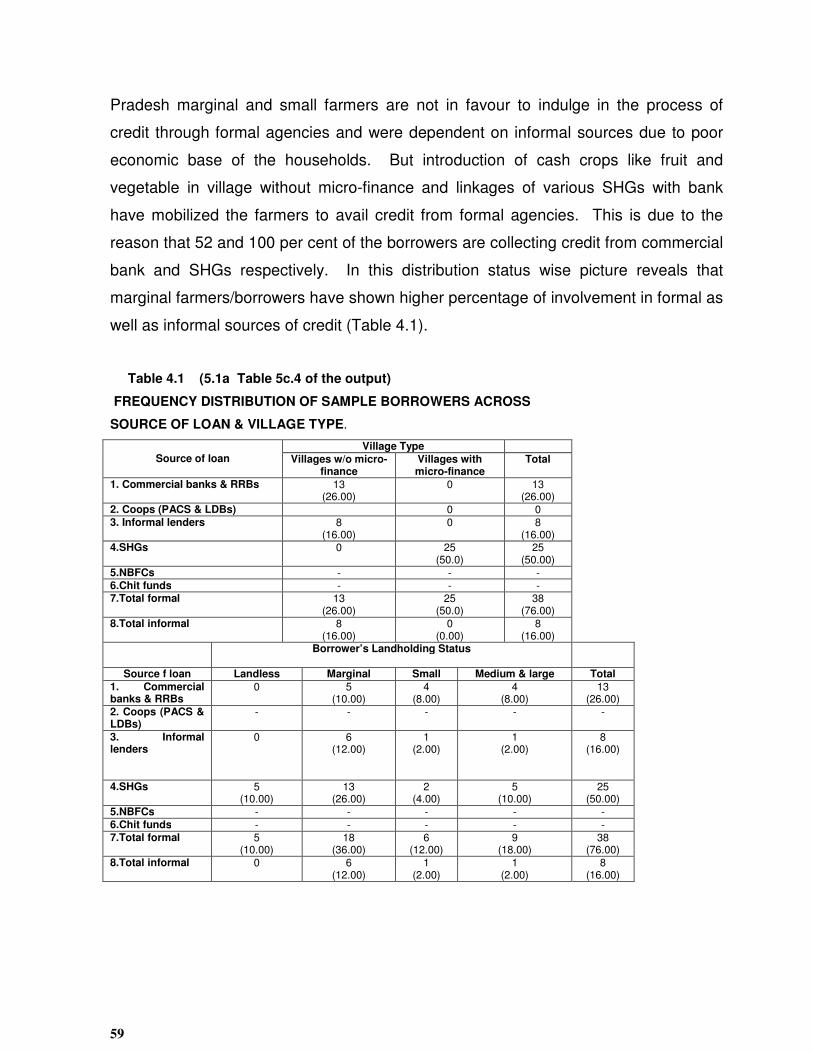
59
Pradesh marginal and small farmers are not in favour to indulge in the process of
credit through formal agencies and were dependent on informal sources due to poor
economic base of the households. But introduction of cash crops like fruit and
vegetable in village without micro-finance and linkages of various SHGs with bank
have mobilized the farmers to avail credit from formal agencies. This is due to the
reason that 52 and 100 per cent of the borrowers are collecting credit from commercial
bank and SHGs respectively. In this distribution status wise picture reveals that
marginal farmers/borrowers have shown higher percentage of involvement in formal as
well as informal sources of credit (Table 4.1).
Table 4.1 (5.1a Table 5c.4 of the output)
FREQUENCY DISTRIBUTION OF SAMPLE BORROWERS ACROSS
SOURCE OF LOAN & VILLAGE TYPE.
Source of loan
Village Type Villages w/o micro-
finance Villages with micro-finance
Total
1. Commercial banks & RRBs 13 (26.00)
0 13 (26.00)
2. Coops (PACS & LDBs) 0 0 3. Informal lenders 8
(16.00) 0 8
(16.00) 4.SHGs 0 25
(50.0) 25
(50.00) 5.NBFCs - - - 6.Chit funds - - - 7.Total formal 13
(26.00) 25
(50.0) 38
(76.00) 8.Total informal 8
(16.00) 0
(0.00) 8
(16.00) Borrower’s Landholding Status
Source f loan Landless Marginal Small Medium & large Total
1. Commercial banks & RRBs
0 5 (10.00)
4 (8.00)
4 (8.00)
13 (26.00)
2. Coops (PACS & LDBs)
- - - - -
3. Informal lenders
0 6 (12.00)
1 (2.00)
1 (2.00)
8 (16.00)
4.SHGs 5 (10.00)
13 (26.00)
2 (4.00)
5 (10.00)
25 (50.00)
5.NBFCs - - - - - 6.Chit funds - - - - - 7.Total formal 5
(10.00) 18
(36.00) 6
(12.00) 9
(18.00) 38
(76.00) 8.Total informal 0 6
(12.00) 1
(2.00) 1
(2.00) 8
(16.00)

60
PERCENTAGE SHARE OF LOAN IN VARIOUS LENDING INSTITUTION
Percentage share of various lending institutions in all loans to the sample
borrowers as classified by village type and status classified by village type and status
presented in Table 4.2. The table reveals that on an average the percentage share of
loan distributed through formal institution accounts 95.75 per cent followed by informal
4.25 per cent. The total percentage is drawn through total loan distributed for all
purpose to borrowers of both the villages. Village wise distribution indicates that in
village without micro finance the percentage share of commercial bank is 95.48
percent and the remaining 4.52 per cent shared by informal agencies whereas, in case
of village with micro-finance SHGs account 100 per cent of the total share. These
SHGs are linked with commercial and regional rural banks. In this table it may be
observed that marginal farmers have highest percentage share of credit from all the
sources of finance as compared to other category of farms.
TABLE 4.2: (TABLE NEW 1) PERCENTAGE SHARES OF VARIOUS LENDING INSTITUTIONS IN ALL LOANS TO THE SAMPLE BORROWERS AS CLASSIFIED BY VILLAGE TYPE/ BORROWER’S LAND HOLDING STATUS.
Village Type Source of loan Villages w/o micro-
finance Villages with micro-
finance All
1. Commercial banks & RRBs
95.48 0.00 95.48
2. Coops (PACS & LDBs) 0.00 0.00 0.00
3. Informal lenders 4.52 0.00 4.52
4.SHGs 0.00 100.00 100.00
5.NBFCs 0.00 0.00 0.00
6.Chit funds 0.00 0.00 0.00
7.Total formal 95.48 100.00 95.75
8.Total informal 4.52 0.00 4.25
Borrower’s Landholding Status
Source f loan Lendless Marginal Small Medium & large
1. Commercial banks & RRBs
0.00 78.79 99.00 90.19
2. Coops (PACS & LDBs)
0.00 0.00 0.00 0.00
3. Informal lenders 0.00 21.21 1.00 5.30
4.SHGs 20.00 52.00 8.00 20.00
5.NBFCs 0.00 0.00 0.00 0.00
6.Chit funds 0.00 0.00 0.00 0.00
7.Total formal 20.00 84.14 99.90 94.69
8.Total informal 0.00 15.86 0.10 5.31

61
CONSUMPTION LOANS
In Table 4.3 it may be seen that only a small amount of consumption loan has
been drawn through SHGs in village with micro-finance. Though, there is a need for
consumption loan to rural people but it’s demand use to be fulfilled through
shopkeepers and relatives as, farmers do not want to indulge in credit with formal
institutions specially in village with micro-finance. At the same time surplus labour of
this village have more opportunities to work in non-farm sector and income drawn from
wage labour is the surety of repayment for consumption loan. In case of village
without micro-finance requirement of consumption loan use to be meat out partly from
loan drawn for input purchase from formal institutions. Farmers of this village have
made limit of loan with bank against their produce of cash crops.
TABLE 4. 3 (TABLE 5 A 1(TABLE 5A 5 OF THE OUTPUT) SOURCE-WISE AVERAGE ANNUAL CONSUMPTION LOAN(IN RS.) ACROSS VILLAGE TYPE/BORROWER’S LAND HOLDING STATUS.
Source of loan Village type
Village w/o micro-finance
Village with micro-finance
1. Commercial banks & RRBs [banks] 0.00 0.00
2.Coops (PACS & LADBs) [coopc] 0.00 0.00
3. Informal lenders [infore] 0.00 0.00
4.SHG [shge] 0.00 80.00 (100.00)
5.NBFCs [nbfee] 0.00 0.00
6.Chit funds [chite] 0.00 0.00
7.Total formal [fore] 0.00 80.00 (100.00)
8.Total informal [nfore] 0.00 0.00
Borrower’s landholding status
Source of loan Landless Marginal Small Medium & large
1. Commercial banks & RRBs [banks]
0.00 0.00 0.00 0.00
2.Coops (PACS & LADBs) [coopc]
0.00 0.00 0.00 0.00
3. Informal lenders [infore]
0.00 0.00 0.00 0.00
4.SHG [shge] 0.00 86.96 (100.00)
0.00 0.00
5.NBFCs [nbfee] 0.00 0.00 0.00 0.00
6.Chit funds [chite] 0.00 0.00 0.00 0.00
7.Total formal [fore] 0.00 86.96 (100.00)
0.00 0.00
8.Total informal [nfore] 0.00 0.00 0.00 0.00
Note: Figures in parentheses represent % shares of total production loan.

62
PRODUCTION LOANS
Source-wise average annual production loan across village type/borrowers land
holding status are presented in Table 4.4. In this table it may be observed that on an
average annual loan drawn from formal resources (Commercial Bank) is Rs. 35
thousand in village without micro-finance. In this village farmers are also availing
annual average credit at the rate of Rs.1660 from two private agencies supplying
credit for inputs especially seed, insecticides/pesticides and other nutrients for fruit and
vegetable crops. On the other side farmers of village with micro-finance are availing
credit at the rate of rupees 360 from SHGs for production purposes. The low rate of
loan in this village is due to traditional cereal based farming where requirement of input
is less as compared to cash crops. Introduction of potato crop during last few years
encouraged farmers to purchase quality seed and fertilizer for cultivation of said crop.
TABLE 4. 4 5A 2 (TABLE 5 A.6 OF THE OUTPUT) SOURCE-WISE AVERAGE ANNUAL PRODUCTION LOAN (IN RS.) ACROSS VILLAGE TYPE/BORROWER’S LAND HOLDING STATUS.
Village type
Source of loan Village w/o micro-finance Village with micro-finance
1. Commercial banks & RRBs [banks] 35040.00 (100.00)
0.00
2.Coops (PACS & LADBs) [coopc] 0.00 0.00
3. Informal lenders [infore] 1660.00 (100.00)
0.00
4.SHG [shge] 0.00 360.00 (100.00)
5.NBFCs [nbfee] 0.00 0.00 6.Chit funds [chite] 0.00 0.00
7.Total formal [fore] 35040.00 (100.00)
360.00 (100.00)
8.Total informal [nfore] 1660.00 (100.00)
0.00
Borrower’s landholding status
Source of loan Landless Marginal Small Medium & large
1. Commercial banks & RRBs [banks]
0.00 4173.91 (100.00)
88571.41 (100.00)
16000.00 (100.00)
2.Coops (PACS & LADBs) [coopc]
0.00 0.00 0.00 0.00
3. Informal lenders [infore] 0.00 1123.91 (100.00)
892.86 (100.00)
940.00 (100.00)
4.SHG [shge] 100.00 (100.00)
0.00 0.00 800.00 (100.00)
5.NBFCs [nbfee] 0.00 0.00 0.00 0.00
6.Chit funds [chite] 0.00 0.00 0.00 0.00 7.Total formal [fore] 100.00
(100.00) 4173.91 (100.00)
88571.41 (100.00)
16800.00 (100.00)
8.Total informal [nfore] 0.00 1123.91 (100.00)
892.86 (100.00)
940.00 (100.00)

63
Borrowers land holding status wise picture reflects that the range of loan vary from
Rs.4274 (marginal) to Rs.16800 (medium) and Rs.88591 among small farmers. The
high range of loan among small farms is due to the reason that one of the farmers
among a total sample has drawn loan for truck hence, range of credit is abnormal
when compared to other categories. Regarding informal source the distribution of loan
vary between Rs.940 to Rs.1124 among marginal, small and medium farms. Almost
whole of the flow of credit is through commercial bank.
HUMAN CAPITAL LOAN
Source wise average annual human capital loan presented in Table 4.5 shows
that only farmers of SHGs in village with micro-finance are availing credit under human
capitals loan drawn in favour of education and health etc. Under human capital loan
none of the farmers have demanded loan in village without micro-finance. This may
be due to the reason of prosperity in the village because of comparatively higher
income from cultivation of cash crops. Status wise picture shows that marginal and
small farmers have drawn loan at higher order i.e. Rs.1391 and 1000 respectively as
compared to landless and medium farms.

64
TABLE 4. 5 5A.3 (TABLE 5A.7 OF THE OUTPUT) SOURCE-WISE AVERAGE ANNUAL HUMAN CAPITAL LOAN (IN RS.) ACROSS VILLAGE TPE/BORROWER’S LAND HOLDING STATUS. Source of loan Village type
Village w/o micro-finance
Village with micro-finance
1. Commercial banks & RRBs [banks]
0.00 0.00
2.Coops (PACS & LADBs) [coopc]
0.00 0.00
3. Informal lenders [infore] 0.00 - 4.SHG [shge] 0.00 1631.20 5.NBFCs [nbfee] 0.00 0.00 6.Chit funds [chite] 0.00 - 7.Total formal [fore] 0.00 1631.20
(100.00) 8.Total informal [nforh] 0.00 -
0.00
Source of loan Borrower’s landholding status Landless Marginal Small Medium &
large 1. Commercial banks & RRBs [banks]
0.00 0.00 0.00 0.00
2.Coops (PACS & LADBs) [coopc]
0.00 0.00 0.00 0.00
3. Informal lenders [infore] 0.00 0.00 0.00 0.00 4.SHG [shge] 3780.00
(100.00) 1391.30 (100.00)
1000.00 (100.00)
500.00 (100.00)
5.NBFCs [nbfee] 0.00 0.00 0.00 0.00 6.Chit funds [chite] 0.00 0.00 0.00 0.00 7.Total formal [fore] 3780.00
(100.00) 1391.30 (100.00)
1000.00 (100.00)
500.00 (100.00)
8.Total informal 0.00 0.00 0.00 0.00 SOURCE-WISE TOTAL LOAN
Source-wise average size of loan in rupees for all purposes across
villages/borrowers land holding size is presented in Table 4.6. On an average
villagers without micro-finance are availing credit at the rate of 35 thousand along with
1660 rupees from informal resources i.e. input supplying private agencies. In this
comparison village with micro-financing are availing credit at the rate of rupees 360
per annum. The said average of rupees 360 has been supplied by regional and

65
commercial banks through self-help groups. In fact, village without micro-financing
use to finalize bank limit of credit against their marketed surplus of fruit and
vegetables. The limit of credit varies as per the marketed surplus available at different
level of production of individual farms. The supply of input through private agencies
are fulfilling the demand of those farmers specially marginal farmers who have small
amount based demand and are not interested to draw loan from banks due to non-
security and consider loan from bank is a social evil.
TABLE 4.6: 5A.4 SOURCE-WISE AVERAGE SIZE OF LOAN (IN RS.) FOR ALL PURPOSES ACROSS VILLAGES/BORROWER’S LAND HOLDING STATUS.
Source of loan
Village type
Village w/o micro-finance
Village with micro-finance
1. Commercial banks & RRBs [banks]
35040.00
0.00
2.Coops (PACS & LDBs) [acoop]
0.00 0.00
3. Informal lenders [ainfor] 1660.00
0.00
4.SHG [ashg] 0.00 360.00
5.NBFCs [anbfe] 0.00 0.00 6.Chit funds [achit] 0.00 0.00 7.Total formal [afor] 35040.00
360.00
8.Total informal [anfor] 1660.00
0.00
Source of loan Borrower’s landholding status
Landless Marginal Small Medium & large 1. Commercial banks & RRBs [banks]
0.00 4173.91
88571.41
16000.00
2.Coops (PACS & LDBs) [acoop]
0.00 0.00 0.00 0.00
3. Informal lenders [ainfor] 0.00 1123.91 892.86 940.00 4.SHG [ashg] 478.00 1478.26 1000.00 1300.00 5.NBFCs (anbfe] 0.00 0.00 0.00 0.00 6.Chit funds [achite] 0.00 0.00 0.00 0.00 7.Total formal [afor] 478.00 5652.17 89571.00 16940.00 8.Total informal [afor] 0.00 1123.91 1000.00 1300.00

66
In this comparison village with micro-finance have no such resource which may be
utilized as pledge for the limit of credit with financial institutions. They have surplus
labour instead of surplus produce. This may be the reason for which self-help groups
provides more scope of credits to the labourers who have unviable land holdings.
DEFAULT RATE
As per the discussion held with managers of banks it comes to know that banks
felt a major jolt when loans were exempted by the Govt. of India. In this concern loan
amounting rupees 2500 drawn before 1992 will be exempted. Keeping this exemption
in mind the borrowers who have drawn loan after date of exemption have become
willful defaulters thinking that their loan further also be exempted. Therefore, banking
required an independence in their dealing instead of paying loan to government
sponsored farmers. Source-wise default rate across village type/borrower’s
landholding status presented in Table 4.7. In this table it may be seen that village with
micro-finance have no default rate and banks are satisfied with the working of SHGs.
On the other hand village without micro finance have shown 5.88 per cent default rate.
During discussion with officials of the banks political persons from the villages who
have drawn loan for non-farm activities are among the major defaulters. Low level of
default rate is due to permanent source of income i.e. fruits and vegetables in village
without micro-finance.
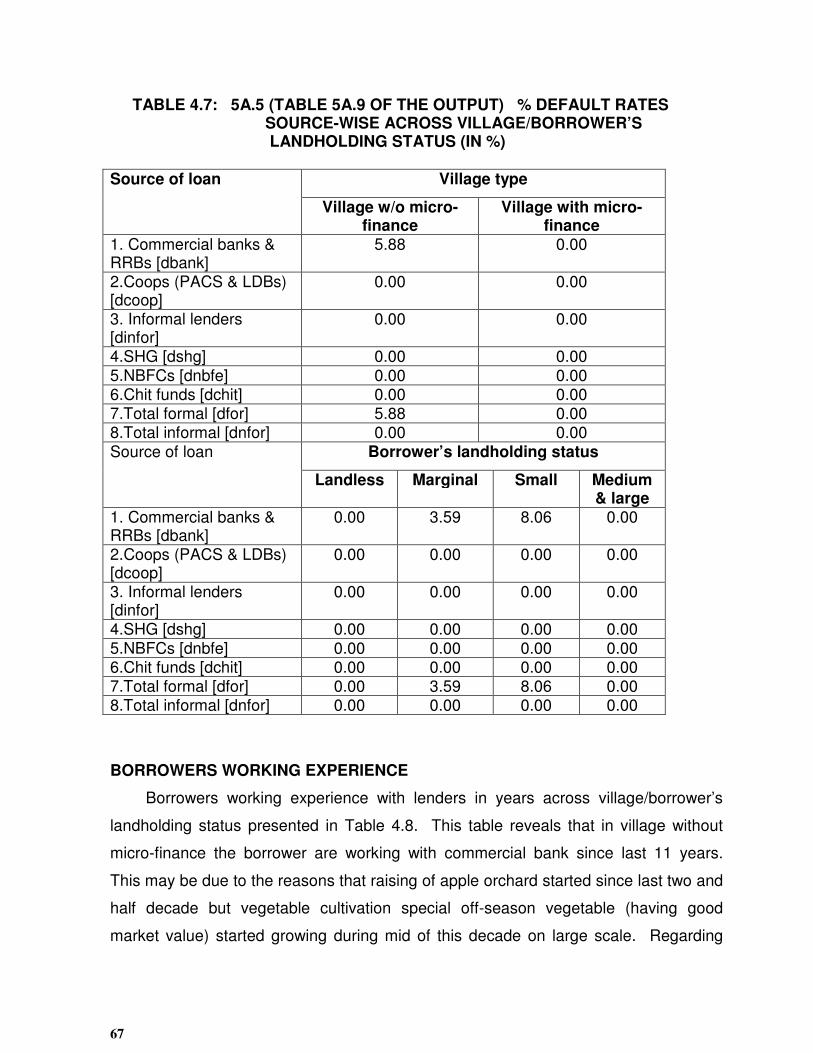
67
TABLE 4.7: 5A.5 (TABLE 5A.9 OF THE OUTPUT) % DEFAULT RATES SOURCE-WISE ACROSS VILLAGE/BORROWER’S LANDHOLDING STATUS (IN %) Source of loan Village type
Village w/o micro-finance
Village with micro-finance
1. Commercial banks & RRBs [dbank]
5.88 0.00
2.Coops (PACS & LDBs) [dcoop]
0.00 0.00
3. Informal lenders [dinfor]
0.00 0.00
4.SHG [dshg] 0.00 0.00
5.NBFCs [dnbfe] 0.00 0.00 6.Chit funds [dchit] 0.00 0.00 7.Total formal [dfor] 5.88 0.00 8.Total informal [dnfor] 0.00 0.00
Source of loan Borrower’s landholding status
Landless Marginal Small Medium & large
1. Commercial banks & RRBs [dbank]
0.00 3.59 8.06 0.00
2.Coops (PACS & LDBs) [dcoop]
0.00 0.00 0.00 0.00
3. Informal lenders [dinfor]
0.00 0.00 0.00 0.00
4.SHG [dshg] 0.00 0.00 0.00 0.00
5.NBFCs [dnbfe] 0.00 0.00 0.00 0.00 6.Chit funds [dchit] 0.00 0.00 0.00 0.00 7.Total formal [dfor] 0.00 3.59 8.06 0.00 8.Total informal [dnfor] 0.00 0.00 0.00 0.00
BORROWERS WORKING EXPERIENCE
Borrowers working experience with lenders in years across village/borrower’s
landholding status presented in Table 4.8. This table reveals that in village without
micro-finance the borrower are working with commercial bank since last 11 years.
This may be due to the reasons that raising of apple orchard started since last two and
half decade but vegetable cultivation special off-season vegetable (having good
market value) started growing during mid of this decade on large scale. Regarding

68
village with micro-finance the working experience in this system is newly introduced
hence villagers have started working in these groups since last two to three years.
Category wise results shows that working experience of Commercial Bank vary from 4
years among marginal to about 8 years among small and medium farms. Whereas,
working experience is less than threes years in SHGs and informal lenders.
TABLE 4.8: 5A.6(TABLE 5A.10 OF THE OUTPUT) BORROWERS WORKING EXPERIENCE WITH LENDERS IN YEARS ACROSS VILLAGES/BORROWER’S LANDHOLDING STATUS
Source of loan Village type
Village w/o micro-finance
Village with micro-finance
1. Commercial banks & RRBs [wbank]
11.00 0.00
2.Coops (PACS & LDBs) [wcoop]
0.00 0.00
3. Informal lenders [winfor]
4.00 0.00
4.SHG [wshg] 0.00 3.00 5.NBFCs [wnbfe] 0.00 0.00
6.Chit funds [wchit] 0.00 0.00 7.Total formal [wfor] 11.00 3.00 8.Total informal [wnfor] 4.00 0.00
Source of loan Borrower’s landholding status
Landless Marginal Small Medium & large
1. Commercial banks & RRBs [wbank]
0.00 4.00 7.69 7.00
2.Coops (PACS & LDBs) [wcoop]
0.00 0.00 0.00 0.00
3. Informal lenders [winfor]
0.00 2.90 2.85 1.50
4.SHG [wshg] 1.50 1.69 0.85 1.50 5.NBFCs [wnbfe] 0.00 0.00 0.00 0.00
6.Chit funds [wchit] 0.00 0.00 0.00 0.00 7.Total formal [wfor] 1.50 5.69 8.54 8.50 8.Total informal [wnfor] 0.00 2.90 2.85 1.50

69
COMFORT LEVEL
Index of borrower’s comfort level with different lending organization across village
type and borrowers land holding status is presented in Table 4.9. The table shows
that comfort level with commercial bank in village without micro-finance is less when
compared SHGs of the village with micro-finance. This shows in traditional credit
system there is lack of facilities equal to that of SHGs hence, comfort level is below
maximum satisfaction. Basically flow of credit through self-help groups required no
major formalities except deposits whereas, opening an account in bank have less
comforts.
TABLE 4.9: 5A.7 (TABLE 5A.11 OF THE OUTPUT) INDEX OF BORROWER’S COMFORT LEVEL WITH DIFFERENT LENDING ORGANIZATIONS ACROSS VILLAGE TYPE AND BORROWER’S LAND HOLDING
Source of loan Village type
Village w/o micro-finance Village with micro-finance
1. Commercial banks & RRBs [cbank]
0.52 0.00
2.Coops (PACS & LDBs) [ccoop]
0.00 0.00
3. Informal lenders [cinfor] 0.16 0.00
4.SHG [cshg] 0.00 1.00
5.NBFCs [cnbfe] 0.00 0.00
6.Chit funds [cchit] 0.00 0.00
7.Total formal [cfor] 0.52 1.00
8.Total informal [cnfore] 0.16 0.00
Source of loan
Borrower’s landholding status
Landless Marginal Small Medium & large
1. Commercial banks & RRBs [cbank]
0.00 0.22 0.57 0.40
2.Coops (PACS & LDBs) [coop]
0.00 0.00 0.00 0.00
3. Informal lenders [cinfor] 0.00 0.26 0.14 0.10
4.SHG [cshg] 1.00 1.00 1.00 1.00
5.NBFCs [cnbfe] 0.00 0.00 0.00 0.00
6.Chit funds [cchit] 0.00 0.00 0.00 0.00
7.Total formal [cfore] 1.00 1.22 1.57 1.40
8.Total informal [cnfor] 0.00 0.26 0.14 0.40
Note: The comfort levels for CBANK, CCOOP etc. varies from 1 (in case of maximum comfort) to 5 (in case of minimum comfort).

70
BORROWERS TRANSACTIONS FREQUENCY
Source-wise annual frequency of borrower’s transactions (in number) with
different lending organization across village type and borrower landholding status is
presented in Table 4.10. The table shows that on an average frequency of borrower’s
transaction is 1.80 in a years in village without micro-finance whereas, it is more than
five in case of self-help group of village with micro-finance. This is due to the reasons
that cash crops have single major transaction in a year which vary across farm status.
Comparatively small farmers in village without micro-finance have more transactions
followed by medium and marginal farms. But in case of village with micro-finance the
transaction are comparatively more in the farm of marginal category followed by
landless, medium and small farms. Since SHGs based on micro collections of
deposits hence transaction will also be made in similar rate where amount of
repayment use to be deposited in regular small installments.
TABLE 4.10 5A.8 (TABLE 5A.12 OF THE OUTPUT) SOURCE-WISE ANNUAL FREQUENCY OF BORROWER’S TRANSACTIONS (IN NUMBERS) WITH DIFFERENT LENDING ORGANIZATIONS ACROSS VILLAGE TYPE AND BORROWER’S LANDHOLDING STATUS.
Source of loan
Village type
Village w/o micro-finance
Village with micro-finance
1. Commercial banks & RRBs [qbank] 1.80 0.00
2.Coops (PACS & LDBs) [qcoop] 0.00 0.00
3. Informal lenders [qinfor] 0.48 0.00
4.SHG [qshg] 0.00 5.52 5.NBFCs [qnbfe] 0.00 0.00
6.Chit funds [qchit] 0.00 0.00
7.Total formal [qfor] 1.80 5.52
8.Total informal [qnfor] 0.48 0.00
Source of loan
Borrower’s landholding status Landless Marginal Small Medium & large
1. Commercial banks & RRBs [qbank] 0.00 0.95 1.43 1.30
2.Coops (PACS & LDBs) [qcoop] 0.00 0.00 0.00 0.00
3. Informal lenders [qinfor] 0.00 0.78 0.43 0.30
4.SHG [qshg] 5.40 6.52 2.86 5.20 5.NBFCs [qnbfe] 0.00 0.00 0.00 0.00
6.Chit funds [qchit] 0.00 0.00 0.00 0.00
7.Total formal [qfor] 5.40 6.87 4.29 6.50
8.Total informal [qnfor] 0.00 0.78 0.43 0.30

71
INDEX OF FLEXIBILITY
Index of flexibility enjoyed by borrowers in term of possible loan rescheduling
across village type and borrowers landholding status is shown in Table 4.11. The
table indicate that chances of flexibility in rescheduling of loans are less in commercial
banks as compared to self-help groups. This may be due to the reason that
rescheduling in SHGs could be managed with in members of the groups whereas
banks have not such adjustments. Rescheduling in banks may create various
problems such as increase in default rate etc. Similar trend have shown among
different category of farms.
TABLE 4.11 5A.10(TABLE 5A.13 OF THE OUTPUT) INDEX OF FLEXIBILITY ENJOYED BY BORROWERS IN TERMS OF POSSIBLE LOAN RESCHEDULING ACROSS VILLAGE TYPE AND BORROWER’S LAND HOLDING STATUS.
Source of loan
Village type
Village w/o micro-finance Village with micro-finance
1. Commercial banks & RRBs [xbank]
0.06 0.00
2.Coops (PACS & LDBs) [xcoop]
0.00 0.00
3. Informal lenders [xinfor] 0.00 0.00
4.SHG [xshg] 0.00 0.50
5.NBFCs [xnbfe] 0.00 0.00
6.Chit funds [xchit] 0.00 0.00
7.Total formal [xfor] 0.06 0.50
8.Total informal [xnfor] 0.00 0.00
Source of loan Borrower’s landholding status
Landless Marginal Small Medium & large
1. Commercial banks & RRBs [xbank]
0.00 0.04 0.14 0.10
2.Coops (PACS & LDBs) [xcoop]
0.00 0.00 0.00 0.00
3. Informal lenders [xinfor] 0.00 0.00 0.00 0.00
4.SHG [xshg] 0.50 0.57 0.29 0.50
5.NBFCs [xnbfe] 0.00 0.00 0.00 0.00
6.Chit funds [xchit] 0.00 0.00 0.00 0.00
7.Total formal [xfor] 0.50 0.61 0.43 0.60
8.Total informal [xnfor] 0.00 0.00 0.00 0.00

72
BORROWERS TRANSACTION COST (PER LOAN ON VISITS)
Source-wise borrowers transaction cost per loan on visit shows in Table 4.12 that
total cost on per loan on visits is 15.40 rupees in commercial bank of village without
micro-finance. The said cost accounts rupees 4.10 in informal lenders of said village.
In this comparison the per loan cost on visits of village with micro-finance have shown
no cost. This is due to the reason that members of SHGs are used to meet at a
particular mid point of village where important issues like loan distribution etc. are used
to be finalized which require no costs. As per landholding status shown in said table
indicate that comparatively small farmers are paying more transaction cost i.e. rupees
36 in case of formal institution and rupees 7 in case of informal lenders.
TABLE 4.12 5B.1(TABLE 5 B.1 OF THE OUTPUT) SOURCE-WISE BORROWER’S TRANSACTIONS COST PER LOAN ON VISITS TO THE LENDER (IN RS.) ACROSS VILLAGE TYPE/BORROWER’S LAND HOLDING STATUS
Source of loan Village type
Village w/o micro-finance
Village with micro-finance
1. Commercial banks & RRBs [bankvs]
15.40 0.00
2.Coops (PACS & LDBs) [coopvs]
0.00 0.00
3. Informal lenders [inforvs] 4.10 0.00
4.SHG [shgvs] 0.00 0.00
5.NBFCs [nbfevs] 0.00 0.00
6.Chit funds [chitvs] 0.00 0.00
7.Total formal [forvs] 15.40 0.00
8.Total informal [nforvs] 4.10 0.00
Source of loan Borrower’s landholding status
Landless Marginal Small Medium & large
1. Commercial banks & RRBs [bankvs]
0.00 9.57 35.71 30.00
2.Coops (PACS & LDBs) [coopvs]
0.00 0.00 0.00 0.00
3. Informal lenders [inforvs] 0.00 4.57 7.14 5.00
4.SHG [shgvs] 0.00 0.00 0.00 0.00
5.NBFCs [nbfevs] 0.00 0.00 0.00 0.00
6.Chit funds [chitvs] 0.00 0.00 0.00 0.00
7.Total formal [forvs] 0.00 9.57 35.71 30.00
8.Total informal [nforvs] 0.00 4.57 7.14 5.00

73
BORROWERS TOTAL TRANSACTION COST
Source-wise borrower’s total transaction cost per loan across village type and
borrower’s land holding status is presented in Table 4.13. In this table it may be
observed that transaction cost on village without micro-finance have shown rupees 58
when loan drawn from commercial banks. The said cost is 1.70 rupees in village with
micro-finance where SHGs are availing credit from commercial as well as regional
rural banks. Land holding status wise picture shown in the table reveals that
in case of SHGs total cost of loan vary from rupees 1.14 to 1.87 while
drawing credit from SHGs. The total cost of loan is highest (200 Rs.) in the category
of small farms. This may be due to the reason that one of the respondent has
purchased truck hence transaction cost is high in this category.
TABLE 4.13 5B.2 (TABLE 5B.2 OF THE OUTPUT) SOURCE-WISE BORROWER’S TOTAL TRANSACTION COST PER LOAN (IN RS.)ACROSS VILLAGE TYPE/BORROWER’S LANDHOLDING STATUS
Source of loan Village type
Village w/o micro-finance
Village with micro-finance
1. Commercial banks & RRBs [bankte & pbankte]
58.00 0.00
2.Coops (PACS & LDBs) [coopte & pcoopte]
0.00 0.00
3. Informal lenders [inforte & pinforte]
0.00 0.00
4.SHG [shgte & pshgte] 0.00 1.70
5.NBFCs [nbfete & pnbfete] 0.00 0.00
6.Chit funds [chitte & pchitte] 0.00 0.00
7.Total formal [forte & pforte] 58.00 1.70
8.Total informal [nforte & pnforte]
0.00 0.00
Source of loan Borrower’s landholding status
Landless Marginal Small Medium & large
1. Commercial banks & RRBs [bankte & pbankte]
0.00 28.26 200.00 85.00
2.Coops (PACS & LDBs) [coopte & pcoopte]
0.00 0.00 0.00 0.00
3. Informal lenders [inforte & pinforte]
0.00 0.00 0.00 0.00
4.SHG [shgte & pshgte] 1.70 1.87 1.14 1.70
5.NBFCs [nbfete & pnbfete] 0.00 0.00 0.00 0.00
6.Chit funds [chitte & pchitte] 0.00 0.00 0.00 0.00
7.Total formal [forte & pforte] 1.70 30.13 201.14 86.70
8.Total informal [nforte & pnforte]
0.00 0.00 0.00 0.00

74
INTEREST COLLECTION
Source-wise nature of interest collection from different lending organization reveals in
Table 4.14 that generally in all the institution interest is collected on later system
across villages as well as category of farms.
TABLE 4.14: 5B.3 (TABLE 5B.4 OF THE OUTPUT) SOURCE-WISE NATURE OF INTEREST COLLECTION (WHETHER UNFRONT OR LATER) FROM DIFFERENT LENDING ORGANIZATIONS ACROSS VILLAGE TYPE/ BORROWER’S LAND HOLDING STATUS
Source of loan Village type Village w/o micro-
finance Village with micro-
finance 1. Commercial banks & RRBs [bankup]
0.08 0.00
2.Coops (PACS & LDBs) [coopup]
0.00 0.00
3. Informal lenders [inforup]
0.00 0.00
4.SHG [shgup] 0.00 0.00 5.NBFCs [nfeup] 0.00 0.00 6.Chit fund [chitup] 0.00 0.00 7.Total formal [forup] 0.08 0.00 8.Total informal [nforup] 0.00 0.00
Source of loan Borrower’s landholding status
Landless
Marginal Small Medium & large
1. Commercial banks & RRBs [bankup]
0.00 0.00 0.29 0.00
2.Coops (PACS & LDBs) [coopup]
0.00 0.00 0.00 0.00
3. Informal lenders [inforup]
0.00 0.00 0.00 0.00
4.SHG [shgup] 0.00 0.00 0.00 0.00 5.NBFCs [nfeup] 0.00 0.00 0.00 0.00 6.Chit fund [chitup] 0.00 0.00 0.00 0.00 7.Total formal [forup] 0.00 0.00 0.29 0.00
8.Total informal [nforup] 0.00 0.00 0.00 0.00

75
AVERAGE DAYS TAKEN FOR LOAN
Average number of days taken(between application and disbursement of loan) for
loan processing of loan across village type/borrowers landholding status is presented
in Table 4.15. In this table it may be observed that in village without micro-finance it
takes about 2.08 days when loan drawn from commercial banks. In case of village
with micro-finance the loan drawn through self-help groups required about 1.60 days.
Category wise picture shows that average number of days spent for drawing loan vary
from 1.20 to 1.90 days among different category of farms when loan drawn through
SHGs. The said distribution through commercial banks vary from 1.17 days to 7.86
days. In this concern small farmers are spending about 8 days because of the reason
that among these farmers a single farmer has drawn loan for transportation (vehicle)
hence, average in all the cases have shown abnormality in results.
TABLE 4.15: 5B.4 (TABLE 5B.5 OF THE OUTPUT) AVERAGE NO OF DAYS TAKEN (BETWEEN APPLICATION & DISBURSEMENT OF LOAN) FOR LOAN PROCESSING PER LOAN ACROSS VILLAGE TYPE/BORROWER’S
LANDHOLDING STATUS
Source of loan
Village type
Village w/o micro-finance
Village with micro-finance
1. Commercial banks & RRBs [bankdy]
2.08 0.00
2.Coops (PACS & LDBs) [coopdy]
0.00 0.00
3. Informal lenders [infordy] 0.00 0.00
4.SHG [shgdy] 0.00 1.60
5.NBFCs [nfedy] 0.00 0.00
6.Chit fund [chitdy] 0.00 0.00
7.Total formal [fordy] 2.08 1.60
8.Total informal [nfordy] 0.00 0.00 Source of loan Borrower’s landholding status
Landless Marginal Small Medium & large
1. Commercial banks & RRBs [bankdy]
0.00 1.17 7.86 2.20
2.Coops (PACS & LDBs) [coopdy]
0.00 0.00 0.00 0.00
3. Informal lenders [infordy] 0.00 0.00 0.00 0.00
4.SHG [shgdy] 1.20 1.65 1.57 1.90
5.NBFCs [nfedy] 0.00 0.00 0.00 0.00
6.Chit fund [chitdy] 0.00 0.00 0.00 0.00
7.Total formal [fordy] 1.20 2.82 9.43 4.10
8.Total informal [nfordy] 0.00 0.00 0.00 0.00

76
PERCENTAGE GAP SHORTFALL IN DEMAND AND SUPPLY
Percentage shortfall between demand and supply is presented in Table 4.16 and
4.17. the response regarding percentage gap between demand and supply is zero in
both the cases shown in these tables. This may be due to the reasons that small and
marginal farmers of village with micro financing hesitate to link with formal financial
institutions. The said hesitation among these farmers over come by providing credit
through self help groups where commercial as well as regional rural banks are
supplying credit through groups. So, they are satisfied with the supplying of credit. On
the other hand village without micro finance have sufficient income from vegetables
and never interested to increase their limit of loan from banks. Though these farmers
are stressed by banks official to draw more amount of loan but farmers use to ignore
this idea of formal lending institutions.
TABLE 4.16: 5B.5 (TABLE 5B.6 OF THE OUTPUT) %GAP SHORTFALL OF LOAN ACTUALLY SUPPLIED FROM AMOUNT DEMANDED BY BORROWER ACROSS VILLAGE TYPE/BORROWER’S LAND HOLDING STATUS
Source of loan Village type
Village w/o micro-finance
Village with micro-finance
1. Commercial banks & RRBs [bankgap]
0.00 0.00
2.Coops (PACS & LDBs) [coopgap]
0.00 0.00
3. Informal lenders [inforgap] 0.00 0.00
4.SHG [shggap] 0.00 0.00
5.NBFCs [nfegap] 0.00 0.00
6.Chit fund [chitgap] 0.00 0.00
7.Total formal [forgap] 0.00 0.00
8.Total informal [nforgap] 0.00 0.00 Source of loan Borrower’s landholding status
Landless Marginal Small Medium & large
1. Commercial banks & RRBs [bankgap]
0.00 0.00 0.00 0.00
2.Coops (PACS & LDBs) [coopgap]
0.00 0.00 0.00 0.00
3. Informal lenders [inforgap] 0.00 0.00 0.00 0.00
4.SHG [shggap] 0.00 0.00 0.00 0.00
5.NBFCs [nfegap] 0.00 0.00 0.00 0.00
6.Chit fund [chitgap] 0.00 0.00 0.00 0.00
7.Total formal [forgap] 0.00 0.00 0.00 0.00
8.Total informal [nforgap] 0.00 0.00 0.00 0.00

77
TABLE 4.17: 5B.6 (TABLE 5B.7 OF THE OUTPUT) %GAP OF LOAN DISBURSED TO BORROWERS IN CASH ACROSS VILLAGE TYPE & BORROWER’S LANDHOLDING STATUS
Source of loan Village type
Village w/o micro-finance
Village with micro-finance
1. Commercial banks & RRBs [bankgap]
0.00 0.00
2.Coops (PACS & LDBs) [coopgap]
0.00 0.00
3. Informal lenders [inforgap]
0.00 0.00
4.SHG [shggap] 0.00 0.00 5.NBFCs [nfegap] 0.00 0.00
6.Chit fund [chitgap] 0.00 0.00 7.Total formal [forgap] 0.00 0.00 8.Total informal [nforgap] 0.00 0.00
Source of loan Borrower’s landholding status
Landless Marginal Small Medium & large
1. Commercial banks & RRBs [bankgap]
0.00 0.00 0.00 0.00
2.Coops (PACS & LDBs) [coopgap]
0.00 0.00 0.00 0.00
3. Informal lenders [inforgap]
0.00 0.00 0.00 0.00
4.SHG [shggap] 0.00 0.00 0.00 0.00
5.NBFCs [nfegap] 0.00 0.00 0.00 0.00 6.Chit fund [chitgap] 0.00 0.00 0.00 0.00 7.Total formal [forgap] 0.00 0.00 0.00 0.00 8.Total informal [nforgap] 0.00 0.00 0.00 0.00
COLLATERALS USED BY LENDING AGENCIES
Average number of collaterals used by lending agencies across village type and
borrowers status is presented in Table 4.18. In this table it may be seen that average
number of total formal collaterals vary from 0.52 in village without micro finance to 1.00
in village with micro finance. In this village bank use to mortgage farmers land

78
whereas in village with micro finance required only a guarantee of group. Status wise
collaterals are almost the same among landless, marginal, small and medium farms.
TABLE 4.18: 5C.1 (TABLE 5C.1 OF THE OUTPUT) AVERAGE NUMBER OF COLLATERALS USED BY LENDING AGENCIES ACROSS VILLAGE TYPE & BORROWER’S LANDHOLDING STATUS
Source of loan Village type
Village w/o micro-finance
Village with micro-finance
1. Commercial banks & RRBs [bankmul]
0.52 0.00
2.Coops (PACS & LDBs) [coopmul]
0.00 0.00
3. Informal lenders [informul] 0.00 0.00 4.SHG [shgmul] 0.00 1.00 5.NBFCs [nfemul] 0.00 0.00
6.Chit fund [chitmul] 0.00 0.00 7.Total formal [formul] 0.52 1.00 8.Total informal [nformul] 0.00 0.00
Source of loan Borrower’s landholding status
Landless Marginal Small Medium & large
1. Commercial banks & RRBs [bankmul]
0.00 0.22 0.57 0.40
2.Coops (PACS & LDBs) [coopmul]
0.00 0.00 0.00 0.00
3. Informal lenders [informul]
0.00 0.00 1.00 0.00
4.SHG [shgmul] 1.00 1.00 1.00 1.00 5.NBFCs [nfemul] 0.00 0.00 0.00 0.00 6.Chit fund [chitmul] 0.00 0.00 1.00 1.00 7.Total formal [formul] 1.00 1.22 1.57 1.40 8.Total informal [nformul] 0.00 0.00 0.00 0.00

79
INDEX OF FLEXIBILITY
Index of flexibility allowed in loan repayment across village type and borrower’s
landholding status shown in Table 4.19. In this table it may be observed that banks
have shown minimum flexibility as compared of SHGs where flexibility is maximum.
TABLE 4.19: 5C.2 (TABLE 5C.2 OF THE OUTPUT) INDEX OF FLEXIBILITY ALLOWED IN LOAN REPAYMENT ACROSS VILLAGE TYPE & BORROWER’S LANDHOLDING STATUS
Source of loan Village type
Village w/o micro-finance
Village with micro-finance
1. Commercial banks & RRBs [bankflx]
2.52 0.00
2.Coops (PACS & LDBs) [coopflx]
0.00 0.00
3. Informal lenders [inforflx] 2.60 0.00 4.SHG [shgflx] 0.00 1.00 5.NBFCs [nfeflx] 0.00 0.00 6.Chit fund [chitflx] 0.00 0.00 7.Total formal [forflx] 2.52 1.00 8.Total informal [nforflx] 2.60 0.00
Source of loan Borrower’s landholding status
Landless Marginal Small Medium & large
1. Commercial banks & RRBs [bankflx]
0.00 1.09 2.57 2.00
2.Coops (PACS & LDBs) [coopflx]
0.00 0.00 0.00 0.00
3. Informal lenders [inforflx]
0.00 1.09 2.86 2.00
4.SHG [shgflx] 1.50 0.57 0.29 1.50 5.NBFCs [nfeflx] 0.00 0.00 0.00 0.00 6.Chit fund [chitflx] 0.00 0.00 0.00 0.00 7.Total formal [forflx] 1.50 1.66 2.86 3.50
8.Total informal [nforflx] 0.00 1.09 2.86 2.00

80
BEHAVIOUR OF TRUST RELATED VARIABLES
Formal Resources Behaviour
In formal sector behaviour of trust related variables in terms of nature of security
sought by lending organization across village type and Borrowers landholding status
presented in Table 4.20. In this table it may be seen that in village with micro
financing where credit is drawn from various banks through SHGs required no any
guarantee, security, agreement and land mortgage etc. Only assurance guarantee of
group member is the only demand for drawing credit through self-help group. In case
of village without micro financing there are different type of guarantees/securities like
third party/personal guarantee, prior agreement asked for in the form of input purchase
against loan and mortgage of land against the loan.
Further table shows that there is no scope for conveniently spacing the loan in
both the villages. Regarding flexibility in loan scheduling and flexibility in
documentation and other condition the scope are better in village with micro finance
when compared to village without micro finance. Status wise picture shows that only
landless category of farm have shown low level of index in above mentioned variables
in comparison to other category of farms. Discussion concludes that at the level of
lending institution scope of flexibility in term of securing rescheduling and spacing of
loan are very less but in case of borrowers of SHGs adjustment of above variable
could be made through NGO working in the field of formation and linkages of SHGs.
INFORMAL RESOURCES BEHAVIOUR
Regarding informal resources still marginal and small farmers are dependent on
their friends and relatives for credit. It is very interesting to note that majority of the
people are in search of a society where flow of money is on higher rank. To achieve
this society individuals those are in need of credit use to provide various social
services and human labour. In this return borrowers belonging from all status collect
credit for which they have to pay no interests. At the same time the relation of
borrowers and lenders remain hidden and generally disclosed on a particular
occasions especially at the time of deference between the two. In this process
81
exemption of interest use to compensate under the services provided by the
borrowers. During the course of this study it was observed that medium farmers or
economically advanced households have turned their demand of credit from friends
and relatives to financial institutions. This society having higher craze of development
and utilizing supply of loans from formal institutions. In this village two private agencies
are in operation and supplying inputs like seed and insecticides/pesticides to the
farmers. They have no any formality for drawing credit due to local identification as
well as assurance of cultivation of crops. Discussion concludes that private agencies
in village without micro finance and SHGs in village with micro finance proved helpful
to switch over farmers from money lenders to financial agencies. At the same time the
category of medium and large households approaching for formal and informal
institutions for credit and also motivating the society of marginal and small farmers to
avail facilities provided by these institutions.

82
TABLE 4.20: 5C.3 (TABLE 5C.3 OF THE OUTPUT) BEHAVIOUR OF TRUST RELATED VARIABLES IN TERMS OF NATURE OF SECURITY SOUGHT BY LENDING ORGANIZATIONS ACROSS VILLAGETYPE & BORROWER’S LAND HOLDING STATUS. Source of loan Village type Borrower’s landholding status
Village w/o micro-finance
Villages with
micro-finance
Landless
Marginal
Small
Medium & large
FORMAL SECTOR
1.Indices of whether no security is requested for [FORNS][0=no, 1=yes]
0.08 0.00 0.00 0.00 0.29 0.00
2.Index of whether security asked for in the form of third party/personal guarantee [FORTP][0=no, 1=yes]
0.04 0.00 0.00 0.00 0.00 0.00
3.Index of whether security asked for in the form of group guarantee [FORGG] [0=no, 1=yes]
0.00 1.00 0.50 0.57 0.43 0.50
4.Index of whether prior agreement asked for in the form of input purchase against loan [FORIP] [0=no, 1=yes]
0.08 0.00 0.00 0.00 0.29 0.00
5.Index of whether agreement asked for in the form of labour sale in future [FORLB] [0=no,1=yes]
0.00 0.00 0.00 0.00 0.00 0.00
6.Index of whether agreement asked for in the form of output sale in future [FOROP] [0=no,1=yes]
0.00 0.00 0.00 0.00 0.00 0.00
7.Index of various material mortgage asked for against the loans [FORMT][0=no, 1=yes]
0.52 0.00 0.00 0.22 0.57 0.40
8.Index of borrower’s desired to stop lending from these sources because of
0.00 0.00 0.00 0.00 0.00 0.00

83
collateral/security reasons[FORST] [0=no, 1=yes] 9. Ranking index for flexibility in loan scheduling [FORFX] [1=best, 5=worst]
2.52 1.00 0.50 1.65 2.86 2.50
10.Ranking index in terms of scope for conveniently spacing the loan installments [FORSP][1=best, 5=worst]
2.60 3.72 0.50 0.00 0.00 0.00
11.Ranking index in terms of flexibility in documentation & other conditions [FORDO] [1=best, 5=worst]
2.60 1.00 0.50 1.65 2.86 2.50
12.Ranking index in terms of provision of incentives /concessions to encourage good borrower behavior [FORCN] [1=best, 5=worst]
2.60 1.00 0.50 1.65 3.14 2.50
INFORMAL SECTOR
1.Indices of whether no security is requested for [NFORNS][0=no, 1=yes]
0.00 0.00 0.00 0.00 0.00 0.00
2.Index of whether security asked for in the form of third party/ personal guarantee [NFORTP] [0=no, 1=yes]
0.00 0.00 0.00 0.00 0.00 0.00
3.Index of whether security asked for in the form of group guarantee [NFORGG][0=no, 1=yes]
0.00 0.00 0.00 0.00 0.00 0.00
4.Index of whether prior agreement asked for in the form of input purchase against loan [NFORIP][0=no, 1=yes]
0.00 0.00 0.00 0.00 0.00 0.00
5.Index of whether agreement asked for in the form of labour sale in future [NFORLB][0=no,
0.00 0.00 0.00 0.00 0.00 0.00

84
1=yes] 6.Index of whether agreement asked for in the form of output sale in future [NFOROP][0=no, 1=yes]
0.00 0.00 0.00 0.00 0.00 0.00
7.Index of various material mortgage asked for against the loan [NFORMT] [0=no, 1=yes]
0.00 0.00 0.00 0.00 0.00 0.00
8.Index of borrower’s desire to stop lending from these sources because of collateral /security reason [NFORST] [0=no, 1 yes]
0.00 0.00 0.00 0.00 0.00 0.00
9.Ranking index for flexibility in loan scheduling [NFORFX] [1=best, 5=worst]
0.00 0.00 0.00 0.00 0.00 0.00
10.Ranking index in terms of scope for conveniently spacing the loan installments [NFORSP] [1=best, 5=worst]
0.00 0.00 0.00 0.00 0.00 0.00
11.Ranking index in terms of flexibility in documentation & other conditions [NFORDO] [1=best, 5=worst]
0.00 0.00 0.00 0.00 0.00 0.00
12.Ranking index in terms of provision of incentives/ concessions to encourage good borrower behavior [INFORCN][1=best, 5=worst]
0.00 0.00 0.00 0.00 0.00 0.00
BORROWERS PERCEPTION ABOUT RESCHEDULING OF LOANS
Borrowers perception about the lender’s capacity of rescheduling indicate in Table
4.21 that rescheduling capacity of informal agencies is higher as compared to SHGs
and commercial bank operating in both the villages. During collection of secondary
data it was observed that higher rescheduling capacity results into higher default rate.
As discussed earlier in chapter IInd repayment of loan has shown decreasing trend

85
among private agencies. This may be due to higher rescheduling capacity in these
agencies. On the other hand it may be seen from the table that landless and marginal
farmers are satisfied with the response of rescheduling capacity of lenders in their
favour but small and medium households have shown their perception that
rescheduling capacity in commercial banks is in low order when compared to SHGs
and informal institutions.
TABLE 4.21: 5D.1 (TABLE 5D.1 OF THE OUTPUT) BORROWER’S PERCEPTION ABOUT THE LENDER’S CAPACITY OF RESCHEDULING LOANS UNDER CONTINGENT SITUATIONS ACROSS VILLAGE TYPE & BORROWER’S LANDHOLDING STATUS. Source of loan Village type
Village w/o micro-finance
Village with micro-finance
1. Commercial banks & RRBs [banker]
3.96 0.00
2.Coops (PACS & LDBs) [cooper] 0.00 0.00 3. Informal lenders [inforre] 0.96 0.00 4.SHG [shgre] 0.00 3.00 5.NBFCs [nbfcre] 0.00 0.00
6.Chit fund [chitre] 0.00 0.00 7.Total formal [forre] 3.96 3.00 8.Total informal [nforre] 0.96 0.00
Source of loan Borrower’s landholding status
Landless Marginal Small Medium & large
1. Commercial banks & RRBs [banker]
0.00 1.35 3.86 3.30
2.Coops (PACS & LDBs) [cooper]
0.00 0.00 0.00 0.00
3. Informal lenders [inforre]
0.00 0.78 0.43 0.30
4.SHG [shgre] 1.50 1.70 0.86 1.50 5.NBFCs [nbfcre] 0.00 0.00 0.00 0.00
6.Chit fund [chitre] 0.00 0.00 0.00 0.00 7.Total formal [forre] 1.50 3.05 4.72 4.80 8.Total informal [nforre] 0.00 0.78 0.86 1.50
EXPLICIT ANNUAL INTEREST RATE
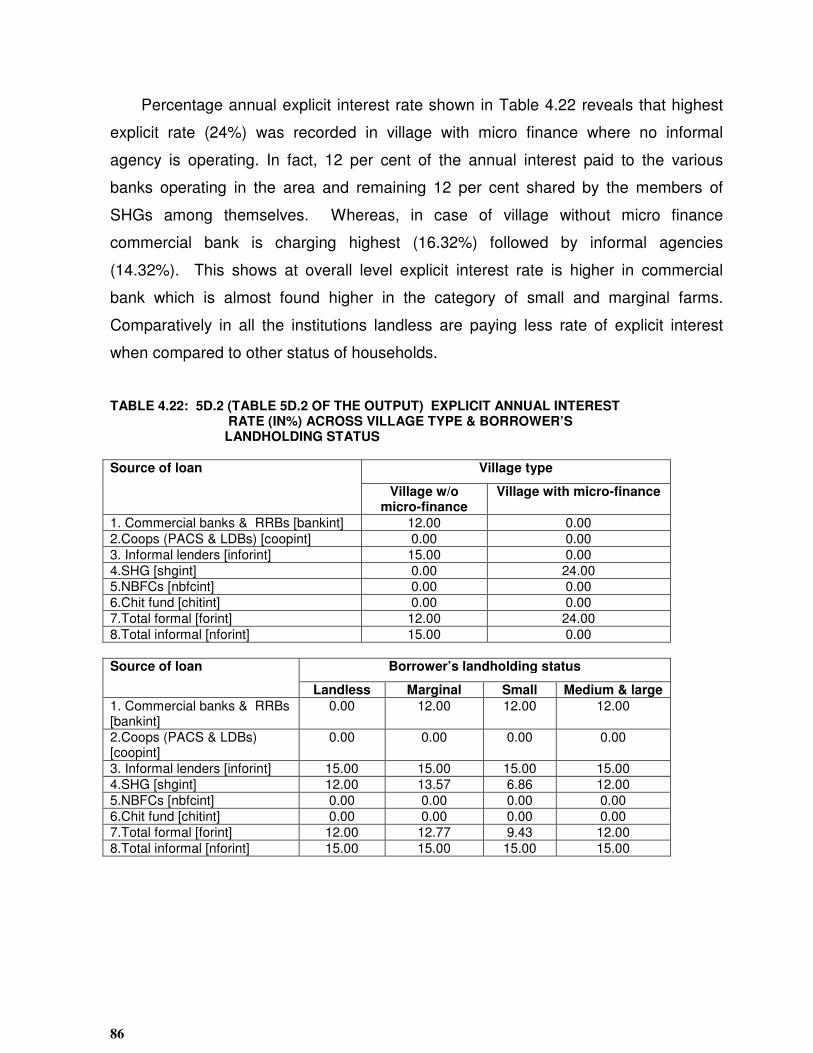
86
Percentage annual explicit interest rate shown in Table 4.22 reveals that highest
explicit rate (24%) was recorded in village with micro finance where no informal
agency is operating. In fact, 12 per cent of the annual interest paid to the various
banks operating in the area and remaining 12 per cent shared by the members of
SHGs among themselves. Whereas, in case of village without micro finance
commercial bank is charging highest (16.32%) followed by informal agencies
(14.32%). This shows at overall level explicit interest rate is higher in commercial
bank which is almost found higher in the category of small and marginal farms.
Comparatively in all the institutions landless are paying less rate of explicit interest
when compared to other status of households.
TABLE 4.22: 5D.2 (TABLE 5D.2 OF THE OUTPUT) EXPLICIT ANNUAL INTEREST RATE (IN%) ACROSS VILLAGE TYPE & BORROWER’S LANDHOLDING STATUS
Source of loan Village type
Village w/o micro-finance
Village with micro-finance
1. Commercial banks & RRBs [bankint] 12.00 0.00
2.Coops (PACS & LDBs) [coopint] 0.00 0.00
3. Informal lenders [inforint] 15.00 0.00
4.SHG [shgint] 0.00 24.00 5.NBFCs [nbfcint] 0.00 0.00
6.Chit fund [chitint] 0.00 0.00
7.Total formal [forint] 12.00 24.00
8.Total informal [nforint] 15.00 0.00
Source of loan Borrower’s landholding status
Landless Marginal Small Medium & large
1. Commercial banks & RRBs [bankint]
0.00 12.00 12.00 12.00
2.Coops (PACS & LDBs) [coopint]
0.00 0.00 0.00 0.00
3. Informal lenders [inforint] 15.00 15.00 15.00 15.00
4.SHG [shgint] 12.00 13.57 6.86 12.00
5.NBFCs [nbfcint] 0.00 0.00 0.00 0.00
6.Chit fund [chitint] 0.00 0.00 0.00 0.00
7.Total formal [forint] 12.00 12.77 9.43 12.00
8.Total informal [nforint] 15.00 15.00 15.00 15.00
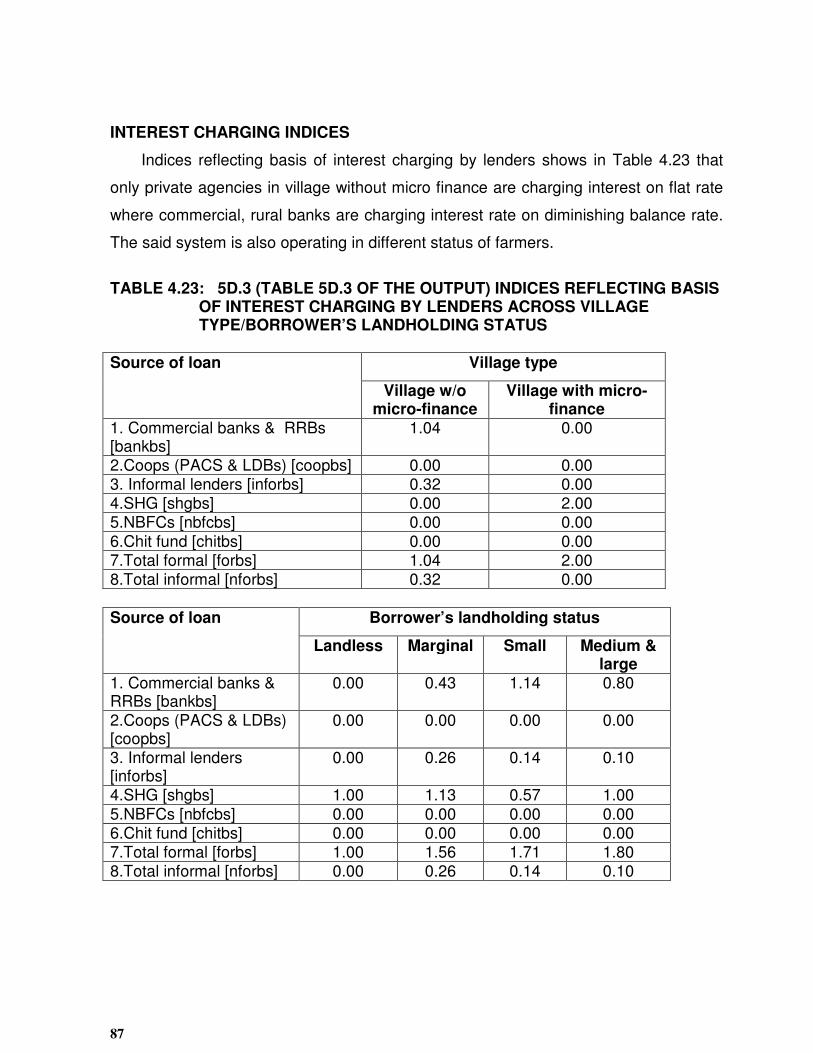
87
INTEREST CHARGING INDICES
Indices reflecting basis of interest charging by lenders shows in Table 4.23 that
only private agencies in village without micro finance are charging interest on flat rate
where commercial, rural banks are charging interest rate on diminishing balance rate.
The said system is also operating in different status of farmers.
TABLE 4.23: 5D.3 (TABLE 5D.3 OF THE OUTPUT) INDICES REFLECTING BASIS OF INTEREST CHARGING BY LENDERS ACROSS VILLAGE TYPE/BORROWER’S LANDHOLDING STATUS
Source of loan Village type
Village w/o micro-finance
Village with micro-finance
1. Commercial banks & RRBs [bankbs]
1.04 0.00
2.Coops (PACS & LDBs) [coopbs] 0.00 0.00 3. Informal lenders [inforbs] 0.32 0.00 4.SHG [shgbs] 0.00 2.00 5.NBFCs [nbfcbs] 0.00 0.00
6.Chit fund [chitbs] 0.00 0.00 7.Total formal [forbs] 1.04 2.00 8.Total informal [nforbs] 0.32 0.00
Source of loan Borrower’s landholding status
Landless Marginal Small Medium & large
1. Commercial banks & RRBs [bankbs]
0.00 0.43 1.14 0.80
2.Coops (PACS & LDBs) [coopbs]
0.00 0.00 0.00 0.00
3. Informal lenders [inforbs]
0.00 0.26 0.14 0.10
4.SHG [shgbs] 1.00 1.13 0.57 1.00
5.NBFCs [nbfcbs] 0.00 0.00 0.00 0.00 6.Chit fund [chitbs] 0.00 0.00 0.00 0.00 7.Total formal [forbs] 1.00 1.56 1.71 1.80 8.Total informal [nforbs] 0.00 0.26 0.14 0.10

88
INDICES OF MONITORING AND EXTENSION SERVICES
Indices of monitoring and extension services indicates in Table 4.24 that NGOs in
village with micro finance and field staff of banks are regularly in touch with borrowers
and showing interest for extensions but still farmers are neither increasing their limits
of loan with lenders in village without micro finance because of speculation in
production as well as marketing of their produce. Whereas, in village with micro
finance surplus labour is not sure for getting employment regularly. Similar status may
be observed in differed categories.
TABLE 4.24: 5D.4 (TABLE 5D.4 OF THE OUTPUT) INDICES OF MONITORING & EXTENSION SERVICES OF LOANS AS PERCEIVED BY BORROWERS ACROSS VILLAGE TYPE/BORROWER’S LAND HOLDING STATUS Source of loan Village type
Village w/o micro-finance
Village with micro-finance
1. Commercial banks & RRBs [bankex]
0.44 0.00
2.Coops (PACS & LDBs) [coopbs] 0.00 0.00
3. Informal lenders [inforex] 0.00 0.00 4.SHG [shgex] 0.00 0.00 5.NBFCs [nbfcex] 0.00 0.00 6.Chit fund [chitex] 0.00 0.00 7.Total formal [forex] 0.44 0.00 8.Total informal [nforex] 0.00 0.00
Source of loan Borrower’s landholding status
Landless Marginal Small Medium & large
1. Commercial banks & RRBs [bankex]
0.00 0.22 0.57 0.20
2.Coops (PACS & LDBs) [coopbs]
0.00 0.00 0.00 0.00
3. Informal lenders [inforex]
0.00 0.00 0.00 0.00
4.SHG [shgex] 0.00 0.00 0.00 0.00 5.NBFCs [nbfcex] 0.00 0.00 0.00 0.00 6.Chit fund [chitex] 0.00 0.00 0.00 0.00 7.Total formal [forex] 0.00 0.22 0.57 0.20 8.Total informal [nforex] 0.00 0.00 0.00 0.00
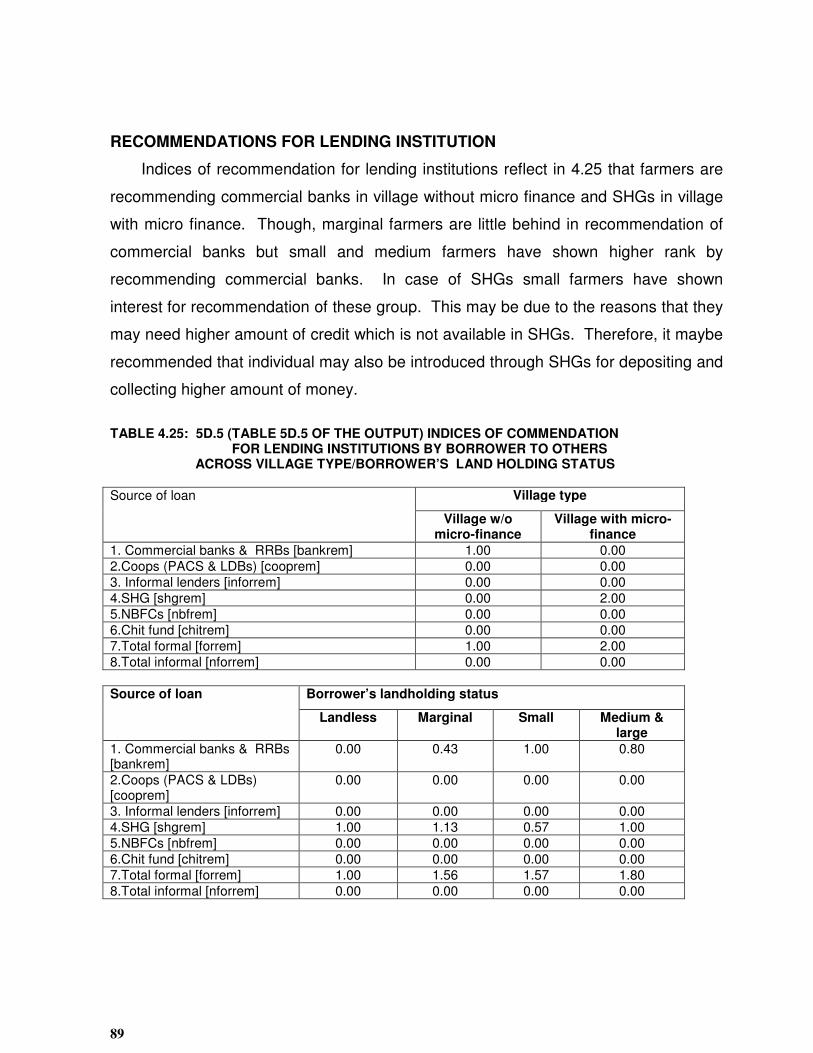
89
RECOMMENDATIONS FOR LENDING INSTITUTION
Indices of recommendation for lending institutions reflect in 4.25 that farmers are
recommending commercial banks in village without micro finance and SHGs in village
with micro finance. Though, marginal farmers are little behind in recommendation of
commercial banks but small and medium farmers have shown higher rank by
recommending commercial banks. In case of SHGs small farmers have shown
interest for recommendation of these group. This may be due to the reasons that they
may need higher amount of credit which is not available in SHGs. Therefore, it maybe
recommended that individual may also be introduced through SHGs for depositing and
collecting higher amount of money.
TABLE 4.25: 5D.5 (TABLE 5D.5 OF THE OUTPUT) INDICES OF COMMENDATION FOR LENDING INSTITUTIONS BY BORROWER TO OTHERS ACROSS VILLAGE TYPE/BORROWER’S LAND HOLDING STATUS
Source of loan Village type
Village w/o micro-finance
Village with micro-finance
1. Commercial banks & RRBs [bankrem] 1.00 0.00
2.Coops (PACS & LDBs) [cooprem] 0.00 0.00
3. Informal lenders [inforrem] 0.00 0.00
4.SHG [shgrem] 0.00 2.00
5.NBFCs [nbfrem] 0.00 0.00
6.Chit fund [chitrem] 0.00 0.00
7.Total formal [forrem] 1.00 2.00
8.Total informal [nforrem] 0.00 0.00
Source of loan Borrower’s landholding status
Landless Marginal Small Medium & large
1. Commercial banks & RRBs [bankrem]
0.00 0.43 1.00 0.80
2.Coops (PACS & LDBs) [cooprem]
0.00 0.00 0.00 0.00
3. Informal lenders [inforrem] 0.00 0.00 0.00 0.00
4.SHG [shgrem] 1.00 1.13 0.57 1.00
5.NBFCs [nbfrem] 0.00 0.00 0.00 0.00
6.Chit fund [chitrem] 0.00 0.00 0.00 0.00
7.Total formal [forrem] 1.00 1.56 1.57 1.80
8.Total informal [nforrem] 0.00 0.00 0.00 0.00

90
FREQUENCY DISTRIBUTION OF BORROWER HOUSEHOLDS WANTS TO LEAVE
LENDING INSTITUTION
Frequency distribution of borrowers households which want to leave/shift/recommend
specific lending institutions a source of credit, classified by village type and borrowers
land holding presented in tables 4.26 to 4.28. In these table response of the farmers
have shown no comment on leaving/shifting or recommending any lending institution.
This may be due to the reasons that in village without micro financing only a single
branch of State Bank of India have its jurisdiction in the village. Therefore, there is no
question of leaving or shifting lending institution. On the other side in village with
micro-finance. SHGs are newly introduced and farmers have switch over towards this
kind of credit. Prior to introduction on SHGs there was no such practice of collecting
loan from bank other than subsidy oriented schemes. In this village co-operative
society is operating since last 20 years but in the village of about 300 household co-
operative society could be able to register only 3-8 members since last five years. At
the same time farmers have not permanent source of income except their surplus
labour hence, loaning from bank is not possible. Therefore, there is no scope for
leaving or shifting financial situation and farmers are satisfied with fulfillment of their
mini financial demands through SHGs.
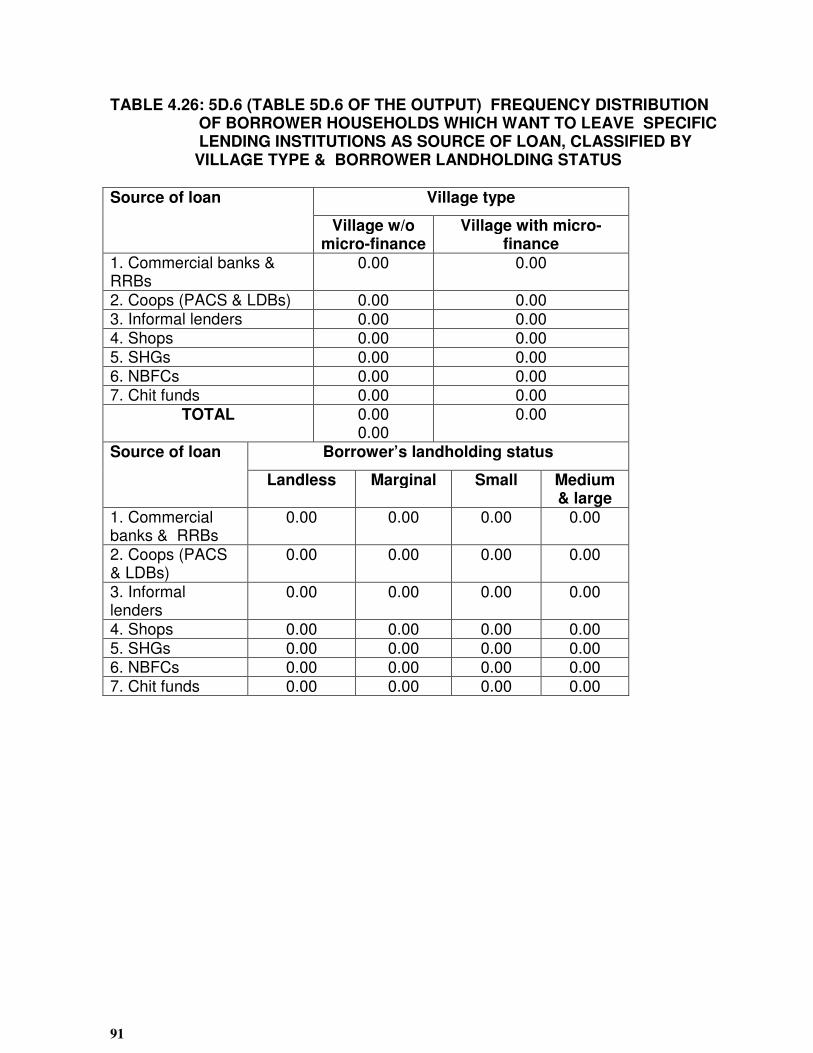
91
TABLE 4.26: 5D.6 (TABLE 5D.6 OF THE OUTPUT) FREQUENCY DISTRIBUTION OF BORROWER HOUSEHOLDS WHICH WANT TO LEAVE SPECIFIC LENDING INSTITUTIONS AS SOURCE OF LOAN, CLASSIFIED BY VILLAGE TYPE & BORROWER LANDHOLDING STATUS
Source of loan Village type
Village w/o micro-finance
Village with micro-finance
1. Commercial banks & RRBs
0.00 0.00
2. Coops (PACS & LDBs) 0.00 0.00 3. Informal lenders 0.00 0.00 4. Shops 0.00 0.00
5. SHGs 0.00 0.00 6. NBFCs 0.00 0.00 7. Chit funds 0.00 0.00
TOTAL 0.00 0.00
0.00
Source of loan Borrower’s landholding status
Landless Marginal Small Medium & large
1. Commercial banks & RRBs
0.00 0.00 0.00 0.00
2. Coops (PACS & LDBs)
0.00 0.00 0.00 0.00
3. Informal lenders
0.00 0.00 0.00 0.00
4. Shops 0.00 0.00 0.00 0.00
5. SHGs 0.00 0.00 0.00 0.00 6. NBFCs 0.00 0.00 0.00 0.00 7. Chit funds 0.00 0.00 0.00 0.00

92
TABLE 4.27: 5D.7 (TABLE 5D.7 OF THE OUTPUT) FREQUENCY DISTRIBUTION OF BORROWER HOUSEHOLDS WHICH WANT TO SHIFT LENDING INSTITUTIONS AS SOURCE OF LOAN, CLASSIFIED BY VILLAGE TYPE & BORROWER LANDHOLDING STATUS. Source of loan Village type
Village w/o micro-finance
Village with micro-finance
1. Commercial banks & RRBs
0.00 0.00
2. Coops (PACS & LDBs) 0.00 0.00 3. Informal lenders 0.00 0.00 4. Shops 0.00 0.00 5. SHGs 0.00 0.00 6. NBFCs 0.00 0.00 7. Chit funds 0.00 0.00
Source of loan Borrower’s landholding status
Landless Marginal Small Medium & large
1. Commercial banks & RRBs
0.00 0.00 0.00 0.00
2. Coops (PACS & LDBs)
0.00 0.00 0.00 0.00
3. Informal lenders
0.00 0.00 0.00 0.00
4. Shops 0.00 0.00 0.00 0.00
5. SHGs 0.00 0.00 0.00 0.00 6. NBFCs 0.00 0.00 0.00 0.00 7. Chit funds 0.00 0.00 0.00 0.00

93
TABLE 4.28: 5D.8 (TABLE 5D.8 OF THE OUTPUT) INDEX OF AVERAGE IMPORTANCE OF VARIOUS REASONS BEHIND SHIFTING PREFERENCE OF BORROWERS FROM THEIR CURRENT LENDING INSTITUTIONS BY VILLAGE TYPE AND BORROWER’S LAND HOLDING STATUS Variables Village type
Village w/o micro-finance
Village with micro-finance
INTER 0.00 0.00
COMPLI 0.00 0.00 PURP 0.00 0.00 INSUF 0.00 0.00 TERMS 0.00 0.00 OTHERS 0.00 0.00
Variables Borrower’s landholding status Landless Marginal Small Medium &
large INTER 0.00 0.00 0.00 0.00 COMPLI 0.00 0.00 0.00 0.00 PURP 0.00 0.00 0.00 0.00 INSUF 0.00 0.00 0.00 0.00 TERMS 0.00 0.00 0.00 0.00
OTHERS 0.00 0.00 0.00 0.00

94
CHAPTER – V
CONCLUSIONS AND SUGESTIONS
Himachal Pradesh, as its name suggests, lies in the heart of Himalaya. Because of
varying climatic conditions flora and fauna the life of people also vary and the
conditions prevailing at one place may be absolutely different from another.
Directorate of Himachal Pradesh divided total geographical area into four agro-climatic
zones on the basis of rainfall climate, temperature, elevation, soil etc. and named as
low, mid and high hill zones ranging between 650 meters (low hill) to 2200 meters
(high hills) above mean sea level. Therefore, strategies required for the flow of credit
definitely be vary in different regions.
Description of study areas reflects that district Kangra (village with micro-finance)
representing foot hills and district Shimla representing high hills and placed under
without micro-finance were selected for the detailed study. In village with micro-
finance cereal crop based farming and in village without micro-finance fruit and
vegetable based farming systems are the main characteristic features of both the
study regions. These characteristics are the determinants of socio-economic structure
of household families in these regions. Regions-wise conclusion are mentioned
below:-
VILLAGE WITH MICRO-FINANCE
Results of the study indicates that in village with micro-finance returns from farm
activities are less as compared to non-farm activities due to poor agriculture base
where maximum holdings are unviable. Whereas, a village without micro-finance has
shown prosperity by cultivating commercial crops and farmers are not putting area
under cereals crops. Per head annual returns from all sources indicate that in village
with micro-finance farmers are generating Rs.11869 in comparison of village without
micro-finance where per head returns are Rs.17890. Activity wise results indicate
that the income from farm business is 75 per cent in village without micro-finance
whereas said income is 27 per cent in village with micro-finance.

95
During the course of study it was observed that financial institutions operating in
the regions have sufficient amount for credit with them. But, the problem is how to
make sure about the deposits of the rural people because of their poor saving
capacity. During discussions with farmers it was observed that farmers of this district
are consuming even their retained seed specially in July-August when there is scarcity
of food-grains at household levels. At the same time it has became a tendency that
majority of the farmers of this region never interested to indulge in process of loans
from banks except subsidy oriented programmes. In such a scenario role of non-
government organization has proved very suitable in micro financing to SHGs. NGO
working in the district have shown its excellency in formation and linkage of self help
groups in the State and has been declared a mother NGO by NABARD operating in
Himachal Pradesh.
Determine factors for success of NGO operating in this region and having
jurisdiction in the study area are nothing but the style of working and implementation of
the programme among rural poors. The mother NGO of Himachal Pradesh named
“Chinmaya Rural Primary Health Care and Training Centre Sidhbari” (CRPHCTCS)
working under the guidelines of Chinmaya Tapoban Trust Sidhbari at Dharamsala in
district Kangra. Explanation about ideology, programme implementation and coverage
of said NGO will definitely be prove helpful for national strategies. Determining
success of mother NGO of Himachal Pradesh is given below:
Ideology and Programme Implementation of the NGO
This NGO is working under the motto “if you give a poor hungry man a fish to eat,
you have helped him for a day. If you teach him how to fish, you have helped him for
a life time”, this way of helping people describes the steps from welfare to
development. The difference between welfare and development has shown in self-
explanatory Table 5.1. Reflection of the table indicates that development aims at
building up the capacity and potential of the people concern. This involves
participatory ways based on realities, resources, local needs, culture, inherent skills
and looks at long term effects of its intervention.

96
Table: 5.1 Difference Between Welfare and Development
Factors/issues Welfare Development General Effect More obvious, hence
better known and understood
Subtle & hence less known & understood
Beneficiaries • Passive receivers
• Remain dependent
• Do not influence programme decision and design
• Do not own the programmes
Active participants Grow to be independent & self-reliant Continuously influence programme decision & design with interaction and feed back Develop sense of ownership over a period
Activity with beneficiary
Often onetime Persistent and continuous
Nature Static Rigid Isolated programme
Dynamic & Vibrant Flexible Usually integrated & holistic programme
Initially Easy Difficult Later Remains one sided Becomes easier with people’s
involvement Orientation Result orientated Process oriented Involvement of beneficiaries in the process of activity
Nil Each step with beneficiaries is important Result is in the serial growth of process
Capacity building Nil As per need & potential of beneficiaries
Time - Short term objectives
- Usually only immediate help is provided
Long term goals & impact Slow & steady facilitation provided at the pace of beneficiary
Influence and spread by beneficiaries
None Beneficiaries as they change became partners in development and often change agents.
Sustainability Remains dependent Sustainable as people grow & develop their capacity & unfold potential
Source: NGO’s Head Office Sidhbari, Dharmasala, Kangra, H.P.

97
FOCUS ON WOMEN PARTICIPATION
Above-mentioned ideology further was implemented through women participation
in the villages of study district. In fact the status of women in the district is confined
only up to household work or crop cultivation at their tiny and unviable land holdings.
Whereas, women have to face maximum liabilities of household and due to lack of
minimum required income this section of the society remained isolated from the
household development. It is in this context the Director of the NGO (Dr. Kashma
Matre) who is female encouraged the formation of Mahila Mandals which later
culminated into self-help groups. The meeting of Mahila Mandals were utilized as the
plateform for explaining the concept of SHGs. The implementation technique of the
programme is presented in Table 5.2.
The first group that was formed in district, has its genesis at the office of the NGO
where fortnightly meetings of the Mahila Mandal were held. In such meetings the
participating members were made aware about the group’s concepts, as well as the
advantages occurring from them. The NGO sends its nominees to all the groups
meetings who record observation about the proceedings of the meetings. The
structure for implementation of the programme is shown in Table 5.2 where in it can be
observed that how invisible problems can be made visible and in what manner the
services will be provided to the rural community. The said implementation design in
the table proved very successful for formation and linkages of SHGs in the study
region.
SPATIAL COVERAGE CONCENTRATION OF SHGs
Kangra valley situated in low hill zone and offers a great potentials for the
production of cereal crops especially wheat, paddy and maize. But due to
marginalization of farms, higher pressure of population as compared to other districts
of the state and low level of diversification towards cash crops, the valley of low hill
zone remained unviable as compared to mid and high hill zone of the state (Sharma
1998, Vaidya 1991). At the same time the valley is drawing higher non-farm income

98
when compared to other zones. In such a scenario the demand for emergency credit
is regularly increasing. Perhaps, entrance of NGO in the field of welfare and
development of rural poors has shown a change from traditional financing system to
new generation financial institution system through micro financing to SHGs. The
process of formation of these groups further linked with formal institutions like banks
for drawing credit to SHGs in all over the district. Initially very few families could be
organized to save and collect credit from various financial institutions. The
membership of groups increased impressively as there were only 4 SHGs in 1995-96
which jumped to 792 in Feb. 2001. The process of linkages took movement after
1997-98 when there were only about 100 SHGs. Perhaps, participation of women in
SHGs can make new generation institutions more successful in India. Banks have
already stated that due to 100 per cent recovery of credit from SHGs is the better sign
to control default rate and develop the concept of micro-finance.
The system for formation of SHGs is very simple because of the reason that
women members of Mahila Mandal in their meeting use to nominate president and
secretary among 20 members of the group. They used to collect 20 rupees per month
from a members and after regular collection for six month the group is to be linked with
regional or commercial bank. The bank has already made a limit to provide 4 times
credit against their deposits at the rate of 12 per cent per annum. Whereas, group
contribute 24 per cent of the interest from members from which 12 per cent shared by
all the members. The adoption of this credit system proved very helpful when
compared to the credit taken from money lenders.
VILLAGE WITHOUT MICRO-FINANCE
In case of village without micro-finance it was observed that farmers have fixed
their limit of credit against production of their commercial crops showing a sizeable
marketable surplus. Though a commercial bank which have monopoly in the study
village is in favour of increasing the limit of credit of its clients but farmers are facing
marketing as well as disease problems and are regularly depriving from getting
remunerative prices of their produce. The low level of returns and high value of input

99
purchase restricting farmers to extend their credit limit. In this regard about 80 per
cent of the produce of fruit and vegetable is received in Delhi market and most of it
further distributed to other markets of the country. In this way, Delhi market is the
main collection centre for H.P. The producers share in consumer’s rupee was 42.28
per cent (Saraswat and Vaidya, 1995). Therefore, it is to be suggested that fruit and
vegetable industry is presently not geared for systematic marketing to the advantage
of producer and consumer. Middlemen dominate the trade and cutting away a
sustained part of the producer’s share. This is amply evidenced that farmer’s share in
consumer’s rupee is significantly low and there have been continued malpractices in
the marketing system on a wide scale. At the same time problems related with
infrastructure like construction of road, provision of irrigation and supply of quality
oriented seeds as well as insecticides and pesticides should be encouraged through
financial institutions operating in the state.
The future strategies for fruit and vegetable development in general and apple in
particular should encompass (i) research endeavourer to resolve emerging diseases
and problems of the growers (ii) effective horticultural extension service in the state (iii)
providing more teeth to market regulation and cubing malpractices, (iv) ensuring
regulated supply of fruit and vegetables to major terminal markets; (v) sacking
avenues for export of fresh fruits and vegetables and processed apple products to
potential markets. With these measures flow of credit can be enlarged to the farmers
who are still bond at their minimum credit limit due to low rate of producer’s margin.
The financial institutions operating in both the study regions have shown their
response in below mentioned order.
CO-OPERATIVES
Study concludes that all the co-operative banks i.e. state co-operative and central
co-operative banks have not complied with the minimum involvement conditions as
fixed by NABARD. This is due to their surplus resource position viz-a-viz low level of
agriculture lending, the co-operative banks have not been able to achieve minimum
involvement level stipulated by NABARD and as such they have not been able to seek
100
short term credit limits from NABARD. At the same time it was observed that at study
area level the co-operative could be able to supply loan only for 7 families which is the
highest number of finance during 1995-96 to 1999-2000 in village with micro-finance
where more than two hundred families belongs to small and marginal farms in the
cluster of 4 villages. This shows, co-operative is moving without co-operation among
the borrowers as well as lender. Perhaps, faith among borrowers as well lenders;
capability of leadership in the organization and people participation are the only
determinants to prove successful co-operative system.
COMMERCIAL BANKS
Commercial Banks felt a major jolt when it was declared that credit drawn before
1992 will be exempted of those clients who have drawn credit up to Rs.2500.
Because of said declaration default rate increased manifold and borrowers who have
drawn loan after exemption with-holed the installments and started expecting
exemption of their loan. Banks are demanding independence from govt. and are in
view that such interventions can destroy the future of formal institutions. It was also
observed that commercial banks have sufficient amount with them to distribute but
limit of credit fixed by banks have started shrinking due to non-availability of
remunerative prices of farmers produce as well as diseases causing huge investment
on various sprays and insecticides/pesticides.
In this regard it is to be suggested that marketing system should be boosted so
that margin of producer in consumer rupees may increase. Traders use to collect their
share both from producer as well as retailer. Retailer further supply fruit and
vegetables on higher margin due to the fear of perishability. because, it takes 2 to 7
days after picking/plucking of produce to reach in the hand of retailers. At the same
time dependency of credit on traders force the spirit of farmers to remain in touch with
traders so that emergency need can be meat out in any time. Therefore, it is to be
suggested that banks should perform capabiling to draw the attention of the producers
towards such credit for which they are dependent on traders.

101
Regarding regional rural banks they have little amount to invest on credit but have
shown better performance specially in coverage of marginal farmers. At the same
time this bank have started creating a confidential environment with clients having low
level of requirements.
POLICY MATRIX IN VILLAGE WITH AND WITHOUT MICRO-FINANCE.
VILLAGE WITH MICRO FINANCE Problems Broad suggestion Action point
together with agencies
recommended for undertaking such
actions 1. Traditional cropping pattern Introduction of cash
(vegetable) crops Agricultural Development office & block office
2. Seasonal unemployment Introduction of cottage industries in the villages assisted through formal institutions
Khadi Udyog and State Wool Federation
3. Less interest of farmers on credit from formal institutions
Awareness through formal agencies
Himachal Gramin Bank (RRB) and Commercial Banks
4. Large number of formalities in Banks
Banks should follow the idea of SHGs for collaterals etc.
Field staff of banks should follow the working of NGOs
5.Financial powers to NGOs For direct linkages NGO should be provided powers for disbursement of loans
NABARD may intervene in the problem
6.Government support for social evils
Participation and demand for particular problems like wine drinking and exploitation of woman government should delt the problem in priorities
Deputy Commissioner should involve for such problems
7. Less devotion of commercial banks for linkages of SHGs
Commercial banks should given targets for micro-finance
NABARD may prove very helpful for involving commercial bank in the process of micro-finance
8. Non-Viable Farms Introduction of Flowericulture/Bee
District flowericulture Federation,

102
Keeping/Dairy development oriented schemes
Directorate of Horticulture and Agriculture
9. Villagers participation Developmental approach through NGOs
Financial powers to NGOs
VILLAGE WITHOUT MICRO-FINANCE
Problems Broad suggestion Action point together with
agencies recommended
for undertaking such actions
1.Supply of quality seed for cash crops
Through co-operative societies, seed federations and popular as well as certified private agencies. So that production as well limit of credit may be increased
Directorate of Agriculture and Private Agencies supplying certified seeds
2.Modern implements for fruit and vegetable cultivation
As per suitability of hilly topography like mini tractors, spray pumps etc. should be financed through formal agencies.
Directorates of Horticulture and Agriculture of the State along with commercial banks operating in the regions.
3. Infrastructure facilities like picking/plucking/packing/grading/transportation from field to road head and refrigeration of produce
Government should come forward for providing infrastructure facilities so that community can face competition arises due to WTO
World Bank and other international agencies like USAID
4. Low rate of producers share in marketing of fruit and vegetables
Regulated system of markets required lot of intervention for maintaining margins in equal share. Traders of terminal markets are the main hindrance for proper distribution of margins among various functionaries operating in marketing process
Government intervention for proper distribution of margins among producer, traders and retailers
5. Irrigation facilities In hilly topography there are number of resources of water but
Irrigation and public health

103
it require an implementation of lift irrigation system in large scale so that limit from banks can be enhanced with increase in production
Ministry, NABARD and World Bank
6. Extra facilities of credit far marketing of produce
Keeping in view the perishability of crops farmers should be provided with credit in advance for marketing through formal institutions so that produce can be supplied up to market in proper time
Commercial Banks as well as State marketing corporations
7. Cold storage facilities Formal and informal institutions may finance for cold stores on the demand of group of farmers. So that perish ability may be protected
World Bank NABARD and Commercial Banks
8. Processed product of fruits Juice and wine factories should be financed in the region
Private agencies

104
BIBLIOGRAPHY
1. Bhati J.P., et. al., “Diversity of Mountain Forming System in H.P.”, Farmers Strategies for Natural Resource Use: Chapter in “Sustainable Mountain Agriculture”, pp. 497-515, Oxford and IPH, Pub. Co., New Delhi, 1992.
2. Chand, K.P. and Swarup, R., Appraisal of Successful Marketing Co-
operative Society in H.P., Agro-Economic Research Centre, Shimla, 1983.
3. Datta, S.K.and Sriram, M.S., “Flow of Credit to Small and Marginal Farmers in India” Proposal for the Ministry of Agriculture, G.O.I., Indian Institute of Management Ahmedabad, 2000
4. Dorna, P(Ed.), “Cooperative and Commune, Group Farming in Economic
Development of Agriculture”, The University of Wisconsin Press, England, 1977.
5. Desai B.M. & Namboodiri, N., “SHGs as a Strategy or Mode for Reaching the
Unreached for Rural Credit”, Part B in a book, Organization and Management of Rural Financial Sector Text, Cases and Exercises, IIM Ahmedabad, Oxford & IBH.Pub.Co., New Delhi, 2000.
6. Goel, B.B., “Cooperative Management and Administration”, Deep and Deep
Publications, New Delhi, 1984. 7. Gupta, A. et.al., “Rural Banking Learning to Unlearn, An Action Research
Enquiry”, Institute of Ahmedabad, Oxford & IPH Publishing Co., New Delhi , 1990.
8. Jain, A, “Caught in Coop”, The Economic Times, November 23, 1998.
9. H.P. Govt., “Annual Administration Report, 1996-97”, Govt. of Himachal
Pradesh, Department of Co-operation Shimla, 1997.
10. H.P. Govt., “Twelveth Annual Report, 1996-97”, The H.P. State Co-operative Milk Producers Federation Ltd., Shimla, 1996-97.
11. H.P. Govt., “Statistical Outline”, Directorate of Economics Statistics, Himachal
Pradesh, 1997.
12. H.P. Lead Bank, “State Credit Plan”, UCO Bank Shimla, H.P. 1999-2000.

105
13. NABARD, “State Credit Plan”, Presented in State Credit Seminar held at Shimla, H.P. (2000-2001)
14. District Lead Bank, “District Credit Plan”, Lead Bank Dharamsala, Kangra,
H.P., 1999-2000.
15. Sharma M.L., “Economic Viability of Farms in Different Agricultural Systems and Zones of H.P.: A Comparative Study”, (Ph.D.Thesis) Department of Economics H.P. University, Shimla, 1998.
16. Singh, Gurdev and Asoken, S.R., “Institutional Finance in Rural India
Efficiency and Efficacy”, Indian Institute of Management, Ahmedabad, 1988.
17. Singh Gopal, “Rural Credit Planning”, RBSA Publishers SMS Jaipur India, 2000.
18. Vaidya, C.S. & Sikka, B.K., “Small and Marginal Farms in Himachal
Pradesh: Economic Viability and Potentialities for Increasing Income and Employment”, AER Centre, HPU, Shimla (Memio) 1993.
19. Vaidya C.S., Sharma M.L. and Sharma N.K., “Economic Reforms and
Dynamics of Cooperative Movement in H.P.” AER Centre, H.P.U. Shimla
(Memio), 1993.

106
ANNEXURE - I Comments on Draft Report by Prof. S.K. Datta (Co-ordinator of the Study)
Indian Institute of Management Ahmedabad
Title of the Study Report: Flow of Credit to Small and Marginal Farmers in Himachal
Pradesh
Authors: M.L. Sharma, N.K. Sharma & K.R. Sharma
Organization: Agro-Economic Research Centre, Himachal Pradesh
University, Shimla
1 Comments on Executive Summary:
It does not include the policy matrix for the village with micro finance, although, it is
included in the summary of the original report. This small lapse is corrected before
submission to the Ministry.
Action Taken:
Lapse of policy matrix for the village with micro finance has been corrected.
Overall View on the Acceptability of the Report:
I have gone through it with interest and approve of its acceptance by the Ministry.
It is well done and I congratulate for preparing a very good report.