Embed Size (px)
Citation preview

European Scientific Journal October 2014 edition vol.10, No.28 ISSN: 1857 – 7881 (Print) e - ISSN 1857- 7431
457
FLOW OF FISCAL RESPONSIBILITY AMONG LAYERS OF GOVERNMENT: A CASE OF
NIGERIA
Ogunlana, Olarewaju Fatai Lawal, Arogundade Samod
Bello, Al-Hassan Taiwo Kolawole, Bashir Olayinka
Department of Economics, Lagos State University, Ojo
Abstract The issue of fiscal federalism has for quite some time engaged the attention of scholars and policy makers in contemporary Nigeria. Several arguments have been put forward on the economic and political desirability for the practice of fiscal federalism in a country. While the political arguments are largely based on the heterogeneous characteristics of the different regions making up the country, the economic justification is usually based on the need to promote efficiency in the use of national resources. This paper examines the effect of fiscal decentralization on macroeconomic performance in Nigeria. The study employs three measures of fiscal decentralization namely revenue measure, expenditure measure and simultaneity measure to determine the extent, and the impact of fiscal decentralization on macroeconomic performance over the period 1980 to 2010. The overall objective of this study is to analyze the empirical effects of fiscal decentralization on some selected indicators of macroeconomic performance in Nigeria. The indicators include: economic growth, inflation rate, interest rate, and exchange in Nigeria. The Vector Autoregressive (VAR) estimator with lagged decentralization variables was employed using the E-views, version 7.0 to provide analytical support. The empirical findings are quite informative and offer evidence that the central objective of this study has been empirically investigated. There is, indeed, a connection between fiscal federalism and macroeconomic performance in Nigeria over the study period. The study suggests that faster economic growth may constitute additional benefit of fiscal decentralization beyond those already well recognized. This finding conforms to a strand of the literature that establishes links between fiscal decentralization, public sector efficiency and macroeconomic stability.
European Scientific Journal October 2014 edition vol.10, No.28 ISSN: 1857 – 7881 (Print) e - ISSN 1857- 7431
458
Keywords: Fiscal Federalism, Fiscal decentralization, Macroeconomic Performance and Vector Autoregressive Estimator 1.0 Introduction Fiscal decentralization constitutes an important topical issue in many developed and less developed countries. Many countries across the globe have devoluted fiscal powers from the central down to lower level governments practically to improve resource allocation and spending among the tiers of government (Oates,1972; Tanzi,1995). Fiscal decentralization is an integral component of federal system of government63. In the process of decentralizing fiscal responsibilities among the layers of government, there is need to understand the menu of the functions and instruments to be centralized and the one to be placed under the spheres of decentralized levels of government. As a subject which falls under public finance, fiscal federalism addresses the executive arm of the public sector. It explores, both in normative and positive terms, the roles of the different levels of government and the ways in which they relate to one another through such instruments as intergovernmental grants. Federalism is essentially about multilevel government structure, rather than within a level structure of government. Each level of government can be viewed as an institution with definite functions to perform (Rivlin, 1991). The conventional wisdom in economics is that all functions allocated to government should be those that the market is not able to perform in the efficient allocation of resources, equitable distribution of income, and economic stability and growth (Varian, 1990; Layard and Walters, 1978). There are different forms of federalism. The prominent ones are fiscal, political and administrative. Decentralized systems of government give rise to a set of fiscal exigencies as enshrined in fiscal federalism. Since 1990s there has been a resurgence of interest in the macroeconomic performance of developing countries. A prominent element in the policy advice given to developing countries to enhance growth and development potentials is the need to restructure the public sector to make it more responsive to efficient and equitable provision of public services to ensure stable macroeconomic performance(Aigbokhan,1999)64. Recent
63 In a federal structure, governmental functions and powers were exercised in consonance with the dictates of the constitution. Federal structure comprises of three tiers of government namely, central, state and local. Each of these governments have their respective constitutional limitations. 64 A trend that has emerged from this public sector restructuring is the devolution of spending and revenue-raising responsibilities to lower levels of government not only in federal systems, but also in many unitary countries. This trend is a reflection of the

European Scientific Journal October 2014 edition vol.10, No.28 ISSN: 1857 – 7881 (Print) e - ISSN 1857- 7431
459
interest in fiscal decentralization fuelled the debate about public sector reforms in general, and the role of sub-national governments in macroeconomic policy-making process. In all countries, power is necessarily divided to some extent between the central and other levels of government. The extent of division of power has important implications for the functioning of the public sector and efficient provision of services. Division of policy-making powers influences not only delivery of services but also their financing that in turn determines macroeconomic performance of countries. Fiscal decentralization requires that sub-central units of the government must make decisions about provision of public services at the lower level (Yilmaz, 1999). The important question that remains to be answered is whether lower-level governments’ spending increases and imposes constraints on macroeconomic stability. In general, macroeconomic variables such as prices, money supply, interest rate, unemployment, foreign exchange rate may be subjected to violent fluctuations which may compromise the growth of the national economy and promote an unstable macroeconomic environment. This is of particular importance in the performance of the stabilization function, usually assigned to the central government. It can be seen that issues of fiscal federalism affect national development and macroeconomic stability. Nigeria's experience with fiscal federalism started in 1954. Despite over fifty years of experience with fiscal federalism, the country is faced with many challenges on macroeconomic management, poor output growth rate, high inflation rate, and weak balance of payment position. The absence of good macroeconomic governance has also raised the problematic issue of credibility in public policy. Relevant questions central to this study is could fiscal federalism challenges be responsible for poor macroeconomic performance in Nigeria? What are the hindrances promoting the principles and practice of fiscal federalism in Nigeria? From independence in 1960 till date, Nigeria’s fiscal management system has neither been efficient nor equitable. Indeed it manifested a wide spectrum of vulnerability, ethnicity, language, region and religion interactively forming Nigeria’s matrix of cultural pluralism65. The problems of fiscal decentralization and intergovernmental fiscal relations are of wide-spread concern in developing countries. Much of the
movement towards participatory democracy and the need to provide public goods and services that meet the preferences of people in each locality. 65The Federal Government has, for more than four decades assumed certain responsibilities which rightly belonged to the lower tiers of government and, in the process, had compromised efficiency in public expenditure management, resulting in high levels of unsustainable overall deficits, high inflation, slow economic growth and poor external sector balance (Ike,1981; Anyanwu, 1995; Aigbokhan 1999; Chete, 1998).
European Scientific Journal October 2014 edition vol.10, No.28 ISSN: 1857 – 7881 (Print) e - ISSN 1857- 7431
460
established literature of fiscal federalism has been explicitly or implicitly oriented toward the institutions and policy issues that arise within developed countries, particularly Canada and the United States (Wildasin, 1997; Artis, 2006; Austin 2006). There is no consensus in the literature on the effects of fiscal federalism on macroeconomic performance in developed and developing countries. The literature on the potential macroeconomic effects of fiscal federalism is quite vast but mixed. Decentralization may improve allocative efficiency, but it may also make stabilization policies more difficult to carry out (Prud’homme, 1994; Tanzi, 1995). While there are several reasons that fiscal decentralization has been adopted around the world the common motive of many is that fiscal decentralization is considered to have the potential to improve the performance of the public sector. The theory of fiscal federalism holds that for certain public goods, the decision to provide these goods in a decentralized fashion can increase efficiency and accountability in resource allocation (Bird and Vaillancourt, 1998 as cited in Kwom, 2003; Oates, 1993). However recent studies have held that the conventional argument that decentralized provision of public goods will increase efficiency in resource allocation may not be applicable in developing countries (Bahl and Linn, 1994; Prud’homme, 1995). Recent experience with fiscal decentralization in numerous developing and transition economies has led many observers to question whether fiscal decentralization undermines macroeconomic stability. In several countries, central government transfers to lower-level governments have increased fiscal deficits at the central level, creating pressures on central banks to monetize additional debt and thus jeopardizing stability. In other countries, central governments attempting to control their deficits have reduced transfers to lower-level governments, creating fiscal distress at lower levels (Wellisch and Wildasin, 1996). Despite the controversy concerning the effects of fiscal decentralization in developing countries, fiscal decentralization continues to take place in developing countries as well as in developed ones. There has been a growing body of literature that deals with fiscal decentralization in developing and transition economies. The emerging literature clearly departs from the broad principles and practices of fiscal federalism to the quality of macroeconomic governance because it perceives the federal system as possessing high potentials for macroeconomic mismanagement and instability (Prud’homme, 1994). Many of the empirical literature on Nigeria have been concerned with explaining the pattern of intergovernmental relations (Mbanefor, 1993; Sarah et al, 2003) or providing an impressionistic view within the context of political economy of possible consequences of such relationships (Ekpo, 1994). A notable exception is the work of Aigbokhan (1999) and Chete (1998) which investigate the

European Scientific Journal October 2014 edition vol.10, No.28 ISSN: 1857 – 7881 (Print) e - ISSN 1857- 7431
461
relationship between fiscal federalism and economic growth. Missing from the empirical literature on Nigeria is an empirical analysis of the impact of fiscal decentralization on macroeconomic performance. In an attempt to fill this void, this study is therefore an extension of previous studies that are based on one macroeconomic variable. The broad objective of this study is to investigate the relationship between fiscal decentralization federalism and macroeconomic performance in Nigeria. The specific objectives are to identify the underlying factors promoting true practice of fiscal federalism; ascertain the extent of fiscal decentralization; and analyze the empirical effects of fiscal decentralization on some selected indicators of macroeconomic performance in Nigeria. Apart from the introduction, section two contains the review of related literatures. Section three contains the stylized facts explaining Nigeria's fiscal federalism while section four proposes the theoretical framework and methodology for the study. Section five provided the empirical findings and discussion of results. The last section concludes the study. 2.0 A Brief Review of Literature The basic foundations of fiscal federalism were laid by Kenneth Arrow, Richard Musgrave and Paul Samuelson. Samuelson’s two important papers (1954, 1955) on the theory of public goods, Arrows discourse (1970) on the roles of the public and private sectors and Musgrave’s book (1959) on public finance provided the framework for what became accepted as the proper role of the state in the economy. Within this framework, three roles were identified for the government sector namely allocative, stabilization and distributive. By this classification, the central government is saddled with the responsibilities of stabilization and distribution functions while allocation functions are shared among the different levels of government. It has been argued at the theoretical level, that the central government would be in a better position to perform the distribution and stabilization functions as well as provide national public goods (Oates, 1972; Musgrave and Musgrave, 1989; Cremer et al 1995; Taiwo, 1999). All these functions would be inefficiently performed at the local government level due to difficulty in appropriating the full social benefits of the programme undertaken at that level, and the tendency towards the free rider problem. There are two complementary issues in fiscal federalism namely tax assignment and revenue sharing. Tax assignment falls under the three levels of governments. Central collection of taxes is more consistent with the pursuit of distribution and stabilization functions of government, and also the provision of national public goods, all of which are assigned to the central government. This system is expected to generate economies of scale in tax administration and prevent revenue loss due to the mobility of taxpayers

European Scientific Journal October 2014 edition vol.10, No.28 ISSN: 1857 – 7881 (Print) e - ISSN 1857- 7431
462
from one locality to another if such taxes were collected locally. On the other hand, a decentralized system of tax collection would be more likely to make spending decisions at the grass root level more compatible with available resources. It could, therefore, promote accountability and responsibility as well as the efficient provision of local public goods. This system also encourage fiscal autonomy and tax competition among localities. Decentralization of functions should be matched by decentralization of revenue collection66. A number of factors have been cited for the negative impact of decentralization on growth. These include: corruption, limited fiscal arrangements, low quality of bureaucracies and absence of skilled manpower (Prud’homme,1995; Tanzi,1995 and Nelson,2006). The experience of many developing countries suggest that sub national governments are likely to contribute to the aggravation of macroeconomic problems, or make it difficult to correct such problems (Tanzi, 1995). This is particularly so in countries where expenditure assignment is not matched with taxing assignment. In such situations, sub national governments tend to accumulate debt. The argument in favour of decentralization stems from motivation for enhanced efficiency, accountability, and autonomy. According to Stigler (1957), a representative government works best when it is closer to the people. Carrying Stigler’s argument further, Oates (1972) formulates the decentralization theorem as ‘each public service should be provided by the jurisdiction having control over the minimum geographic area that would internalize benefits and costs of such provision. Yilmaz (1999) in a study on fiscal decentralization and macroeconomic performance argues that the correlation coefficient between local governments spending and GDP partly supports decentralization theorem. In the developed countries, where local governments are more responsive to constituents, there is a high positive correlation between GDP per capita and local government spending. On the other hand, in developing countries, the correlation coefficient is very low, even negative. Davoodi and Zou (1998) examine the effects of fiscal decentralization on growth. Fiscal decentralization is measured as spending by sub national governments as a fraction of total government spending. They separated their full sample of 46 countries over the 1970-1989 period
66 Fiscal federalism literature suggests that expenditure assignment should precede tax assignment. This is because tax assignment would generally be guided by expenditure requirement of different levels of government and these cannot be worked out in advance of expenditure responsibilities. Absence of tax assignment would result in dependence on the federal government by lower levels of government. It is recognized, however, that the two assignments need not correspond exactly. Intergovernmental transfers could be used to make up the difference (Aigbokhan, 1999).

European Scientific Journal October 2014 edition vol.10, No.28 ISSN: 1857 – 7881 (Print) e - ISSN 1857- 7431
463
into developing and developed countries and found a negative relationship between fiscal decentralization and economic growth in the world (full sample) and developing country samples while the developed country sample showed a positive, but not significant effect. One of their explanations for the negative effect of fiscal decentralization on growth in developing countries is that “efficiency gains from fiscal decentralization, the strongest argument in its favour, may not materialize for developing countries since revenue collection and expenditure decisions by local governments may still be constrained by the central government. Bruecker (1999) used an overlapping generations (OLG) model to show that, in a dynamic context, fiscal federalism affects the incentive to save. It does so by replacing a common tax burden, associated with uniform national provision of the public good z, with head-tax burdens that differ between young and old consumers, who live in separate jurisdictions where z is provided at different levels in response to age-dependent demands. Fiscal federalism thus alters the time path of after-tax income over the life cycle, thereby affecting the economy’s level of saving. Because Bruecker’s analysis relies on the traditional Diamond (1965) OLG model, this difference in saving alters the economy’s steady-state capital intensity without affecting its growth rate, except in the transition between the “unitary” system (where a common z level is provided nationally) and a federalist system. Evidence from empirical literature show that fiscal structure affects the successful operation of fiscal federalism. Wantchekon and Asadurin (2002) in a study report that in the case of Nigeria, the dependence on transfers is a by product of the dominance of oil in the Nigerian economy beginning in the 1970’s. The states that are the highest recipients of transfers (oil rents) have experienced increased income inequality and display poor economic indicators, which suggest that there is little “meaningful accountability”, while oil-producing states have also displayed poor social and economic indicators due to inadequate transfer system. Surprisingly, states that have benefited the least from oil rents have fared much better. It is also worth noting that despite earning over $300 billion in the last twenty five years from oil windfalls, the per capita income in Nigeria today is around the same level as it was in 1970 due partly to the absence of tight fiscal controls and corruption in both the public and private sector. In line with the argument put forth here, Rodden and Wibbles (2001), attempt to explain the variations in economic performance of countries typically categorized as federal. They hypothesize that federalism effect on economic outcomes are conditioned by the strength of party systems, the degree to which countries are decentralized fiscally and the actual revenue autonomy of sub national units. They find in their sample of fifteen countries (including Nigeria) for the period 1978-1996, that deficit and inflation rates

European Scientific Journal October 2014 edition vol.10, No.28 ISSN: 1857 – 7881 (Print) e - ISSN 1857- 7431
464
were conditioned by the underlying fiscal and party structure. In particular, they find that fiscal decentralization has a negative relationship with inflation and deficits, and this is strengthened when state governments have higher levels of revenue autonomy. When dependent on transfers, deficits and inflation increase and this effect is reinforced the more a country is fiscally decentralized. Theoretical reason why vertical fiscal imbalance (transfer dependence) might distort economic performance is that internal revenue and grants are viewed differently; “intergovernmental grants alter perceptions and beliefs about the levels of local expenditure that can be maintained”. The literature dealing with the effects of fiscal decentralization on fiscal size of government is extensive. Efforts have been concentrated on testing Wagner’s Law which relates to the rising share of the public sector in the economy in the course of economic development. The factors which have been identified as affecting the growth of government expenditure and the fiscal deficit in LDCs include government revenue instability, degree of government’s participation in the economy and growth of government revenue. Morrison (1982), and Peacock and Wiseman (1961) explain the growth of government expenditure in terms of the increase in the activities of the different tiers of government. They argue that centralization of public expenditure is accompanied by rising per capita national income because of the economies of scale in public activities and the broad-based superior taxing powers that result from the centralization of government functions. Similarly, Martin and Lewis (1956) argue that greater centralization of government functions is important in LDCs because of the scarcity of qualified personnel. Wheare (1963) is of the view that for developing countries, a highly decentralized government may be too expensive and a waste of badly needed funds. However, as a country grows in size and income, the centralization of all government activities becomes more and more difficult to execute efficiently. For efficiency reasons, it may be necessary to decentralize fiscal functions. Ubogu (1982), in a study based on cross-sectional data of Nigeria’s former twelve states find that variations in fiscal decentralization among the states are highly influenced by factors such as federal government transfers or allocations, degree of urbanization and share of agriculture in each state’s capital formation. Aigbokhan (1999) using a similar method for Nigeria during the period 1970-1997 find that there is high concentration of fiscal resources in the federal government, while the other tiers of government experienced persistent fiscal deficits. Joulfaian and Marlow (1990) tested the decentralization hypothesis using a cross-sectional methodology, and find evidence in support of the Brennan and Buchanan (1980) “Leviathan”

European Scientific Journal October 2014 edition vol.10, No.28 ISSN: 1857 – 7881 (Print) e - ISSN 1857- 7431
465
hypothesis67 that fiscal decentralization serves as a constraint on the behaviour of the revenue-maximizing government. Therefore, the argument in favour of fiscal decentralization is twofold: (1) fiscal decentralization will increase competition among the local governments which will ultimately limit the size of the public sector; and (2) decentralization will increase efficiency because local governments have better information about their residents’ needs than the central government. Ojo and Okunrounmu (1992) investigate the role of fiscal decentralization in developing countries with specific reference to Nigeria and observe that the Nigeria’s narrow revenue base could not withstand the weight of public expenditure and investment. They find that fiscal decentralization increased macroeconomic instability and the public debt burden escalated. Other notable studies on fiscal performance of Nigeria include Oyejide (1972), Ariyo (1993), Egwaikhide et al. (1994), Anyanwu (1999), among others. Despite, the contradictory findings, economic reforms in the transition countries and its effect on the rest of the world fuelled the debate on the appropriate role of the state and its institutions in the last decade. Such a debate on public sector reforms in developing and transition countries reinstated the interest in fiscal decentralization. 3.0 Stylized Facts on Nigeria's Fiscal Federalism There has been a limited degree of fiscal decentralization in Nigeria since 1954 when the country adopted federalism. At independence in 1960, the constitution gave the federal government exclusive powers over the imposition of some taxes. The regional governments were then left with the power to impose any other tax not reserved for the federal government. However, when the military assumed power in 1966, the fiscal relationship changed as a result of the suspension of the constitution68. This, in effect, empowered the federal government to impose any tax, thereby curtailing the fiscal powers of the states. State governments, therefore, became administratively and financially dependent on the federal government as the revenues from regional or state taxes remained grossly inadequate to meet their expenditure responsibilities. Therefore, states had to fall back on their share of federally collected revenues, but the federal government retained fiscal supremacy. Revenue allocation in Nigeria has always been subject to controversy, and various revenue allocation commissions have been set up to 67 The Leviathan model predicts that the overall size of the public sector should inversely vary with decentralization. 68 The legal, administrative and political relationship between the federal and the state governments were based on Decree No. 1 of 1966 which gave the federal government unlimited powers to legislate on “any matter whatsoever”.
European Scientific Journal October 2014 edition vol.10, No.28 ISSN: 1857 – 7881 (Print) e - ISSN 1857- 7431
466
look into the allocation formula. Some categories of revenue were allocated to the states and local government and revenues that do not fall under this category are federally collected and paid into the federation account for sharing. The revenue is shared vertically among the three tiers of government, and horizontally among the units within the same level of government. The vertical sharing revenue formular is in the following percentages; 48.5: 24.0 and 20.0% to federal, state and local governments, respectively while the balance of 7.5% is allocated to special funds. The horizontal counterparts is based on the following principles including equality, population, internal revenue effort, and geographical size among others. Revenues accruing to the three levels of government consists of tax and non-tax financial flows which are derived from internal and external sources. The internal sources are those revenue heads assigned to the three levels of government by the Constitution, while the external source is made up of statutory revenue allocation, discretionary grants and value added tax (VAT). The different formulas that have been used for revenue allocation have consistently increased the financial powers of the federal government against the other levels of government, The allocation of the most productive income-elastic taxes to the federal government have made the centre financially stronger than the states and local governments. The principal effect of this is the increasing fiscal dependence of the lower governments on federally collected revenue (both statutory and non-statutory), and their inability to meet the cost of functions assigned to them. The overview of the profile and challenges of fiscal federalism in Nigeria have been presented to show deviation from the true practice of fiscal federalism in Nigeria. The main issue is that if the three tiers of government in a federal system were to simultaneously intervene in a market economy, without coordination, and perform the role of the public sector, the situation will be chaotic. Therefore, in order to ensure sustainable growth and national development, it is necessary to understand and institutionalize the policy issues of fiscal federalism. Ideally, each tier of government should be assigned revenue/tax sources that are commensurate with its responsibilities. However, it is important to reconcile considerations of efficiency (minimization of resource cost) with equity (rationalization of expenditure and revenue needs). It is in this light that certain major principles become imperative: progressive redistributive taxes should be central; taxes suitable for economic stabilization should be central while lower level taxes should be cyclically stable; tax bases distributed equally between jurisdictions should be centralized; taxes on mobile factors of production are best administered at the centre; residence-based taxes such as excise duties or sales tax on consumption goods to consumers are best suited

European Scientific Journal October 2014 edition vol.10, No.28 ISSN: 1857 – 7881 (Print) e - ISSN 1857- 7431
467
for the local level; and benefit taxes and user charges might be appropriately used at all levels (Musgrave 1959). In assigning tax/revenue powers, it is also important to distinguish between those revenue powers which are exercisable by one level of government and the revenue which accrue to that level of government alone (“independent revenue”), and those exercisable by a level of government, but whose revenues accrue to that level of government as well as others. Table1 presents the assignment of tax powers in the Nigerian federal system. Table 2 show Nigeria’s major taxes and the accompanying jurisdiction and right to revenue. Table 3 indicates that all the major sources of revenue-petroleum profits tax, import duties, excise duties, mining rents and royalties, and company income tax-come under the jurisdiction of the federal government. With the exception of personal income tax (at the state level) and property tax (at the local government level), the state and local governments have jurisdiction over minor and poor yielding revenue sources. As a result of the concentration of revenue rights and jurisdiction at the national level, sub national governments have become dependent on national transfers for their expenditures. Indeed, there has been a high dependency on statutory allocations from the federal to the state level. It is widely documented that the federal government enjoys a greater ability to raise revenues to meet its functional expenditure obligations than do state and local governments. Tax assignment in Nigeria had changed at different periods essentially as determined by the federal structure in operation. Between 1966 and 1999, the fiscal decentralization arrangement changed remarkably, following the intervention of the military69. The military government introduced some measures which systematically eroded the revenue potentials of the lower tiers of government. The combination of military rule, civil war, and an arrangement whereby all the proceeds from oil goes to the federal government totally reversed the situation in the early 1960s when there was substantial revenue and expenditure decentralization. Today, what exist is a situation in which all fiscal resources are centralized at the federal level which is then transferred to the states and local governments through the federation account and the local government joint account, respectively. This situation has been compounded by shifts in fiscal responsibilities from the federal to other levels of government, especially the
69The measures introduced by the military include: promulgation of Decree No. 9 of 1971, transferring mining and royalties to the Federal Government; centralization of marketing boards, and their eventual dissolution; collection and retention of company income tax and excise duties. The introduction of value-added tax (VAT) in 1994 to replace the sales tax that had been previously assigned to states. The legislation and administration of the new tax was assigned to the Federal Government as agent of the federating units.

European Scientific Journal October 2014 edition vol.10, No.28 ISSN: 1857 – 7881 (Print) e - ISSN 1857- 7431
468
local governments (for example primary education and primary health care, among others). From the above analysis, it is clear that the Federal Government had assumed a near absolute control of revenue matters in the country. Table 3 presents figures on total revenues collected by different tiers of government. The table reveals that from 1980 to 2011, between 94 and 99 % of the total revenues are collected by the federal government. The Federal government continues to sustain this feat by tinkering with the rights of tiers of government to collect revenues.
Table1: Nigeria’s Tax Jurisdiction, 1999 Federal Government State Government Local Government 1. Companies Income Tax
Personal Income Tax (on residents of the State)
Tenement rate
2. Petroleum Profits Tax Capital Gains Tax (on individuals only)
Shop and Kiosks Rates
3. Value Added Tax Stamp Duties (on individuals) only
Liquor Licence Fees
4.Education Tax (on Companies only)
Road taxes, e.g., Vehicle Licences
Slaughter slab fees
5. Capital Gains Tax (on Corporate Bodies and Abuja Residents)
Betting and Gaming Taxes Marriage, Birth and Death Registration Fees
6. Stamp Duties (on Corporate Bodies)
Business Premises and Registration Levies
Street name, Registration Fees (excluding state capital)
7. With-holding Tax (on Companies)
Development levy (Max of #100 per annum on taxable individuals only)
Market/Motor Park Fees (excluding State owned markets)
8. Personal Income Tax (on personnel of the Armed Forces, Police, External Affairs Ministry and Residents of Abuja )
Street Name Registration Fees (State Capital Only)
Domestic Animal Licence Fees
9. Mining Rents and Royalties
Right of Occupancy Fees (State Capital Only)
Bicycle, Trucks, Canoe, Wheelbarrow, Carts and Canoe Fees
10. Customs Duties (i.e., Import Duties and Export Duties
Market fees (where market is financed by State Government)
Right of Occupancy fees (excluding State Capital)
11. Excise Duties Miscellaneous revenues (e.g., rents on property)
Cattle Tax
Sources: Federal Ministry of Finance, and 1999 Constitution of the Federal Republic of Nigeria and other Legislation to date

European Scientific Journal October 2014 edition vol.10, No.28 ISSN: 1857 – 7881 (Print) e - ISSN 1857- 7431
469
Table 2: Nigeria’s Major Tax Jurisdictions and Right to Revenue (1999) Types of tax Jurisdiction Right to Revenue
Law
Admin. And Collection
1. Import duties 2. Excise duties 3. Export duties 4. Mining rents and royalties 5.Petroleum profit tax 6. Companies income tax 7. Capital gains tax 8.Personal income tax (other than those listed in 9) 9.Personal income tax: armed forces, external affairs officers, non- residents of the Fed. Capital Territory and Nigerian Police Force 10. Licences fees on television and wireless radio 11. Stamp duties 12.Capital transfer tax (CCT) 13. Value added tax 14. Pools betting and other betting taxes 15. Motor vehicle and drivers’ licenses 16. Entertainment tax 17. Land registration and survey fees 18. Property taxes and rating 19.Market and trading licence and fees
Federal Federal Federal Federal Federal Federal Federal Federal Federal Federal Federal Federal Federal State State State State State State
Federal Federal Federal Federal Federal Federal Federal/States States Federal Local Federal/States States Federal/States States States States States Local Local
federation account federation account federation account federation account federation account federation account States Federal Federal Local States States Federal/States/Local States States States States/Local Local Local
Note: The peculiar status of the Federal Capital Territory has not been taken consideration in this table. Source: Constitutions of the Federal Republic of Nigeria and other legislations to date Table 3: Average Collected Government Revenues by Tiers of Government , 1980-2011 DESCRIPTION
1980-84 (# million)
1985-1989 (# million)
1990-1994 (#million)
1995-1999 (#million)
2000-2007 (# million)
2008-2011 (# million)
1.Total Federally collected Revenue
12,343.94
26,898.78 156,845.5 595,838.4 3,699,174 8,992,645
2.States Internally Gen. Revenues
87.2 1,836.06 5,568.72 25,430.22 24,179.2 540,579.8
3.Total Nigerian Govt. Revenues (1+2)
12431.14 28,734.84 162,414.22 621,268.62 3,823,353.2 9,533,224.8
4.Fed. Collected Rev. as % of Total
99 94 97 96 97 94
5.% of States collected revenue
1 6 3 4 3 6
6. Number of Regions/States
19 20 28 34 36 36
Source: Central Bank of Nigeria, Annual Report & Statement of Accounts (Various Issues).

European Scientific Journal October 2014 edition vol.10, No.28 ISSN: 1857 – 7881 (Print) e - ISSN 1857- 7431
470
From the above analysis, it is evident that state and local governments depend heavily on the federation account for more than 80% of their total revenue as a result of their narrow tax bases and inefficient tax administration machinery. Internal tax bases of state governments include personal income tax, capital gains tax, stamp duties, and property tax among others. While states have the power to determine the rate and tax bases of some of these taxes, the federal government determines the rates and bases for all other taxes, including personal income tax. All the taxes assigned to the federal government are those that yield the highest revenues. The taxes under the state and local governments like the personal income tax are set by the federal government. Theoretically, this practice can be defended on the basis of unequal distribution of natural resources, especially crude oil, and the need for the federal government to have certain stabilization instruments at its disposal. 4.0 Theoretical Framework and Methodology There is a growing consensus in the literature about the mechanisms that create the links between fiscal decentralization and macroeconomic performance (Feltenstein and Iwata, 2005; Brandt and Zhu, 2000; Jin et al. 1999; Lardy, 1998; Naughton, 1995; Yusuf, 1994, Aigbokhan, 1999). Fiscal decentralization is expected to shift tax revenues from the central government to sub national governments. Sub national governments infused with new revenue, begin to build local infrastructure. This infrastructure encourages both public and private investment. Private firms tend to respond to the increased local infrastructure with higher rates of investment than the public enterprises, given their greater efficiency. As the public enterprises attempt to keep up with the rates of investment of private enterprises, a further adjustment occurs. The public enterprises, observing the increased rate of capital formation of the private enterprises increase their own rate of investment beyond the rate that would be optimal. The public enterprises are able to do so because they have access to bank loans that are not justified on economic grounds. Also the private enterprises increase their borrowing to expand business operations because of the improvement in local infrastructure. Increased economic activities at sub national level results in monetary expansion. The implication of this is that the resulting monetary expansion would have effects on indicators of macroeconomic performance; inflation rate, interest rate, exchange rate, and economic growth. The effects of the monetary expansion on these macroeconomic variables could be positive or negative. This study assumes that the monetary expansion would lead to increased inflation and interest rate, depreciation of the exchange rate, while the higher output of both the public and private enterprises cause an increase in aggregate real income (that is economic growth).

European Scientific Journal October 2014 edition vol.10, No.28 ISSN: 1857 – 7881 (Print) e - ISSN 1857- 7431
471
4.1 Fiscal Federalism and Economic Growth Given the basic foundations for the initial theory of Fiscal Federalism, the study adopts the Keynesian School of thought approach as the theoretical basis for the relationship between fiscal federalism and economic growth. The two-sector production function framework (Ram, 1986; Barro, 1990) is adopted for this study70. The model developed in this study is an extension from other studies (Ram, 1986 and Aigbokhan, 1996; 1999). The model assumes that the economy consists of two broad sectors, public (G) and private (P) whose output depends on labour (L) and capital (K). In addition, the output of G exercises some externality effect on output in P. The production function of the economy is thus: Y = f (L, KP , KG ) (1) where the subscripts denote sectoral inputs: KP = private capital per labour KG = public capital per labour The production functions of the respective sectors are thus: YP = P(LP, KP, G) (2) YG = G(LG, KG ) (3) Total inputs are given as: LT = LP + LG (4) KT = KP + KG (5) Total output Y is given as the sum of sectoral output or a function of sectoral inputs: Y = YP + YG (6) Y = P(LP, KP, G) + G(LG, KG) (7a) Y = f(LT, KT, GT) (7b) The model further assumes that the public sector comprises of three subsectors and, by extension, that public spending is carried out by three levels of government: federal (f), state (s), and local (m). Thus: Y = a0 + LT + KT + GT + µ (8) The study assumes that the size of government tends to influence growth rate and that fiscal decentralization tends to reduce the size of government. Theoretically, fiscal decentralization is expected to foster growth through allocative efficiency and efficiency of service delivery. The nature of intergovernmental fiscal arrangement is therefore expected to influence output of G. By introducing fiscal decentralization (FDC) as a policy variable into the model on the basis of equation (8) Gt = f(FDC) (9) 70 It provides an appealing set of models for investigating the relationship between fiscal decentralization and macroeconomic performance indicators such as growth of aggregate output, inflation rate, interest rate, and exchange rate. The model assumes that macroeconomic performance is influenced by policy variables other than the technical relationship between capital and labour (Ram, 1986; Barro, 1990; Aigbokhan, 1999).

European Scientific Journal October 2014 edition vol.10, No.28 ISSN: 1857 – 7881 (Print) e - ISSN 1857- 7431
472
Equation (7b); Y= f(Lt, Kt, Gt) becomes Y = f(Lt, Kt, FDCt) (10) The study postulates that output (growth), is positively affected by money supply (MS). Introducing money supply into the model, equation (10) becomes; Y = f(Lt, Kt, MSt, FDCt ) (11) Equation (11) is the estimated basic growth equation. Its explicit form is: Y = α 0 + α 1Lt + α 2Kt + α 3MSt + α 4FDCt + µ t (12a) From equation (12a), a VAR Model with j lags can be expressed as; yt = α1yt-1+ α2yt-2 +…+ αjyt-j + µt (12b) 4.2 Fiscal Federalism and Inflation rate There is evidence to suggest that monetary expansion will lead to increased inflation (Feltenstein and Iwata, 2005). Following this, we express inflation as a function of money supply. INF = f(MS) (13) The model assumes that there are two sectors, private P and public G whose output depends on labour (L) and capital (K), and that there is a negative relationship between output and price movement (inflation rate). Following this, the study postulates that labour and capital have an impact on price level (inflation).There is evidence to suggest that factor productivity tends to impact positively on price level (inflation rate). Equation (13) becomes: INF = f(MSt ,Lt , Kt) (14) There are links between decentralization and inflation (Brandt and Zhu, 2000; Jin et al. 1999; Lardy, 1998; Naughton, 1995; Yussuf, 1994). By introducing fiscal decentralization (FDC) as a policy variable into the model equation (14) becomes: INF = f(MSt , Lt , Kt , FDCt) (15) Equation (15) is the estimated basic inflation equation. Its explicit form is; INF = β 0 + β 1MSt + β 2Lt + β 3Kt + β 4FDCt + µ t (16a)
From equation (16a) a VAR model with j lags can be expressed as; INFt = β1INFt-1+ β2INFt-2 +…+ βjINFt-j + µt (16b) 4.3 Fiscal Federalism and Exchange rate The model assumes a flexible exchange rate determined by market forces (Ige 2006, Afolabi, 1999). In addition, the study postulates that exchange rate (EXC) will be negatively affected by inflation and increase in money supply, and therefore states that: EXC = f (INF, MS) (17)

European Scientific Journal October 2014 edition vol.10, No.28 ISSN: 1857 – 7881 (Print) e - ISSN 1857- 7431
473
The study assumes that the size of government tends to influence exchange rate, and that fiscal decentralization has a negative correlation with the size of government. This implies that increase in decentralization would reduce the size of government. Theoretically, fiscal decentralization may have a negative impact on exchange rate if there is lack of fiscal discipline at sub national levels of government. By introducing fiscal decentralization (FDC) as a policy variable into the model, equation (17) becomes, EXC = f(INFt , MSt , Gt) (18) EXC = f(INFt , MSt , FDCt) (19) Equation (19) is deduced from (18) on the basis of the argument above that size of G depends to a certain degree on FDC. Equation (19) is the estimated basic exchange rate equation. Its explicit form is: EXC = δ 0 + δ 1INFt + δ 2MSt + δ 3FDCt +µ t (20a)
From equation (20a) a VAR model with j lags can be expressed as; EXCt = δ1EXCt-1 + δ2EXCt-2 +…+ δjEXCt-j+ µt (20b) 4.4 Fiscal Federalism and Interest rate According to the Keynesian School of thought, interest rate is a monetary phenomenon, determined solely by demand and supply of money. To the Classical School, interest rate varies inversely with demand for money and directly with supply of money. The inverse relationship between interest rate and demand for money has implication for the level of savings. The study postulates that the level of savings in the economy is positively affected by interest rate, which is high interest rate correlates with high level of savings and vice-versa. The functional relationship is stated as follows: INT = f (MS, TDS) (21) There is evidence that price level (inflation) influences interest rate (Ige, 2006). By introducing inflation into the model, equation (21) becomes: INT = f (MSt , TDSt , INFt) (22) The study assumes that the size of government influences interest rate, and that fiscal decentralization has a negative correlation with the size of government (Aigbokhan, 1999; Ehdaie 1994). Theoretically fiscal decentralization may have a negative impact on interest rate if there is lack of fiscal discipline at sub national level, and how fiscal imbalances are financed (Chete 1998). By introducing fiscal decentralization (FDC) as a policy variable into the model, equation (22) becomes: INT = f(MSt ,TDSt , INFt , Gt) (23) INT = f(MSt , TDSt , INFt , FDCt) (24) Equation (24) is deduced from (23) on the basis of the argument above that the size of G depends to a certain degree on FDC. Equation (24) is the estimated basic interest rate equation. Its explicit form is: INT = λ 0 +λ 1MSt +λ 2TDSt +λ 3INFt +λ 4FDCt +µ t (25a)
From equation (25a), a VAR model with j lags can be expressed as;
European Scientific Journal October 2014 edition vol.10, No.28 ISSN: 1857 – 7881 (Print) e - ISSN 1857- 7431
474
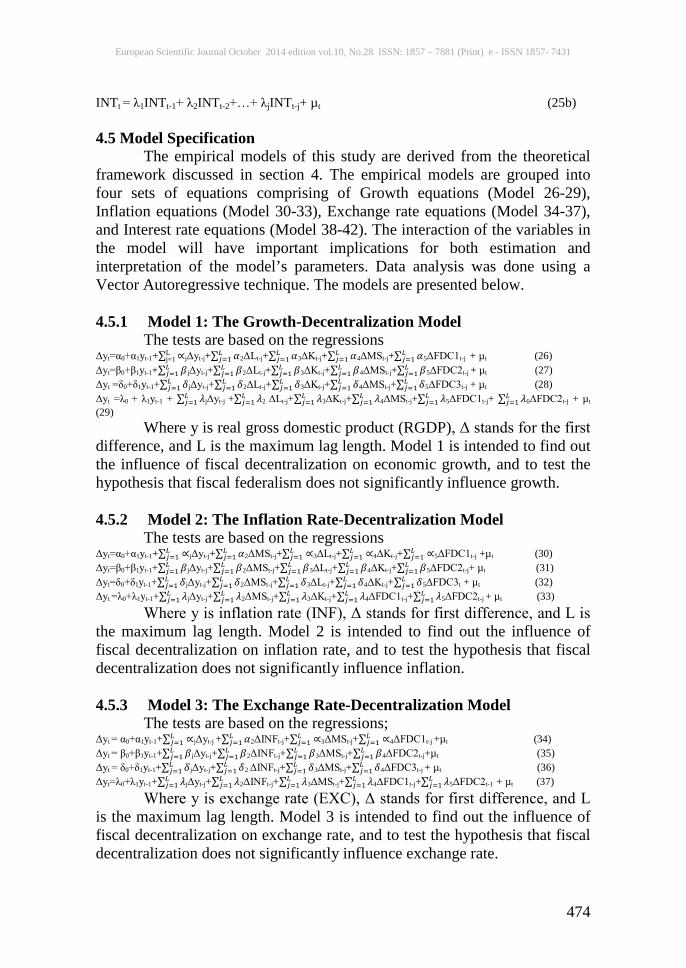
INTt = λ1INTt-1+ λ2INTt-2+…+ λjINTt-j+ µt (25b) 4.5 Model Specification The empirical models of this study are derived from the theoretical framework discussed in section 4. The empirical models are grouped into four sets of equations comprising of Growth equations (Model 26-29), Inflation equations (Model 30-33), Exchange rate equations (Model 34-37), and Interest rate equations (Model 38-42). The interaction of the variables in the model will have important implications for both estimation and interpretation of the model’s parameters. Data analysis was done using a Vector Autoregressive technique. The models are presented below. 4.5.1 Model 1: The Growth-Decentralization Model The tests are based on the regressions Δyt=α0+α1yt-1+∑ ∝L
j=1 jΔyt-j+∑ 𝛼𝐿𝑗=1 2ΔLt-j+∑ 𝛼𝐿
𝑗=1 3ΔKt-j+∑ 𝛼𝐿𝑗=1 4ΔMSt-j+∑ 𝛼𝐿
𝑗=1 5ΔFDC1t-j + µt (26) Δyt=β0+β1yt-1+∑ 𝛽𝐿
𝑗=1 jΔyt-j+∑ 𝛽𝐿𝑗=1 2ΔLt-j+∑ 𝛽𝐿
𝑗=1 3ΔKt-j+∑ 𝛽𝐿𝑗=1 4ΔMSt-j+∑ 𝛽𝐿
𝑗=1 5ΔFDC2t-j + µt (27) Δyt =δ0+δ1yt-1+∑ 𝛿𝐿
𝑗=1 jΔyt-j+∑ 𝛿𝐿𝑗=1 2ΔLt-j+∑ 𝛿𝐿
𝑗=1 3ΔKt-j+∑ 𝛿𝐿𝑗=1 4ΔMSt-j+∑ 𝛿𝐿
𝑗=1 5ΔFDC3t-j + µt (28) Δyt =λ0 + λ1yt-1 + ∑ 𝜆𝐿
𝑗=1 jΔyt-j +∑ 𝜆𝐿𝑗=1 2 ΔLt-j+∑ 𝜆𝐿
𝑗=1 3ΔKt-j+∑ 𝜆𝐿𝑗=1 4ΔMSt-j+∑ 𝜆𝐿
𝑗=1 5ΔFDC1t-j+ ∑ 𝜆𝐿𝑗=1 6ΔFDC2t-j + µt
(29) Where y is real gross domestic product (RGDP), Δ stands for the first difference, and L is the maximum lag length. Model 1 is intended to find out the influence of fiscal decentralization on economic growth, and to test the hypothesis that fiscal federalism does not significantly influence growth. 4.5.2 Model 2: The Inflation Rate-Decentralization Model The tests are based on the regressions Δyt=α0+α1yt-1+∑ ∝𝐿
𝑗=1 jΔyt-j+∑ 𝛼𝐿𝑗=1 2ΔMSt-j+∑ ∝𝐿
𝑗=1 3ΔLt-j+∑ ∝𝐿𝑗=1 4ΔKt-j+∑ ∝𝐿
𝑗=1 5ΔFDC1t-j +µt (30) Δyt=β0+β1yt-1+∑ 𝛽𝐿
𝑗=1 jΔyt-j+∑ 𝛽𝐿𝑗=1 2ΔMSt-j+∑ 𝛽𝐿
𝑗=1 3ΔLt-j+∑ 𝛽𝐿𝑗=1 4ΔKt-j+∑ 𝛽𝐿
𝑗=1 5ΔFDC2t-j+ µt (31) Δyt=δ0+δ1yt-1+∑ 𝛿𝐿
𝑗=1 jΔyt-j+∑ 𝛿𝐿𝑗=1 2ΔMSt-j+∑ 𝛿𝐿
𝑗=1 3ΔLt-j+∑ 𝛿𝐿𝑗=1 4ΔKt-j+∑ 𝛿𝐿
𝑗=1 5ΔFDC3t + µt (32) Δyt =λ0+λ1yt-1+∑ 𝜆𝐿
𝑗=1 jΔyt-j+∑ 𝜆𝐿𝑗=1 2ΔMSt-j+∑ 𝜆𝐿
𝑗=1 3ΔKt-j+∑ 𝜆𝐿𝑗=1 4ΔFDC1t-j+∑ 𝜆𝐿
𝑗=1 5ΔFDC2t-j + µt (33) Where y is inflation rate (INF), Δ stands for first difference, and L is the maximum lag length. Model 2 is intended to find out the influence of fiscal decentralization on inflation rate, and to test the hypothesis that fiscal decentralization does not significantly influence inflation. 4.5.3 Model 3: The Exchange Rate-Decentralization Model The tests are based on the regressions; Δyt = α0+α1yt-1+∑ ∝𝐿
𝑗=1 jΔyt-j +∑ 𝛼𝐿𝑗=1 2ΔINFt-j+∑ ∝𝐿
𝑗=1 3ΔMSt-j+∑ ∝𝐿𝑗=1 4ΔFDC1t-j +µt (34)
Δyt = β0+β1yt-1+∑ 𝛽𝐿𝑗=1 jΔyt-j+∑ 𝛽𝐿
𝑗=1 2ΔINFt-j+∑ 𝛽𝐿𝑗=1 3ΔMSt-j+∑ 𝛽𝐿
𝑗=1 4ΔFDC2t-j+µt (35) Δyt = δ0+δ1yt-1+∑ 𝛿𝐿
𝑗=1 jΔyt-j+∑ 𝛿𝐿𝑗=1 2 ΔINFt-j+∑ 𝛿𝐿
𝑗=1 3ΔMSt-j+∑ 𝛿𝐿𝑗=1 4ΔFDC3t-j + µt (36)
Δyt=λ0+λ1yt-1+∑ 𝜆𝐿𝑗=1 jΔyt-j+∑ 𝜆𝐿
𝑗=1 2ΔINFt-j+∑ 𝜆𝐿𝑗=1 3ΔMSt-j+∑ 𝜆𝐿
𝑗=1 4ΔFDC1t-j+∑ 𝜆𝐿𝑗=1 5ΔFDC2t-1 + µt (37)
Where y is exchange rate (EXC), Δ stands for first difference, and L is the maximum lag length. Model 3 is intended to find out the influence of fiscal decentralization on exchange rate, and to test the hypothesis that fiscal decentralization does not significantly influence exchange rate.
European Scientific Journal October 2014 edition vol.10, No.28 ISSN: 1857 – 7881 (Print) e - ISSN 1857- 7431
475
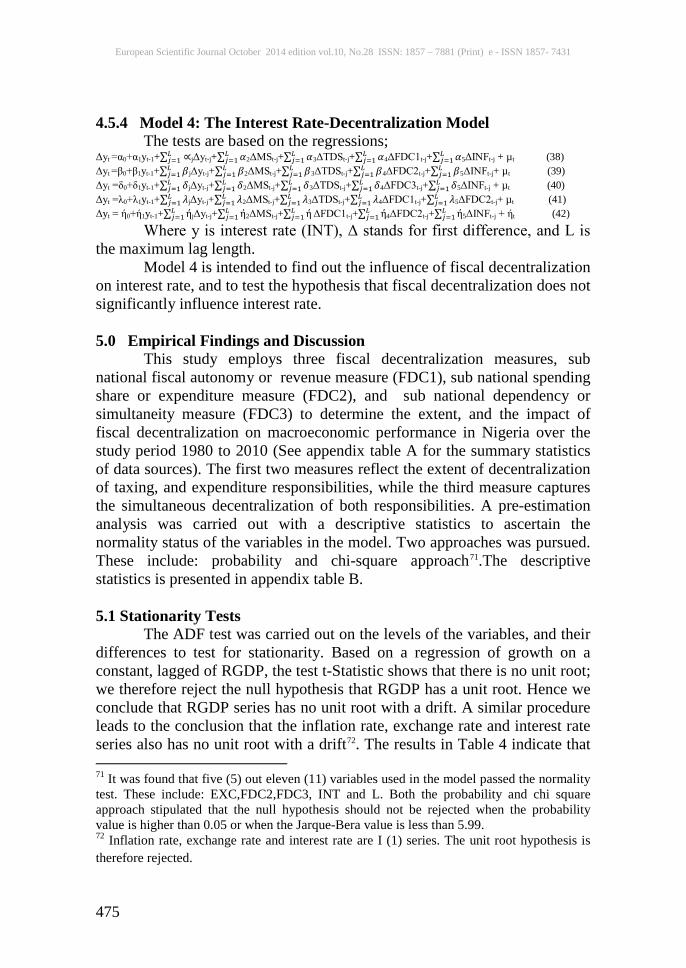
4.5.4 Model 4: The Interest Rate-Decentralization Model The tests are based on the regressions; Δyt =α0+α1yt-1+∑ ∝𝐿
𝑗=1 jΔyt-j+∑ 𝛼𝐿𝑗=1 2ΔMSt-j+∑ 𝛼𝐿
𝑗=1 3ΔTDSt-j+∑ 𝛼𝐿𝑗=1 4ΔFDC1t-j+∑ 𝛼𝐿
𝑗=1 5ΔINFt-j + µt (38)
Δyt =β0+β1yt-1+∑ 𝛽𝐿𝑗=1 jΔyt-j+∑ 𝛽𝐿
𝑗=1 2ΔMSt-j+∑ 𝛽𝐿𝑗=1 3ΔTDSt-j+∑ 𝛽𝐿
𝑗=1 4ΔFDC2t-j+∑ 𝛽𝐿𝑗=1 5ΔINFt-j+ µt (39)
Δyt =δ0+δ1yt-1+∑ 𝛿𝐿𝑗=1 jΔyt-j+∑ 𝛿𝐿
𝑗=1 2ΔMSt-j+∑ 𝛿𝐿𝑗=1 3ΔTDSt-j+∑ 𝛿𝐿
𝑗=1 4ΔFDC3t-j+∑ 𝛿𝐿𝑗=1 5ΔINFt-j + µt (40)
Δyt =λ0+λ1yt-1+∑ 𝜆𝐿𝑗=1 jΔyt-j+∑ 𝜆𝐿
𝑗=1 2ΔMSt-j+∑ 𝜆𝐿𝑗=1 3ΔTDSt-j+∑ 𝜆𝐿
𝑗=1 4ΔFDC1t-j+∑ 𝜆𝐿𝑗=1 5ΔFDC2t-j+ µt (41)
Δyt = ή0+ή1yt-1+∑ ή𝐿𝑗=1 jΔyt-j+∑ ή𝐿
𝑗=1 2ΔMSt-j+∑ ή𝐿𝑗=1 ΔFDC1t-j+∑ ή𝐿
𝑗=1 4ΔFDC2t-j+∑ ή𝐿𝑗=1 5ΔINFt-j + ήt (42)
Where y is interest rate (INT), Δ stands for first difference, and L is the maximum lag length. Model 4 is intended to find out the influence of fiscal decentralization on interest rate, and to test the hypothesis that fiscal decentralization does not significantly influence interest rate. 5.0 Empirical Findings and Discussion This study employs three fiscal decentralization measures, sub national fiscal autonomy or revenue measure (FDC1), sub national spending share or expenditure measure (FDC2), and sub national dependency or simultaneity measure (FDC3) to determine the extent, and the impact of fiscal decentralization on macroeconomic performance in Nigeria over the study period 1980 to 2010 (See appendix table A for the summary statistics of data sources). The first two measures reflect the extent of decentralization of taxing, and expenditure responsibilities, while the third measure captures the simultaneous decentralization of both responsibilities. A pre-estimation analysis was carried out with a descriptive statistics to ascertain the normality status of the variables in the model. Two approaches was pursued. These include: probability and chi-square approach71.The descriptive statistics is presented in appendix table B. 5.1 Stationarity Tests The ADF test was carried out on the levels of the variables, and their differences to test for stationarity. Based on a regression of growth on a constant, lagged of RGDP, the test t-Statistic shows that there is no unit root; we therefore reject the null hypothesis that RGDP has a unit root. Hence we conclude that RGDP series has no unit root with a drift. A similar procedure leads to the conclusion that the inflation rate, exchange rate and interest rate series also has no unit root with a drift72. The results in Table 4 indicate that 71 It was found that five (5) out eleven (11) variables used in the model passed the normality test. These include: EXC,FDC2,FDC3, INT and L. Both the probability and chi square approach stipulated that the null hypothesis should not be rejected when the probability value is higher than 0.05 or when the Jarque-Bera value is less than 5.99. 72 Inflation rate, exchange rate and interest rate are I (1) series. The unit root hypothesis is therefore rejected.
European Scientific Journal October 2014 edition vol.10, No.28 ISSN: 1857 – 7881 (Print) e - ISSN 1857- 7431
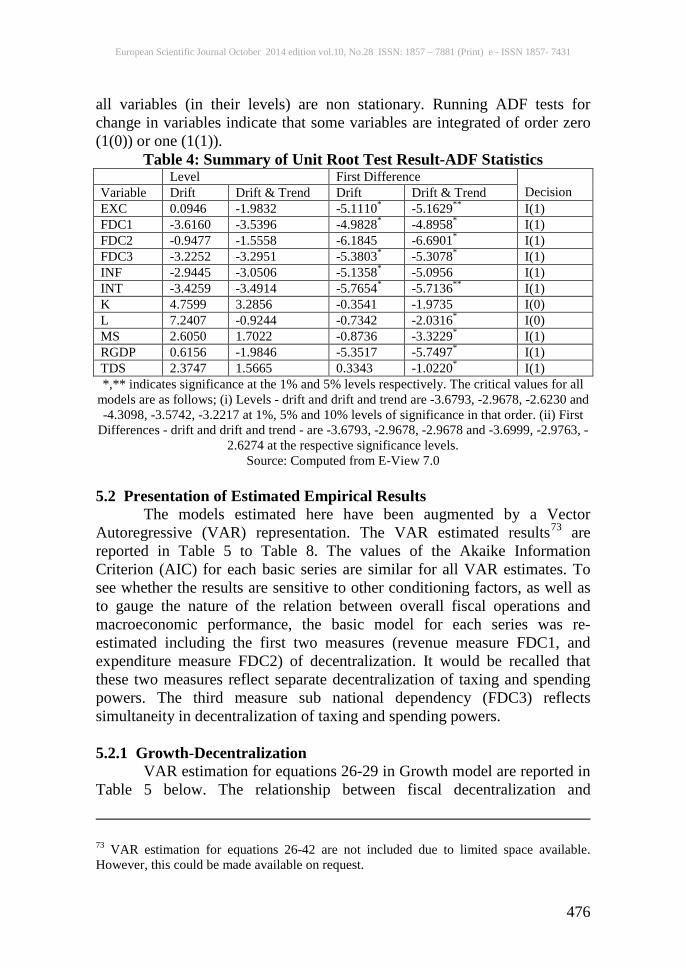
476
all variables (in their levels) are non stationary. Running ADF tests for change in variables indicate that some variables are integrated of order zero (1(0)) or one (1(1)).
Table 4: Summary of Unit Root Test Result-ADF Statistics Level First Difference
Decision Variable Drift Drift & Trend Drift Drift & Trend EXC 0.0946 -1.9832 -5.1110* -5.1629** I(1) FDC1 -3.6160 -3.5396 -4.9828* -4.8958* I(1) FDC2 -0.9477 -1.5558 -6.1845 -6.6901* I(1) FDC3 -3.2252 -3.2951 -5.3803* -5.3078* I(1) INF -2.9445 -3.0506 -5.1358* -5.0956 I(1) INT -3.4259 -3.4914 -5.7654* -5.7136** I(1) K 4.7599 3.2856 -0.3541 -1.9735 I(0) L 7.2407 -0.9244 -0.7342 -2.0316* I(0) MS 2.6050 1.7022 -0.8736 -3.3229* I(1) RGDP 0.6156 -1.9846 -5.3517 -5.7497* I(1) TDS 2.3747 1.5665 0.3343 -1.0220* I(1) *,** indicates significance at the 1% and 5% levels respectively. The critical values for all
models are as follows; (i) Levels - drift and drift and trend are -3.6793, -2.9678, -2.6230 and -4.3098, -3.5742, -3.2217 at 1%, 5% and 10% levels of significance in that order. (ii) First
Differences - drift and drift and trend - are -3.6793, -2.9678, -2.9678 and -3.6999, -2.9763, -2.6274 at the respective significance levels.
Source: Computed from E-View 7.0 5.2 Presentation of Estimated Empirical Results The models estimated here have been augmented by a Vector Autoregressive (VAR) representation. The VAR estimated results73 are reported in Table 5 to Table 8. The values of the Akaike Information Criterion (AIC) for each basic series are similar for all VAR estimates. To see whether the results are sensitive to other conditioning factors, as well as to gauge the nature of the relation between overall fiscal operations and macroeconomic performance, the basic model for each series was re-estimated including the first two measures (revenue measure FDC1, and expenditure measure FDC2) of decentralization. It would be recalled that these two measures reflect separate decentralization of taxing and spending powers. The third measure sub national dependency (FDC3) reflects simultaneity in decentralization of taxing and spending powers. 5.2.1 Growth-Decentralization VAR estimation for equations 26-29 in Growth model are reported in Table 5 below. The relationship between fiscal decentralization and
73 VAR estimation for equations 26-42 are not included due to limited space available. However, this could be made available on request.

European Scientific Journal October 2014 edition vol.10, No.28 ISSN: 1857 – 7881 (Print) e - ISSN 1857- 7431
477
economic growth is analyzed using the three decentralization measures. The three measures of decentralization, revenue measure (FDC1), expenditure measure (FDC2), and simultaneity measure (FDC3) were found to be positive and highly significant at one per cent and five per cent in most cases for RGDP growth equations. The coefficients of revenue and expenditure measures show a consistent positive sign when the two decentralization measures are included as reported in the fourth column in Table 5. This result is consistent with the findings in similar studies in China (Feltenstein and Iwata, 2005), United States of America (Akai, 2002; Ram, 1986, Rodden, 2001), and Canada (Boadway, 1992). However, it contradicts the finding on Nigeria by Aigbokhan (1999) that decentralization has a negative impact on economic growth. The difference in the finding of these studies and that of Aigbokhan (1999) could be due to difference in the scope of the study. The growth-decentralization model include three control variables, money supply (MS), labour (L), and capital (K) and they have signs predicted by theory. Labour input produced a positive significant impact, at one per cent level, on economic growth in Nigeria over the study period. Expectedly capital input is positively signed and significant at five per cent level. Capital input is thus a major driver of economic growth in Nigeria. Also money supply is positively signed but is insignificant. Adjusted coefficient of determination shows that variations in GDP are sufficiently explained by the variables included in the growth models. On the basis of estimation results of the growth models the null hypothesis is rejected, and the alternative hypothesis that fiscal decentralization has a significant effect on growth is accepted.
Table 5 : Estimated Empirical Results in Growth-Decentralization Model 1
Dependent variable RGDP Regressors 1 2 3 4 RGDP(-1) 0.6597** 0.6237* 0.6506** 0.6667** (2.5029) (2.3837) (2.5649) (2.9757) RGDP(-2) 0.3891* 0.0537** 0.2977** 0.3025 (1.2901) (0.1765) (0.9780) (1.0880) L(-1) 0.0540 0.0338 0.0534 0.0141 (1.4905) (0.5100) (1.3823) (0.2499) L(-2) 0.0565 0.0337 0.0558 0.0133 (1.5071) (0.4939) (1.3974) (0.2278) K(-1) 0.0026* 0.0082 0.0024 0.0144** (0.0882) (0.2895) (0.0795) (0.7923) K(-2) 0.0010* 0.0142 0.0033 0.0131* (0.0294) (0.4911) (0.1081) (0.6928) MS(-1) 0.0063 0.0033 0.0066 - (0.7330) (0.3720) (0.7503) - MS(-2) 0.0031* -0.0025* 0.0028 -

European Scientific Journal October 2014 edition vol.10, No.28 ISSN: 1857 – 7881 (Print) e - ISSN 1857- 7431
478
(0.3393) (-0.2545) (0.3028) - FDC1(-1) 45004.31* - - 74948.35* (0.4428) - - (0.79881) FDC1(-2) 108711.5** - - 126478.3** (1.0293) - - (1.31294) FDC2(-1) - 13686.99** - (5036.253)* - (0.31575) - (0.12565) FDC2(-2) - 80004.31* - 90674.76* - (1.6609) - (2.11808) FDC3(-1) - - 17889.27** - - - (0.1251) - FDC3(-2) - - 144133.2* - - - (1.03380) - C -62576.45 -48844.25 -51749.46 -92638.06 (-1.8277) (-1.62712) (-1.5209) (-3.76556) Observations 31 31 31 31 Adj. R2 0.94 0.95 0.94 0.95 F- Statistic 48.1405 49.6600 46.4641 58.5765 Log-Likelihood -304.4167 -303.9821 -304.9118 -301.6650 Akaike AIC 21.75287 21.72290 21.78702 21.56311 Source: Computed from E-View 7.0 Notes Figures in parentheses are standard errors *5% level of significance ; **1% level of significance 5.2.2 Inflation Rate-Decentralization VAR estimation for equations 30-33 are reported in Table 6. The relationship between fiscal decentralization and inflation rate is analyzed using the three measures of decentralization, revenue measure (FDC1), expenditure measure (FDC2), and simultaneity measure (FDC3). The three measures of decentralization were found to be positively related with inflation rate but insignificant at one per cent and five per cent level. The coefficients of the lagged values of revenue and expenditure decentralization measures have a positive sign and are statistically insignificant. The coefficient of the simultaneity measure of decentralization (FDC3) has a consistent positive sign in the first and second lagged period and it is also insignificant. The positive correlation between fiscal decentralization and inflation supports the view that fiscal decentralization may lead to inflation. This finding is similar to the findings of Feltenstein and Iwata (2005), and Boadway (1990) which emphasized that that fiscal decentralization has adverse implication on the rate of inflation. Also in Table 6, the coefficients of revenue and expenditure measures of decentralization are positively signed when the two decentralization measures are included in the inflation rate-decentralization model. However they are not significant. On the basis of this findings, we therefore concludes that fiscal decentralization have adverse implications for the rate of inflation, and this may be due to inadequacies in the financial system. These models

European Scientific Journal October 2014 edition vol.10, No.28 ISSN: 1857 – 7881 (Print) e - ISSN 1857- 7431
479
include three control variables, money supply (MS), labour (L), and capital (K). Money supply produced a positive and significant impact, at one per cent level, on inflation rate in Nigeria over the study period. This result is not surprising as it confirms that inflation is more of a monetary phenomenon in Nigeria. Expectedly labour input is negatively signed but is not significant. Also expectedly capital is positively signed and significant at one per cent and five per cent level. Adjusted coefficient of determination indicates that variations in inflation are not sufficiently explained by the variables included in the model. Thus the model thus not has a good fit.
Table 6 : Estimated Empirical Results in Inflation-Decentralization Model 2
Dependent Variable INF Regressors 1 2 3 4 INF(-1) 0.6074** 0.5727** 0.6238** 0.7334** (2.6697) (2.3070) (2.8041) (3.3532) INF(-2) -0.4029* -0.2055* -0.4456 -0.2705* (-1.7927) (-0.9543) (-1.9997) (-1.1169) MS(-1) 4.07E-07 1.58E-06 1.44E-07 2.04E-06 (0.0334) (0.1228) (0.0121) (0.1850) MS(-2) 1.23E-06 6.10E-07 1.72E-06 7.84E-07 (0.0955) (0.0469) (0.1371) (0.0617) L(-1) 0.0001* 8.28E-05* 0.0001* - (1.8433) (0.8681) (2.0126) - L(-2) -0.0001* -8.59E-05* -0.0001 - (-1.8429) (-0.8751) (-2.0122) - K(-1) 6.48E-06 5.37E-06 5.93E-06 -9.77E-06 (0.2175) (0.1776) (0.2043) (-0.3888) K(-2) 1.25E-05 1.81E-05 1.42E-05 3.52E-06 (0.3569) (0.5301) (0.4167) (0.1109) FDC1(-1) 68.4605 - - 110.3670 (0.4794) - - (0.7607) FDC1(-2) 148.2641 - - 106.2776 (0.9784) - - (0.6967) FDC2(-1) - 85.1643 - 66.0218 - (1.5215) - (1.0878) FDC2(-2) - 75.5880 - 101.3343 (1.0018) - (1.9521) FDC3(-1) - - 161.2969 - - - (0.8313) - FDC3(-2) - - 295.2601 - (1.4246) - C 66.7557 62.7425 66.9013 24.4516 (1.6563) (1.6498) (1.7434) (1.0880) Observations 31 31 31 31 Adj.R2 0.2455 0.3077 0.2861 0.2625 F-Statistic 1.9112 2.2447 2.1222 1.9969 Log-Likelihood -114.7159 -113.4679 -113.9139 -114.3849 Akaike AIC 8.6701 8.5840 8.6148 8.6472
Source: Computed from E-View 7.0 Notes Figures in parentheses are standard errors
*5% level of significance ; **1% level of significance
European Scientific Journal October 2014 edition vol.10, No.28 ISSN: 1857 – 7881 (Print) e - ISSN 1857- 7431
480
5.2.3 Exchange Rate-Decentralization VAR estimation results for equations 34-37 are reported in Table 7. The three measures of decentralization, revenue measure, expenditure measure, and simultaneity are positively correlated with exchange rate in Nigeria but are insignificant at one per cent, and five per cent. The coefficients of the lagged values of the revenue and expenditure decentralization measures of decentralization (FDC1, FDC2) are positive and statistically insignificant. The coefficient of the lagged values of simultaneity measure of decentralization (FDC3) is also positive insignificant. The positive correlation between fiscal decentralization and exchange rate shows clearly that fiscal decentralization often leads to exchange rate depreciation but its effect is not significant. Decentralization coefficients of the lagged values of the revenue and simultaneity measures of decentralization (FDC1 and FDC3) have a consistent positive sign in the first and second lagged period and are statistically insignificant. For the expenditure decentralization measure (FDC2) its coefficient has a positive sign in the first lagged period and then a negative sign in the second lagged period and it is also insignificant. The positive signs of the coefficient of revenue, expenditure and simultaneity measures of decentralization (FDC1, FDC2 and FDC3) show that fiscal decentralization will lead to depreciation of the exchange rate. The transmission mechanism of fiscal decentralization and macroeconomic performance explains why decentralization might lead to a depreciation of the exchange rate. Fiscal decentralization is intended to shift tax revenues from the central government to sub national governments. Sub national governments infused with new revenue, begin to build local infrastructure. This infrastructure encourages both public and private investment. Private firms tend to respond to the increased local infrastructure with higher rates of investment than the public enterprises, given their greater efficiency. As the public enterprises attempt to keep up with the rates of investment of private enterprises, a further adjustment occurs. The public enterprises, observing the increased rate of capital formation of the private enterprises increase their own rate of investment beyond the rate that would be optimal. The public enterprises are able to do so because they have access to bank loans that are not justified on economic grounds. Also the private enterprises increase their borrowing to expand business operations because of the improvement in local infrastructure. The resulting monetary expansion leads to depreciation of the exchange rate. This model include two control variables, inflation (INF) and money supply (MS), and their signs conform to a priori expectation. Expectedly, inflation is positively signed and significant at five per cent level. The implication of this finding is that increase in inflation would lead to a

European Scientific Journal October 2014 edition vol.10, No.28 ISSN: 1857 – 7881 (Print) e - ISSN 1857- 7431
481
depreciation of the exchange rate. Money supply is positively signed and significant at one per cent level. Adjusted coefficient of determination shows that variations in exchange rate are sufficiently explained by variables included in the exchange rate model. Table 7: Estimated Empirical Results in Exchange rate-Decentralization
Model 3 Dependent Variable Regressors 1 2 3 4 EXC(-1) 1.0631** 0.9497** 1.0310* 0.9636* (4.5431) (3.9569) (4.4950) (3.6049) EXC(-2) -0.0940** 0.0389** -0.0782* 0.0378** (-0.3991) (0.1463) (-0.3374) (0.1266) INF(-1) 0.0151* 0.0481 0.0677** 0.0034 (0.0708) (0.2540) (0.3179) (0.0167) INF(-2) 0.1694* 0.2042* 0.1363** 0.2703* (0.8077) (0.9556) (0.6335) (1.1084) MS(-1) 1.08E-05 9.29E-06 1.03E-05 9.42E-06 (1.1263) (1.0316) (1.0800) (1.0001) MS(-2) 1.42E-05 1.04E-05 1.34E-05 1.04E-05 (1.0791) (0.8382) (1.0232) (0.7917) FDC1(-1) 87.6915 - - 67.8870 (0.6201) - - (0.4634) FDC1(-2) 17.9485 - - 118.4612 (0.1313) - - (0.8118) FDC2(-1) - 4.2348 - 3.6966 - (0.0704) - (0.0501) FDC2(-2) - 61.0053 - -66.7879 - (1.2547) - (-1.2992) FDC3(-1) - - 14.2322 - - - (0.0731) - FDC3(-2) - - 118.5471* - - - (0.6601) - C 6.8806 30.1711 6.8352 36.8482 (0.7491) (1.9777) (0.7498) (1.4341) Observations 31 31 31 31 Adj. R2 0.9282 0.9375 0.9288 0.9331 F-Statistic 46.2712 53.5333 46.6777 40.0717 Log Likelihood -115.4714 -113.4587 -115.3510 -112.9198 Akaike AIC 8.5842 8.4454 8.5759 8.5462
Computed from E-View 7.0 Notes Figures in parentheses are standard errors
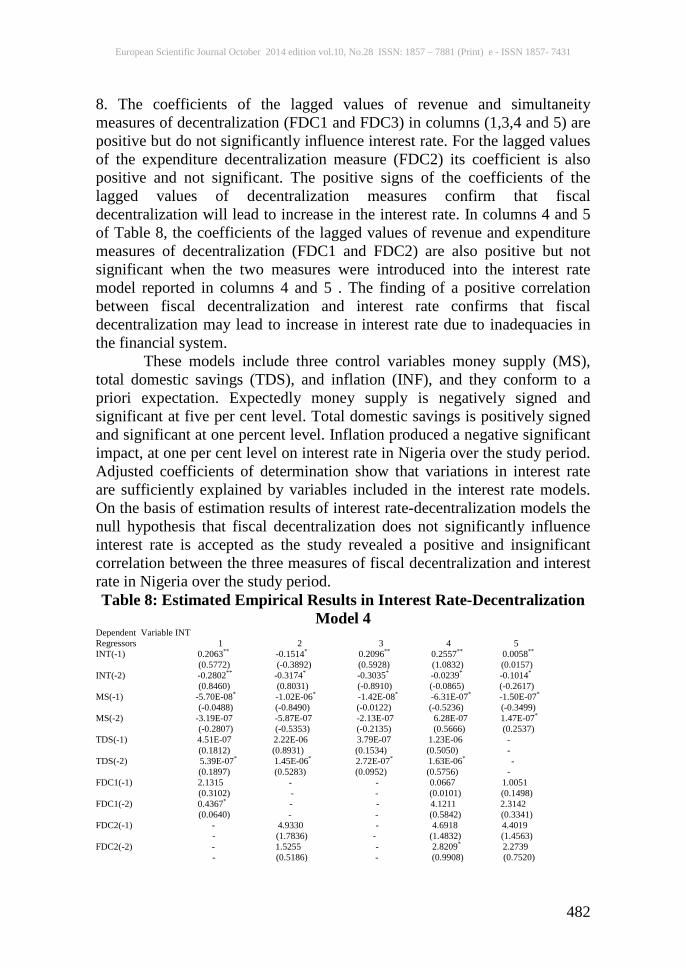
*5% level of significance; **1% level of significance 5.2.4 Interest Rate-Decentralization VAR estimation results for equations 38-42 in interest rate-decentralization model 4 are reported in Table 8. The three measures of decentralization, revenue measure (FDC1), expenditure measure (FDC2), and simultaneity measure (FDC3) are positively correlated with interest rate but not significant at one per cent and five per cent level as shown in Table
European Scientific Journal October 2014 edition vol.10, No.28 ISSN: 1857 – 7881 (Print) e - ISSN 1857- 7431
482
8. The coefficients of the lagged values of revenue and simultaneity measures of decentralization (FDC1 and FDC3) in columns (1,3,4 and 5) are positive but do not significantly influence interest rate. For the lagged values of the expenditure decentralization measure (FDC2) its coefficient is also positive and not significant. The positive signs of the coefficients of the lagged values of decentralization measures confirm that fiscal decentralization will lead to increase in the interest rate. In columns 4 and 5 of Table 8, the coefficients of the lagged values of revenue and expenditure measures of decentralization (FDC1 and FDC2) are also positive but not significant when the two measures were introduced into the interest rate model reported in columns 4 and 5 . The finding of a positive correlation between fiscal decentralization and interest rate confirms that fiscal decentralization may lead to increase in interest rate due to inadequacies in the financial system. These models include three control variables money supply (MS), total domestic savings (TDS), and inflation (INF), and they conform to a priori expectation. Expectedly money supply is negatively signed and significant at five per cent level. Total domestic savings is positively signed and significant at one percent level. Inflation produced a negative significant impact, at one per cent level on interest rate in Nigeria over the study period. Adjusted coefficients of determination show that variations in interest rate are sufficiently explained by variables included in the interest rate models. On the basis of estimation results of interest rate-decentralization models the null hypothesis that fiscal decentralization does not significantly influence interest rate is accepted as the study revealed a positive and insignificant correlation between the three measures of fiscal decentralization and interest rate in Nigeria over the study period. Table 8: Estimated Empirical Results in Interest Rate-Decentralization
Model 4 Dependent Variable INT Regressors 1 2 3 4 5 INT(-1) 0.2063** -0.1514* 0.2096** 0.2557** 0.0058** (0.5772) (-0.3892) (0.5928) (1.0832) (0.0157) INT(-2) -0.2802** -0.3174* -0.3035* -0.0239* -0.1014* (0.8460) (0.8031) (-0.8910) (-0.0865) (-0.2617) MS(-1) -5.70E-08* -1.02E-06* -1.42E-08* -6.31E-07* -1.50E-07* (-0.0488) (-0.8490) (-0.0122) (-0.5236) (-0.3499) MS(-2) -3.19E-07 -5.87E-07 -2.13E-07 6.28E-07 1.47E-07* (-0.2807) (-0.5353) (-0.2135) (0.5666) (0.2537) TDS(-1) 4.51E-07 2.22E-06 3.79E-07 1.23E-06 - (0.1812) (0.8931) (0.1534) (0.5050) - TDS(-2) 5.39E-07* 1.45E-06* 2.72E-07* 1.63E-06* - (0.1897) (0.5283) (0.0952) (0.5756) - FDC1(-1) 2.1315 - - 0.0667 1.0051 (0.3102) - - (0.0101) (0.1498) FDC1(-2) 0.4367* - - 4.1211 2.3142 (0.0640) - - (0.5842) (0.3341) FDC2(-1) - 4.9330 - 4.6918 4.4019 - (1.7836) - (1.4832) (1.4563) FDC2(-2) - 1.5255 - 2.8209* 2.2739 - (0.5186) - (0.9908) (0.7520)

European Scientific Journal October 2014 edition vol.10, No.28 ISSN: 1857 – 7881 (Print) e - ISSN 1857- 7431
483
FDC3(-1) - - 2.1387 - - - - (0.2210) - - FDC3(-2) - - 5.3979 - - - - (0.5987) - - INF(-1) -0.0085 -0.0193 -0.0104 - -0.0157 (-0.5343) (-1.2377) (-0.6595) - (-0.9962) INF(-2) 0.0007* -0.0054** 0.0016** - -0.0004 (0.0512) (-0.3635) (0.1055) - (-0.0260) C 1.1948 3.1746 1.2342 1.5425 2.4099 (1.6284) (1.8885) (1.7024) (1.6467) (1.4895) Observations 31 31 31 31 31 Adj. R2 0.811 0.821 0.8103 0.7801 0.8014 F-Statistic 15.012 15.912 15.410 13.910 14.5010 Log-Likelihood -79.410 -78.551 -79.038 -82.632 -79.946 Akaike AIC 5.318 5.268 5.296 5.448 5.349 Source: Computed from E-View 7.0 Notes Figures in parentheses are standard errors
*5% level of significance , **1% level of significance 6.0 Conclusion The question of whether fiscal decentralization challenges could be responsible for poor macroeconomic performance in Nigeria has been extensively investigated in this study. The application of the Vector Autoregressive (VAR) estimator with lagged decentralization variables to a set of dynamic time series data models has proved quite intuitive, robust, and immensely suitable. The results presented in this study clearly show how fiscal decentralization impacted on macroeconomic performance in Nigeria and it equally provides a menu of policy options to be employed to address the question of underperformance relating to fiscal decentralization. The study suggests that faster economic growth may constitute additional benefit of fiscal decentralization beyond those already well recognized. The study also show that the practice of fiscal federalism in Nigeria has been inhibited by a number of factors, chief of which is long years of military rule from 1966 to 1999 that led to the centralization of fiscal operations. Besides, the study also reveals a limited degree of fiscal decentralization in Nigeria. Another striking finding in this study is the fact that fiscal decentralization is good for growth and bad for development. Decentralization and financial autonomy are essential features of fiscal federalism. Sub national governments need to be given access to adequate resources to effectively do the job with which they are entrusted. At the same time they must also be accountable for what they do with the resources. To achieve the relevant policy objectives that relate to ensuring a stable fiscal federalism, questions on how to organize intergovernmental fiscal systems should be pragmatically addressed. These objectives include efficient allocation of resources, income distribution and macroeconomic stabilization. The attainment of these objectives will ensure macroeconomic stability. Finally, all policy changes proposed to address the challenges of fiscal federalism must be vigorously pursued so that macroeconomic stability is not jeopardized in the short and long run.

European Scientific Journal October 2014 edition vol.10, No.28 ISSN: 1857 – 7881 (Print) e - ISSN 1857- 7431
484
References: Afolabi, L (1999). Monetary Economics.Ibadan:Intec Printers Limited, 357-62. Akai, N. and M. Sakata (2002). Fiscal Decentralization Contributes to Economic Growth: Evidence from State-Level Cross Section data for the United States, Journal of Urban Economics, 52, 93-108. Aigbokhan, B.E.(1996). Government Size and Economic Growth: The Nigerian Experience Proceedings of the Annual Conference of the Nigerian Economic Society, 505-523. Aigbokhan, B.E. (1999).Fiscal Federalism and Economic Growth in Nigeria. In: Fiscal Federalism and Nigeria’s Economic development. Proceedings of the Annual Conference of the Nigerian Economic Society, 333-352. Anyanwu, J.C.(1995). Nigerian Fiscal Federalism: Concepts Issues and Problems, Paper Presented at the National Workshop on Additional Sources of Revenue for Federal State and Local Governments Organized by NCEMA, Ibadan, May 7-19, 1995. Anyanwu, J. C (1999). Fiscal Relations among the various Tiers of Government in Nigeria .In: Fiscal Federalism and Nigeria’s Economic Development, Ibadan Nigeria. The Nigerian Economic Society, 119-114. Ariyo, A. (1993). An Assessment of the Sustainability of Nigeria’s Fiscal Deficit: 1970-1990, Journal of African Economics,2,263-282. Artis, M. (2006).Alternative Transitions to EMU, Economic Journal, 106, 1005-1015. Austin, D.A. (2006).The Price of Nationalism: Evidence from the Soviet Union, Public Choice, 87, 1-18. Bahl, R.W. and J. Linn (1994). Fiscal Decentralization and Intergovernmental Transfers in Less Developed Countries, The Journal of Federation, 24 (1), 1-19. Barro, R. (1990). Government Spending in a Simple Model of Endogenous Growth, Journal of Political Economy, 98, S103-S125. Brandt, L. and X. Zhu (2000). Redistribution in a Decentralized Economy: Growth and Inflation in China under Reform, Journal of Political Economy, 108, 422-439. Brennan, G. and J. M. Buchanan.(1980).The Power to Tax: Analytical Foundations of a Fiscal Constitution. Cambridge. UK: Cambridge University Press. Boadway, R. W. (1992).The Constitutional Division of Powers: An Economic Perspective: Ottawa Economic Council of Canada. Bruecker, J. K. (1999). Fiscal Federalism and Capital Accumulation. Journal of Public Economic Theory, 1, 205-224. Chete, L.N.(1998). Fiscal Decentralization and Macroeconomic Management, 6, (1), 91-114.

European Scientific Journal October 2014 edition vol.10, No.28 ISSN: 1857 – 7881 (Print) e - ISSN 1857- 7431
485
Cremer, H., Fourgeaud, M. L. M., Merchand, M.and P.Pestieau (1995).Mobility and Redistribution: A Survey, (Unpublished). Davoodi, H. and H. Zou (1998).Fiscal Decentralization and Economic Growth: A Cross- Country Study. Journal of Urban Economics, 43, 244-257. Egwaikhide, F. O., Chete, L. N. and G. O. Falokun.1(1994). Exchange Rate Depreciation, Budget Deficit and Inflation-The Nigerian Experience. AERC Research Paper, No. 26, November, Nairobi. Ehdaie,J.(1994).Fiscal Decentralization and the Size of Government: An Extension with Evidence from Cross-Country Data. Policy Research Working Paper 1387, December, The World Bank. Ekpo, A. H. (1994). Fiscal Decentralization and the Size of Government: An Extension with Evidence from Cross-Country Data. Policy Research Working Paper 1387, World Bank, December. Feltenstein,A. and S. Iwata.(2005). Decentralization and Macroeconomic Performance in China: Regional Autonomy has its Costs. Journal of Development Economics, 76, 481-501. Ige,C.S.(2006).Macroeconomics of Commercial Banks Re-Capitalization in Nigeria. Covenant Journal of Business and Social Sciences, 1 (1), December, 5-19. Ike,D.N. (1981).Towards an Optimal Formula for Revenue Allocation in Nigeria. The Nigerian Journal of Development Studies,1(2), 104-109. Kwon, O. (2003). Macroeconomic Management and Intergovernmental Relations in Korea. Public Budgeting and Finance, 9, (2), 41-60. Layard, P. R. G. and A. A. Walters. (1978). Macroeconomic Theory. London: McGraw-Hill (UK) Ltd. Jin, H., Qian, Y. and B. R. Weingast. (1999). Regional Decentralization and Fiscal Incentives: Federalism, Chinese Style. Stockholm: Nobel Symposium in Economics, September. Joulfaian, D. and L. M. Marlow. (1990). Government Size and Decentralization: Evidence from Disaggregated Data. Southern Economic Journal, 56 (4). Lardy, N. R. (1998). China’s Unfinished Economic Revolution. Brooking Institution Press, Washington, D. C. Martin, A. M. and W. A. Lewis. (1956). Patterns of Public Revenue and Expenditure. Manchester School of Social Studies, September, 203-244. Mbanefoh, G.(1993).Unsettled Issue in Nigerian Fiscal Federalism and the National Question. Proceedings of the 1993 NES Annual Conference, 61-77. Morrison, T. K. (1982), Structural Determinants of Government Budget Deficits in Developing Countries. World Development, 10 (6), 467-473.
European Scientific Journal October 2014 edition vol.10, No.28 ISSN: 1857 – 7881 (Print) e - ISSN 1857- 7431
486
Musgrave, R. A. (1959). The Theory of Public Finance. New York: McGraw-Hill. Musgrave, R. A. (1983). Who Should Tax where what? In: Tax Assignment in Federal Countries. Charles Mclure, Jr (ed). Canberra: Centre for Research on Federal Financial Relations, ANU. Musgrave, R. A. and P. B. Musgrave.(1989). Public Finance in Theory and Practice, 5th ed. Singapore: McGraw-Hill. Musgrave, R. A. and P. B. Musgrave.(1989). Public Finance in Theory and Practice, International Edition. Singapore: McGraw-hill Book Coy. Naughton, B. (1995). Growing out of the Plan: Chinese Economic Reform. Cambridge University Press, New York, 1978-1993. Nelson, M. A. (2006).Searching for Leviathan, Comments and Extension. American Economic Review,77 (1), 198-204. Ojo, M. O. and T. O. Okunrounmu (1992).Why Fiscal Policies matter in African Countries. Economic and Financial Review, Central Bank of Nigeria, 30 (4). Oyejide, T. A. (1972). Deficit Financing, Inflation and Capital Formation: An Analysis of the Nigerian Experience, 1959-1970. The Nigerian Journal of Economic and Social Studies,14, 22-43. Peacock, A. T. and J. Wiseman.(1961).The Growth of Public Expenditure in the United Kingdom Oxford University Press, London. Oates, W. E. (1972).Fiscal Federalism. New York: Harcourt Brace Jovanovich. Oates, W. E. (1993). Fiscal Decentralization and Economic Development. National Tax Journal,46, 37-243. Prud’homme, R.(1994).Decentralization and Economic Growth. The World Bank, Unpublished Manuscript. Prud’homme, R.(1995).The Dangers of Decentralization. The World Bank Research Observer, 10, 201-26. Ram, R. (1986). Government Size and Economic Growth: A New Framework and some Evidence From Cross-Section and Time-Series. American Economic Review, 76 (1), 191-202. Rodden, J. (2001). Reviving Leviathan: Fiscal Federalism and the Growth of Government, Unpublished Manuscript, Cambridge, MA: MIT. Rodden, J. and E. Wibbles.(2001). Federalism and Macroeconomic Management. Cambridge, MIT Press. Rivlin, A. M. (1991). Distinguished Lecture on Economics in Government: Strengthening The Economy by Rethinking the Role of Federal and State Governments. Journal of Economics Perspectives, 5 (2), 3-14. Sarah,O.A.,J.O.Ebajemito., S. C. Rapu and M. Tule, (2003). Fiscal Federalism and Macroeconomic Governance. In: Contemporary Economic
European Scientific Journal October 2014 edition vol.10, No.28 ISSN: 1857 – 7881 (Print) e - ISSN 1857- 7431
487
Policy Issues in Nigeria. Nnanna, O. J., S. O. Alade and F. O. Odoko (eds). Central Bank of Nigeria. Stigler, G. J. (1957).The Tenable Range of Functions of Local Government. In: Federal Expenditure Policy for Economic Growth and Stability: US Congress Joint Economic Committee ed. Washington, DC: Government Printing Office. Taiwo, I. O. (1999).Fiscal Federalism: A Theoretical Framework. A Paper Presented at the Annual Conference of the Nigerian Economic Society, 3-23. Tanzi, V. (1995). Fiscal Federalism and Decentralization: A Review of some Efficiency And Macroeconomic Aspects. In: Annual World Bank Conference on Development Economics. Bruno,M. and B, Pleskovic, eds. World Bank, 317-322. Ubogu, R. (1982). Fiscal Decentralization and Economic Development among Nigerian States, Nigerian Journal of Economic and Social studies, 24 (1) , 1-21. Varian, H. R. (1990). Intermediate Microeconomics: A Modern Approach. Norton and Company 2nd ed. Wantchekon, L. and T. Asadurin. (2002). Transfer Dependence and Regional Disparities: The case of Nigeria. Paper Presented at the Federalism Conference, June 6-7, Standford University. Wellisch, D. and D. E. Wildasin (1996).Decentralized Income Redistribution and Immigration, European Economic Review, 40, 101-133. Wheare, K. C. (1963). Federal Government, 4th edition. N. Y.: Oxford University Press. Wildasin,D.(1997).Externalities and Bailouts: Hard and Soft Budget Constraints in Intergovernmental Fiscal Relations. Washington DC: World Bank Policy Research Working Paper 1843. Yilmaz, S. (1999).The Impact of Fiscal Decentralization on Macroeconomic Performance: Prepared for the 92nd Annual Conference on Taxation, Atlanta, GA, 24-26 October for the Session on Fiscal Decentralization in Transition Countries: The Role of Local Democratic Governance. Yussuf, S.(1994).China’s Macroeconomic Performance and Management during Transition. Journal of Economic Perspectives, 8, 71-92.

European Scientific Journal October 2014 edition vol.10, No.28 ISSN: 1857 – 7881 (Print) e - ISSN 1857- 7431
488
Appendix Table A: Summary of Definition of Variables and Data Sources
Variable Definition Source of Data Fiscal decentralization measure of revenue decentralization (FDC1)
Sub national own-source (internally generated) revenue as a ratio of total central (federal) revenue. Reflects the decentralization of taxing power
CBN Statistical Bulletin (2010)
Fiscal decentralization measure of expenditure decentralization (FDC2)
Sub national expenditure as a ratio of total federal expenditure. Reflects the decentralization of spending power
CBN Statistical Bulletin (2010)
Fiscal decentralization measure of simultaneous decentralization of taxing and spending powers FDC3
Sub national own-source (internally generated) revenue as a ratio of total federal expenditure. Capture the simultaneous decentralization of both powers.
CBN Statistical Bulletin (2010)
Real Gross Domestic Product (RGDP)
The broadest quantitative measure of a nation’s total economic activity. It measures, in constant (2000 naira) prices, the value of economic activity within Nigeria’s geographic borders, including all final goods and services produced over a period of time (usually a year).
World Bank (2010), Africa development indicator online
Inflation rate (INF) This is the annual percentage change in consumer price index (CPI)
World Bank (2010), Africa development indicator online
Real Exchange rate (EXC) Exchange rate index represents the relative importance of naira to all other currencies
World Bank (2010), Africa development indicator online
Real Interest rate (INT) Real interest rate is the lending interest rate adjusted for inflation as measured by the gross domestic product (GDP) deflator.
World Bank (2010), Africa development indicator online.
Money Supply (MS) Money supply is the sum of currency in circulation and demand deposit (M1) at the end of period (usually a year).
CBN Statistical Bulletin (2008)
Total Domestic Savings (TDS)
Total savings deposit of commercial banks, mortgage banks, investment and property development corporation (M3).
CBN Statistical Bulletin (2008)
Labour force (L) Total labour force, also called the economically active population, “comprises all persons of either sex who furnish the supply of labour for the production of economic goods and services.” Labour force includes people ages 15 and older who meet the International Labour Organization (ILO) definition of the economically active population
World Bank (2010), Africa development indicator online
Stock of physical capital input (K)
Stock of physical capital input per worker. The proxy for this variable is the gross fixed capital formation.
CBN Statistical Bulletin (2010)
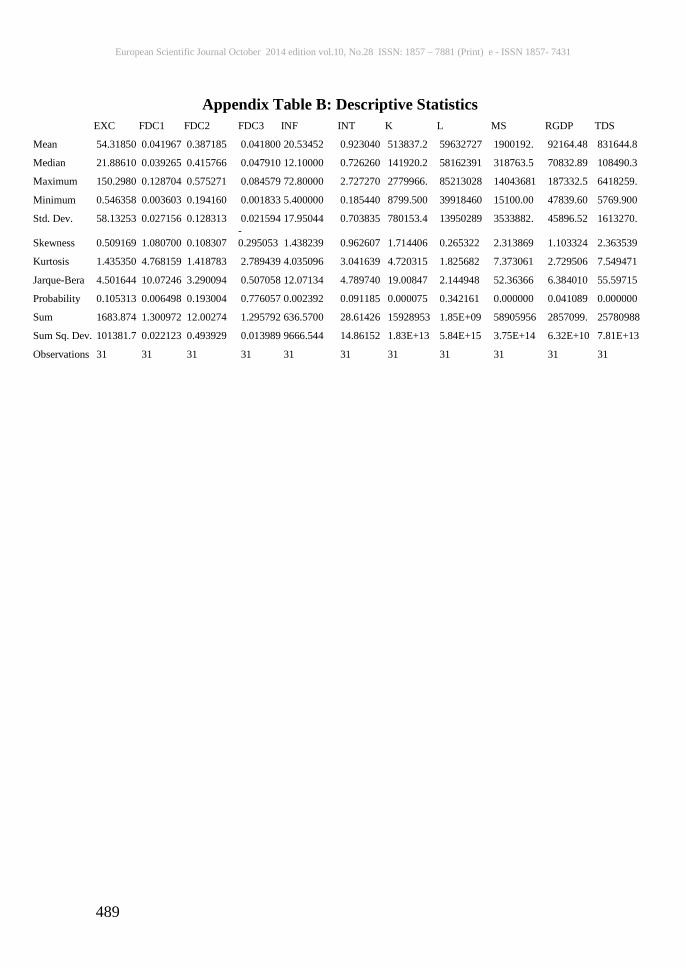
European Scientific Journal October 2014 edition vol.10, No.28 ISSN: 1857 – 7881 (Print) e - ISSN 1857- 7431
489
Appendix Table B: Descriptive Statistics EXC FDC1 FDC2 FDC3 INF INT K L MS RGDP TDS
Mean 54.31850 0.041967 0.387185 0.041800 20.53452 0.923040 513837.2 59632727 1900192. 92164.48 831644.8
Median 21.88610 0.039265 0.415766 0.047910 12.10000 0.726260 141920.2 58162391 318763.5 70832.89 108490.3
Maximum 150.2980 0.128704 0.575271 0.084579 72.80000 2.727270 2779966. 85213028 14043681 187332.5 6418259.
Minimum 0.546358 0.003603 0.194160 0.001833 5.400000 0.185440 8799.500 39918460 15100.00 47839.60 5769.900
Std. Dev. 58.13253 0.027156 0.128313 0.021594 17.95044 0.703835 780153.4 13950289 3533882. 45896.52 1613270.
Skewness 0.509169 1.080700 0.108307 -0.295053 1.438239 0.962607 1.714406 0.265322 2.313869 1.103324 2.363539
Kurtosis 1.435350 4.768159 1.418783 2.789439 4.035096 3.041639 4.720315 1.825682 7.373061 2.729506 7.549471
Jarque-Bera 4.501644 10.07246 3.290094 0.507058 12.07134 4.789740 19.00847 2.144948 52.36366 6.384010 55.59715
Probability 0.105313 0.006498 0.193004 0.776057 0.002392 0.091185 0.000075 0.342161 0.000000 0.041089 0.000000
Sum 1683.874 1.300972 12.00274 1.295792 636.5700 28.61426 15928953 1.85E+09 58905956 2857099. 25780988
Sum Sq. Dev. 101381.7 0.022123 0.493929 0.013989 9666.544 14.86152 1.83E+13 5.84E+15 3.75E+14 6.32E+10 7.81E+13
Observations 31 31 31 31 31 31 31 31 31 31 31