Embed Size (px)
Citation preview
Flow�of�Light�Energy�in�
Benthic�Photosynthetic�Microbial�Mats�
By�
Mohammad�Ahmad�A.�Al�Najjar�
A�thesis�submitted�in�partial�fulfilment�
of�requirements�for�the�degree�of�
�
DOCTOR�OF�PHILOSOPHY�IN�SCIENCE�
“Dr.�rer.�nat.“�
Faculty�of�Biology�and�Chemistry�
University�of�Bremen�
���
Bremen�
December�2010�
�
�
�
The work in this thesis was done during the period from April 2007 to
December 2010 in the Max-Planck Institute for Marine
Microbiology/Bremen, in the frame of the International Max-Planck
Research School for Marine Microbiology (IMPRS MarMic).
Supervisors:
Dr. Lubos Polerecky, Max-Planck Institute/Bremen
Dr. Dirk de Beer, Max-Planck Institute/Bremen
Examining committee members:
First reviewer: Prof. Dr. Bo Barker Jørgensen, MPI /Bremen Second reviewer: Prof. Dr. Ulrich Fischer, Universität Bremen
Member: Prof. Dr. Victor Smetacek, AWI/Bremerhaven
Member: Dr. Henk Jonkers, Delft University of Technology The Netherlands
Thesis contents
Microbial mats are extremely interesting ecosystems that have been intensively investigated
by researchers from a wide variety of fields. This can be clearly seen from the huge body of
literature examined different aspects of microbial mats including structural and functional
composition. Microbial mats are highly complex systems with micrometer scale changes in
the activity and the structural composition within in the photic zone, primarily, due to the
highly heterogeneous light field. The difficulties associated with measuring such small
changes in light field have resulted in dealing with microbial mats as a “black box”.
Therefore, important and fundamental questions such as the fate of light energy and the
energy budget inside the microbial mats, as well as the factors affecting the variations in light
utilizing efficiency between different mat ecosystems have remained unexplored.
The primary aims of this thesis were the ambitious goal of assessing the first energy
budget inside benthic photosynthetic microbial mat ecosystems and the subsequent
understanding of the “black box”. The best way to gain the needed information is by
following the fate of light energy once reaches the surface of a microbial mat. The work in
this thesis used microsensors, pigment analysis using HPLC, a combined imaging approach
(imaging PAM and hyperspectral imaging), molecular and statistical analyses to investigate
the fate of light energy inside microbial mat ecosystems. Gathering glimpses on how light
absorption is affected by mat structure and offer insights into deeper processes in the
microbenthic ecosystem. This was achieved through the three parts of the thesis:
1. Assessing the first energy budget inside a microbial mat ecosystem, demonstrating how
the budget and the spatial distribution of local photosynthetic efficiencies within the euphotic
zone depend on the absorbed irradiance. Furthermore, a model that describes light
propagation and conversion in a scattering-absorbing medium was developed. In contrast to
previous attempts, this model requires inputs from the easily measured parameters; the light
attenuation coefficient, the reflectance and the scalar irradiance (Chapter 2).
2. Comparing the efficiency of light energy utilization between the three marine benthic
photosynthetic ecosystems, and showing that maximum photosynthetic efficiency is related
to the accessory pigment/chlorophyll a ratio, depth of the photic zone and light absorption by
non-photosynthetic components relative to absorption by photopigments and the structure of
the upper layer of a given mat. This study provides first insight to how differential
composition and spatial organization of photosynthetic microbial communities affect overall
ecosystem efficiency (Chapter 3).
3. Applying a combined pigment imaging technique (variable chlorophyll fluorescence and
hyperspectral imaging) for a detailed analysis of the spatial heterogeneity in oxygenic
photosynthesis, photopigment composition and light acclimation in cyanobacterial mats.
This, in conjunction with molecular (amplified ribosomal intergenic spacer analysis) and
statistical analyses, were used to assess changes in bacterial community structure as well as
changes in functional and contextual parameters (Chapter 4). Finally, light intensity at which
maximum quantum efficiency, Emax, and half of quantum efficiency, E1/2, were used instead
of the parameter Ek to evaluate light acclimation state in cyanobacterial mats (Chapter 4).
Acknowledgements
My highest appreciation goes to my direct supervisor Dr. Lubos Polerecky, for the
time and the information that he kindly provided during my PhD. I do highly thank
Dr. Dirk de Beer for offering me this chance to do this work in the microsensor
group, in addition to his active participation in the PhD committee meetings,
discussions and improving the manuscript for the published paper. I deeply
appreciate the continuous support and encouragements that I received from Prof. Dr.
Bo Barker Jørgensen and for his constant interest in my work. I appreciate him
because he accepted being my ‘Doktorvater’. Prof. Dr. Ulrich Fischer is also thanked
for being the second reviewer of my thesis. I further thank, Prof. Dr. Michael Kühl
for his continuous interest in my work, his comments and suggestions are particularly
appreciated. The fruitful discussions with Prof. Dr. Friedrich Widdel, Dr. Henk
Jonkers, and Dr. Alban Ramette are highly acknowledged. I do thank Prof. Dr.
Waleed Hamza from UAE University, as well as, Dr. Alistair Grinham for the fruitful
collaborations and supplying the samples. I also thank technicians of the microsensor
group at MPI for being always helpful, building the microsensors and their smile
faces always. Many thanks to my colleagues in “microsens” for the friendly work
atmosphere. I also thank Abdul monem Al-Raei for his support and for being always
there, ready to provide help. I thank the MarMic graduate school, especially Dr.
Christiane Glöckner, for the supportive and pleasant atmosphere. The continuous
support and prayers from my parents in Jordan is one of the important energy sources
that powered my motivation during my PhD. The last but not the least, I can’t find
enough words suitable to acknowledge the support, encouragements, spiritual
motivation and patience I gained, without conditions, from my greatest family; my
(w/l)ife Siham and the greatest kids (Malek, Moath and Bushra). The financial
support from Yosuf Jameel scholarship and the MPI-Bremen is highly appreciated.
Bremen, December 2010

�����: �� �� ������� ���� ����� ������ ���� /�����!�� ��"���� �#�����
��$ �$�%&�� $�'* +5* 6�$ ��8 9���� �<= >�=*� ?�@ ><�� ����� 9@ +� O�Q ><�� �X�
�����%�� +Z��$� ����" +[ ���� . \'�@ +Z�� O�]� +Z��^� _����#�� >���� ��8 ���=* ��@
_������ �=* _� >�`�*� +��' +5* �!'* ?* {�|Z�* `� �+Z��$� ���@} _��%~����
��~"� ����� ����
$�%&�� ���* ����
���!�� 2010
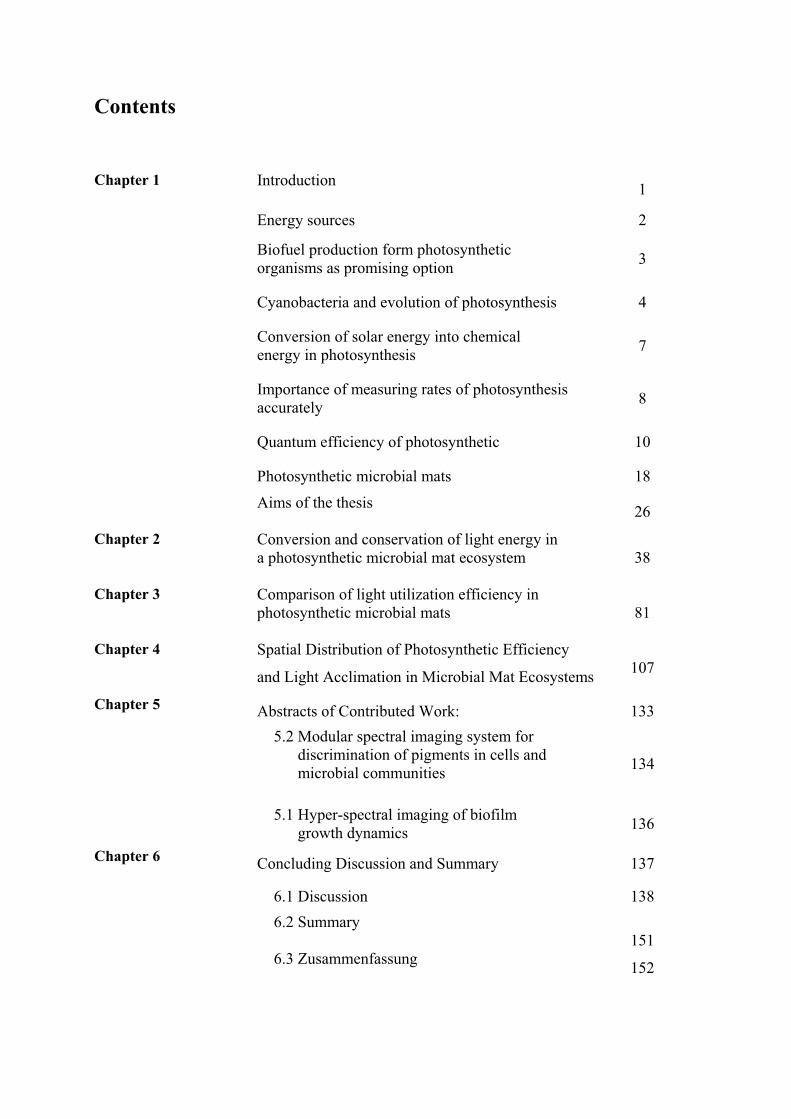
Contents
Introduction 1
Energy sources 2
Biofuel production form photosynthetic organisms as promising option 3
Cyanobacteria and evolution of photosynthesis 4
Conversion of solar energy into chemical energy in photosynthesis 7
Importance of measuring rates of photosynthesis accurately 8
Quantum efficiency of photosynthetic 10
Photosynthetic microbial mats 18
Chapter 1
Aims of the thesis 26
Chapter 2 Conversion and conservation of light energy in a photosynthetic microbial mat ecosystem
38
Chapter 3 Comparison of light utilization efficiency in photosynthetic microbial mats
81
Chapter 4 Spatial Distribution of Photosynthetic Efficiency
and Light Acclimation in Microbial Mat Ecosystems 107
Abstracts of Contributed Work: 133 5.2 Modular spectral imaging system for
discrimination of pigments in cells and microbial communities
134
Chapter 5
5.1 Hyper-spectral imaging of biofilm growth dynamics 136
Concluding Discussion and Summary 137
6.1 Discussion 138
Chapter 6
6.2 Summary 151 6.3 Zusammenfassung 152


Chapter 1 Introduction
Chapter 1
Introduction
1
M. Al-Najjar Flow of light energy in microbial mats
Energy Sources
The global consumption of energy, obtained mainly from fossil fuel and nuclear power with
a small contribution from renewable energy sources, is continuously increasing, but the
available energy sources are substantially decreasing (Lewis and Nocera 2006).
Furthermore, the use of fossil fuel has implications on the atmosphere by increasing the
CO2 partial pressure, exacerbating the greenhouse effect that results in accelerated global
warming accompanied by a number of threats to life (Macdonald 2010). This effect can be
followed by tracing the CO2 concentrations, which have risen significantly over the past 50
years, and are currently 380 ppm (Lewis and Nocera 2006), compared to 180-260 ppm for
the past 430,000 years (Siegenthaler et al. 2005). On the other hand, one hour of incoming
solar energy delivers more than the annual global energy consumption on Earth. About
3.8�1024 J of solar energy is absorbed by the Earth's surface and atmosphere every year.
The total energy consumption of humans in 2007 was 0.01% of this flux, whereas the
primary productivity of global ecosystems is estimated at around 0.1% (Makarieva et al.
2008).
This stimulated the idea of using solar energy as an alternative energy source.
However, it must be converted to a form that can be easily used (i.e., chemical, heat or
mechanical energy), stored and dispatched on demand. This represents a real challenge for
the scientists and engineers to find processes (or mechanisms) that capture, transform and
store solar energy with high efficiency (Lewis and Nocera 2006). Furthermore, it is
extremely important to reduce dramatically the cost per Watt (W), to make it economically
competitive with the other energy sources. Nevertheless, it is also crucial to change (lower)
energy consumption rate of the civilization in order to decrease the potential environmental
change, as it is incorrectly assumed that it could be prevented if there was a switch to clean
energy resources (Makarieva et al. 2008). In this case, the available renewable energy (such
2
Chapter 1 Introduction
as river-based hydropower, wind power, tidal power, solar power, etc.) could in total ensure
no more than one tenth of the modern energy consumption rate (Makarieva et al. 2008).
There are several potential ways to generate large amounts of carbon-neutral energy. These
are:
(i) Nuclear fission: the disadvantages are human safety, the need of the
widespread implementation of the breeder reactors and the limited amount of
the uranium.
(ii) The conversion of solar energy, which could be done either by photovoltaic
cells (Lewis and Nocera 2006) or by the use of photosynthetic organisms in
biofuels production.
Biofuels Production by Photosynthetic Organisms as Promising Option
Biofuels (biodiesel) are clean fuels produced from photosynthetic organisms, vegetable oils,
or animal fats. It is produced by transesterification of oils with alcohols or by esterification
of fatty acids (Vasudevan and Briggs 2008). Because of limited petroleum reserves and the
environmental consequences resulting from combustion of gases, biodiesel production has
emerged as a viable alternative for generating environmentally friendly energy, (Ragauskas
et al. 2006; Mussgnug et al. 2007; Dismukes et al. 2008; Rosenberg et al. 2008). There are
many research priorities that aim to increase light utilization efficiency by photosynthesis in
different photosynthetic organisms. For example, genetic engineering of Rubisco to
increase its specificity towards CO2 compared to O2 either by mutagenesis is one of them
(Satagopan and Spreitzer 2008), transplantation of cyanobacterial genes that are associated
with rate-limiting steps in carbon fixation and over-expressing them in higher plants is
another (reviewed in Vasudevan and Briggs 2008).
3
M. Al-Najjar Flow of light energy in microbial mats
Recently, more attention has been paid to the use of algae and cyanobacteria as
promising source of biodiesel. There are many advantages of using them over the traditional
plant crops. Their productivity per area is higher, they grow faster and they don’t compete
with food crops for human consumption. Interestingly, they can thrive in lower quality
water (e.g. the effluent of waste water treatment facilities, or saline water), and remove CO2
and NOx gases that are produced by combustion (e.g. coal-fired power station emissions).
Moreover, any algal species produces valuable products, such as colorants, polyunsaturated
fatty acids and bioactive compounds, which can be used in food and pharmaceutical
industries (Brown and Zeiler 1993; Ragauskas et al. 2006).
The major technical challenges regarding these systems are to (i) sustain highest
photosynthesis and biomass productivity, (ii) reduce cell damage by hydrodynamic stress,
(iii) reduce costs in fabrication, installation, and maintenance, and (iv) increase the
capability of the system to expand to an industrial scale production (Brown and Zeiler
1993). Therefore, it is of vital importance to fully understand photosynthesis, including
limitations of light utilization efficiency, or the conditions by which the highest yield of
biomass production is achieved with the lowest possible damage or energy losses from the
photosynthetic system. The base of such knowledge can be gained from naturally occurring
ecosystems and the adaptations that they have developed to cope with environmental
conditions.
Cyanobacteria and Evolution of Photosynthesis
Photosynthesis is the mechanism for converting solar energy into chemical energy stored in
phototrophic organisms such as plants, algae or photosynthetic bacteria. Once stored, the
organic material can serve as food for heterotrophic organisms, or can be further converted
to other forms of usable energy such as fuel (Ragauskas et al. 2006).
4
Chapter 1 Introduction
At the beginning of life on Earth and because of the reduced state of oceans and the
atmosphere, anoxygenic photosynthesis has evolved first. Photosynthetic bacteria at that
time used the reduced iron (Fe2+) and hydrogen sulfide as a source of electrons and the light
as a source of energy to fix inorganic carbon. Anoxygenic photosynthetic organisms occur
in the domain of Bacteria and have representatives in four phyla: Purple Bacteria, Green
Sulfur Bacteria, Green Gliding Bacteria, and Gram Positive Bacteria (Whitmarsh and
Govindjee 1999).
The release of O2 by photosynthesis in cyanobacteria has had a profound effect on the
evolution of life. Initially, the released O2 reacted with ferrous iron in the oceans and was
not released into the atmosphere. Geological evidence indicates that the ferrous iron was
depleted around 2 billion years ago, and the Earth's atmosphere became aerobic (Whitmarsh
and Govindjee 1999). Although there is widespread agreement on the importance of the
emergence of oxygenic photosynthesis, the timing of this event is intensely debated. Fossil
evidence indicates that cyanobacteria existed over 3 billion years ago and it is thought that
they were the first oxygen evolving organisms on Earth (Wilmotte 1994). However, other
evidence suggests that oxygenic photosynthesis evolved and radiated shortly before
snowball (the time when earth was covered with show), including geological features such
as red beds, lateritic paleosols, and the return of sedimentary sulfate deposits that occurred
shortly before the snowball Earth (2.3-2.2 Ga), massive deposition of manganese after the
snowball that required huge quantities of O2 to occur. Additional evidence is provided by
the cyanobacterial growth model incorporating the expected fluxes of carbon, iron and
phosphate at that time (Kopp et al. 2005). Allen and Martin (2007) claimed the emergence
of oxygenic photosynthesis to be between 2.3 billion years ago (based on geological record
of oxygen in the atmosphere) and 3.4 billion years ago (based on the record of carbon
deposition). However, the extensive carbon deposition in the latter complement could be
5
M. Al-Najjar Flow of light energy in microbial mats
explained by the incorporation of anoxygenic photosynthesis (Olson 2006). Regardless of
the exact time when it proliferated, oxygenic photosynthesis had a crucial role in shifting
global biogeochemical cycles, the appearance of oxic ocean layers and subsequent presence
of oxygen in the atmosphere that allowed the evolution and proliferation of aerobic life-
forms on land.
Cyanobacteria, as other bacteria, are very successful in developing strategies to adapt
to ever changing environmental conditions and habitats throughout their life history. Whilst
there have been large scale extinction events in eukaryotes, bacteria have remained
relatively persistent. This is mainly, because of the following:
1. They have versatile metabolic pathways, thus produce energy (ATP) from a wide range
of fuels (organic and inorganic compounds) and oxidants (oxygen, nitrate, iron III,
Arsen IV, Selenium VI, etc.). However, non-photosynthetic eukaryotes gain their
energy from a short list of reduced compounds (glucose, pyruvate, etc.) and the only
electron acceptor that they can use is oxygen.
2. They have “feast or famine” mode of existence and can tolerate long periods of
starvations lasting several months to years. To achieve this they have developed unique
strategies to combat starvation periods, for example:
a. Marked alterations in their cellular ultra-structure, such as production of endospores
or cysts. Members of this group of bacteria are called the differentiating bacteria.
b. Non-differentiating bacteria decrease in cell size, shrink their protoplast, in addition
to altering their gene expression and changing their mode of life from planktonic to
sessile (e.g. biofilm formation).
6

Chapter 1 Introduction
3. Some bacteria evolve “pack rat” strategy by storing reserve materials including
glycogen-like polysaccharides, polyhydroxybutarate, polyphosphate, and sulfur to
persist during famine conditions (reviewed in Guerrero et al. 2002).
Conversion of Solar Energy into Chemical Energy by Photosynthesis
Photosynthesis (PS) is considered as one of the oldest biological processes and is one of the
most important mechanisms that support life on our planet. It is therefore highly conserved
and tightly controlled to preserve its vital role in the primary producers that form the basis
of the food webs. For example, oxygenic photosynthesis involves about 100 proteins that
are highly ordered within photosynthetic membranes of the cell (Allen and Martin 2007).
To convert solar energy into chemical energy in plants, algae and cyanobacteria, two
reactions � the light reaction and the dark reaction � must occur in sequence. PS starts when
the light quanta are absorbed by light harvesting pigments (e.g., chlorophyll) in the light
reaction, during which the energy from the light and electrons from water oxidation are
transformed into chemical energy (ATP) and reducing power (NADPH). In the dark
reaction, CO2 is fixed into organic material by the reducing power and the chemical energy
obtained during the light reaction. In the case of oxygenic photosynthesis, an oxygen
molecule is evolved as a by-product of water oxidation, leading to the ‘regeneration’ of
electrons lost from the photosystem II (PSII) (oxygenic photosynthesis; Falkowski and
Raven 1997). Anoxygenic photosynthesis is performed by other types of bacteria that use
light energy to create organic compounds but do not produce oxygen. These organisms lack
PSII, in which water oxidation and subsequent O2 evolution occur, and only have
photosystem I (PSI).
Trapping solar radiation in photosynthetic organisms is facilitated by pigments, which
are molecules that absorb specific wavelengths (energies) of light and reflect all others
7
M. Al-Najjar Flow of light energy in microbial mats
(Falkowski and Raven 1997). When excited, the reaction centre needs to return to its
normal lower energy level. In order to do this it must get rid of the energy that has put it
into the higher energy state to begin with. This can happen in several different ways:
1) The extra energy can be converted into molecular motion and lost as heat.
2) Some of the extra energy can be lost as heat energy, while the rest is lost as light
(fluorescence).
3) The energy, but not the electron itself, can be passed onto another molecule. This is
called resonance.
4) The energy and electron can be transferred to another molecule.
Pigments of phototrophs usually utilize the last two of these reactions to convert the sun's
energy into their own. When chlorophyll a is isolated from the enzymes it is associated with
the second scenario.
Importance of Measuring Photosynthetic Rates Accurately
In an era when atmospheric CO2 levels are rising rapidly due to human activities,
understanding the role of phototrophs in the global carbon cycle is becoming more
important than ever. The question of how to accurately measure the primary productivity of
these organisms is critical in determining their potential role in carbon drawdown and
cycling (Beardall et al. 2009). Furthermore, finding renewable energy sources, (i.e.
environment-friendly) that have less negative impact on our atmosphere and at the same
time do not threaten resources, has been a prime concern for scientists around the world.
This has resulted in algae-based biofuel emerging as a viable environmentally friendly
energy source. In addition, marine ecosystems account for 50% of the annual global carbon
assimilation (Falkowski and Raven 1997) and, therefore, it is arguably important to enhance
our understanding of the photosynthetic marine ecosystems.
8
Chapter 1 Introduction
There should be special emphasis on the question of how to accurately measure the
primary productivity of these organisms, as this is critical in determining their potential role
in carbon drawdown and cycling. The main techniques used to measure either net or gross
photosynthesis have been recently summarized (reviewed, Beardall et al. 2009). The most
important techniques are listed below:
(i) Radioactive and stable carbon isotopes (14C and 13C): the uptake of the radioactive
14C have been used for almost 60 years, after Steeman Nielson first described the
method in 1952 (Williams et al. 2002). More recently, a method using the stable
isotope 13C has been developed (Miller and Dunton 2007; Beardall et al. 2009).
(ii) The use of O2 isotopic tracers: this method uses 18O-labelled water (Bender et al.
1999), or the 17O/18O ratio of atmospheric O2 to estimate the gross productivity of
the ocean.
(iii) Direct measurement of gas exchange using infrared gas analysis (Johnston and
Raven 1986). However, this method is not suitable for high pH or marine systems
(Beardall et al. 2009).
(iv) Photoacoustics: this method is based on measuring pressure waves created from
heat dissipation after exposure of photosynthetic cells to light pulses. The
magnitude of these pressure waves is accurately measured by microphones, and
can be used to estimate photosynthesis (Dubinsky et al. 1998).
(v) Fluorescence based methods: because photosynthesis is never an efficient process,
only part of the absorbed light energy is used in photochemical reactions whilst the
rest is dissipated as heat or emitted as higher wavelength light (fluorescence).
Measuring the intensity of fluorescence under certain light conditions gives an
estimation of the rate of photosynthesis. These methods include the pulse
9
M. Al-Najjar Flow of light energy in microbial mats
amplitude modulated fluorometry (PAM), fast repetition rate fluorometry (FRRE),
and fast induction and relaxation fluorometry (FIRe) (reviewed in Kühl and
Polerecky 2008; Beardall et al. 2009).
(vi) Planar O2 optode imaging: this is based on the excitation of indicator dyes (i.e
metallo-organnic complexes of ruthenium (II) or metallo-prophyrines with
platinum or palladium as a central atom) that exhibit a reversible changes in their
optical properties as a function of O2 concentration. The imaging system employs
synchronization between the blue excitation light (generated from a blue LED) and
image acquisition by a CCD camera. After calibration, O2 concentration
(photosynthesis) can be calculated from the generated images using dedicated
programs (available at www.microsen-wiki.net). This method is an excellent
choice to study photosynthesis in benthic photosynthetic systems (Bachar et al.
2008; Kühl and Polerecky 2008; Fischer and Wenzhöfer 2010).
(vii) Oxygen microsensors; these can resolve the steep concentration gradients of
dissolved O2 in microbial mats at high spatial (100 – 200 �m) and temporal (0.1 –
0.2 s) resolution (Revsbech et al. 1983; Revsbech and Jørgensen 1986). Using the
so-called light-dark shift method (Revsbech and Jørgensen 1983), O2 microsensors
can measure the volumetric rates of gross photosynthetic with a spatial resolution
of 100�200 �m.
Quantum Efficiency of Photosynthetic
The photosynthetic quantum efficiency (QE) is defined as the amount of CO2 molecules
assimilated or O2 molecules produced per number of photons absorbed. Assuming no
losses, the maximal QE of photosynthesis is 0.125. This follows from the basic photon
requirements for the amount of electrons that need to be transferred to oxidize water and
10
Chapter 1 Introduction
reduce CO2, and from the fact that this electron transfer takes place sequentially over two
reaction centers, each requiring one photon to separate one electron (a minumum of 8
photons per CO2 molecule fixed or O2 molecule produced).
The actual QE is far lower than the theoretical efficiency. Assuming no nutrients
limitations and suitable temperature and salinity, reasons for this include light intensity and
other processes whose efficiencies are independent of the rate of energy input, but whose
catalysts show phylogenetic variation leading to different energy costs in different taxa.
These costs include variations in light harvesting complexes, Rubisco and sensitivity of
PSII to photodamage (reviewed in Raven et al. 2000).
In nature, phototrophs are exposed to continuous changes in the incident irradiance
due to changes in environmental variables (such as cloud cover, water clarity, etc) and
diurnal and seasonal cycles. Therefore, they undergo dynamic adjustments based on the
incident irradiances available in their environment (photoacclimation). These include
adjustments in the absorption cross-section of the antenna system, changes in the numbers
of reaction centers and electron transport components and their relative proportions,
biochemical feed-back and feed-forward changes in the Calvin-Benson cycle, as well as
changes in the levels of enzymes involved in carbon metabolism (Falkowski and Raven
1997).
Under light limiting conditions, cellular content of light harvesting pigments such as
phycobilins, chlorophylls, fucoxanthin and peridinin increase to harvest as much light as
available. The same pigments decrease under high light, resulting in cells being rather
transparent. On the other hand, the photoprotective pigments �-carotene and astaxanthin,
and the elements of the xanthophyll cycle, increase when the cells are exposed to high
irradiance levels, concomitant with enhanced activity of the antioxidant enzymes catalase,
superoxydismutase, and peroxidase (Dubinsky and Stambler 2009). These processes are
11
M. Al-Najjar Flow of light energy in microbial mats
complemented by up to 5–fold changes in the Rubisco to photosystem unit (PSU) ratio, and
parallel changes in light-saturated photosynthetic rates. Thus, light-harvesting and
utilization efficiencies are maximized under low light, whereas photosynthetic carbon
assimilation and throughput rates reach their peak values whenever light is no longer
limiting (Dubinsky and Stambler 2009). This has resulted in the use of photosynthesis-
irradiance (P-E) curves to evaluate the effects of photoacclimation, nutrient limitation, UV
damage, genetic regulation and other sources of variability on photosynthesis (Falkowski
and Raven 1997). Several mathematical models have been developed to describe,
summarize and interpret the measured data, permitting better understanding of the
ecophysiolgy of the studied ecosystem or culture (examples, Webb et al. 1974; Jassby and
Platt 1976).
At low incident irradiances, light is the limiting factor to photosynthesis. The rate of
photosynthesis increases linearly with increasing irradiances until saturation or
compensation point. Under these circumstances the limiting factors are the light absorption
and the primary charge separation, not the intersystem electron transport (Falkowski and
Raven 1997). However, at incident irradiance above that of saturation, intersystem electron
transport does not limit photosynthesis but so does carbon assimilation by Rubisco. More
specifically, the redox state of plastoquinone (PQ) pool is the limiting factor in the electron
transport, as the half-time PQH2 oxidation is at least 4-5 times slower than the maximum
steady state reduction rate of PQ (electron per millisecond). This is still several orders of
magnitudes higher than the redox rates of the other electron carriers in the electron transport
chain (on the order of pico- to microseconds; Falkowski and Raven 1997).
The consequence of oversaturation of photosystems by excess incident irradiance is
the formation of reactive oxygen species (ROS) that affect PSII by the damaging D1 protein
and/or interfering with the cellular repair mechanisms of the damaged D1 protein (Latifi et
12
Chapter 1 Introduction
al. 2009). ROS prevents the translational elongation of psbA mRNA, which forms D1 under
normal conditions (Nishiyama et al. 2001; Nishiyama et al. 2004; Latifi et al. 2009).
Despite the apparent light dependence of chlorophyll a formation (Apel and Kloppstech
1980), high light intensities decrease the biosynthesis of chlorophyll as they severely inhibit
5-aminolevulinic acid (ALA) synthesis (Aarti et al. 2007). Furthermore, it was shown that
the genes involved in light absorption and photochemical reactions of Synechocystis sp
PCC 6803 were down-regulated within 15 min of exposure to high light intensity, whereas
those associated with CO2 fixation and protection from photoinhibition were up-regulated
(Hihara et al. 2001).�The light-harvesting catalysts involved in photosynthesis are an estimate of the
effectiveness of a given pigment-protein complex in photon absorption and excitation
energy transfer to the reaction center. This measure is independent of the amount of
available energy as photons; however, there is a constant package effect (Raven et al. 2000).
The second energy independent factor is the Rubisco cellular concentration, which is
considered to be the single most abundant enzyme in nature as it makes up 5-50% of the
total soluble proteins in the photosynthetic cells. Rubisco is able to react with O2 as well as
to CO2 and has low specific reaction rates (Vmax at 25° C does not exceed 60 mol CO2 mol-1
enzyme s-1) compared to other enzymes (Falkowski and Raven 1997) which could explain
why Rubisco is so abundant in cells.
There are many more factors causing the decrease in PS energy efficiency:
(i) the capture of photons by photopigments and channeling of their energy to
the reaction center is inefficient,
(ii) photons may be absorbed by cell components and accessory pigments that
are not photosynthetically active,
13
M. Al-Najjar Flow of light energy in microbial mats
(iii) excess excitation energy is dissipated as heat by non-photochemical
quenching processes, and
(iv) part of the energy stored in the light-dependent reaction is used for
processes other than CO2 fixation (Schneider 1973; Huner et al.
1998;Osmond 1994; Zhu et al. 2008).
In benthic photosynthetic systems such as cyanobaterial mats or microphytobenthic
biofilms, additional relevent factors include the proportion of the light energy that is
absorbed abiotically (e.g., by sediment particles or Fe precipitates) or biotically but by
photosynthetically inactive components (e.g., protective sunscreen pigments, detritus or
phaeopigments). Consequently, the true photosynthetic efficiency of phototrophic cells
comprizing the mat is likely higher than estimated from measurements. Furthermore, there
are other processes at the cellular level that may cause uncoupling between light utilization,
O2 production and CO2 fixation, and thus affect the estimated QE, and subsequently may
have effect on the overall energy budget. These include:
(i) Cyclic electron flow in PSI and PSII:
In cyclic electron flow in PSI, the electrons can be recycled from either reduced
ferredoxin or NADPH to plastoquinone and subsequently to the cytochrome b6/f
complex, generating a pH gradient across the membrane and allowing ATP
production (Falkowski and Raven 1997). This process is essential to ensure linear
electron flow and maintain the correct ATP/NAPDH production ratio, preventing the
accumulation of NADPH, which will cause over-reduction (Munekaga et al. 2004).
This process is essential in non-photochemical quenching (NPQ) of Chl fluorescence,
a mechanism for excess heat energy dissipation. At high incident irradiances, when
light is saturating for PS, increased acidification triggers thermal dissipation (Müller
et al. 2001; Miyake et al. 2004). Arabidopsis mutants that lack proton gradient
14
Chapter 1 Introduction
regulation (pgr5: encodes a novel thylakoid membrane protein that is involved in
electron cyclic flow in PSI), had lower Chl fluorescence and P700 oxidation ratio
(Munekage et al. 2002). It was proposed that the pgr5 pathway contributes to the pH
gradient that induces thermal dissipation. Electron flow around PSII occurs at
elevated light intensities and is the reason for the curvilinear relationship between the
O2 and fluorescence measurements (Longstaff et al. 2002; Beer and Axelsson 2004).
The cyclic flow of the electrons around PSII produces an artificially high electron
flow rate relative to O2 evolution. This is important as a photoprotective mechanism
in events of decreased linear electron transport capacity (Prasil et al. 1996). However,
it is not clear whether this flow affects primary productivity, but may enable the cells
to maintain higher tolerance to high PSII absorption cross section under rate limiting
conditions of linear electron transport rates (Beardall et al. 2009).
(ii) Mehler peroxidase reaction: This is an indirect redox reaction that generates ATP at
the expense of light energy. This process involves the sequential transfer of electrons
from the donor side of PSII to the reducing side in PSI, where O2 is reduced to H2O2
and then to H2O again, with no net O2 exchange (Falkowski and Raven 1997). This
mechanism (water-water cycle) has often been studied as a mechanism with possible
function in the photoprotection of plants (Asada 1999). It assists in developing and
maintaining a high pH gradient across the thylakoid membranes, which in turn
enhances excess energy dissipation (Schreiber and Neubauer 1990). When CO2
fixation becomes limiting, the Mehler peroxidase reaction protects PSII against
photoinactivation by supporting the electron transport required for zeaxanthin-
dependent non-photochemical quenching and concomitantly scavenging H2O2
(Neubauer and Yamamoto 1992). This limits the over-reduction of intersystem
electron carriers and generates a large proton gradient across the thylakoid membrane
15
M. Al-Najjar Flow of light energy in microbial mats
and leads to downregulation of PSII (Asada 1999; Raven and Beardall 2005). The
amount of electrons used in this reaction compared to the total electron flow in
photosynthesis varies in different photosynthetic organisms. For example, it is
between 10 and 20% in tropical trees (Lovelock and Winter 1996), while it is ~30 %
in wheat leaves under drought (Biehler and Fock 1996). Therefore, oxygen reduction
in the water-water cycle (Mehler reaction) together with associated electron transport
is a major sink for electrons and helps protecting photosynthesis against high
irradiance levels (Makino et al. 2002; Weng et al. 2008).
(iii) Photorespiration can result in overestimated QE values when estimated using O2
measurements, as Rubisco reacts competitively with O2 instead of CO2, leading to
lower CO2 fixation rates compared to measured O2 evolution. However, aquatic
photoautotrophs that can actively concentrate internal inorganic carbon availability
suppress the oxygenase activity of Rubisco and stimulate its carboxylase activities.
Therefore, these organisms are not carbon limited, and photosynthesis is saturated
with respect to carbon at levels normally found in seawater. Exceptions are the
coccolithophorid Emiliana huxleyi and potentially other coccolithophorids, as their
inorganic carbon concentrating mechanisms are less efficient compared to other
marine phototrophs (Falkowski and Raven 1997).
(iv) A fraction of electrons generated from water oxidation is used for other reductive
processes in the cell, such as reduction of nitrogen and sulfur, potentially leading to
the overestimation of QE overestimation (Falkowski and Raven 1997). These
processes are probably more significant under higher photon fluxes, especially
because of a strong build-up of O2, reactive oxygen species (ROS) and pH in cells
high in the euphotic zone.
16
Chapter 1 Introduction
(v) Maintenance respiration: this is the minimum energy consumption rate required to
maintain the viability of the cell. It includes maintaining cellular structures and
gradients of ions and metabolites, in addition to the physiological adaptations in
response to changing environmental conditions (Beardall et al. 2009).
(vi) Protein turnover (degradation and re-synthesis) is considered an important process in
the regulation of biological systems. This process regulates cellular enzyme activities,
abnormal protein removal, allows changes in the relative concentrations of different
proteins assisting in the adaptation of organisms to different environmental
conditions, and enables microalgae to compete under a range of environmental
stresses (Beardall et al. 2009). Protein turnover is considered a significant component
of the maintenance respiration in terms of cellular energy requirements (Raven et al.
2000), for example one third of the respiratory demands in Phaeodactylum
tricornutum (diatom) and Dunaliella (chlorophyte) were associated with protein
turnover (Quigg and Beardall 2003). Moreover, it is proposed that species best
adapted to grow at low light intensities have lower maintenance respiration rates
(Falkowski and Raven 1997).
(vii) Slippage: this occurs when there is a reduction in photon efficiency especially at low
rates of photon absorption (Quigg et al. 2006; Beardall et al. 2009). The decrease in
microalgae growth at light levels of 1 μmol photon m-2 s-1 is caused by the decay of
the unstable intermediates in the O2 evolution pathway of photosynthesis, and the
functioning of the active proton porters as a passive uniporter (Radmer and Kok 1977;
Raven and Beardall 1981). The latter mechanism leads to leakage of protons and the
loss of the electrochemical gradient across the thylakoids membrane, which
subsequently negatively affects QE.
17
M. Al-Najjar Flow of light energy in microbial mats
(viii) CO2 concentrating mechanisms: these occur in cyanobacteria and some algae. These
mechanisms are energetically more expensive to the cell than CO2 fixation by
Rubisco and the subsequent photorespiration and glycolate metabolism (Raven et al.
2000; Beardall and Giordano 2002). Generally they act as pump and leakage
mechanisms which exhibit high HCO3- pumping rates resulting in creation of high
internal CO2 concentrations to overcome diffusion rates (Salon et al. 1996).
Therefore, this mechanism serves to dissipate excess light energy in the
photosynthetic cells as well as alternative electron sink (Tchernov et al. 1998).
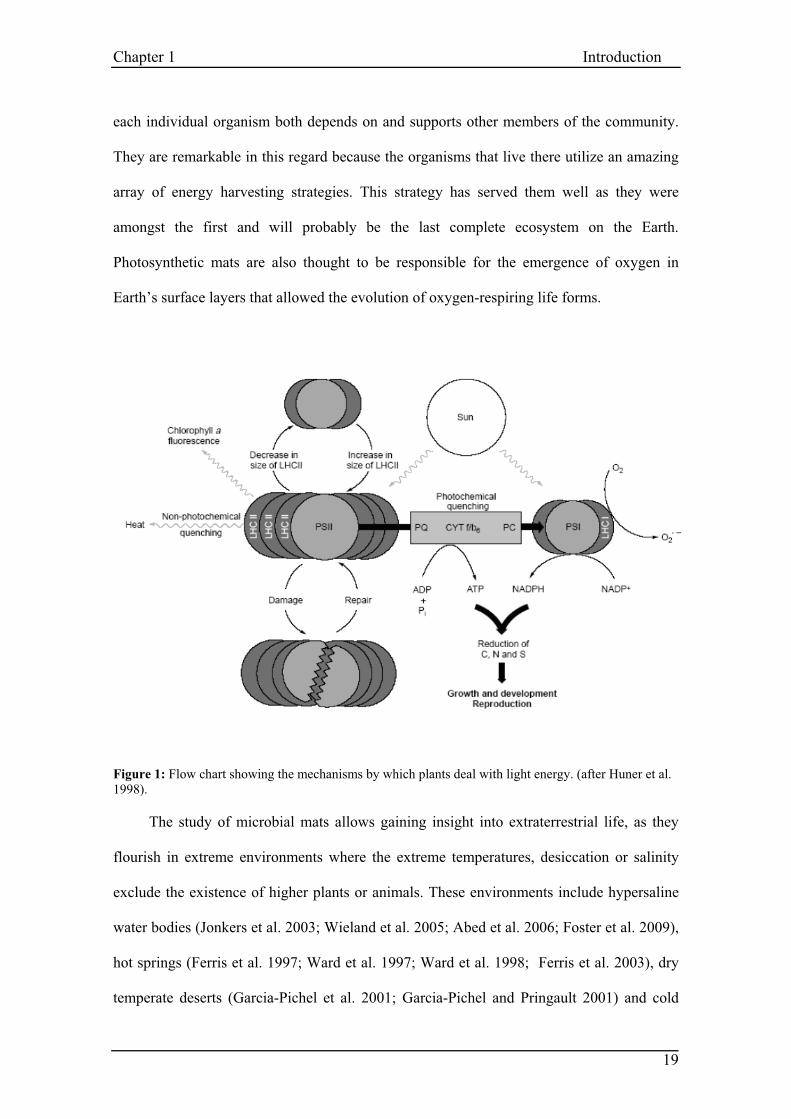
Photosynthetic cells have developed a range of different mechanisms to protect against
photoinhibition. These mechanisms are particularly important to assess the balance between
the energy absorbed versus the energy utilized through electron transport and metabolism
(Fig. 1). These mechanisms include:
1. Short-term mechanisms, occurring within minutes; these involve photochemical
and non-photochemical quenching (“heat dissipation”);
2. Long-term mechanisms (hours to days); these involve: a) reduction of the antenna
size of the light harvesting center II (LHCII), b) alteration of PSII–PSI
stoichiometry; c) stimulation of damaged D1 protein repair rate in PSII; and d)
stimulation of the ability to utilize ATP and NADPH through metabolism to
maintain high photochemical quenching of PSII excitation (Huner et al. 1998).
Photosynthetic microbial mats
Microbial mats are laminated complex microbial ecosystems that inhabit a wide range of
environments (Franks and Stolz 2009). They operate as almost closed systems with
persistent oxidation-reduction gradients and restricted mass flow (Guerrero et al. 2002). A
photosynthetic microbial mat functions in the same way as a complex food web, in which
18
Chapter 1 Introduction
each individual organism both depends on and supports other members of the community.
They are remarkable in this regard because the organisms that live there utilize an amazing
array of energy harvesting strategies. This strategy has served them well as they were
amongst the first and will probably be the last complete ecosystem on the Earth.
Photosynthetic mats are also thought to be responsible for the emergence of oxygen in
Earth’s surface layers that allowed the evolution of oxygen-respiring life forms.
Figure 1: Flow chart showing the mechanisms by which plants deal with light energy. (after Huner et al. 1998).
The study of microbial mats allows gaining insight into extraterrestrial life, as they
flourish in extreme environments where the extreme temperatures, desiccation or salinity
exclude the existence of higher plants or animals. These environments include hypersaline
water bodies (Jonkers et al. 2003; Wieland et al. 2005; Abed et al. 2006; Foster et al. 2009),
hot springs (Ferris et al. 1997; Ward et al. 1997; Ward et al. 1998; Ferris et al. 2003), dry
temperate deserts (Garcia-Pichel et al. 2001; Garcia-Pichel and Pringault 2001) and cold
19

M. Al-Najjar Flow of light energy in microbial mats
and dry environments of Antarctica (Buffan-Dubau et al. 2001; Roeselers et al. 2007;
Bottos et al. 2008). Furthermore, species occurrence and abundance in microbial mat
communities are strongly influenced by the physical properties and chemical parameters of
the environment in which they live. Important physical properties include light (both
quantity and quality), temperature, and pressure. Key chemical parameters include oxygen
availability, pH, oxidation/reduction potential, salinity, and available electron acceptors and
donors, as well as the presence or absence of specific chemical species (Franks and Stolz
2009).
The typical thickness of a microbial mat ranges from several millimeters to a few
centimeters and within this confined space all primary productivity, aerobic and anaerobic
mineralization processes take place (Des Marais 2003). Due to the mass transfer resistance
and the fact that the primary energy source, i.e., sun light, enters the photosynthetic
microbial mat ecosystem from above, steep gradients in physico-chemical
microenvironments occur, leading to a pronounced stratification of the microbial
community composition and the associated activity. Obviously, energy-taxis provides cells
with a versatile sensory system and enables them to navigate to niches where energy
generation is optimized. This behavior is likely to govern vertical species stratification and
the active migration of motile cells in response to shifting gradients of electron donors and
acceptors observed within microbial mats (Alexandre et al. 2004). Therefore, energy-taxis
is fine-tuned to the environment a cell finds itself in and allows efficient adaptation to
changing conditions that affect cellular energy levels.
Typically, the upper zone of the mat, where light penetrates in sufficient amounts, is
characterized by high rates of oxygenic photosynthesis and, due to the elevated oxygen
concentrations and the excretion of photosynthetic products, high rates of aerobic
20
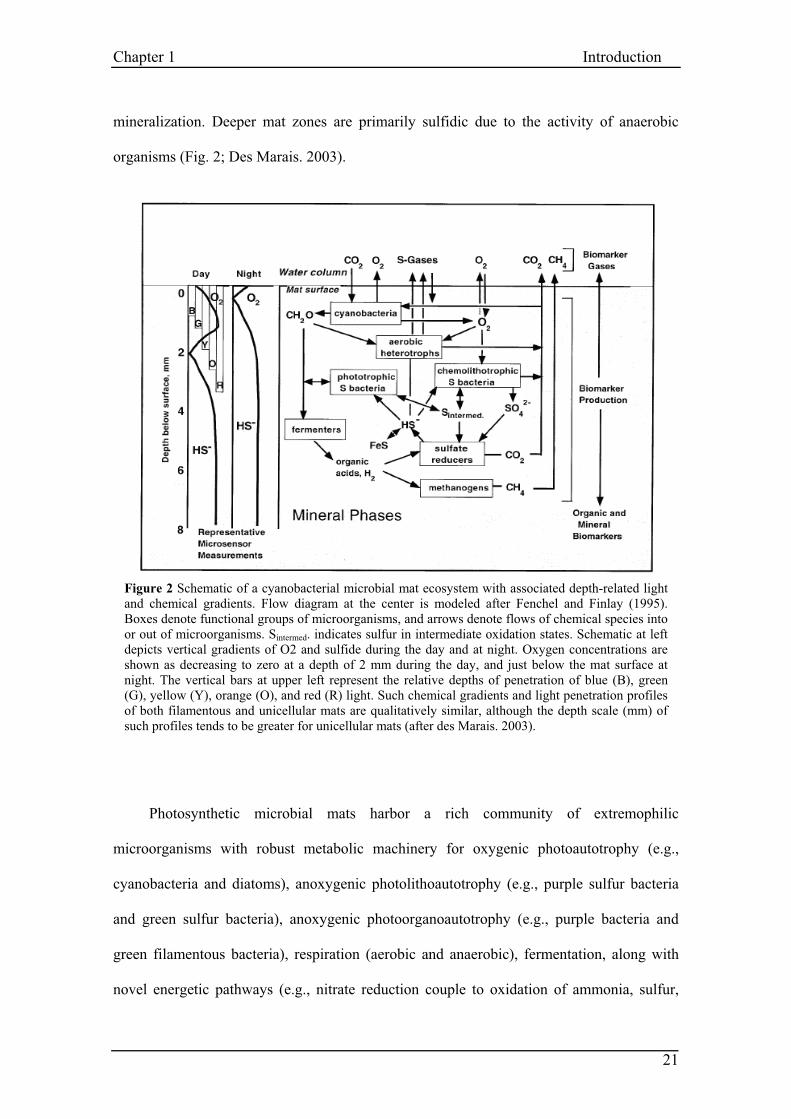
Chapter 1 Introduction
mineralization. Deeper mat zones are primarily sulfidic due to the activity of anaerobic
organisms (Fig. 2; Des Marais. 2003).
Figure 2 Schematic of a cyanobacterial microbial mat ecosystem with associated depth-related light and chemical gradients. Flow diagram at the center is modeled after Fenchel and Finlay (1995). Boxes denote functional groups of microorganisms, and arrows denote flows of chemical species into or out of microorganisms. Sintermed. indicates sulfur in intermediate oxidation states. Schematic at left depicts vertical gradients of O2 and sulfide during the day and at night. Oxygen concentrations are shown as decreasing to zero at a depth of 2 mm during the day, and just below the mat surface at night. The vertical bars at upper left represent the relative depths of penetration of blue (B), green (G), yellow (Y), orange (O), and red (R) light. Such chemical gradients and light penetration profiles of both filamentous and unicellular mats are qualitatively similar, although the depth scale (mm) of such profiles tends to be greater for unicellular mats (after des Marais. 2003).
Photosynthetic microbial mats harbor a rich community of extremophilic
microorganisms with robust metabolic machinery for oxygenic photoautotrophy (e.g.,
cyanobacteria and diatoms), anoxygenic photolithoautotrophy (e.g., purple sulfur bacteria
and green sulfur bacteria), anoxygenic photoorganoautotrophy (e.g., purple bacteria and
green filamentous bacteria), respiration (aerobic and anaerobic), fermentation, along with
novel energetic pathways (e.g., nitrate reduction couple to oxidation of ammonia, sulfur,
21
M. Al-Najjar Flow of light energy in microbial mats
and arsenite) that have been recently discovered (Moezelaar et al. 1996; Franks and Stolz
2009).
Within the oxygenic photoautotrophs cyanobacteria show incredible adaptations to
thrive in the continuously changing and extreme conditions. They are unique in shifting
their metabolism from oxygenic or anoxygenic photosynthesis and respiration when light
and O2 are available to fermentation when they are exposed to long periods of darkness
(Cohen et al. 1986; Jørgensen et al. 1986; Moezelaar et al. 1996). This metabolic flexibility
helps generate enough energy to ensure their survival during “famine” conditions and keep
their important reservoir of the energetically “expensive proteins” and pigments. These
stores ensure the cyanobacteria are ready to restore normal functioning (i.e, photosynthesis)
when the conditions are suitable.
Cyanobacterial mats show a unique tolerance to dryness and desiccation, as they
survive relatively long periods without water (days to weeks) but can revive their
photosynthetic capabilities within short time after rewetting (i.e., few minutes to an hour),
and achieve maximum activity within a few hours (e.g., Brock 1975; Scherer et al. 1984;
Garcia-Pichel and Belnap 1996; Joset et al. 1996; Garcia-Pichel and Pringault 2001; Satoh
et al. 2002).
Studies on hypersaline mats include the effects of temperature and light-intensity on
biomass production and mineralization (e.g., Jørgensen et al. 1987; Jørgensen and Des
Marais 1988; Kühl and Jørgensen 1992; Kühl and Jørgensen 1994; Kühl et al. 1994; Kühl
and Fenchel 2000; Wieland and Kühl 2000a, b; Abed et al. 2006), mechanisms of
calcification (Arp et al. 1999; Ludwig et al. 2005), controlling mechanisms of element
cycling (Canfield and Des Marais 1993; Jørgensen 1994; Kühl 1993; Hoehler et al. 2002;
Jonkers et al. 2003; Jonkers et al. 2005; Wieland et al. 2005), a fundamental work on
photosynthesis (Badger and Andrews 1982; Govindjee et al. 1993; Kühl and Jørgensen
22
Chapter 1 Introduction
1994; Epping and Jørgensen 1996; Jørgensen and des Marais 1988; Epping et al. 1999;
Garcia-Pichel et al. 1999; Grotzschel and de Beer 2002; Woelfel et al. 2009), and many
biodiversity studies (Cohen and Krumbein 1977; Garcia-Pichel et al. 2001; Nubel et al.
2001; Sanchez-Rivera and Rios-Velazquez 2008; Allen et al. 2009; Dillon et al. 2009;
Robertson et al. 2009). Furthermore, the energy transfer in microbial mats, considering just
the conserved chemical energy and the photosynthetic efficiency measure, was studied
(Revsbech et al. 1983; Revsbech and Jørgensen 1986; Lassen et al. 1992; Martinez-Alonso
et al. 2004; Vopel and Hawes 2006). These studies represent just a few examples of the
quantity of work that has been done so far on microbial mats.
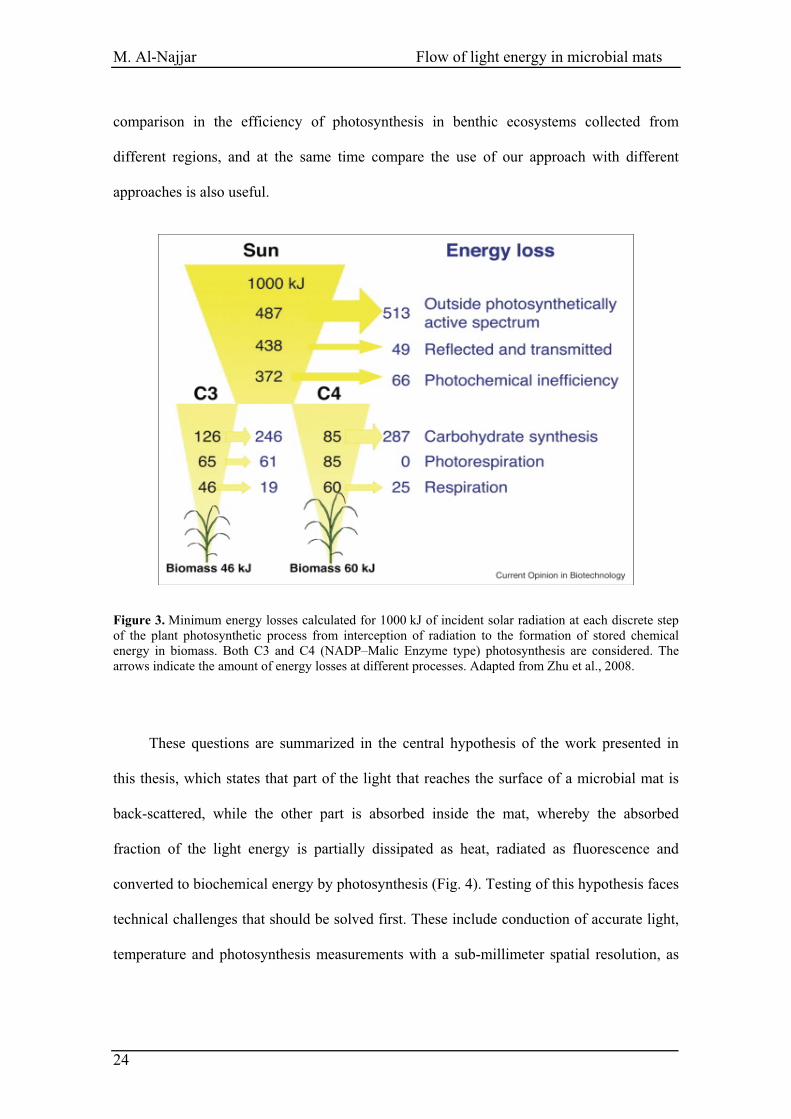
Research on photosynthetic efficiency has mainly focused on plants (Singsaas et al.
2001; Zhu et al. 2008, Fig. 3) and planktonic algae (Dubinsky et al. 1986; Flameling and
Kromkamp 1998; Rosenberg et al. 2008). The measurements are typically conducted in a
homogeneous light field allowing a uniform transfer of light energy to the studied
photosynthetic system and thus facilitating detailed studies of underlying physiological
mechanisms of light adaptation and acclimation.
However, based on the best of our knowledge, a complete balanced energy budget
that describes the fate of light energy inside the microbial mat ecosystems has not yet been
tackled. Specifically, how much of the incident irradiance, which “bombards” the surface of
a photosynthetic microbial mat, would be back-scattered and how much would be
absorbed? Furthermore, what is the fate of the absorbed light energy, and how much from
this absorbed energy would be converted into the other types of energy? Finally, what is
the contribution of each layer of the microbial mat to the overall quantum efficiency of the
whole ecosystems? Once these questions are answered, it would be important to apply the
intended approach to different benthic photosynthetic ecosystems to estimate the variations
in light utilization efficiency in these ecosystems. Moreover, conducting a biogeographical
23
M. Al-Najjar Flow of light energy in microbial mats
comparison in the efficiency of photosynthesis in benthic ecosystems collected from
different regions, and at the same time compare the use of our approach with different
approaches is also useful.
Figure 3. Minimum energy losses calculated for 1000 kJ of incident solar radiation at each discrete step of the plant photosynthetic process from interception of radiation to the formation of stored chemical energy in biomass. Both C3 and C4 (NADP–Malic Enzyme type) photosynthesis are considered. The arrows indicate the amount of energy losses at different processes. Adapted from Zhu et al., 2008.
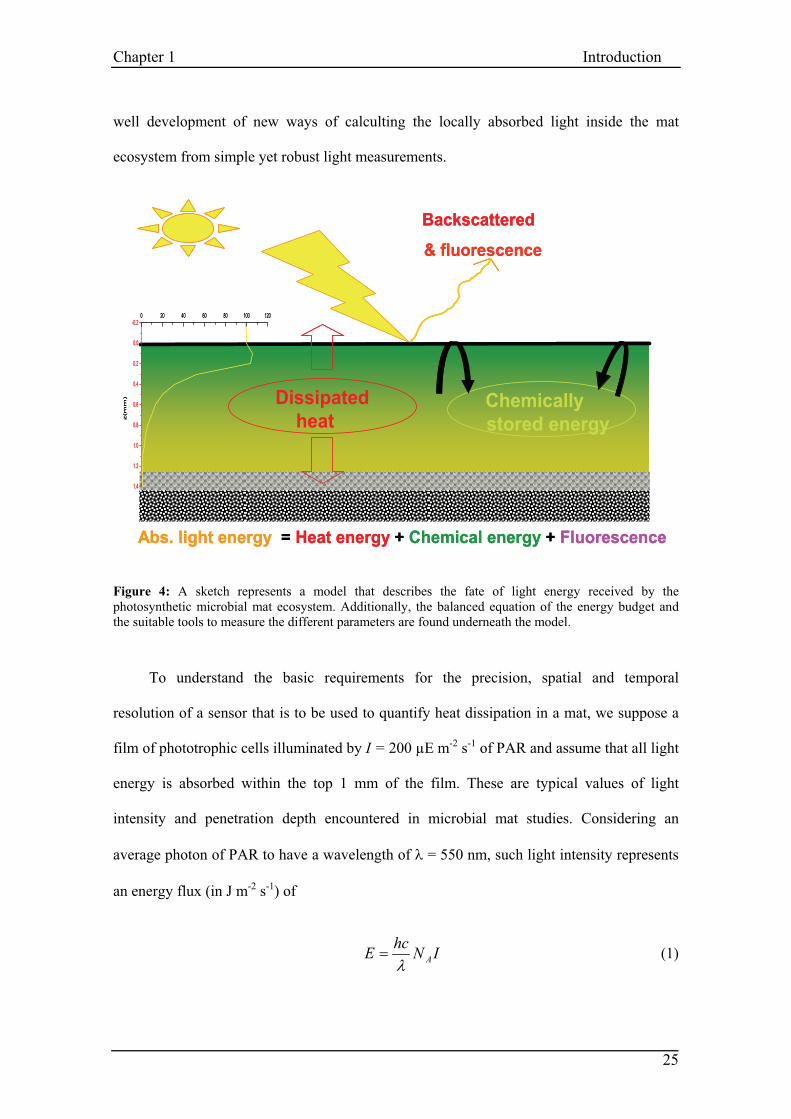
These questions are summarized in the central hypothesis of the work presented in
this thesis, which states that part of the light that reaches the surface of a microbial mat is
back-scattered, while the other part is absorbed inside the mat, whereby the absorbed
fraction of the light energy is partially dissipated as heat, radiated as fluorescence and
converted to biochemical energy by photosynthesis (Fig. 4). Testing of this hypothesis faces
technical challenges that should be solved first. These include conduction of accurate light,
temperature and photosynthesis measurements with a sub-millimeter spatial resolution, as
24
Chapter 1 Introduction
25
well development of new ways of calculting the locally absorbed light inside the mat
ecosystem from simple yet robust light measurements.
& fluorescence
Backscattered
Dissipatedheat
Chemicallystored energy
Abs. light energy = + Chemical energy + FluorescenceHeat energy
& fluorescence
Backscattered
Dissipatedheat
Chemicallystored energy
Abs. light energy = + Chemical energy + FluorescenceHeat energy
Figure 4: A sketch represents a model that describes the fate of light energy received by the photosynthetic microbial mat ecosystem. Additionally, the balanced equation of the energy budget and the suitable tools to measure the different parameters are found underneath the model.
To understand the basic requirements for the precision, spatial and temporal
resolution of a sensor that is to be used to quantify heat dissipation in a mat, we suppose a
film of phototrophic cells illuminated by I = 200 μE m-2 s-1 of PAR and assume that all light
energy is absorbed within the top 1 mm of the film. These are typical values of light
intensity and penetration depth encountered in microbial mat studies. Considering an
average photon of PAR to have a wavelength of � = 550 nm, such light intensity represents
an energy flux (in J m-2 s-1) of
INE A��
hc (1)
M. Al-Najjar Flow of light energy in microbial mats
26
where c is the speed of light (3x10⁸ m s-1), is the Planck constant (6.626 x 10⁻³⁴ J s) and
is the Avogadro number (6.022 x 10²³ mol-1). Assuming that none of this energy is
conserved photosynthetically but is all converted into heat instead, the expected volumetric
rate of energy dissipation, i.e., heat generation, in the 1 mm film layer will be Q = E/1mm ~
43.5 kJ m-3 s-1. Supposing that the material comprising the film (i.e., cells) consists
primarily of water, i.e., the mass specific heat capacity Cm and density � are equal to 4.2 kJ
kg-1 K-1 and 103 kg m-3, respectively, and that no heat exchange takes place between the
film and the environment, the heat generation rate can be translated into a rate of
temperature increase of dT/dt = Q/(�Cm) = 0.01 °C s-1. This is a maximum estimate, as the
photosynthetic conservation and heat exchange with the environment were neglected. Thus
to quantify the heat dissipation in a typical microbial mat and under realistic conditions, the
temperature microsensor must be able to detect changes in temperature at least in the order
of ~0.01 °C s-1. Furthermore, it must be able to do so with a spatial resolution of ~100 �m
so that the measurement is non-invasive and the results can be directly compared with
microsensor-based measurements of gross photosynthesis and light attenuation in the mat.
h
N A
Aims of the thesis
The goals of the work presented in this thesis are to experimentally verify the budget of
light energy inside photosynthetic microbial mat ecosystems outlined in Fig. 4, and to
explore how this budget is regulated by environmental parameters. To address these goals
with various levels of details, the thesis was divided into three parts:
1. The first part demonstrates that a closed energy budget in photosynthetic microbial
mat ecosystems can be experimentally verified. Specifically, it describes an
approach to quantify how much of the incident light energy flux ( INJ ) is back-
scattered and thus lost to the environment ( RJ ), dissipated as heat ( HJ ) or
Chapter 1 Introduction
27
chemically stored by photosynthesis ( PSJ ), and how this energy flow varies with
depth across the euphotic zone. This work was divided into three main challenges:
(i) to experimentally verify that PSH JJR= JINJ �� , (ii) to characterize how the
budget depends on the incident irradiance, and (iii) to elucidate how the overall
photosynthetic light utilization efficiency of the entire mat depends on the partial
efficiencies of the different layers in the mat.
2. The second part compares the efficiency of light energy utilization between three
benthic photosynthetic microbial ecosystems, using the approach that was used in
the first part. Furthermore, the structural characteristics of the systems are
described, including microbial composition and contents of photo- and accessory
pigments, exopolymers and mineral particles.
3. The third part describes a detailed analysis of the spatial heterogeneity in quantum
efficiency of oxygenic photosynthesis, photopigments distribution, and light
acclimation in microbial mats, assessed by PAM and hyper-spectral imaging
techniques. Possible factors affecting these variations were also investigated.
M. Al-Najjar Flow of light energy in microbial mats
References
Aarti, D., Tanaka, R., Ito, H., Tanaka, A., 2007. High light inhibits chlorophyll biosynthesis at the level of 5-aminolevulinate synthesis during de-etiolation in cucumber (Cucumis sativus) cotyledons. Photochemistry and Photobiology 83, 171-176.
Abed, R.M.M., Polerecky, L., Al Najjar, M., de Beer, D., 2006. Effect of temperature on
photosynthesis, oxygen consumption and sulfide production in an extremely hypersaline cyanobacterial mat. Aquatic Microbial Ecology 44, 21-30.
Alexandre, G., Greer-Phillips, S., Zhulin, I.B., 2004. Ecological role of energy taxis in
microorganisms. FEMS Microbiology Reviews 28, 113-126. Allen, J.F., Martin, W., 2007. Evolutionary biology - Out of thin air. Nature 445, 610-612. Allen, M.A., Goh, F., Burns, B.P., Neilan, B.A., 2009. Bacterial, archaeal and eukaryotic
diversity of smooth and pustular microbial mat communities in the hypersaline lagoon of Shark Bay. Geobiology 7, 82-96.
Apel, K., Kloppstech, K., 1980. The effect of light on the biosynthesis of the light-
harvesting chlorophyll a/b Protein - evidence for the requirement of chlorophyll a for the stabilization of the apoprotein. Planta 150, 426-430.
Arp, G., Reimer, A., Reitner, J., 1999. Calcification in cyanobacterial biofilms of alkaline
salt lakes. European Journal of Phycology 34, 393-403. Asada, K., 1999. The water-water cycle in chloroplasts: Scavenging of active oxygens and
dissipation of excess photons. Annual Review of Plant Physiology and Plant Molecular Biology 50, 601-639.
Bachar, A., Polerecky, L., Fischer, J.P., Vamvakopoulos, K., de Beer, D., Jonkers, H.M.,
2008. Two-dimensional mapping of photopigment distribution and activity of Chloroflexus-like bacteria in a hypersaline microbial mat. FEMS Microbiology Ecology 65, 434-448.
Badger, M.R., Andrews, T.J., 1982. Photosynthesis and inorganic carbon usage by the
marine Cyanobacterium, Synechococcus sp. Plant Physiology 70, 517-523. Beardall, J., Giordano, M., 2002. Ecological implications of microalgal and cyanobacterial
CO2 concentrating mechanisms, and their regulation. Functional Plant Biology 29, 335-347.
Beardall, J., Ihnken, S., Quigg, A., 2009. Gross and net primary production: closing the gap
between concepts and measurements. Aquatic Microbial Ecology 56, 113-122. Beer, S., Axelsson, L., 2004. Limitations in the use of PAM fluorometry for measuring
photosynthetic rates of macroalgae at high irradiances. European Journal of Phycology 39, 1-7.
Bender, M., Orchardo, J., Dickson, M.L., Barber, R., Lindley, S., 1999. In vitro O2 fluxes
compared with C14 production and other rate terms during the JGOFS Equatorial
28
Chapter 1 Introduction
Pacific experiment. Deep-Sea Research Part I - Oceanographic Research Papers 46, 637-654.
Biehler, K., Fock, H., 1996. Evidence for the contribution of the Mehler-peroxidase reaction
in dissipating excess electrons in drought-stressed wheat. Plant Physiology 112, 265-272.
Bottos, E.M., Vincent, W.F., Greer, C.W., Whyte, L.G., 2008. Prokaryotic diversity of
arctic ice shelf microbial mats. Environmental Microbiology 10, 950-966. Brock, T.D., 1975. Effect of water potential on a Microcoleus (Cyanophyceae) from a
desert crust. Journal of Phycology 11, 316-320. Brown, L.M., Zeiler, K.G., 1993. Aquatic biomass and carbon-dioxide trapping. Energy
Conversion and Management 34, 1005-1013. Buffan-Dubau, E., Pringault, O., de Wit, R., 2001. Artificial cold-adapted microbial mats
cultured from Antarctic lake samples. 1. Formation and structure. Aquatic Microbial Ecology 26, 115-125.
Canfield, D.E., des Marais, J.D., 1993. Biochemical cycles of carbon, sulfur, and free
oxygen in a microbial mat. Geochimica Et Cosmochimica Acta 57, 3971-3984. Cohen, Y., Jorgensen, B.B., Revsbech, N.P., Poplawski, R., 1986. Adaptation to hydrogen-
sulfide of oxygenic and anoxygenic photosynthesis among Cyanobacteria. Applied and Environmental Microbiology 51, 398-407.
Cohen, Y., Krumbein, W.E., 1977. Solar lake (Sina) .2. Distribution of photosynthetic
microorganisms and primary production. Limnology and Oceanography 22, 609-620. Des Marais, D.J., 2003. Biogeochemistry of hypersaline microbial mats illustrates the
dynamics of modern microbial ecosystems and the early evolution of the biosphere. Biological Bulletin 204, 160-167.
Dillon, J.G., Miller, S., Bebout, B., Hullar, M., Pinel, N., Stahl, D.A., 2009. Spatial and
temporal variability in a stratified hypersaline microbial mat community. FEMS Microbiology Ecology 68, 46-58.
Dismukes, G.C., Carrieri, D., Bennette, N., Ananyev, G.M., Posewitz, M.C., 2008. Aquatic phototrophs: efficient alternatives to land-based crops for biofuels. Current Opinion in Biotechnology 19, 235-240.
Dubinsky, Z., Falkowski, P.G., Wyman, K., 1986. Light harvesting and utilization by
phytoplankton. Plant and Cell Physiology 27, 1335-1349. Dubinsky, Z., Feitelson, J., Mauzerall, D.C., 1998. Listening to phytoplankton: Measuring
biomass and photosynthesis by photoacoustics. Journal of Phycology 34, 888-892. Dubinsky, Z., Stambler, N., 2009. Photoacclimation processes in phytoplankton:
mechanisms, consequences, and applications. Aquatic Microbial Ecology 56, 163-176.
29
M. Al-Najjar Flow of light energy in microbial mats
Epping, E.H.G., Jørgensen, B.B., 1996. Light-enhanced oxygen respiration in benthic phototrophic communities. Marine Ecology-Progress Series 139, 193-203.
Epping, E.H.G., Khalili, A., Thar, R., 1999. Photosynthesis and the dynamics of oxygen
consumption in a microbial mat as calculated from transient oxygen microprofiles. Limnology and Oceanography 44, 1936-1948.
Falkowski, P.G., Raven, J.A., 1997. Aquatic photosynthesis. Blackwell Science, Capital
City Press, Washington, DC. Ferris, M.J., Kühl, M., Wieland, A., Ward, D.M., 2003. Cyanobacterial ecotypes in different
optical microenvironments of a 68 degrees C hot spring mat community revealed by 16S-23S rRNA internal transcribed spacer region variation. Applied and Environmental Microbiology 69, 2893-2898.
Ferris, M.J., Nold, S.C., Revsbech, N.P., Ward, D.M., 1997. Population structure and
physiological changes within a hot spring microbial mat community following disturbance. Applied and Environmental Microbiology 63, 1367-1374.
Flameling, I.A., Kromkamp, J., 1998. Light dependence of quantum yields for PSII charge
separation and oxygen evolution in eucaryotic algae. Limnology and Oceanography 43, 284-297.
Foster, J.S., Green, S.J., Ahrendt, S.R., Golubic, S., Reid, R.P., Hetherington, K.L., Bebout,
L., 2009. Molecular and morphological characterization of cyanobacterial diversity in the stromatolites of Highborne Cay, Bahamas. ISME Journal 3, 573-587.
Franks, J., Stolz, J.F., 2009. Flat laminated microbial mat communities. Earth-Science
Reviews 96, 163-172. Garcia-Pichel, F., Kühl, M., Nubel, U., Muyzer, G., 1999. Salinity-dependent limitation of
photosynthesis and oxygen exchange in microbial mats. Journal of Phycology 35, 227-238.
Garcia-Pichel, F., Lopez-Cortes, A., Nubel, U., 2001. Phylogenetic and morphological
diversity of cyanobacteria in soil desert crusts from the Colorado Plateau. Applied and Environmental Microbiology 67, 1902-1910.
Garcia-Pichel, F., Pringault, O., 2001. Microbiology - Cyanobacteria track water in desert
soils. Nature 413, 380-381. Garcia-Pichel, F., Belnap, J., 1996. Microenvironments and microscale productivity of
cyanobacterial desert crusts. Journal of Phycology 32, 774-782. Govindjee, J.F.H.S., De Vos, O.J., Van Rensen, J.J.S., 1993. Antagonistic effects of light I
and II on chlorophyll alpha fluorescence yield and P70 turnover as monitors of carbon dioxide depletion in intact algal and cyanobacterial cells. Physiologia Plantarum 89, 143-148.
Grotzschel, S., de Beer, D., 2002. Effect of oxygen concentration on photosynthesis and
respiration in two hypersaline microbial mats. Microbial Ecology 44, 208-216.
30
Chapter 1 Introduction
Guerrero, R., Piqueras, M., Berlanga, M., 2002. Microbial mats and the search for minimal ecosystems. International Microbiology 5, 177-188.
Hihara, Y., Kamei, A., Kanehisa, M., Kaplan, A., Ikeuchi, M., 2001. DNA microarray
analysis of cyanobacterial gene expression during acclimation to high light. Plant Cell 13, 793-806.
Hoehler, T.M., Albert, D.B., Alperin, M.J., Bebout, B.M., Martens, C.S., des Marais, D.J.,
2002. Comparative ecology of H2 cycling in sedimentary and phototrophic ecosystems. Antonie Van Leeuwenhoek International Journal of General and Molecular Microbiology 81, 575-585.
Huner, N.P.A., Oquist, G., Sarhan, F., 1998. Energy balance and acclimation to light and
cold. Trends in Plant Science 3, 224-230. Jassby, A.D., Platt, T., 1976. Mathematical formulation of relationship between
photosynthesis and light for phytoplankton. Limnology and Oceanography 21, 540-547.
Johnston, A.M., Raven, J.A., 1986. The analysis of photosynthesis in air and water of
Ascophyllum nodosum (L.) Le Jol. Oecologia 69, 288-295. Jonkers, H.M., Koh, I.O., Behrend, P., Muyzer, G., de Beer, D., 2005. Aerobic organic
carbon mineralization by sulfate-reducing bacteria in the oxygen-saturated photic zone of a hypersaline microbial mat. Microbial Ecology 49, 291-300.
Jonkers, H.M., Ludwig, R., De Wit, R., Pringault, O., Muyzer, G., Niemann, H., Finke, N.,
De Beer, D., 2003. Structural and functional analysis of a microbial mat ecosystem from a unique permanent hypersaline inland lake: 'La Salada de Chiprana' (NE Spain). FEMS Microbiology Ecology 44, 175-189.
Jørgensen, B.B., 1994. Sulfate reduction and thiosulfate transformations in a cyanobacterial
mat during a diel oxygen cycle. FEMS Microbiology Ecology 13, 303-312. Jørgensen, B.B., Cohen, Y., Des Marais, D.J., 1987. Photosynthetic action spectra and
adaptation to spectral light-distribution in a benthic cyanobacterial mat. Applied and Environmental Microbiology 53, 879-886.
Jørgensen, B.B., Cohen, Y., Revsbech, N.P., 1986. Transition from anoxygenic to oxygenic
photosynthesis in a Microcoleus-chthonoplastes cyanobacterial mat. Applied and Environmental Microbiology 51, 408-417.
Jørgensen, B.B., des Marais, D.J., 1988. Optical-properties of benthic photosynthetic
communities: fiber-optic studies of cyanobacterial mats. Limnology and Oceanography 33, 99-113.
Joset, F., Jeanjean, R., Hagemann, M., 1996. Dynamics of the response of cyanobacteria to
salt stress: Deciphering the molecular events. Physiologia Plantarum 96, 738-744. Kopp, R.E., Kirschvink, J.L., Hilburn, I.A., Nash, C.Z., 2005. The paleoproterozoic
snowball Earth: A climate disaster triggered by the evolution of oxygenic
31
M. Al-Najjar Flow of light energy in microbial mats
photosynthesis. Proceedings of the National Academy of Sciences of the United States of America 102, 11131-11136.
Kühl, M., 1993. Photosynthesis, O2 respiration and sulphur cycling in a Cyanobacterial
biofilm. Trends in Microbial Ecology, 163-167. Kühl, M., Fenchel, T., 2000. Bio-optical characteristics and the vertical distribution of
photosynthetic pigments and photosynthesis in an artificial cyanobacterial mat. Microbial Ecology 40, 94-103.
Kühl, M., Jørgensen, B.B., 1992. Spectral light measurements in microbenthic phototrophic
communities with a fiber-optic microprobe coupled to a sensitive diode array detector. Limnology and Oceanography 37, 1813-1823.
Kühl, M., Jørgensen, B.B., 1994. The light-field of microbenthic communities: radiance
distribution and microscale optics of sandy coastal sediments. Limnology and Oceanography 39, 1368-1398.
Kühl, M., Lassen, C., Jørgensen, B.B., 1994. Light penetration and light-intensity in sandy
marine-sediments measured with irradiance and scalar irradiance fiberoptic microprobes. Marine Ecology-Progress Series 105, 139-148.
Kühl, M., Polerecky, L., 2008. Functional and structural imaging of phototrophic microbial
communities and symbioses. Aquatic Microbial Ecology 53, 99-118. Lassen, C., Ploug, H., Jørgensen, B.B., 1992. Microalgal photosynthesis and spectral scalar
irradiance in coastal marine-sediments of Limfjorden, Denmark. Limnology and Oceanography 37, 760-772.
Latifi, A., Ruiz, M., Zhang, C.C., 2009. Oxidative stress in cyanobacteria. FEMS
Microbiology Reviews 33, 258-278. Lewis, N.S., Nocera, D.G., 2006. Powering the planet: Chemical challenges in solar energy
utilization. Proceedings of the National Academy of Sciences of the United States of America 103, 15729-15735.
Longstaff, B.J., Kildea, T., Runcie, J.W., Cheshire, A., Dennison, W.C., Hurd, C., Kana, T.,
Raven, J.A., Larkum, A.W.D., 2002. An in situ study of photosynthetic oxygen exchange and electron transport rate in the marine macroalga Ulva lactuca (Chlorophyta). Photosynthesis Research 74, 281-293.
Lovelock, C.E., Winter, K., 1996. Oxygen-dependent electron transport and protection from
photoinhibition in leaves of tropical tree species. Planta 198, 580-587. Ludwig, R., Al-Horani, F.A., de Beer, D., Jonkers, H.M., 2005. Photosynthesis-controlled
calcification in a hypersaline microbial mat. Limnology and Oceanography 50, 1836-1843.
Macdonald, G.M., 2010. Global warming and the Arctic: a new world beyond the reach of
the Grinnellian niche? Journal Experimental Biology 213, 855-861.
32
Chapter 1 Introduction
Makarieva, A.M., Gorshkov, V.G., Li, B.L., 2008. Energy budget of the biosphere and civilization: Rethinking environmental security of global renewable and non-renewable resources. Ecological Complexity 5, 281-288.
Makino, A., Miyake, C., Yokota, A., 2002. Physiological functions of the water-water cycle
(Mehler reaction) and the cyclic electron flow around PSI in rice leaves. Plant and Cell Physiology 43, 1017-1026.
Martinez-Alonso, M., Mir, J., Caumette, P., Gaju, N., Guerrero, R., Esteve, I., 2004.
Distribution of phototrophic populations and primary production in a microbial mat from the Ebro Delta, Spain. International Microbiology 7, 19-25.
Miller, H.L., Dunton, K.H., 2007. Stable isotope (C13) and O2 micro-optode alternatives for
measuring photosythesis in seaweeds. Marine Ecology-Progress Series 329, 85-97. Miyake, C., Shinzaki, Y., Miyata, M., Tomizawa, K., 2004. Enhancement of cyclic electron
flow around PSI at high light and its contribution to the induction of non-photochemical quenching of chl fluorescence in intact leaves of tobacco plants. Plant and Cell Physiology 45, 1426-1433.
Moezelaar, R., Bijvank, S.M., Stal, L.J., 1996. Fermentation and sulfur reduction in the
mat-building cyanobacterium Microcoleus chthonoplastes. Applied and Environmental Microbiology 62, 1752-1758.
Müller, P., Li, X.P., Niyogi, K.K., 2001. Non-photochemical quenching. A response to
excess light energy. Plant Physiology 125, 1558-1566. Munekaga, Y., Hashimoto, M., Miyaka, C., Tomizawa, K.I., Endo, T., Tasaka, M.,
Shikanai, T., 2004. Cyclic electron flow around photosystem I is essential for photosynthesis. Nature 429, 579-582.
Munekage, Y., Hojo, M., Meurer, J., Endo, T., Tasaka, M., Shikanai, T., 2002. PGR5 is
involved in cyclic electron flow around photosystem I and is essential for photoprotection in Arabidopsis. Cell 110, 361-371.
Mussgnug, J.H., Thomas-Hall, S., Rupprecht, J., Foo, A., Klassen, V., McDowall, A.,
Schenk, P.M., Kruse, O., Hankamer, B., 2007. Engineering photosynthetic light capture: impacts on improved solar energy to biomass conversion. Plant Biotechnology Journal 5, 802-814.
Neubauer, C., Yamamoto, H.Y., 1992. Mehler-peroxidase reaction mediates zeaxanthin
formation and zeaxanthin-related fluorescence quenching in intact chloroplasts. Plant Physiology 99, 1354-1361.
Nishiyama, Y., Allakhverdiev, S.I., Yamamoto, H., Hayashi, H., Murata, N., 2004. Singlet
oxygen inhibits the repair of photosystem II by suppressing the translation elongation of the D1 protein in Synechocystis sp PCC 6803. Biochemistry 43, 11321-11330.
Nishiyama, Y., Yamamoto, H., Allakhverdiev, S.I., Inaba, M., Yokota, A., Murata, N.,
2001. Oxidative stress inhibits the repair of photodamage to the photosynthetic machinery. Embo Journal 20, 5587-5594.
33
M. Al-Najjar Flow of light energy in microbial mats
Nubel, U., Bateson, M.M., Madigan, M.T., Kuhl, M., Ward, D.M., 2001. Diversity and
distribution in hypersaline microbial mats of bacteria related to Chloroflexus spp. Applied and Environmental Microbiology 67, 4365-4371.
Olson, J.M., 2006. Photosynthesis in the Archean Era. Photosynthesis Research 88, 109-
117. Osmond, C.B., 1994. What is photoinhibition? Some insights from comparisons of shade
and sun plants, In Environmental Plant Biology Series; Photoinhibition of photosynthesis: From molecular mechanisms to the field. eds N.R. Baker, J.R. Bowyer, pp. 1-24. Bios Scientific Publisher, Oxford.
Prasil, O., Kolber, Z., Berry, J.A., Falkowski, P.G., 1996. Cyclic electron flow around
photosystem II in vivo. Photosynthesis Research 48, 395-410. Quigg, A., Beardall, J., 2003. Protein turnover in relation to maintenance metabolism at low
photon flux in two marine microalgae. Plant Cell and Environment 26, 693-703. Quigg, A., Kevekordes, K., Raven, J.A., Beardall, J., 2006. Limitations on microalgal
growth at very low photon fluence rates: the role of energy slippage. Photosynthesis Research 88, 299-310.
Radmer, R., Kok, B., 1977. Photosynthesis: limited yield, unlimited dreams. Bioscience 27,
599-605. Ragauskas, A.J., Williams, C.K., Davison, B.H., Britovsek, G., Cairney, J., Eckert, C.A.,
Frederick, W.J., Hallett, J.P., Leak, D.J., Liotta, C.L., Mielenz, J.R., Murphy, R., Templer, R., Tschaplinski, T., 2006. The path forward for biofuels and biomaterials. Science 311, 484-489.
Raven, J.A., Beardall, J., 1981. The intrinsic permeability of biological membranes to H+ :
Significance for the efficiency of low rates of energy transformation. FEMS Microbiology Letters 10, 1-5.
Raven, J.A., Beardall, J., 2005. Respiration in aquatic photolithotrophs, In Respiration in
aquatic ecosystems. eds P. del Giorgio, P. Williams, pp. 36-46. Oxford University press.
Raven, J.A., Kubler, J.E., Beardall, J., 2000. Put out the light, and then put out the light.
Journal of the Marine Biological Association of the United Kingdom 80, 1-25. Revsbech, N.P., Jørgensen, B.B., 1983. Photosynthesis of benthic microflora measured with
high spatial-resolution by the oxygen microprofile method - capabilities and limitations of the method. Limnology and Oceanography 28, 749-756.
Revsbech, N.P., Jørgensen, B.B., 1986. Microelectrodes - Their use in microbial ecology.
Advances in Microbial Ecology 9, 293-352.
34
Chapter 1 Introduction
Revsbech, N.P., Jørgensen, B.B., Blackburn, T.H., Cohen, Y., 1983. Microelectrode studies of the photosynthesis and O2, H2S, and pH profiles of a microbial mat. Limnology and Oceanography 28, 1062-1074.
Robertson, C.E., Spear, J.R., Harris, J.K., Pace, N.R., 2009. Diversity and stratification of
Archaea in a hypersaline microbial mat. Applied and Environmental Microbiology 75, 1801-1810.
Roeselers, G., Norris, T.B., Castenholz, R.W., Rysgaard, S., Glud, R.N., Kuhl, M., Muyzer,
G., 2007. Diversity of phototrophic bacteria in microbial mats from Arctic hot springs (Greenland). Environmental Microbiology 9, 26-38.
Rosenberg, J.N., Oyler, G.A., Wilkinson, L., Betenbaugh, M.J., 2008. A green light for
engineered algae: redirecting metabolism to fuel a biotechnology revolution. Current Opinion in Biotechnology 19, 430-436.
Salon, C., Mir, N.A., Canvin, D.T., 1996. HCO3
- and CO2 leakage from Synechococcus UTEX 625. Plant Cell and Environment 19, 260-274.
Sanchez-Rivera, F.J., Rios-Velazquez, C., 2008. Evaluating the Diversity of
Anoxyphototrophic Bacteria in Young and Mature Tropical Hypersaline Microbial Mats using Culture-Independent Approaches. Abstracts of the General Meeting of the American Society for Microbiology 108, 429.
Satagopan, S., Spreitzer, R.J., 2008. Plant-like substitutions in the large-subunit carboxy
terminus of Chlamydomonas Rubisco increase CO2/O2 Specificity. Bmc Plant Biology 8.
Satoh, K., Hirai, M., Nishio, J., Yamaji, T., Kashino, Y., Koike, H., 2002. Recovery of
photosynthetic systems during rewetting is quite rapid in a terrestrial cyanobacterium, Nostoc commune. Plant and Cell Physiology 43, 170-176.
Scherer, S., Ernst, A., Chen, T.W., Boger, P., 1984. Rewetting of drought-resistant blue-
green-algae - time course of water-uptake and reappearance of respiration, ühotosynthesis, and nitrogen-fixation. Oecologia 62, 418-423.
Schneider, T.R., 1973. Efficiency of photosynthesis as a solar energy converter. Energy
Conversion 13, 77-84. Schreiber, U., Neubauer, C., 1990. O2 dependent electron flow, membrane energization and
the mechanism of non photochemical quenching of chlorophyll fluoresence. Photosynthesis Research 25, 279-293.
Siegenthaler, U., Stocker, T.F., Monnin, E., Luthi, D., Schwander, J., Stauffer, B., Raynaud,
D., Barnola, J.M., Fischer, H., Masson-Delmotte, V., Jouzel, J., 2005. Stable carbon cycle-climate relationship during the late Pleistocene. Science 310, 1313-1317.
Singsaas, E.L., Ort, D.R., DeLucia, E.H., 2001. Variation in measured values of
photosynthetic quantum yield in ecophysiological studies. Oecologia 128, 15-23.
35
M. Al-Najjar Flow of light energy in microbial mats
Tchernov, D., Hassidim, M., Vardi, A., Luz, B., Sukenik, A., Reinhold, L., Kaplan, A., 1998. Photosynthesizing marine microorganisms can constitute a source of CO2 rather than a sink. Canadian Journal of Botany-Revue Canadienne De Botanique 76, 949-953.
Vasudevan, P.T., Briggs, M., 2008. Biodiesel production-current state of the art and
challenges. Journal of Industrial Microbiology & Biotechnology 35, 421-430. Vopel, K., Hawes, I., 2006. Photosynthetic performance of benthic microbial mats in Lake
Hoare, Antarctica. Limnology and Oceanography 51, 1801-1812. Ward, D.M., Ferris, M.J., Nold, S.C., Bateson, M.M., 1998. A natural view of microbial
biodiversity within hot spring cyanobacterial mat communities. Microbiology and Molecular Biology Reviews 62, 1353-+.
Ward, D.M., Santegoeds, C.M., Nold, S.C., Ramsing, N.B., Ferris, M.J., Bateson, M.M.,
1997. Biodiversity within hot spring microbial mat communities: Molecular monitoring of enrichment cultures. Antonie Van Leeuwenhoek International Journal of General and Molecular Microbiology 71, 143-150.
Webb, W.L., Newton, M., Starr, D., 1974. Carbon-dioxide exchange of Alnus-Rubra - mathematical-model. Oecologia 17, 281-291.
Weng, X.Y., Xu, H.X., Yang, Y., Peng, H.H., 2008. Water-water cycle involved in
dissipation of excess photon energy in phosphorus deficient rice leaves. Biologia Plantarum 52, 307-313.
Whitmarsh, J., Govindjee, 1999. The photosynthetic process, In Concepts in photobiology:
photosynthesis and photomorphogenesis. ed. G.R. GS Singhal, SK Sopory, K-D Irrgang and Govindjee, pp. 11-51. Narosa Publishers/New Delhi; and Kluwer Academic/Dordrecht
Wieland, A., Kühl, M., 2000a. Irradiance and temperature regulation of oxygenic
photosynthesis and O2 consumption in a hypersaline cyanobacterial mat (Solar Lake, Egypt). Marine Biology 137, 71-85.
Wieland, A., Kühl, M., 2000b. Short-term temperature effects on oxygen and sulfide
cycling in a hypersaline cyanobacterial mat (Solar Lake, Egypt). Marine Ecology-Progress Series 196, 87-102.
Wieland, A., Zopfi, J., Benthien, A., Kuhl, M., 2005. Biogeochemistry of an iron-rich
hypersaline microbial mat (Camargue, France). Microbial Ecology 49, 34-49. Williams, P., Thomas, D.N., Reynolds, C.S., 2002. Phytoplankton productivity: Carbon
assimilation in marine and freshwater ecology. Wiley-Blackwell, Oxford. Wilmotte, A., 1994. Molecular evolution and taxonomy of the cyanobacteria, In The
molecular biology of cyanobacteria. ed. D. Bryant, pp. 1-25. Kluwer Academic, Dordrecht.
Woelfel, J., Sorensen, K., Warkentin, M., Forster, S., Oren, A., Schumann, R., 2009.
Oxygen evolution in a hypersaline crust: in situ photosynthesis quantification by
36

Chapter 1 Introduction
microelectrode profiling and use of planar optode spots in incubation chambers. Aquatic Microbial Ecology 56, 263-273.
Zhu, X.G., Long, S.P., Ort, D.R., 2008. What is the maximum efficiency with which
photosynthesis can convert solar energy into biomass? Current Opinion in Biotechnology 19, 153-159.
37
M. Al-Najjar Flow of light energy in microbial mats
Chapter 2
Conversion and conservation of light energy
in a photosynthetic microbial mat ecosystem
Mohammad A. A. Al-Najjar1 , Dirk de Beer1 , Bo Barker Jørgensen1 ,
Michael Kühl , Lubos Polerecky1 2
1 Max-Planck Institute for Marine Microbiology, Celsiusstrasse 1, D-28359 Bremen,
Germany 2 Marine Biological Laboratory, Department of Biology, University of Copenhagen,
Strandpromenaden 5, DK-3000 Helsingør, Denmark
The work in this chapter was published in the ISME Journal, 2010
Al-Najjar, M.A.A. et al, 2010. The ISME Journal 4, 440-449.
38
M Al-Najjar Flow of light energy in microbial mats
Conversion and Conservation of Light Energy
in a Photosynthetic Microbial mat Ecosystem
Mohammad Al-Najjar1 , Dirk de Beer1 , Bo Barker Jørgensen1 ,
Michael Kühl , Lubos Polerecky1 2
1 Max-Planck Institute for Marine Microbiology, Celsiusstrasse 1, D-28359 Bremen,
Germany 2 Marine Biological Laboratory, Department of Biology, University of Copenhagen,
Strandpromenaden 5, DK-3000 Helsingør, Denmark
Running title: Light conversion in a microbial mat ecosystem
Subject Category: Microbial ecosystem impacts
Keywords: efficiency / light conversion / microbial mats / microsensors /
photosynthesis
Abbreviations: PS, photosynthesis; PAR, photosynthetically available radiation (400-
700 nm); QE, quantum efficiency; EE, energy efficiency
� 39
Chapter 2 Light conversion in microbial mats
Abstract
Here we present, to the best of our knowledge, the first balanced light energy budget for a
benthic microbial mat ecosystem, and show how the budget and the spatial distribution of
the local photosynthetic efficiencies within the euphotic zone depend on the absorbed
irradiance (Jabs). Our approach employs microscale measurements of the rates of heat
dissipation, gross photosynthesis and light absorption in the system, and a model describing
light propagation and conversion in a scattering-absorbing medium. The energy budget was
dominated by heat dissipation on the expense of photosynthesis: at light limiting conditions,
95.5% of the absorbed light energy dissipated as heat and 4.5% was channeled into
photosynthesis. This energy disproportionation changed in favor of heat dissipation at
increasing irradiance, with > 99% of the absorbed light energy being dissipated as heat and
< 1% utilized by photosynthesis at Jabs > 700 �mol photon m-2 s-1 (> 150 J m-2 s-1).
Maximum photosynthetic efficiencies varied with depth in the euphotic zone between
0.014�0.047 O2 photon-1. Due to steep light gradients, photosynthetic efficiencies varied
differently with increasing irradiances at different depths in the euphotic zone; e.g., at Jabs >
700 �mol photon m-2 s-1, they reached around 10% of the maximum values at depths 0�0.3
mm and progressively increased towards 100% below 0.3 mm. The present study provides
the base for addressing in much more detail the photobiology of densely populated
photosynthetic systems with intense absorption and scattering. Furthermore, our analysis
has promising applications in other areas of photosynthesis research such as plant biology
and biotechnology.
�40
M Al-Najjar Flow of light energy in microbial mats
Introduction
About J of solar energy is anually absorbed by the Earth's surface and
atmosphere. The total energy consumption of humans in 2007 was 0.01% of this flux,
whereas the primary productivity of global ecosystems is estimated at around 0.1%
(Makarieva et al., 2008). Thus, the amount of solar energy that is available but not yet
harvested is enormous. Photosynthesis offers a possibility to utilize this energy source, as it
is a mechanism by which solar energy is converted into chemical energy and stored as
biomass in phototrophic organisms such as plants, algae or cyanobacteria. Once stored, the
organic material can serve as food for heterotrophic organisms, or can be further converted
to other forms of usable energy such as fuel (Ragauskas et al., 2006). Therefore, the study
of photosynthetic efficiency is a very active research field, especially in recent years due to
a growing demand for biofuels and technologies for sustainable energy production
(Ragauskas et al., 2006; Mussgnug et al., 2007; Dismukes et al., 2008; Rosenberg et al.,
2008).
24103.8�
Research on photosynthetic efficiency has mainly focused on plants (Singsaas et al.,
2001; Zhu et al., 2008) and planktonic algae (Dubinsky et al., 1986; Flameling and
Kromkamp, 1998; Rosenberg et al., 2008). The measurements are typically conducted in a
homogeneous light field allowing a uniform transfer of light energy to the studied
photosynthetic system and thus facilitating detailed studies of underlying physiological
mechanisms of light adaptation and acclimation. Benthic photosynthetic systems such as
biofilms and microbial mats constitute an important component of shallow water habitats by
contributing significantly to primary productivity (Cahoon 1999; Guerrero et al., 2002), but
the photosynthetic efficiency and energy budget for such systems are virtually unexplored.
Photosynthetic microbial mats are complex and highly compacted microbial ecosystems,
where a high diversity of phototrophic and heterotrophic populations interact within a few
� 41
Chapter 2 Light conversion in microbial mats
millimeters thick photosynthetically active (euphotic) zone (vanGemerden, 1993; Stal,
2000). Because of the high concentration of cells and the presence of abiotic components
such as sediment particles, these benthic systems are fundamentally different from the
terrestrial and planktonic systems investigated so far in that the light field is highly
heterogeneous on spatial scales comparable with the size of and the distance between the
individual organisms (Kühl and Jørgensen, 1992; Kühl and Jørgensen, 1994; Kühl et al.,
1994). To what extent such pronounced light gradients affect the photosynthetic efficiency
of the individual cells and the energy budget of these microbial ecosystems as a whole is
still an open question.
In photosynthesis research, the quantum efficiency (QE) is a frequently used measure
of light conversion, as the photochemical reactions are driven by photons that are absorbed
by the chlorophylls and their antenna in the photosystems and lead to a charge separation
across the thylakoid membrane. The photosynthetic QE is defined as the amount of CO2
molecules assimilated per number of photons absorbed. Assuming a 1:1 stoichiometry of
CO2 fixation and O2 production, which is reasonable when NH4+ is the predominant source
of nitrogen, rather than NO3-, QE can also be determined from the amount of O2 molecules
produced per photons absorbed. QE is typically derived either from CO2 or O2 exchange
measurements performed in flux chambers or by fluorimetry using variable Chlorophyll a
fluorescence measuring the quantum efficiency of PSII (Falkowski and Raven, 1997).
Assuming no losses, the maximal QE of photosynthesis is 0.125. This follows from the
basic photon requirements for the amount of electrons that need to be transferred to oxidize
water and reduce CO2, and from the fact that this electron transfer takes place sequentially
over two reaction centers, each requiring one photon to separate one electron (thus,
requiring in total 8 photons per CO2 molecule fixed or O2 molecule produced). Under light
limiting conditions QE in terrestrial plants and planktonic algae can reach up to 0.110-0.111
�42
M Al-Najjar Flow of light energy in microbial mats
� 43
(see supplementary Table S1), which is indeed close to the theoretical maximum.
The energy efficiency (EE) is the preferred measure when considering photosynthesis
in the context of energy production. EE is defined as the ratio between the energy stored as
biomass and the absorbed light energy, and can be quantified directly from biomass growth
experiments. Alternatively, EE can be derived from QE by considering the following steps:
First, in the light-dependent reactions, where O2 is formed by splitting of water, reducing
equivalents are used to form NADPH, and ATP is formed by the proton-motive force, the
energy gained and stored is kJ (mol O2)-1. This follows from the Gibbs free
energies of reactants in the reactions 2H2O + 2NADP O2 + 2NADPH + 2H
( kJ mol ) and ADP + P i ATP (
9.482=E
� �
1�
G
439=G 9.43=G kJ mol � , both at pH 7; Thauer
et al., 1977). Second, the molar energy content of light with wavelength
1
� is
)/(N= �� hcE A , where , , and are the Avogadro's number, the Planck constant and
the speed of light, respectively. Thus, assuming no intermediate losses, i.e., the energy
stored in the light-dependent reaction is fully used for CO2 fixation in the dark reaction
(equivalent to the assumption of O2:CO2 stoichiometry being equal to 1), a relationship
between EE and QE can be written as
AN h c
.QE=EE�EGE
1�
1�
(1)
Considering blue (450 nm) and red (670 nm) photons, which are most efficiently
absorbed by Chl a, the factor ranges between 1.8-2.7 photon O2 , averaging at
2.22 photon O2 for an “average” photon (550 nm) within the range of photosynthetically
active radiation (PAR, 400-700 nm). Thus, the theoretical maximum EE of photosynthetic
light utilization is about 27.7%. This represents a situation where all incident photons are
absorbed and utilized for O2 evolution and equivalent CO2 assimilation. The actual
�EEG /
Chapter 2 Light conversion in microbial mats
photosynthetic EE is lower, primarily because (i) capture of photons by photopigments and
channeling of their energy to the reaction center is inefficient, (ii) photons are absorbed by
cell components and accessory pigments that are not photosynthetically active, (iii) excess
excitation energy is dissipated as heat by non-photochemical quenching processes, and (iv)
part of the energy stored in the light-dependent reaction is used for other processes than
CO2 fixation (Schneider, 1973; Osmond, 1994; Huner et al., 1998; Zhu et al., 2008). Direct
biomass growth measurements for terrestrial C3 and C4 plants obtained EE values of 4.6
and 6.0%, respectively (Table S1; Zhu et al., 2008). Hitherto the photosynthetic EE in
benthic biofilms and microbial mats is unexplored.
Detailed studies of microbenthic PS require specialized tools and methods to resolve
the distribution of light and photosynthetic activity at relevant spatial scales. Oxygen
microsensors can resolve the steep concentration gradients of O2 in microbial mats at �m
resolution and the light-dependent O2 dynamics at 0.1�0.2 s resolution (Revsbech et al.,
1983; Revsbech and Jørgensen, 1986). Using the so-called light-dark shift method
(Revsbech and Jørgensen, 1983), O2 microsensors can measure the volumetric rates of gross
photosynthetic with a spatial resolution of 100�200 �m. When combined with
measurements of the locally available light using fiber-optic microprobes (Kühl, 2005), the
vertical distribution of the relative photosynthetic efficiency within a microbial mat can be
quantified (Lassen et al., 1992b). Microscale measurements of volumetric gross PS are
typically done throughout the mm-thin euphotic zone under different incident irradiance
levels and are then integrated over depth to yield the areal rate of gross PS for the entire
ecosystem as a function of the incident irradiance. We compiled such data from a number of
sources and, assuming that 90% of the incident irradiance was absorbed and utilized,
obtained maximal QE for benthic photosynthetic systems in the range of 0.01�0.07 (Table
S1). In principle, Eq. 1 could be used to simply convert QE to EE, but this approach would
�44
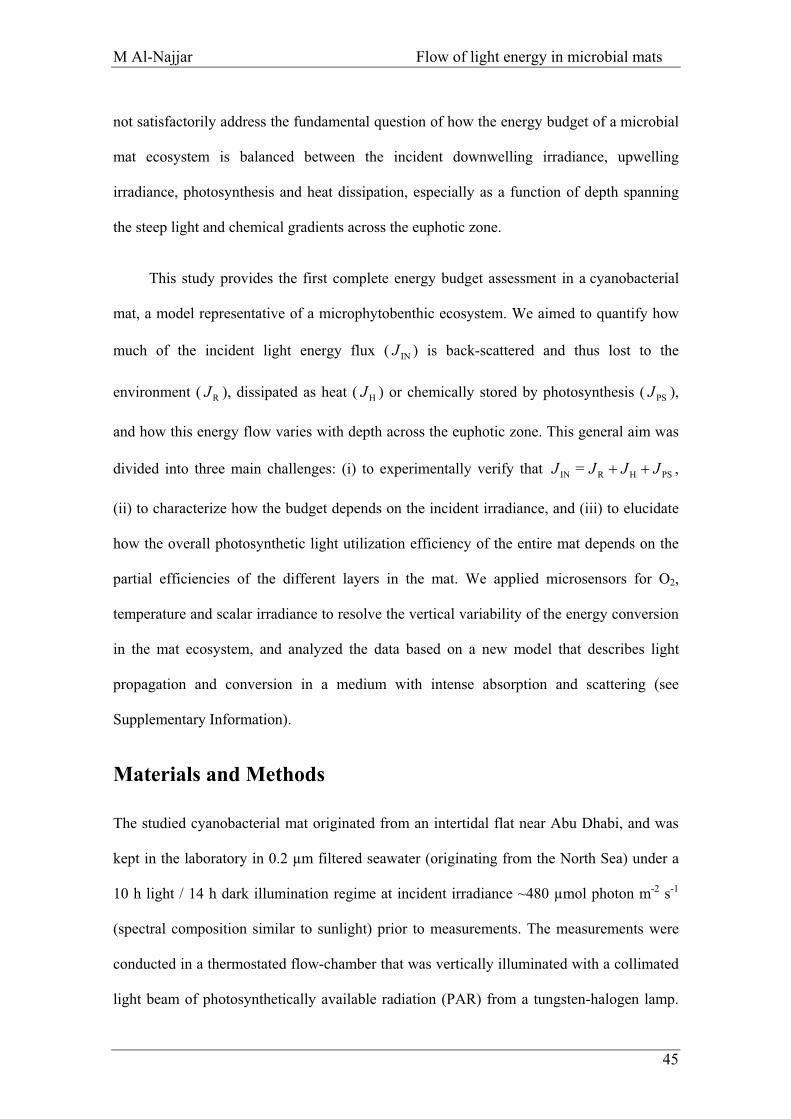
M Al-Najjar Flow of light energy in microbial mats
� 45
not satisfactorily address the fundamental question of how the energy budget of a microbial
mat ecosystem is balanced between the incident downwelling irradiance, upwelling
irradiance, photosynthesis and heat dissipation, especially as a function of depth spanning
the steep light and chemical gradients across the euphotic zone.
This study provides the first complete energy budget assessment in a cyanobacterial
mat, a model representative of a microphytobenthic ecosystem. We aimed to quantify how
much of the incident light energy flux ( ) is back-scattered and thus lost to the
environment ( ), dissipated as heat ( ) or chemically stored by photosynthesis ( ),
and how this energy flow varies with depth across the euphotic zone. This general aim was
divided into three main challenges: (i) to experimentally verify that ,
(ii) to characterize how the budget depends on the incident irradiance, and (iii) to elucidate
how the overall photosynthetic light utilization efficiency of the entire mat depends on the
partial efficiencies of the different layers in the mat. We applied microsensors for O2,
temperature and scalar irradiance to resolve the vertical variability of the energy conversion
in the mat ecosystem, and analyzed the data based on a new model that describes light
propagation and conversion in a medium with intense absorption and scattering (see
Supplementary Information).
INJ
J J J
= JJJ �
R H PS
PSJ�HRIN
Materials and Methods
The studied cyanobacterial mat originated from an intertidal flat near Abu Dhabi, and was
kept in the laboratory in 0.2 μm filtered seawater (originating from the North Sea) under a
10 h light / 14 h dark illumination regime at incident irradiance ~480 μmol photon m-2 s-1
(spectral composition similar to sunlight) prior to measurements. The measurements were
conducted in a thermostated flow-chamber that was vertically illuminated with a collimated
light beam of photosynthetically available radiation (PAR) from a tungsten-halogen lamp.
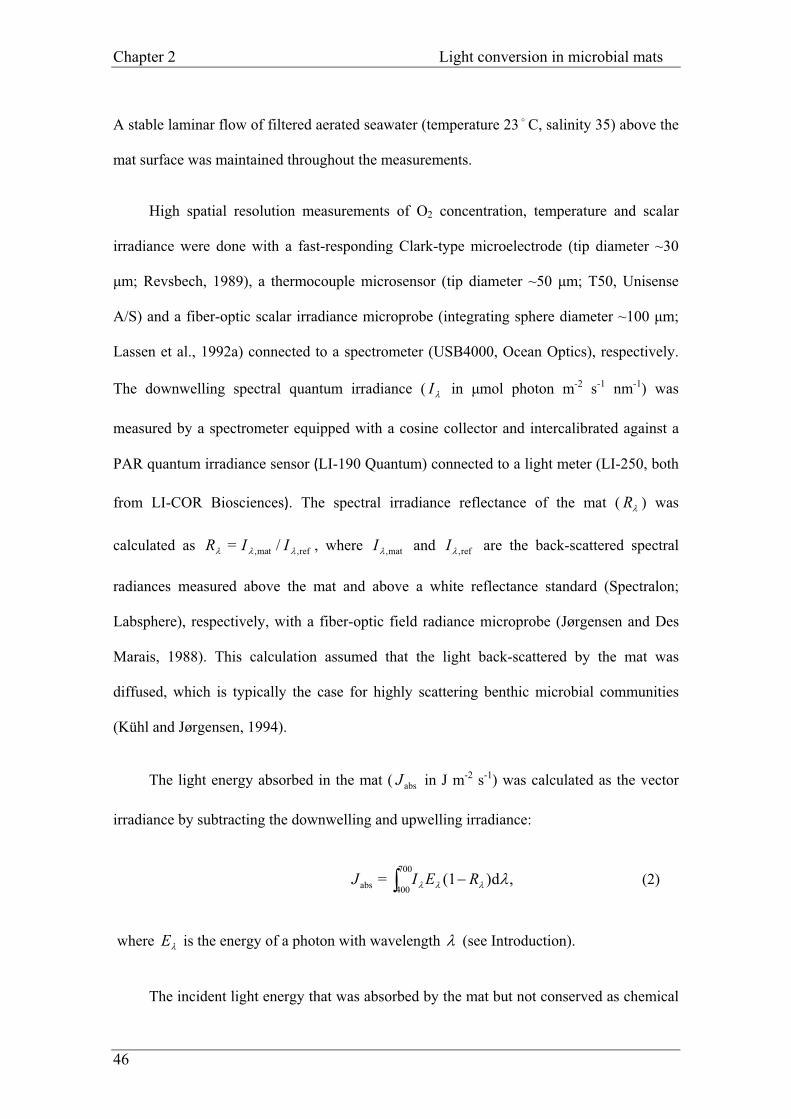
Chapter 2 Light conversion in microbial mats
�46
A stable laminar flow of filtered aerated seawater (temperature 23 � C, salinity 35) above the
mat surface was maintained throughout the measurements.
High spatial resolution measurements of O2 concentration, temperature and scalar
irradiance were done with a fast-responding Clark-type microelectrode (tip diameter ~30
�m; Revsbech, 1989), a thermocouple microsensor (tip diameter ~50 �m; T50, Unisense
A/S) and a fiber-optic scalar irradiance microprobe (integrating sphere diameter ~100 �m;
Lassen et al., 1992a) connected to a spectrometer (USB4000, Ocean Optics), respectively.
The downwelling spectral quantum irradiance ( in �mol photon m-2 s-1 nm-1) was
measured by a spectrometer equipped with a cosine collector and intercalibrated against a
PAR quantum irradiance sensor (LI-190 Quantum) connected to a light meter (LI-250, both
from LI-COR Biosciences). The spectral irradiance reflectance of the mat ( ) was
calculated as , where and are the back-scattered spectral
radiances measured above the mat and above a white reflectance standard (Spectralon;
Labsphere), respectively, with a fiber-optic field radiance microprobe (Jørgensen and Des
Marais, 1988). This calculation assumed that the light back-scattered by the mat was
diffused, which is typically the case for highly scattering benthic microbial communities
(Kühl and Jørgensen, 1994).
�I
R
IIR I I
J
700
E
�
ref,mat, /= ��� mat,� ref,�
The light energy absorbed in the mat ( in J m-2 s-1) was calculated as the vector
irradiance by subtracting the downwelling and upwelling irradiance:
abs
(2) ,d)(1=400abs ���� REIJ ��
where is the energy of a photon with wavelength � � (see Introduction).
The incident light energy that was absorbed by the mat but not conserved as chemical
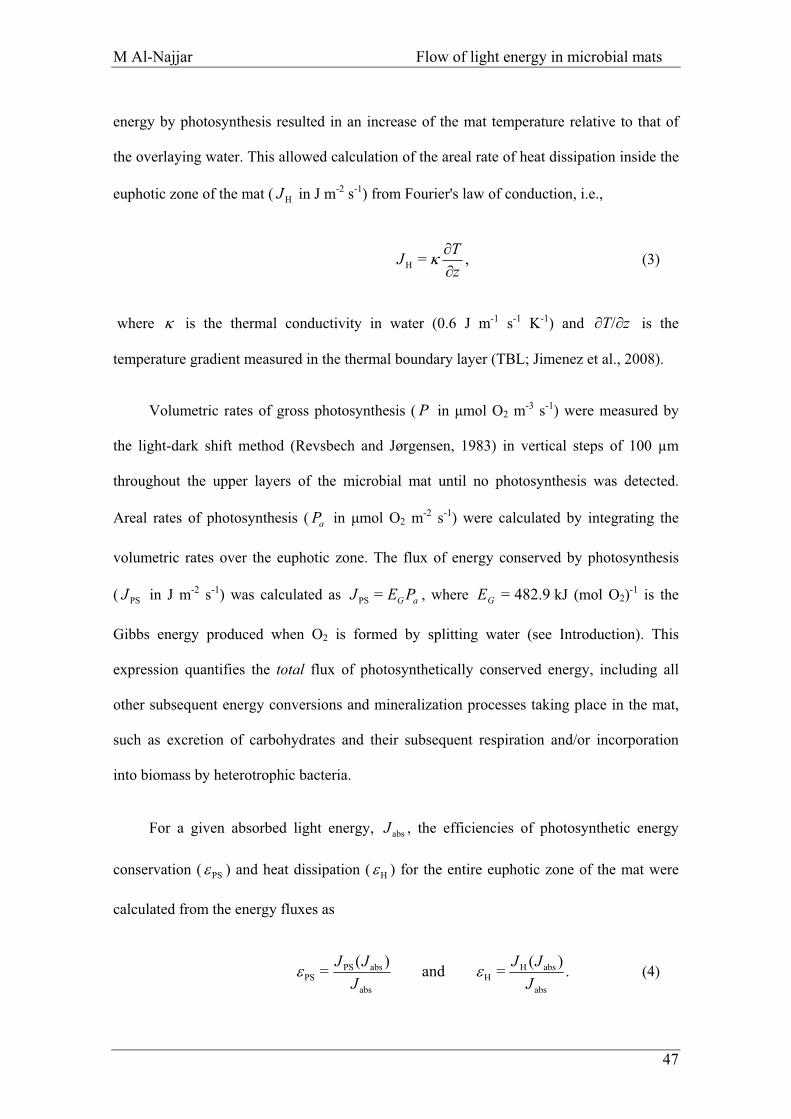
M Al-Najjar Flow of light energy in microbial mats
� 47
energy by photosynthesis resulted in an increase of the mat temperature relative to that of
the overlaying water. This allowed calculation of the areal rate of heat dissipation inside the
euphotic zone of the mat ( in J m-2 s-1) from Fourier's law of conduction, i.e., HJ
,=H zJ
�T� (3)
where is the thermal conductivity in water (0.6 J m-1 s-1 K-1) and � is the
temperature gradient measured in the thermal boundary layer (TBL; Jimenez et al., 2008).
zT �/
P
P
J PEJ = 9.482=E
J
Volumetric rates of gross photosynthesis ( in �mol O2 m-3 s-1) were measured by
the light-dark shift method (Revsbech and Jørgensen, 1983) in vertical steps of 100 μm
throughout the upper layers of the microbial mat until no photosynthesis was detected.
Areal rates of photosynthesis ( in �mol O2 m-2 s-1) were calculated by integrating the
volumetric rates over the euphotic zone. The flux of energy conserved by photosynthesis
( in J m-2 s-1) was calculated as , where kJ (mol O2)-1 is the
Gibbs energy produced when O2 is formed by splitting water (see Introduction). This
expression quantifies the total flux of photosynthetically conserved energy, including all
other subsequent energy conversions and mineralization processes taking place in the mat,
such as excretion of carbohydrates and their subsequent respiration and/or incorporation
into biomass by heterotrophic bacteria.
a
PS aGPS G
For a given absorbed light energy, , the efficiencies of photosynthetic energy
conservation (
abs
PS� ) and heat dissipation ( H� ) for the entire euphotic zone of the mat were
calculated from the energy fluxes as
.=and=abs
absHH
abs
absPSPS JJ
�� )()( JJJJ (4)
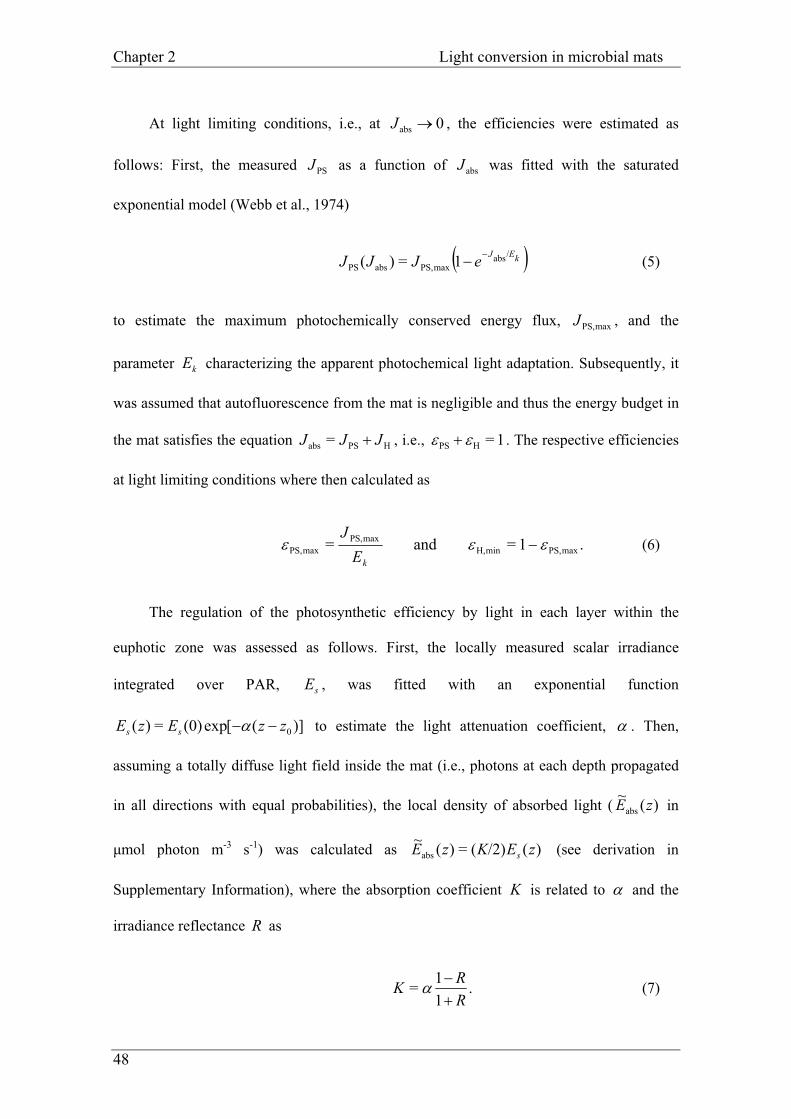
Chapter 2 Light conversion in microbial mats
�48
At light limiting conditions, i.e., at , the efficiencies were estimated as
follows: First, the measured as a function of was fitted with the saturated
exponential model (Webb et al., 1974)
0absJ
J JPS abs
� �keJJJ absmaxPS,absPS 1=)( � EJ /�
J
E
= JJJ
(5)
to estimate the maximum photochemically conserved energy flux, , and the
parameter characterizing the apparent photochemical light adaptation. Subsequently, it
was assumed that autofluorescence from the mat is negligible and thus the energy budget in
the mat satisfies the equation
maxPS,
k
HPSabs � , i.e., 1=HPS �� � . The respective efficiencies
at light limiting conditions where then calculated as
.1=and= maxPS,minH,maxPS,
maxPS, ��� �kE
J
E
��
(6)
The regulation of the photosynthetic efficiency by light in each layer within the
euphotic zone was assessed as follows. First, the locally measured scalar irradiance
integrated over PAR, , was fitted with an exponential function s
)]([exp(0)=)( 0zzEzE ss � to estimate the light attenuation coefficient, � . Then,
assuming a totally diffuse light field inside the mat (i.e., photons at each depth propagated
in all directions with equal probabilities), the local density of absorbed light ( )(~absE z in
�mol photon m-3 s-1) was calculated as )(/2)(=)(~abs zEKzE s (see derivation in
Supplementary Information), where the absorption coefficient K is related to � and the
irradiance reflectance R as
.1
=R
K�
1 R�� (7)
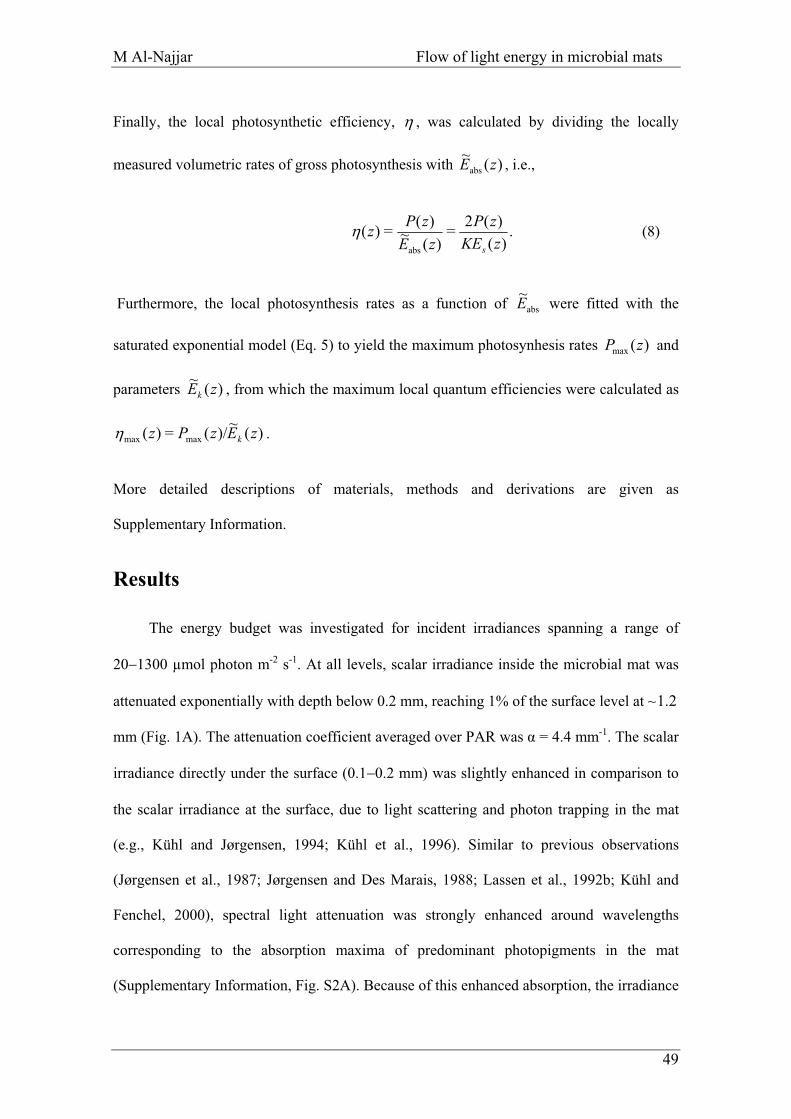
M Al-Najjar Flow of light energy in microbial mats
� 49
Finally, the local photosynthetic efficiency, � , was calculated by dividing the locally
measured volumetric rates of gross photosynthesis with )(~abs zE , i.e.,
.)(
=)(~=)(
abs zKEzEz
s
� )(2)( zPzP (8)
Furthermore, the local photosynthesis rates as a function of abs~E were fitted with the
saturated exponential model (Eq. 5) to yield the maximum photosynhesis rates and
parameters
)(zPmax
)(~ zEk , from which the maximum local quantum efficiencies were calculated as
)(~)/(max zP=)(max zEz k� .
More detailed descriptions of materials, methods and derivations are given as
Supplementary Information.
Results
The energy budget was investigated for incident irradiances spanning a range of
20�1300 μmol photon m-2 s-1. At all levels, scalar irradiance inside the microbial mat was
attenuated exponentially with depth below 0.2 mm, reaching 1% of the surface level at ~1.2
mm (Fig. 1A). The attenuation coefficient averaged over PAR was � = 4.4 mm-1. The scalar
irradiance directly under the surface (0.1�0.2 mm) was slightly enhanced in comparison to
the scalar irradiance at the surface, due to light scattering and photon trapping in the mat
(e.g., Kühl and Jørgensen, 1994; Kühl et al., 1996). Similar to previous observations
(Jørgensen et al., 1987; Jørgensen and Des Marais, 1988; Lassen et al., 1992b; Kühl and
Fenchel, 2000), spectral light attenuation was strongly enhanced around wavelengths
corresponding to the absorption maxima of predominant photopigments in the mat
(Supplementary Information, Fig. S2A). Because of this enhanced absorption, the irradiance
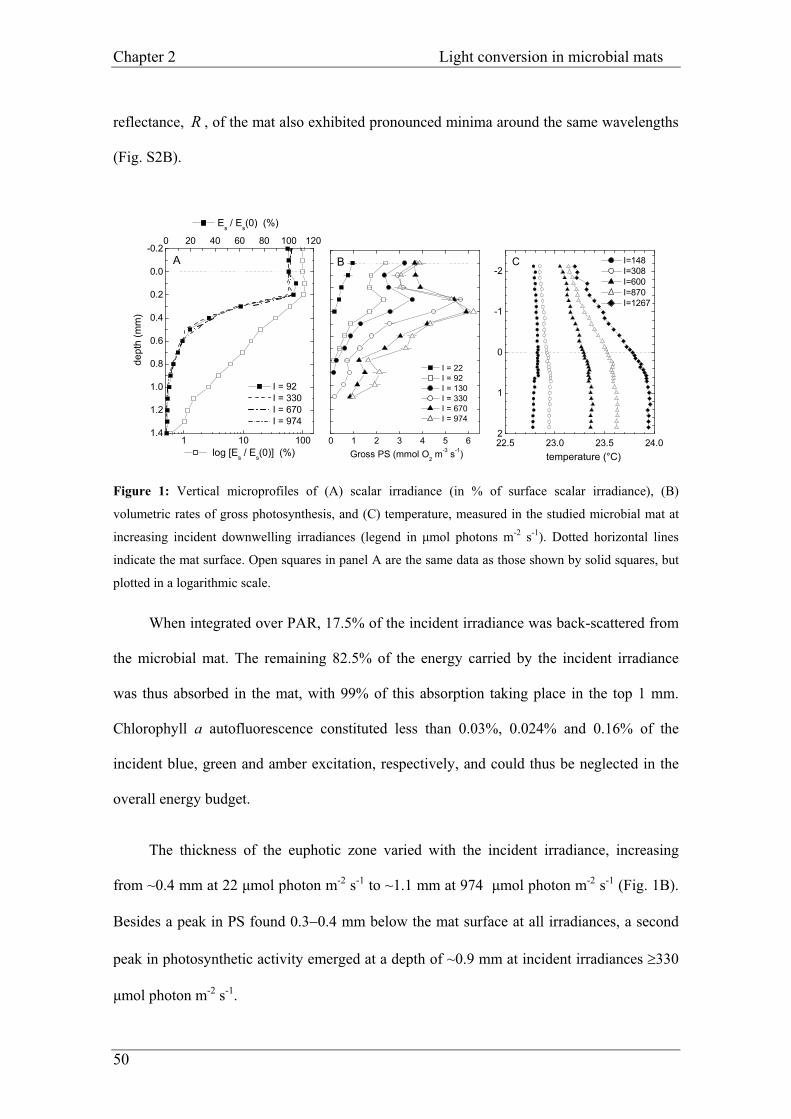
Chapter 2 Light conversion in microbial mats
�50
reflectance, R , of the mat also exhibited pronounced minima around the same wavelengths
(Fig. S2B).
Figure 1: Vertical microprofiles of (A) scalar irradiance (in % of surface scalar irradiance), (B)
volumetric rates of gross photosynthesis, and (C) temperature, measured in the studied microbial mat at
increasing incident downwelling irradiances (legend in �mol photons m-2 s-1). Dotted horizontal lines
indicate the mat surface. Open squares in panel A are the same data as those shown by solid squares, but
plotted in a logarithmic scale.
When integrated over PAR, 17.5% of the incident irradiance was back-scattered from
the microbial mat. The remaining 82.5% of the energy carried by the incident irradiance
was thus absorbed in the mat, with 99% of this absorption taking place in the top 1 mm.
Chlorophyll a autofluorescence constituted less than 0.03%, 0.024% and 0.16% of the
incident blue, green and amber excitation, respectively, and could thus be neglected in the
overall energy budget.
The thickness of the euphotic zone varied with the incident irradiance, increasing
from ~0.4 mm at 22 �mol photon m-2 s-1 to ~1.1 mm at 974 �mol photon m-2 s-1 (Fig. 1B).
Besides a peak in PS found 0.3�0.4 mm below the mat surface at all irradiances, a second
peak in photosynthetic activity emerged at a depth of ~0.9 mm at incident irradiances �330
�mol photon m-2 s-1.
1.4
1.2
1.0
0.8
0.6
0.4
0.2
0.0
-0.2
1 10 100 log [Es / Es(0)] (%)
dept
h (m
m)
0 40 60 80 100 12020
I = 92 I = 330 I = 670 I = 974
A
Es / Es(0) (%)
0 1 2 3 4 5 6
B
Gross PS (mmol O2 m-3 s-1)
I = 22 I = 92 I = 130 I = 330 I = 670 I = 974
2
1
0
-1
-2
22.5 23.0 23.5 24.0
C
temperature (°C)
I=148 I=308 I=600 I=870 I=1267
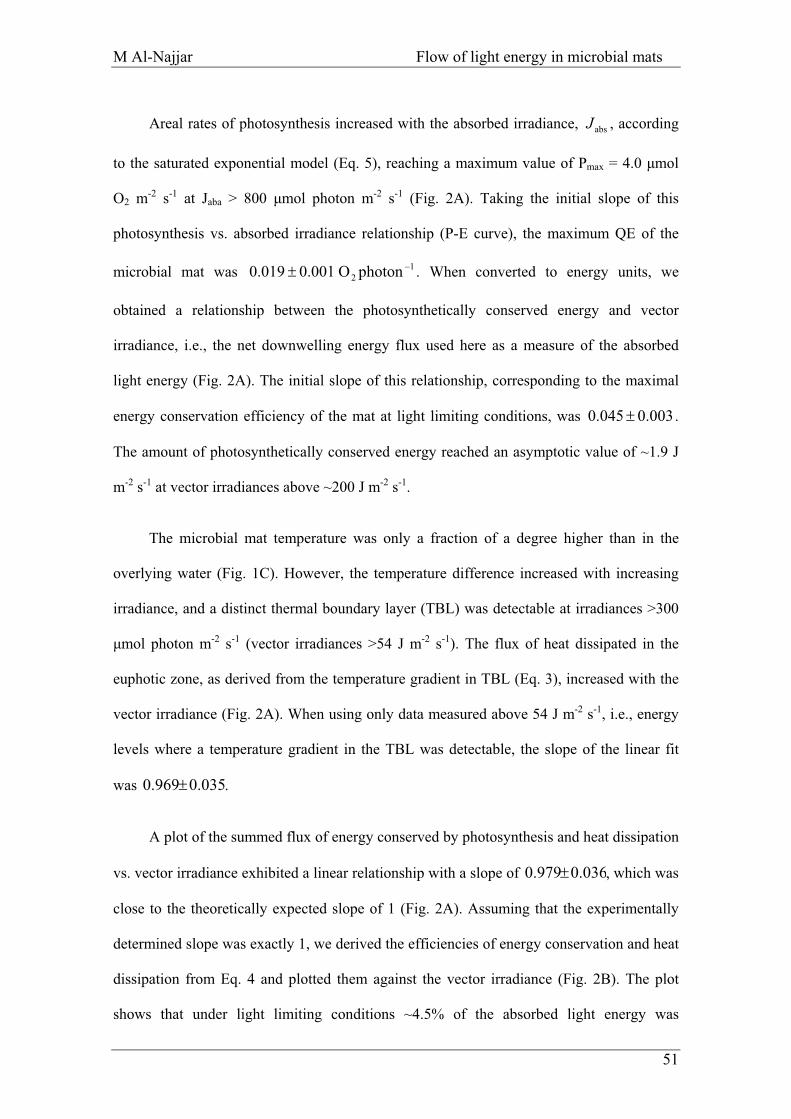
M Al-Najjar Flow of light energy in microbial mats
� 51
Areal rates of photosynthesis increased with the absorbed irradiance, , according
to the saturated exponential model (Eq. 5), reaching a maximum value of Pmax = 4.0 �mol
O2 m-2 s-1 at Jaba > 800 �mol photon m-2 s-1 (Fig. 2A). Taking the initial slope of this
photosynthesis vs. absorbed irradiance relationship (P-E curve), the maximum QE of the
microbial mat was . When converted to energy units, we
obtained a relationship between the photosynthetically conserved energy and vector
irradiance, i.e., the net downwelling energy flux used here as a measure of the absorbed
light energy (Fig. 2A). The initial slope of this relationship, corresponding to the maximal
energy conservation efficiency of the mat at light limiting conditions, was .
The amount of photosynthetically conserved energy reached an asymptotic value of ~1.9 J
m-2 s-1 at vector irradiances above ~200 J m-2 s-1.
absJ
0.045
0.0010.019 � 1�
0.003�
0.0350.969�
0.03
2 photonO
The microbial mat temperature was only a fraction of a degree higher than in the
overlying water (Fig. 1C). However, the temperature difference increased with increasing
irradiance, and a distinct thermal boundary layer (TBL) was detectable at irradiances >300
�mol photon m-2 s-1 (vector irradiances >54 J m-2 s-1). The flux of heat dissipated in the
euphotic zone, as derived from the temperature gradient in TBL (Eq. 3), increased with the
vector irradiance (Fig. 2A). When using only data measured above 54 J m-2 s-1, i.e., energy
levels where a temperature gradient in the TBL was detectable, the slope of the linear fit
was .
A plot of the summed flux of energy conserved by photosynthesis and heat dissipation
vs. vector irradiance exhibited a linear relationship with a slope of 60.979 , which was
close to the theoretically expected slope of 1 (Fig. 2A). Assuming that the experimentally
determined slope was exactly 1, we derived the efficiencies of energy conservation and heat
dissipation from Eq. 4 and plotted them against the vector irradiance (Fig. 2B). The plot
shows that under light limiting conditions ~4.5% of the absorbed light energy was
�
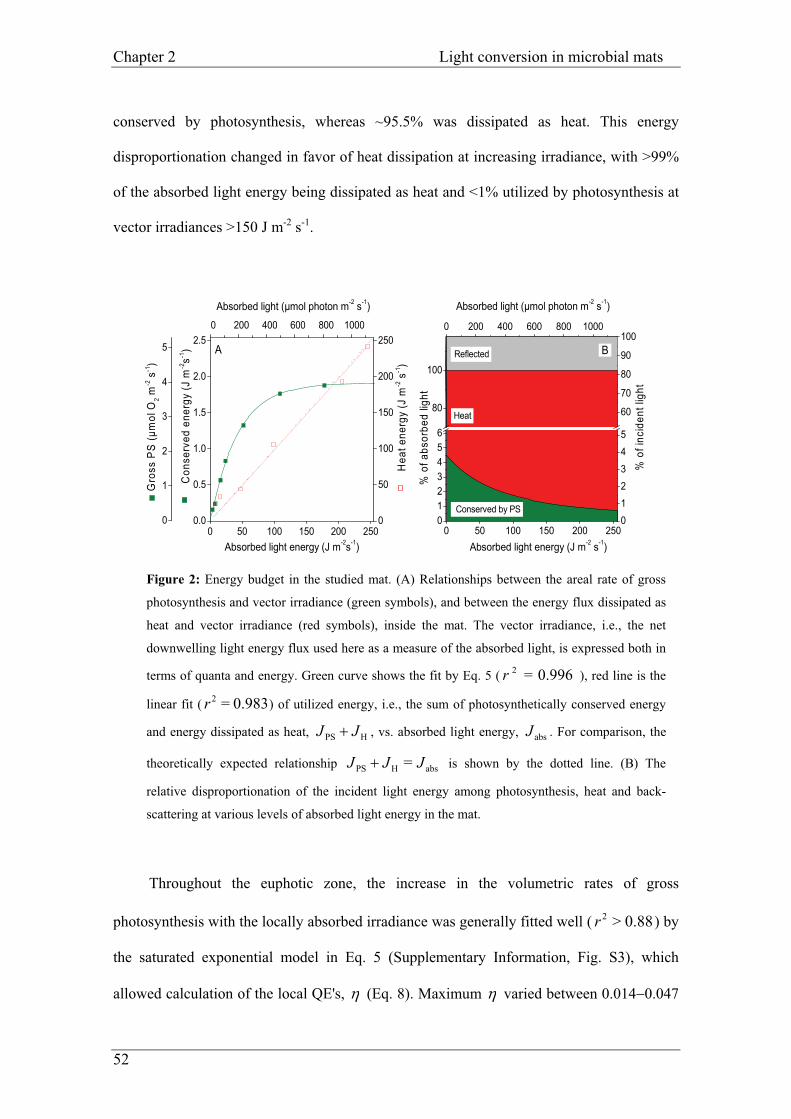
Chapter 2 Light conversion in microbial mats
�52
conserved by photosynthesis, whereas ~95.5% was dissipated as heat. This energy
disproportionation changed in favor of heat dissipation at increasing irradiance, with >99%
of the absorbed light energy being dissipated as heat and <1% utilized by photosynthesis at
vector irradiances >150 J m-2 s-1.
Throughout the euphotic zone, the increase in the volumetric rates of gross
photosynthesis with the locally absorbed irradiance was generally fitted well ( ) by
the saturated exponential model in Eq. 5 (Supplementary Information, Fig. S3), which
allowed calculation of the local QE's,
0.88>r 2
� (Eq. 8). Maximum � varied between 0.014�0.047
0 200 400 600 800 1000
012345
60
70
80
90
100
0 50 100 150 200 2500.0
0.5
1.0
1.5
2.0
2.50 200 400 600 800 1000
0
1
2
3
4
5
0 50 100 150 200 2500123456
80
100Reflected
Heat
Conserved by PS
% o
f abs
orbe
d lig
ht
Absorbed light energy (J m-2 s-1)
B
% o
f inc
iden
t lig
ht
A
Con
serv
ed e
nerg
y (J
m-2s-1
)
Absorbed light energy (J m-2s-1)
0
50
100
150
200
250
Hea
t ene
rgy
(J m
-2 s
-1)
Absorbed light (µmol photon m-2 s-1) Absorbed light (µmol photon m-2 s-1)
Gro
ss P
S (µ
mol
O2 m
-2 s
-1)
Figure 2: Energy budget in the studied mat. (A) Relationships between the areal rate of gross
photosynthesis and vector irradiance (green symbols), and between the energy flux dissipated as
heat and vector irradiance (red symbols), inside the mat. The vector irradiance, i.e., the net
downwelling light energy flux used here as a measure of the absorbed light, is expressed both in
terms of quanta and energy. Green curve shows the fit by Eq. 5 ( ), red line is the
linear fit ( ) of utilized energy, i.e., the sum of photosynthetically conserved energy
and energy dissipated as heat,
0.996=r 2
2
JJ
0.983=r
HPS � , vs. absorbed light energy, . For comparison, the
theoretically expected relationship
absJ
absH =PSJ JJ� is shown by the dotted line. (B) The
relative disproportionation of the incident light energy among photosynthesis, heat and back-
scattering at various levels of absorbed light energy in the mat.
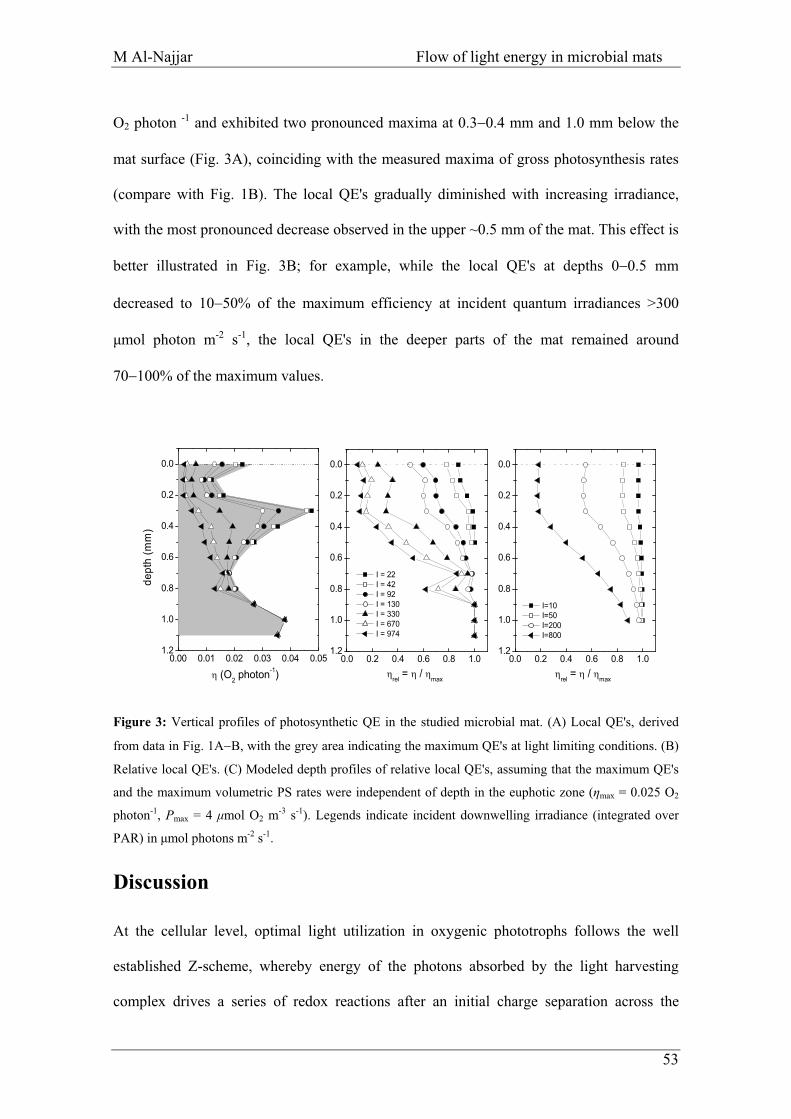
M Al-Najjar Flow of light energy in microbial mats
O2 photon -1 and exhibited two pronounced maxima at 0.3�0.4 mm and 1.0 mm below the
mat surface (Fig. 3A), coinciding with the measured maxima of gross photosynthesis rates
(compare with Fig. 1B). The local QE's gradually diminished with increasing irradiance,
with the most pronounced decrease observed in the upper ~0.5 mm of the mat. This effect is
better illustrated in Fig. 3B; for example, while the local QE's at depths 0�0.5 mm
decreased to 10�50% of the maximum efficiency at incident quantum irradiances >300
�mol photon m-2 s-1, the local QE's in the deeper parts of the mat remained around
70�100% of the maximum values.
1.2
1.0
0.8
0.6
0.4
0.2
0.0
0.0 0.2 0.4 0.6 0.8 1.01.2
1.0
0.8
0.6
0.4
0.2
0.0
0.0 0.2 0.4 0.6 0.8 1.01.2
1.0
0.8
0.6
0.4
0.2
0.0
0.00 0.01 0.02 0.03 0.04 0.05
I = 22 I = 42 I = 92 I = 130 I = 330 I = 670 I = 974
�rel = � / �max �rel = � / �max
I=10 I=50 I=200 I=800
� (O2 photon-1)
dept
h (m
m)
Figure 3: Vertical profiles of photosynthetic QE in the studied microbial mat. (A) Local QE's, derived
from data in Fig. 1A�B, with the grey area indicating the maximum QE's at light limiting conditions. (B)
Relative local QE's. (C) Modeled depth profiles of relative local QE's, assuming that the maximum QE's
and the maximum volumetric PS rates were independent of depth in the euphotic zone (�max = 0.025 O2
photon-1, Pmax = 4 �mol O2 m-3 s-1). Legends indicate incident downwelling irradiance (integrated over
PAR) in �mol photons m-2 s-1.
Discussion
At the cellular level, optimal light utilization in oxygenic phototrophs follows the well
established Z-scheme, whereby energy of the photons absorbed by the light harvesting
complex drives a series of redox reactions after an initial charge separation across the
� 53
Chapter 2 Light conversion in microbial mats
�54
photosynthetic membrane, resulting in the generation of a proton gradient (used for ATP
synthesis) and reduction equivalents. By coupling to the CO2 fixation machinery and
nutrient uptake, this process eventually results in the conversion of solar energy to chemical
energy bound in organic-C compounds. It also leads to evolution of molecular oxygen as a
byproduct. At very low photon fluxes, the rate of photosynthesis is limited by the rate of
excitation energy supply to the photosystems, the efficiency of primary photochemistry and
the stoichiometry of the two photoreactions required to generate the appropriate ATP and
NADPH stoichiometry for O2 evolution and CO2 fixation. At higher photon fluxes, the
redox reactions limit the rate of biochemical energy transformation, and only part of the
absorbed light energy is actually stored, while the rest is dissipated non-photochemically as
heat and fluorescence. Our measurements show that such a conceptual model of energy
flow can be formulated and experimentally validated for a photosynthetic microbial mat,
which represents a complex microbial ecosystem characterized by a high density of
phototrophic (and other) cells and steep light gradients.
We demonstrated that the sum of photosynthetically stored energy, , and energy
dissipated as heat, , accounted well for the total energy absorbed by the microbial mat,
. At high irradiance, the discrepancy between
PSJ
J
J JJ
H
abs HPS � and was only about 2%.
This was considered satisfactory to prove our original hypothesis about the energy flow,
especially when taking into account the experimental challenges involved, such as the
necessity to conduct accurate light, temperature and photosynthesis measurements at sub-
millimeter spatial resolution. At low irradiance, the discrepancy in the energy balance was
larger; e.g., although the slope of vs. was expected to decrease at low (due to
proportionally higher contribution of photosynthesis to light energy utilization), this was not
clear from our data, mainly because the temperature gradients measured at Jabs < 50 J m-2 s-1
were close to or below the detection limit of the temperature microsensor. Therefore, the
absJ
J J JH abs abs
M Al-Najjar Flow of light energy in microbial mats
� 55
determination of the energy conversion efficiencies at low irradiance relied on the
measurements of photosynthesis and on the assumption that the energy balance
remained valid for the entire range of investigated irradiances, although it
could be experimentally verified with satisfactory accuracy only at high irradiances.
HPSabs = JJJ �
In the studied microbial mat, a relatively large portion (17.5%) of the incident
photosynthetically active radiation was back-scattered and thus not utilized by the mat.
Auto-fluorescence emitted by pigments in the mat constituted only a negligible fraction in
the total energy budget. The remaining 82.5% of the incident irradiance was absorbed
within the top 0.4�1.1 mm of the mat. The majority of absorbed energy was dissipated as
heat, whereas chemically conserved energy constituted less than 4.5% (Fig. 2B). The
highest energy storage efficiency of the mat occurred under light limiting conditions. With
increasing irradiance, the photosynthetic efficiency decreased approximately inversely with
the absorbed light energy ( ), reaching less than 1% at Jabs more than 300 J m-2 s-1. 1abs�� J
At the cellular level, the fact that photosynthesis follows a saturation curve, and that
its efficiency therefore decreases, is foremost due to the enzymatic processes in the
photosynthetic apparatus becoming rate limiting at increasing irradiance. Additional factors
contributing to saturation, or even to inhibition at high irradiances, include enhanced
photorespiration or cyclic photophosphorylation, which generate some ATP, or the
formation of reactive oxygen species (ROS) that can affect PSII by damaging the D1
protein or by preventing its repair (Nishiyama et al., 2001; Hihara et al., 2001; Nishiyama et
al., 2004; Aarti et al., 2007; Latifi et al., 2009). Overall, the saturation dynamics of
photosynthesis with irradiance (P-E curve) can be described by a number of empirical
models (e.g., Eq. 5; Webb et al., 1974; see also MacIntyre et al. 2002). As demonstrated by
the P-E curves shown in Fig. S3, a qualitatively similar physiological mechanism regulates
photosynthetic activity in each individual layer of the mat's euphotic zone. However,
Chapter 2 Light conversion in microbial mats
although one can expect that the changes in the photosynthetic efficiency on the ecosystem
and cellular level are linked, the relationship between the two is complicated by the fact that
the light present in the ecosystem exhibits a pronounced gradient (e.g., the upper-most part
of the euphotic zone experienced ~100-fold higher light levels than the lower-most one; Fig.
1a).
This relationship can be qualitatively understood by examining the vertical
distribution of the local photosynthetic efficiencies as a function of irradiance. Comparing
figures 2A and 3A�B, it is clear that the energy storage efficiency of the entire mat at light
limiting conditions is maximal because all layers within the euphotic zone utilize the locally
available light with maximum efficiency. This implies that the areal photosynthesis rate
should initially increase approximately linearly with incident irradiance, which was indeed
observed. An increase in the incident irradiance leads to an increase in local light
availability for progressively deeper mat regions, with the upper layers experiencing a much
higher increase compared to the deeper mat layers due to a steep light gradient in the mat.
Consequently, the upper mat layers experience a more severe decrease in photosynthetic
efficiency than the lower ones. The overall effect is a decrease in efficiency of the entire
mat. However, the resulting value lies between those exhibited by the upper and lower parts
of the euphotic zone, because it is a weighted average over all photosynthetically active
layers. Such a decrease in efficiency results in the observed departure of the P-E
relationship (areal rates) from the straight line towards a curve with a lower derivative (Fig.
2a). This trend continues with increasing irradiance until the efficiency in most of the
euphotic zone is very low (Fig. 3A�B, triangles), leading to the observed saturation in the
areal rate of gross photosynthesis (Fig. 2A). We confirmed this conceptual description by a
simplified model, assuming similar but constant values for the maximum QE and the
maximum volumetric rate of photosynthesis as those determined experimentally throughout
the entire euphotic zone. By employing the measured light attenuation in the euphotic zone
�56
M Al-Najjar Flow of light energy in microbial mats
in the model, we were able to reproduce the observed spatial heterogeneities in the decrease
of the relative photosynthetic efficiency with the increasing irradiance levels (compare Figs.
3B and 3C).
The maximum QE ( ) in the studied mat is about 6-fold lower than
the theoretical maximum, and is also at the lower end of values compiled from studies of
various photosynthetic organisms, including higher plants, corals, macro- and microalgae
(Table S1). It needs to be realized, however, that our value represents the overall efficiency
of the entire mat ecosystem and not of the actual phototrophic cells. In mats, a large
proportion of the light energy is likely absorbed by abiotic (e.g., sediment particles or Fe
precipitates) or biotic but photosynthetically inactive components (e.g., protective sunscreen
pigments, detritus or phaeopigments). Thus, the true photosynthetic efficiency of the
phototrophic cells comprizing the mat is likely higher than estimated from our
measurements. Furthermore, there are other processes on the cellular level that cause
uncoupling between light utilization, O2 production and CO2 fixation, and thus effect the
estimated QE. For example, in cyclic photophosphorylation the energy of absorbed photons
is stored as ATP but no O2 is evolved, resulting in an underestimated QE based on O2
measurements. The Mehler reaction has a similar qualitative effect on QE, because O2
generated from oxidation of water is reduced to H2O2 and ultimately back to water, with
some ATP production. However, photorespiration can result in an overestimated QE values
when determined from O2 measurements, because RuBisCO reacts competitively with O2
instead of CO2, which leads to lower CO2 fixation than the measured O2 evolution.
Furthermore, part of the electrons generated from water oxidation are used for other
reductive processes in the cell, such as reduction of nitrogen and sulfur, leading also to QE
overestimation. Although the effects of these additonal processes are expected not to exceed
10% of the estimated QE at light limitting conditions (Falkowski and Raven, 1997), they
0.019 12 photonO �
� 57
Chapter 2 Light conversion in microbial mats
are probably more significant under higher photon fluxes, especially because of a strong
build-up of O2, reactive oxygen species (ROS) and pH in the euphotic zone. However, an
accurate quantification of such effects was not possible in our experimental approach.
The maximum QE in the studied mat exhibited a pronounced vertical stratification
(Fig. 3A). The peaks at depths of 0.3�0.4 and 1 mm could be either due to the phototrophic
cells being proportionally more abundant in these layers than the photosynthetically inactive
mat components, or because the phototrophic cells were indeed physiologically adapted or
acclimated to capture and utilize photons more efficiently (e.g., by having a higher pigment
content and/or absoption cross section). The position of these layers was probably the result
of cell growth at optimal light conditions within the gradient light field generated by the
incident light during mat growth. A detailed clarification of these interesting aspects would
go beyond the scope of this study, but could be experimentally investigated, e.g., by
conducting microscale variable fluorescence measurements to map photosynthetic biomass
in concert with quantum yields (Schreiber et al., 1996; Kühl, 2005) or by a range of new
imaging methods (Kühl and Polerecky, 2008).
The overall EE of the studied mat ecosystem was in the order of 1�2% at irradiances
corresponding to typical daytime values (100�1000 �mol photon m-2 s-1). This EE value
may seem low when compared to the theoretical maximum of 27.7% or to the maximum
efficiencies of individual organisms such as plants or microalgae (Table S1). However, the
studied microbial mat is about 10�20 times more efficient than the estimated primary
productivity of the global ecosystem, which converts around 0.1% of the available light to
biomass (Makarieva et al., 2008).
Besides presenting a new experimental approach for studying photosynthetic and
energy efficiencies, this study also presents a theoretical framework for the description of
�58
M Al-Najjar Flow of light energy in microbial mats
light energy propagation, conversion and conservation in benthic photosynthetic systems
such as microbial mats (see Supplementary Information). Due to a high density of
pigmented cells and other particles, light is intensively scattered and absorbed as it
propagates through the mat. This results in a rapid switch from incident predominantly
collimated light to diffuse light that is highly attenuated with depth in the mat (Kühl and
Jørgensen, 1992). Previous work showed that light absorption at a specific depth in the mat
could be quantified from combined measurements of the downwelling and upwelling
irradiance and the scalar irradiance (Kühl and Jørgensen, 1994). However, in practice such
measurements are laborious and difficult to use in complex samples.
In this study we show that the locally absorbed light can be estimated from the locally
available light. The proposed calculation (see Supplementary Information) was adapted
from the work of Yang et al. (2004), who extended the original Kubelka-Munk (K-M)
theory of light propagation in absorbing and scattering media. The essential step was the
realization that (i) the downwelling and upwelling photon fluxes, for which the K-M
formalism was originally developed, are proportional to the scalar irradiance if a totally
diffused light field is assumed, and that (ii) the absorption coefficient required to calculate
the absorbed light can be derived from the light attenuation coefficient obtained from the
vertical profile of scalar irradiance and the reflectance of the mat (see Eq. 7 and
Supplementary Information). Since all of these parameters can easily be measured, this is a
major advantage which now makes it possible to calculate photosynthetic efficiencies inside
dense assemblages of cells such as benthic biofilms or mats (Eq. 8). However, one needs to
be cautious with interpretation within the top 0.1�0.2 mm of the mat, where the light field is
anisotropic (Kühl and Jørgensen, 1994). However, this region forms only a relatively small
part of the euphotic zone.
In conclusion, this study represents, to the best of our knowledge, the first balanced
� 59
Chapter 2 Light conversion in microbial mats
assessment of the fate of light energy inside a microphytobenthic ecosystem. The energy
budget is dominated by heat dissipation and the efficiency of photosynthetic energy
conservation decreases with the increasing irradiance. Due to steep light gradients, this
decrease is highly heterogeneous across the euphotic zone. Moreover, we derived a
mathematical formula to quantify the locally absorbed light from easily measured
parameters, i.e., the light attenuation coefficient, the reflectance and the scalar irradiance.
Based on the present study it is now possible to address the photobiology of densely
populated biofilms and microbial mats with intense absorption and scattering in much more
detail, but our analysis may also find application in other areas of photosynthesis research
such as plant biology and biotechnology, e.g., when optimizing quantum yields and growth
efficiency of phototrophic cell cultures for biofuel production.
Acknowledgments
We thank the technicians of the microsensor group for microsensor construction and Paul
Faerber, Harald Osmers, Georg Herz and Volker Meyer for their technical support. We
thank Dr. Henk Jonkers and Prof. Friedrich Widdel for fruitful discussions, and Prof.
Waleed Hamza for his guidance and assistance during sampling. Two anonymous reviewers
are specially thanked for their useful comments and suggestions to improve the manuscript.
Financial support was provided by the Max Planck Society (to D. B., B. B. J. and L. P.), the
Yusef Jameel foundation (to M. A-N.) and the Danish Natural Science Research Council (to
M. K.).
Authors Contribution
B. B. J, M. K., D. B. & L. P. designed the project. M. A-N constructed light microsensors.
M. A-N & L. P. designed the setup, conducted the measurements, and did the calculations.
L. P. derived the mathematical calculation for the absorbed light energy. M. A-N wrote the
manuscript with input from M. K., D. B., B. B. J. and L. P.
�60
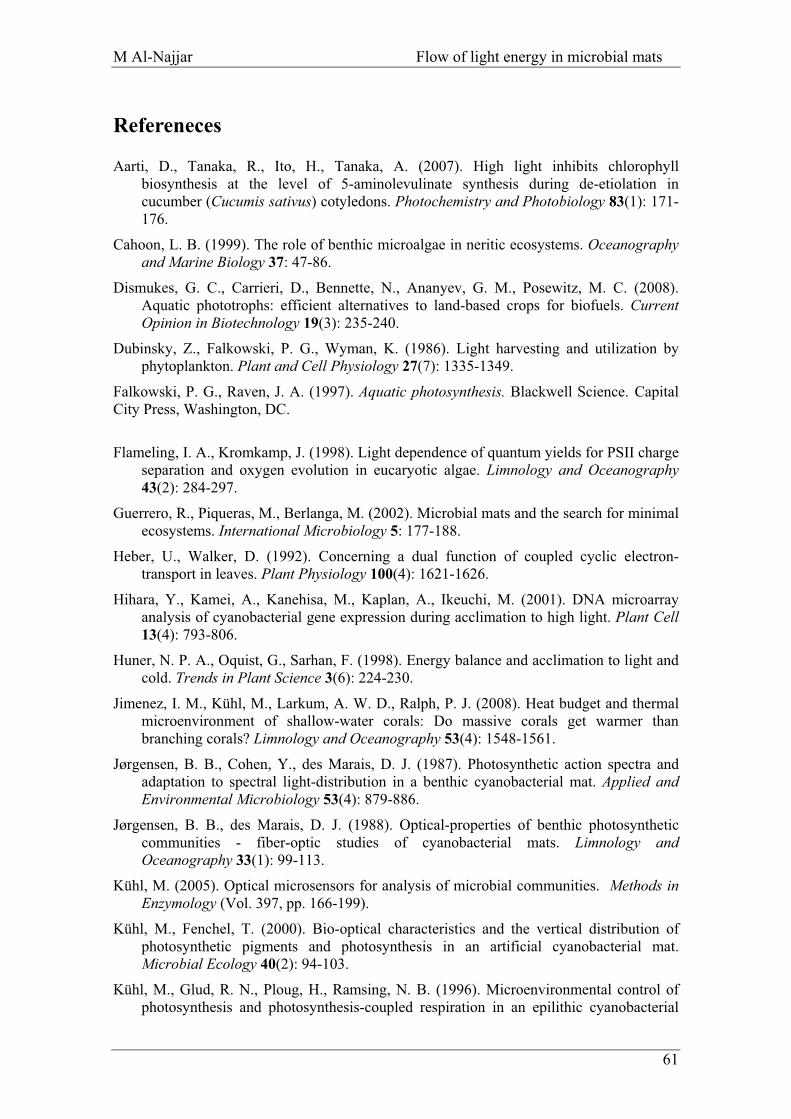
M Al-Najjar Flow of light energy in microbial mats
Refereneces
Aarti, D., Tanaka, R., Ito, H., Tanaka, A. (2007). High light inhibits chlorophyll biosynthesis at the level of 5-aminolevulinate synthesis during de-etiolation in cucumber (Cucumis sativus) cotyledons. Photochemistry and Photobiology 83(1): 171-176.
Cahoon, L. B. (1999). The role of benthic microalgae in neritic ecosystems. Oceanography and Marine Biology 37: 47-86.�
Dismukes, G. C., Carrieri, D., Bennette, N., Ananyev, G. M., Posewitz, M. C. (2008). Aquatic phototrophs: efficient alternatives to land-based crops for biofuels. Current Opinion in Biotechnology 19(3): 235-240.
Dubinsky, Z., Falkowski, P. G., Wyman, K. (1986). Light harvesting and utilization by phytoplankton. Plant and Cell Physiology 27(7): 1335-1349.
Falkowski, P. G., Raven, J. A. (1997). Aquatic photosynthesis. Blackwell Science. Capital City Press, Washington, DC.
Flameling, I. A., Kromkamp, J. (1998). Light dependence of quantum yields for PSII charge separation and oxygen evolution in eucaryotic algae. Limnology and Oceanography 43(2): 284-297.
Guerrero, R., Piqueras, M., Berlanga, M. (2002). Microbial mats and the search for minimal ecosystems. International Microbiology 5: 177-188.
Heber, U., Walker, D. (1992). Concerning a dual function of coupled cyclic electron-transport in leaves. Plant Physiology 100(4): 1621-1626.
Hihara, Y., Kamei, A., Kanehisa, M., Kaplan, A., Ikeuchi, M. (2001). DNA microarray analysis of cyanobacterial gene expression during acclimation to high light. Plant Cell 13(4): 793-806.
Huner, N. P. A., Oquist, G., Sarhan, F. (1998). Energy balance and acclimation to light and cold. Trends in Plant Science 3(6): 224-230.
Jimenez, I. M., Kühl, M., Larkum, A. W. D., Ralph, P. J. (2008). Heat budget and thermal microenvironment of shallow-water corals: Do massive corals get warmer than branching corals? Limnology and Oceanography 53(4): 1548-1561.
Jørgensen, B. B., Cohen, Y., des Marais, D. J. (1987). Photosynthetic action spectra and adaptation to spectral light-distribution in a benthic cyanobacterial mat. Applied and Environmental Microbiology 53(4): 879-886.
Jørgensen, B. B., des Marais, D. J. (1988). Optical-properties of benthic photosynthetic communities - fiber-optic studies of cyanobacterial mats. Limnology and Oceanography 33(1): 99-113.
Kühl, M. (2005). Optical microsensors for analysis of microbial communities. Methods in Enzymology (Vol. 397, pp. 166-199).
Kühl, M., Fenchel, T. (2000). Bio-optical characteristics and the vertical distribution of photosynthetic pigments and photosynthesis in an artificial cyanobacterial mat. Microbial Ecology 40(2): 94-103.
Kühl, M., Glud, R. N., Ploug, H., Ramsing, N. B. (1996). Microenvironmental control of photosynthesis and photosynthesis-coupled respiration in an epilithic cyanobacterial
� 61
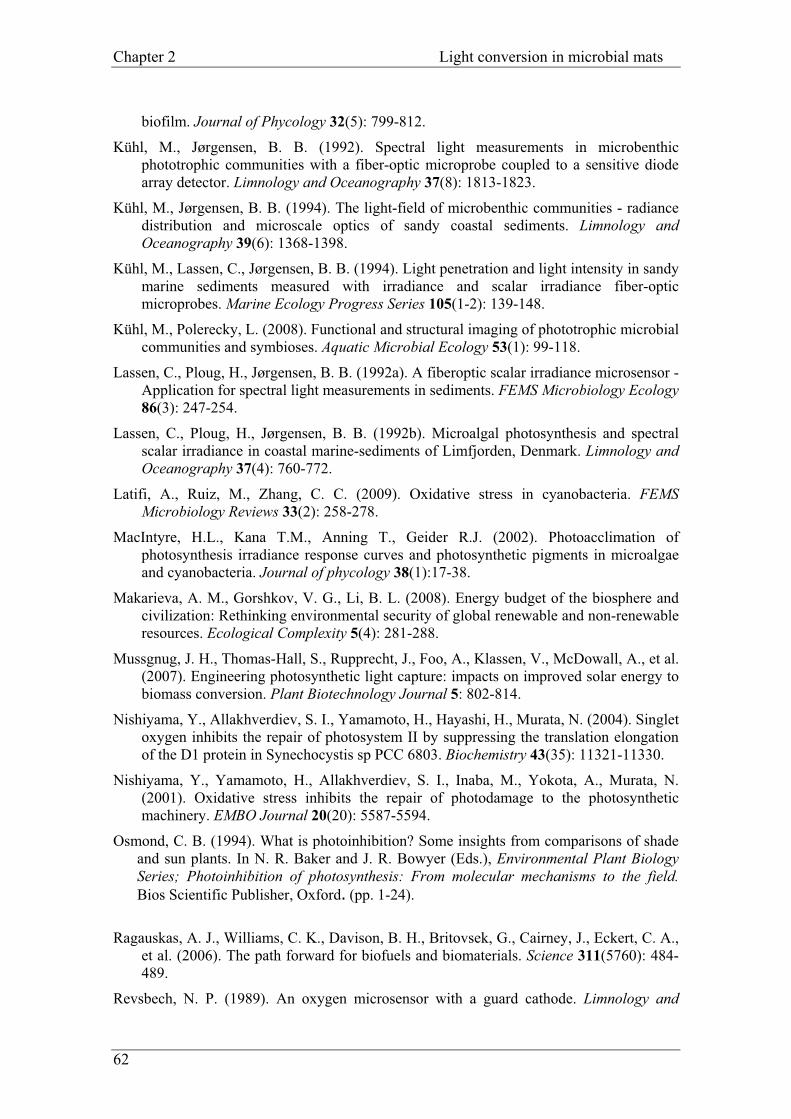
Chapter 2 Light conversion in microbial mats
biofilm. Journal of Phycology 32(5): 799-812.
Kühl, M., Jørgensen, B. B. (1992). Spectral light measurements in microbenthic phototrophic communities with a fiber-optic microprobe coupled to a sensitive diode array detector. Limnology and Oceanography 37(8): 1813-1823.
Kühl, M., Jørgensen, B. B. (1994). The light-field of microbenthic communities - radiance distribution and microscale optics of sandy coastal sediments. Limnology and Oceanography 39(6): 1368-1398.
Kühl, M., Lassen, C., Jørgensen, B. B. (1994). Light penetration and light intensity in sandy marine sediments measured with irradiance and scalar irradiance fiber-optic microprobes. Marine Ecology Progress Series 105(1-2): 139-148.
Kühl, M., Polerecky, L. (2008). Functional and structural imaging of phototrophic microbial communities and symbioses. Aquatic Microbial Ecology 53(1): 99-118.
Lassen, C., Ploug, H., Jørgensen, B. B. (1992a). A fiberoptic scalar irradiance microsensor - Application for spectral light measurements in sediments. FEMS Microbiology Ecology 86(3): 247-254.
Lassen, C., Ploug, H., Jørgensen, B. B. (1992b). Microalgal photosynthesis and spectral scalar irradiance in coastal marine-sediments of Limfjorden, Denmark. Limnology and Oceanography 37(4): 760-772.
Latifi, A., Ruiz, M., Zhang, C. C. (2009). Oxidative stress in cyanobacteria. FEMS Microbiology Reviews 33(2): 258-278.
MacIntyre, H.L., Kana T.M., Anning T., Geider R.J. (2002). Photoacclimation of photosynthesis irradiance response curves and photosynthetic pigments in microalgae and cyanobacteria. Journal of phycology 38(1):17-38.
Makarieva, A. M., Gorshkov, V. G., Li, B. L. (2008). Energy budget of the biosphere and civilization: Rethinking environmental security of global renewable and non-renewable resources. Ecological Complexity 5(4): 281-288.
Mussgnug, J. H., Thomas-Hall, S., Rupprecht, J., Foo, A., Klassen, V., McDowall, A., et al. (2007). Engineering photosynthetic light capture: impacts on improved solar energy to biomass conversion. Plant Biotechnology Journal 5: 802-814.
Nishiyama, Y., Allakhverdiev, S. I., Yamamoto, H., Hayashi, H., Murata, N. (2004). Singlet oxygen inhibits the repair of photosystem II by suppressing the translation elongation of the D1 protein in Synechocystis sp PCC 6803. Biochemistry 43(35): 11321-11330.
Nishiyama, Y., Yamamoto, H., Allakhverdiev, S. I., Inaba, M., Yokota, A., Murata, N. (2001). Oxidative stress inhibits the repair of photodamage to the photosynthetic machinery. EMBO Journal 20(20): 5587-5594.
Osmond, C. B. (1994). What is photoinhibition? Some insights from comparisons of shade and sun plants. In N. R. Baker and J. R. Bowyer (Eds.), Environmental Plant Biology Series; Photoinhibition of photosynthesis: From molecular mechanisms to the field.Bios Scientific Publisher, Oxford. (pp. 1-24).
Ragauskas, A. J., Williams, C. K., Davison, B. H., Britovsek, G., Cairney, J., Eckert, C. A., et al. (2006). The path forward for biofuels and biomaterials. Science 311(5760): 484-489.
Revsbech, N. P. (1989). An oxygen microsensor with a guard cathode. Limnology and
�62
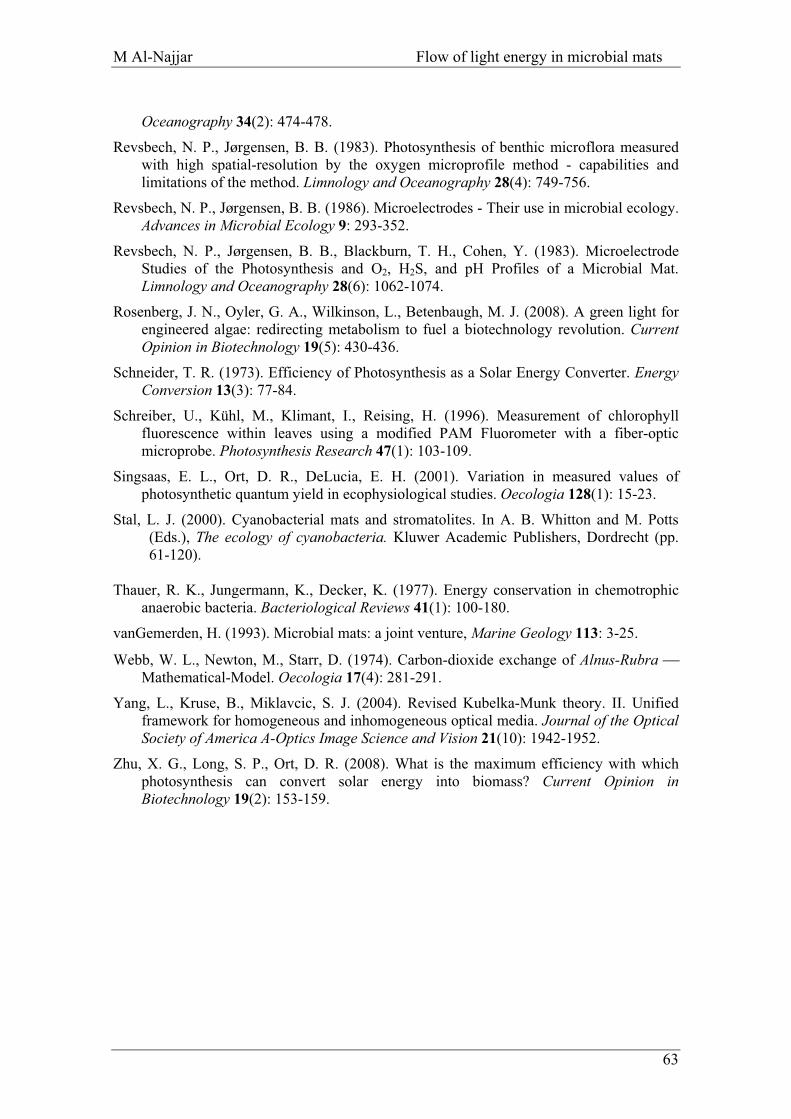
M Al-Najjar Flow of light energy in microbial mats
Oceanography 34(2): 474-478.
Revsbech, N. P., Jørgensen, B. B. (1983). Photosynthesis of benthic microflora measured with high spatial-resolution by the oxygen microprofile method - capabilities and limitations of the method. Limnology and Oceanography 28(4): 749-756.
Revsbech, N. P., Jørgensen, B. B. (1986). Microelectrodes - Their use in microbial ecology. Advances in Microbial Ecology 9: 293-352.
Revsbech, N. P., Jørgensen, B. B., Blackburn, T. H., Cohen, Y. (1983). Microelectrode Studies of the Photosynthesis and O2, H2S, and pH Profiles of a Microbial Mat. Limnology and Oceanography 28(6): 1062-1074.
Rosenberg, J. N., Oyler, G. A., Wilkinson, L., Betenbaugh, M. J. (2008). A green light for engineered algae: redirecting metabolism to fuel a biotechnology revolution. Current Opinion in Biotechnology 19(5): 430-436.
Schneider, T. R. (1973). Efficiency of Photosynthesis as a Solar Energy Converter. Energy Conversion 13(3): 77-84.
Schreiber, U., Kühl, M., Klimant, I., Reising, H. (1996). Measurement of chlorophyll fluorescence within leaves using a modified PAM Fluorometer with a fiber-optic microprobe. Photosynthesis Research 47(1): 103-109.
Singsaas, E. L., Ort, D. R., DeLucia, E. H. (2001). Variation in measured values of photosynthetic quantum yield in ecophysiological studies. Oecologia 128(1): 15-23.
Stal, L. J. (2000). Cyanobacterial mats and stromatolites. In A. B. Whitton and M. Potts (Eds.), The ecology of cyanobacteria. Kluwer Academic Publishers, Dordrecht (pp. 61-120).
Thauer, R. K., Jungermann, K., Decker, K. (1977). Energy conservation in chemotrophic
anaerobic bacteria. Bacteriological Reviews 41(1): 100-180.
vanGemerden, H. (1993). Microbial mats: a joint venture, Marine Geology 113: 3-25.
Webb, W. L., Newton, M., Starr, D. (1974). Carbon-dioxide exchange of Alnus-Rubra � Mathematical-Model. Oecologia 17(4): 281-291.
Yang, L., Kruse, B., Miklavcic, S. J. (2004). Revised Kubelka-Munk theory. II. Unified framework for homogeneous and inhomogeneous optical media. Journal of the Optical Society of America A-Optics Image Science and Vision 21(10): 1942-1952.
Zhu, X. G., Long, S. P., Ort, D. R. (2008). What is the maximum efficiency with which photosynthesis can convert solar energy into biomass? Current Opinion in Biotechnology 19(2): 153-159.
� 63
Chapter 2 Light conversion in microbial mats
SUPPLEMENTARY INFORMATION
Content
1. Sampling.
2. Experimental setup and procedures.
3. Model of the attenuation and absorption of light in a microbial mat.
4. Figure S1: Schematic diagram of light propagation and utilization in a microbial mat.
5. Figure S2: Optical properties of the studied microbial mat.
6. Figure S3: Volumetric rates of gross photosynthesis at various depths inside the studied
microbial mat.
7. Table S1: Maximum quantum efficiency (QEmax) and energy efficiency (EEmax) of
photosynthesis for different phototrophic organisms/systems.
8. Supplementary references.
1 Sampling
Microbial mats originated from the coast of Sadeyat Island, near Abu Dhabi, United Arab
Emirates (24º 31’ 20” N, 54 º 26’ 5” E). Under natural conditions, the mat is exposed to
continuous flushing by tidal seawater for ~4 h a day, followed by calm periods during
which water evaporates, resulting in daily salinity changes in the overlaying water between
35 and > 170. Several cm2 of mats were collected in September 2007 at the onset of low
tide (in-situ salinity of 90-130, temperature 35ºC). The collected mat pieces were brought to
the laboratory and incubated in filtered seawater (temperature 28ºC, salinity of 33) under a
10h light / 14h dark illumination regime (incident quantum irradiance 480 μmol photon m-2
s-1; light source AQUALINE 10000, MH 400W, spectrum similar to sunlight). During
�64
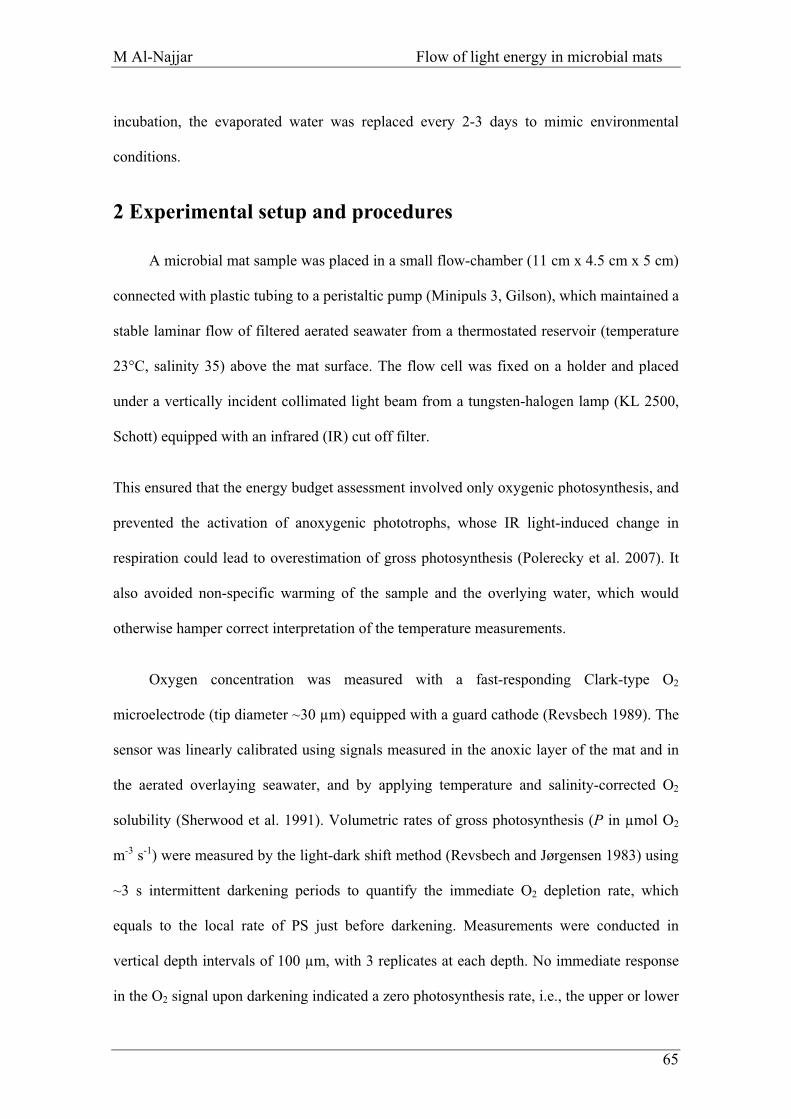
M Al-Najjar Flow of light energy in microbial mats
incubation, the evaporated water was replaced every 2-3 days to mimic environmental
conditions.
2 Experimental setup and procedures
A microbial mat sample was placed in a small flow-chamber (11 cm x 4.5 cm x 5 cm)
connected with plastic tubing to a peristaltic pump (Minipuls 3, Gilson), which maintained a
stable laminar flow of filtered aerated seawater from a thermostated reservoir (temperature
23°C, salinity 35) above the mat surface. The flow cell was fixed on a holder and placed
under a vertically incident collimated light beam from a tungsten-halogen lamp (KL 2500,
Schott) equipped with an infrared (IR) cut off filter.
This ensured that the energy budget assessment involved only oxygenic photosynthesis, and
prevented the activation of anoxygenic phototrophs, whose IR light-induced change in
respiration could lead to overestimation of gross photosynthesis (Polerecky et al. 2007). It
also avoided non-specific warming of the sample and the overlying water, which would
otherwise hamper correct interpretation of the temperature measurements.
Oxygen concentration was measured with a fast-responding Clark-type O2
microelectrode (tip diameter ~30 μm) equipped with a guard cathode (Revsbech 1989). The
sensor was linearly calibrated using signals measured in the anoxic layer of the mat and in
the aerated overlaying seawater, and by applying temperature and salinity-corrected O2
solubility (Sherwood et al. 1991). Volumetric rates of gross photosynthesis (P in μmol O2
m-3 s-1) were measured by the light-dark shift method (Revsbech and Jørgensen 1983) using
~3 s intermittent darkening periods to quantify the immediate O2 depletion rate, which
equals to the local rate of PS just before darkening. Measurements were conducted in
vertical depth intervals of 100 μm, with 3 replicates at each depth. No immediate response
in the O2 signal upon darkening indicated a zero photosynthesis rate, i.e., the upper or lower
� 65
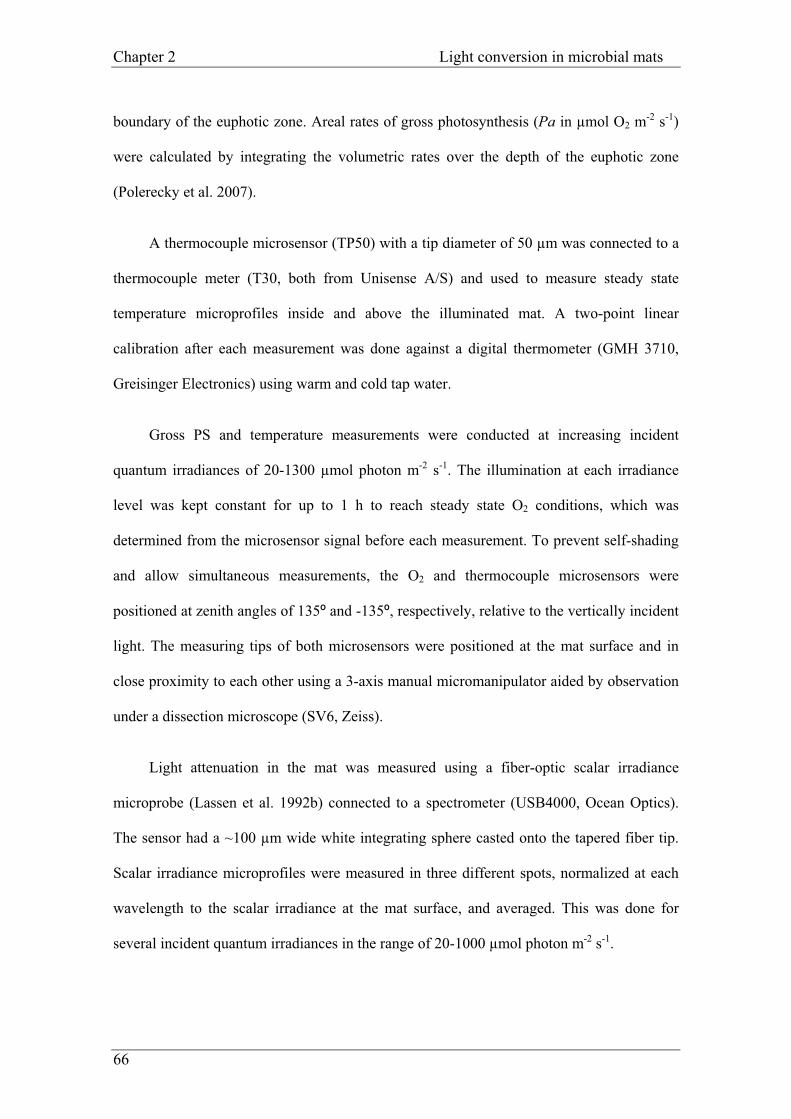
Chapter 2 Light conversion in microbial mats
boundary of the euphotic zone. Areal rates of gross photosynthesis (Pa in μmol O2 m-2 s-1)
were calculated by integrating the volumetric rates over the depth of the euphotic zone
(Polerecky et al. 2007).
A thermocouple microsensor (TP50) with a tip diameter of 50 μm was connected to a
thermocouple meter (T30, both from Unisense A/S) and used to measure steady state
temperature microprofiles inside and above the illuminated mat. A two-point linear
calibration after each measurement was done against a digital thermometer (GMH 3710,
Greisinger Electronics) using warm and cold tap water.
Gross PS and temperature measurements were conducted at increasing incident
quantum irradiances of 20-1300 μmol photon m-2 s-1. The illumination at each irradiance
level was kept constant for up to 1 h to reach steady state O2 conditions, which was
determined from the microsensor signal before each measurement. To prevent self-shading
and allow simultaneous measurements, the O2 and thermocouple microsensors were
positioned at zenith angles of 135º and -135º, respectively, relative to the vertically incident
light. The measuring tips of both microsensors were positioned at the mat surface and in
close proximity to each other using a 3-axis manual micromanipulator aided by observation
under a dissection microscope (SV6, Zeiss).
Light attenuation in the mat was measured using a fiber-optic scalar irradiance
microprobe (Lassen et al. 1992b) connected to a spectrometer (USB4000, Ocean Optics).
The sensor had a ~100 μm wide white integrating sphere casted onto the tapered fiber tip.
Scalar irradiance microprofiles were measured in three different spots, normalized at each
wavelength to the scalar irradiance at the mat surface, and averaged. This was done for
several incident quantum irradiances in the range of 20-1000 μmol photon m-2 s-1.
�66
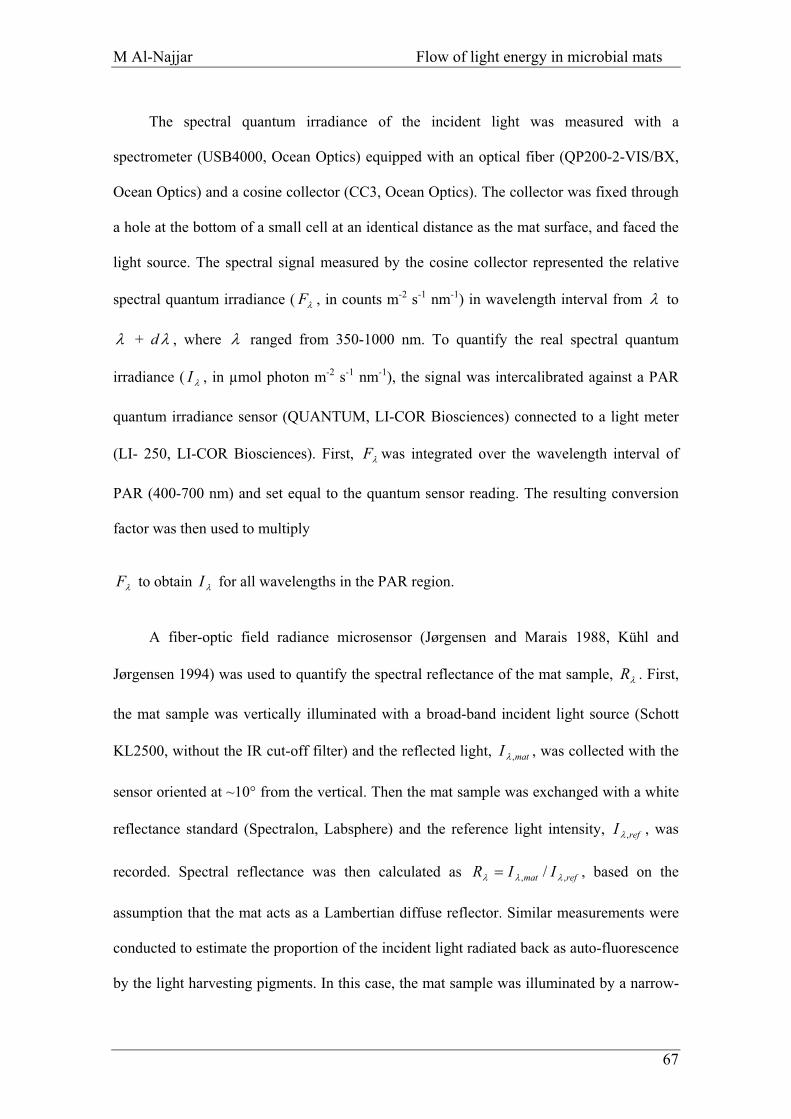
M Al-Najjar Flow of light energy in microbial mats
� 67
The spectral quantum irradiance of the incident light was measured with a
spectrometer (USB4000, Ocean Optics) equipped with an optical fiber (QP200-2-VIS/BX,
Ocean Optics) and a cosine collector (CC3, Ocean Optics). The collector was fixed through
a hole at the bottom of a small cell at an identical distance as the mat surface, and faced the
light source. The spectral signal measured by the cosine collector represented the relative
spectral quantum irradiance ( , in counts m-2 s-1 nm-1) in wavelength interval from �F � to
� + d� , where � ranged from 350-1000 nm. To quantify the real spectral quantum
irradiance ( , in μmol photon m-2 s-1 nm-1), the signal was intercalibrated against a PAR
quantum irradiance sensor (QUANTUM, LI-COR Biosciences) connected to a light meter
(LI- 250, LI-COR Biosciences). First, was integrated over the wavelength interval of
PAR (400-700 nm) and set equal to the quantum sensor reading. The resulting conversion
factor was then used to multiply
�I
F I
R
I
IR /
�F
� to obtain for all wavelengths in the PAR region. �
A fiber-optic field radiance microsensor (Jørgensen and Marais 1988, Kühl and
Jørgensen 1994) was used to quantify the spectral reflectance of the mat sample, . First,
the mat sample was vertically illuminated with a broad-band incident light source (Schott
KL2500, without the IR cut-off filter) and the reflected light, , was collected with the
sensor oriented at ~10° from the vertical. Then the mat sample was exchanged with a white
reflectance standard (Spectralon, Labsphere) and the reference light intensity, , was
recorded. Spectral reflectance was then calculated as
�
refI ,�
mat,�
matI ,� ref,�� � , based on the
assumption that the mat acts as a Lambertian diffuse reflector. Similar measurements were
conducted to estimate the proportion of the incident light radiated back as auto-fluorescence
by the light harvesting pigments. In this case, the mat sample was illuminated by a narrow-
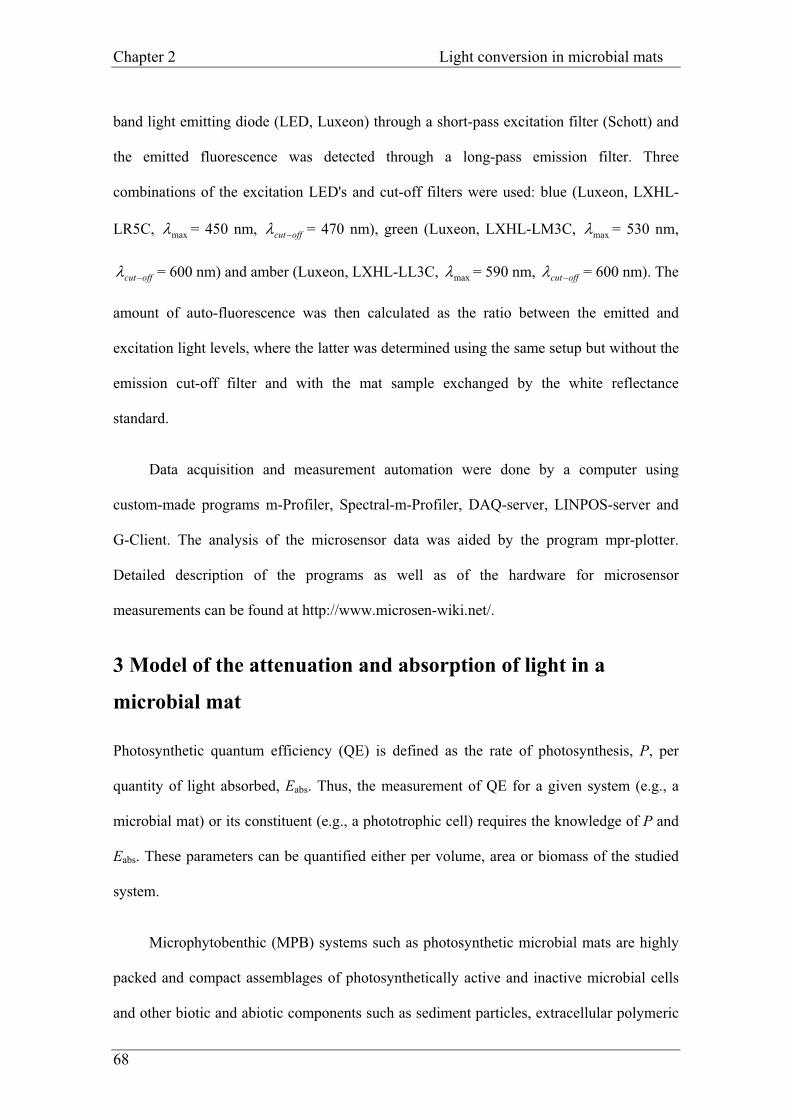
Chapter 2 Light conversion in microbial mats
�68
band light emitting diode (LED, Luxeon) through a short-pass excitation filter (Schott) and
the emitted fluorescence was detected through a long-pass emission filter. Three
combinations of the excitation LED's and cut-off filters were used: blue (Luxeon, LXHL-
LR5C, max� = 450 nm, offcut�� = 470 nm), green (Luxeon, LXHL-LM3C, max� = 530 nm,
offcut�� = 600 nm) and amber (Luxeon, LXHL-LL3C, max� = 590 nm, offcut�� = 600 nm). The
amount of auto-fluorescence was then calculated as the ratio between the emitted and
excitation light levels, where the latter was determined using the same setup but without the
emission cut-off filter and with the mat sample exchanged by the white reflectance
standard.
Data acquisition and measurement automation were done by a computer using
custom-made programs m-Profiler, Spectral-m-Profiler, DAQ-server, LINPOS-server and
G-Client. The analysis of the microsensor data was aided by the program mpr-plotter.
Detailed description of the programs as well as of the hardware for microsensor
measurements can be found at http://www.microsen-wiki.net/.
3 Model of the attenuation and absorption of light in a
microbial mat
Photosynthetic quantum efficiency (QE) is defined as the rate of photosynthesis, P, per
quantity of light absorbed, Eabs. Thus, the measurement of QE for a given system (e.g., a
microbial mat) or its constituent (e.g., a phototrophic cell) requires the knowledge of P and
Eabs. These parameters can be quantified either per volume, area or biomass of the studied
system.
Microphytobenthic (MPB) systems such as photosynthetic microbial mats are highly
packed and compact assemblages of photosynthetically active and inactive microbial cells
and other biotic and abiotic components such as sediment particles, extracellular polymeric
M Al-Najjar Flow of light energy in microbial mats
substances or detritus. Although all components contribute to light absorption in the system,
only the photosynthetically active cells perform photosynthesis. Because of the high
compaction, the measurements of photosynthesis and light absorption in MPB systems
requires the use of specialized tools and approaches. For the measurement of
photosynthesis, the microsensor-based light-dark shift method (Revsbech and Jørgensen
1983) has been widely used, as it allows quantification of volumetric gross photosynthesis
rates (P in μmol O2 m-3 s-1) with a spatial resolution of 100-200 μm. For the assessment of
light with a similar spatial resolution, fiber-optic based irradiance or scalar irradiance
microprobes have been applied (Lassen et al. 1992b, Lassen and Jørgensen 1994, Kühl and
Jørgensen 1994, Kühl et al. 1994). Although these measurements allow characterization of
locally available photon fluxes, from which parameters such as the light attenuation
coefficient can be derived, it is unclear how they can directly yield information on the
locally absorbed light energy. This complication stems from the fact that scattering plays an
important role in the way light propagates, attenuates and eventually becomes absorbed in
microbial mats or other systems with high density of cells and other material. Kühl and
Jørgensen (1994) proposed and realized a method for such a purpose. Their approach was,
however, not straightforward, as it involved rather laborious and practically difficult
measurements of angular distributions of light irradiances at various depths in the mat, from
which the locally absorbed light was then calculated. Here we propose a theoretical
framework from which light propagation in photosynthetic microbial mats can be more
easily understood, and which allows a more straightforward way to quantify absorbed light
from parameters that are relatively simple to measure. The derivation adopts ideas of Yang
et al. (2004) that were developed in their revision and application of the original Kubelka-
Munk (K-M) theory of light propagation in a scattering and absorbing medium for ink-jet
printing.
� 69
Chapter 2 Light conversion in microbial mats
�70
We assume that the light field in the mat is diffused, i.e., photons at each depth
propagate with equal probability in all directions. As shown by Kühl and Jørgensen (1994),
this is generally a good assumption for measurements where the mat is illuminated
vertically by a collimated light beam from a lamp, except for the very top mat layer (100-
200 μm), where the incident light undergoes a transition from a collimated to diffused light
field (see below).
The light field in the mat is divided into two components, a downwelling photon flux,
F+, associated with photons travelling in the positive z-direction, and an upwelling photon
flux, F-, associated with photons propagating in the negative z-direction (Fig. S1). By
definition, these fluxes represent the amount of photons that pass through a horizontal plane
of unit area per second, i.e., a quantity measured by a cosinus-corrected irradiance sensor.
As suggested in the original K-M theory, scattering in the medium results in a transfer of
energy from F+ to F- and vice versa, whereas absorption in the medium results in a loss of
energy. The medium is assumed to be linear, i.e., the strengths of the energy transfer and
loss are proportional to the photon flux. Thus, the spatial distribution of the two fluxes can
be described by a set of coupled first-order linear differential equations,
,)(
,)(
���
���
�����
����
SFFSKdz
dF
SFFSKdz
dF
(1)
where K and S denote the absorption and scattering coefficient, respectively. As stressed by
Yang et al. (2004), these parameters do not represent the intrinsic absorption and scattering
properties of the material in which the light propagates, but are used only as
phenomenological parameters describing the energy transfer efficiencies between the two
light field components. However, a relationship between the phenomenological and
intrinsic parameters can be found if the local angular distribution of light in the material is
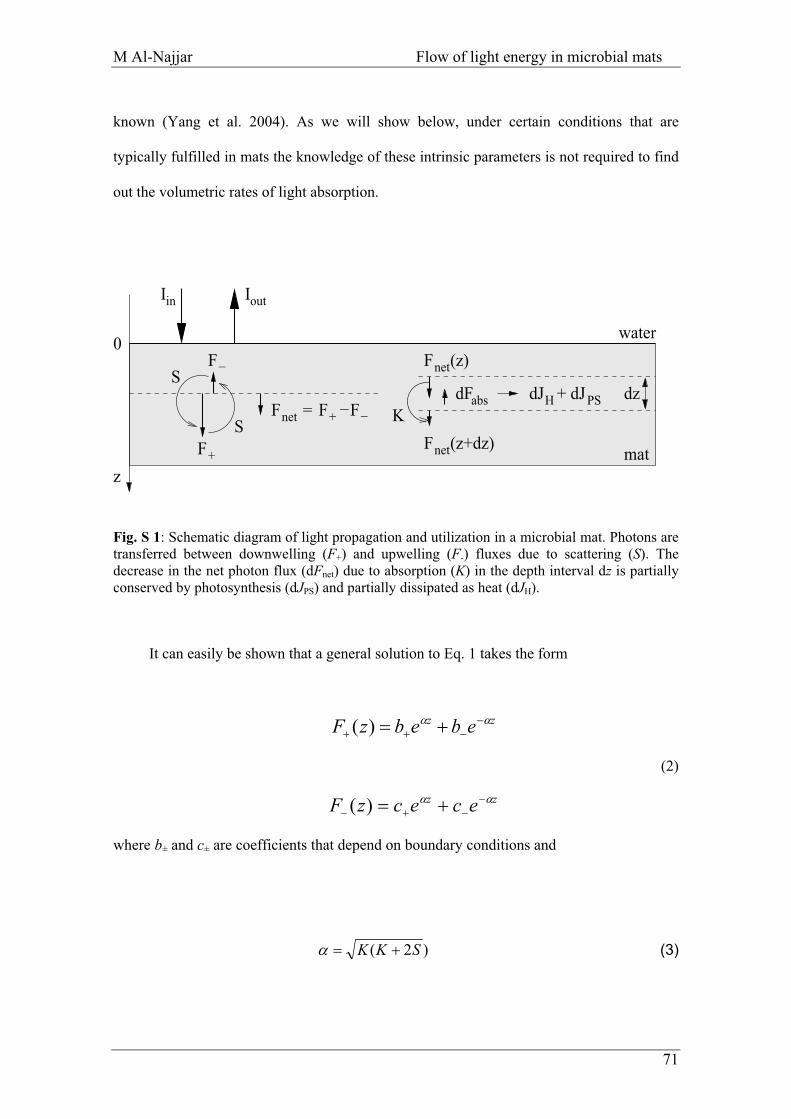
M Al-Najjar Flow of light energy in microbial mats
� 71
known (Yang et al. 2004). As we will show below, under certain conditions that are
typically fulfilled in mats the knowledge of these intrinsic parameters is not required to find
out the volumetric rates of light absorption.
in Iout
+F −FFnet = −
+F
−F Fnet(z)
Fnet(z+dz)
dJ + dJH PSdFabs
0
S
Sdz
water
matz
I
K
Fig. S 1: Schematic diagram of light propagation and utilization in a microbial mat. Photons are transferred between downwelling (F+) and upwelling (F-) fluxes due to scattering (S). The decrease in the net photon flux (dFnet) due to absorption (K) in the depth interval dz is partially conserved by photosynthesis (dJPS) and partially dissipated as heat (dJH).
It can easily be shown that a general solution to Eq. 1 takes the form
zz �� �
zz �� �
ebebzF ��� ��)(
(2)
ececzF ��� ��)(
where b± and c± are coefficients that depend on boundary conditions and
)2( SKK ��� (3)
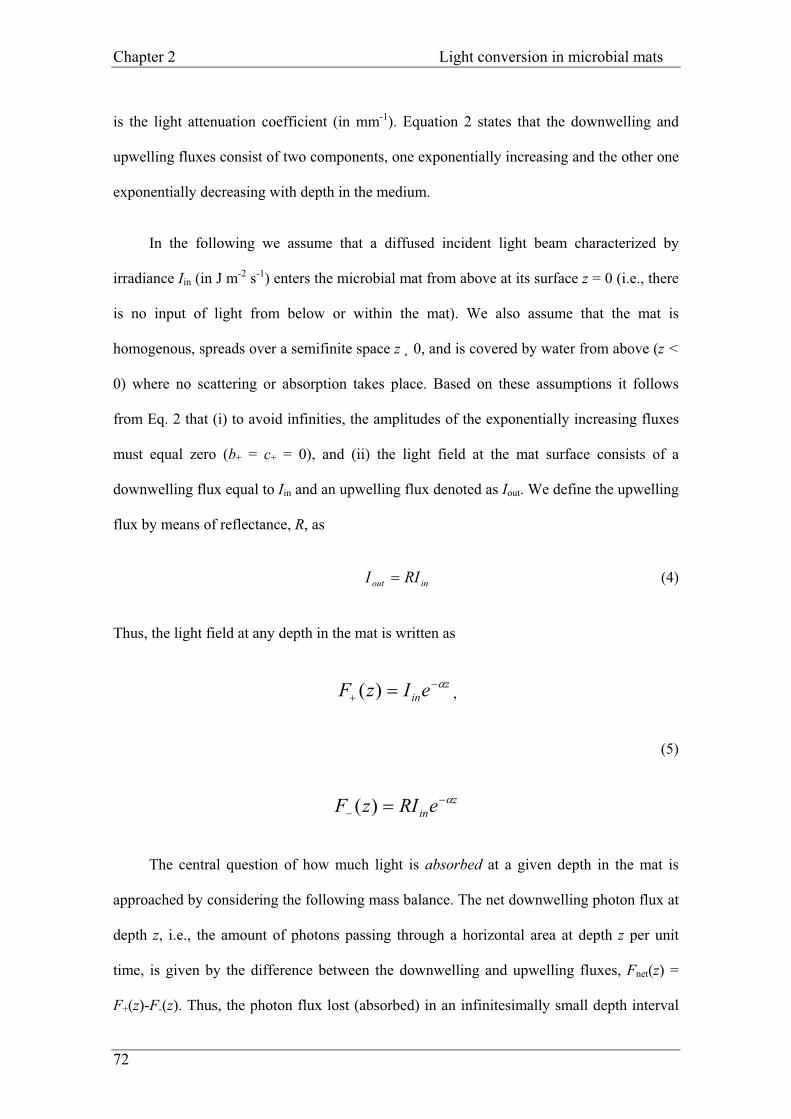
Chapter 2 Light conversion in microbial mats
�72
is the light attenuation coefficient (in mm-1). Equation 2 states that the downwelling and
upwelling fluxes consist of two components, one exponentially increasing and the other one
exponentially decreasing with depth in the medium.
In the following we assume that a diffused incident light beam characterized by
irradiance Iin (in J m-2 s-1) enters the microbial mat from above at its surface z = 0 (i.e., there
is no input of light from below or within the mat). We also assume that the mat is
homogenous, spreads over a semifinite space z ¸ 0, and is covered by water from above (z <
0) where no scattering or absorption takes place. Based on these assumptions it follows
from Eq. 2 that (i) to avoid infinities, the amplitudes of the exponentially increasing fluxes
must equal zero (b+ = c+ = 0), and (ii) the light field at the mat surface consists of a
downwelling flux equal to Iin and an upwelling flux denoted as Iout. We define the upwelling
flux by means of reflectance, R, as
inout RII � (4)
Thus, the light field at any depth in the mat is written as
z��
z��
ineIzF� �)( ,
(5)
ineRIzF� �)(
The central question of how much light is absorbed at a given depth in the mat is
approached by considering the following mass balance. The net downwelling photon flux at
depth z, i.e., the amount of photons passing through a horizontal area at depth z per unit
time, is given by the difference between the downwelling and upwelling fluxes, Fnet(z) =
F+(z)-F-(z). Thus, the photon flux lost (absorbed) in an infinitesimally small depth interval
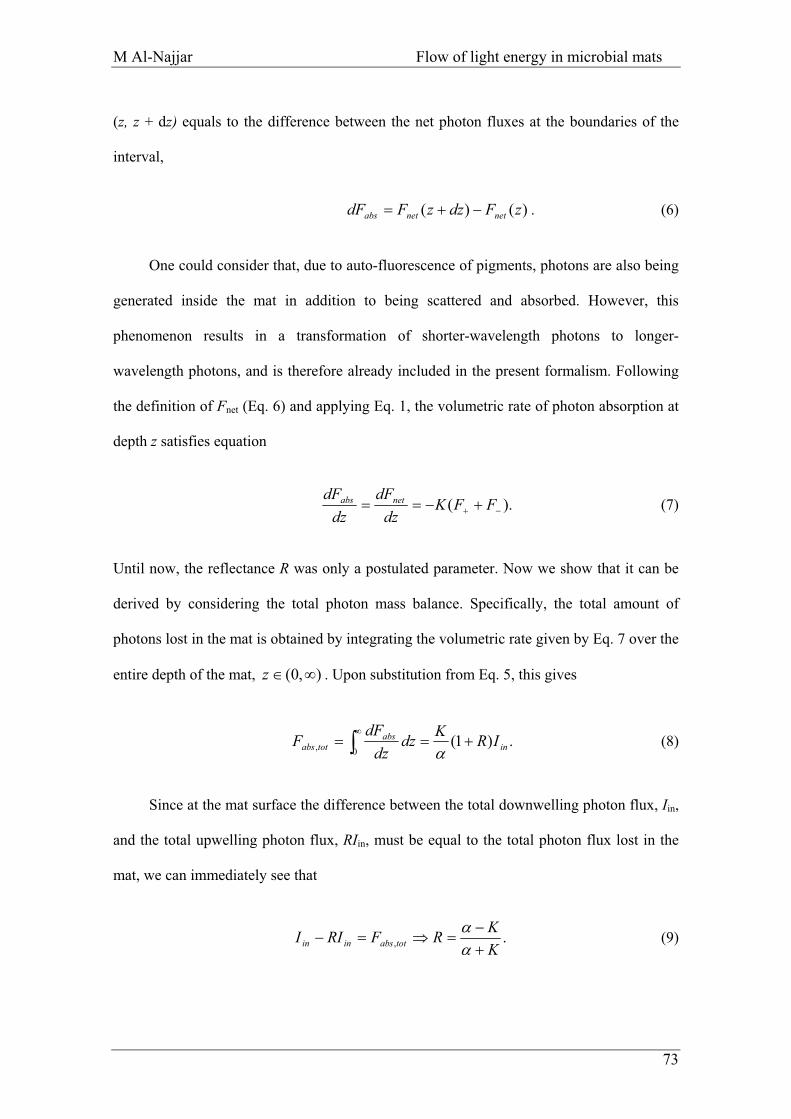
M Al-Najjar Flow of light energy in microbial mats
� 73
(z, z + dz) equals to the difference between the net photon fluxes at the boundaries of the
interval,
)()( zFdzzFdF netnetabs ��� . (6)
One could consider that, due to auto-fluorescence of pigments, photons are also being
generated inside the mat in addition to being scattered and absorbed. However, this
phenomenon results in a transformation of shorter-wavelength photons to longer-
wavelength photons, and is therefore already included in the present formalism. Following
the definition of Fnet (Eq. 6) and applying Eq. 1, the volumetric rate of photon absorption at
depth z satisfies equation
).( �� ���� FFKdzdz
netabs dFdF
),0( ��z
(7)
Until now, the reflectance R was only a postulated parameter. Now we show that it can be
derived by considering the total photon mass balance. Specifically, the total amount of
photons lost in the mat is obtained by integrating the volumetric rate given by Eq. 7 over the
entire depth of the mat, . Upon substitution from Eq. 5, this gives
��
���0, .)1( in
abstotabs IRKdz
dzF
�dF
(8)
Since at the mat surface the difference between the total downwelling photon flux, Iin,
and the total upwelling photon flux, RIin, must be equal to the total photon flux lost in the
mat, we can immediately see that
., KRFRII totabsinin �
K�������
(9)
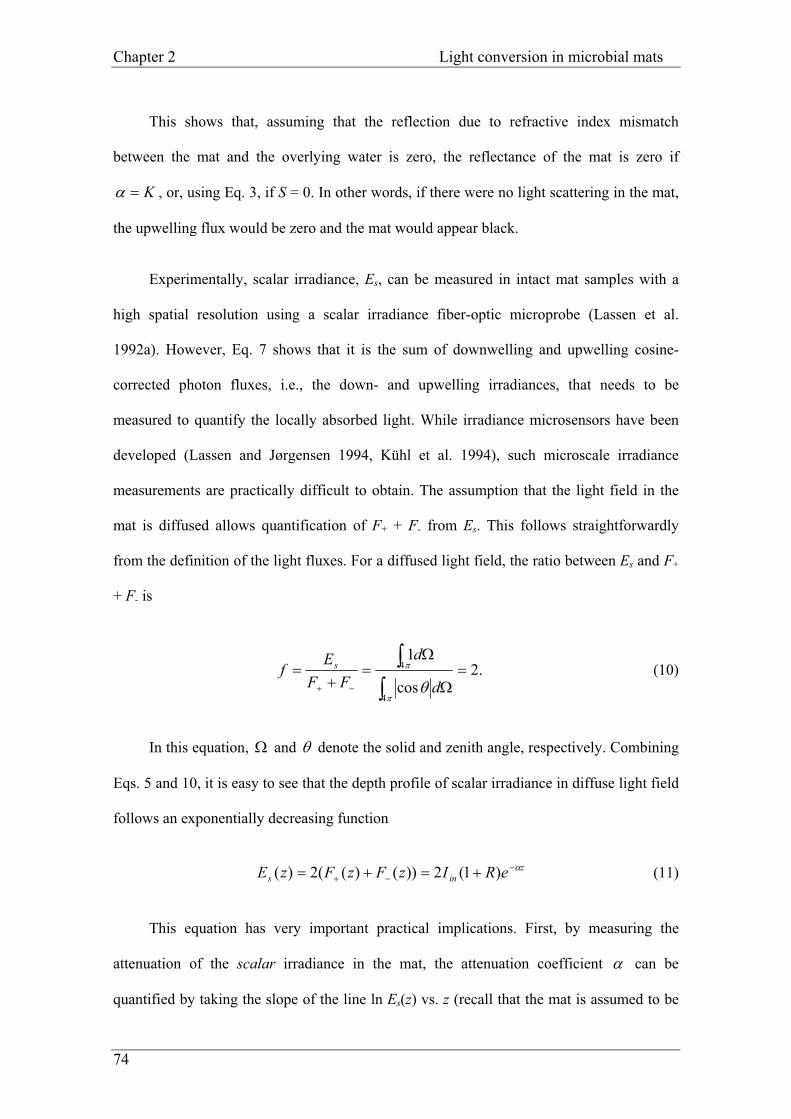
Chapter 2 Light conversion in microbial mats
�74
This shows that, assuming that the reflection due to refractive index mismatch
between the mat and the overlying water is zero, the reflectance of the mat is zero if
K�� , or, using Eq. 3, if S = 0. In other words, if there were no light scattering in the mat,
the upwelling flux would be zero and the mat would appear black.
Experimentally, scalar irradiance, Es, can be measured in intact mat samples with a
high spatial resolution using a scalar irradiance fiber-optic microprobe (Lassen et al.
1992a). However, Eq. 7 shows that it is the sum of downwelling and upwelling cosine-
corrected photon fluxes, i.e., the down- and upwelling irradiances, that needs to be
measured to quantify the locally absorbed light. While irradiance microsensors have been
developed (Lassen and Jørgensen 1994, Kühl et al. 1994), such microscale irradiance
measurements are practically difficult to obtain. The assumption that the light field in the
mat is diffused allows quantification of F+ + F- from Es. This follows straightforwardly
from the definition of the light fluxes. For a diffused light field, the ratio between Es and F+
+ F- is
.2cos
1
4
4 ��
��
��
��
���
�
� d
d
FFE
f s (10)
In this equation, � and � denote the solid and zenith angle, respectively. Combining
Eqs. 5 and 10, it is easy to see that the depth profile of scalar irradiance in diffuse light field
follows an exponentially decreasing function
z��ins eRIzFzFzE �� ���� )1(2))()((2)( (11)
This equation has very important practical implications. First, by measuring the
attenuation of the scalar irradiance in the mat, the attenuation coefficient � can be
quantified by taking the slope of the line ln Es(z) vs. z (recall that the mat is assumed to be
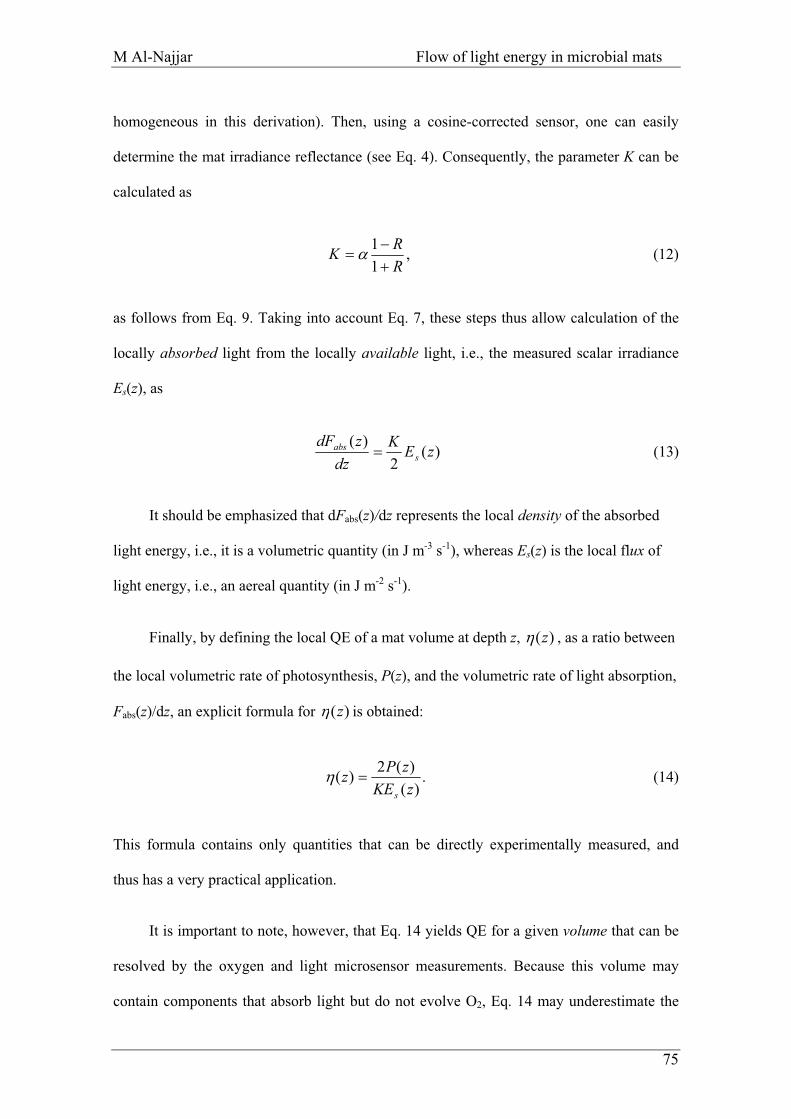
M Al-Najjar Flow of light energy in microbial mats
� 75
homogeneous in this derivation). Then, using a cosine-corrected sensor, one can easily
determine the mat irradiance reflectance (see Eq. 4). Consequently, the parameter K can be
calculated as
,1 R
K�
1 R�� � (12)
as follows from Eq. 9. Taking into account Eq. 7, these steps thus allow calculation of the
locally absorbed light from the locally available light, i.e., the measured scalar irradiance
Es(z), as
)(2
zEKdz sabs �
)(zdF
)(z
(13)
It should be emphasized that dFabs(z)/dz represents the local density of the absorbed
light energy, i.e., it is a volumetric quantity (in J m-3 s-1), whereas Es(z) is the local flux of
light energy, i.e., an aereal quantity (in J m-2 s-1).
Finally, by defining the local QE of a mat volume at depth z, � , as a ratio between
the local volumetric rate of photosynthesis, P(z), and the volumetric rate of light absorption,
Fabs(z)/dz, an explicit formula for )(z� is obtained:
.)(
)(zKE
zs
�� )(2 zP (14)
This formula contains only quantities that can be directly experimentally measured, and
thus has a very practical application.
It is important to note, however, that Eq. 14 yields QE for a given volume that can be
resolved by the oxygen and light microsensor measurements. Because this volume may
contain components that absorb light but do not evolve O2, Eq. 14 may underestimate the
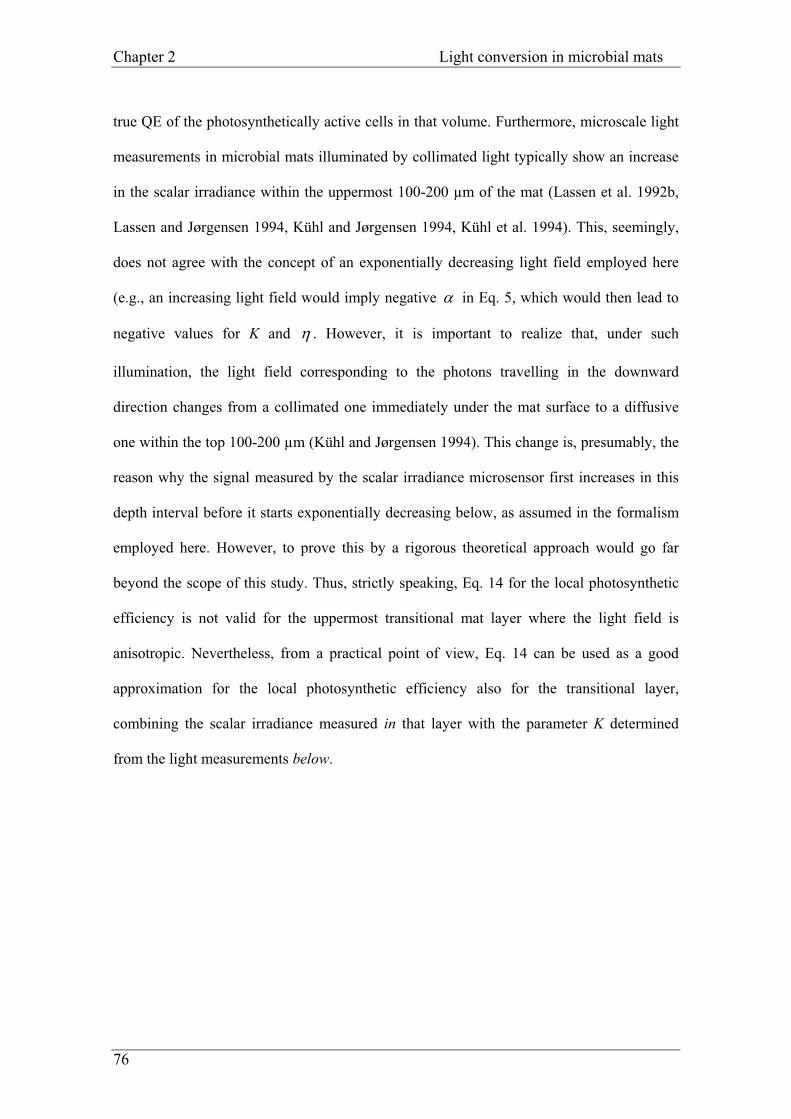
Chapter 2 Light conversion in microbial mats
�76
true QE of the photosynthetically active cells in that volume. Furthermore, microscale light
measurements in microbial mats illuminated by collimated light typically show an increase
in the scalar irradiance within the uppermost 100-200 μm of the mat (Lassen et al. 1992b,
Lassen and Jørgensen 1994, Kühl and Jørgensen 1994, Kühl et al. 1994). This, seemingly,
does not agree with the concept of an exponentially decreasing light field employed here
(e.g., an increasing light field would imply negative � in Eq. 5, which would then lead to
negative values for K and � . However, it is important to realize that, under such
illumination, the light field corresponding to the photons travelling in the downward
direction changes from a collimated one immediately under the mat surface to a diffusive
one within the top 100-200 μm (Kühl and Jørgensen 1994). This change is, presumably, the
reason why the signal measured by the scalar irradiance microsensor first increases in this
depth interval before it starts exponentially decreasing below, as assumed in the formalism
employed here. However, to prove this by a rigorous theoretical approach would go far
beyond the scope of this study. Thus, strictly speaking, Eq. 14 for the local photosynthetic
efficiency is not valid for the uppermost transitional mat layer where the light field is
anisotropic. Nevertheless, from a practical point of view, Eq. 14 can be used as a good
approximation for the local photosynthetic efficiency also for the transitional layer,
combining the scalar irradiance measured in that layer with the parameter K determined
from the light measurements below.
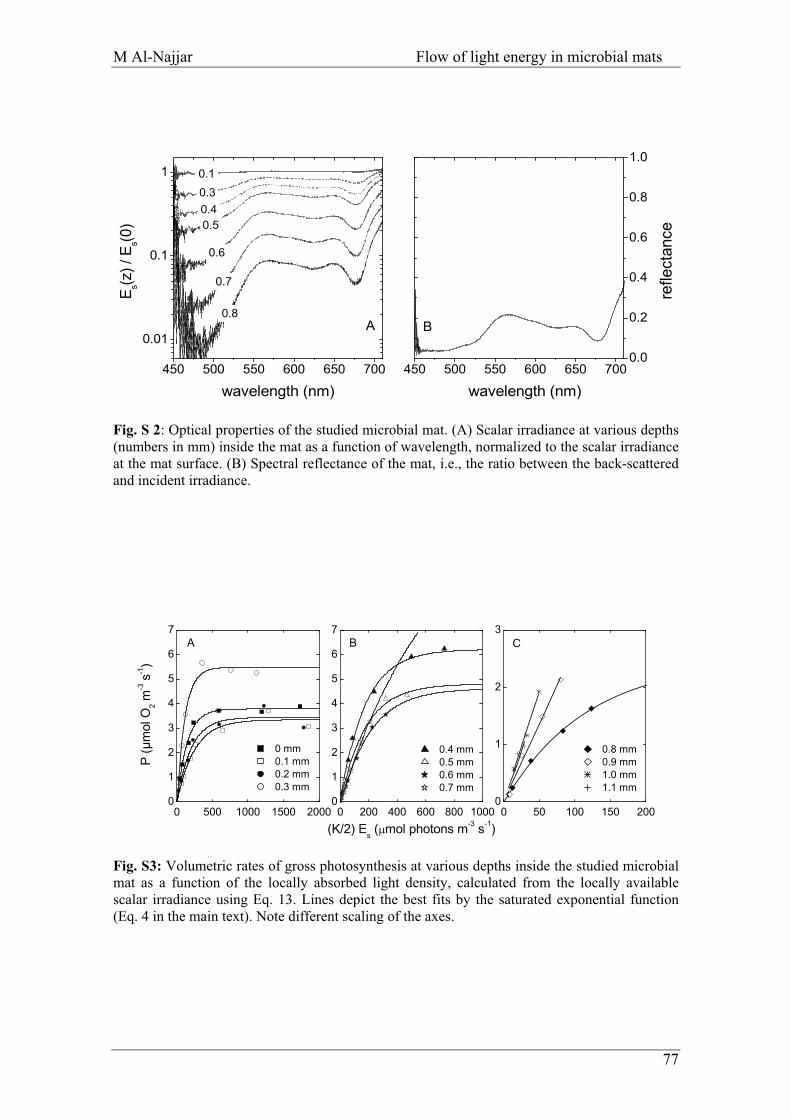
M Al-Najjar Flow of light energy in microbial mats
Fig. S 2: Optical properties of the studied microbial mat. (A) Scalar irradiance at various depths (numbers in mm) inside the mat as a function of wavelength, normalized to the scalar irradiance at the mat surface. (B) Spectral reflectance of the mat, i.e., the ratio between the back-scattered and incident irradiance.
Fig. S3: Volumetric rates of gross photosynthesis at various depths inside the studied microbial mat as a function of the locally absorbed light density, calculated from the locally available scalar irradiance using Eq. 13. Lines depict the best fits by the saturated exponential function (Eq. 4 in the main text). Note different scaling of the axes.
� 77
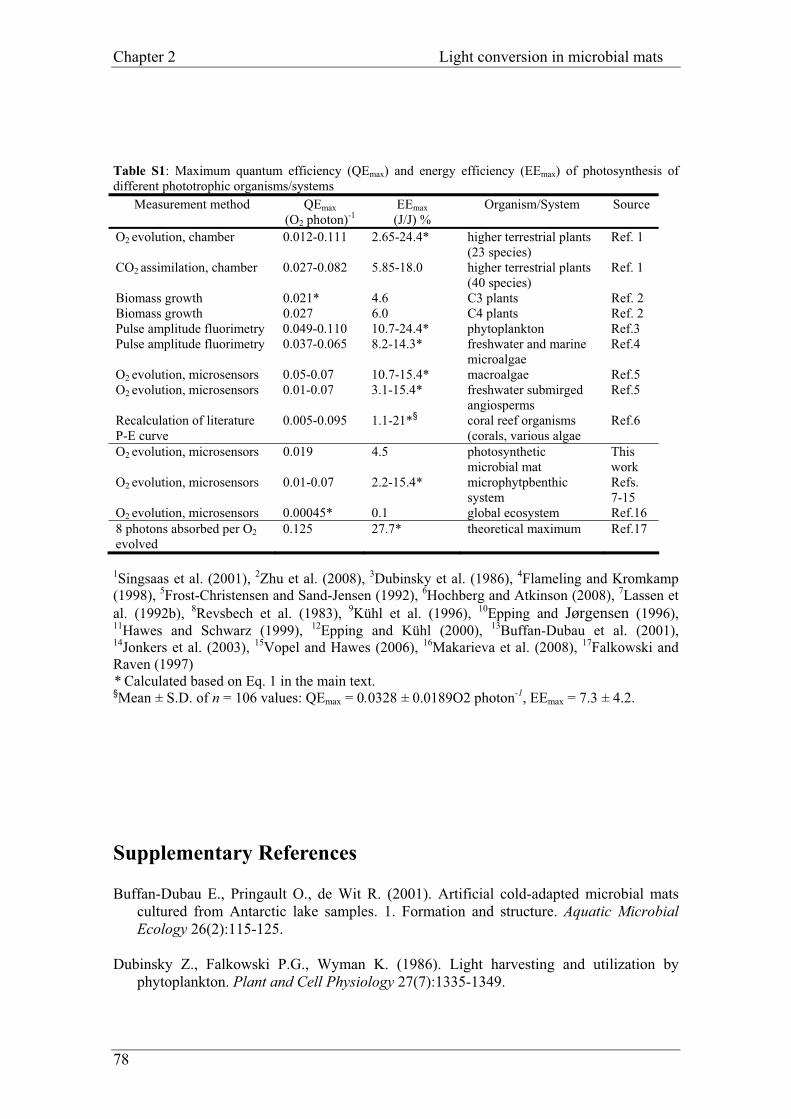
Chapter 2 Light conversion in microbial mats
Table S1: Maximum quantum efficiency (QEmax) and energy efficiency (EEmax) of photosynthesis of different phototrophic organisms/systems
Measurement method QEmax (O2 photon)-1
EEmax (J/J) %
Organism/System Source
O2 evolution, chamber 0.012-0.111 2.65-24.4* higher terrestrial plants (23 species)
Ref. 1
CO2 assimilation, chamber 0.027-0.082 5.85-18.0 higher terrestrial plants (40 species)
Ref. 1
Biomass growth 0.021* 4.6 C3 plants Ref. 2 Biomass growth 0.027 6.0 C4 plants Ref. 2 Pulse amplitude fluorimetry 0.049-0.110 10.7-24.4* phytoplankton Ref.3 Pulse amplitude fluorimetry 0.037-0.065 8.2-14.3* freshwater and marine
microalgae Ref.4
O2 evolution, microsensors� 0.05-0.07 10.7-15.4* macroalgae Ref.5 O2 evolution, microsensors� 0.01-0.07 3.1-15.4* freshwater submirged
angiosperms Ref.5
Recalculation of literature P-E curve
0.005-0.095 1.1-21*§ coral reef organisms (corals, various algae
Ref.6
O2 evolution, microsensors 0.019 4.5 photosynthetic microbial mat
This work
O2 evolution, microsensors 0.01-0.07
2.2-15.4*
microphytpbenthic system
Refs. 7-15
O2 evolution, microsensors 0.00045* 0.1 global ecosystem Ref.16 8 photons absorbed per O2 evolved
0.125 27.7* theoretical maximum Ref.17
1Singsaas et al. (2001), 2Zhu et al. (2008), 3Dubinsky et al. (1986), 4Flameling and Kromkamp (1998), 5Frost-Christensen and Sand-Jensen (1992), 6Hochberg and Atkinson (2008), 7Lassen et al. (1992b), 8Revsbech et al. (1983), 9Kühl et al. (1996), 10Epping and Jørgensen (1996), 11Hawes and Schwarz (1999), 12Epping and Kühl (2000), 13Buffan-Dubau et al. (2001), 14Jonkers et al. (2003), 15Vopel and Hawes (2006), 16Makarieva et al. (2008), 17Falkowski and Raven (1997) * Calculated based on Eq. 1 in the main text. §Mean ± S.D. of n = 106 values: QEmax = 0.0328 ± 0.0189O2 photon-1, EEmax = 7.3 ± 4.2.
Supplementary References
Buffan-Dubau E., Pringault O., de Wit R. (2001). Artificial cold-adapted microbial mats cultured from Antarctic lake samples. 1. Formation and structure. Aquatic Microbial Ecology 26(2):115-125.
Dubinsky Z., Falkowski P.G., Wyman K. (1986). Light harvesting and utilization by
phytoplankton. Plant and Cell Physiology 27(7):1335-1349.
�78
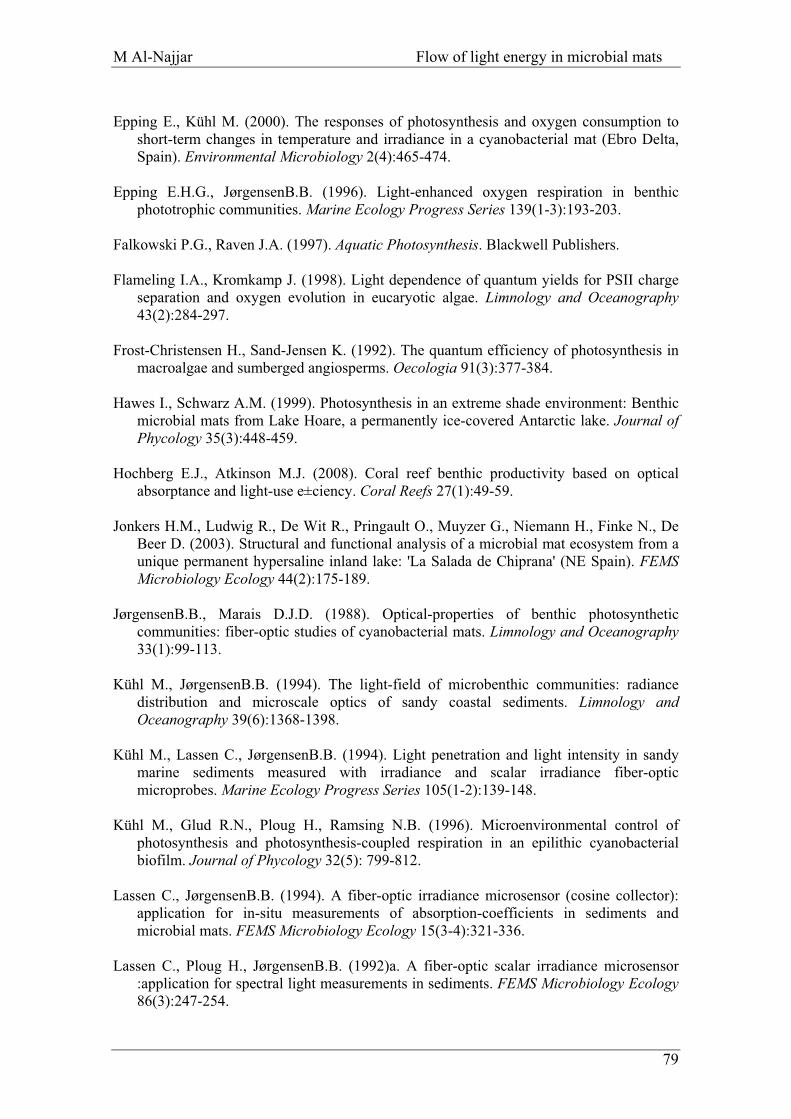
M Al-Najjar Flow of light energy in microbial mats
Epping E., Kühl M. (2000). The responses of photosynthesis and oxygen consumption to short-term changes in temperature and irradiance in a cyanobacterial mat (Ebro Delta, Spain). Environmental Microbiology 2(4):465-474.
Epping E.H.G., JørgensenB.B. (1996). Light-enhanced oxygen respiration in benthic
phototrophic communities. Marine Ecology Progress Series 139(1-3):193-203. Falkowski P.G., Raven J.A. (1997). Aquatic Photosynthesis. Blackwell Publishers. Flameling I.A., Kromkamp J. (1998). Light dependence of quantum yields for PSII charge
separation and oxygen evolution in eucaryotic algae. Limnology and Oceanography 43(2):284-297.
Frost-Christensen H., Sand-Jensen K. (1992). The quantum efficiency of photosynthesis in
macroalgae and sumberged angiosperms. Oecologia 91(3):377-384. Hawes I., Schwarz A.M. (1999). Photosynthesis in an extreme shade environment: Benthic
microbial mats from Lake Hoare, a permanently ice-covered Antarctic lake. Journal of Phycology 35(3):448-459.
Hochberg E.J., Atkinson M.J. (2008). Coral reef benthic productivity based on optical
absorptance and light-use e±ciency. Coral Reefs 27(1):49-59. Jonkers H.M., Ludwig R., De Wit R., Pringault O., Muyzer G., Niemann H., Finke N., De
Beer D. (2003). Structural and functional analysis of a microbial mat ecosystem from a unique permanent hypersaline inland lake: 'La Salada de Chiprana' (NE Spain). FEMS Microbiology Ecology 44(2):175-189.
JørgensenB.B., Marais D.J.D. (1988). Optical-properties of benthic photosynthetic
communities: fiber-optic studies of cyanobacterial mats. Limnology and Oceanography 33(1):99-113.
Kühl M., JørgensenB.B. (1994). The light-field of microbenthic communities: radiance
distribution and microscale optics of sandy coastal sediments. Limnology and Oceanography 39(6):1368-1398.
Kühl M., Lassen C., JørgensenB.B. (1994). Light penetration and light intensity in sandy
marine sediments measured with irradiance and scalar irradiance fiber-optic microprobes. Marine Ecology Progress Series 105(1-2):139-148.
Kühl M., Glud R.N., Ploug H., Ramsing N.B. (1996). Microenvironmental control of
photosynthesis and photosynthesis-coupled respiration in an epilithic cyanobacterial biofilm. Journal of Phycology 32(5): 799-812.
Lassen C., JørgensenB.B. (1994). A fiber-optic irradiance microsensor (cosine collector):
application for in-situ measurements of absorption-coefficients in sediments and microbial mats. FEMS Microbiology Ecology 15(3-4):321-336.
Lassen C., Ploug H., JørgensenB.B. (1992)a. A fiber-optic scalar irradiance microsensor
:application for spectral light measurements in sediments. FEMS Microbiology Ecology 86(3):247-254.
� 79
Chapter 2 Light conversion in microbial mats
Lassen C., Ploug H., JørgensenB.B. (1992)b. Microalgal photosynthesis and spectral scalar
irradiance in coastal marine-sediments of Limfjorden, Denmark. Limnology and Oceanography 37(4):760-772.
Makarieva A.M., Gorshkov V.G., Li B.L. (2008). Energy budget of the biosphere and
civilization: Rethinking environmental security of global renewable and non-renewable resources. Ecological Complexity 5(4):281-288.
Polerecky L., Bachar A., Schoon R., Grinstein M., JørgensenB.B., de Beer D., Jonkers
H.M. (2007). Contribution of Chloroflexus respiration to oxygen cycling in a hypersaline microbial mat from Lake Chiprana, Spain. Environmental Microbiology 9(8):2007-2024.
Revsbech N.P. (1989). An oxygen microsensor with a guard cathode. Limnology and
Oceanography 34 (2):474-478. Revsbech N.P., JørgensenB.B. (1983). Photosynthesis of benthic microflora measured with
high spatial-resolution by the oxygen microprofile method, capabilities and limitations of the method. Limnology and Oceanography 28(4):749-756.
Revsbech N.P., JørgensenB.B., Blackburn T.H., Cohen Y. (1983). Microelectrode studies of
the photosynthesis and O2, H2S, and pH profiles of a microbial mat. Limnology and Oceanography 28(6): 1062-1074.
Sherwood J.E., Stagnitti F., Kokkinn M.J., Williams W.D. (1991). Dissolved-oxygen
concentrations in hypersaline waters. Limnology and Oceanography 36(2):235-250. Singsaas E.L., Ort D.R., DeLucia E.H. (2001). Variation in measured values of
photosynthetic quantum yield in ecophysiological studies. Oecologia 128(1):15-23. Vopel K., Hawes I. (2006). Photosynthetic performance of benthic microbial mats in Lake
Hoare, Antarctica. Limnology and Oceanography 51(4):1801-1812. Yang L., Kruse B., Miklavcic S.J. (2004). Revised Kubelka-Munk theory. II. Unified
framework for homogeneous and inhomogeneous optical media. Journal of the Optical Society of America A|Optics Image Science and Vision 21(10):1942-1952.
Zhu X.G., Long S.P., Ort D.R. (2008). What is the maximum efficiency with which
photosynthesis can convert solar energy into biomass? Current Opinion in Biotechnology 19(2):153-159.
�80

M Al-Najjar Flow of light energy in microbial mats
� 81
Chapter 3
Comparison of light utilization efficiency
in photosynthetic microbial mats
Mohammad A. A. Al-Najjar1, Dirk de Beer1 and Lubos Polerecky1 1 Max-Planck Institute for Marine Microbiology, Celsius str.1, 28359 Bremen, Germany
Manuscript in preparation
�
Chapter 3 Comparison of light utilization in photosynthetic mats
Comparison of light utilization efficiency
in photosynthetic microbial mats
Mohammad A. A. Al-Najjar, Dirk de Beer and Lubos Polerecky Max-Planck Institute for Marine Microbiology, Celsiusstr.1, 28359 Bremen, Germany
Manuscript in preparation
Abstract
We combined microsensors for light, temperature and oxygen to measure the conversion of
light energy in photosynthetic microbial mats originating from three distant geographical
locations. The mats differed with respect to the structure and composition of the
phototrophic community, thickness of the photosynthetically active zone and pigment
concentrations in this zone, but not with respect to the areal photosynthetic activity at light
saturation. In all mats, more than 99% of the absorbed light energy dissipated as heat at
incident light intensities typically experienced by the mats during the day. The efficiency of
light energy conservation by photosynthesis increased with decreasing light intensity,
reaching maximum at light limiting conditions. The maximum photosynthetic efficiency
varied among the studied mats between 4.5�16.2%, and was positively correlated with the
rate of light attenuation (r2 = 0.98) and the average concentration of photo-pigments in the
euphotic zone of the mat (r2 = 0.95). For all mats, the maximum photosynthetic efficiencies
were much lower than those estimated for an ideal system that absorbs the same fraction of
incident light as the mats, for which the theoretical maximum is 27.7%. The photosynthetic
microbial mats were more efficient in conserving the light energy at light limiting
conditions when their euphotic zone was thinner and more densely populated by
photosynthetic cells, and the efficiency was significantly lowered due to light absorption by
photosynthetically inactive components of the mat ecosystem.
82
M. Al-Najjar Flow of light energy in microbial mats
Introduction
Photosynthetic mats are light-driven ecosystems where complex, microbially mediated
energy conversions and element cycles occur within the upper few millimeters. Due to the
thin layer and dense communities, photosynthetic mats are ideal model systems to study the
tight coupling between these processes. This is especially important in the context of
behavior of complex ecosystems in element cycling.
Photosynthetic mats are characterized by pronounced vertical stratification of the
microbial community and microenvironmental conditions. This is a result of the attenuation
of light with depth, high rates of metabolic activity of the different functional groups in the
system, and the limited transport of substrates and products of metabolic processes. The
spatial organization of mats is essentially determined by environmental conditions, such as
the quantity and quality of available energy and nutrients, temperature, salinity, input of
sediment or availability of water. We hypothesize that, for a given environmental setting,
the mat ecosystem is structured such that the efficiency of utilization of the available
resources is maximized.
To explore this hypothesis from the perspective of photosynthetic light utilization
efficiency, we followed the fate of light energy in three photosynthetic microbial mats
originating from distant geographical locations with different environmental characteristics.
The main objectives were to compare the three systems and to identify possible links
between the photosynthetic efficiency and structure of the mats and the environmental
settings of their origin. We applied the microsensor-based approach described by Al-Najjar
et al. (2010) to quantify with a high spatial resolution the rates of light absorption, heat
production and photosynthetic energy conservation in the system. Furthermore, we
characterized the structure of the mats from the content and distribution of pigments,
exopolymers and mineral particles.
83
Chapter 3 Comparison of light utilization in photosynthetic mats
Materials and Methods
Sampling
The microbial mats originated from (i) Sadeyat Island, Abu Dhabi, United Arab Emirates;
(ii) Svalbard in the Arctic, and (iii) Exmouth Gulf, Western Australia (Fig.1). The sampling
site and incubation conditions for the Abu Dhabi (AD) mat were described elsewhere (Al-
Najjar et al. 2010). The Arctic (ARC) mat was collected on 11th August 2008 from an
intertidal flat in Ymerbukta, Svalbard (78°16.844'N/14°02.968’E; air temperature: 4.6°C;
sediment and water temperature: 6.4-6.5°C). The sample was covered with water from the
collection site (for elemental composition, see Gihring et al. 2010), transported to the Max-
Planck Institute in Bremen, and incubated at 4°C under a 14h/10h light/dark illumination
regime. Illumination with an incident quantum irradiance of 15 μmol photons m-2 s-1 was
provided by a halogen lamp (KL 2500, Schott, Germany). Measurements were conducted 3
weeks after the collection. The Australian (AUS) mat was collected on 16th October 2008
from the low intertidal zone of the Exmouth Gulf (for habitat characteristics and elemental
composition of the mat, see Lovelock et al. 2009). After transportation to the Max-Planck
Institute, the mat was rewetted and incubated in filtered seawater (28ºC, salinity 33) under a
10h/14h light/dark illumination regime. Illumination with incident quantum irradiance of
120 μmol photons m-2 s-1 was provided by a tungsten lamp (Envirolite, UK). During
incubation, seawater was pumped over the mat for only 5 hours a day to mimic the original
environmental conditions, using a pump connected to a timer. Measurements were
conducted 2 months after the rewetting.
Experimental Setup and Calculations
The measurements and calculations were done as described earlier (Al-Najjar et al. 2010).
Briefly, a mat sample was placed in a flow cell and a laminar flow of aerated seawater
above the mat surface was maintained by a pump. Temperature was controlled by a
84
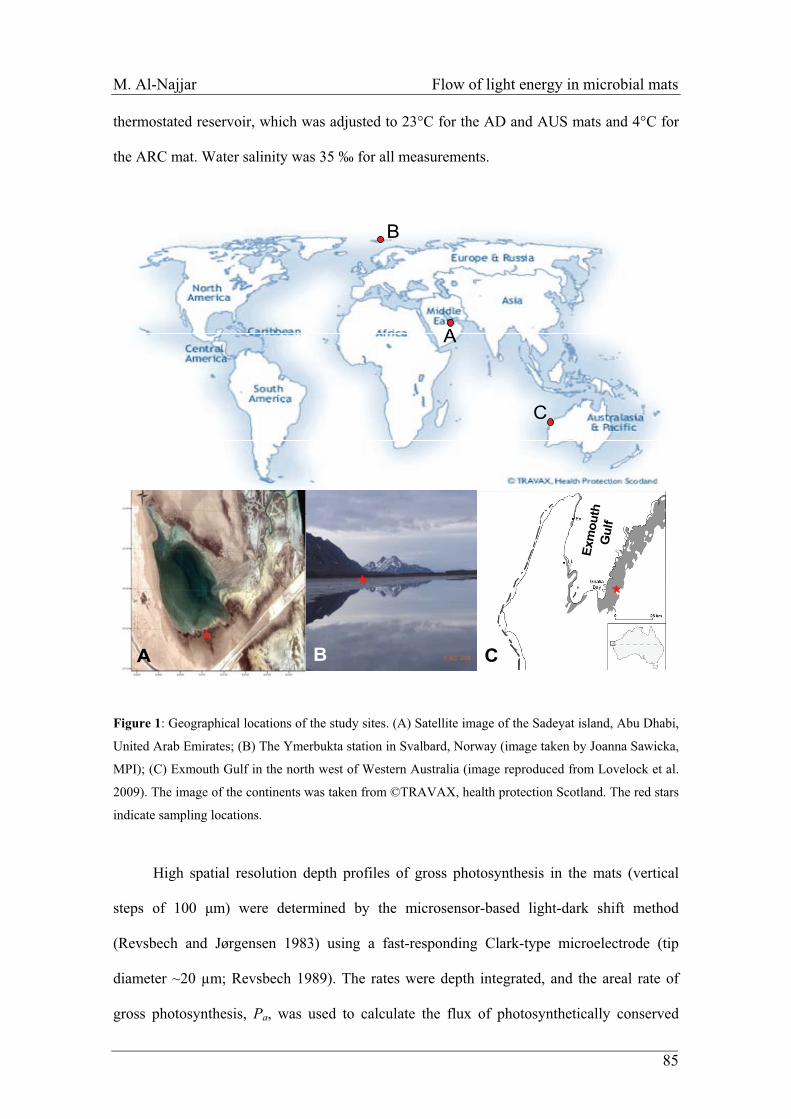
M. Al-Najjar Flow of light energy in microbial mats
thermostated reservoir, which was adjusted to 23°C for the AD and AUS mats and 4°C for
the ARC mat. Water salinity was 35 ‰ for all measurements.
A
B
A
C
CB
Exm
outh
Gul
f
A
B
A
C
CB
Exm
outh
Gul
f
Figure 1: Geographical locations of the study sites. (A) Satellite image of the Sadeyat island, Abu Dhabi,
United Arab Emirates; (B) The Ymerbukta station in Svalbard, Norway (image taken by Joanna Sawicka,
MPI); (C) Exmouth Gulf in the north west of Western Australia (image reproduced from Lovelock et al.
2009). The image of the continents was taken from ©TRAVAX, health protection Scotland. The red stars
indicate sampling locations.
High spatial resolution depth profiles of gross photosynthesis in the mats (vertical
steps of 100 �m) were determined by the microsensor-based light-dark shift method
(Revsbech and Jørgensen 1983) using a fast-responding Clark-type microelectrode (tip
diameter ~20 μm; Revsbech 1989). The rates were depth integrated, and the areal rate of
gross photosynthesis, Pa, was used to calculate the flux of photosynthetically conserved
85
Chapter 3 Comparison of light utilization in photosynthetic mats
86
light energy according to , where is the Gibbs energy produced when O2
molecule is formed by splitting water (EG = 482.9 kJ (mol O2)-1; Al-Najjar et al. 2010). Heat
dissipation fluxes were calculated as
aG PEJ =PS GE
,zT=H �
J � where = 0.6 J m-1 s-1 K-1 is the thermal
conductivity of water and is the temperature gradient, which was measured in the
thermal boundary layer (TBL) using a thermocouple microsensor (tip diameter ~50 �m;
T50, Unisense A/S). The fluxes of light energy absorbed by the mats were derived from the
spectral reflectance measurements. First, the intensities of light back-scattered from a white
reflectance standard (I�,ref) and from the mat (I�,mat) were measured using a fiber-optic field
radiance microprobe (fiber tip diameter ~50 μm; Jørgensen and Des Marais 1988; Kühl
2005) connected to a spectrometer (USB4000, Ocean Optics, USA), and the spectral
reflectance of the mat was calculated as R¡ = I�,mat / I�,ref. Subsequently, the incident spectral
quantum irradiance (I� in μmol photon m-2 s-1 nm ) was measured by the same
spectrometer equipped with a cosine collector, and the flux of absorbed light energy in the
PAR region (photosynthetically active radiation; 400�700 nm) was calculated as
where is the energy of a photon with wavelength ¡. Gross
photosynthesis rates and steady state temperature microprofiles were measured at increasing
incident irradiances in the range of 17�400 μmol photon m-2 s-1 and 200�2400 μmol photon
m-2 s-1, respectively.
zT �� /
, �E
1�
d)(1=700
400abs ���� REIJ ��
The efficiencies of heat dissipation (�H) and photosynthetic energy conservation by
the mat ecosystem (�PS) were calculated from the measured energy fluxes as
.)(=and)(=abs
absHH
abs
absPSPS J
JJJ
JJ��
M. Al-Najjar Flow of light energy in microbial mats
The maximum photosynthetic efficiency, denoted as maxPS,� , was calculated from the initial
slope of JPS plotted as a function of Jabs, and the minimum heat dissipation efficiency was
calculated as .1= maxPS,minH, �� �
Light attenuation in the mats was measured with a scalar irradiance microprobe
(Lassen et al. 1992) connected to a spectrometer (USB4000). The mats were illuminated
with a collimated light beam and the scalar irradiance was measured in vertical steps of
100 �m. The scalar irradiance was integrated over PAR and normalized to the value at the
mat surface. Subsequently, the measured data were fitted with an exponential function Es(z)
= Es(0) exp[��(z-z0)] to estimate the light attenuation rate �. The light penetration depth,
defined as the depth where the local scalar irradiance reached 1% of the level at the mat
surface, was calculated as 2�ln10/�.
Light Microscopy and Confocal Laser Microscopy
Phototrophic cells in the mats were identified using morphological criteria described
previously (Castenholz 2001; Uher 2009). Cells from the euphotic zone were suspended,
placed on a slide, covered with a cover slip and observed under a light microscope.
Additionally, the architecture of the uppermost layers of the studied mats (top 300 μm) was
investigated using a confocal laser microscope (Zeiss LSM 510) equipped with four
different Helium-Neon lasers. First, the exopolymeric substances (EPS) were specifically
stained using the dye fluorescent brightener 28 (Sigma) as described by de Beer et al.
(1996). Subsequently, excitation wavelengths of 488, 633, and 364 nm were used to image
fluorescence emission of Chl a, phycocyanin and the EPS-bound fluorescent brightener 28.
The Z-stack projection was done in 10 μm steps and analyzed with the ImageJ software.
87
Chapter 3 Comparison of light utilization in photosynthetic mats
Pigment content
High spatial resolution depth distributions of photo-pigments in the studied mats were
measured with the modular spectral imaging system (Polerecky et al. 2009). A vertical
section of the mat (~1 mm thin) was placed on a white reference standard, illuminated with
a halogen bulb (Philips; emission range 400�900 nm) and scanned. The pigments were
identified based on their absorption maxima and their distribution was visualized with the
Look@MOSI software (http://www.microsen-wiki.net) using the second derivative of the
measured reflectance spectra at the wavelengths of maximal absorption (Polerecky et al.
2009).
Quantification of Phycocyanin (PC) was done spectro-photometrically as described
previously (Sode et al. 1991). Briefly, the uppermost 2 mm of the mat were suspended in 1
ml of 65 mM phosphate buffer (pH 8.2) with added lysozyme (concentration of 15 mg/ml).
The suspension was incubated for 2 h at 37°C. Subsequently, the lysate was centrifuged at
3000g for 20 min at 4°C and the absorbance of the supernatant was measured with a
spectrophotometer (Lambda 20, Perkin Elmer). The PC concentration was calculated as
34.5)474.0(
)/( 650615 AAmlmgPC
��� ,
where A615 and A650 are absorbances at the specific wavelengths corrected for the near
infrared absorbance at 750 nm, A615 = A’615 � A’750, A615 = A’615 � A’750 (Sode et al. 1991).
Chlorophyll a (Chl a) and fucoxanthin (FUC) concentrations were quantified using
high-performance liquid chromatography (HPLC). Mat samples were freeze-dried,
horizontally sliced in 200 μm thick sections and incubated in 100% acetone in the dark for
24 h at �20°C. Subsequently, the supernatant was filtrated through a 0.45 μm Acrodiscs CR
4-mm syringe filter (Pall Gelman laboratory) and the filtrates were injected into a reverse-
phase HPLC consisting of a Waters 996 photo diode array detector (PDA) and a Waters
2695 separation module (Waters, MA). Pigments were separated using a 125 � 4.6 mm
88
M. Al-Najjar Flow of light energy in microbial mats
vertex column packed with a Eurospher-100 C18 particles of 5-mm in size (Knauer GmbH,
Berlin, Germany). Identification and quantification were done by comparing the retention
time and spectrum of the eluents with those of pigment standards (DHI Water and
Environment, Denmark). The samples were kept on ice and under dim light during the
procedure.
Results
Light distribution
The scalar irradiance integrated over PAR (photosynthetically active radiation; 400�700
nm) decreased approximately exponentially with depth in the mats (Fig. 2, left panels). A
slight increase in the scalar irradiance at depths 100�200 �m relative to the surface value
was observed in the AD mat, whereas no such enhancement was detected in the ARC and
AUS mats. The light attenuation rates were the highest in the AUS mat (13.4 mm-1) and the
lowest in the AD mat (4.55 mm-1; Table 1). The corresponding light penetration depths
ranged from 0.35 to 1 mm, and roughly coincided with the maximum thickness of the
euphotic zone (Table 1).
Photosynthesis
The thickness of the euphotic zone in the AD mat increased from 0.4 to 1.1 mm with
increasing incident light intensity (Fig. 2B). At the lowest light intensities, the maximum
photosynthetic activity occurred at the mat surface, whereas at higher intensities this
maximum was observed at depths between 0.3-0.4 mm. An additional activity peak
appeared at depths 0.9�1 mm at the highest light intensities (Fig. 2B). In the ARC mat, the
thickness of the euphotic zone also slightly increased with illumination (from 0.6 to 0.8)
and maximum activity occurred at 0.2 mm below the surface (Fig. 2D). In contrast, the
thickness of the euphotic zone in the AUS mat remained constant for all investigated
illumination intensities.
89
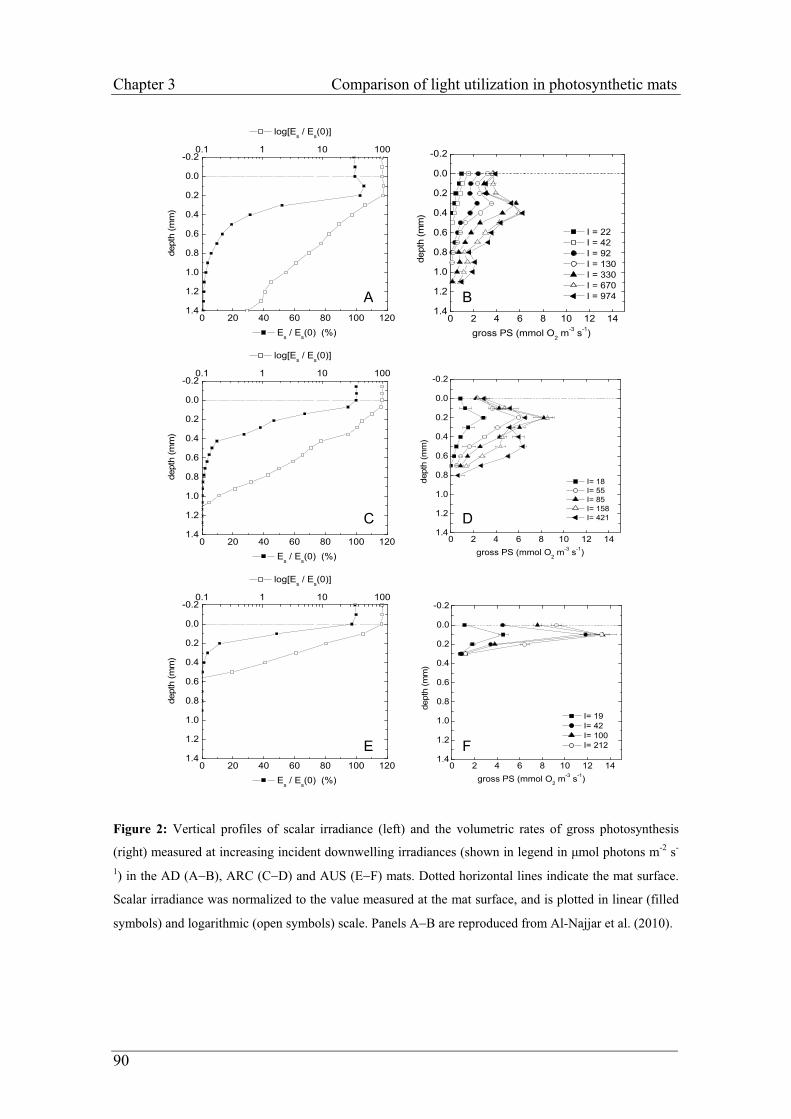
Chapter 3 Comparison of light utilization in photosynthetic mats
1.4
1.2
1.0
0.8
0.6
0.4
0.2
0.0
-0.2
0 20 40 60 80 100 120
0.1 1 10 100
Es / E
s(0) (%)
dept
h (m
m)
log[Es / E
s(0)]
1.4
1.2
1.0
0.8
0.6
0.4
0.2
0.0
-0.2
0 20 40 60 80 100 120
0.1 1 10 100
Es / E
s(0) (%)
dept
h (m
m)
log[Es / E
s(0)]
1.4
1.2
1.0
0.8
0.6
0.4
0.2
0.0
-0.2
0 20 40 60 80 100 120
0.1 1 10 100
Es / E
s(0) (%)
dept
h (m
m)
log[Es / E
s(0)]
1.4
1.2
1.0
0.8
0.6
0.4
0.2
0.0
-0.2
0 2 4 6 8 10 12 14gross PS (mmol O2 m
-3 s-1)
dept
h (m
m)
I = 22 I = 42 I = 92 I = 130 I = 330 I = 670 I = 974
1.4
1.2
1.0
0.8
0.6
0.4
0.2
0.0
-0.2
0 2 4 6 8 10 12 14
I= 18 I= 55 I= 85 I= 158 I= 421
gross PS (mmol O2 m-3 s-1)
dept
h (m
m)
1.4
1.2
1.0
0.8
0.6
0.4
0.2
0.0
-0.2
0 2 4 6 8 10 12 14
I= 19 I= 42 I= 100 I= 212
gross PS (mmol O2 m-3 s-1)
dept
h (m
m)
A B
C D
E F
Figure 2: Vertical profiles of scalar irradiance (left) and the volumetric rates of gross photosynthesis
(right) measured at increasing incident downwelling irradiances (shown in legend in �mol photons m-2 s-
1) in the AD (A�B), ARC (C�D) and AUS (E�F) mats. Dotted horizontal lines indicate the mat surface.
Scalar irradiance was normalized to the value measured at the mat surface, and is plotted in linear (filled
symbols) and logarithmic (open symbols) scale. Panels A�B are reproduced from Al-Najjar et al. (2010).
90
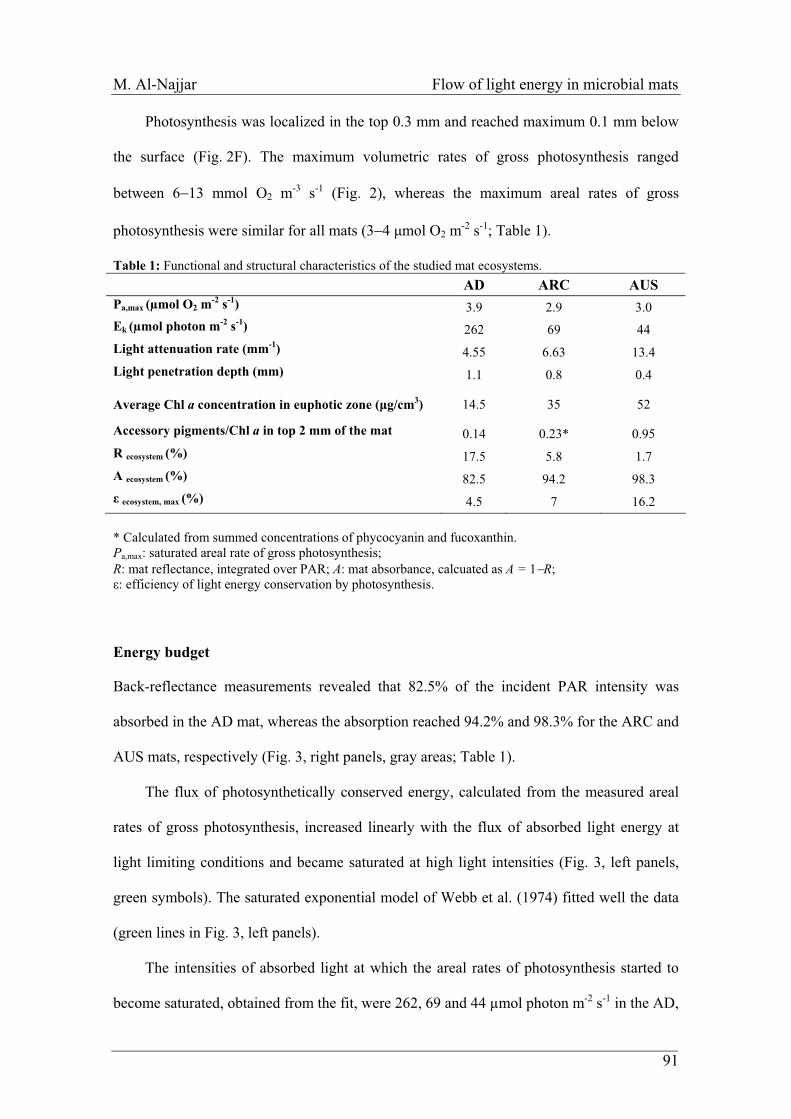
M. Al-Najjar Flow of light energy in microbial mats
Photosynthesis was localized in the top 0.3 mm and reached maximum 0.1 mm below
the surface (Fig. 2F). The maximum volumetric rates of gross photosynthesis ranged
between 6�13 mmol O2 m-3 s-1 (Fig. 2), whereas the maximum areal rates of gross
photosynthesis were similar for all mats (3�4 �mol O2 m-2 s-1; Table 1).
Table 1: Functional and structural characteristics of the studied mat ecosystems. AD ARC AUS Pa,max (μmol O2 m-2 s-1) 3.9 2.9 3.0 Ek (μmol photon m-2 s-1) 262 69 44 Light attenuation rate (mm-1) 4.55 6.63 13.4 Light penetration depth (mm) 1.1 0.8 0.4
Average Chl a concentration in euphotic zone (�g/cm3) 14.5 35 52
Accessory pigments/Chl a in top 2 mm of the mat 0.14 0.23* 0.95 R ecosystem (%) 17.5 5.8 1.7 A ecosystem (%) 82.5 94.2 98.3 � ecosystem, max (%) 4.5 7 16.2
* Calculated from summed concentrations of phycocyanin and fucoxanthin. Pa,max: saturated areal rate of gross photosynthesis; R: mat reflectance, integrated over PAR; A: mat absorbance, calcuated as A = 1�R; £: efficiency of light energy conservation by photosynthesis.
Energy budget
Back-reflectance measurements revealed that 82.5% of the incident PAR intensity was
absorbed in the AD mat, whereas the absorption reached 94.2% and 98.3% for the ARC and
AUS mats, respectively (Fig. 3, right panels, gray areas; Table 1).
The flux of photosynthetically conserved energy, calculated from the measured areal
rates of gross photosynthesis, increased linearly with the flux of absorbed light energy at
light limiting conditions and became saturated at high light intensities (Fig. 3, left panels,
green symbols). The saturated exponential model of Webb et al. (1974) fitted well the data
(green lines in Fig. 3, left panels).
The intensities of absorbed light at which the areal rates of photosynthesis started to
become saturated, obtained from the fit, were 262, 69 and 44 μmol photon m-2 s-1 in the AD,
91
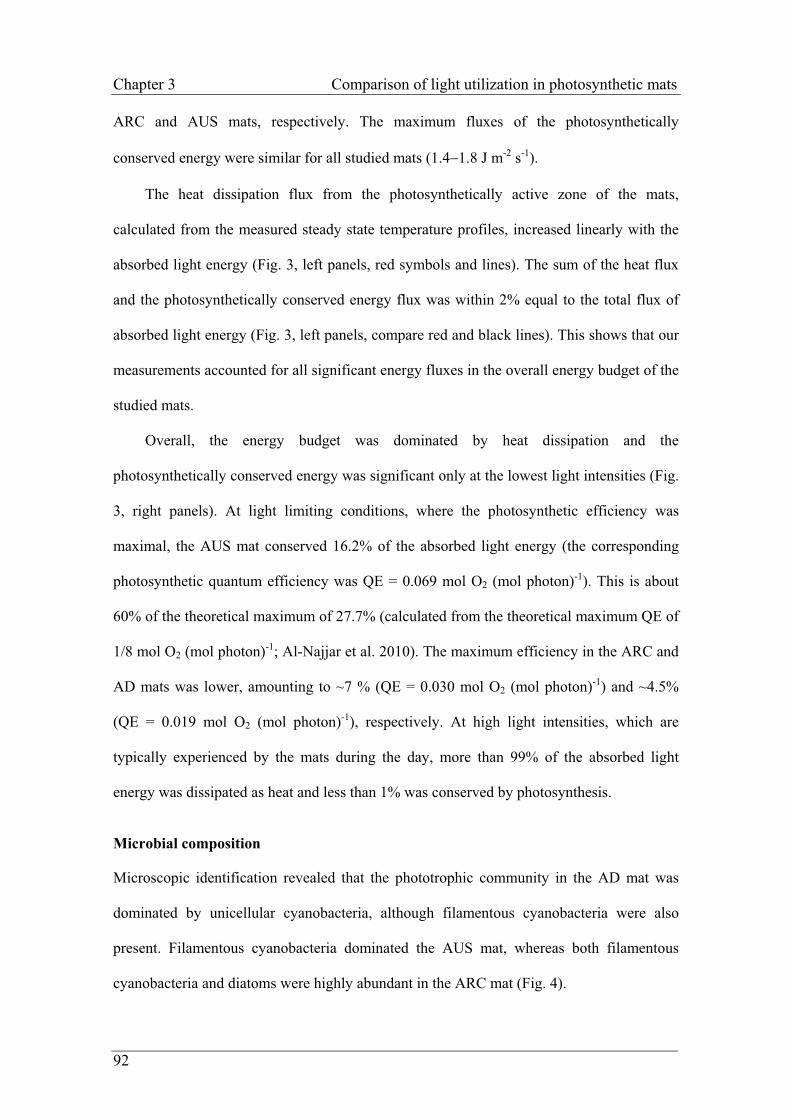
Chapter 3 Comparison of light utilization in photosynthetic mats
ARC and AUS mats, respectively. The maximum fluxes of the photosynthetically
conserved energy were similar for all studied mats (1.4�1.8 J m-2 s-1).
The heat dissipation flux from the photosynthetically active zone of the mats,
calculated from the measured steady state temperature profiles, increased linearly with the
absorbed light energy (Fig. 3, left panels, red symbols and lines). The sum of the heat flux
and the photosynthetically conserved energy flux was within 2% equal to the total flux of
absorbed light energy (Fig. 3, left panels, compare red and black lines). This shows that our
measurements accounted for all significant energy fluxes in the overall energy budget of the
studied mats.
Overall, the energy budget was dominated by heat dissipation and the
photosynthetically conserved energy was significant only at the lowest light intensities (Fig.
3, right panels). At light limiting conditions, where the photosynthetic efficiency was
maximal, the AUS mat conserved 16.2% of the absorbed light energy (the corresponding
photosynthetic quantum efficiency was QE = 0.069 mol O2 (mol photon)-1). This is about
60% of the theoretical maximum of 27.7% (calculated from the theoretical maximum QE of
1/8 mol O2 (mol photon)-1; Al-Najjar et al. 2010). The maximum efficiency in the ARC and
AD mats was lower, amounting to ~7 % (QE = 0.030 mol O2 (mol photon)-1) and ~4.5%
(QE = 0.019 mol O2 (mol photon)-1), respectively. At high light intensities, which are
typically experienced by the mats during the day, more than 99% of the absorbed light
energy was dissipated as heat and less than 1% was conserved by photosynthesis.
Microbial composition
Microscopic identification revealed that the phototrophic community in the AD mat was
dominated by unicellular cyanobacteria, although filamentous cyanobacteria were also
present. Filamentous cyanobacteria dominated the AUS mat, whereas both filamentous
cyanobacteria and diatoms were highly abundant in the ARC mat (Fig. 4).
92
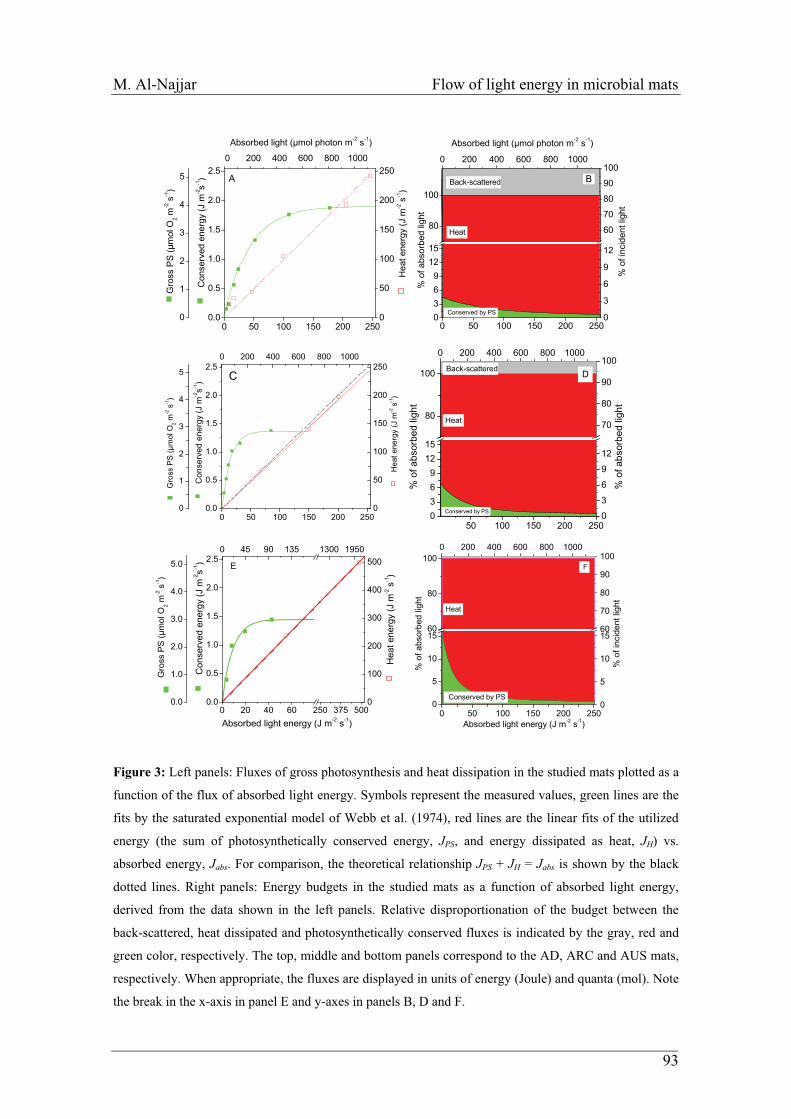
M. Al-Najjar Flow of light energy in microbial mats
0 200 400 600 800 1000
0
3
6
9
12
60
70
80
90
100
0 50 100 150 200 2500.0
0.5
1.0
1.5
2.0
2.50 200 400 600 800 1000
0
1
2
3
4
5
0 50 100 150 200 2500369
1215
80
100Back-scattered
Heat
Conserved by PS
% o
f abs
orbe
d lig
ht
B
% o
f inc
iden
t lig
ht
A
Con
serv
ed e
nerg
y (J
m-2s-1
)
0
50
100
150
200
250
Hea
t ene
rgy
(J m
-2 s
-1)
Absorbed light (µmol photon m-2 s-1) Absorbed light (µmol photon m-2 s-1)
Gro
ss P
S (µ
mol
O2 m
-2 s
-1)
0 50 100 150 200 2500.0
0.5
1.0
1.5
2.0
2.5
0
50
100
150
200
2500 200 400 600 800 1000
0
1
2
3
4
5
Con
serv
ed e
nerg
y (J
m-2s-1
) C H
eat e
nerg
y (J
m-2 s
-1)
Gro
ss P
S (µ
mol
O2 m
-2 s
-1)
0 200 400 600 800 1000
0
3
6
9
12
70
80
90
100
50 100 150 200 2500369
1215
80
100 D Back-scattered
Heat
Conserved by PS
% o
f abs
orbe
d lig
ht
% o
f abs
orbe
d lig
ht
0 200 400 600 800 1000
0
5
10
1560
70
80
90
100
0 50 100 150 200 2500
5
10
1560
80
100 F
Heat
Conserved by PS
% o
f abs
orbe
d lig
ht
Absorbed light energy (J m-2 s-1)
%
of i
ncid
ent l
ight
0
100
200
300
400
500
0.0
1.0
2.0
3.0
4.0
5.0
0 45 90 135 1300 1950
0 20 40 60 250 375 5000.0
0.5
1.0
1.5
2.0
2.5 E
Con
serv
ed e
nerg
y (J
m-2s-1
)
Absorbed light energy (J m-2 s-1)
Hea
t ene
rgy
(J m
-2 s
-1)
Gro
ss P
S (µ
mol
O2 m
-2 s
-1)
Figure 3: Left panels: Fluxes of gross photosynthesis and heat dissipation in the studied mats plotted as a
function of the flux of absorbed light energy. Symbols represent the measured values, green lines are the
fits by the saturated exponential model of Webb et al. (1974), red lines are the linear fits of the utilized
energy (the sum of photosynthetically conserved energy, JPS, and energy dissipated as heat, JH) vs.
absorbed energy, Jabs. For comparison, the theoretical relationship JPS + JH = Jabs is shown by the black
dotted lines. Right panels: Energy budgets in the studied mats as a function of absorbed light energy,
derived from the data shown in the left panels. Relative disproportionation of the budget between the
back-scattered, heat dissipated and photosynthetically conserved fluxes is indicated by the gray, red and
green color, respectively. The top, middle and bottom panels correspond to the AD, ARC and AUS mats,
respectively. When appropriate, the fluxes are displayed in units of energy (Joule) and quanta (mol). Note
the break in the x-axis in panel E and y-axes in panels B, D and F.
93
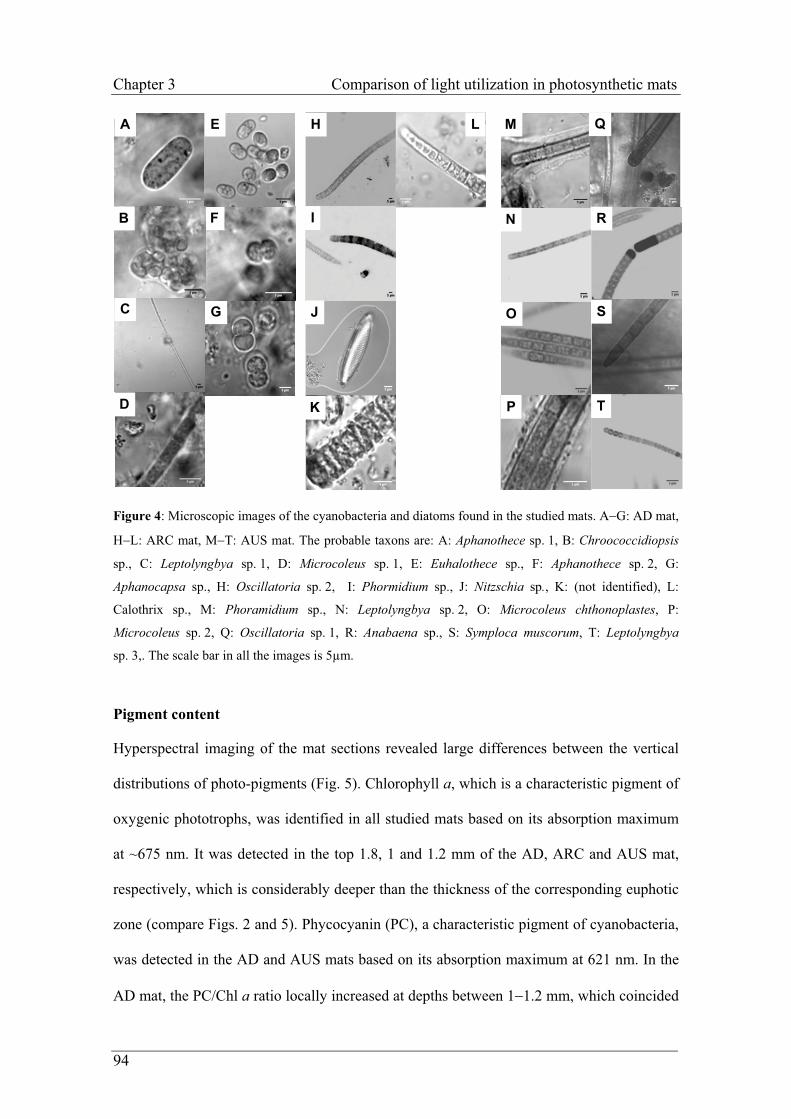
Chapter 3 Comparison of light utilization in photosynthetic mats
Figure 4: Microscopic images of the cyanobacteria and diatoms found in the studied mats. A�G: AD mat,
H�L: ARC mat, M�T: AUS mat. The probable taxons are: A: Aphanothece sp. 1, B: Chroococcidiopsis
sp., C: Leptolyngbya sp. 1, D: Microcoleus sp. 1, E: Euhalothece sp., F: Aphanothece sp. 2, G:
Aphanocapsa sp., H: Oscillatoria sp. 2, I: Phormidium sp., J: Nitzschia sp., K: (not identified), L:
Calothrix sp., M: Phoramidium sp., N: Leptolyngbya sp. 2, O: Microcoleus chthonoplastes, P:
Microcoleus sp. 2, Q: Oscillatoria sp. 1, R: Anabaena sp., S: Symploca muscorum, T: Leptolyngbya
sp. 3,. The scale bar in all the images is 5μm.
Pigment content
Hyperspectral imaging of the mat sections revealed large differences between the vertical
distributions of photo-pigments (Fig. 5). Chlorophyll a, which is a characteristic pigment of
oxygenic phototrophs, was identified in all studied mats based on its absorption maximum
at ~675 nm. It was detected in the top 1.8, 1 and 1.2 mm of the AD, ARC and AUS mat,
respectively, which is considerably deeper than the thickness of the corresponding euphotic
zone (compare Figs. 2 and 5). Phycocyanin (PC), a characteristic pigment of cyanobacteria,
was detected in the AD and AUS mats based on its absorption maximum at 621 nm. In the
AD mat, the PC/Chl a ratio locally increased at depths between 1�1.2 mm, which coincided
A
G
F
D
QE H L M
IB RN
C SJ O
TPK
94
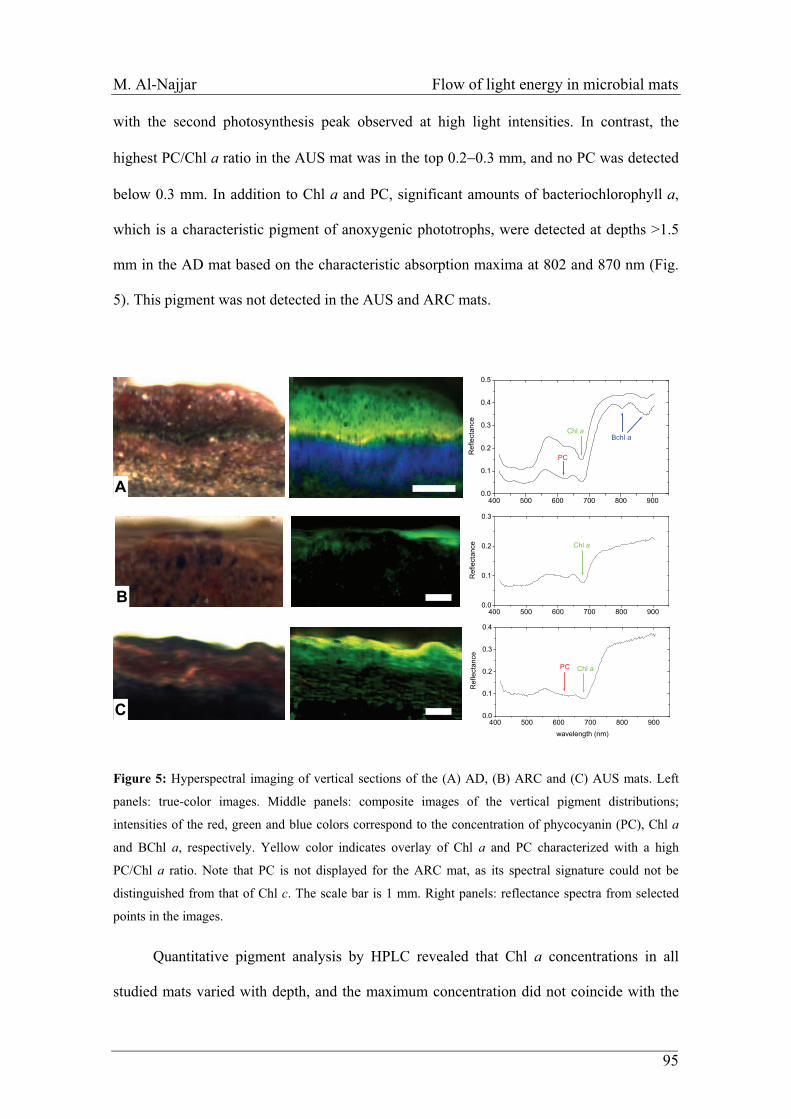
M. Al-Najjar Flow of light energy in microbial mats
95
with the second photosynthesis peak observed at high light intensities. In contrast, the
highest PC/Chl a ratio in the AUS mat was in the top 0.2�0.3 mm, and no PC was detected
below 0.3 mm. In addition to Chl a and PC, significant amounts of bacteriochlorophyll a,
which is a characteristic pigment of anoxygenic phototrophs, were detected at depths >1.5
mm in the AD mat based on the characteristic absorption maxima at 802 and 870 nm (Fig.
5). This pigment was not detected in the AUS and ARC mats.
Figure 5: Hyperspectral imaging of vertical sections of the (A) AD, (B) ARC and (C) AUS mats. Left
panels: true-color images. Middle panels: composite images of the vertical pigment distributions;
intensities of the red, green and blue colors correspond to the concentration of phycocyanin (PC), Chl a
and BChl a, respectively. Yellow color indicates overlay of Chl a and PC characterized with a high
PC/Chl a ratio. Note that PC is not displayed for the ARC mat, as its spectral signature could not be
distinguished from that of Chl c. The scale bar is 1 mm. Right panels: reflectance spectra from selected
points in the images.
Quantitative pigment analysis by HPLC revealed that Chl a concentrations in all
studied mats varied with depth, and the maximum concentration did not coincide with the
400 500 600 700 800 9000.0
0.1
0.2
0.3
0.4
0.5
Bchl a
PC
Chl a
Ref
lect
ance
400 500 600 700 800 9000.0
0.1
0.2
0.3
Chl a
Ref
lect
ance
400 500 600 700 800 9000.0
0.1
0.2
0.3
0.4
PC Chl a
Ref
lect
ance
wavelength (nm)
A
B
C
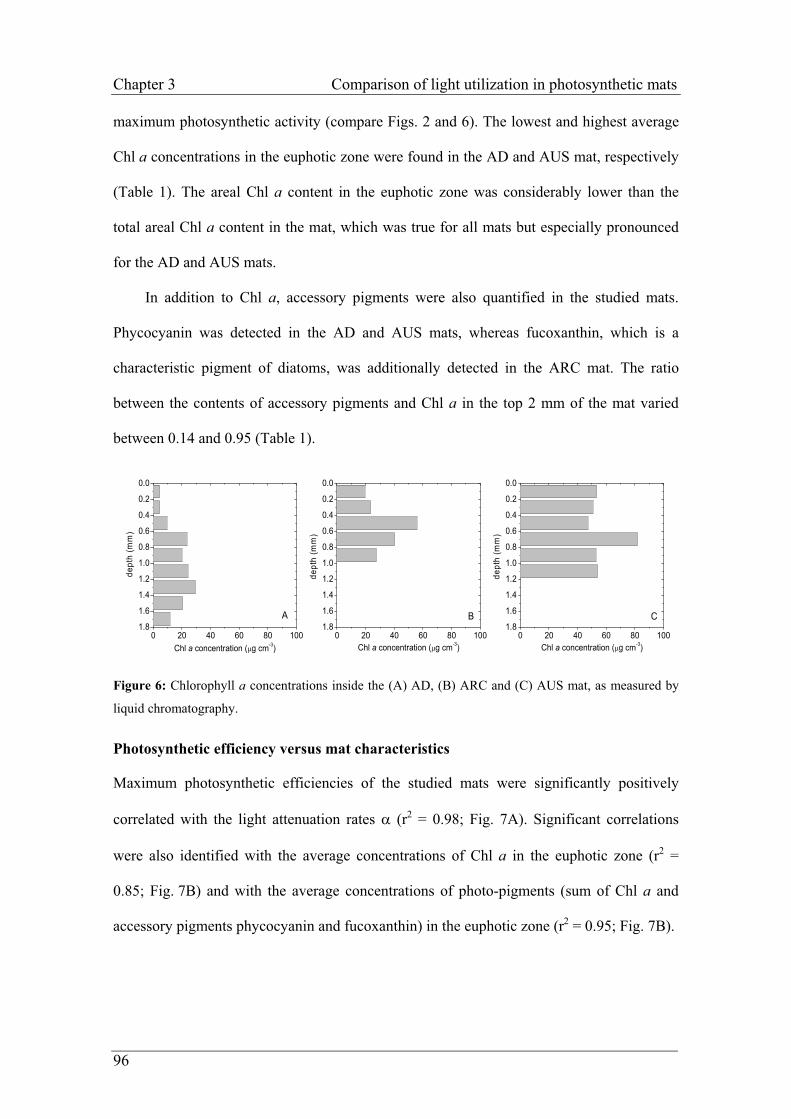
Chapter 3 Comparison of light utilization in photosynthetic mats
maximum photosynthetic activity (compare Figs. 2 and 6). The lowest and highest average
Chl a concentrations in the euphotic zone were found in the AD and AUS mat, respectively
(Table 1). The areal Chl a content in the euphotic zone was considerably lower than the
total areal Chl a content in the mat, which was true for all mats but especially pronounced
for the AD and AUS mats.
In addition to Chl a, accessory pigments were also quantified in the studied mats.
Phycocyanin was detected in the AD and AUS mats, whereas fucoxanthin, which is a
characteristic pigment of diatoms, was additionally detected in the ARC mat. The ratio
between the contents of accessory pigments and Chl a in the top 2 mm of the mat varied
between 0.14 and 0.95 (Table 1).
1.8
1.6
1.4
1.2
1.0
0.8
0.6
0.4
0.2
0.0
0 20 40 60 80 100
C
Chl a concentration (�g cm-3)
dept
h (m
m)
1.8
1.6
1.4
1.2
1.0
0.8
0.6
0.4
0.2
0.0
0 20 40 60 80 100
B
Chl a concentration (�g cm-3)
dept
h (m
m)
1.8
1.6
1.4
1.2
1.0
0.8
0.6
0.4
0.2
0.0
0 20 40 60 80 100
A
Chl a concentration (�g cm-3)
dept
h (m
m)
Figure 6: Chlorophyll a concentrations inside the (A) AD, (B) ARC and (C) AUS mat, as measured by
liquid chromatography.
Photosynthetic efficiency versus mat characteristics
Maximum photosynthetic efficiencies of the studied mats were significantly positively
correlated with the light attenuation rates � (r2 = 0.98; Fig. 7A). Significant correlations
were also identified with the average concentrations of Chl a in the euphotic zone (r2 =
0.85; Fig. 7B) and with the average concentrations of photo-pigments (sum of Chl a and
accessory pigments phycocyanin and fucoxanthin) in the euphotic zone (r2 = 0.95; Fig. 7B).
96

M. Al-Najjar Flow of light energy in microbial mats
Discussion
On a cellular level, the efficiency of light utilization in photosynthetic organisms depends
on a variety of factors. Environmental conditions that influence the efficiency include
irradiance (Flameling and Kromkamp 1998; Aarti et al. 2007), temperature (Falkowski and
Raven 1997; Abed et al. 2006), availability of essential nutrients (Beardall et al. 2001;
Ludwig et al. 2006), iron (e.g. Martin et al. 1990; Kirchman et al. 2000), CO2, O2
(Grötzschel and de Beer 2002) and other cofactors. Furthermore, salinity and hydration
status (Garcia-Pichel and Belnap 1996; Garcia-Pichel et al. 1999; Garcia-Pichel and
Pringault 2001; Chaves et al. 2009) play an essential role in this respect.
0 5 10 15 20 250
5
10
15
20
25
30A
AUS
ARCAD
� max
(%)
�PAR (mm-1)0 20 40 60 80 100 120
0
5
10
15
20
Chl a Chl a + accessory
BAUS
ARC
AD
� max
(%)
pigment concentration (�g cm-3)
Figure 7: Maximum photosynthetic efficiency of the studied mats plotted against (A) the attenuation rate
of photosynthetically active radiation (PAR) in the mat, (B) average concentration of Chl a in the
euphotic zone (closed symbols), and the sum of average concentrations of Chl a and accessory pigments
(phycocyanin and fucoxanthin) in the euphotic zone (open symbols).
Depending on the environmental conditions, photosynthetic cells develop specific
adaptations to optimally trap light energy or to protect their photosynthetic apparatus from
damage by excessive light. This is controlled enzymatically by limiting the rate of processes
carried out in the photosynthetic apparatus, or by the redox status of the intermediate
97
Chapter 3 Comparison of light utilization in photosynthetic mats
electron carriers between the photosystems. The excess light energy absorbed by the
photosynthetic apparatus is dissipated as heat.
In photosynthetic ecosystems such as microbial mats, most of the factors influencing
photosynthetic efficiency vary steeply with depth, and the cells present at different depths
must develop different adaptations to optimize their photosynthesis. The central aim of this
study was to explore whether general conclusions can be drawn about the photosynthetic
efficiency of the mat ecosystem as a whole, independent of the specific adaptations in
individual cells.
We found that utilization of the absorbed light energy by the mats was always
dominated by heat dissipation (Fig. 3). At irradiances that are typically experienced by the
mats during the day, more than 99% of the absorbed light energy was dissipated as heat and
only less than 1% was conserved as chemical energy by photosynthesis. As the energy of
the absorbed light decreased towards zero, the photosynthetic efficiency of the mats
increased towards the maximum. Thus, the behavior of the mat ecosystem reflected the
response of an individual cell, which exhibits the same type of saturation of photosynthesis
with light.
The maximum photosynthetic efficiency varied among the studied mats between 4.5%
and 16.2%, and this variability was best explained by the rate at which the scalar irradiance
in the mat attenuates with depth (Fig. 7A). Since the light attenuation rate was inversely
proportional to the depth of the euphotic zone, this essentially means that mats with a
shallower euphotic zone had higher maximum photosynthetic efficiency. Light attenuation
in the mat occurs because of absorption by photo-pigments and by photosynthetically
inactive components of the matrix in which the photosynthetic cells are embedded (e.g.,
sand grains, detritus or exopolymers). Since photo-pigments are involved in photosynthesis,
higher pigment concentrations imply higher concentrations of photosynthetically active
biomass and, for a given amount of available light, higher volumetric rates of
98
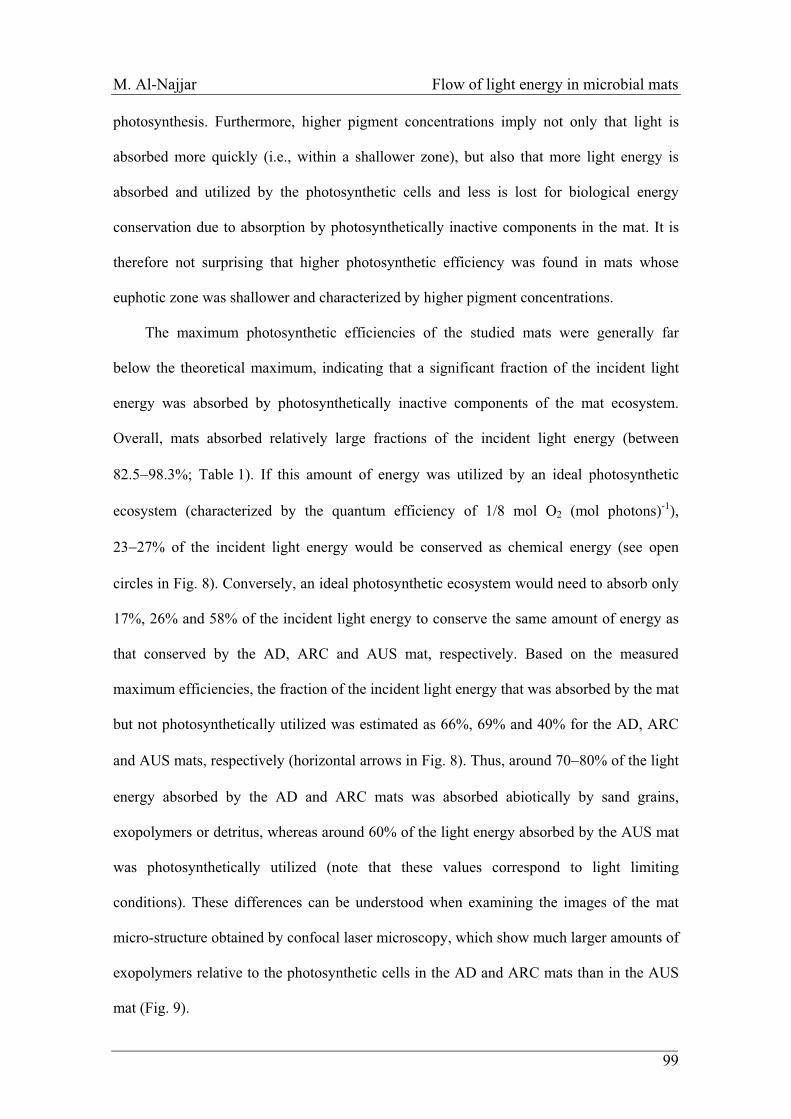
M. Al-Najjar Flow of light energy in microbial mats
photosynthesis. Furthermore, higher pigment concentrations imply not only that light is
absorbed more quickly (i.e., within a shallower zone), but also that more light energy is
absorbed and utilized by the photosynthetic cells and less is lost for biological energy
conservation due to absorption by photosynthetically inactive components in the mat. It is
therefore not surprising that higher photosynthetic efficiency was found in mats whose
euphotic zone was shallower and characterized by higher pigment concentrations.
The maximum photosynthetic efficiencies of the studied mats were generally far
below the theoretical maximum, indicating that a significant fraction of the incident light
energy was absorbed by photosynthetically inactive components of the mat ecosystem.
Overall, mats absorbed relatively large fractions of the incident light energy (between
82.5�98.3%; Table 1). If this amount of energy was utilized by an ideal photosynthetic
ecosystem (characterized by the quantum efficiency of 1/8 mol O2 (mol photons)-1),
23�27% of the incident light energy would be conserved as chemical energy (see open
circles in Fig. 8). Conversely, an ideal photosynthetic ecosystem would need to absorb only
17%, 26% and 58% of the incident light energy to conserve the same amount of energy as
that conserved by the AD, ARC and AUS mat, respectively. Based on the measured
maximum efficiencies, the fraction of the incident light energy that was absorbed by the mat
but not photosynthetically utilized was estimated as 66%, 69% and 40% for the AD, ARC
and AUS mats, respectively (horizontal arrows in Fig. 8). Thus, around 70�80% of the light
energy absorbed by the AD and ARC mats was absorbed abiotically by sand grains,
exopolymers or detritus, whereas around 60% of the light energy absorbed by the AUS mat
was photosynthetically utilized (note that these values correspond to light limiting
conditions). These differences can be understood when examining the images of the mat
micro-structure obtained by confocal laser microscopy, which show much larger amounts of
exopolymers relative to the photosynthetic cells in the AD and ARC mats than in the AUS
mat (Fig. 9).
99
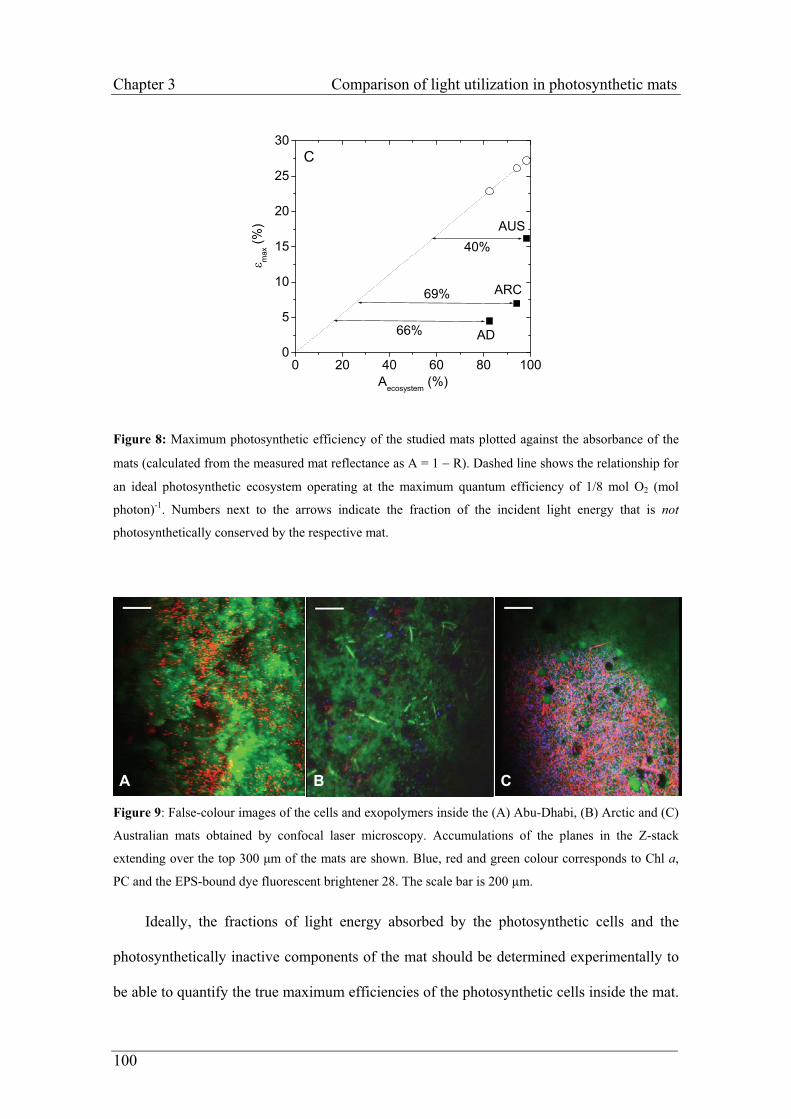
Chapter 3 Comparison of light utilization in photosynthetic mats
0 20 40 60 80 1000
5
10
15
20
25
30C
40%
69%
66%
AUS
ARC
AD
� max
(%)
Aecosystem (%)
Figure 8: Maximum photosynthetic efficiency of the studied mats plotted against the absorbance of the
mats (calculated from the measured mat reflectance as A = 1 � R). Dashed line shows the relationship for
an ideal photosynthetic ecosystem operating at the maximum quantum efficiency of 1/8 mol O2 (mol
photon)-1. Numbers next to the arrows indicate the fraction of the incident light energy that is not
photosynthetically conserved by the respective mat.
A B C
Figure 9: False-colour images of the cells and exopolymers inside the (A) Abu-Dhabi, (B) Arctic and (C)
Australian mats obtained by confocal laser microscopy. Accumulations of the planes in the Z-stack
extending over the top 300 �m of the mats are shown. Blue, red and green colour corresponds to Chl a,
PC and the EPS-bound dye fluorescent brightener 28. The scale bar is 200 μm.
Ideally, the fractions of light energy absorbed by the photosynthetic cells and the
photosynthetically inactive components of the mat should be determined experimentally to
be able to quantify the true maximum efficiencies of the photosynthetic cells inside the mat.
100
M. Al-Najjar Flow of light energy in microbial mats
A possible method to realize this is to measure the transmission and reflectance of a
horizontal mat section that extends over the thickness of the euphotic zone, and to compare
these measurements before and after extraction of the photo-pigments from the sample. This
was, however, not possible in this study, and thus our results with respect to maximal
photosynthetic efficiencies are limited to the mat ecosystem as a whole. Nevertheless, our
measurements show that the maximal photosynthetic efficiency in microbial mats is highly
variable and generally much lower than that for other systems, such as shade-adapted plants
(24.4%; Singsaas et al. 2001), phytoplankton (24.2%; Dubinsky et al. 1986) or coral reef
organisms (up to 21%; Hochberg and Atkinson 2008).
In conclusion, utilization of the absorbed light energy in the studied mats was
dominated by heat dissipation. Conservation of the light energy by photosynthesis was
maximal at light limiting conditions, and the maximum conservation efficiency varied
significantly among the mats. This variability was best explained by the variability in the
rate of light attenuation, which is influenced by the average pigment concentration in the
euphotic zone of the mat. The highest maximum efficiency was detected in the mat with the
steepest light gradient, where the euphotic zone was thinnest and most densely populated
with photosynthetically active cells. The maximum efficiency was lowered by the
photosynthetically inactive components of the mat ecosystem, which contribute
significantly to the light absorption in the euphotic zone and thus decrease the amount of
light available for photosynthesis.
Acknowledgment
We thank Dr. Alistair Grinham and Dr. Cathrine Lovelock for supplying us with the mats
from Exmouth Gulf, Australia, Joana Sawicka for collecting the Arctic mat samples, Dr.
Martin Beutler for his assistance with confocal laser microscopy, Dr. Katharina Kohls,
Judith Klatt, and Olivera Kuijpers for their help in the lab, and technical assistants of the
101
Chapter 3 Comparison of light utilization in photosynthetic mats
microsensor group for providing us with excellent oxygen microsensors. We are grateful to
Prof. Dr. Michael Kühl for valuable suggestions and critical reading of this manuscript.
This work was financially supported by the Max-Planck Society and the Yusef Jameel
Scholarship.
Authors Contribution
LP and DB designed the project, MAN and LP designed the setup, conducted the
measurements, and analyzed the data. MAN wrote the manuscript with input from LP and
DB.
References
Aarti, D., Tanaka, R., Ito, H., Tanaka, A., 2007. High light inhibits chlorophyll biosynthesis at the level of 5-aminolevulinate synthesis during de-etiolation in cucumber (Cucumis sativus) cotyledons. Photochemistry and Photobiology 83, 171-176.
Abed, R.M.M., Garcia-Pichel, F., Hernandez-Marine, M., 2002. Polyphasic characterization
of benthic, moderately halophilic, moderately thermophilic cyanobacteria with very thin trichomes and the proposal of Halomicronema excentricum gen. nov., sp nov. Archives of Microbiology 177, 361-370.
Abed, R.M.M., Polerecky, L., Al Najjar, M., de Beer, D., 2006. Effect of temperature on
photosynthesis, oxygen consumption and sulfide production in an extremely hypersaline cyanobacterial mat. Aquatic Microbial Ecology 44, 21-30.
Al-Najjar, M.A.A., de Beer, D., Jørgensen, B.B., Kühl, M., Polerecky, L., 2010. Conversion
and conservation of light energy in a photosynthetic microbial mat ecosystem. The ISME Journal 4, 440-449.
Beardall, J., Young, E., Roberts, S., 2001. Approaches for determining phytoplankton
nutrient limitation. Aquatic Sciences 63, 44-69. Bowler, C., Karl, D.M., Colwell, R.R., 2009. Microbial oceanography in a sea of
opportunity. Nature 459, 180-184. Brown, L.M., Zeiler, K.G., 1993. Aquatic biomass and carbon-dioxide trapping. Energy
Conversion and Management 34, 1005-1013. Castenholz, R., 2001. General characteristics of the cyanobacteria, In Bergey’s Manual of
Systematic Bacteriology. eds D. Boone, R. Castenholz, pp. 474–487. Springer, New York.
102

M. Al-Najjar Flow of light energy in microbial mats
Castenholz, R.W., Garcia-Pichel, F., 2000. The ecology of cyanobacteria: Their diversity in
time and space, In The ecology of cyanobacteria. eds A. B. Whitton, M. Potts, pp. 593-603.
Chaves, M.M., Flexas, J., Pinheiro, C., 2009. Photosynthesis under drought and salt stress:
regulation mechanisms from whole plant to cell. Annals of Botany 103, 551-560. de Beer, D., Oflaharty, V., Thaveesri, J., Lens, P., Verstraete, W., 1996. Distribution of
extracellular polysaccharides and flotation of anaerobic sludge. Applied Microbiology and Biotechnology 46, 197-201.
Dechazal, N.M., Smith, G.D., 1994. Characterization of a Brown Nostoc Species from Java
That Is Resistant to High Light-Intensity and Uv. Microbiology-Uk 140, 3183-3189. Dillon, J.G., Tatsumi, C.M., Tandingan, P.G., Castenholz, R.W., 2002. Effect of
environmental factors on the synthesis of scytonemin, a UV-screening pigment, in a cyanobacterium (Chroococcidiopsis sp.). Archives of Microbiology 177, 322-331.
Dubinsky, Z., Falkowski, P.G., Wyman, K., 1986. Light harvesting and utilization by
phytoplankton. Plant and Cell Physiology 27, 1335-1349. Falkowski, P.G., Raven, J.A., 1997. Aquatic photosynthesis. Blackwell Science, Capital
City Press, Washington, DC. Flameling, I.A., Kromkamp, J., 1998. Light dependence of quantum yields for PSII charge
separation and oxygen evolution in eucaryotic algae. Limnology and Oceanography 43, 284-297.
Franks, J., Stolz, J.F., 2009. Flat laminated microbial mat communities. Earth-Science
Reviews 96, 163-172. Gantt, E., 1981. Phycobilisomes. Annual Review of Plant Physiology and Plant Molecular
Biology 32, 327-347. Garcia-Pichel, F., Belnap, J., 1996. Microenvironments and microscale productivity of
cyanobacterial desert crusts. Journal of Phycology 32, 774-782. Garcia-Pichel, F., Kühl, M., Nubel, U., Muyzer, G., 1999. Salinity-dependent limitation of
photosynthesis and oxygen exchange in microbial mats. Journal of Phycology 35, 227-238.
Garcia-Pichel, F., Pringault, O., 2001. Microbiology - Cyanobacteria track water in desert
soils. Nature 413, 380-381. Gihring, T.M., Lavik, G., Kuypers, M.M.M., Kostka, J.E., 2010. Direct determination of
nitrogen cycling rates and pathways in Arctic fjord sediments (Svalbard, Norway). the American Society of Limnology and Oceanography 55, 740-752.
Gouveia, L., Oliveira, A.C., 2009. Microalgae as a raw material for biofuels production.
Journal of Industrial Microbiology & Biotechnology 36, 269-274.
103
Chapter 3 Comparison of light utilization in photosynthetic mats
Grabowski, J., Gantt, E., 1978. Photophysical properties of phycobiliproteins from
phycobilisomes - fluorescence lifetimes, quantum yields, and polarization spectra. Photochemistry and Photobiology 28, 39-45.
Grotzschel, S., de Beer, D., 2002. Effect of oxygen concentration on photosynthesis and
respiration in two hypersaline microbial mats. Microbial Ecology 44, 208-216. Guan, X.Y., Qin, S., Zhao, F.Q., Zhang, X.W., Tang, X.X., 2007. Phycobilisomes linker
family in cyanobacterial genomes: divergence and evolution. International Journal of Biological Sciences 3, 434-445.
Haugan, J.A., Liaaenjensen, S., 1994. Isolation and characterization of 4 allenic (6's)-
isomers of fucoxanthin. Tetrahedron Letters 35, 2245-2248. Hochberg, E.J., Atkinson, M.J., 2008. Coral reef benthic productivity based on optical
absorptance and light-use efficiency. Coral Reefs 27, 49-59. Jørgensen, B.B., Des Marais, D.J., 1988. Optical-properties of benthic photosynthetic
communities - fiber-optic studies of cyanobacterial mats. Limnology and Oceanography 33, 99-113.
Karsten, U., 1996. Growth and organic osmolytes of geographically different isolates of
Microcoleus chthonoplastes (cyanobacteria) from benthic microbial mats: Response to salinity change. Journal of Phycology 32, 501-506.
Kirchman, D.L., Meon, B., Cottrell, M.T., Hutchins, D.A., Weeks, D., Bruland, K.W.,
2000. Carbon versus iron limitation of bacterial growth in the California upwelling regime. Limnology and Oceanography 45, 1681-1688.
Kühl, M., 2005. Optical microsensors for analysis of microbial communities, In Methods in
Enzymology. pp. 166-199. Kühl, M., Jørgensen, B.B., 1994. The light-field of microbenthic communities - radiance
distribution and microscale optics of sandy coastal sediments. Limnology and Oceanography 39, 1368-1398.
Kühl, M., Lassen, C., Jørgensen, B.B., 1994. Optical properties of microbial mats: light
measurements with fiber-optic microprobes, In Microbial Mats: Structure, Development and Environmental Significance. eds J. Stal, P. Caumette, pp. 149-167. Springer, Berlin.
Lassen, C., Ploug, H., Jorgensen, B.B., 1992. A fiberoptic scalar irradiance microsensor -
application for spectral light measurements in sediments. Fems Microbiology Ecology 86, 247-254.
Lewis, N.S., Nocera, D.G., 2006. Powering the planet: Chemical challenges in solar energy
utilization. Proceedings of the National Academy of Sciences of the United States of America 103, 15729-15735.
104
M. Al-Najjar Flow of light energy in microbial mats
Li, X.F., Xu, H., Wu, Q.Y., 2007. Large-scale biodiesel production from microalga Chlorella protothecoides through heterotropic Cultivation in bioreactors. Biotechnology and Bioengineering 98, 764-771.
Lovelock, C., Grinham, A., Adame, M.F., H., P., 2009. Elemental composition and
productivity of cyanobacterial mats in an arid zone estuary in north Western Australia. Wetlands Ecology and Management.
Ludwig, R., Pringault, O., de Wit, R., de Beer, D., Jonkers, H.M., 2006. Limitation of
oxygenic photosynthesis and oxygen consumption by phosphate and organic nitrogen in a hypersaline microbial mat: a microsensor study. Fems Microbiology Ecology 57, 9-17.
Martin, J.H., Fitzwater, S.E., Gordon, R.M., 1990. Iron deficiency limits phytoplankton
growth in Antractic waters. Global Biogeochemical Cycles 4, 5-12. Mikhodyuk, O.S., Gerasimenko, L.M., Akimov, V.N., Ivanovsky, R.N., Zavarzin, G.A.,
2008. Ecophysiology and polymorphism of the unicellular extremely natronophilic cyanobacterium Euhalothece sp Z-M001 from Lake Magadi. Microbiology 77, 717-725.
Mullineaux, C.W., 2001. How do cyanobacteria sense and respond to light? Molecular
Microbiology 41, 965-971. Mussgnug, J.H., Thomas-Hall, S., Rupprecht, J., Foo, A., Klassen, V., McDowall, A.,
Schenk, P.M., Kruse, O., Hankamer, B., 2007. Engineering photosynthetic light capture: impacts on improved solar energy to biomass conversion. Plant Biotechnology Journal 5, 802-814.
Oren, A., Sorensen, K.B., Canfield, D.E., Teske, A.P., Ionescu, D., Lipski, A., Altendorf,
K., 2009. Microbial communities and processes within a hypersaline gypsum crust in a saltern evaporation pond (Eilat, Israel). Hydrobiologia 626, 15-26.
Polerecky, L., Bissett, A., Al-Najjar, M., Faerber, P., Osmers, H., Suci, P.A., Stoodley, P.,
de Beer, D., 2009. Modular spectral imaging system for discrimination of pigments in cells and microbial communities. Applied and Environmental Microbiology 75, 758-771.
Ragauskas, A.J., Williams, C.K., Davison, B.H., Britovsek, G., Cairney, J., Eckert, C.A.,
Frederick, W.J., Hallett, J.P., Leak, D.J., Liotta, C.L., Mielenz, J.R., Murphy, R., Templer, R., Tschaplinski, T., 2006. The path forward for biofuels and biomaterials. Science 311, 484-489.
Revsbech, N.P., 1989. An oxygen microsensor with a guard cathode. Limnology and
Oceanography 34, 474-478. Revsbech, N.P., Jørgensen, B.B., 1983. Photosynthesis of benthic microflora measured with
high spatial-resolution by the oxygen microprofile method - capabilities and limitations of the method. Limnology and Oceanography 28, 749-756.
105
Chapter 3 Comparison of light utilization in photosynthetic mats
Schmitz, O., Katayama, M., Williams, S.B., Kondo, T., Golden, S.S., 2000. CikA, a bacteriophytochrome that resets the cyanobacterial circadian clock. Science 289, 765-768.
Searle, G.F.W., Barber, J., Porter, G., Tredwell, C.J., 1978. Picosecond time-resolved
energy-transfer in porphyridium-cruentum .2. Isolated light harvesting complex (Phycobilisomes). Biochimica Et Biophysica Acta 501, 246-256.
Singsaas, E.L., Ort, D.R., DeLucia, E.H., 2001. Variation in measured values of
photosynthetic quantum yield in ecophysiological studies. Oecologia 128, 15-23. Sode, K., Horikoshi, K., Takeyama, H., Nakamura, N., Matsunaga, T., 1991. Online
monitoring of marine cyanobacterial cultivation based on phycocyanin fluorescence. Journal of Biotechnology 21, 209-217.
Stal, L.J., 2000. Cyanobacterial mats and stromatolites, In The ecology of cyanobacteria.
eds A. B. Whitton, M. Potts, pp. 61-120. Kluwer Academic Publishers, Dordrecht, The Netherlands.
Uher, B., 2009. Spatial distribution of cyanobacteria and algae from the tombstone in a
historic cemetery in Bratislava, Slovakia. Fottea 9, 81-92. Vasudevan, P.T., Briggs, M., 2008. Biodiesel production-current state of the art and
challenges. Journal of Industrial Microbiology & Biotechnology 35, 421-430. Webb, W.L., Newton, M., Starr, D., 1974. Carbon-dioxide exchange of Alnus-Rubra -
mathematical-model. Oecologia 17, 281-291. Wright, S.W., Jeffrey, S.W., Mantoura, R.F.C., Llewellyn, C.A., Bjornland, T., Repeta, D.,
Welschmeyer, N., 1991. Improved Hplc method for the analysis of chlorophylls and carotenoids from marine-phytoplankton. Marine Ecology-Progress Series 77, 183-196.
Yoshihara, S., Suzuki, F., Fujita, H., Geng, X.X., Ikeuchi, M., 2000. Novel putative
photoreceptor and regulatory genes required for the positive phototactic movement of the unicellular motile cyanobacterium Synechocystis sp PCC 6803. Plant and Cell Physiology 41, 1299-1304.
Zhu, X.G., Long, S.P., Ort, D.R., 2008. What is the maximum efficiency with which
photosynthesis can convert solar energy into biomass? Current Opinion in Biotechnology 19, 153-159.
106
M. Al-Najjar Flow of light energy in microbial mats
107
Chapter 4
Spatial Distribution of Photosynthetic Efficiency
and Light Acclimation in Microbial Mat Ecosystems
Mohammad Al-Najjar1, Alban Ramette1, Michael Kühl2, Waleed Hamza3, Dirk de
Beer1, and Lubos Polerecky1
1 Max-Planck Institute for Marine Microbiology, Celsiusstr. 1, 28359 Bremen, Germany. 2 Marine Biological Laboratory, Department of Biology, University of Copenhagen, Strandpromenaden 5,
DK-3000 Helsingør, Denmark. 3 Biology Department, UAE University, Al-Ain, United Arab Emirates.
Manuscript in preparation
M. Al-Najjar Flow of light energy in microbial mats
Spatial Distribution of Photosynthetic Efficiency
and Light Acclimation in Cyanobacterial Mats
Mohammad Al-Najjar1, Alban Ramette1, Michael Kühl2, Waleed Hamza3,
Dirk de Beer1, and Lubos Polerecky1
1 Max-Planck Institute for Marine Microbiology, Celsiusstr. 1, 28359 Bremen, Germany. 2 Marine Biological Laboratory, Department of Biology, University of Copenhagen, Strandpromenaden 5,
DK-3000 Helsingør, Denmark. 3 Biology Department, UAE University, Al-Ain, United Arab Emirates.
Manuscript in preparation
Abstract
We applied hyperspectral and PAM imaging to study small- and large scale variability in
pigment distribution, quantum yield of PSII and light adaptation of cyanobacterial mats from
distant geographical locations. Concurrently we used the amplified ribosomal intergenic spacer
analysis (ARISA) to characterize the bacterial community structure of the mats. In all studied
mats, the maximum quantum yield and light acclimation intensity exhibited pronounced
vertical and horizontal heterogeneity on a sub-millimetre scale. They generally decreased in a
correlated manner with depth in the mat, with gradients that varied greatly within as well as
between samples. Average values of the maximum quantum yield of PSII, light acclimation
intensity and pigment absorbance varied between samples, but grouped in significantly
different clusters according to the geographical origin, which was similar to the grouping of the
mats based on their microbial community structure derived from ARISA fingerprinting
profiles.
108
Chapter 4 Spatial Distribution of Photosynthetic Efficiency
Introduction
Main tasks of microbial ecology are to understand how the structure, composition and function
of microbial communities are linked, how they are influenced by environmental conditions, and
how the communities contribute to the local and global cycling of elements. Cyanobacterial
mats are examples of microbial communities where these complex interactions between the
biotic and abiotic components occur within a layer of a few millimeters (vanGemerden 1993;
Stal 2000). Thus, they are good model systems to study these interactions.
Cyanobacterial mats are typically characterized by steep vertical gradients of chemical
parameters, including oxygen, pH and sulfide (Kühl et al. 1996; Wieland and Kühl 2000;
Jonkers et al. 2003; Garcia de Lomas 2005) . Also, the light field is highly heterogeneous on
spatial scales comparable with the size of and the distance between the individual organisms
(Kühl and Jørgensen 1992; Kühl and Jørgensen 1994; Kühl et al. 1994). This heterogeneity is a
result of high metabolic rates in the system and the diffusional transport resistance for
substrates and products of the metabolic processes. As a result of the physico-chemical
heterogeneity and different adaptations of microorganisms, the community composition is also
highly heterogeneous.
This study aimed to identify possible links between the heterogeneities in function and
structure of cyanobacterial mats, and to investigate whether and how these links are controlled
by environmental conditions. The focus was on photosynthesis and cyanobacteria, as one of the
dominant processes and players in cyanobacterial mats, and on both large- and small-scale
heterogeneities. We used PAM imaging to characterize the potential photosynthetic activity and
light adaptation in the mats, and hyperspectral imaging to measure light absorption by specific
photo-pigments. We assessed the differences in the microbial structure of the studied mats by
109
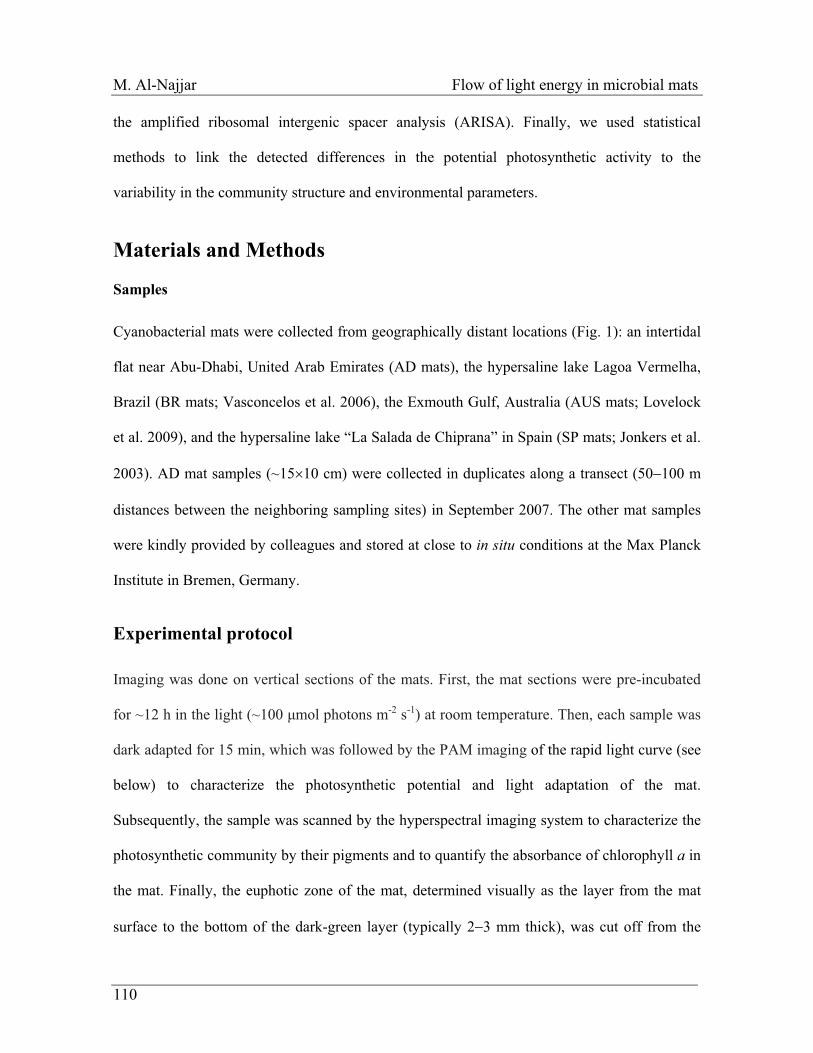
M. Al-Najjar Flow of light energy in microbial mats
the amplified ribosomal intergenic spacer analysis (ARISA). Finally, we used statistical
methods to link the detected differences in the potential photosynthetic activity to the
variability in the community structure and environmental parameters.
Materials and Methods
Samples
Cyanobacterial mats were collected from geographically distant locations (Fig. 1): an intertidal
flat near Abu-Dhabi, United Arab Emirates (AD mats), the hypersaline lake Lagoa Vermelha,
Brazil (BR mats; Vasconcelos et al. 2006), the Exmouth Gulf, Australia (AUS mats; Lovelock
et al. 2009), and the hypersaline lake “La Salada de Chiprana” in Spain (SP mats; Jonkers et al.
2003). AD mat samples (~15�10 cm) were collected in duplicates along a transect (50�100 m
distances between the neighboring sampling sites) in September 2007. The other mat samples
were kindly provided by colleagues and stored at close to in situ conditions at the Max Planck
Institute in Bremen, Germany.
Experimental protocol
Imaging was done on vertical sections of the mats. First, the mat sections were pre-incubated
for ~12 h in the light (~100 �mol photons m-2 s-1) at room temperature. Then, each sample was
dark adapted for 15 min, which was followed by the PAM imaging of the rapid light curve (see
below) to characterize the photosynthetic potential and light adaptation of the mat.
Subsequently, the sample was scanned by the hyperspectral imaging system to characterize the
photosynthetic community by their pigments and to quantify the absorbance of chlorophyll a in
the mat. Finally, the euphotic zone of the mat, determined visually as the layer from the mat
surface to the bottom of the dark-green layer (typically 2�3 mm thick), was cut off from the
110
Chapter 4 Spatial Distribution of Photosynthetic Efficiency
mat with a sterile scalpel and divided into two halves, whereby the first half was used for the
amplified ribosomal intergenic spacer analysis ARISA and the second half for the analysis of
pigments by liquid chromatography (chlorophyll a) and spectro-photometry (phycocyanin; see
Chapter 3) and for the analysis of C and N content by gas chromatography.
ba
Figure 1: Sampling locations of the studied cyanobacterial mats.
PAM imaging
PAM imaging was done with the imaging-PAM fluorometer (Walz GmbH, Germany), using
the red light emitting diodes to excite Chl a fluorescence. The measurement was automated by
the ImagingWin software. The vertical section of each mat sample was placed in a Petri dish,
covered with seawater (salinity 32 ‰, temperature 15 °C) and placed under the imaging-PAM
camera. After 15 min of dark adaptation, images of the minimum (Fo) and maximum (Fm)
fluorescence yields of the dark-adapted state were recorded (saturating pulse intensity 2400
111
M. Al-Najjar Flow of light energy in microbial mats
μmol photons m–2 s–1, duration 0.8 s), and the image of the dark-adapted PSII quantum yield
was calculated as Ym = (Fm�Fo)/Fm. Subsequently, rapid light curves (RLC, Schreiber et al.
1996; Schreiber et al. 1997) were measured by increasing the actinic irradiance from 0 to 1700
μmol photons m-2 s-1 in time intervals of 3 min and acquiring the fluorescence yield images at
actinic illumination (F) and during the saturating pulse (Fm’) at the end of each interval. The
image of the effective PSII quantum yield at the given actinic irradiance was calculated as
Y = (Fm’�F)/Fm’. (1)
The intensity of the actinic light was calibrated against a PAR quantum irradiance sensor (LI-
190 Quantum, LI-COR Biosciences) connected to a light meter (LI-250, LI-COR Biosciences)
positioned in the same place as the mat samples. As the samples were lying on their side, all
depths in the mat were exposed to the same illumination.
The values of Y were plotted against the intensity of the actinic illumination and the
following parameters were determined: maximum quantum yield of PSII (denoted as Ymax),
which was not necessarily equal to the dark-adapted PSII quantum yield Ym (see Discussion),
incident light intensity at which the quantum yield reached Ymax (denoted as Emax) and 1/2 of
Ymax (denoted as E1/2). The intensities Emax and E1/2 characterize light acclimation of the cells,
whereas Ymax reflects their maximum quantum efficiency of photosynthesis. These values were
calculated for each pixel in the image using a program written in Matlab, and displayed as
color-coded images.
Hyperspectral imaging
Immediately after PAM imaging, the mat sample was placed on a motorized stage, illuminated
with a halogen bulb (Philips, type 6423) emitting in the visible to near infrared range (400�900
nm), and scanned with the SPECIM hyperspectral imaging system (Spectral Imaging Ltd,
112
Chapter 4 Spatial Distribution of Photosynthetic Efficiency
Finland). The spectral reflectance images were calculated by normalizing against the light
back-scattered from a gray reference (40% reflectance; SRS-40-020, Labsphere). The
absorbance of the chlorophyll a across the mat section was calculated as
A = (R750 � R675) / R750, (2)
where R750 and R675 are the back-reflectance images measured at wavelengths 750 nm (no
absorption by Chl a) and 675 nm (maximum Chl a absorption), respectively. Image analysis
was done with the Look@MOSI software (Polerecky et al. 2009; www.microsen-wiki.net).
DNA Extraction and ARISA
DNA was extracted and purified from the upper 2�3 mm of the studied mats using the
UltraClean soil DNA isolation kit (MO BIO Laboratories, Inc., Carlsbad, CA, USA) according
to the manufacturer’s instructions. PCR reactions (50 μl) were conducted in triplicates and
contained 1×PCR buffer (Promega, Madison, WI, USA), 2.5 mM MgCl2 (Promega), 0.25 mM
of 40 mM dNTP mix (Promega), bovine serum albumin (3 μg/μl, final concentration), 25 ng
extracted DNA, 400 nM each of universal primer ITSF (5´-GTCGTAACAAGGTAGCCGTA-
3´) and eubacterial ITSReub (5´-GCCAAGGCATCCACC-3´; Cardinale et al. 2004) labeled
with the phosphoramidite dye HEX, and 0.05 units GoTaq polymerase (Promega). All the
subsequent steps, including PCR protocol, purity of the PCR products, labeling of the products,
discrimination of the PCR-amplified fragments via capillary electrophoresis (ABI PRISM
3130xl Genetic Analyzer, Applied Biosystems) and the subsequent statistical analysis of
ARISA profiles were done as previously described (Boer et al. 2009; Ramette 2009).
113
M. Al-Najjar Flow of light energy in microbial mats
Results
Overall, the data presented here were obtained from 13 samples of cyanobacterial mats from
Abu-Dhabi, 8 mats from Australia, 2 (hyper-spectral and PAM imaging data) and 5 (ARISA
profiles) from Spain and 3 from Brazil.
All mats exhibited pronounced vertical stratification, with a characteristic dark-green
layer of variable thickness at or close to the mat surface (see direct images in Fig. 2). This
distinct appearance was due to cyanobacteria, as indicated by the presence of pronounced
absorption at the wavelengths of maximal absorption by chlorophyll a (675 nm) and
phycocyanin (625 nm) detected by hyperspectral imaging (data not shown). In AD and AUS
mats the dark-green layer was followed underneath by a brown layer and a red layer, and the
deepest layer was black, presumably due to FeS precipitates. Additionally, the AD mats were
covered by a thin orange gelatinous layer. The BR mats showed a different layering pattern:
they were made of two main layers, the upper dark-green layer (~1 mm thick) followed by a
thicker dark pink gelatinous layer. The SP mats had similar structure as the AD mats, except
the distinct layers were thicker and the surface gelatinous layer was white and light brown.
Spatial heterogeneity in physiological parameters
Absorbance images derived from hyperspectral imaging showed a high degree of horizontal as
well as vertical variability, indicating pronounced microscale heterogeneity in the Chl a
distribution within the mats (Fig. 2). The absorbance averaged within the dark-green
cyanobacterial layer varied in the range of 0.5�0.9 (Fig. 3), and the variability was significant
with respect to the geographical origin of the mats (ANOVA, p=0.0003). The lowest
absorbances were in the SP mats (average 57 � 3 %), while they were similar in the AD, AUS
and BR mats (averages ranging between 77�81 %). Furthermore, the absorbances varied
114
Chapter 4 Spatial Distribution of Photosynthetic Efficiency
significantly less across the dark-green cyanobacterial layer in the AD mats (average std 5.2 �
0.3 %) than in the other mats (average std 7�9 %), suggesting a less patchy distribution of the
cyanobacterial populations in the AD mats.
The maximum quantum yield of photosynthesis Ymax and the light acclimation intensity
E1/2 also exhibited pronounced horizontal and vertical variability (Fig. 2). Highest Ymax values
were typically present at the top of the green cyanobacterial layer and decreased with variable
gradients with depth. In the BR mats the decrease in Ymax was additionally followed by an
increase to similar values as at the surface. Ymax values averaged over the dark-green
cyanobacterial layer varied significantly with respect to the geographical origin of the mats
(ANOVA, p<10-6). The AD and SP mats had on average the lowest Ymax values (0.13�0.16),
while Ymax in the AUS (0.25 � 0.01) and BR (0.30 � 0.01) were significantly higher (Fig. 3).
No correlation was found between the absorbance and maximum quantum yield values
averaged over the dark-green layers when tested for mats from a specific location or for all
mats.
The light acclimation intensity E1/2 was significantly correlated with the maximum
quantum yield within the dark-green cyanobacterial layer of any given mat (Fig. 2). The
generally higher values of E1/2 observed at the top of the cyanobacterial layer indicated that the
cyanobacteria there are adapted to the higher light intensities, in agreement with the expectation
based on a typical profile of scalar irradiance in mats, which decreases approximately
exponentially with depth (see Chapters 2 & 3). The E1/2 values averaged over the
cyanobacterial layer varied significantly among the mats from different locations (ANOVA,
p<10-3), with the AUS mat having the highest (170 � 10 �mol photon m-2 s-1) and SP mats
having the lowest (50 � 17 �mol photon m-2 s-1) average values (Figs. 2 and 3). The averages of
115
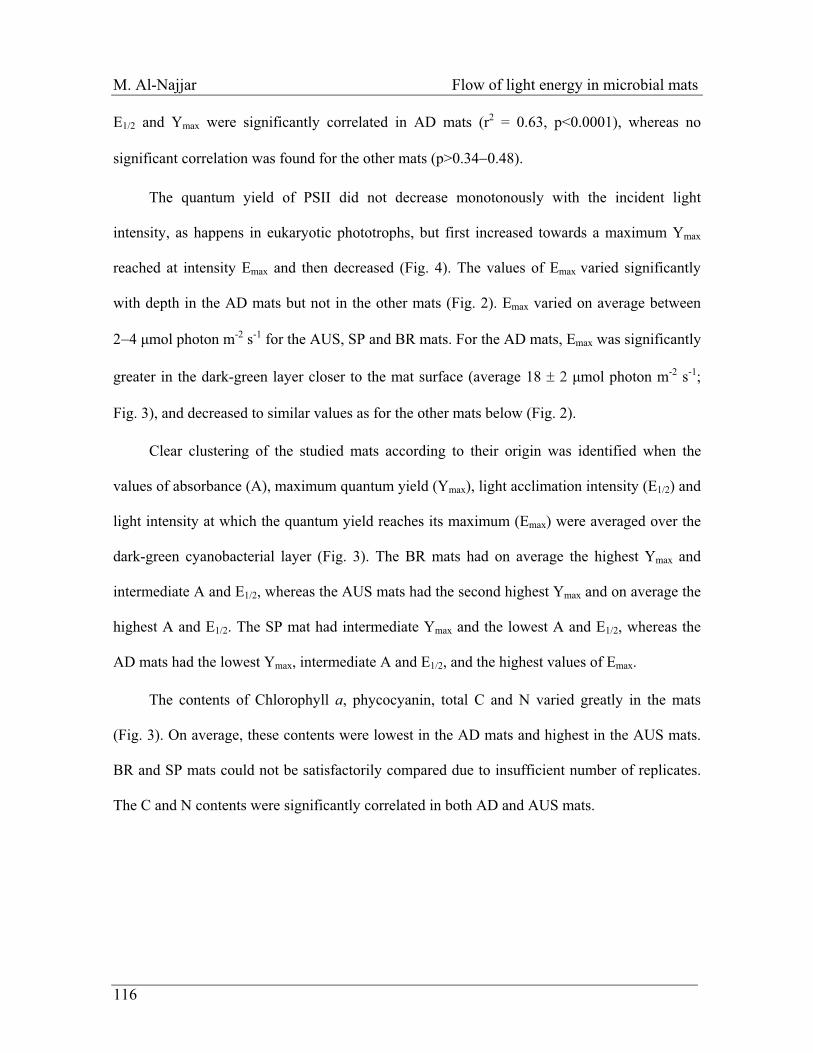
M. Al-Najjar Flow of light energy in microbial mats
116
E1/2 and Ymax were significantly correlated in AD mats (r2 = 0.63, p<0.0001), whereas no
significant correlation was found for the other mats (p>0.34�0.48).
The quantum yield of PSII did not decrease monotonously with the incident light
intensity, as happens in eukaryotic phototrophs, but first increased towards a maximum Ymax
reached at intensity Emax and then decreased (Fig. 4). The values of Emax varied significantly
with depth in the AD mats but not in the other mats (Fig. 2). Emax varied on average between
2�4 �mol photon m-2 s-1 for the AUS, SP and BR mats. For the AD mats, Emax was significantly
greater in the dark-green layer closer to the mat surface (average 18 � 2 �mol photon m-2 s-1;
Fig. 3), and decreased to similar values as for the other mats below (Fig. 2).
Clear clustering of the studied mats according to their origin was identified when the
values of absorbance (A), maximum quantum yield (Ymax), light acclimation intensity (E1/2) and
light intensity at which the quantum yield reaches its maximum (Emax) were averaged over the
dark-green cyanobacterial layer (Fig. 3). The BR mats had on average the highest Ymax and
intermediate A and E1/2, whereas the AUS mats had the second highest Ymax and on average the
highest A and E1/2. The SP mat had intermediate Ymax and the lowest A and E1/2, whereas the
AD mats had the lowest Ymax, intermediate A and E1/2, and the highest values of Emax.
The contents of Chlorophyll a, phycocyanin, total C and N varied greatly in the mats
(Fig. 3). On average, these contents were lowest in the AD mats and highest in the AUS mats.
BR and SP mats could not be satisfactorily compared due to insufficient number of replicates.
The C and N contents were significantly correlated in both AD and AUS mats.
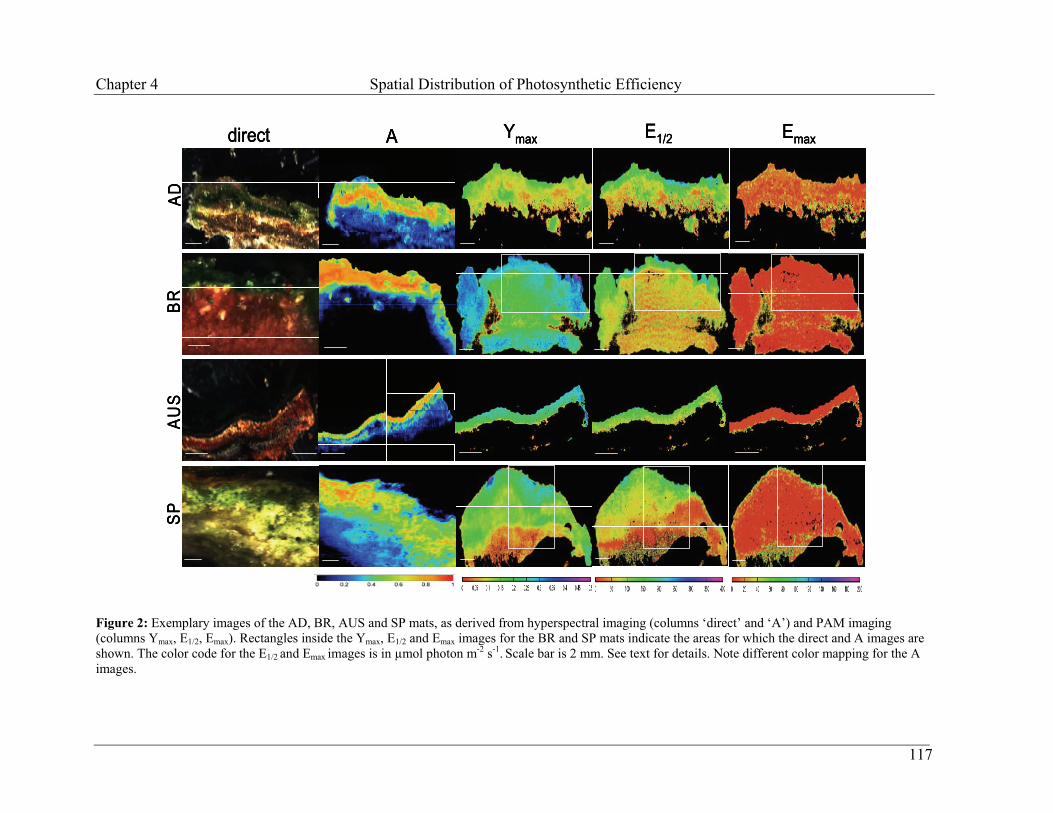
Chapter 4 Spatial Distribution of Photosynthetic Efficiency
direct A Ymax E1/2
AU
SS
P
Emax
AD
BR
direct A Ymax E1/2
AU
SS
P
Emax
AD
BR
direct A Ymax E1/2
AU
SS
P
Emax
AD
BR
Figure 2: Exemplary images of the AD, BR, AUS and SP mats, as derived from hyperspectral imaging (columns ‘direct’ and ‘A’) and PAM imaging (columns Ymax, E1/2, Emax). Rectangles inside the Ymax, E1/2 and Emax images for the BR and SP mats indicate the areas for which the direct and A images are shown. The color code for the E1/2 and Emax images is in μmol photon m-2 s-1. Scale bar is 2 mm. See text for details. Note different color mapping for the A images.
117
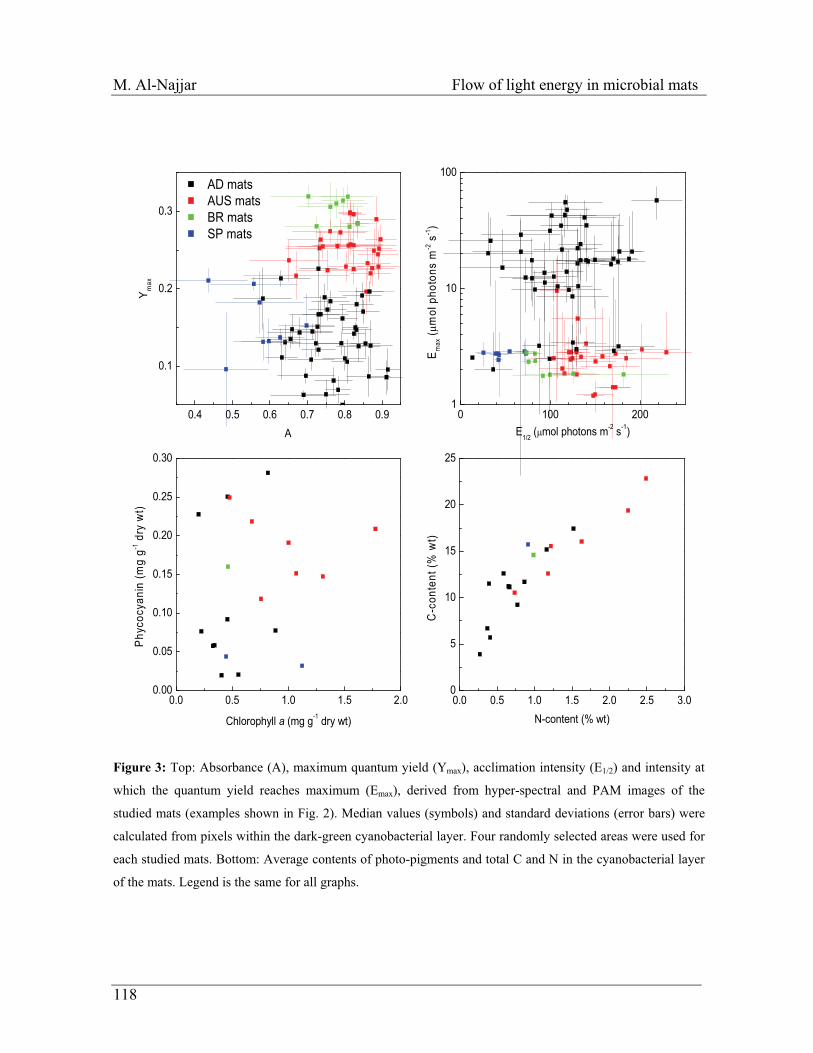
M. Al-Najjar Flow of light energy in microbial mats
0 100 2001
10
100
E max
(�m
ol p
hoto
ns m
-2 s
-1)
E1/2 (�mol photons m-2 s-1)0.4 0.5 0.6 0.7 0.8 0.9
0.1
0.2
0.3
AD mats AUS mats BR mats SP mats
Y max
A
0.0 0.5 1.0 1.5 2.00.00
0.05
0.10
0.15
0.20
0.25
0.30
Phyc
ocya
nin
(mg
g-1 d
ry w
t)
Chlorophyll a (mg g-1 dry wt)
0.0 0.5 1.0 1.5 2.0 2.5 3.00
5
10
15
20
25
C-c
onte
nt (%
wt)
N-content (% wt)
Figure 3: Top: Absorbance (A), maximum quantum yield (Ymax), acclimation intensity (E1/2) and intensity at
which the quantum yield reaches maximum (Emax), derived from hyper-spectral and PAM images of the
studied mats (examples shown in Fig. 2). Median values (symbols) and standard deviations (error bars) were
calculated from pixels within the dark-green cyanobacterial layer. Four randomly selected areas were used for
each studied mats. Bottom: Average contents of photo-pigments and total C and N in the cyanobacterial layer
of the mats. Legend is the same for all graphs.
118
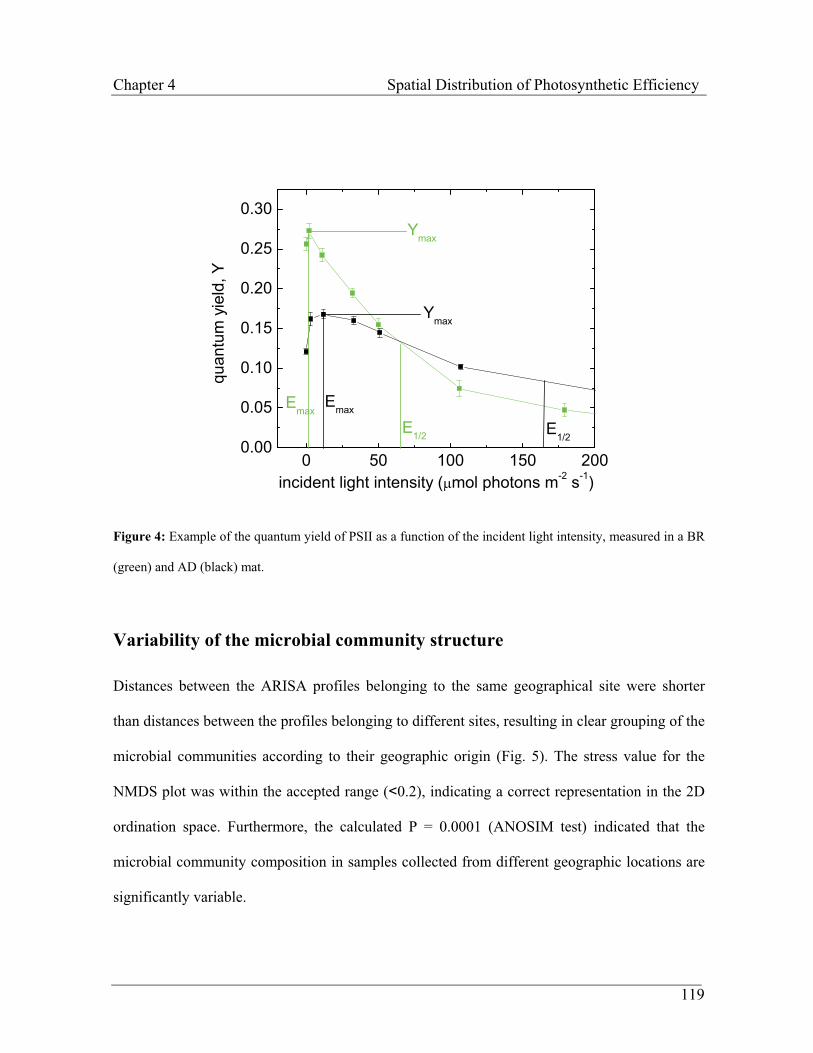
Chapter 4 Spatial Distribution of Photosynthetic Efficiency
0 50 100 150 2000.00
0.05
0.10
0.15
0.20
0.25
0.30
E1/2E1/2
EmaxEmax
Ymax
Ymax
quan
tum
yie
ld, Y
incident light intensity (�mol photons m-2 s-1)
Figure 4: Example of the quantum yield of PSII as a function of the incident light intensity, measured in a BR
(green) and AD (black) mat.
Variability of the microbial community structure
Distances between the ARISA profiles belonging to the same geographical site were shorter
than distances between the profiles belonging to different sites, resulting in clear grouping of the
microbial communities according to their geographic origin (Fig. 5). The stress value for the
NMDS plot was within the accepted range (<0.2), indicating a correct representation in the 2D
ordination space. Furthermore, the calculated P = 0.0001 (ANOSIM test) indicated that the
microbial community composition in samples collected from different geographic locations are
significantly variable.
119
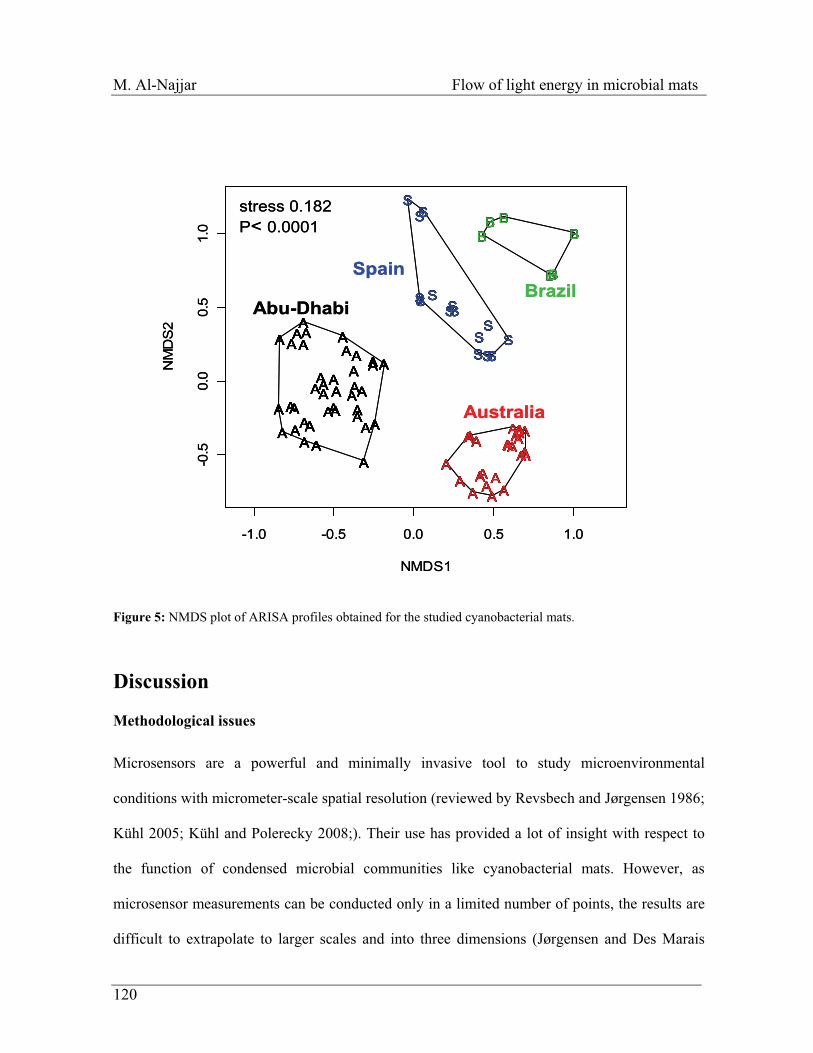
M. Al-Najjar Flow of light energy in microbial mats
120
-1.0 -0.5 0.0 0.5 1.0
-0.5
0.0
0.5
1.0
NMDS1
NM
DS
2
AA AAAA
A AA
AAA
AAAAAA
A
AA
AA
A
AA A
AAAAA
A
AA AAAA
BBB B
BB
AA A
AAA
AA AA
AA
AAAAAAAA A
AAA
SSS
SSS
SSS
SS
S
SS
SAA AAAA
A AA
AAA
AAAAAA
A
AA
AA
A
AA A
AAAAA
A
AA AAAA
BBB B
BB
AA A
AAA
AA AA
AA
AAAAAAAA A
AAA
SSS
SSS
SSS
SS
S
SS
SAA AAAA
A AA
AAA
AAAAAA
A
AA
AA
A
AA A
AAAAA
A
AA AAAA
BBB B
BB
AA A
AAA
AA AA
AA
AAAAAAAA A
AAA
SSS
SSS
SSS
SS
S
SS
SAA AAAA
A AA
AAA
AAAAAA
A
AA
AA
A
AA A
AAAAA
A
AA AAAA
BBB B
BB
AA A
AAA
AA AA
AA
AAAAAAAA A
AAA
SSS
SSS
SSS
SS
S
SS
S
BrazilSpain
Abu-Dhabi
stress 0.182P< 0.0001
Australia
Figure 5: NMDS plot of ARISA profiles obtained for the studied cyanobacterial mats.
Discussion
Methodological issues
Microsensors are a powerful and minimally invasive tool to study microenvironmental
conditions with micrometer-scale spatial resolution (reviewed by Revsbech and Jørgensen 1986;
Kühl 2005; Kühl and Polerecky 2008;). Their use has provided a lot of insight with respect to
the function of condensed microbial communities like cyanobacterial mats. However, as
microsensor measurements can be conducted only in a limited number of points, the results are
difficult to extrapolate to larger scales and into three dimensions (Jørgensen and Des Marais
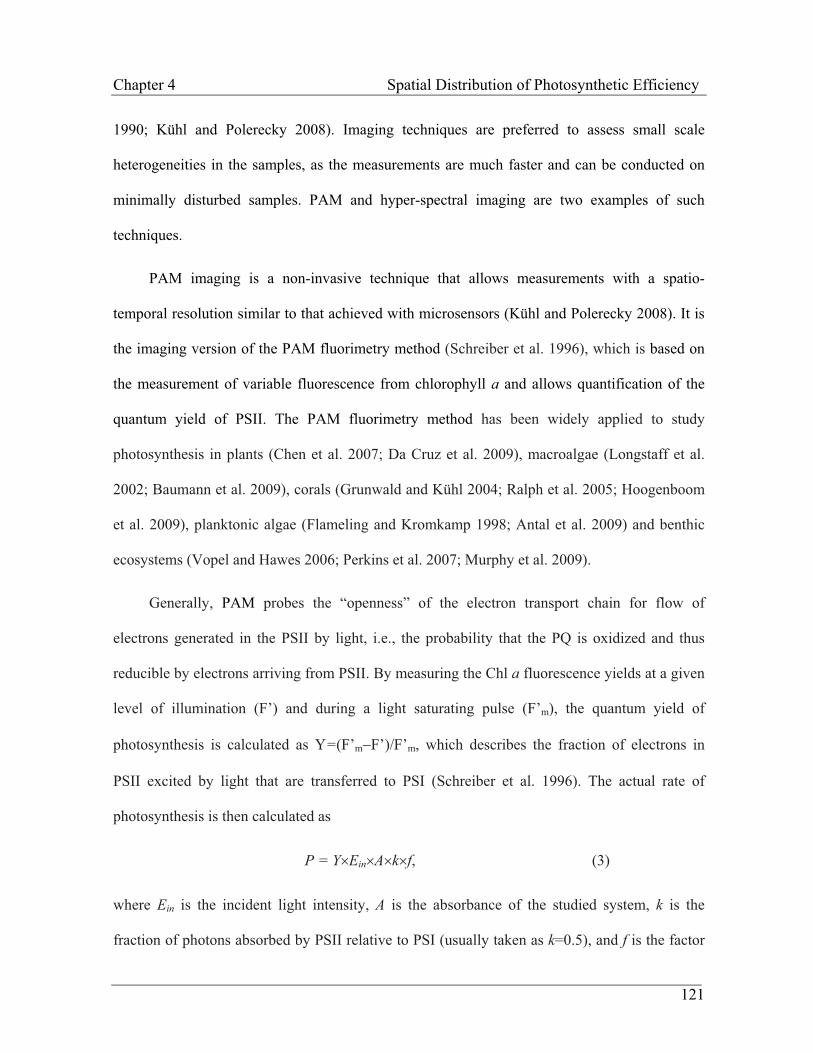
Chapter 4 Spatial Distribution of Photosynthetic Efficiency
1990; Kühl and Polerecky 2008). Imaging techniques are preferred to assess small scale
heterogeneities in the samples, as the measurements are much faster and can be conducted on
minimally disturbed samples. PAM and hyper-spectral imaging are two examples of such
techniques.
PAM imaging is a non-invasive technique that allows measurements with a spatio-
temporal resolution similar to that achieved with microsensors (Kühl and Polerecky 2008). It is
the imaging version of the PAM fluorimetry method (Schreiber et al. 1996), which is based on
the measurement of variable fluorescence from chlorophyll a and allows quantification of the
quantum yield of PSII. The PAM fluorimetry method has been widely applied to study
photosynthesis in plants (Chen et al. 2007; Da Cruz et al. 2009), macroalgae (Longstaff et al.
2002; Baumann et al. 2009), corals (Grunwald and Kühl 2004; Ralph et al. 2005; Hoogenboom
et al. 2009), planktonic algae (Flameling and Kromkamp 1998; Antal et al. 2009) and benthic
ecosystems (Vopel and Hawes 2006; Perkins et al. 2007; Murphy et al. 2009).
Generally, PAM probes the “openness” of the electron transport chain for flow of
electrons generated in the PSII by light, i.e., the probability that the PQ is oxidized and thus
reducible by electrons arriving from PSII. By measuring the Chl a fluorescence yields at a given
level of illumination (F’) and during a light saturating pulse (F’m), the quantum yield of
photosynthesis is calculated as Y=(F’m�F’)/F’m, which describes the fraction of electrons in
PSII excited by light that are transferred to PSI (Schreiber et al. 1996). The actual rate of
photosynthesis is then calculated as
P = Y�Ein�A�k�f, (3)
where Ein is the incident light intensity, A is the absorbance of the studied system, k is the
fraction of photons absorbed by PSII relative to PSI (usually taken as k=0.5), and f is the factor
121
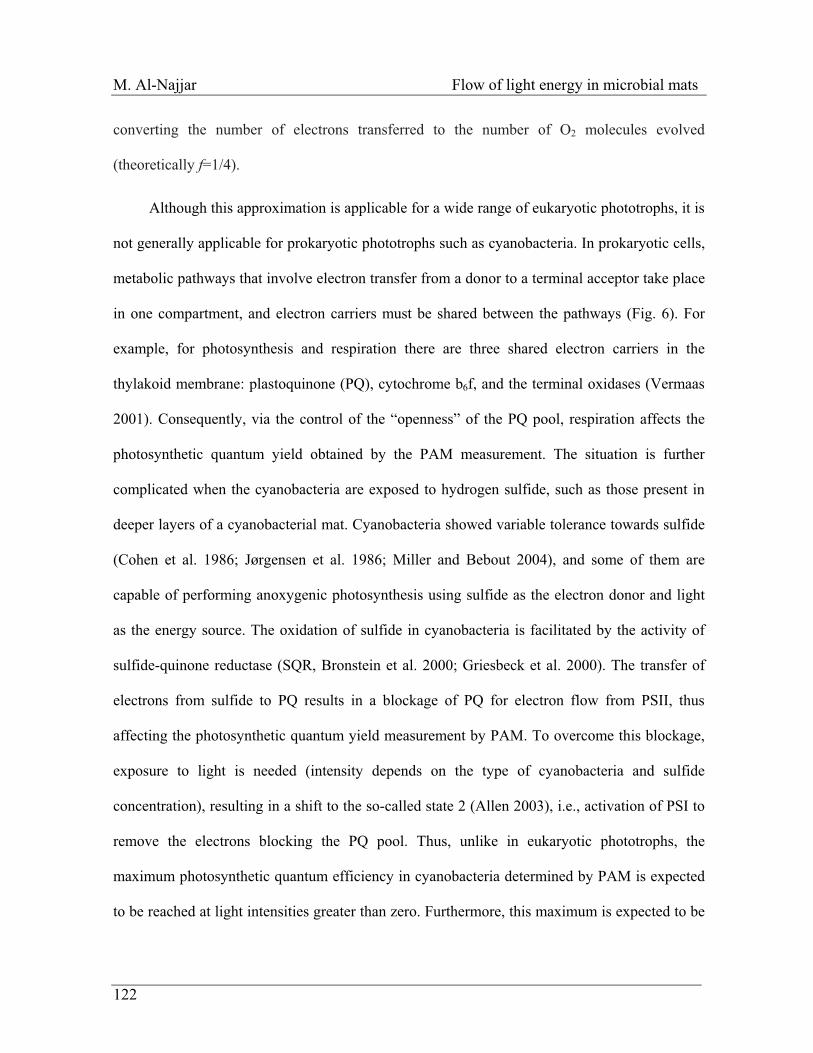
M. Al-Najjar Flow of light energy in microbial mats
converting the number of electrons transferred to the number of O2 molecules evolved
(theoretically f=1/4).
Although this approximation is applicable for a wide range of eukaryotic phototrophs, it is
not generally applicable for prokaryotic phototrophs such as cyanobacteria. In prokaryotic cells,
metabolic pathways that involve electron transfer from a donor to a terminal acceptor take place
in one compartment, and electron carriers must be shared between the pathways (Fig. 6). For
example, for photosynthesis and respiration there are three shared electron carriers in the
thylakoid membrane: plastoquinone (PQ), cytochrome b6f, and the terminal oxidases (Vermaas
2001). Consequently, via the control of the “openness” of the PQ pool, respiration affects the
photosynthetic quantum yield obtained by the PAM measurement. The situation is further
complicated when the cyanobacteria are exposed to hydrogen sulfide, such as those present in
deeper layers of a cyanobacterial mat. Cyanobacteria showed variable tolerance towards sulfide
(Cohen et al. 1986; Jørgensen et al. 1986; Miller and Bebout 2004), and some of them are
capable of performing anoxygenic photosynthesis using sulfide as the electron donor and light
as the energy source. The oxidation of sulfide in cyanobacteria is facilitated by the activity of
sulfide-quinone reductase (SQR, Bronstein et al. 2000; Griesbeck et al. 2000). The transfer of
electrons from sulfide to PQ results in a blockage of PQ for electron flow from PSII, thus
affecting the photosynthetic quantum yield measurement by PAM. To overcome this blockage,
exposure to light is needed (intensity depends on the type of cyanobacteria and sulfide
concentration), resulting in a shift to the so-called state 2 (Allen 2003), i.e., activation of PSI to
remove the electrons blocking the PQ pool. Thus, unlike in eukaryotic phototrophs, the
maximum photosynthetic quantum efficiency in cyanobacteria determined by PAM is expected
to be reached at light intensities greater than zero. Furthermore, this maximum is expected to be
122
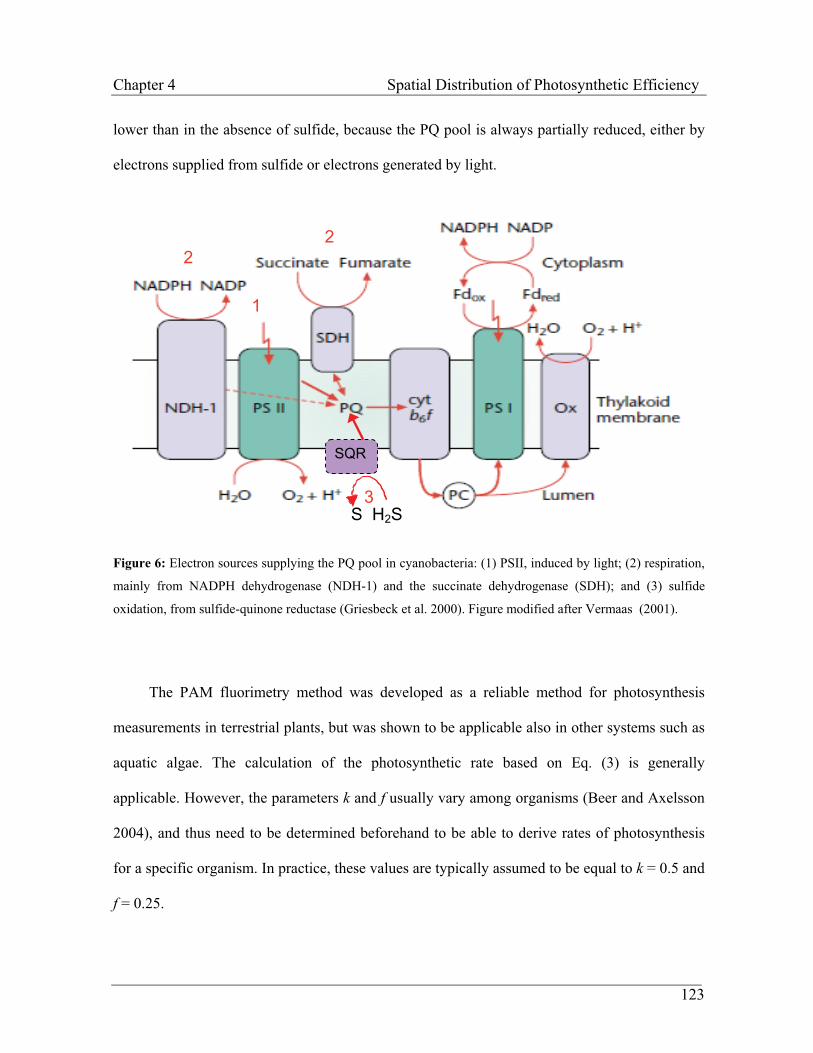
Chapter 4 Spatial Distribution of Photosynthetic Efficiency
lower than in the absence of sulfide, because the PQ pool is always partially reduced, either by
electrons supplied from sulfide or electrons generated by light.
22
1
SQR
3S H2S
Figure 6: Electron sources supplying the PQ pool in cyanobacteria: (1) PSII, induced by light; (2) respiration,
mainly from NADPH dehydrogenase (NDH-1) and the succinate dehydrogenase (SDH); and (3) sulfide
oxidation, from sulfide-quinone reductase (Griesbeck et al. 2000). Figure modified after Vermaas (2001).
The PAM fluorimetry method was developed as a reliable method for photosynthesis
measurements in terrestrial plants, but was shown to be applicable also in other systems such as
aquatic algae. The calculation of the photosynthetic rate based on Eq. (3) is generally
applicable. However, the parameters k and f usually vary among organisms (Beer and Axelsson
2004), and thus need to be determined beforehand to be able to derive rates of photosynthesis
for a specific organism. In practice, these values are typically assumed to be equal to k = 0.5 and
f = 0.25.
123
M. Al-Najjar Flow of light energy in microbial mats
An additional parameter that determines the rate of photosynthesis calculated from the
PAM measurement is the absorbance. This value is usually calculated from Eq. (2). However,
this calculation is based on the assumption that absorption in the near infrared region (e.g., at
wavelength 750 nm) is affected only by the abiotic matrix in which the chlorophyll a is
embedded (e.g., sediment). This assumption is incorrect in microbial mats if the phototrophic
organisms absorbing in the near infrared range (e.g., cyanobacteria with Chl d; Kühl et al. 2005;
Kühl and Polerecky 2008), Chloroflexus-like bacteria with Bchl c; Bachar et al. 2008) are co-
localized with the cyanobacteria. In such case A calculated from Eq. (2) cannot be used as a
reliable estimate of light energy absorbed by the Chl a in cyanobacteria.
Last but not least, it is important to realize that even if the parameters Y, A, k and f were
accurately determined in every pixel of the vertical cross section of the mat, Eq. 3 could still not
be used to directly calculate the rate of photosynthesis. This is because of the additional
dependence on the of incident irradiance intensity Ein. It is well documented that availability of
light varies strongly with depth in the mat (see, e.g., Chapters 2 and 3). However, this was not
determined in this study.
Because of these drawbacks of the PAM and hyper-spectral imaging techniques, we
refrained from comparing the rates of photosynthesis calculated with Eq. 3 within the mats as
well as among the mats. Instead, we used the parameters that characterize the potential for
photosynthesis � the quantum yield of PSII and the absorbance of chlorophyll a � to compare
the different mats, as this comparison is not biased by assumptions about the parameters k and f
in Eq. 3.
124
Chapter 4 Spatial Distribution of Photosynthetic Efficiency
Small scale variability
The maximum quantum yield of PSII was highly heterogeneous on a sub-millimeter scale both
in the vertical and horizontal directions, and this variability was similar when compared within
the mat and between the mats from the same location. As this parameter was derived from the
measurements of Chl a fluorescence, factors that affect the fluorescence signal will also
influence the calculated yield. One possible factor is the presence of chlorophyll a that is not
part of a functional PSII, such as in dead cyanobacterial cells. Another factor is the presence of
degradation products of chlorophyll a or any other components of the mat that have similar
auto-fluorescence as chlorophyll a. Since in both cases the fluorescence is detectable but not
variable, the calculated quantum yield will be lower than that calculated from fluorescence that
originates entirely from chlorophyll a that is part of a functional PSII. Thus, the observed
decrease in Ymax with depth could be an artifact associated with a proportionally lower
concentrations of “active” Chl a in the total Chl a pool.
Another possible explanation of the observed small-scale variability in the maximum
quantum yield could be the exposure to sulfide (see above). It is well documented that sulfide
concentrations rapidly increase with depth in microbial mats (Kühl et al. 1996; Wieland and
Kühl 2000; Jonkers et al. 2003; Garcia de Lomas 2005). Using PAM, (Miller and Bebout 2004)
detected approximately 50-fold variation in PSII performance in response to different sulfide
concentrations in cyanobacteria originating from sulfidic habitats. Thus, the generally observed
decrease in Ymax with depth could be due to increasing sulfide concentrations in deeper mat
layers. Similar trends were observed in other cyanobacterial systems (e.g., stromatolites),
specifically due to anaerobic conditions and absence of light after burial events (Kromkamp et
al. 2007). In our experiments, the mat sections were pre-incubated in the light and in aerated
125
M. Al-Najjar Flow of light energy in microbial mats
seawater prior to the PAM measurements, which should remove sulfide from the cyanobacterial
layers probed by the PAM. However, since sulfide was not simultaneously measured, its effect
on the observed heterogeneities in Ymax cannot be proven nor ruled out.
The light adaptation of the cyanobacteria was also highly heterogeneous within the mats.
The acclimation intensity E1/2, which characterizes this adaptation and was derived from the
PAM measurements, generally decreased with depth in the same manner as the maximum
quantum yield. This decrease possibly reflected specific adaptations of the cyanobacteria to the
light available during growth, e.g., by adjusting chlorophyll-specific absorption cross section
(Dubinsky and Stambler 2009) or by changing the numbers of reaction centers and electron
transport components (Falkowski and Raven 1997).
Large scale variability
ARISA profiles showed that although the microbial communities in the studied mats
significantly varied with location, the communities originating from the same geographical
location were more similar to each other than those originating from geographically distant
locations (Fig. 5). Similar clustering of the mats was identified based on the physiological
characteristics averaged over the cyanobacterial layer (Fig. 3, top row). Although this clustering
was less distinct due to large variability of the samples within each site, it was still significant.
This similarity suggests that there is a factor (or several factors) that affects the microbial
community so strongly that significant differences between this factor(s) result in communities
with significantly different structure and function. We expect that this factor is associated with
the environmental conditions of the sampling locations. In this study, only temperature and
salinity were determined, but their variability among the sampling locations does not seem to
explain the variability in the microbial communities (data not shown). Additional parameters
126
Chapter 4 Spatial Distribution of Photosynthetic Efficiency
that are expected to play a significant role include the availability of nutrients (e.g., phosphate or
nitrate), light intensity, sedimentation rate, or duration of submersion relative to exposure to air;
however, these were not determined in this study.
The variability in the physiological parameters characterizing the mats within the site was
comparable to the variability between the sites, whereas the microbial community structures
within the site were much more similar than when compared between the sites. This is
demonstrated by a much more distinct clustering in the ARISA plots (Fig. 5) compared to the
clustering in plots of physiological parameters (Fig. 3), and suggests that the possible
environmental factors mentioned above affect the function of the microbial community to a
greater extent than its structure.
In conclusion, this study shows that structure and function of cyanobacterial mats is
highly variable and this variability increases with scale at which it is measured. Significant
variabilities observed on a sub-millimetre scale within a sample are lower than those observed
between samples from the same site, and all of them are exceeded by variabilities associated
with the geographical origin of the mats. It should be noted, however, that location as such,
characterized by spatial co-ordinates such as latitude, longitude and depth in the mat, should not
be considered as the cause of variability. Instead, environmental conditions that co-vary with
location must be considered as the true cause. Understanding of how functional and structural
variability scales with space may provide vital clues for the identification of the most relevant
environmental parameters that influence the system. For such study, microscale measurements
of sulfide, oxygen, redox potential and light would likely help understanding the microscale
variation in the quantum yield of PSII and light adaptation of the cyanobacteria, whereas data on
127
M. Al-Najjar Flow of light energy in microbial mats
nutrients, incident light intensity, sedimentation rate or duration of submersion would help
understanding the within-site and between-site variabilities.
Acknowledgements
We thank Dr Patrick Meister and Dr Susanne Borgwardt for providing samples of the mats
collected from Brazil and Spain. This work was financially supported by the Max-Planck
Society, the Yusef Jameel Scholarship and the Danish Natural Science Research Council.
Authors Contribution
M. A-N, M. K. & L. P. designed the project. M. A-N & L. P. conducted the measurements. L. P.
wrote the programs to process the images. M. A-N & L. P. did the calculations. W. H. & M. A-
N collected the AD samples and W. H. measured the elemental composition for the AD mats. A.
R. and L. P. did the statistical analysis. M. A-N wrote the manuscript with input from L. P., A.
R. and D. B.
References
Allen, J.F., 2003. State transitions - a question of balance. Science 299, 1530-1532.
Antal, T.K., Matorin, D.N., Ilyash, L.V., Volgusheva, A.A., Osipov, V., Konyuhov, I.V., Krendeleva, T.E., Rubin, A.B., 2009. Probing of photosynthetic reactions in four phytoplanktonic algae with a PEA fluorometer. Photosynthesis Research 102, 67-76.
Bachar, A., Polerecky, L., Fischer, J.P., Vamvakopoulos, K., de Beer, D., Jonkers, H.M., 2008. Two-dimensional mapping of photopigment distribution and activity of Chloroflexus-like bacteria in a hypersaline microbial mat. Fems Microbiology Ecology 65, 434-448.
Baumann, H.A., Morrison, L., Stengel, D.B., 2009. Metal accumulation and toxicity measured by PAM-Chlorophyll fluorescence in seven species of marine macroalgae. Ecotoxicology and Environmental Safety 72, 1063-1075.
128
Chapter 4 Spatial Distribution of Photosynthetic Efficiency
Beer, S., Axelsson, L., 2004. Limitations in the use of PAM fluorometry for measuring photosynthetic rates of macroalgae at high irradiances. European Journal of Phycology 39, 1-7.
Boer, S.I., Hedtkamp, S.I.C., van Beusekom, J.E.E., Fuhrman, J.A., Boetius, A., Ramette, A., 2009. Time- and sediment depth-related variations in bacterial diversity and community structure in subtidal sands. The ISME Journal 3, 780-791.
Bronstein, M., Schutz, M., Hauska, G., Padan, E., Shahak, Y., 2000. Cyanobacterial sulfide-quinone reductase: Cloning and heterologous expression. Journal of Bacteriology 182, 3336-3344.
Cardinale, M., Brusetti, L., Quatrini, P., Borin, S., Puglia, A.M., Rizzi, A., Zanardini, E., Sorlini, C., Corselli, C., Daffonchio, D., 2004. Comparison of different primer sets for use in automated ribosomal intergenic spacer analysis of complex bacterial communities. Applied and Environmental Microbiology 70, 6147-6156.
Chen, H., Cowan, M.J., Hasday, J.D., Vogel, S.N., Medvedev, A.E., 2007. Tobacco smoking inhibits expression of proinflammatory Cytokines and activation of IL-1R-Associated kinase, p38, and NF-kappa B in alveolar macrophages stimulated with TLR2 and TLR4 Agonists. Journal of Immunology 179, 6097-6106.
Cohen, Y., Jørgensen, B.B., Revsbech, N.P., Poplawski, R., 1986. Adaptation to hydrogen-sulfide of oxygenic and anoxygenic photosynthesis among Cyanobacteria. Applied and Environmental Microbiology 51, 398-407.
Da Cruz, M.D.M., De Siqueira, D.L., Salomao, L.C.C., Cecon, P.R., 2009. Chlorophyll a fluorescence in leaves of 'Ponkan' mandarin and the 'Tahiti' acid lime submitted to water stress. Revista Brasileira De Fruticultura 31, 896-901.
Dubinsky, Z., Stambler, N., 2009. Photoacclimation processes in phytoplankton: mechanisms, consequences, and applications. Aquatic Microbial Ecology 56, 163-176.
Falkowski, P.G., Raven, J.A., 1997. Aquatic photosynthesis. Blackwell Science, Capital City Press, Washington, DC.
Flameling, I.A., Kromkamp, J., 1998. Light dependence of quantum yields for PSII charge separation and oxygen evolution in eucaryotic algae. Limnology and Oceanography 43, 284-297.
Garcia de Lomas, J., Corzo, A., Garcia, C.M., and van Bergeijk, S.A, 2005. Microbenthos in a hypersaline tidal lagoon: factors affecting microhabitat, community structure and mass exchange at the sediemnt-water interface. Aquatic Microbial Ecology, 53-69.
129
M. Al-Najjar Flow of light energy in microbial mats
Griesbeck, C., Hauska, G., Schütz, M., 2000. Biological Sulfide-Oxidation: Sulfide-Quinone Reductase (SQR), the Primary Reaction, In Pandalai, S.G. ed. R.R.D.i. Microbiology, pp. 179-203. Research Signpost, Trivadrum , India.
Grunwald, B., Kühl, M., 2004. A system for imaging variable chlorophyll fluorescence of aquatic phototrophs. Ophelia 58, 79-89.
Hoogenboom, M.O., Connolly, S.R., Anthony, K.R.N., 2009. Effects of photoacclimation on the light niche of corals: a process-based approach. Marine Biology 156, 2493-2503.
Jonkers, H.M., Ludwig, R., De Wit, R., Pringault, O., Muyzer, G., Niemann, H., Finke, N., de Beer, D., 2003. Structural and functional analysis of a microbial mat ecosystem from a unique permanent hypersaline inland lake: 'La Salada de Chiprana' (NE Spain). Fems Microbiology Ecology 44, 175-189.
Jørgensen, B.B., Cohen, Y., Revsbech, N.P., 1986. Transition from anoxygenic to oxygenic photosynthesis in a Microcoleus-chthonoplastes cyanobacterial mat. Applied and Environmental Microbiology 51, 408-417.
Jørgensen, B.B., Des Marais, J.D., 1990. The diffusive boundary layer of sediments: Oxygen microgradients over a microbial mat. Limnology and Oceanography 35, 1343-1355.
Kromkamp, J.C., Perkins, R., Dijkman, N., Consalvey, M., Andres, M., Reid, R.P., 2007. Resistance to burial of cyanobacteria in stromatolites. Aquatic Microbial Ecology 48, 123-130.
Kühl, M., 2005. Optical microsensors for analysis of microbial communities, In Methods in Enzymology. pp. 166-199.
Kühl, M., Chen, M., Ralph, P.J., Schreiber, U., Larkum, A.W.D., 2005. A niche for cyanobacteria containing chlorophyll d. Nature 433, 820-820.
Kühl, M., Glud, R.N., Ploug, H., Ramsing, N.B., 1996. Microenvironmental control of photosynthesis and photosynthesis-coupled respiration in an epilithic cyanobacterial biofilm. Journal of Phycology 32, 799-812.
Kühl, M., Jørgensen, B.B., 1992. Spectral light measurements in microbenthic phototrophic communities with a fiber-optic microprobe coupled to a sensitive diode array detector. Limnology and Oceanography 37, 1813-1823.
Kühl, M., Jørgensen, B.B., 1994. The light-field of microbenthic communities - radiance distribution and microscale optics of sandy coastal sediments. Limnology and Oceanography 39, 1368-1398.
130
Chapter 4 Spatial Distribution of Photosynthetic Efficiency
Kühl, M., Lassen, C., Jørgensen, B.B., 1994. Optical properties of microbial mats: light measurements with fiber-optic microprobes, In Microbial Mats: Structure, Development and Environmental Significance. eds J. Stal, P. Caumette, pp. 149-167. Springer, Berlin.
Kühl, M., Polerecky, L., 2008. Functional and structural imaging of phototrophic microbial communities and symbioses. Aquatic Microbial Ecology 53, 99-118.
Longstaff, B.J., Kildea, T., Runcie, J.W., Cheshire, A., Dennison, W.C., Hurd, C., Kana, T., Raven, J.A., Larkum, A.W.D., 2002. An in situ study of photosynthetic oxygen exchange and electron transport rate in the marine macroalga Ulva lactuca (Chlorophyta). Photosynthesis Research 74, 281-293.
Lovelock, C., Grinham, A., Adame, M.F., H., P., 2009. Elemental composition and productivity of cyanobacterial mats in an arid zone estuary in north Western Australia. Wetlands Ecology and Management.
Miller, S.R., Bebout, B.M., 2004. Variation in sulfide tolerance of photosystem II in phylogenetically diverse cyanobacteria from sulfidic habitates. Applied and Environmental Microbiology 70, 736-744.
Murphy, R.J., Tolhurst, T.J., Chapman, M.G., Underwood, A.J., 2009. Seasonal distribution of chlorophyll on mudflats in New South Wales, Australia measured by field spectrometry and PAM fluorometry. Estuarine Coastal and Shelf Science 84, 108-118.
Perkins, R.G., Kromkamp, J.C., Reid, R.P., 2007. Importance of light and oxygen for photochemical reactivation in photosynthetic stromatolite communities after natural sand burial. Marine Ecology-Progress Series 349, 23-32.
Polerecky, L., Bissett, A., Al-Najjar, M., Faerber, P., Osmers, H., Suci, P.A., Stoodley, P., de Beer, D., 2009. Modular spectral imaging system for discrimination of pigments in cells and microbial communities. Applied and Environmental Microbiology 75, 758-771.
Ralph, P.J., Schreiber, U., Gademann, R., Kühl, M., Larkum, A.W.D., 2005. Coral photobiology studied with a new imaging pulse amplitude modulated fluorometer. Journal of Phycology 41, 335-342.
Ramette, A., 2009. Quantitative Community Fingerprinting Methods for Estimating the Abundance of Operational Taxonomic Units in Natural Microbial Communities. Applied and Environmental Microbiology 75, 2495-2505.
Revsbech, N.P., Jørgensen, B.B., 1986. Microelectrodes - Their use in microbial ecology. Advances in Microbial Ecology 9, 293-352.
Schreiber, U., Gademann, R., Ralph, P.J., Larkum, A.W.D., 1997. Assessment of photosynthetic performance of Prochloron in Lissoclinum patella in hospite by chlorophyll fluorescence measurements. Plant and Cell Physiology 38, 945-951.
131
M. Al-Najjar Flow of light energy in microbial mats
132
Schreiber, U., Kühl, M., Klimant, I., Reising, H., 1996. Measurement of chlorophyll fluorescence within leaves using a modified PAM Fluorometer with a fiber-optic microprobe. Photosynthesis Research 47, 103-109.
Stal, L.J., 2000. Cyanobacterial mats and stromatolites, In The ecology of cyanobacteria. eds A. B. Whitton, M. Potts, pp. 61-120. Kluwer Academic Publishers, Dordrecht, The Netherlands.
vanGemerden, H., 1993. Microbial Mats: a Joint Venture, In Marine Geology. pp. 3-25.
Vasconcelos, C., Warthmann, R., McKenzie, J.A., Visscher, P.T., Bittermann, A.G., van Lith, Y., 2006. Lithifying microbial mats in Lagoa Vermelba, Brazil: Modern Precambrian relics? Sedimentary Geology 185, 175-183.
Vermaas, W.F., 2001. Photosynthesis and Respiration in Cyanobacteria, In Encyclopedia of Life Sciences. John Wiley & Sons, Ltd. Online library
Vopel, K., Hawes, I., 2006. Photosynthetic performance of benthic microbial mats in Lake Hoare, Antarctica. Limnology and Oceanography 51, 1801-1812.
Wieland, A., Kühl, M., 2000. Irradiance and temperature regulation of oxygenic photosynthesis and O-2 consumption in a hypersaline cyanobacterial mat (Solar Lake, Egypt). Marine Biology 137, 71-85.
Chapter 5 Contributed Work
Chapter 5
Contributed Work
5.1 Modular Spectral Imaging System for Discrimination
of Pigments in Cells and Microbial Communities
5.2 Hyper-spectral Imaging of Biofilm Growth Dynamics
�
�
�
�
�
�
�
� 133
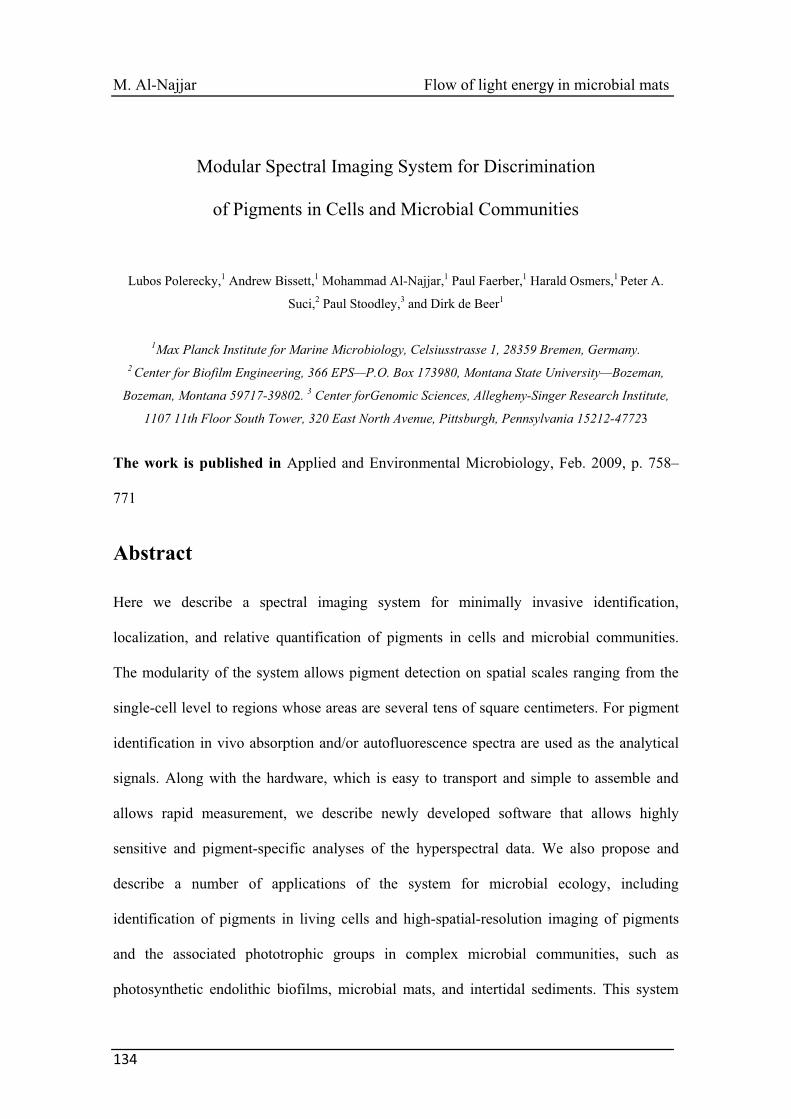
M. Al-Najjar Flow of light energy�in microbial mats������������
Modular Spectral Imaging System for Discrimination
of Pigments in Cells and Microbial Communities
Lubos Polerecky,1 Andrew Bissett,1 Mohammad Al-Najjar,1 Paul Faerber,1 Harald Osmers,1 Peter A.
Suci,2 Paul Stoodley,3 and Dirk de Beer1
1Max Planck Institute for Marine Microbiology, Celsiusstrasse 1, 28359 Bremen, Germany. 2 Center for Biofilm Engineering, 366 EPS—P.O. Box 173980, Montana State University—Bozeman,
Bozeman, Montana 59717-39802. 3 Center forGenomic Sciences, Allegheny-Singer Research Institute,
1107 11th Floor South Tower, 320 East North Avenue, Pittsburgh, Pennsylvania 15212-47723
The work is published in Applied and Environmental Microbiology, Feb. 2009, p. 758–
771
Abstract
Here we describe a spectral imaging system for minimally invasive identification,
localization, and relative quantification of pigments in cells and microbial communities.
The modularity of the system allows pigment detection on spatial scales ranging from the
single-cell level to regions whose areas are several tens of square centimeters. For pigment
identification in vivo absorption and/or autofluorescence spectra are used as the analytical
signals. Along with the hardware, which is easy to transport and simple to assemble and
allows rapid measurement, we describe newly developed software that allows highly
sensitive and pigment-specific analyses of the hyperspectral data. We also propose and
describe a number of applications of the system for microbial ecology, including
identification of pigments in living cells and high-spatial-resolution imaging of pigments
and the associated phototrophic groups in complex microbial communities, such as
photosynthetic endolithic biofilms, microbial mats, and intertidal sediments. This system
�134�

Chapter 5 Contributed Work
provides new possibilities for studying the role of spatial organization of microorganisms in
the ecological functioning of complex benthic microbial communities or for noninvasively
monitoring changes in the spatial organization and/or composition of a microbial
community in response to changing environmental factors.
� 135
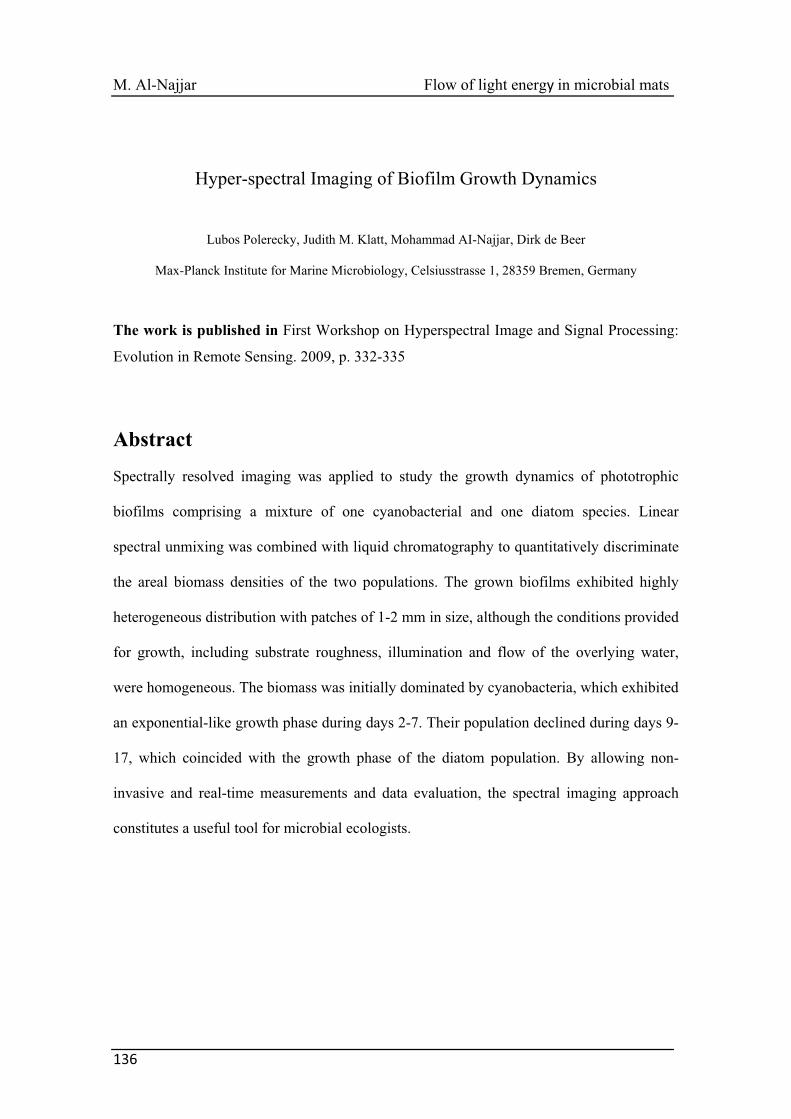
M. Al-Najjar Flow of light energy�in microbial mats������������
�136�
Hyper-spectral Imaging of Biofilm Growth Dynamics
Lubos Polerecky, Judith M. Klatt, Mohammad AI-Najjar, Dirk de Beer
Max-Planck Institute for Marine Microbiology, Celsiusstrasse 1, 28359 Bremen, Germany
The work is published in First Workshop on Hyperspectral Image and Signal Processing:
Evolution in Remote Sensing. 2009, p. 332-335
AbstractSpectrally resolved imaging was applied to study the growth dynamics of phototrophic
biofilms comprising a mixture of one cyanobacterial and one diatom species. Linear
spectral unmixing was combined with liquid chromatography to quantitatively discriminate
the areal biomass densities of the two populations. The grown biofilms exhibited highly
heterogeneous distribution with patches of 1-2 mm in size, although the conditions provided
for growth, including substrate roughness, illumination and flow of the overlying water,
were homogeneous. The biomass was initially dominated by cyanobacteria, which exhibited
an exponential-like growth phase during days 2-7. Their population declined during days 9-
17, which coincided with the growth phase of the diatom population. By allowing non-
invasive and real-time measurements and data evaluation, the spectral imaging approach
constitutes a useful tool for microbial ecologists.
Chapter 6 Concluding Discussion and Summary
Chapter 6
Concluding Discussion and Summary�
�
�
�
�
�
�
�
�
�
�
�
�
�
�
�
� 137
M. Al-Najjar Flow of light energy�in microbial mats������������
6.1 Concluding Discussion
Benthic photosynthetic ecosystems and microbial mats are complex and densely populated
microbial structures, that can be considered complete ecosystems (Karsten 1996). They
harbor a high diversity of phototrophic and heterotrophic populations within the
photosynthetically active (euphotic) zone that is often only a few millimeters thick (van
Gemerden 1993; Stal 2000). These ecosystems are an important component of shallow
water habitats by contributing significantly to primary productivity (Cahoon 1999; Guerrero
et al. 2002). They also stabilize the sediment surface (Staats 1999). As they have high areal
activities and nitrogen fixation potential, they can control the nutrient budgets in shallow
waters. Because of their important role in shallow water ecosystems, many specialized and
integrative studies were conducted on photosynthesis and respiration (Wieland and Kühl
2000; Polerecky et al. 2007), microbial community structure (Nübel et al. 1999; Nübel
2000; Jonkers et al. 2003; Garcia de Lomas 2005), and biogeochemistry (Jonkers et al.
2003; Wieland et al. 2005; Wieland 2008).
Cyanobacteria in microbial mat ecosystems are exposed to extreme variations in light
intensity, temperature (Abed et al. 2006), and salinity (Kohls et al. 2010). Thus, behavioral
and physiological adaptations (e.g., migration and adjustment of rates of photosynthesis and
respiration) are needed to cope with these variations. Cyanobacteria in these ecosystems
possess regulatory mechanisms that enable photopigments to adjust and optimize the
function of the light reactions under diverse conditions. This allows maintaining a high
quantum efficiency of photosynthesis under diverse light quality conditions (Chow et al.
1990). Cyanobacteria decrease photosynthetic rates as response to high temperature, either
because the high temperature affects CO2 fixation rates, and/or the diffusion of CO2/HCO3-
and nutrients across the plasmalemma and/or thylakoid membrane (Abed et al. 2006). They
also, migrate downward to escape the unfavorable conditions, such as, increasing light
�138�
Chapter 6 Concluding Discussion and Summary
intensity and increasing salinity. Other conditions such as radiation hazards (UV; Garcia-
Pichel 2000), oxygen and sulfide concentrations also stimulate motility and other
physiological responses (mainly rates of photosynthesis and respiration, as well as shifting
from oxygenic to anoxygenic photosynthesis for some cyanobacteria) promoting the
allocation of cyanobacteria in the mat to the periods of light and dark periods (Des Marais
2003).
The use of migration by cyanobacteria as a strategy to escape harsh conditions could
be energetically the best option. It could be less expensive than degrading or inactivating
the excess photopigments when light energy is very high, and then re-synthesizing them
when light conditions are suitable again. However, downward migration leads to the deeper
penetration of light in the sediment as the absorbance by photopigments is much less in the
upper layers, thus more energy would be absorbed by components other than the
photosynthetic cells or dissipate as heat. This behavioral adaptation (migration) leads to
reduce the efficiency of the whole ecosystem, but profoundly improves the survival of
cyanobacteria in microbial mats.�All of these strategies show how versatile the adaptations
adopted by cyanobacteria to cope with the extreme environments they live in. This actually
makes studying these ecosystems interesting and at the same time not easy.
The overarching energy budget of these systems has never been determined, mostly
because of the technical difficulties involved. These mat systems have high volumetric
activities and high light attenuation, creating steep gradients of light, chemistry and
physiology. Thus high spatial resolution methods are required to resolve the energy budget
with sufficient precision. Therefore, this thesis was designed to tackle this important
question “the energy budget inside photosynthetic microbial mat ecosystems”. We used a
combination of microsensors for temperature, light, and oxygen, and high resolution
imaging of physiological properties and community structure.
� 139
M. Al-Najjar Flow of light energy�in microbial mats������������
Main Accomplishments
The primary goals of this thesis were to investigate the energy budget in photosynthetic
microbial mats and the controlling factors on the different sinks for light energy. We studied
oxygenic photosynthesis and it was, therefore, important to avoid anoxygenic
photosynthesis by filtering out the infrared (IR) using an infrared cut-off filter. With
microsensors, clear hypotheses, mathematical formalism to calculate the absorbed light
inside the mat, pigment analysis, specialized imaging techniques (Pulse Amplitude Module,
PAM, and hyperspectral imaging), microbial community structure analysis, and statistical
analyses, the goals of this work were successfully reached.
The Balanced Energy Budget inside Microbial Mats
A balanced energy budget must take all possible energy forms to which the light energy
could be transformed into account: reflection, conversion in heat and conservation into
biological energy (see chapter 1, fig 4). Highly precise measurements of temperature
changes required perfectly thermostated conditions. High precision light measurements
were also required; the light distributions in the mats were measured with optical
microfibers. We succeeded indeed to make the budgets almost closed: the sum of
photosynthetically stored energy ( ) and energy dissipated as heat ( ) was only less
than 2% deviating from the total energy absorbed by the microbial mat ( ), sufficiently
accurate to support our hypothesis (see above) and to draw conclusions on the energy flow.
PSJ HJ
Jabs
Only 2-20% of the incident irradiance is reflected from the surfaces of the three
studied microbial mats, the rest was absorbed in the photic zone. Most of the absorbed
energy was dissipated as heat, whereas chemically conserved energy constituted 4.5-16%
(chapter 3, Fig. 3). The highest energy storage efficiency occurred under light limiting
conditions, and the efficiency decreased with increasing light intensity. Thus, the efficiency
is generally increasing with depth, as light gets attenuated. The different biological
�140�
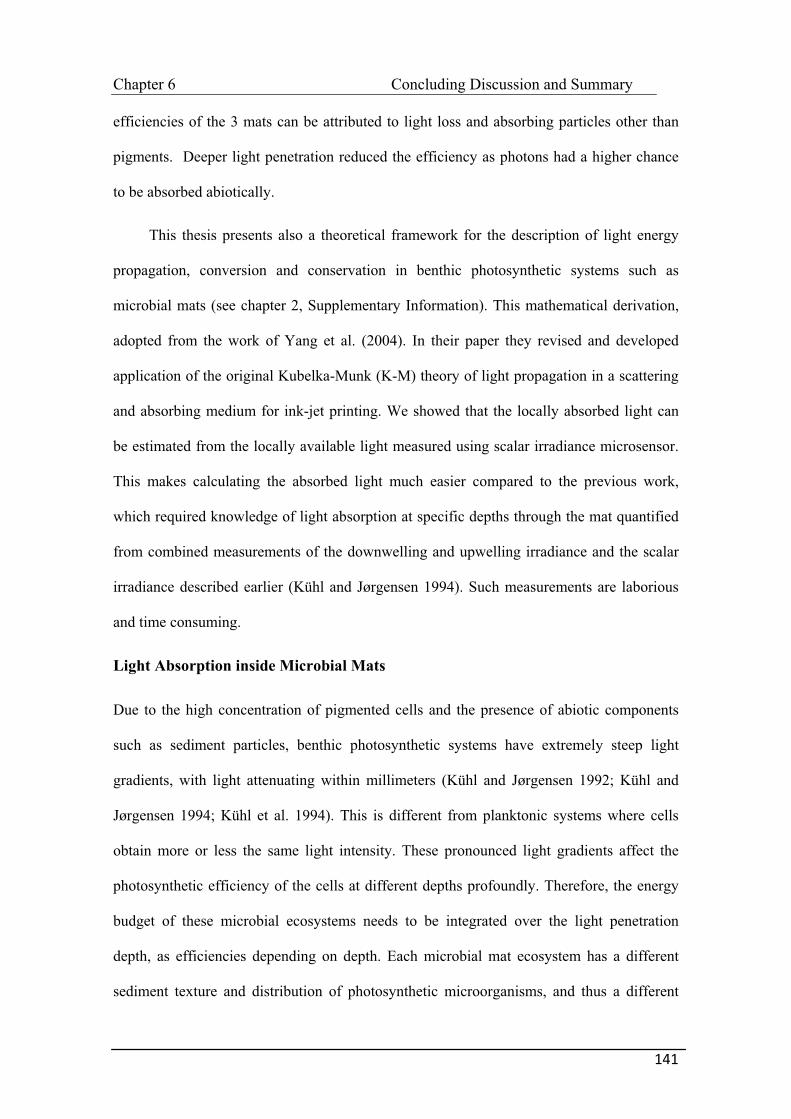
Chapter 6 Concluding Discussion and Summary
efficiencies of the 3 mats can be attributed to light loss and absorbing particles other than
pigments. Deeper light penetration reduced the efficiency as photons had a higher chance
to be absorbed abiotically.
This thesis presents also a theoretical framework for the description of light energy
propagation, conversion and conservation in benthic photosynthetic systems such as
microbial mats (see chapter 2, Supplementary Information). This mathematical derivation,
adopted from the work of Yang et al. (2004). In their paper they revised and developed
application of the original Kubelka-Munk (K-M) theory of light propagation in a scattering
and absorbing medium for ink-jet printing. We showed that the locally absorbed light can
be estimated from the locally available light measured using scalar irradiance microsensor.
This makes calculating the absorbed light much easier compared to the previous work,
which required knowledge of light absorption at specific depths through the mat quantified
from combined measurements of the downwelling and upwelling irradiance and the scalar
irradiance described earlier (Kühl and Jørgensen 1994). Such measurements are laborious
and time consuming.
Light Absorption inside Microbial Mats
Due to the high concentration of pigmented cells and the presence of abiotic components
such as sediment particles, benthic photosynthetic systems have extremely steep light
gradients, with light attenuating within millimeters (Kühl and Jørgensen 1992; Kühl and
Jørgensen 1994; Kühl et al. 1994). This is different from planktonic systems where cells
obtain more or less the same light intensity. These pronounced light gradients affect the
photosynthetic efficiency of the cells at different depths profoundly. Therefore, the energy
budget of these microbial ecosystems needs to be integrated over the light penetration
depth, as efficiencies depending on depth. Each microbial mat ecosystem has a different
sediment texture and distribution of photosynthetic microorganisms, and thus a different
� 141
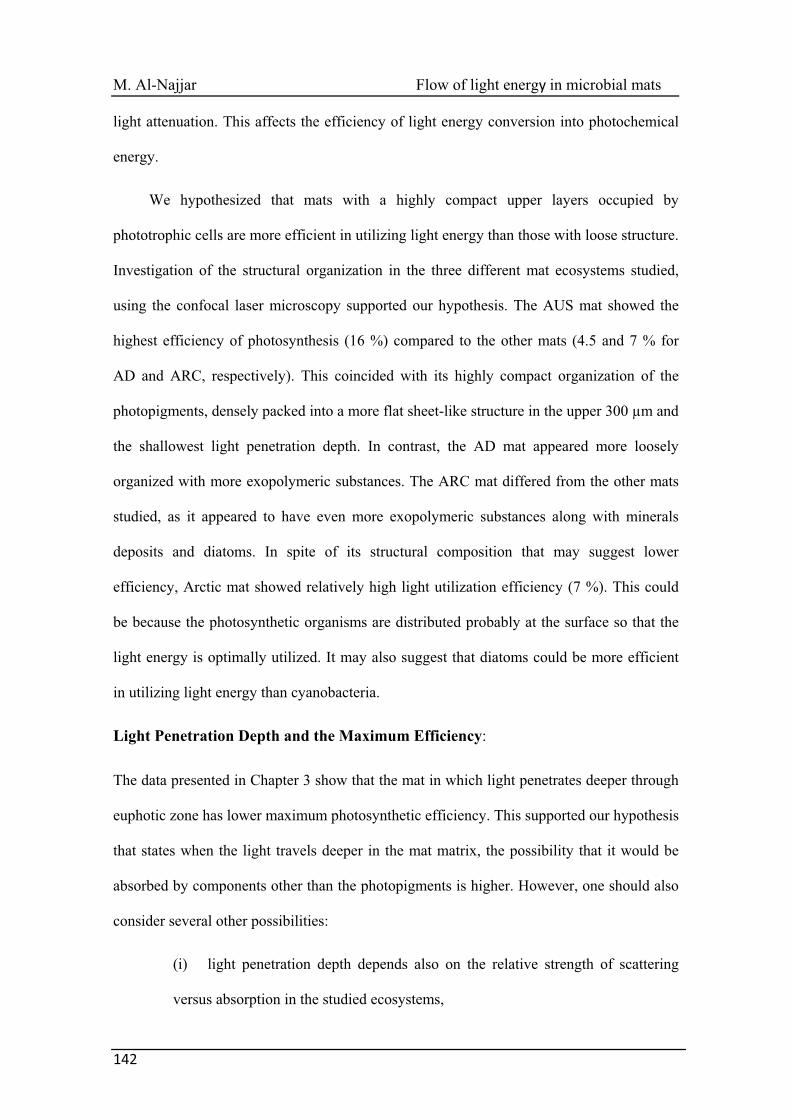
M. Al-Najjar Flow of light energy�in microbial mats������������
light attenuation. This affects the efficiency of light energy conversion into photochemical
energy.
We hypothesized that mats with a highly compact upper layers occupied by
phototrophic cells are more efficient in utilizing light energy than those with loose structure.
Investigation of the structural organization in the three different mat ecosystems studied,
using the confocal laser microscopy supported our hypothesis. The AUS mat showed the
highest efficiency of photosynthesis (16 %) compared to the other mats (4.5 and 7 % for
AD and ARC, respectively). This coincided with its highly compact organization of the
photopigments, densely packed into a more flat sheet-like structure in the upper 300 μm and
the shallowest light penetration depth. In contrast, the AD mat appeared more loosely
organized with more exopolymeric substances. The ARC mat differed from the other mats
studied, as it appeared to have even more exopolymeric substances along with minerals
deposits and diatoms. In spite of its structural composition that may suggest lower
efficiency, Arctic mat showed relatively high light utilization efficiency (7 %). This could
be because the photosynthetic organisms are distributed probably at the surface so that the
light energy is optimally utilized. It may also suggest that diatoms could be more efficient
in utilizing light energy than cyanobacteria.
Light Penetration Depth and the Maximum Efficiency:
The data presented in Chapter 3 show that the mat in which light penetrates deeper through
euphotic zone has lower maximum photosynthetic efficiency. This supported our hypothesis
that states when the light travels deeper in the mat matrix, the possibility that it would be
absorbed by components other than the photopigments is higher. However, one should also
consider several other possibilities:
(i) light penetration depth depends also on the relative strength of scattering
versus absorption in the studied ecosystems,
�142�
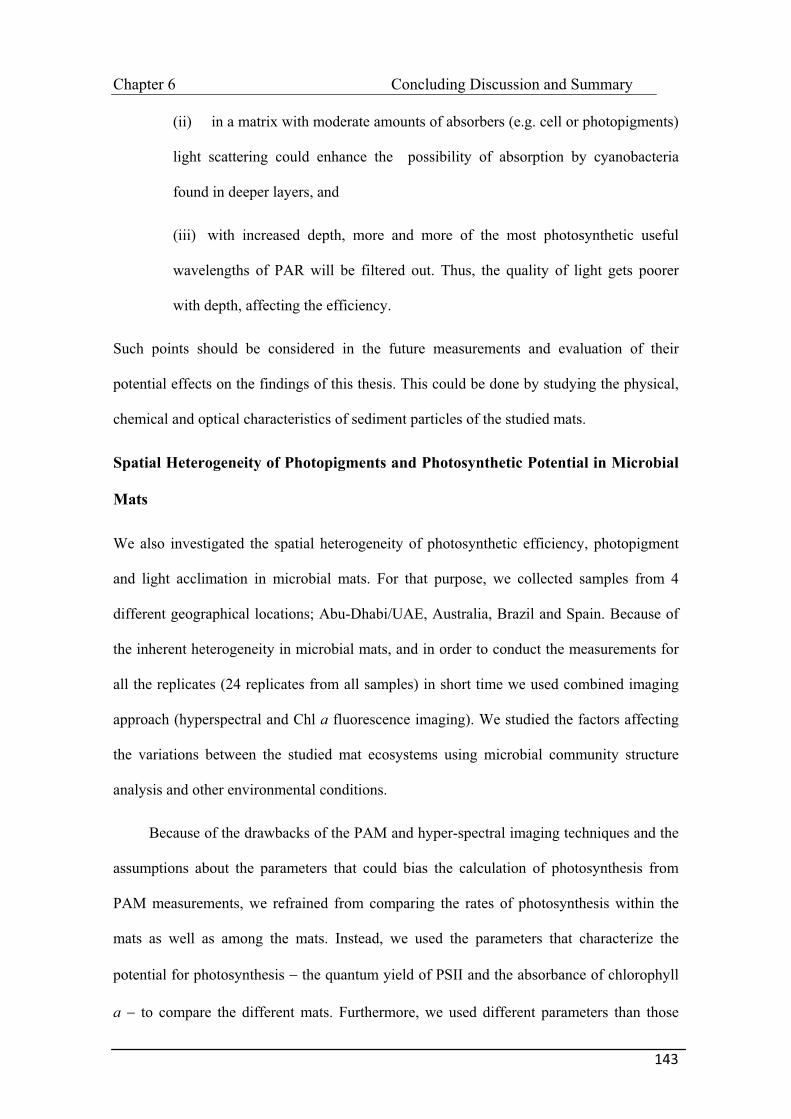
Chapter 6 Concluding Discussion and Summary
(ii) in a matrix with moderate amounts of absorbers (e.g. cell or photopigments)
light scattering could enhance the possibility of absorption by cyanobacteria
found in deeper layers, and
(iii) with increased depth, more and more of the most photosynthetic useful
wavelengths of PAR will be filtered out. Thus, the quality of light gets poorer
with depth, affecting the efficiency.
Such points should be considered in the future measurements and evaluation of their
potential effects on the findings of this thesis. This could be done by studying the physical,
chemical and optical characteristics of sediment particles of the studied mats.
Spatial Heterogeneity of Photopigments and Photosynthetic Potential in Microbial
Mats
We also investigated the spatial heterogeneity of photosynthetic efficiency, photopigment
and light acclimation in microbial mats. For that purpose, we collected samples from 4
different geographical locations; Abu-Dhabi/UAE, Australia, Brazil and Spain. Because of
the inherent heterogeneity in microbial mats, and in order to conduct the measurements for
all the replicates (24 replicates from all samples) in short time we used combined imaging
approach (hyperspectral and Chl a fluorescence imaging). We studied the factors affecting
the variations between the studied mat ecosystems using microbial community structure
analysis and other environmental conditions.
Because of the drawbacks of the PAM and hyper-spectral imaging techniques and the
assumptions about the parameters that could bias the calculation of photosynthesis from
PAM measurements, we refrained from comparing the rates of photosynthesis within the
mats as well as among the mats. Instead, we used the parameters that characterize the
potential for photosynthesis � the quantum yield of PSII and the absorbance of chlorophyll
a � to compare the different mats. Furthermore, we used different parameters than those
� 143
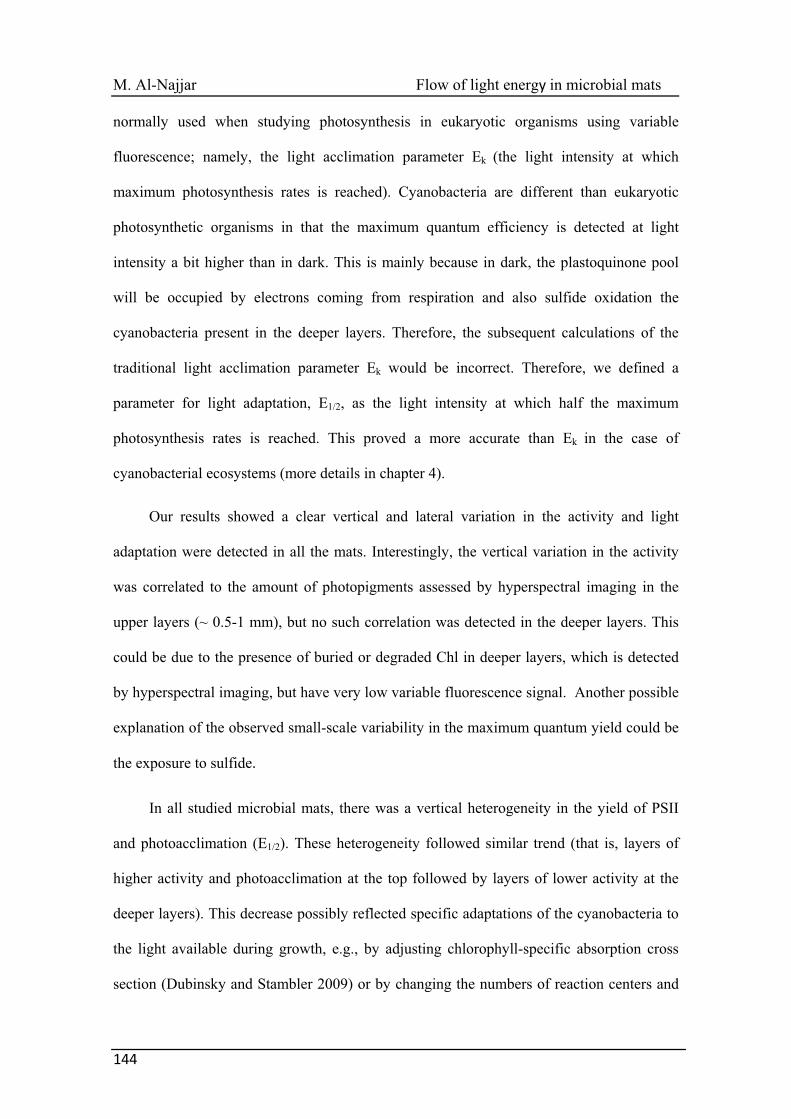
M. Al-Najjar Flow of light energy�in microbial mats������������
normally used when studying photosynthesis in eukaryotic organisms using variable
fluorescence; namely, the light acclimation parameter Ek (the light intensity at which
maximum photosynthesis rates is reached). Cyanobacteria are different than eukaryotic
photosynthetic organisms in that the maximum quantum efficiency is detected at light
intensity a bit higher than in dark. This is mainly because in dark, the plastoquinone pool
will be occupied by electrons coming from respiration and also sulfide oxidation the
cyanobacteria present in the deeper layers. Therefore, the subsequent calculations of the
traditional light acclimation parameter Ek would be incorrect. Therefore, we defined a
parameter for light adaptation, E1/2, as the light intensity at which half the maximum
photosynthesis rates is reached. This proved a more accurate than Ek in the case of
cyanobacterial ecosystems (more details in chapter 4).
Our results showed a clear vertical and lateral variation in the activity and light
adaptation were detected in all the mats. Interestingly, the vertical variation in the activity
was correlated to the amount of photopigments assessed by hyperspectral imaging in the
upper layers (~ 0.5-1 mm), but no such correlation was detected in the deeper layers. This
could be due to the presence of buried or degraded Chl in deeper layers, which is detected
by hyperspectral imaging, but have very low variable fluorescence signal. Another possible
explanation of the observed small-scale variability in the maximum quantum yield could be
the exposure to sulfide.��
In all studied microbial mats, there was a vertical heterogeneity in the yield of PSII
and photoacclimation (E1/2). These heterogeneity followed similar trend (that is, layers of
higher activity and photoacclimation at the top followed by layers of lower activity at the
deeper layers). This decrease possibly reflected specific adaptations of the cyanobacteria to
the light available during growth, e.g., by adjusting chlorophyll-specific absorption cross
section (Dubinsky and Stambler 2009) or by changing the numbers of reaction centers and
�144�
Chapter 6 Concluding Discussion and Summary
electron transport components (Falkowski and Raven 1997).
Our data showed that the variability in the measured physiological parameters within
samples collected from the same site was comparable to the variability found in the samples
collected from different locations. On the other hand, variability the microbial community
structure was much less within the samples collected from the same location compared to
those collected from other geographic locations. This suggests that the possible
environmental factors mentioned above affect the function of the microbial community to a
greater extent than its structure.
Open Questions and Applications
The results of this thesis could find the way to important applications, such as in the fast
growing filed of biofuel. Also, other interesting questions were raised based on the findings
of this work.
(i) Open questions:
Although this thesis answered many interesting questions, it also raises other ones. It needs
to be investigated whether the conclusions of this study on photosynthetic mats can be
generalized on other photosynthetic ecosystems. Is the relationship between the absorbed
light energy by the biomass and the maximum efficiency universal for all photosynthetic
ecosystems (e.g., benthic, pelagic and terrestrial systems such as rain forests)? If so, then is
the relation quantitatively the same? What are the specific effects of the structural
organization (photosynthetic cell density relative to other components of the mat matrix)
and community composition of benthic microbial mats on the maximum photosynthetic
efficiency of this ecosystem? What can influence the abiotic light absorption, and the
reflection?
� 145
M. Al-Najjar Flow of light energy�in microbial mats������������
(ii) Application:
I propose to use two approaches to increase light utilization efficiency of photosynthetic
organisms to be used for biomass or biofuels production: genetic/genomic engineering (e.g.,
multiplex automated genome engineering, MAGE; Wang et al. 2009), and the physiological
optimisation of the studied photosynthetic model (algae and/or cyanobacteria). The first
approach would enhance the selectivity of Rubisco towards CO2 versus O2, and the CO2
fixation rate. This occurs because MAGE enables the rapid and continuous generation of
sequence diversity at many targeted chromosomal locations across a large population of
cells through the repeated introduction of synthetic DNA (Wang et al. 2009). Each cell will
contain a different set of mutations producing a heterogeneous population. Then, we can
select the cells that will show high CO2 fixation rate for further physiological optimization.
The selection method should enumerate the mutants separately in fresh media, then measure
the CO2 fixation rate on a sub-samples using 13CO2 tracer.
Secondly, I propose to optimize cultivation and growth conditions towards higher
efficiency of photosynthesis. The observed relation between the depth of the photic zone
and the efficiency of light utilization can be a guide for optimization of engineered systems.
The optimal conditions needed for such system are those enabling growing the cells at their
maximum efficiency per photon, thus generating high biomass. Such conditions include
suitable light intensity, optimum temperature, cell density, ideal biofilm thickness and
suitable nutrients. Preliminary optimization can be done in the lab to optimize the cell
density, thickness of the needed layer, the intensity of light and the best harvesting method.
This optimization could improve large-scale (i.e., industrial bioreactors) production of
biodiesel using algae and cyanobacteria. Immobilizing the suitable phototrophic cells into a
thin, highly dense layer would increase the efficiency of photosynthesis, it also protect
against shear forces (Packer 2009). Biofilms are easier to harvest the concentrated biomass
�146�
Chapter 6 Concluding Discussion and Summary
than suspended cells, also they save efforts and costs (Vega et al. 1988).
Outlook
For further studies, I suggest the following set of measurements:
1. in situ measurements of the energy budget of at least one of the microbial mat
systems investigated in this work. The Australian mat could be a promising choice,
as it showed the highest efficiency, the system is easily accessible and our
collaborators in the University of Queensland/Australia have frequent site visits. In
addition, the system is well characterized making the conclusions easier to draw.
However, field measurements could be faced problems in accounting for the daily
changes of temperature and light. The changes in incident light could be monitored
during the measurements and then incorporated into efficiency calculations. The
impact of temperature changes on photosynthetic efficiency could be accounted for
using the heat dissipation equation maxPS,minH, 1= �� � based on results from Chapter
2. It would be important to compare the laboratory measurements with in situ
measurements, to see the effects of lab conditions on the actual photosynthetic
efficiency.
2. The light absorption by the cells (photopigments) relative to the absorption by other
components of the mats (EPS, sediment, minerals, detritus, etc) should be better
investigated. The reflectance and transmission (Fig. 1) after and before pigment
extraction should be done on the photic zone only. Leaving the mat intact will
increase the light penetration and absorption by mat components other than
photopigments. This will lead to an overestimation of the absorption. To be more
exact in assessing the reflectance of abiotic material in the photic zone, the
measurements should be done on the photic zone only.
� 147
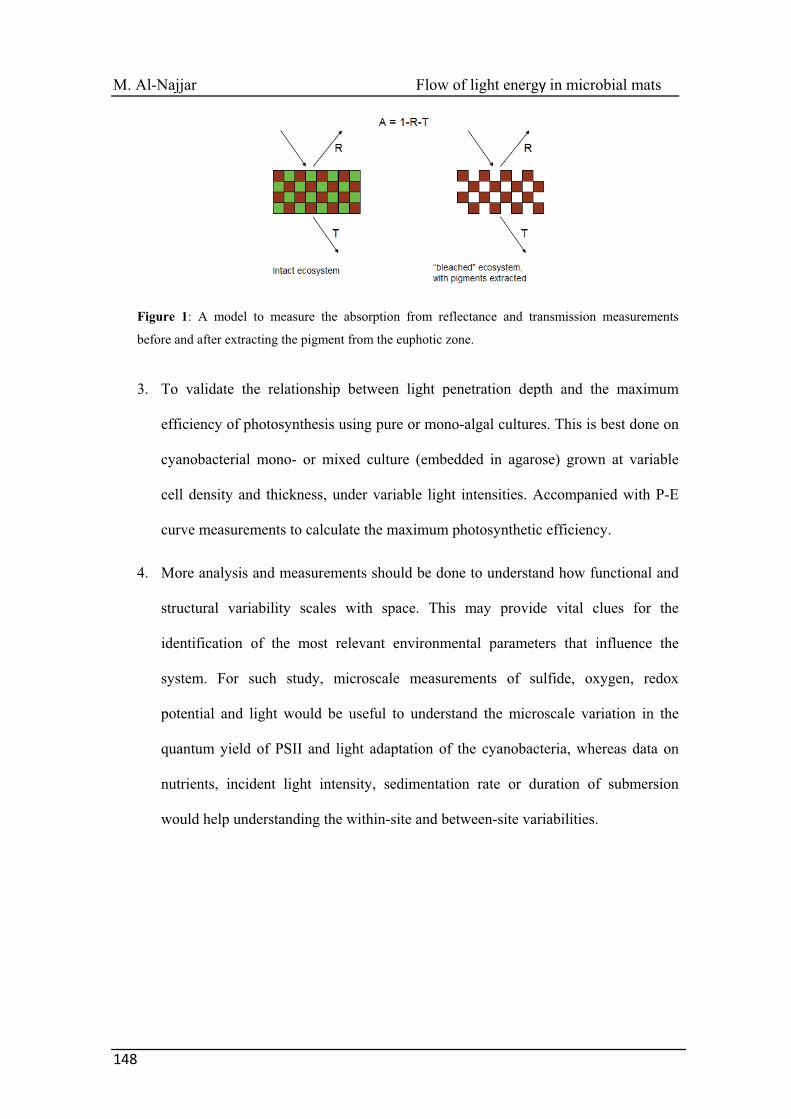
M. Al-Najjar Flow of light energy�in microbial mats������������
Figure 1: A model to measure the absorption from reflectance and transmission measurements
before and after extracting the pigment from the euphotic zone.
3. To validate the relationship between light penetration depth and the maximum
efficiency of photosynthesis using pure or mono-algal cultures. This is best done on
cyanobacterial mono- or mixed culture (embedded in agarose) grown at variable
cell density and thickness, under variable light intensities. Accompanied with P-E
curve measurements to calculate the maximum photosynthetic efficiency.
4. More analysis and measurements should be done to understand how functional and
structural variability scales with space. This may provide vital clues for the
identification of the most relevant environmental parameters that influence the
system. For such study, microscale measurements of sulfide, oxygen, redox
potential and light would be useful to understand the microscale variation in the
quantum yield of PSII and light adaptation of the cyanobacteria, whereas data on
nutrients, incident light intensity, sedimentation rate or duration of submersion
would help understanding the within-site and between-site variabilities.
�148�
Chapter 6 Concluding Discussion and Summary
References
Abed, R.M.M., Polerecky, L., Al Najjar, M., de Beer, D., 2006. Effect of temperature on photosynthesis, oxygen consumption and sulfide production in an extremely hypersaline cyanobacterial mat. Aquatic Microbial Ecology 44, 21-30.
Cahoon, L.B., 1999. The role of benthic microalgae in neritic ecosystems. Oceanogr. Mar. Biol. Annu. Rev. 37, 47–86.
Chow, W.S., Melis, A., Anderson, J.M., 1990. Adjustments of photosystem stoichiometry in chloroplasts improve the quantum efficiency of photosynthesis. Proceedings of the National Academy of Sciences of the United States of America 87, 7502-7506.
Des Marais, D.J., 2003. Biogeochemistry of hypersaline microbial mats illustrates the dynamics of modern microbial ecosystems and the early evolution of the biosphere. Biological Bulletin 204, 160-167.
Garcia-Pichel, F., 2000. Cyanobacteria, In Encyclopedia of Microbiology. ed. J. Lederberg, pp. 907–929. Academic Press, San Diego, CA.
Garcia de Lomas, J., Corzo, A., Garcia, C.M., and van Bergeijk, S.A, 2005. Microbenthos in a hypersaline tidal lagoon: factors affecting microhabitat, community structure and mass exchange at the sediemnt-water interface. Aquatic Microbial Ecology, 53-69.
Guerrero, R., Piqueras, M., Berlanga, M., 2002. Microbial mats and the search for minimal ecosystems. International Microbiology 5, 177-188.
Jonkers, H.M., Ludwig, R., De Wit, R., Pringault, O., Muyzer, G., Niemann, H., Finke, N., De Beer, D., 2003. Structural and functional analysis of a microbial mat ecosystem from a unique permanent hypersaline inland lake: 'La Salada de Chiprana' (NE Spain). FEMS Microbiology Ecology 44, 175-189.
Karsten, U., and Kühl, M., 1996. Die Mikrobenmatte-das kleinste Ökosystem der Welt. Biologie unserer Zeit, 16-26.
Kohls, K., Abed, R.M.M., Polerecky, L., Weber, M., de Beer, D., Halotaxis of cyanobacteria in an intertidal hypersaline microbial mat. Environmental Microbiology 12, 567-575.
Kühl, M., Jørgensen, B.B., 1992. Spectral light measurements in microbenthic phototrophic communities with a fiber-optic microprobe coupled to a sensitive diode array detector. Limnology and Oceanography 37, 1813-1823.
Kühl, M., Jørgensen, B.B., 1994. The light-field of microbenthic communities - radiance distribution and microscale optics of sandy coastal sediments. Limnology and Oceanography 39, 1368-1398.
Kühl, M., Lassen, C., Jørgensen, B.B., 1994. Optical properties of microbial mats: light measurements with fiber-optic microprobes, In Microbial Mats: Structure, Development and Environmental Significance. eds J. Stal, P. Caumette, pp. 149-167. Springer, Berlin.
� 149
M. Al-Najjar Flow of light energy�in microbial mats������������
Nübel, U., Garcia-Pichel, F., Kühl, M., Muyzer, G., 1999. Spatial scale and the diversity of benthic cyanobacteria and diatoms in a salina. Hydrobiologia 401, 199-206.
Nübel, U., Garcia-Pichel, F., Clavero, E., and Muyzer, G, 2000. Matching molecular diversity and ecophysiology of benthic cyanobacteria and diatoms in communities along a salinity gradient. Environmental Microbiology, 217-226.
Packer, M., 2009. Algal capture of carbon dioxide; biomass generation as a tool for greenhouse gas mitigation with refernce to New Zealand energy strategy and policy. Energy Policy 37, 3428-3437.
Polerecky, L., Bachar, A., Schoon, R., Grinstein, M., Jørgensen, B.B., de Beer, D., Jonkers, H.M., 2007. Contribution of Chloroflexus respiration to oxygen cycling in a hypersaline microbial mat from Lake Chiprana, Spain. Environmental Microbiology 9, 2007-2024.
Staats, N., Winder, B.d., Stal, L.J., and Mur, L.R, 1999. Isolation and characterization of extracellular polysaccharides from the epipelic diatoms Cylindrotheca closterium and Novicula salinarum. European Journal of Phycology, 161-169.
Stal, L.J., 2000. Cyanobacterial mats and stromatolites, In The ecology of cyanobacteria. eds A. B. Whitton, M. Potts, pp. 61-120. Kluwer Academic Publishers, Dordrecht, The Netherlands.
Van Gemerden, H., 1993. Microbial Mats: a Joint Venture, In Marine Geology. pp. 3-25.
Vega, J.L., Clausen, E.C., Gaddy, J.L., 1988. Biofilm reactors for ethanol-production. Enzyme and Microbial Technology 10, 390-402.
Wang, H.H., Isaacs, F.J., Carr, P.A., Sun, Z.Z., Xu, G., Forest, C.R., Church, G.M., 2009. Programming cells by multiplex genome engineering and accelerated evolution. Nature 460, 894-U133.
Wieland, A., Kühl, M., 2000. Irradiance and temperature regulation of oxygenic photosynthesis and O-2 consumption in a hypersaline cyanobacterial mat (Solar Lake, Egypt). Marine Biology 137, 71-85.
Wieland, A., Pape, T., Möbius, J., Klock, J.H., and Michaelis, W, 2008. Carbon pools and isotopic trends in a hypersaline cyanobacterial mat. Geobiology.
Wieland, A., Zopfi, J., Benthien, A., Kuhl, M., 2005. Biogeochemistry of an iron-rich hypersaline microbial mat (Camargue, France). Microbial Ecology 49, 34-49.
Yang, L., Kruse, B., Miklavcic, S.J., 2004. Revised Kubelka-Munk theory. II. Unified framework for homogeneous and inhomogeneous optical media. Journal of the Optical Society of America a-Optics Image Science and Vision 21, 1942-1952.
�150�
Chapter 6 Concluding Discussion and Summary
6.2 Summary The work in this thesis demonstrates the assessment of the energy budget inside microbial
mat ecosystems, and the factors affecting light utilization efficiency. It presents the first
balanced light energy budget for benthic microbial mat ecosystems, and shows how the
budget and the spatial distribution of the local photosynthetic efficiencies within the
euphotic zone depend on the absorbed irradiance (Jabs). The energy budget was dominated
by heat dissipation on the expense of photosynthesis. The maximum efficiency of
photosynthesis was at light limiting conditions
When comparing three different marine benthic photosynthetic ecosystems
(originated from Abu-Dhabi, Arctic, and Exmouth Gulf in Western Australia), differences
in the efficiencies were calculated. The results demonstrated that the maximum efficiency
depended on mat characteristics affecting light absorption and scattering; such as,
photopigments ratio and distribution, and the structural organization of the photosynthetic
organisms relative to other absorbing components of the ecosystem (i.e., EPS, mineral
particles, detritus, etc.). The maximum efficiency decreased with increasing light
penetration depth, and increased with increasing the accessory pigments (phycocyanin and
fucoxanthin)/chlorophyll ratio.
Spatial heterogeneity in photosynthetic efficiency, pigment distribution, as well as
light acclimation in microbial mats originating from different geographical locations was
investigated. We used a combined pigment imaging approach (variable chlorophyll
fluorescence and hyperspectral imaging), and fingerprinting approach. For each mat, the
photosynthetic activity was proportional to the local pigment concentration in the photic
zone, but not for the deeper layers and between different mats. In each mat, yield of PSII
and E1/2 (light acclimation) generally decreased in parallel with depth, but the gradients in
both parameters varied greatly between samples. This mismatch between pigments
concentration and yield of PSII, as well as the variation in the yield of PSII and E1/2
gradients could be due to differences on cellular level of the cyanobacteria. Our results
showed that more measurements and analysis are still needed to understand the variations
between the mats originated from different locations.
This work provides the base for addressing in more detail the photobiology of densely
populated photosynthetic systems with intense absorption and scattering. The analysis of
the data has promising applications in other areas of research such as plant biology and
biotechnology.
� 151

M. Al-Najjar Flow of light energy�in microbial mats������������
6.3 Zusammenfassung Die vorliegendene Dissertation befasst sich mit der Energiebilanz in mikrobiellen Matten
und Faktoren, die Effizienz der Lichtnutzung beeinflussen. Sie stellt die erste ausgeglichene
Lichtenergiebilanz in benthischen mikrobiellen Matten da und zeigt wie diese Bilanz und
die räumliche Verteilung der lokalen photosynthetischen Effizienzen in der euphotischen
Zone von der absorbierten Strahlung (Jabs) abhängen. Die Energiebilanz wurde zu Lasten
der Photosyntheseleistung durch Wärmeabgabe dominiert. Die maximale Photosynthese-
Effizienz lag unter lichtlimitierenden Bedingungen vor.
Beim Vergleich von drei verschiedenen benthischen photosynthetischen Ökosystemen
(stammend aus Abu-Dhabi, der Arktis und dem Exmouth Golf in West-Australien) wurden
Unterschiede in der Effizienz berechnet. Die Ergebnisse zeigen, dass die maximale
Effizienz von den Charakteristika der Matten abhängt, die die Lichtabsorption und Streuung
beeinflussen, wie z.B. Photopigment-Verhältnis und Verteilung, sowie die strukturelle
Organisation der photosynthetisch aktiven Organismen relativ zu anderen absorbierenden
Komponeneten des Ökosystems (z.B. EPS, mineralische Partikel, Detritus, etc.). Die
maximale Effizienz nahm mit steigender Lichteindringtiefe ab und mit steigendem
Verhältnis an akzessorische Pigmente (Phycocyanin und Fucoxanthin)/Chlorophyll zu.
Räumliche Heterogenität in der photosynthetischen Effizienz, Pigmentverteilung und
Lichtakklimatisierung wurden in den mikrobiellen Matten von den verschiedenen
Standorten untersucht. Wir benutzten einen kombinierten Imaging-Ansatz (variable
Chorophyll Fluoreszenz und Hyperspectral Imaging), sowie einen Fingerprinting-Ansatz. In
jeder Matte war die Photosyntheseaktivität proportional zu der lokalen
Pigmentkkonzentration in der photischen Zone, aber nicht in den tieferen Schichten und
zwischen den verschiedenen Matten.
Der Quantum Ertrag von PSII und E1/2 (Lichtakklimatisierung) nahm in jeder Matte parallel
mit der Tiefe ab, wobei aber die Gradienten zwischen beiden Parametern enorm zwischen
den verschiedenen Proben variierten. Diese Diskrepanz zwischen den
Pigmentkonzentrationen und dem Quantum Ertrag von PSII, als auch die Variation im
Quantum Ertrag von PSII und E1/2 Gradienten könnten durch Unterschiede auf zellulärer
Ebene der Cyanobaktieren hervorgerufen werden. Unsere Ergebnisse zeigen, dass
zusätzliche Analysen nötig sind, damit die Variationen zwischen Matten unterschiedlicher
Standorte zu verstehen sind.
�152�

Chapter 6 Concluding Discussion and Summary
� 153
Diese Arbeit bietet Grundlage für eine nähergehende Untersuchung der Photobiologie von
dichtbesiedelten photosynthetischen Systemen mit intensiver Absorption und Streuung. Die
Datenanalyse zeigt vielversprechende Anwendungsmöglichkeiten in anderen
Forschungsgebieten wie z.B. Pflanzenbiologie und Biotechnologie.
����
��