Embed Size (px)
Citation preview
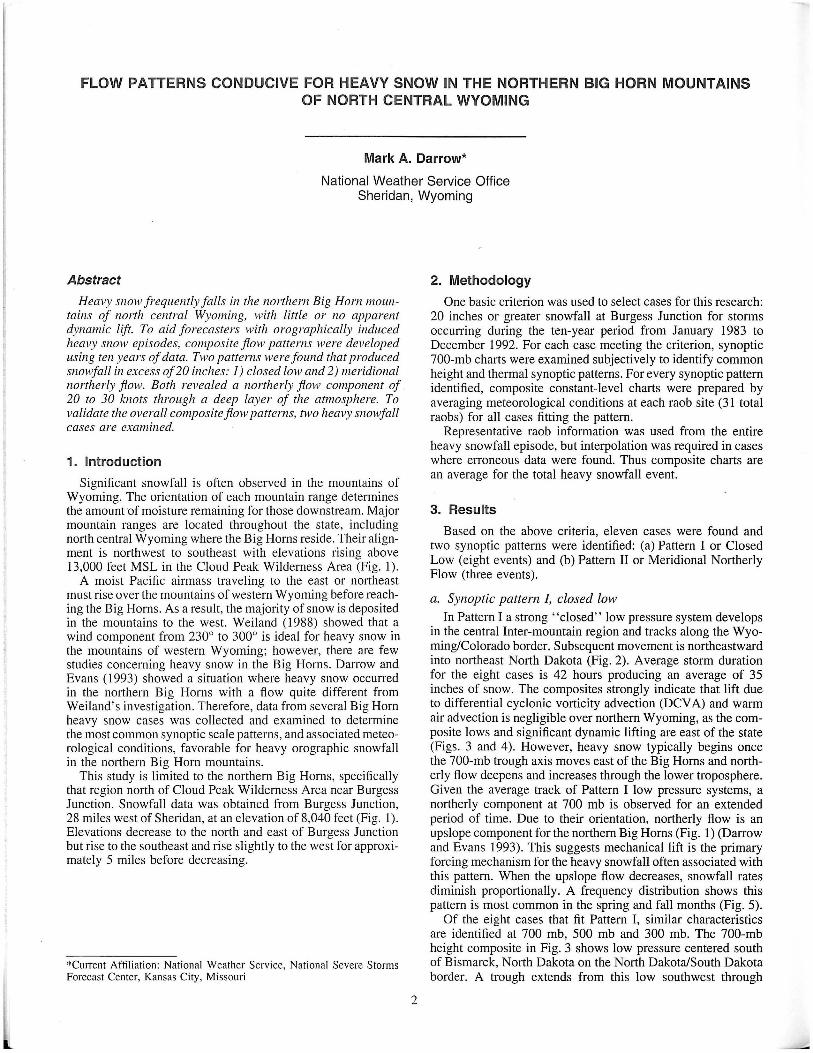
FLOW PATTERNS CONDUCIVE FOR HEAVY SNOW IN THE NORTHERN BIG HORN MOUNTAINS OF NORTH CENTRAL WYOMING
Mark A. Darrow*
National Weather Service Office Sheridan, Wyoming
Abstract
Heavy snow frequently falls in the northern Big Horn mountains of north central Wyoming, with little or no apparent dynamic lift. To aid forecasters with orographicaUy induced heavy snow episodes, composite flow patterns were developed using ten years of data. Two patterns were found that produced snowfall in excess of20 inches: 1) closed low and 2) meridional northerly flow. Both revealed a northerly flow component of 20 to 30 knots through a deep layer of the atmosphere. To validate the overall composite flo w patterns, two heavy snowfall cases are examined.
1. Introduction
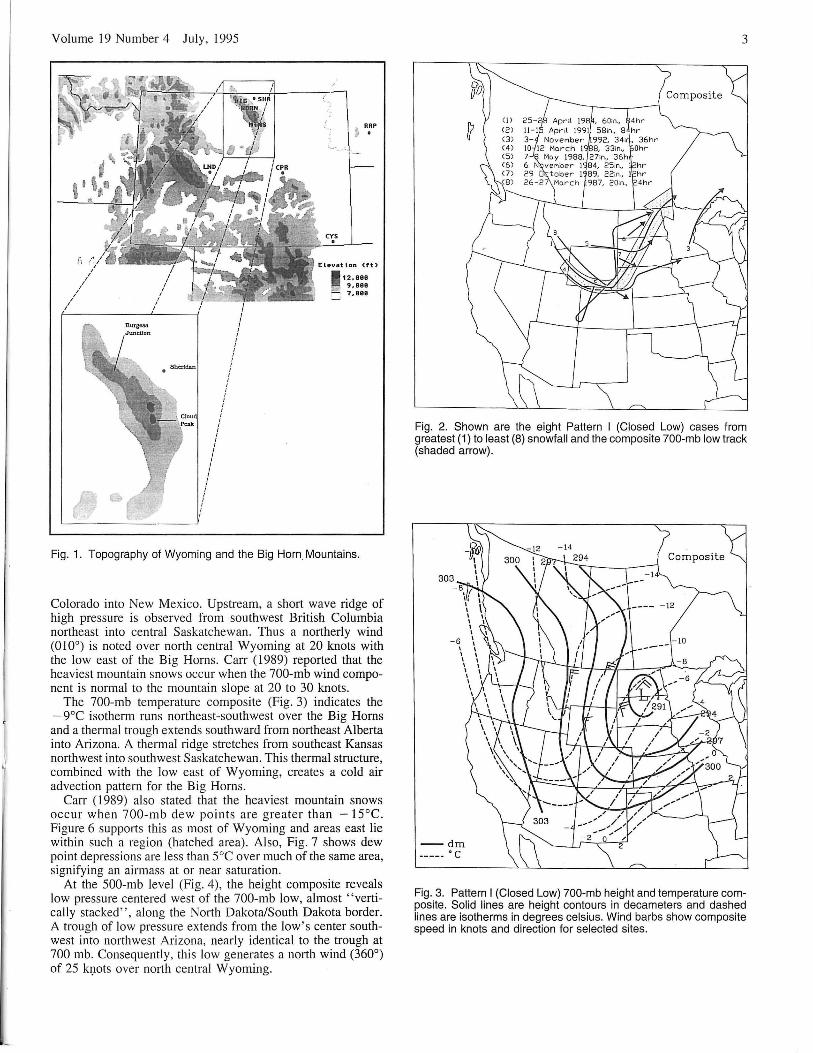
Significant snowfall is often observed in the mountains of Wyoming. The orientation of each mountain range determines the amount 'of moisture remaining for those downstream. Major mountain ranges are located throughout the state, including north central Wyoming where the Big Horns reside. Their alignment is northwest to southeast with elevations rising above 13,000 feet MSL in the Cloud Peak Wilderness Area (Fig. 1).
A moist Pacific airmass traveling to the east or northeast must rise over the mountains of western Wyoming before reaching the Big Horns. As a result, the majority of snow is deposited in the mountains to the west. Weiland (1988) showed that a wind component from 2300 to 3000 is ideal for heavy snow in the mountains of western Wyoming; however, there are few studies concerning heavy snow in the Big Horns. Darrow and Evans (1993) showed a situation where heavy snow occurred in the northern Big Horns with a flow quite different from Weiland's investigation. Therefore, data from several Big Horn heavy snow cases was collected and examined to determine the most common synoptic scale patterns, and associated meteorological conditions, favorable for heavy orographic snowfall in the northern Big Horn mountains.
This study is limited to the northern Big Horns, specifically that region north of Cloud Peak Wilderness Area near Burgess Junction. Snowfall data was obtained from Burgess Junction, 28 miles west of Sheridan, at an elevation of 8,040 feet (Fig. 1). Elevations decrease to the north and east of Burgess Junction but rise to the southeast and rise slightly to the west for approximately 5 miles before decreasing.
*Current Affiliation : National Weather Service, National Severe Storms Forecast Center, Kansas City, Missouri
2
2. Methodology
One basic criterion was used to select cases for this research: 20 inches or greater snowfall at Burgess Junction for storms occurring during the ten-year period from January 1983 to December 1992. For each case meeting the criterion, synoptic 700-mb charts were examined subjectively to identify common height and thermal synoptic patterns. For every synoptic pattern identified, composite constant-level charts were prepared by averaging meteorological conditions at each raob site (31 total raobs) for all cases fitting the pattern.
Representative raob information was used from the entire heavy snowfall episode, but interpolation was required in cases where erroneous data were found. Thus composite charts are an average for the total heavy snowfall event.
3. Results
Based on the above criteria, eleven cases were found and two synoptic patterns were identified: (a) Pattern I or Closed Low (eight events) and (b) Pattern II or Meridional Northerly Flow (three events).
a. Synoptic pattern I, closed low
In Pattern I a strong "closed" low pressure system develops in the central Inter-mountain region and tracks along the Wyoming/Colorado border. Subsequent movement is northeastward into northeast North Dakota (Fig. 2). Average storm duration for the eight cases is 42 hours producing an average of 35 inches of snow. The composites strongly indicate that lift due to differential cyclonic vorticity advection (DCY A) and warm air advection is negligible over northern Wyoming, as the composite lows and significant dynamic lifting are east of the state (Figs. 3 and 4). However, heavy snow typically begins once the 700-mb trough axis moves east of the Big Horns and northerly flow deepens and increases through the lower troposphere. Given the average track of Pattern I low pressure systems, a northerly component at 700 mb is observed for an extended period of time. Due to their orientation, northerly flow is an upslope component for the northern Big Horns (Fig. 1) (Darrow and Evans 1993). This suggests mechanical lift is the primary forcing mechanism for the heavy snowfall often associated with this pattern. When the upslope flow decreases, snowfall rates diminish proportionally. A frequency distribution shows this pattern is most common in the spring and fall months (Fig. 5).
Of the eight cases that fit Pattern I, similar characteristics are identified at 700 mb, 500 mb and 300 mb. The 700-mb height composite in Fig. 3 shows low pressure centered south of Bismarck, North Dakota on the North Dakota/South Dakota border. A trough extends from this low southwest through
Volume 19 Number 4 July, 1995
/ ~ ...
...... ..
(YS o
~ RRP !) •
Eleuatlon (tt)
. 12,888 ~ 9,888
7,888 -
Fig. 1. Topography of Wyoming and the Big Horn Mountains.
Colorado into New Mexico. Upstream, a short wave ridge of high pressure is observed from southwest British Columbia northeast into central Saskatchewan. Thus a northerly wind (01 0°) is noted over north central Wyoming at 20 knots with the low east of the Big Horns. Carr (1989) reported that the heaviest mountain snows occur when the 700-mb wind component is normal to the mountain slope at 20 to 30 knots.
The 700-mb temperature composite (Fig. 3) indicates the - 9°C isotherm runs northeast-southwest over the Big Horns and a thermal trough extends southward from nOItheast Alberta into Arizona. A thermal ridge stretches from southeast Kansas northwest into southwest Saskatchewan. This thermal structure, combined with the low east of Wyoming, creates a cold air advection pattern for the Big Horns.
Carr (1989) also stated that the heaviest mountain snows occur when 700-mb dew points are greater than - 15°C. Figure 6 supports this as most of Wyoming and areas east lie within such a region (hatched area). Also, Fig. 7 shows dew point depressions are less than 5°C over much of the same area, signifying an airmass at or near saturation.
At the 500-mb level (Fig. 4), the height composite reveals low pressure centered west of the 700-mb low, almost "vertically stacked", along the North Dakota/South Dakota border. A trough of low pressure extends from the low's center southwest into northwest Arizona, nearly identical to the trough at 700 mb. Consequently, this low generates a north wind (360°) of 25 kI],ots over north central Wyoming.
3
Fig. 2. Shown are the eight Pattern I (Closed Low) cases from greatest (1) to least (8) snowfall and the composite 700-mb low track (shaded arrow).
--dm ----- • C
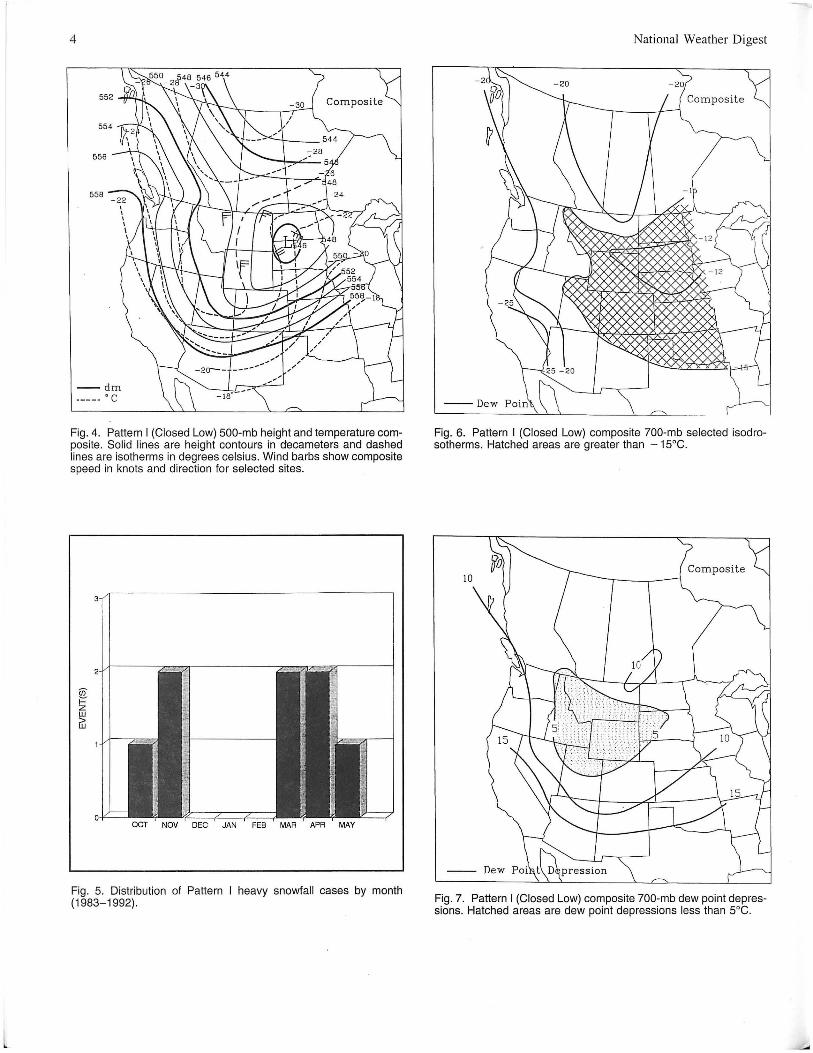
Fig. 3. Pattern I (Closed Low) 700-mb height and temperature compOSite. Solid lines are height contours in decameters and dashed lines are isotherms in degrees celsius. Wind barbs show composite speed in knots and direction for selected sites.
4
556
558
- -dm ---- - • C
Fig. 4. Pattern I (Closed Low) 500-mb height and temperature composite . Solid lines are height contours in decameters and dashed lines are isotherrns in degrees celsius. Wind barbs show composite speed in knots and direction for selected sites.
JAN FEB MAR APR MAY
Fig. 5. Distribution of Pattern I heavy snowfall cases by month (1983- 1992).
National Weather Digest
Fig. 6. Pattern I (Closed Low) composite 700-mb selected isodrosotherms. Hatched areas are greater than - 15°C.
Fig. 7. Pattern I (Closed Low) composite 700-mb dew point depressions. Hatched areas are dew point depressions less than 5°C.
Volume 19 Number 4 July, 1995
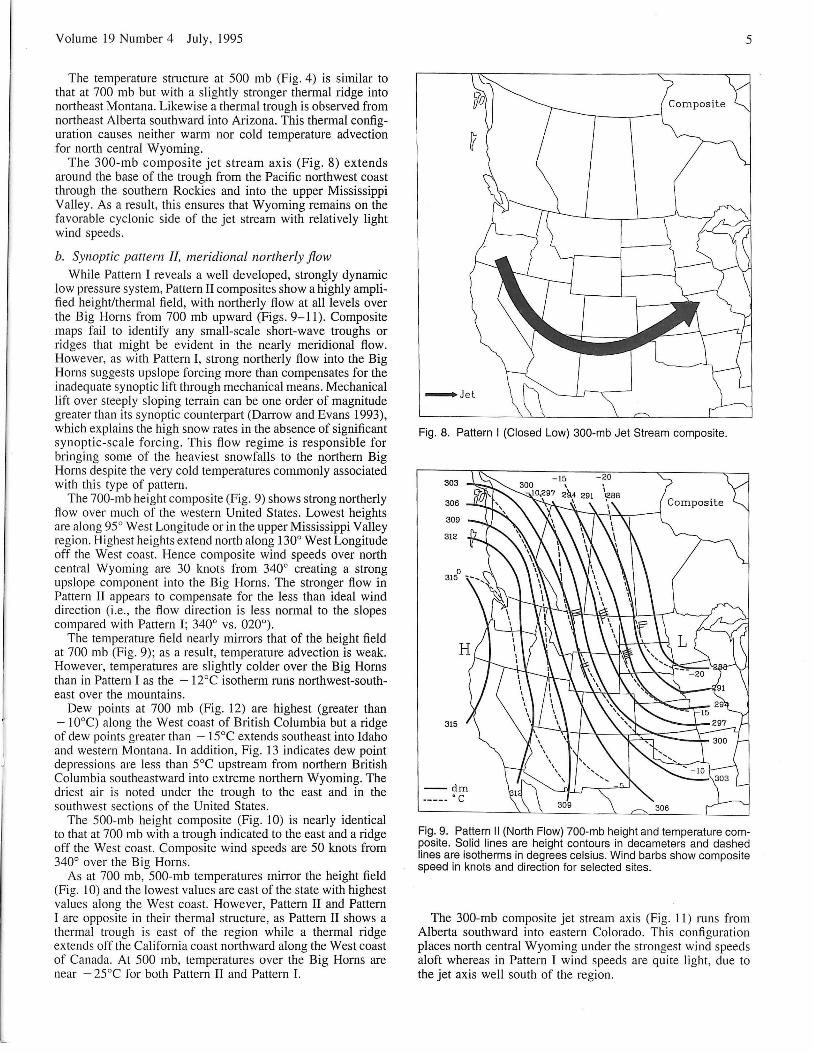
The temperature structure at 500 mb (Fig. 4) is similar to that at 700 mb but with a slightly stronger thermal ridge into northeast Montana. Likewise a thermal trough is observed from northeast Alberta southward into Arizona. This thermal configuration causes neither warm nor cold temperature advection for north central Wyoming.
The 300-mb composite jet stream axis (Fig. 8) extends around the base of the trough from the Pacific northwest coast through the southern Rockies and into the upper Mississippi Valley. As a result, this ensures that Wyoming remains on the favorable cyclonic side of the jet stream with relatively light wind speeds.
h. Synoptic pattern II, meridional northerly flow While Pattern I reveals a well developed, strongly dynamic
low pressure system, Pattern II composites show a highly amplified height/thermal field, with northerly flow at all levels over the Big Horns from 700 mb upward (Figs. 9-11). Composite maps fail to identify any small-scale short-wave troughs or ridges that might be evident in the nearly meridional flow. However, as with Pattern I, strong northerly flow into the Big Horns suggests upslope forcing more than compensates for the inadequate synoptic lift through mechanical means . Mechanical lift over steeply sloping terrain can be one order of magnitude greater than its synoptic counterpart (Darrow and Evans 1993), which explains the high snow rates in the absence of significant synoptic-scale forcing. This flow regime is responsible for bringing some of the heaviest snowfalls to the northern Big Horns despite the very cold temperatures commonly associated with this type of pattern.
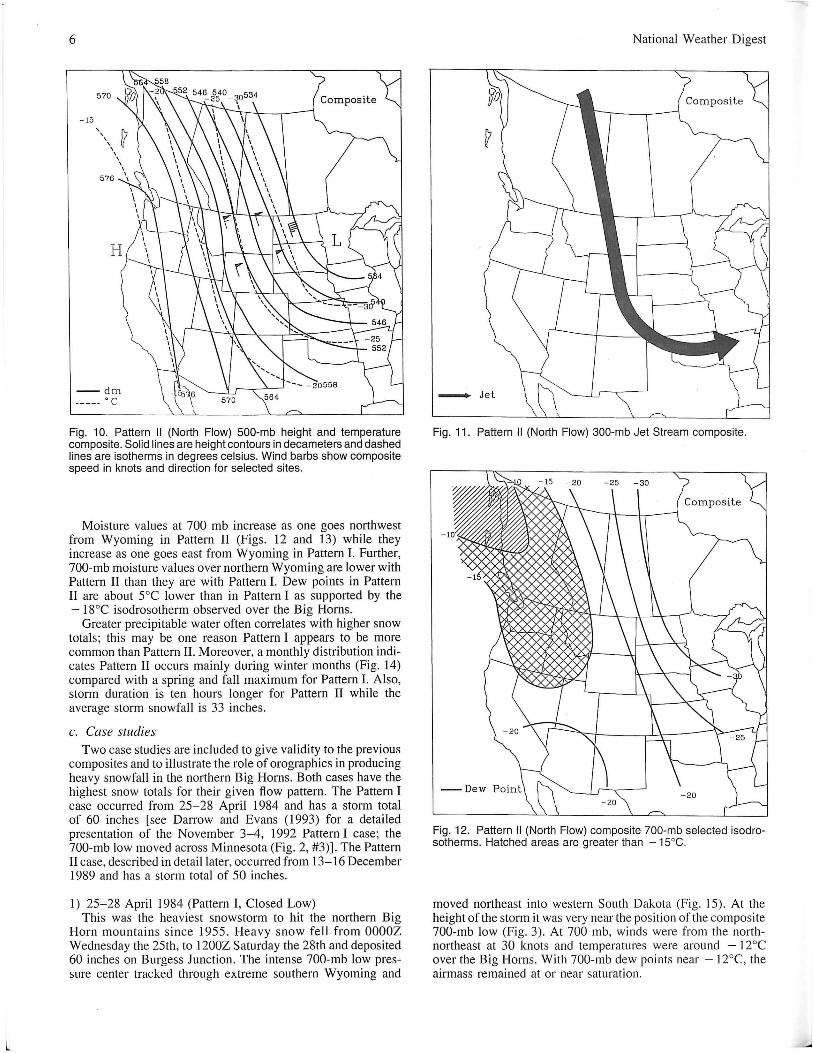
The 700-mb height composite (Fig. 9) shows strong northerly flow over much of the western United States. Lowest heights are along 95° West Longitude or in the upper Mississippi Valley region. Highest heights extend north along 130° West Longitude off the West coast. Hence composite wind speeds over north central Wyoming are 30 knots from 340° creating a strong upslope component into the Big Horns. The stronger flow in Pattern II appears to compensate for the less than ideal wind direction (i.e., the flow direction is less normal to the slopes compared with Pattern I; 340° vs. 020°).
The temperature field nearly mirrors that of the height field at 700 mb (Fig. 9); as a result, temperature advection is weak. However, temperatures are slightly colder over the Big Horns than in Pattern I as the - l2°C isotherm runs northwest-southeast over the mountains.
Dew points at 700 mb (Fig. 12) are highest (greater than - 10°e) along the West coast of British Columbia but a ridge of dew points greater than -15°C extends southeast into Idaho and western Montana. In addition, Fig. 13 indicates dew point depressions are less than 5°C upstream from northern British Columbia southeastward into extreme northern Wyoming. The driest air is noted under the trough to the east and in the southwest sections of the United States.
The 500-mb height composite (Fig. 10) is nearly identical to that at 700 mb with a trough indicated to the east and a ridge off the West coast. Composite wind speeds are 50 knots from 340° over the Big Horns.
As at 700 mb, 500-mb temperatures mirror the height field (Fig. 10) and the lowest values are east of the state with highest values along the West coast. However, Pattern II and Pattern I are opposite in their thermal structure, as Pattern II shows a thermal trough is east of the region while a thermal ridge extends off the California coast northward along the West coast of Canada. At 500 mb, temperatures over the Big Horns are near - 25°C for both Pattern II and Pattern 1.
Fig. 8. Pattern I (Closed Low) 300-mb Jet Stream composite.
303
306
309
312
o 315
315
--dm ----- . c
5
Fig. 9. Pattern II (North Flow) 700-mb height and temperature compOSite. Solid lines are height contours in decameters and dashed lines are isotherms in degrees celsius. Wind barbs show composite speed in knots and direction for selected sites.
The 300-mb composite jet stream axis (Fig. 11) runs from Alberta southward into eastern Colorado. This configuration places north central Wyoming under the strongest wind speeds aloft whereas in Pattern I wind speeds are quite light, due to the jet axis well south of the region.
L
6
570
-15
576
--dm ----- • C
Fig. 10. Pattern II (North Flow) 500-mb height and temperature cornposite. Solid lines are height contours in decameters and dashed lines are isotherms in degrees celsius. Wind barbs show composite speed in knots and direction for selected sites.
Moisture values at 700 mb increase as one goes northwest from Wyoming in Pattern II (Figs. 12 and 13) while they increase as one goes east from Wyoming in Pattern 1. Further, 700-mb moisture values over northern Wyoming are lower with Pattern II than they are with Pattern 1. Dew points in Pattern II are about 5°C lower than in Pattern I as supported by the - 18°C isodrosotherm observed over the Big Horns.
Greater precipitable water often correlates with higher snow totals; this may be one reason Pattern I appears to be more common than Pattern II. Moreover, a monthly distribution indicates Pattern II occurs mainly during winter months (Fig. 14) compared with a spring and fall maximum for Pattern 1. Also, storm duration is ten hours longer for Pattern II while the average storm snowfall is 33 inches.
c. Case studies Two case studies are included to give validity to the previous
composites and to illustrate the role of orographics in producing heavy snowfall in the northern Big Horns. Both cases have the highest snow totals for their given flow pattern. The Pattern I case occurred from 25-28 April 1984 and has a storm total of 60 inches [see Darrow and Evans (1993) for a detailed presentation of the November 3-4, 1992 Pattern I case; the 700-mb low moved across Minnesota (Fig. 2, #3)] . The Pattern II case, described in detail later, occurred from 13-16 December 1989 and has a storm total of 50 inches.
I) 25-28 April 1984 (Pattern I, Closed Low) This was the heaviest snowstorm to hit the northern Big
Horn mountains since 1955 . Heavy snow fell from OOOOZ Wednesday the 25th, to 1200Z Saturday the 28th and deposited 60 inches on Burgess Junction. The intense 700-mb low pressure center tracked through extreme southern Wyoming and
National Weather Digest
_ Jet
Fig . 11. Pattern II (North Flow) 300-mb Jet Stream composite.
Fig. 12. Pattern II (North Flow) composite 700-mb selected isodrosotherms. Hatched areas are greater than - 15°C.
moved northeast into western South Dakota (Fig. 15). At the height ofthe storm it was very near the position of the composite 700-mb low (Fig. 3). At 700 mb, winds were from the northnortheast at 30 knots and temperatures were around - 12°C over the Big Horns. With 700-mb dew points near - 12°C, the airmass remained at or near saturation.
I ~
Volume 19 Number 4 July, 1995
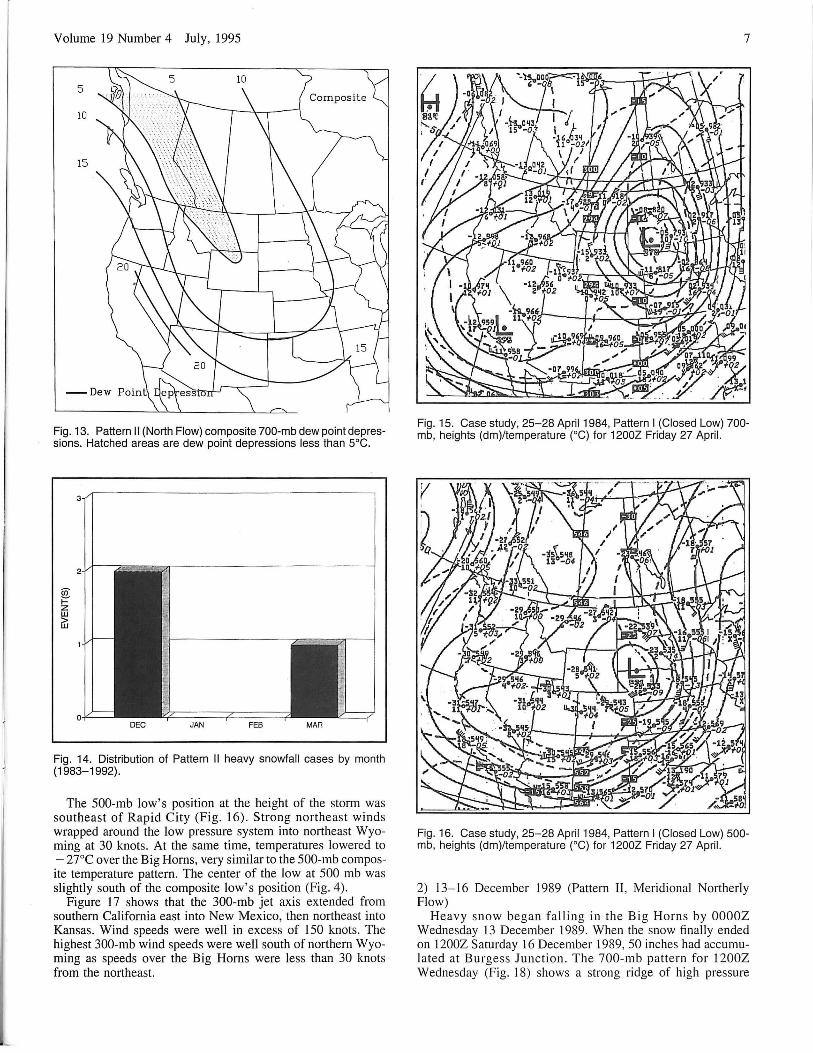
Fig. 13. Pattern II (North Flow) composite 700-mb dew point depressions. Hatched areas are dew point depressions less than 5°C.
MAR
Fig. 14. Distribution of Pattern II heavy snowfall cases by month (1983-1992).
The SOO-mb low's position at the height of the storm was southeast of Rapid City (Fig. 16). Strong northeast winds wrapped around the low pressure system into northeast Wyoming at 30 knots. At the same time, temperatures lowered to - 27°C over the Big Horns, very similar to the SOO-mb composite temperature pattern. The center of the low at 500 mb was slightly south of the composite low's position (Fig. 4) .
Figure 17 shows that the 300-mb jet axis extended from southern California east into New Mexico, then northeast into Kansas. Wind speeds were well in excess of 150 knots. The highest 300-mb wind speeds were well south of northern Wyoming as speeds over the Big Horns were less than 30 knots from the northeast.
7
Fig. 15. Case study, 25-28 April 1984, Pattern I (Closed Low) 700-mb, heights (dm)/temperature (0C) for 1200Z Friday 27 April.
Fig. 16. Case study, 25-28 April 1984, Pattern I (Closed Low) 500-mb, heights (dm)/temperature (OC) for 1200Z Friday 27 April.
2) 13-16 December 1989 (Pattern II, Meridional Northerly Flow)
Heavy snow began falling in the Big Horns by OOOOZ Wednesday 13 December 1989. When the snow finally ended on 1200Z Saturday 16 December 1989, 50 inches had accumulated at Burgess Junction. The 700-mb pattern for 1200Z Wednesday (Fig. 18) shows a strong ridge of high pressure
L
8
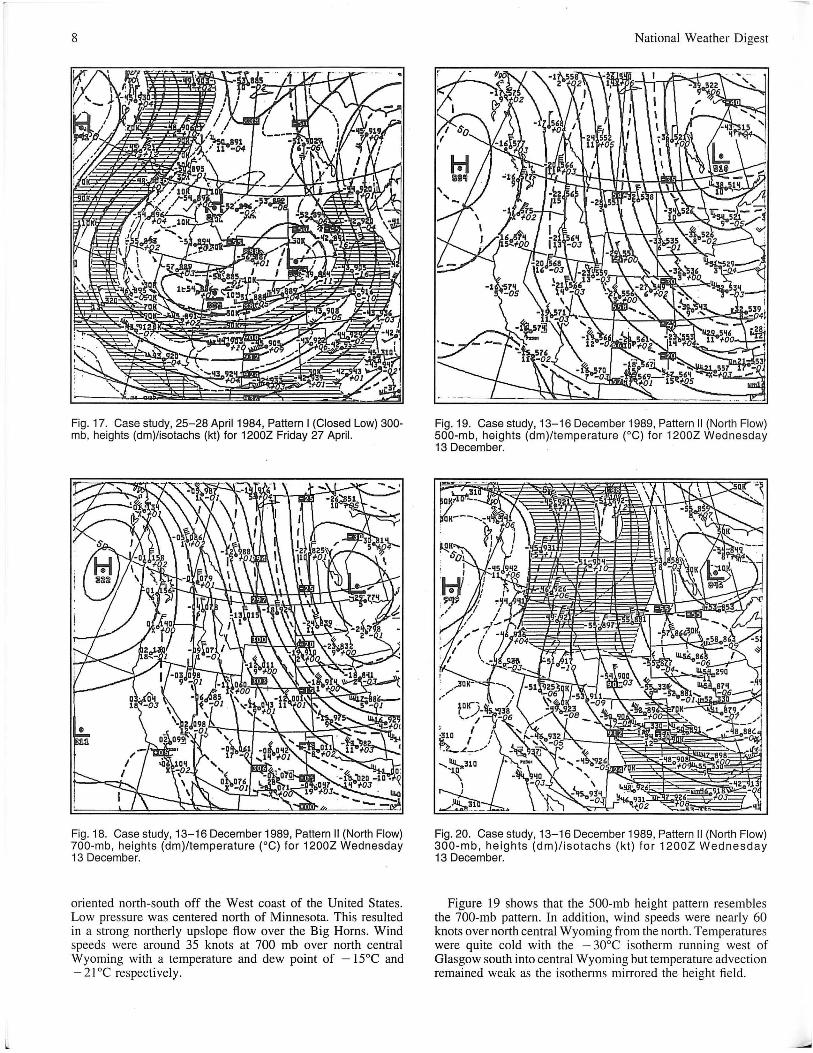
Fig. 17. Case study, 25-28 April 1984, Pattern I (Closed Low) 300-mb, heights (dm)/isotachs (kt) for 1200Z Friday 27 April.
Fig. 18. Case study, 13-16 December 1989, Pattern II (North Flow) 700-mb , heights (dm)/temperature (0C) for 1200Z Wednesday 13 December.
oriented north-south off the West coast of the United States. Low pressure was centered north of Minnesota. This resulted in a strong northerly upslope flow over the Big Horns. Wind speeds were around 35 knots at 700 mb over north central Wyoming with a temperature and dew point of -15°e and - 21 °e respectively.
National Weather Digest
Fig. 19. Case study, 13-16 December 1989, Pattern II (North Flow) 500-mb, heights (dm)/temperature (0C) for 1200Z Wednesday 13 December.
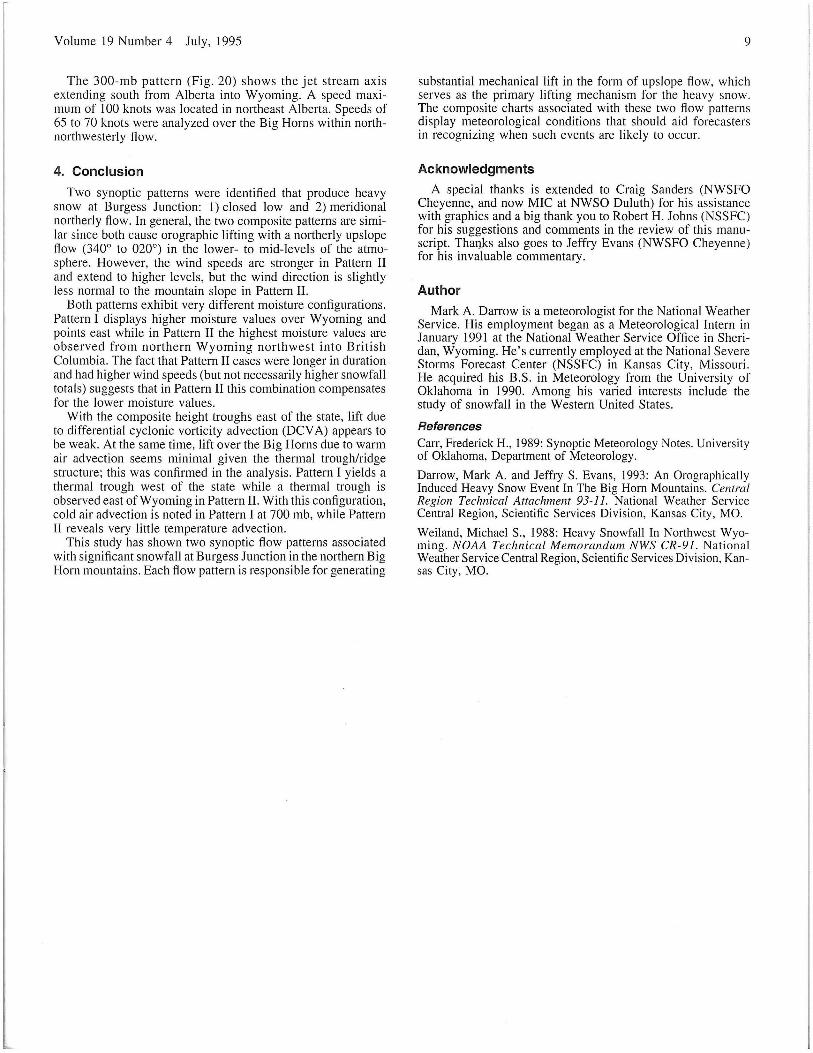
Fig. 20. Case study, 13-16 December 1989, Pattern II (North Flow) 300-mb, heights (dm)/isotachs (kt) for 1200Z Wednesday 13 December.
Figure 19 shows that the 500-mb height pattern resembles the 700-mb pattern. In addition, wind speeds were nearly 60 knots over north central Wyoming from the north . Temperatures were quite cold with the - 300 e isotherm running west of Glasgow south into central Wyoming but temperature advection remained weak as the isotherms minored the height fi eld.
Yolume 19 Number 4 July, 1995
The 300-mb pattern (Fig. 20) shows the jet stream axis extending south from Alberta into Wyoming. A speed maximum of 100 knots was located in northeast Alberta. Speeds of 65 to 70 knots were analyzed over the Big Horns within northnorthwesterly flow.
4. Conclusion
Two synoptic patterns were identified that produce heavy snow at Burgess Junction: I) closed low and 2) meridional northerly flow. In general, the two composite patterns are similar since both cause orographic lifting with a northerly upslope flow (340° to 020°) in the lower- to mid-levels of the atmosphere. However, the wind speeds are stronger in Pattern II and extend to higher levels, but the wind direction is slightly less normal to the mountain slope in Pattern II.
Both patterns exhibit very different moisture configurations. Pattern I displays higher moisture values over Wyoming and points east while in Pattern II the highest moisture values are observed from northern Wyoming northwest into British Columbia. The fact that Pattern II cases were longer in duration and had higher wind speeds (but not necessarily higher snowfall totals) suggests that in Pattern II this combination compensates for the lower moisture values.
With the composite height troughs east of the state, lift due to differential cyclonic vorticity advection (DCY A) appears to be weak. At the same time, lift over the Big Horns due to warm air advection seems minimal given the thermal trough/ridge structure; this was confirmed in the analysis. Pattern I yields a thermal trough west of the state while a thermal trough is observed east of Wyoming in Pattern II. With this configuration, cold air advection is noted in Pattern I at 700 mb, while Pattern II reveals very little temperature advection.
This study has shown two synoptic flow patterns associated with significant snowfall at Burgess Junction in the northern Big Horn mountains. Each flow pattern is responsible for generating
9
substantial mechanical lift in the form of upslope flow, which serves as the primary lifting mechanism for the heavy snow. The composite charts associated with these two flow patterns display meteorological conditions that should aid forecasters in recognizing when such events are likely to occur.
Acknowledgments
A special thanks is extended to Craig Sanders (NWSFO Cheyenne, and now MIC at NWSO Duluth) for his assistance with graphics and a big thank you to Robert H. Johns (NSSFC) for his suggestions and comments in the review of this manuscript. Thal).ks also goes to Jeffry Evans (NWSFO Cheyenne) for his invaluable commentary.
Author
Mark A. Dan'ow is a meteorologist for the National Weather Service. His employment began as a Meteorological Intern in January 1991 at the National Weather Service Office in Sheridan, Wyoming. He's currently employed at the National Severe Storms Forecast Center (NSSFC) in Kansas City, Missouri. He acquired his B.S. in Meteorology from the University of Oklahoma in 1990. Among his varied interests include the study of snowfall in the Western United States.
References Can, Frederick H., 1989: Synoptic Meteorology Notes. University of Oklahoma, Department of Meteorology.
Darrow, Mark A. and Jeffry S. Evans, 1993: An Orographically Induced Heavy Snow Event In The Big Horn Mountains. Central Region Technical Attachment 93-11. National Weather Service Central Region, Scientific Services Division, Kansas City, MO.
Weiland, Michael S., 1988: Heavy Snowfall In Northwest Wyoming. NOAA Technical Memorandum NWS CR-91. National Weather Service Central Region, Scientific Services Division, Kansas City, MO.