Embed Size (px)
Citation preview
A COMPARISONOF PROCEDURESFORINCREASINGBLOODFLOWTOLIMBS USINGAN IMPROVEDOPTICAL PLETHYSMOGRAPH
By G. W. WRIGHTAND KENTONPHELPS
(From the Departments of Physiology and Surgery of Western Reserve UniversityMedical School, Cleveland)
(Received for publication September 11, 1939)
Measuring the minute volume of blood flowthrough an extremity at rest, or in response toa physiological stimulus, offers a useful means ofevaluating the status of its vascular bed. Hew-lett and Van Zwaluwenburg (1) used for thispurpose a plethysmograph based upon the prin-ciple demonstrated by Brodie (2) wherein suddenocclusion of the veins draining the limb producesan increase in limb size, which can be used as ameasure of arterial inflow. If a limb is enclosedin a rigid container the increase in volume canbe recorded in a variety of ways. Hewlett andVan Zwaluwenburg (3) used air conduction andoptical recording; more recently others have usedwater or water and air conduction with a Brodiebellows, Gad volume recorder, or a piston re-corder. Experience has shown us that theselatter methods have concealed errors which be-come apparent when replaced by air conductionand optical recording. These are: (a) errors incalibration due to a non-rigid closure of the openend of the plethysmograph, (b) errors due toinvoluntary movement of the extremity into andout of the plethysmograph, (c) errors producedby rising intravascular tension secondary to venousobstruction, (d) errors due to the effect of dis-placement of blood from beneath the collectingcuff. This report concerns itself with a study ofthese errors, with means of eliminating them, andwith a comparison of five procedures commonlyused to produce dilatation of the vascular bed inthe lower extremity.
APPARATUS
A modification of the Hewlett and Van Zwalu-wenburg leg plethysmograph (3) was devisedwhich has the following chief advantages: (a)greater accuracy in calculation of minute bloodflow, (b) ease and accuracy of calibration, (c)rigid, air-tight, non-constricting closure of theopen end, (d) ease of application.
The plethysmograph (Figure 1) is made of cast
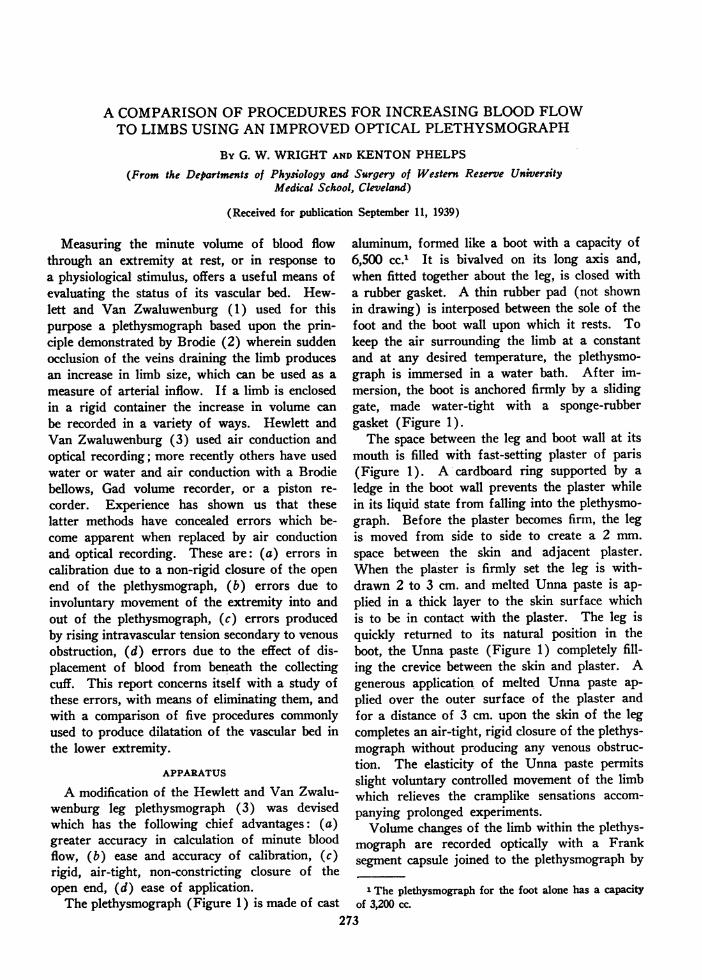
aluminum, formed like a boot with a capacity of6,500 cc." It is bivalved on its long axis and,when fitted together about the leg, is closed witha rubber gasket. A thin rubber pad (not shownin drawing) is interposed between the sole of thefoot and the boot wall upon which it rests. Tokeep the air surrounding the limb at a constantand at any desired temperature, the plethysmo-graph is immersed in a water bath. After im-mersion, the boot is anchored firmly by a slidinggate, made water-tight with a sponge-rubbergasket (Figure 1).
The space between the leg and boot wall at itsmouth is filled with fast-setting plaster of paris(Figure 1). A cardboard ring supported by aledge in the boot wall prevents the plaster whilein its liquid state from falling into the plethysmo-graph. Before the plaster becomes firm, the legis moved from side to side to create a 2 mm.space between the skin and adjacent plaster.When the plaster is firmly set the leg is with-drawn 2 to 3 cm. and melted Unna paste is ap-plied in a thick layer to the skin surface whichis to be in contact with the plaster. The leg isquickly returned to its natural position in theboot, the Unna paste (Figure 1) completely fill-ing the crevice between the skin and plaster. Agenerous application of melted Unna paste ap-plied over the outer surface of the plaster andfor a distance of 3 cm. upon the skin of the legcompletes an air-tight, rigid closure of the plethys-mograph without producing any venous obstruc-tion. The elasticity of the Unna paste permitsslight voluntary controlled movement of the limbwhich relieves the cramplike sensations accom-panying prolonged experiments.
Volume changes of the limb within the plethys-mograph are recorded optically with a Franksegment capsule joined to the plethysmograph by
1 The plethysmograph for the foot alone has a capacityof 3,200 cc.
273
G. W. WRIGHTAND KENTONPHELPS
FIG. 1. DIAGRAM OF BooT PLETHYSMOGRAPH(1) Calibrating stopcock, (2) rubber tube connecting plethysmograph with Frank segment
capsule, (3) plaster of paris seal, (4) sponge rubber gasket, (5) Unna paste seal, (6) collectingcuff.
a piece of stiff rubber tubing 15 cm. long witha bore of 1.2 cm.
Sudden obstruction to venous drainage fromthe limb is accomplished in the conventional man-ner by a blood pressure cuff (hereafter referredto as the "collecting cuff") 6 cm. in diameter(Figure 1) connected to a reservoir containingair at the desired pressure. The moment at whichthe collecting cuff is inflated is recorded by aFrank segment capsule (Figure 2).
It is necessary (for reasons to be discussedlater in the paper) to have the plethysmographopen to the atmosphere when the collecting cuffis inflated and for a period of one second there-after. This is accomplished as follows: A stop-cock is introduced in the tube connecting thepressure reservoir with the collecting cuff andanother in a side arm from the tube connectingthe plethysmograph with the Frank segment cap-sule. A solenoid actuated by a time switch op-
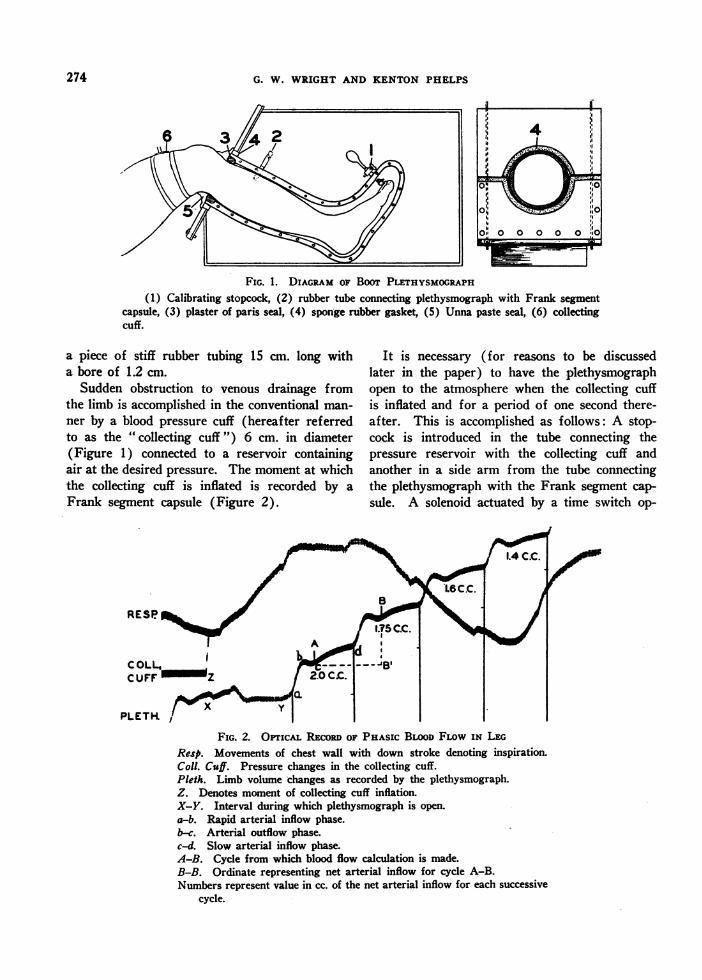
FIG. 2. OPTrIcAL REcoRD OF PHASIc BLOODFLOw IN LEGResp. Movements of chest wall with down stroke denoting inspiration.Coll. Cuff. Pressure changes in the collecting cuff.Pleth. Limb volume changes as recorded by the plethysmograph.Z. Denotes moment of collecting cuff inflation.X-Y. Interval during which plethysmograph is open.a-b. Rapid arterial inflow phase.b-c. Arterial outflow phase.c-d. Slow arterial inflow phase.A-B. Cycle from which blood flow calculation is made.B-B. Ordinate representing net arterial inflow for cycle A-B.Numbers represent value in cc. of the net arterial inflow for each successive
cycle.
274
BLOODFLOW INTO LIMBS BY OPTICAL PLETHYSMOGRAPH
erates both of these stopcocks simultaneously.When the timing switch is closed the solenoidopens both stopcocks. Thus the plethysmographis open (Figure 2X) to the atmosphere at thetime the collecting cuff is inflated. When thetiming switch opens one second later, the solenoidis released and a spring mechanism closes theplethysmograph stopcock, thus allowing the vol-ume changes of the limb to be recorded (Figure2Y).
Calibration of the plethysmograph is accom-plished by injecting or withdrawing a measuredvolume of fluid through a stopcock (Figure 1)into a small rubber bag within the plethysmograph.This must be done with the extremity in situ andwith the arterial inflow completely obstructed bypressure in the collecting cuff.
The natural frequency of the apparatus in situranges from 50 to 100 per second over such arange of sensitivity that a 1 cc. increase in thefluid content of the plethysmograph produces alight beam excursion of 2 to 10 cm. at a projec-tion distance of 1.5 meters.
Immobility of the limb inside of the plethysmo-graph is checked at the beginning of and duringeach experiment by completely occluding the ar-tery and observing whether or not any variationin the plethysmograph volume occurs synchron-ously with breathing. When involuntary move-ment of the limb into and out of the plethysmo-graph is noted, it is easily abolished by placinga wide gauze bandage across the superior marginof the patella and tying each end to the waterbath, thus anchoring the limb without producingany venous obstruction.
Respiratory excursions of the chest wall arerecorded by a Frank segment capsule connectedwith a pneumograph. The volume of the limbcontained in the plethysmograph is determined bydisplacement. Brachial arterial blood pressuredeterminations are made by a mercury manometerand auscultation immediately after each measure-ment of blood flow.
EXPERIMENTALPROCEDURE
For these studies the subject lies upon his back in aGatch bed with the hip and knee flexed about 350 and thehead and shoulders slightly elevated, thus bringing theheart and the extremity being measured approximately tothe same level. This position is chosen because it pre-
vents the development of hi-h venous pressure in the limband is known to be the posit..n best tolerated with com-fort over a period of several hours. To obtain standardexperimental conditions, the following requirements areobserved: (a) severe exercise is prohibited for 24 hoursprior to a Atudy, (b) smoking is not allowed within thehour preceding and during a study, (c) unnecessary talk-ing and other disturbing influences are avoided during theobservation, (d) studies are begun 3 to 4 hours after thelast meal, (e) the subject, clad in trunks, reclines quietlyfor 45 minutes in a room kept at a constant temperaturebetween 28 and 300 before being studied, (f) a lapse of30 minutes is allowed after completing the application ofthe boot plethysmograph before records are taken. Thisallows the flow of blood to assume a constant level andthe heat in the setting plaster and melted Unna paste todissipate.
METHODOF CALCULATINGBLOODFLOW
A typical record is shown in Figure 2. The uppercurve denotes respiratory excursions of the chest wall,inspiration being represented as a down stroke. Themoment of inflation of the collecting cuff is signalled bythe sharp rise (Z) of the second curve. The lower curve(time marker equals .04 seconds) is a 'record of the va-riations in volume of the limb contained in the plethysmo-graph. It is noted that with each pulse there is a rapidincrease in limb volume (a-b) followed by a small de-crease (b-c), after which there is a gradual further in-crease (c-d). In terms of blood flow each pulse showsan initial large inflow followed by a small outflow whichin turn is followed by a gradual inflow of blood. Actuallyeach pulse (Figure 2, a-d) represents a net inflow ofarterial blood. That portion of the cycle (b-c) repre-senting outflow merits more detailed discussion later.
It is apparent from these variations during a singlepulse that the net inflow (a single complete cycle) is thesmallest unit that can be used for measuring blood flow.Methods using the gradient of any portion of a cycle forcalculating blood flow are distinctly in error. As thecurve rises, each successive beat forces a smaller net vol-ume of blood into the leg because of rising venous re-sistance. In this curve (Figure 2) the net flow per suc-cessive beat is 2.0, 1.75, 1.6, 1.4 cc. This fact introducesan error in all procedures using the volume of severalsuccessive beats to calculate minute blood flow. To avoidthe error introduced by a rising venous resistance, thefirst complete cycle following inflation of the collectingcuff should be used as the unit most nearly representingtrue arterial inflow. Use of this cycle, however, is com-plicated by the fact that the collecting cuff as it is in-flated squeezes an appreciable volume of blood from thevessels underlying it into the tissues contained in theplethysmograph The effect of the displaced blood onthe limb volume cannot be differentiated by the plethysmo-graph from the effect of normal arterial inflow. Opticalrecording methods also show that this effect cannot beavoided by varying the size or distances of the collectingcuff from the plethysmograph as has been supposed by
275
G. W. WRIGHTAND KENTONPHELPS
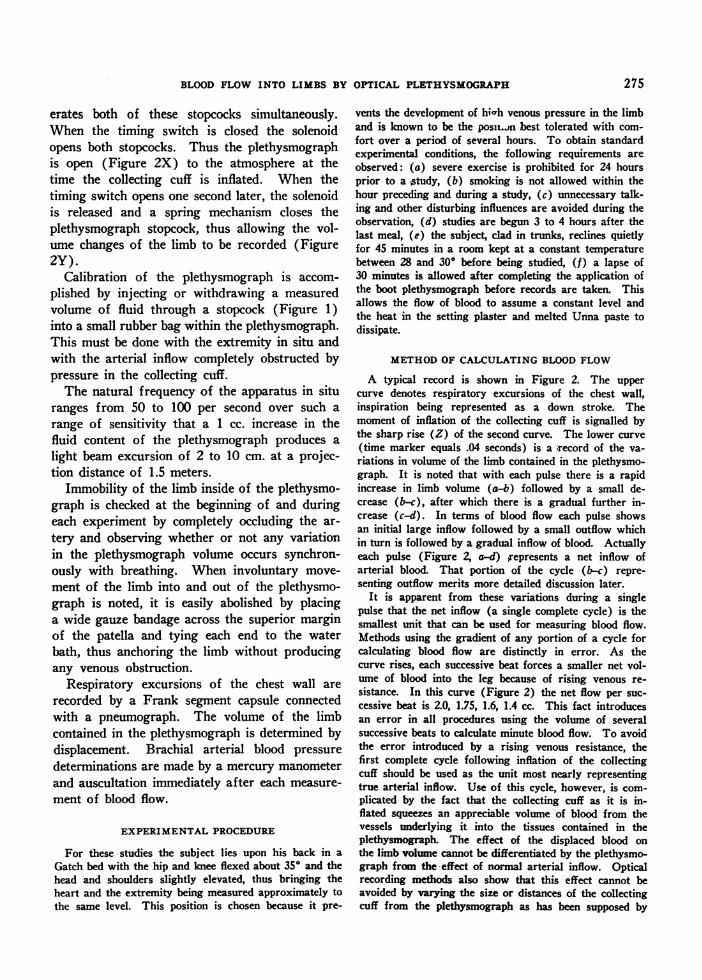
investigators using less sensitive, low frequency apparatus.Since this action of the collecting cuff cannot be pre-vented, the first cycle following the termination of itseffect becomes the earliest available cycle for measuringblood flow. The time required to complete the displace-ment of blood from beneath the collecting cuff is deter-mined by completely occluding the arterial inflow to theleg with an inflated cuff on the mid-thigh and then in-flating the collecting cuff in its usual position with apressure of 80 mm. of mercury. The increase in limbvolume within the plethysmograph (Figure 3, A-B) re-
III
olAI
B
7.0 .0.
FIG. 3. DISPLACEMENT OF FLUID FROM BENEATHCOLLECTING CUFF
A-B. Magnitude of and time required for displace-ment of fluid from beneath collecting cuff.
sulting from displacement of fluid by the collecting cuff,even when of large magnitude, never requires more than1.2 seconds. Consequently, the undesirable effect of thecollecting cuff can be circumvented by measuring theincrease in limb volume for one pulse cycle beginning at a
point (Figure 2-A) 1.6 seconds after inflating the col-lecting cuff, regardless of the place in the cycle at whichthis point falls. In order to nullify the error that mightbe introduced by a sinus arrhythmia, the duration of thiscycle (Figure 2, A-B) must be equal to the average ofseveral cycles recorded during the flow measurementThe ordinate value B-B1 representing the net arterial in-flow for one cycle is converted to cubic cm. and the netarterial blood flow is expressed in the conventional man-
ner of cc. per 100 cc. limb substance per minute.The sudden increase in limb volume produced by the
massaging action of the collecting cuff is not recorded(Figure 2, X-Y) by the simple expedient of having theplethysmograph open to the atmosphere during the time
this event occurs. This is accomplished by the apparatusdescribed earlier.
In addition to errors resulting from inadequate ap-paratus, imperfections in technique may be introduced byvariations in the individual being studied. Observationsshow that records taken more frequently than every 2minutes result in progressively smaller blood flows. Ap-parently sufficient time (2 minutes) must be allowed aftereach test for the accumulated blood to leave the tissuesin order to restore normal dynamic conditions.
TABLE I
Constancy of leg-foot blood flows taken at 2-minute intervals
Bod Room Bath Boot Oral CfTime Blood Blood Heart temr- ter- term- term- CpuffTieflow pures rate pera- pera pera pera puresflowsure ae tture ture ture ture sure
9:36 8.0 104/66 71 28 45 43 37 809:38 7.4 104/66 65 28 45 43 37 809:40 7.6 104/66 73 28 45 43 37 809:42 7.4 104/66 71 28 45 43 37 809:44 7.9 104/66 71 28 45 43 37 80
Blood flow is expressed in cc. per minute per 100 cc. legtissue.
Blood pressure and cuff pressure are expressed in mm.of mercury.
All temperatures are expressed in degrees centigrade.
TABLE II
Effect of blood pressure upon blood flow
Blood Room Bath Boot OralTime Blood pres- Heart tem- tem- tem- tem- CuffTflow pure ramte pera- pera- pemr- pera- sresue ture ture ture ture sr
11:001 1:0311:12
6.76.66.8
116/70116/70116/70
695758
282828
282828
282828
373737
757575
HANDSIMMERSEDIN WATERAT 11 DEGREESCENTIGRADEFOR 5 MINUTES
11:201 8.4 130/82 68 28 28 28 37 75
It scarcely seems necessary to point out the absolutenecessity of blood pressure observations for interpretingvariations in blood flow. Nevertheless there is a con-spicuous absence of such data in published reports con-cerning this subject. Table II shows the influence ofblood pressure change upon the blood flow in the foot.It is apparent also from the contour of the phasic flowthat if the heart rate is increased, even though there beno change in systolic or diastolic pressure, there may bean increase in the peripheral blood flow since it is thelatter part of the cycle that is shortened.
Table III shows that the pressure in the collecting cuffcan vary over a wide range with but little variation in therecorded blood flow.
I I----m_
__w
276
BLOODFLOWINTO LIMBS BY OPTICAL PLETHYSMOGRAPH
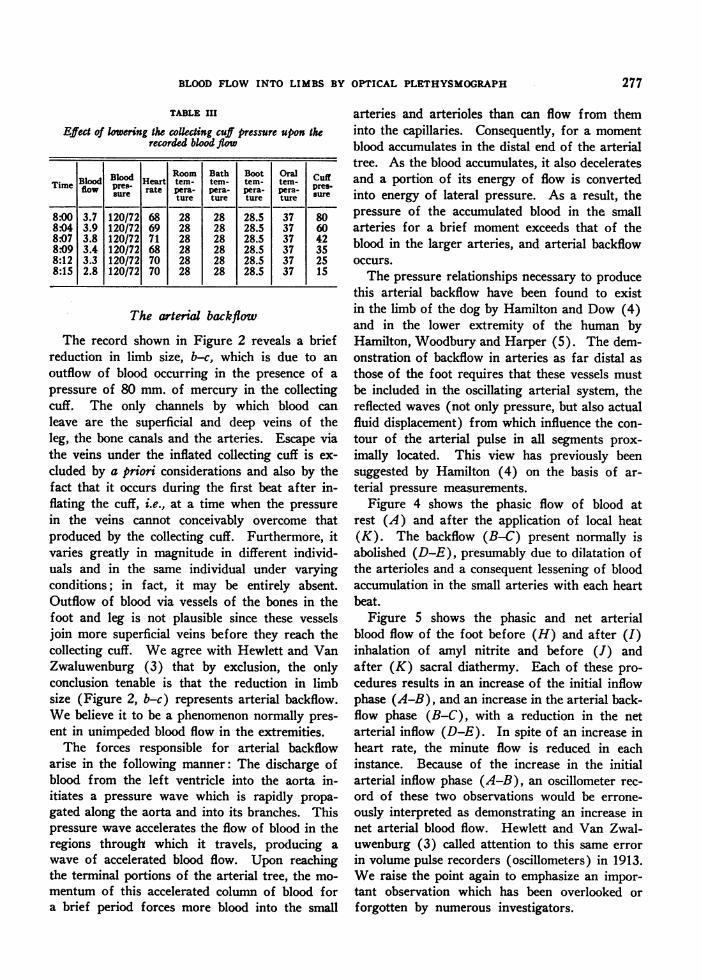
TABLE III
Effect of lowering the colklting cuff pressure upon therecorded blood flow
Blood Room Bath Boot OralTime Blood Heart temr- tern- tern- tem-pflowPwe- rte em pe pema pera-
sue ture ture ture ture sr
8:00 3.7 120/72 68 28 28 28.5 37 808:04 3.9 120/72 69 28 28 28.5 37 608:07 3.8 120/72 71 28 28 28.5 37 428:09 3.4 120/72 68 28 28 28.5 37 358:12 3.3 120/72 70 28 28 28.5 37 258:15 2.8 120/72 70 28 28 28.5 37 15
The arterial backflowThe record shown in Figure 2 reveals a brief
reduction in limb size, b-c, which is due to an
outflow of blood occurring in the presence of a
pressure of 80 mm. of mercury in the collectingcuff. The only channels by which blood can
leave are the superficial and deep veins of theleg, the bone canals and the arteries. Escape viathe veins under the inflated collecting cuff is ex-
cluded by a priori considerations and also by thefact that it occurs during the first beat after in-flating the cuff, i.e., at a time when the pressurein the veins cannot conceivably overcome thatproduced by the collecting cuff. Furthermore, itvaries greatly in magnitude in different individ-uals and in the same individual under varyingconditions; in fact, it may be entirely absent.Outflow of blood via vessels of the bones in thefoot and leg is not plausible since these vesselsjoin more superficial veins before they reach thecollecting cuff. Weagree with Hewlett and VanZwaluwenburg (3) that by exclusion, the onlyconclusion tenable is that the reduction in limbsize (Figure 2, b-c) represents arterial backflow.Webelieve it to be a phenomenon normally pres-ent in unimpeded blood flow in the extremities.
The forces responsible for arterial backflowarise in the following manner: The discharge ofblood from the left ventricle into the aorta in-itiates a pressure wave which is rapidly propa-
gated along the aorta and into its branches. Thispressure wave accelerates the flow of blood in theregions through which it travels, producing a
wave of accelerated blood flow. Upon reachingthe terminal portions of the arterial tree, the mo-
mentum of this accelerated column of blood fora brief period forces more blood into the small
arteries and arterioles than can flow from theminto the capillaries. Consequently, for a momentblood accumulates -in the distal end of the arterialtree. As the blood accumulates, it also deceleratesand a portion of its energy of flow is convertedinto energy of lateral pressure. As a result, thepressure of the accumulated blood in the smallarteries for a brief moment exceeds that of theblood in the larger arteries, and arterial backflowoccurs.
The pressure relationships necessary to producethis arterial backflow have been found to existin the limb of the dog by Hamilton and Dow (4)and in the lower extremity of the human byHamilton, Woodbury and Harper (5). The dem-onstration of backflow in arteries as far distal asthose of the foot requires that these vessels mustbe included in the oscillating arterial system, thereflected waves (not only pressure, but also actualfluid displacement) from which influence the con-tour of the arterial pulse in all segments prox-imally located. This view has previously beensuggested by Hamilton (4) on the basis of ar-terial pressure measurements.
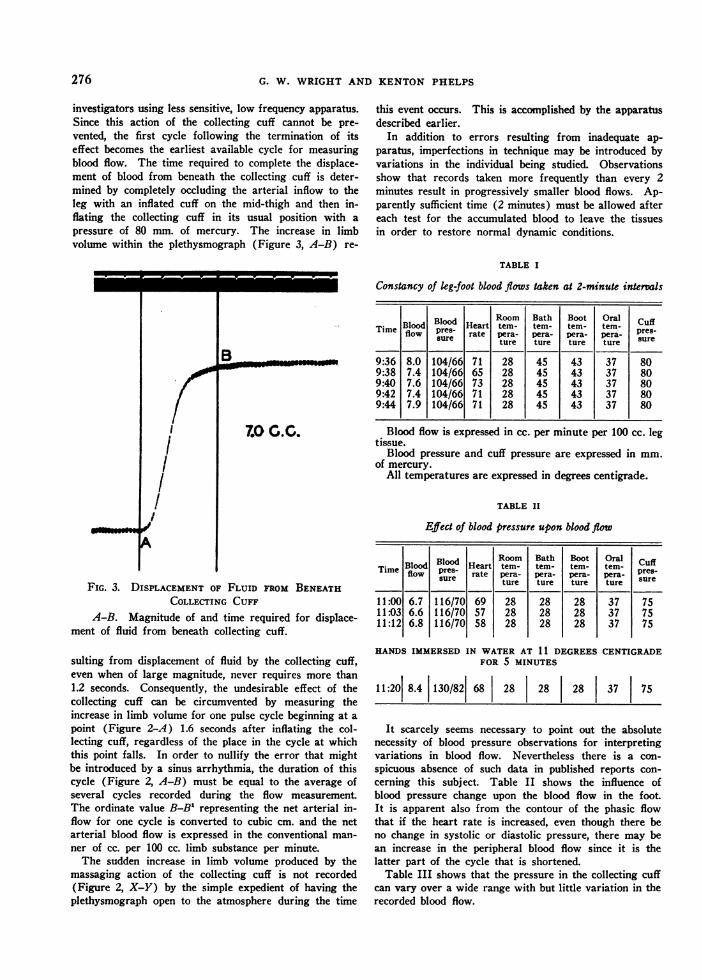
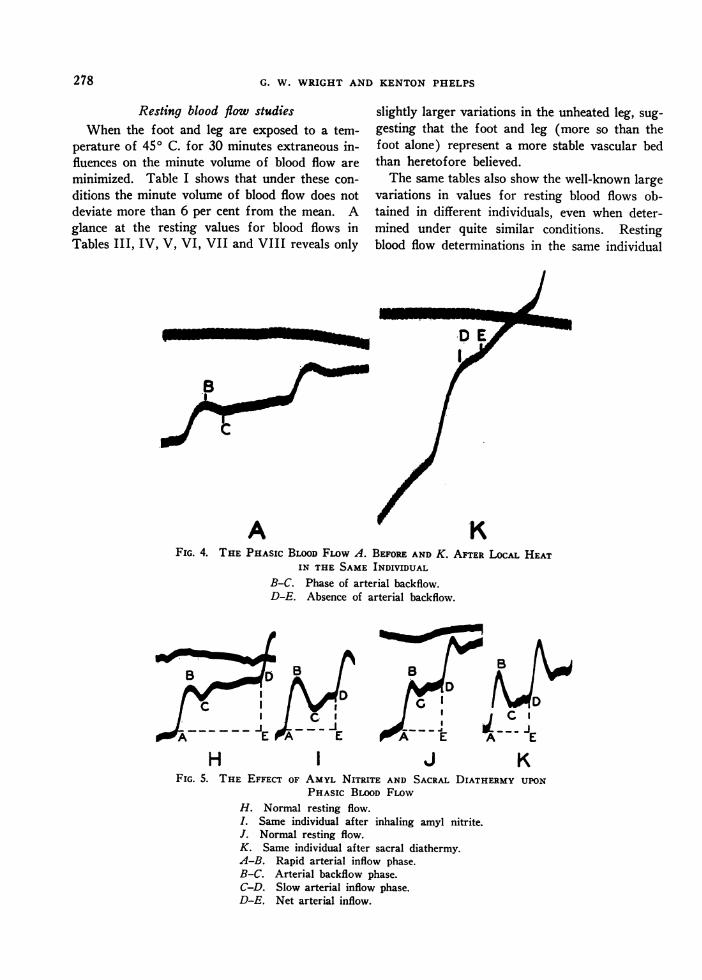
Figure 4 shows the phasic flow of blood atrest (A) and after the application of local heat(K). The backflow (B-C) present normally isabolished (D-E), presumably due to dilatation ofthe arterioles and a consequent lessening of bloodaccumulation in the small arteries with each heartbeat.
Figure 5 shows the phasic and net arterialblood flow of the foot before (H) and after (I)inhalation of amyl nitrite and before (J) andafter (K) sacral diathermy. Each of these pro-cedures results in an increase of the initial inflowphase (A-B), and an increase in the arterial back-flow phase (B-C), with a reduction in the netarterial inflow (D-E). In spite of an increase inheart rate, the minute flow is reduced in eachinstance. Because of the increase in the initialarterial inflow phase (A-B), an oscillometer rec-ord of these two observations would be errone-ously interpreted as demonstrating an increase innet arterial blood flow. Hewlett and Van Zwal-uwenburg (3) called attention to this same errorin volume pulse recorders (oscillometers) in 1913.Weraise the point again to emphasize an impor-tant observation which has been overlooked orforgotten by numerous investigators.
277
G. W. WRIGHTAND KENTONPHELPS
Resting blood flow studiesWhen the foot and leg are exposed to a tem-
perature of 450 C. for 30 minutes extraneous in-fluences on the minute volume of blood flow areminimized. Table I shows that under these con-ditions the minute volume of blood flow does notdeviate more than 6 per cent from the mean. Aglance at the resting values for blood flows inTables III, IV, V, VI, VII and VIII reveals only
slightly larger variations in the unheated leg, sug-gesting that the foot and leg (more so than thefoot alone) represent a more stable vascular bedthan heretofore believed.
The same tables also show the well-known largevariations in values for resting blood flows ob-tained in different individuals, even when deter-mined under quite similar conditions. Restingblood flow determinations in the same individual
A r KFIG. 4. THE PHAsIc BLOODFLOw A. BEFOREAND K. AFTER LOcAL HEAT
IN THE SAME INDIVIDUALB-C. Phase of arterial backflow.D-E. Absence of arterial backflow.
c I G sI-
E AE- -.
t--EC I
AE
H I J KFIG. 5. THE EFFECT OF AMYL NITRITE AND SACRAL DIATHERMY UPON
PHASIc BLOOD FLOWH. Normal resting flow.I. Same individual after inhaling amyl nitrite.J. Normal resting flow.K. Same individual after sacral diathermy.A-B. Rapid arterial inflow phase.B-C. Arterial backflow phase.C-D. Slow arterial inflow phase.D-E. Net arterial inflow.
278
BLOODFLOW INTO LIMBS BY OPTICAL PLETHYSMOGRAPH
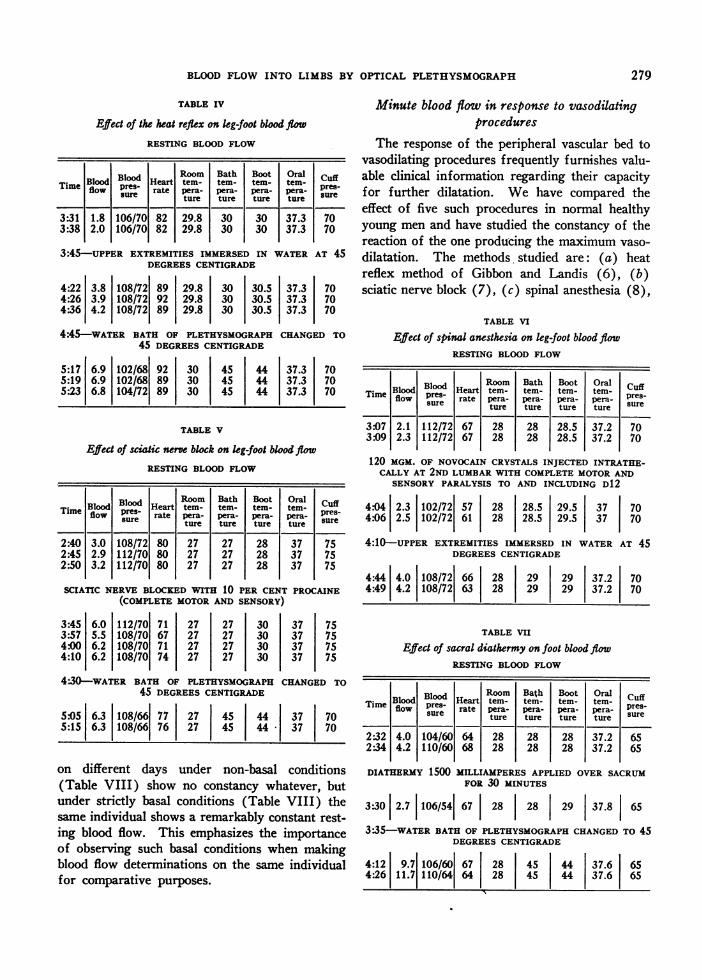
TABLE IV
Effect of the heat reflex on kg-foot blood flow
RESTING BLOODFLOW
BdBlood HRoom Bath Boot Oral cufTimeBlood presd Heart tem - temr- tem- tem-Time sure rate pera- perre-pe- Pera- su-sue ture ture tur ture sr
3:31 1.8 106/70 82 29.8 30 30 37.3 703:38 2.0 106/70 82 29.8 30 30 37.3 70
3:45-UPPER EXTREMITIES IMMERSED IN WATERAT 45DEGREESCENTIGRADE
4:22 3.8 108/72 89 29.8 30 30.5 37.3 704:26 3.9 108/72 92 29.8 30 30.5 37.3 704:36 4.2 108/72 89 29.8 30 30.5 37.3 70
4:45-WATER BATH OF PLETHYSMOGRAPHCHANGEDTO45 DEGREESCENTIGRADE
5:17 6.9 102/68 92 30 45 44 37.3 705:19 6.9 102/68 89 30 45 44 37.3 705:23 6.8 104/72 89 30 45 j 44 37.3 70
TABLE V
Efect of sciatic nerve block on leg-foot blood flowRESTING BLOODFLOW
BodBloodHer Room Bath Boot Oral cuffTime Blowd B10 Hearte tem- tem- tern- tem- presflow supres rate !pera- pera- pera- pera- sureture 1-ture Iture 1-tureIsr2:40 3.0 108/72 80 27 27 28 37 752:45 2.9 112/70 80 27 27 28 37 752:50 3.2 112/70 80 27 27 28 37 75
SCIATIC NERVE BLOCKEDWITH 10 PER CENT PROCAINE(COMPLETEMOTORAND SENSORY)
3:45 6.0 112/70 71 27 27 30 37 753:57 5.5 108/70 67 27 27 30 37 754:00 6.2 108/70 71 27 27 30 37 754:10 6.2 108/70 74 27 27 30 37 75
4-30-WATER BATH OF PLETHYSMOGRAPHCHANGEDTO45 DEGREESCENTIGRADE
5:05 6.3 108/66 77 27 45 44 37 705:15 6.3 108/66 76 27 45 44- 37 70
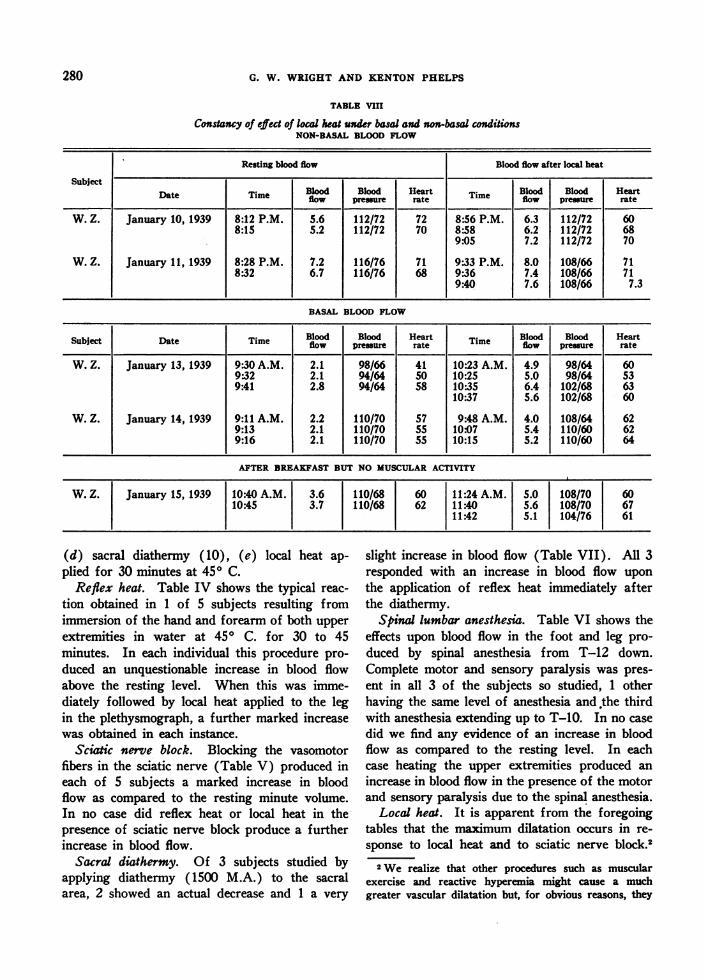
on different days under non-basal conditions(Table VIII) show no constancy whatever, butunder strictly basal conditions (Table VIII) thesame individual shows a remarkably constant rest-ing blood flow. This emphasizes the importanceof observing such basal conditions when makingblood flow determinations on the same individualfor comparative purposes.
Minute blood flow in response to vasodilatingprocedures
The response of the peripheral vascular bed tovasodilating procedures frequently furnishes valu-able clinical information regarding their capacityfor further dilatation. We have compared theeffect of five such procedures in normal healthyyoung men and have studied the constancy of thereaction of the one producing the maximum vaso-
dilatation. The methods studied are: (a) heatreflex method of Gibbon and Landis (6), (b)sciatic nerve block (7), (c) spinal anesthesia (8),
TABLE VI
Effect of spinal anesthesia on leg-foot blood flowRESTING BLOODFLOW
Room Bath Boot Oral CuffTime Blood Blood Heart temr- temr- temr- temr- uffflow sure rate pera- pemr- pera- pera- presue ture ture ture ture sr
3:07 2.1 112/72 67 28 28 28.5 37.2 703:09 2.3 112/72 67 28 28 28.5 37.2 70
120 MGM. OF NOVOCAINCRYSTALS INJECTED INTRATHE-CALLY AT 2ND LUMBARWITH COMPLETEMOTORAND
SENSORYPARALYSIS TO AND INCLUDING D12
4:04 2.3 102/72 57 28 28.5 29.5 37 704:06 2.5 102/72 61 28 28.5 29.5 37 70
4:10-UPPER EXTREMITIES IMMERSED IN WATERAT 45DEGREESCENTIGRADE
4:44 4.0 108/72 66 28 29 29 37.2 704:49 4.2 108/72 63 28 29 29 37.2 70
TABLE VII
Effect of sacral diathermy on foot blood flowRESTING BLOODFLOW
Bod Room Bath Boot Oral cuffTim Blood Blood Heart tem- tem- tern- term-
preT flow sures- rate pera- pera- pera- pera- spres-se tueture ture ture sur
2:32 4.0 104/60 64 28 28 28 37.2 652:34 4.2 110/60 68 28 28 28 37.2 65
DIATHERMY 1500 MILLIAMPERES APPLIED OVER SACRUMFOR 30 MINUTES
3:30 2.7 106/54 67 28 28 29 37.8 65
3:35-WATER BATH OF PLETHYSMOGRAPHCHANGEDTO 45DEGREESCENTIGRADE
4:12 9.7 106/60 67 28 45 44 37.6 654:26 11.7 110/64 64 28 45 44 37.6 65
279
G. W. WRIGHTAND KENTONPHELPS
TABLE VIII
Constancy of effect of local heat under basal and non-basa conditionsNON-BASAL BLOODFLOW
Resting blood flow Blood flow after local heat
SubjectDate Time Blood Blood Heart T- Blood Blood HeartDate Time flow preure rate Tme flow pressure rate
W. Z. January 10, 1939 8:12 P.M. 5.6 112/72 72 8:56 P.M. 6.3 112/72 608:15 5.2 112/72 70 8:58 6.2 112/72 68
9.05 7.2 112/72 70
W. Z. January 11, 1939 8:28 P.M. 7.2 116/76 71 9:33 P.M. 8.0 108/66 718:32 6.7 116/76 68 9:36 7.4 108/66 71
9:40 7.6 108/66 7.3
BASAL BLOODFLOW
Subject Date Time flow Brssr Hrte Blood Blood HeartBlood Bloodur Heat Tie flow pressure rate
W. Z. January 13, 1939 9.30 A.M. 2.1 98/66 41 10:23 A.M. 4.9 98/64 609:32 2.1 94/64 50 10:25 5.0 98/64 539:41 2.8 94/64 58 10:35 6.4 102/68 63
10:37 5.6 102/68 60
W. Z. January 14, 1939 9:11 A.M. 2.2 110/70 57 9:48 A.M. 4.0 108/64 629:13 2.1 110/70 55 10:07 5.4 110/60 629:16 2.1 110/70 55 10:15 5.2 110/60 64
AFTER BREAKFASTBUT NO MUSCULARACTIVITY
W. Z. January 15, 1939 10:40 A.M. 3.6 110/68 60 11:24 A.M. 5.0 108/70 6010:45 3.7 110/68 62 11:40 5.6 108/70 67
11:42 S.1 104/76 61
(d) sacral diathermy ( 10), (e) local heat ap-plied for 30 minutes at 450 C.
Reflex heat. Table IV shows the typical reac-tion obtained in 1 of 5 subjects resulting fromimmersion of the hand and forearm of both upperextremities in water at 450 C. for 30 to 45minutes. In each individual this procedure pro-duced an unquestionable increase in blood flowabove the resting level. When this was imme-diately followed by local heat applied to the legin the plethysmograph, a further marked increasewas obtained in each instance.
Sciatic nerve block. Blocking the vasomotorfibers in the sciatic nerve (Table V) produced ineach of 5 subjects a marked increase in bloodflow as compared to the resting minute volume.In no case did reflex heat or local heat in thepresence of sciatic nerve block produce a furtherincrease in blood flow.
Sacral diathermy. Of 3 subjects studied byapplying diathermy ( 1500 M.A.) to the sacralarea, 2 showed an actual decrease and 1 a very
slight increase in blood flow (Table VII). All 3responded with an increase in blood flow uponthe application of reflex heat immediately afterthe diathermy.
Spinal lumbar anesthesia. Table VI shows theeffects upon blood flow in the foot and leg pro-duced by spinal anesthesia from T-12 down.Complete motor and sensory paralysis was pres-ent in all 3 of the subjects so studied, 1 otherhaving the same level of anesthesia and,the thirdwith anesthesia extending up to T-10. In no casedid we find any evidence of an increase in bloodflow as compared to the resting level. In eachcase heating the upper extremities produced anincrease in blood flow in the presence of the motorand sensory paralysis due to the spinal anesthesia.
Local heat. It is apparent from the foregoingtables that the maximum dilatation occurs in re-sponse to local heat and to sciatic nerve block.2
2We realize that other procedures such as muscularexercise and reactive hyperemia might cause a muchgreater vascular dilatation but, for obvious reasons, they
280
BLOODFLOW INTO LIMBS BY OPTICAL PLETHYSMOGRAPH
In the 5 subjects studied, our observations showthat local heat and sciatic nerve block, when ap-plied separately, yield the same blood flow re-sponse per individual within narrow limits, pro-viding the conditions under which the measure-ments are done are comparable.
If local heat is to be used as the stimulatingagent, the constancy of its response must beknown. A series of studies on the same individual(Table VIII) shows that, under non-basal con-ditions after a day of ordinary activity, the re-sponse to local heating is fairly constant. Thisequality of response, however, is conditioned byone very important observation, as shown in TableVIII. The same subject was studied on 2 daysunder strictly basal conditions and on the thirdday under basal conditions so far as activity wasconcerned, but following the ingestion of a lightmeal. On all 3 days the response to local heatwas in very close agreement but of significantlyless magnitude than after a day of muscular ac-tivity. Apparently, muscular activity conditionsthe response of the peripheral vascular bed to thestimulus of local heat. Studies made upon thesame individual on different days for comparativepurposes must take this into account. It is prefer-able to do all measurements under strictly basalconditions.
DISCUSSION OF RESULTS OF DILATING PROCEDURES
Weconclude that local heat for 30 to 45 min-utes at 450 C. can be substituted to advantage forthe somewhat more formidable procedure ofsciatic nerve block to produce maximal peripheralvascular dilatation, at least in normal individuals.The application of this conclusion to diseased vas-cular beds remains to be tested. It is conceivablethat vessels which are damaged or under the con-trol of an abnormal autonomic nervous systemmay not have the same response to local heat asthose in normal individuals. We also noted thatthe blood pressure and heart rate fluctuate morein response to local heat than to sciatic nerve block.
Our results with spinal anesthesia appear tobe at variance with those of Morton and Scott
would not be suitable agents for studying diseased vas-cular beds. Moreover, the blood pressure and heart ratechanges accompanying exercise and the difficulty of con-trolling the amount and rate of work done would seriouslycomplicate the interpretation of the results obtained.
(8) and of Brill and Lawrence (9) who reportan increase in blood flow in the foot under simi-lar conditions of spinal anesthesia. An elevationof foot skin temperature was used by them as ameasure of increase in blood flow. A possibleexplanation of our differences might be found inthe fact that their subjects were studied in aroom with a temperature much lower than oursso that the blood flow of their subjects would beexpected to be much less than that of our subjectsat the beginning of the experiment. In fact, theskin temperature of our subjects was 31 to 320 C.on the dorsum of the foot at the beginning ofour experiments, a skin temperature virtuallyequal to that obtained in the subjects of Mortonand Scott (8) after spinal anesthesia. For thisreason, it appears possible that our subjects atrest before spinal anesthesia had blood flows es-sentially as great as the subjects of Morton andScott after spinal anesthesia. Such evidence im-plies that spinal anesthesia does not give completevasomotor nerve block. This implication findssupport in the fact that reflex heat produces anincrease in blood flow in the presence of com-plete skeletal motor and sensory anesthesia. Sincespinal anesthesia does not produce an increase inblood flow equal to that resulting from sciaticnerve block, and since reflex heat is effective inthe presence of spinal anesthesia, it is reasonableto assume that at least a part of the fibers mediat-ing vasomotor impulses to the lower extremity isintact in its presence. Of the various explana-tions that might be offered for this situation, nonehave sufficient experimental evidence supportingthem to warrant their exposition.
In regard to the use of skin temperatures as ameans of studying variations in blood flow, twoobservations merit attention. Wehave measuredthe blood flow in many subjects with skin tem-peratures of 32 to 330 C., finding values of only2 cc. per 100 cc. per minute. In other words, arelatively small blood flow will sometimes main-tain a normal skin temperature. Also, 1 subjecthaving a foot skin temperature of 350 C. with ablood flow of 3 cc. per 100 cc. per minute, showeda further rise of only 10 C. (to 360 C.) whenthe blood flow increased to 10.0 cc. per 100 cc.per minute following sciatic nerve block. Theseobservations suggest that skin temperature deter-
281
G. W. WRIGHTAND KENTONPHELPS
minations mirror the changes in blood flow up toa point beyond which the blood flow may increasegreatly with but little further rise in skin tem-perature.
Our results with sacral diathermy do not sup-port those reported by de Takats (10) who basedhis evidence for an increase in blood flow throughthe foot upon skin temperature determinations.Skin temperature studies are in this particular in-stance very untrustworthy since the body tem-perature is elevated (1° C. or more) and alsosince the blood flowing to the skin of the leg maybe warmed as it flows through the pelvis via theiliac arteries. The actual decrease obtained in 2subjects may be due to dilatation of visceral vas-cular beds in the lower abdomen with a consequentshunting of blood into these areas.
SUMMARYAND CONCLUSIONS
1. Despite many advantages of the Hewlett-Van Zwaluwenburg plethysmographic method fordetermining blood flow in the limbs, this procedure-and even more its modification by subsequentworkers-has a number of hidden faults whichlead to inaccuracies in the estimation of flow underdifferent conditions. Among these are: the yield-ing diaphragm surrounding the limb and closingthe plethysmograph, displacement of fluid into theplethysmograph by inflation of the collecting cuff,and lack of sensitivity of the entire apparatus.
2. A boot plethysmograph is described whichis easy to apply and calibrate, the open end ofwhich is sealed around the leg without constric-tion by the use of plaster of paris and Unna paste,and which is comfortable for prolonged periodsof study. The apparatus is connected to a Franksegment capsule giving the entire system frequen-cies up to 100 per second.
3. To obviate the artefacts incurred throughdisplacement of fluid into the plethysmograph bythe inflated cuff, an arrangement of stopcocks isprovided by which the collecting cuff is inflatedwhile the plethysmograph and recording capsuleremain open to the atmosphere; but exactly onesecond later it is automatically closed and thevolume changes are recorded. The rise of a fullpulse beat starting exactly 1.6 seconds after in-flation is used to measure the net flow per cycle.From this the volume flow per minute per 100 cc.
of leg substance is calculated in the conventionalmanner.
4. The phasic arterial blood flow of the legrecorded in this way for normal subjects at restin a warm room (280 to 300 C.), shows threedistinct variations during each cycle: (1) a rapidsystolic forward flow, (2) a slower smaller andvariable systolic backflow, (3) a slow forwardflow during diastole. The net arterial inflow de-pends not only on 1 plus 3 but also upon theamount subtracted by 2. All of these vary underdifferent circumstances. Since only the amplitude(phase 1 above) of the pulse volume is recordedby plethysmographs or oscillometers, these meth-ods give no quantitative estimate of changes involume flow, and under some conditions they donot even show the correct directional changes.
5. The resting flow determined by our proce-dure remains constant within approximately 6per cent of the mean during repeated determina-tions within an hour. It varies greatly in differentindividuals or in the same individual from dayto day unless strictly basal conditions are observed.
6. A study of various procedures suggested forpromoting a maximal blood flow in the leg showsthat direct application of heat and sciatic nerveblock are the most efficacious. Application ofheat to both upper extremities (reflex heat) pro-duces an effect only about one-half as great. Wewere unable to detect any increase in blood flowfollowing effective spinal anesthesia or sacraldiathermy.
7. Other procedures which affect heart rate orblood pressure significantly influence blood flowin a variable manner. Amyl nitrite, for example,increases the amplitude of oscillations but. oftencauses an actual decrease in volume flow.
Wewish to thank Professor Carl J. Wiggers for hisvery helpful criticism and aid in preparing this manu-script. We also wish to acknowledge the technical as-sistance of Mr. William Zantiny, and to express our ap-preciation to Messrs. B. S. Brown, M. Fisher and D. E.Kirkham, who served as subjects for the most exactingof the foregoing studies.
BIBLIOGRAPHY
1. Hewlett, A. W., and Van Zwaluwenburg, J. G.,Method for estimating the blood flow in the arm.Arch. Int. Med., 1909, 3, 254.
2. Brodie, T. G., and Russell, A. E., On the determina-
282
BLOODFLOWINTO LIMBS BY OPTICAL PLETHYSMOGRAPH
tion of the rate of blood flow through an organ.
J. Physiol. (Proc.), 1905, 32, 47.3. Hewlett, A. W., and Van Zwaluwenburg, J. G., The
pulse flow in the brachial artery; I. Technic andgeneral considerations. Arch. Int. Med., 1913, 12,1.
4. Hamilton, W. F., and Dow, P., An experimental studyof the standing waves in the pulse propagatedthrough the aorta. Am. J. Physiol., 1939, 125,48.
5. Hamilton, W. F., Woodbury, R A., and Harper, H.T., Jr., Physiologic relationships between the intra-thoracic, intraspinal and arterial pressures. J. A.M. A., 1936, 107, 853.
6. Gibbon, J. H., Jr., and Landis, E. M., Vasodilatationin the lower extremities in response to immersing
the forearms in warm water. J. Clin. Invest., 1932,11, 1019.
7. White, J. C., Diagnostic blocking of sympatheticnerves to the extremities with procaine; test toevaluate the benefit of the sympathetic ganglionec-tomy. J. A. M. A., 1930, 94, 1382.
8. Morton, J. J., and Scott, W. J. M., The measurementof sympathetic vasoconstrictor activity in the lowerextremities. J. Clin. Invest., 1930, 9, 235.
9. Brill, S., and Lawrence, L. B., Changes in temperatureof the lower extremities following induction ofspinal anesthesia. Proc. Soc. Exper. Biol. andMed., 1930, 27, 728.
10. de Takats, G., The differentiation of organic andspastic vascular occlusions. Ann. Surg., 1931, 94,321.
283