Embed Size (px)
Citation preview

C.P. No. II55
MINISTRY OF AVIATION SUPPLY
AERONAUTICAL RESEARCH COUNQL
CURRENT PAPERS
Flow Unsteadiness and Model Vibration in Wind Tunnels at
Subsonic and Transonic Speeds by
D. G. Mobey
Aerodynamics Dept., R.A.E., Bedford
LONDON: HER MAJESTY’S STATIONERY OFFICE
I971
PRICE f/.3@ NET


UDC 533.6.071.4 : 532.5.013.6 : 533.6.072 : 534.13
CP 1155*
October 1970
FLOW UNSTEADINESS AND MODEL VIBRATION IN WIND TUNNELS AT
SUBSONIC AND TRANSONIC SPEEDS
D. G. Nabey
SUMMARY
Flow unsteadiness and model vibration in the RAE 3ft x 3ft tunnel have Impeded static and dynamic measurements at subsonic and transonic speeds. The unsteadiness was measured with pressure transducers both in the 3ft x 3ft tunnel and a l/9 scale model of this tunnel and good agreement obtained.
For the closed 3ft X 3ft tunnel, successive modifications to the balance sectlon and diffuser derived from tests of the model tunnel have reduced the unsteadiness at subsonic speeds to an acceptable level for dynamic tests.
The unsteadiness In the slotted tunnels operated by diffuser suction orlglnated in the extraction region and was reduced in the 3ft x 3ft tunnel by
covermg the slots with perforated screens. The unsteadiness was still higher than in the closed tunnel and Just acceptable in the 0.91m x 0.69m (3ft x 2.2ft) working section and unacceptable in the 0.91m x 0.91m (3ft x 3ft) working
sectlon.
The perforated and closed working sections of the model tunnel had nearly the same unsteadiness and a similar result was achieved with the new perforated working section for the 3ft x 3ft tunnel in the frequency range normally of Interest (from 20 to 900 Hz). Edge-tones generated at low unit Reynolds number were eliminated by a modification to the hole geometry.
Some comparative pressure fluctuation measurements in other closed, slotted and perforated tunnels are Included In Appendices.
* Replaces RAE Technical Report 70184 - ARC 32716.

CONTENTS
1 INTRODUCTION 2 EXPERIMENTAL DETAILS
2.1 Wind tunnels 2.1.1 Closed section 2.1.2 Top and bottom slotted section 2.1.3 Slotted section
2.1.4 Perforated section
2.1.5 Model tunnel 2.2 Pressure fluctuation measurements
2.3 Model vibration measurements
2.4 Flow visualization
3 RESULTS 3.1 Closed working section
3.2 Top and bottom slotted section 3.3 Slotted working section
394 Origin of unsteadiness in the model tunnel
3.5 Perforated section 4 DISCUSSION
4.1 Unsteadiness in slotted sections with diffuser suction
4.2 Unsteadiness in perforated sections with diffuser suction
5 CONCLUSIONS Appendix A Adverse effect of corner half slots Appendix B Unsteadiness measurements in other slotted tunnels
Appendix C Unsteadiness measurements in other-perforated tunnels with 60° inclined holes
Appendix D Unsteadiness measurements in 3 large wind tunnels Tables l-4
Symbols References
w
3 3
3 4 4 4
5 5 5
7 8
9 9
11 11 12
15 20 20 21
22 25 26
28
30 32-35
36 37
Illustrations
Detachable abstract cards
Figures l-46

3
1 INTRODUCTION
The unsteadiness of airflow in wmd tunnels is important because, If the
model response excited by the unsteadiness is excessive, it may prevent the
accurate measurement of overall forces (such as drag) or impede dynamic
measurements (such as wing buffeting or flutter tests)!’ The desirable level
of tunnel unsteadmess is zero for all frequencies; the acceptable level is
normally determined by the type of tunnel test programme. The RAG 3ft x 3ft
tunnel has been used for wing buffeting' and flutter tests, and some modiflca-
tions were required to achieve an acceptable level of tunnel unsteadiness. This
Report describes the modifications to the tunnel and the levels of unsteadmess
achieved.
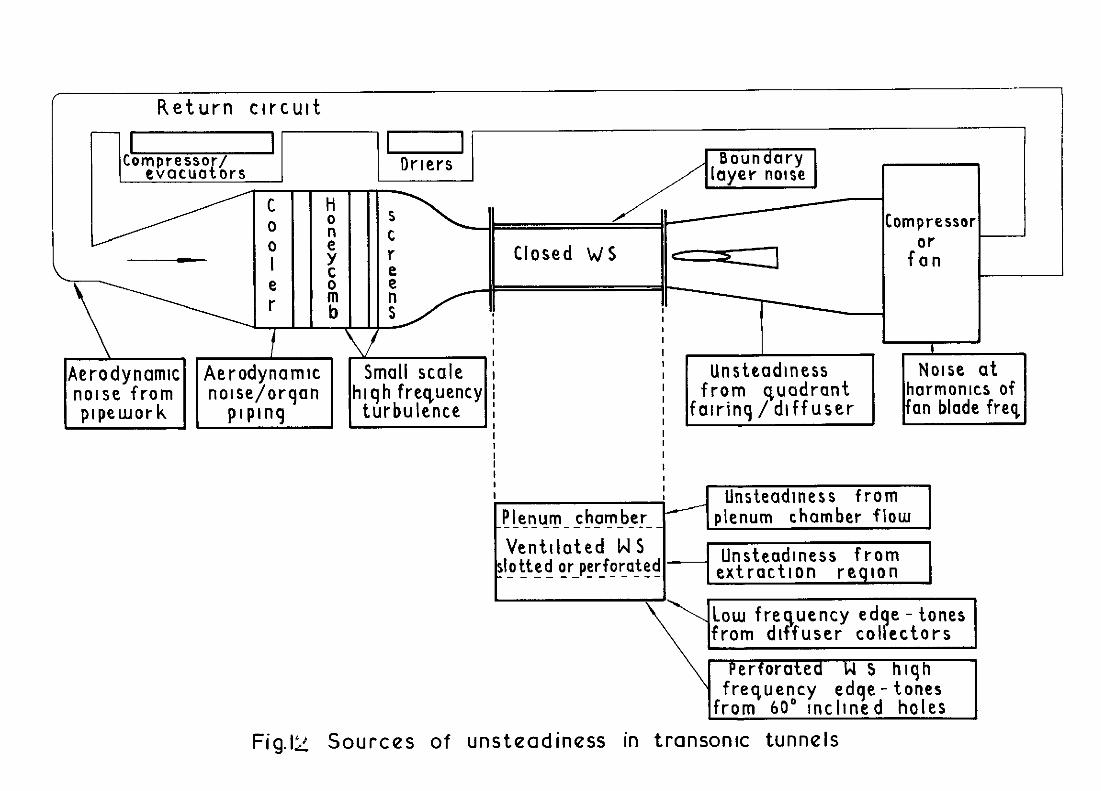
Fig.1 illustrates the principal sources of flow unsteadiness In transonic
tunnels. Many of these sources were encountered in the RAE 3ft x 3ft tunnel
and some useful reductions in unsteadiness were achieved by modificatmns to
the tunnel described in sections 2 and 3; Tables 1 to 4 provide a summary of
the principal configuration changes. The work is complex as it involves
measurements both in the 3ft x 3ft tunnel and a l/9 scale model of the 3ft x 3ft
tunnel over a long period. The general reader may prefer to turn dmxtly to
sections 3.4, 3.5, 4 and 5 for details of the origin of the unsteadiness, a
dzscussion of the principal results and the conclusions.
Some comparative pressure fluctuation measurements in other closed,
slotted and perforated tunnels are included in Appendices. These measurements,
together with wing buffeting measurements in several wind tunnels, furnish
criteria to assess the suitability-rrf wind tunnels for buffeting tests. The
tunnel unsteadiness criteria appropriate to two levels of wing buffeting are
Illustrated in Flg.2; these buffetmg levels are
(1) light buffeting associated with vortex type separations as on
highly swept and slender wings, and
(2) heavy buffeting assocmted with separations on unswept wings.
Fig.2 shows the present lmitatmns on buffeting tests imposed by the
RAE 3ft x 3ft tunnel workmg sections.
2 EXPERIMENT& DETAILS
2.1 Wind tunnels
The 3ft x 3ft wind tunnel was described in Refs.2 to 4, but these
descriptions are not adequate for the present objective because the working

4
sections and diffuser have been substantially modified to reduce the tunnel
unsteadiness. Themodified tunnel is now described.
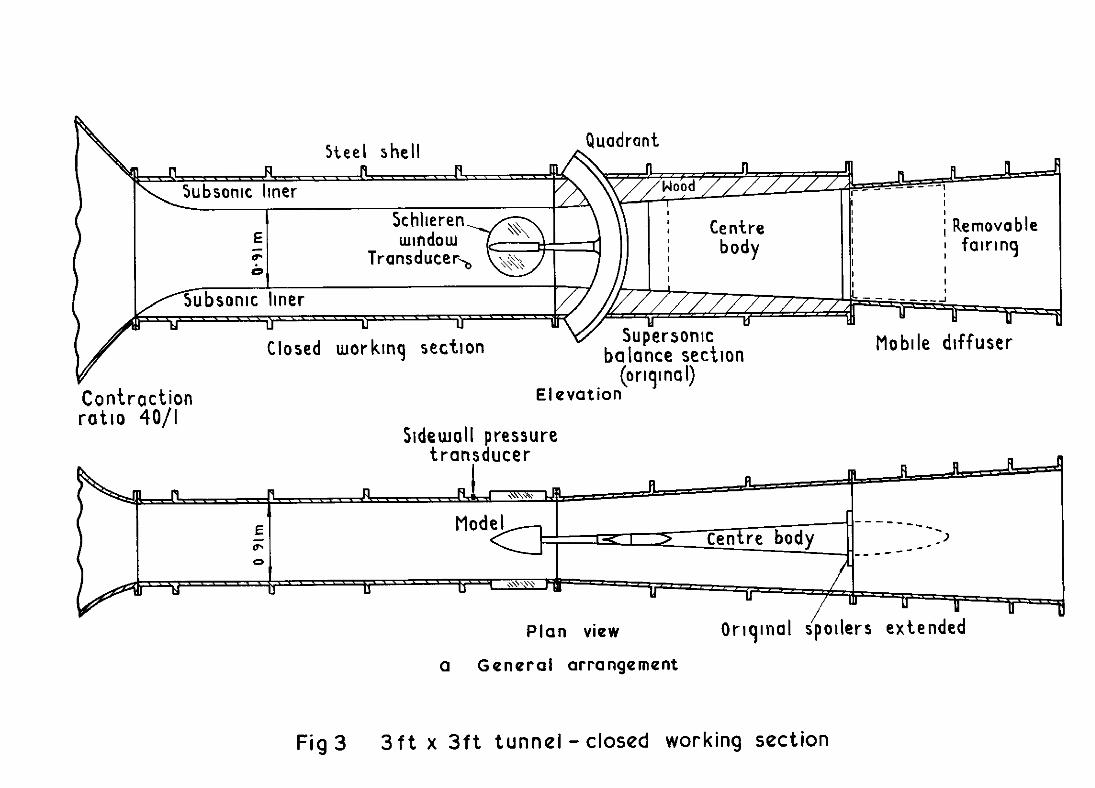
2.1.1 Closed section (Table 1)
The closed 0.91m x 0.91m (3ft x 3ft) working section is fitted with flat
subsonic or contoured supersonx liners 2y3 (Fig.3). Downstream of the closed
working section is the supersonic balance section which originally had a centre body with a bluff base to form a constant area supersonic diffuser and
to shield the flow spoilers. The bluff base of this centre body caused a large flow separation in the mobile diffuser and considerable unsteadiness in
the working section (3.1). To eliminate this separation a removable fairing
was first inserted in the mobrle diffuser. Subsequently the centre body and
the flow spoilers were removed from the supersonic balance section. The wooden linangs of the steel shell of the balance section were altered to pro-
vrde a constant area diffuser without the centre body, Fig.3b, and a pair of flat plate spoilers fitted to the sldewalls of the mobile diffuser, Fig.3c. These diffuser spoilers may be used with any one of the four working sections.
2.1.2 Top and bottom slotted section (Table 2)
The 0.91m x 0.69m (3ft x 2.2ft) top and bottom slotted working section (Flg.4) is formed by inserting slotted liners over the subsonic liners of the closed working sectaon and also utilises the supersonic balance section. There are four complete slots 25 mm (0.98 in) wide and two corner half slots
12.5 mm (0.49 in) wade in these slotted liners. The lower surface of the
complete slots was covered wath perforated metal (Fig.4c-d) to reduce the flow unsteadiness (3.2). This small section 1s used for most transonic measurements
in the 3ft x 3ft tunnel.
2.1.3 Slotted section (Table 3)
The large 0.91m x 0.91m (3ft x 3ft) transonic working section with four slotted walls (Fig.5) utilises a special balance section4. Model vibration limits the use of this section5 and the unsteady signal from strain gauge
balances is sometimes sufficient to overload the ac amplifiers of the self levelling potentiometers and produce spurrous readangs6. Wing buffeting tests
in this sectIon are impeded by the high level of wing vibration at zero 1 lncrdence . This working section has one complete slot on every side 61 mm
(2.38 in) wade and half slots 30.5 mm (1.19 in) wide in every corner of the top
and bottom liners. The lower surface of these slots was also covered with
5
perforated metal (Flg.5c-d) to reduce the flow unsteadiness (3.3), but this is still higher than with the top and bottom slotted sectmn.
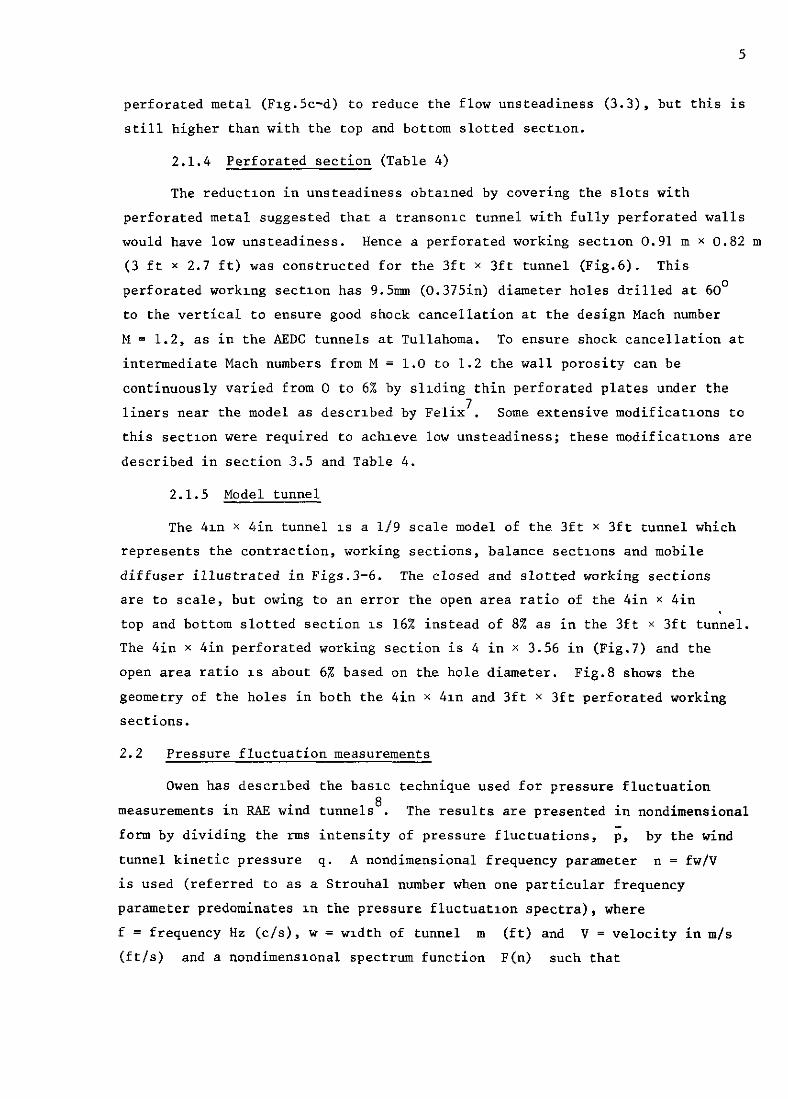
2.1.4 Perforated section (Table 4)
The reductmn in unsteadiness obtamed by covering the slots with perforated metal suggested that a transomc tunnel with fully perforated walls would have low unsteadiness. Hence a perforated working sectmn 0.91 m x 0.82 m (3 ft x 2.7 ft) was constructed for the 3ft x 3ft tunnel (Fig.6). This
perforated workmg section has 9.5m (0.375in) diameter holes drilled at 60' to the vertical to ensure good shock cancellation at the design Mach number M = 1.2, as in the AEDC tunnels at Tullahoma. To ensure shock cancellation at intermediate Mach numbers from M = 1.0 to 1.2 the wall porosity can be
continuously varied from 0 to 6% by sliding thin perforated plates under the liners near the model as described by Felix'. Some extensive modificatmns to this sectmn were required to achieve low unsteadiness; these modificatmns are
described in section 3.5 and Table 4.
2.1.5 Model tunnel
The 4x1 X 4in tunnel IS a l/9 scale model of the 3ft x 3ft tunnel which represents the contraction, working sections, balance sectmns and mobile diffuser illustrated in Figs.+6. The closed and slotted working sections are to scale, but owing to an error the open area ratio of the 4in x 4in top and bottom slotted section IS 16% instead of 8% as in the 3ft x 3ft tunnel. The 4in x 4in perforated working section is 4 in x 3.56 in (Fig.7) and the open area ratio 1s about 6% based on the hole diameter. Fig.8 shows the geometry of the holes in both the 4in x 4111 and 3ft x 3ft perforated working sections.
2.2 Pressure fluctuation measurements
Owen has described the basic technique used for pressure fluctuation
measurements in RAE wind tunnels 8 . The results are presented in nondimensional form by dividing the rms intensity of pressure fluctuations, p, by the wind
tunnel kinetic pressure q. A nondimensional frequency parameter n = fw/V is used (referred to as a Strouhal number when one particular frequency parameter predominates 1x1 the pressure fluctuatmn spectra), where f = frequency Hz (c/s), w = width of tunnel m (ft) and V = velocity in m/s (ft/s) and a nondimensmnal spectrum function F(n) such that

*cm 1ogn=m 12 P/4 =
I F(n) dn =
I nF(n) d (log n) .
a=0 logn=-m
In buffeting investigations the presentation of excitation spectra in terms of JnFo against log n is useful and this form is adopted here. Owen's previous pressure fluctuation measurements in the 3ft x 3ft tunnel' may have been subject to some interference from the model base flow or the support sting in the subsonic and transonic regions. To eliminate this possibility
the present measurements were made with a pressure transducer flush with a sidewall or a slat. (The principal transducer positions are shown in Figs.3-7.) The pressure transducer then receives additional excitation from the fully established wall turbulent boundary layer, but this represents a small, nearly constant correction at high frequency, which is often approximated by p/q = 0.006. For a turbulent boundary layer the rms pressure fluctuations are given more precisely by i/q = 2.5 x the skin friction coefficient cf and C f is estimated to be about 0.002 to 0.003 for these tunnel boundary layers. No corrections were made to the spectra for the turbulent boundary layer pressure fluctuations or the size of the transducer relative to the boundary layer. In
the perforated working section almost the same pressure fluctuations were simultaneously measured by transducers mounted flush with the bottom and side liners as on the cylindrical sectlon of a 9 in long ogival nosed body mounted
on the tunnel centre line. Hence the contribution of the wall boundary layer was small and the pressure fluctuation field approximately onedimensional across the tunnel. These comparative measurements were made simultaneously with sensitive transducers and low noise level amplifiers (see next paragraph).
Several RAE miniature differential pressI& transducers 10 were used for these experiments. These transducers were of the capacitance type and were insensitive to accelerations. The first transducers used had a pressure range of 514 kN/m2 (?2 lb/in2) although later (November 1967) transducers with a pressure range ?4 kN/m2 (~0.6 lb/in') became available. The transducers with a pressure range of *14 kN/m2 (22 lb/ln2) were used in conjunction with a 20 kHz carrier system amplifier for the first measurements in the slotted sections of the 3ft x ?ft tunnel and in the model tunnel (Figs.12-27). The signal/noise ratio of this system was just adequate when the tunnel unsteadiness was high -
typical rms signals wind on were about 60-100 mV and the wind off noise was about 28 mV (some of this was near the carrxr frequency). From November 1967, however, 400 kHz amplifiers were used for the measurements in the perforated
section and comparative measurements in the slotted and closed sections
7
(Figs.28 to 38). These gave typical rms signals of 500 mV (or 1 V with the transducer with a pressure range of +4 kN/m2 (+0.6 lb/ln2) and the wind off
noise was reduced to about 8 mV. These amplifiers and the sensitive
transducers greatly improved the signal/noise ratio. The transducer output
was recorded directly from 20 to 6300 Hz on a level recorder coupled to a Bruel and Kjzerspectrum analyser. The wind-on signal in dB (corrected for wind off noise at the appropriate frequency) was then converted directly to a voltage.
The static calibration K, analyser bandwidth ratio E, the tunnel kinetic
pressure q were then used to form I/nF thus
m = (voltage) x K/& .
Throughout these experiments the same analyser bandwidth ratio E = 0.12 was
used.
In the 3ft x 3ft tunnel a lrmited amount of data from 2 to 20 Hz was recorded manually using a Muirhead selective filter, for comparison with the
model tunnel data at 20 to 180 Hz (i.e. the same frequency parameter). The
3ft x 3ft tunnel measurements were generally made at a total pressure P t of 98 kN/m2 (14.3 lb/ln2) to ensure comparable accuracy with those in the model tunnel which runs at a total pressure about 2 kN/m* (0.3 lb/ln2) below atmospheric pressure.
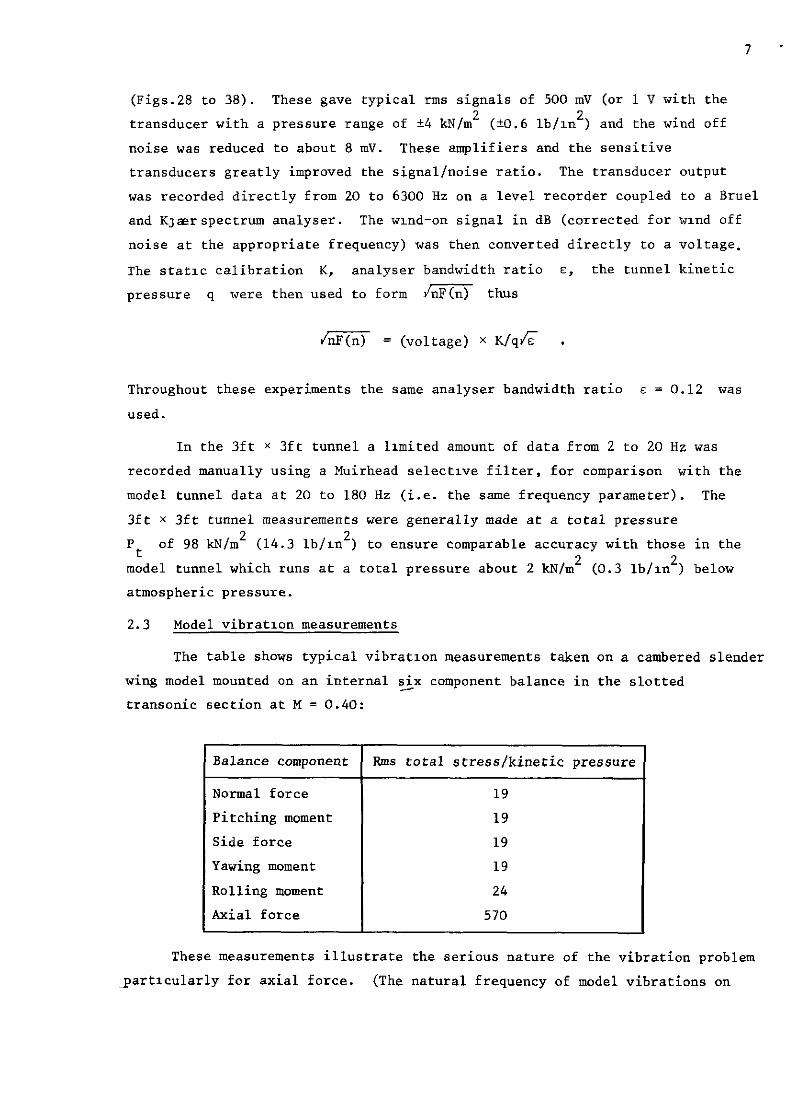
2.3 Model vibration measurements
The table shows typical vibration measurements taken on a cambered slender wing model mounted on an internal six component balance in the slotted transonic section at M = 0.40:
Balance component Rms total stress/kinetic pressure
Normal force 19 Pitching moment 19 Side force 19 Yawing moment 19
Rolling moment 24 Axial force 570
These measurements illustrate the serious nature of the vibration problem particularly for axial force. (The natural frequency of model vibrations on
axial force balances m the 3ft x 3ft tunnel is generally within the range from 100 to 200 Hz.) The present measurements were on the axial force balance of a slender wing model (Pig.9) which vibrated badly in previous tests 6 . A slender
wing was selected because its weak perturbation of the mean flow appeared to mterfere with the movement of unsteady normal waves upstream through the work-
ing section only close to M = 1.0 (section 2.4).
The axial force bridge was excited by 6 V dc (e) and the rms voltage
fluctuation (G) was measured with the equipment used in buffeting
investigationsl. The rms voltage fluctuation e is converted to an rms
balance stress (7 by the relation
where v = gauge factor = 2 for wire gauges
o = balance stress kNfm2 (lb/in2) E = Young's modulus kNIm2 (lb/in2).
At constant Mach number the balance stress was proportional to the kinetic pressure q (implying only structural damping for this vibration mode) and the measurements were presented as curves of o/q. To avoid changing the structural damping the model was not removed from the sting or quadrant during the com- parative tests shown 1x1 Fig.12.
2.4 Flow visualisation
Oil flow photographs showed that the mean streamlines were comparable in
the mixing regions of the 3ft x 3ft and 4in x 4in tunnels where the pressure fluctuations were generated. These mixing regions were the area of separated flow in the mobile diffuser downstream of the supersonic balance section (2.1.1)
and the extraction reglon near the end of the slotted working sections (2.1.2 and 2.1.3) (Fig.10).
Some spark schlieren photographs with a vertical knife edge were taken in
the top and bottom slotted working sections of the 3ft x 3ft and 4in x 4in tunnel (exposure about 1 US). They showed nearly normal waves which formed in the extraction region and moved upstream Into the working section from M = 0.80 to M = 1.00 (Fig.11). Above M = 1.0, photographs in the 4in x 4in tunnel showed that these waves ware confined to the extraction region downstream of the terminal shock. In both tunnels high speed tine films of the waves taken with a Fastex camera at 3000 frames/s showed that they moved upstream through the working section with a wave velocity VW given by

9
“w = (1 - M) a
where a = velocity of sound. (Mach numbers derived from the measured wave
velocity V" were within AO.002 of the Mach numbers derived from the plenum
chamber static pressure.)
Strong normal waves were also found in the closed working section with
the diffuser fairing out; very weak, oblique waves of much higher frequency
were observed with the mobile diffuser fairing in. A cone film showing these
waves passing over the slender wing in the 3ft x 3ft tunnel is available.
3 RESULTS
Flg.12 summaru.es reductions in tunnel unsteadiness [JnF(n)l, and model
response [o/q1 achieved by the principal modifications to the closed and
slotted working sections. The levels of unsteadiness and model response shown
refer to axial force balance vibrations of the slender wing model (Flg.9) at a
single frequency of 140 Hz. A complete picture covering all frequencies of the
improvements achieved by the tunnel modifications can only be obtained by an
examination of the unsteadiness spectra m(n) log n. These spectra are no"
discussed.
3.1 Closed working section (Table 1)
The principal source of unsteadiness in the closed working section "as
identified by tests in the model tunnel as the large separation in the mobile
diffuser downstream of the base of the balance section centre body. The work-
ing section pressure fluctuations at M = 0.80 (Fig.13) suggest that the
excitation from the separation may have excited the first and second diffuser
transverse organ pipe resonance frequencies (at 110 and 220 Hz) and weakly
excited the third resonance at 360 Hz. The same effect was found at other Mach
numbers with some variation of the relative intensity of the modes caused by
variations in the predominant frequency of the excitation from the separation.
(The base flow on the centre body "as not twodimensional because its aspect
ratio "as only 3 and there were thick boundary layers on the walls. HO"tYIe+,
the predominant frequency at n = 0.38 corresponds with a Strouhal number
based on the width of the centre body of 0.16, a typical value for bluff
bodies.)
A removable falring to eliminate thu separation was developed in the
model tunnel and a similar falrlng subsequently manufactured for the 3ft x 3ft
tunnel. This faxrIng reduced the working section pressure fluctuations
(Figs.13 and 14) and the axlal force balance stress (Fig.12).

10
Two significations observations can be made from Fig.14. The first is
that when the tunnel chokes (at M = 1.075 with the tunnel empty because an
excessive allowance was made for boundary layer growth in the working section)
the excitation appears small because
from n = 0.04 to 4.0. This signal includes the excitation from the sidewall
boundary layer and hence the flow in the maximum sectlon downstream of the
aftercooler, honeycomb and screens is good ll. (Later more accurate measurements
with the Improved instrumentation show that this level should be rather higher -
about 0.002 to 0.003.) The second observation is that at subsonic speeds, even
with the diffuser fairing, there 1s a large low frequency component in the
range from n = 0.02 to 0.08 which disappears when the tunnel chokes. A
similar low frequency component was found in the model tunnel and was higher
with the centre body and diffuser falring than with the unfaired centre body
(Flg.15). One hypothesis to explain the orlgln of this low frequency
unsteadiness was that the flow did not dlvlde steadily on either side of the
long centre body, but oscillated from side to side. (Low frequency unsteadiness
of this type has been observed in bifurcated intake ducts 2g.) If this
hypothesis was correct, it seemed possible that a very short centre body would
reduce the low frequency unsteadiness. Hence the long centre body and diffuser
fairing were removed from the model tunnel and replaced by a revised balance
section without a centre body which incorporated nearly the same area
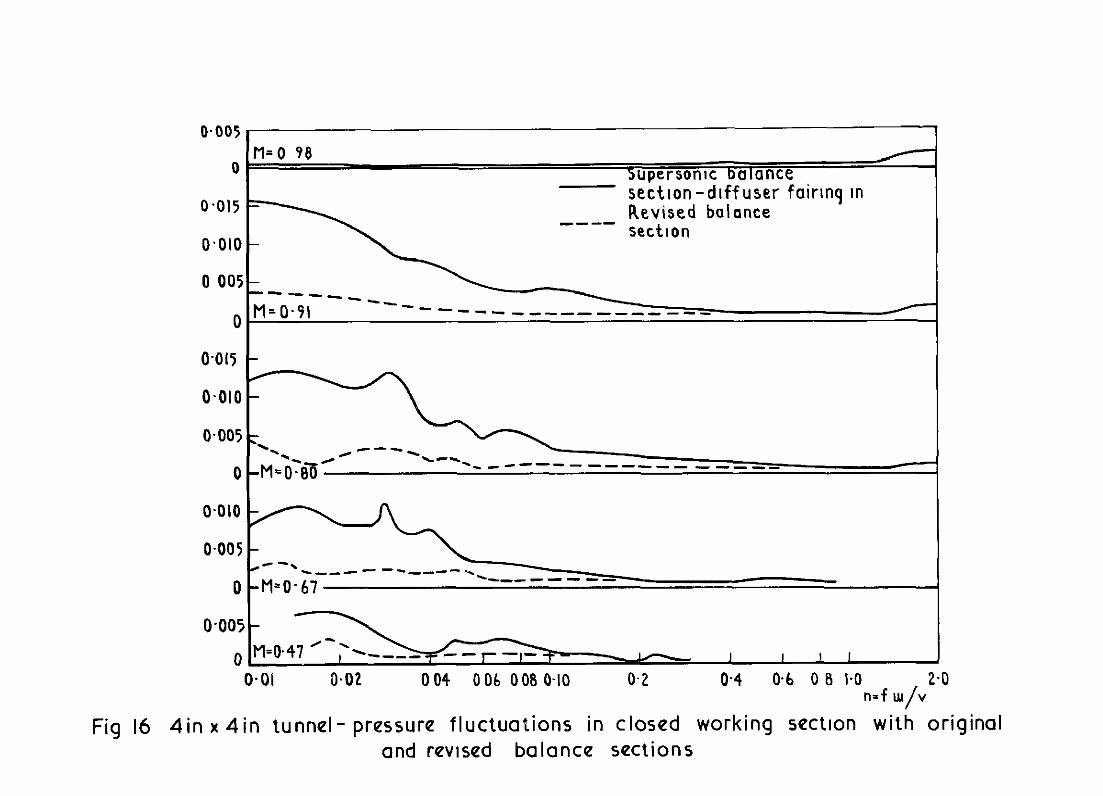
distribution. This revised balance section reduced the low frequency excitation
in the model tunnel (Fig.16) and hence was subsequently incorporated in the
3ft x 3ft tunnel (Fig.17). In the 3ft x 3ft tunnel the low frequency unsteadl-
ness associated with the flow over the step and the rest of the return circuit
is still relatively high, at subsonic speeds, with m = 0.004 (Fig.17).
The revised balance section for the 3ft x 3ft tunnel should also reduce
model vibration at supersonic speeds, because in the model tunnel the revised
balance section reduces the low frequency component of the pressure
fluctuations at the quadrant (Fig.18) which arise from the movement of the
terminal shock system. (The flow unsteadiness caused by the unfalred centre
body in the 3ft x 3ft tunnel has vibrated the quadrant at M = 2.0 and thus
excited serious lateral oscillations at 10 to 40 Hz on several models).

11
3.2 Top and bottom slotted section (Table 2)
The unsteadiness in this section before modification was unacceptable for buffeting tests. Comparative buffeting measurements on Model B of Ref.1 showed that the unsteadiness in this working section was much higher than in the HS 2ft x 2ft slotted tunnel (Fig.10, Ref.1) which apparently had a similar
slot configuratmn. Spark schlieren photographs confirmed that the waves in
the 3ft x 3ft tunnel were stronger than those in the HS 2ft x 2ft tunnel. A comparison of the tunnels revealed only one difference which was believed to be significant (Appendix B). The 3ft x 3ft tunnel utilized deep perforated
channel screens as developed for the temporary transomc section 12 whereas the
HS tunnel had flat perforated screens imediately under the slots (Fig.40). This change in screen geometry would certainly alter the slow mixing process
in the plenum chamber produced by the outflow through the slots and the more rapid mixing process in the extraction region produced by diffuser suction. Hence the channel screens of the 3ft x 3ft tunnel were replaced by flat screens and the model vibration at 140 Hz was immediately reduced (Fig.12).
Schlleren photographs showed that the strength of the waves in the working section was also reduced, although their frequency was not altered.
Fig.19 shows the working section pressure fluctuations with flat screens. There is still a peak at about m(n)= 0.004 at subsonic Mach numbers from M = 0.80 to 0.90 at a frequency parameter n = 1.2 (this corresponds with a frequency of 350 Hz at M = 0.80). The later more accurate measurements, with the rear of the central slat cut away, give higher pressure fluctuations, e.g. Fig.38 shows y'nF= 0.007 at M = 0.80 for n = 1.2. At supersonic speeds the spectra are flatter and lower, although there are local peaks, e.g. m(n)= 0.003 at n = 1.8 at M = 1.10. These imply that the pressure
fluctuations in the extraction region can be transmitted to the working section through the plenum chamber, perhaps by altering the initul expansion through the slots. Fig.19 also shows that the low frequency component (at n = 0.03) is smaller over the complete Mach number range, than in the closed working section, cFlg.14) possibly because of the lower velocities in
the diffuser.
3.3 Slotted working section (Table 3)
The first attempt to reduce the unsteadiness of this section with the same type of thin screens which had improved the top and bottom slotted section was successful, judged by vibration measurements on the slender wing. However fatigue cracks quckly started at the downstream end of the screens and they were replaced by thicker screens.
12
The new screens (Fig.5c) were 3.2 mm (0.125 in) thick. The hole diameter and open area ratid were not considered critical with respect to the unsteadl- ness and were increased from 2.16 nun (0.085 in) and 33% to 6.25 mm (0.25 in) and 50% respectively to improve the subsonic Mach number distribution. These
screens achieved about the same reduction in model vibration as the thin screens (Fig.12) and reduced the tunnel unsteadiness at the peak (n = 0.6 at M = 0.80 to 0.85) by about 50% (Fig.20). However the slotted transonic section is still 2 to 3 times more unsteady than the top and bottom slotted section (comparing Flgs.19 and 20) even allowing for the difference in spectra, probably
because the wider slots permit more effective mixing in the slotted transonic section. Even with these improvements steady measurements may still be unposslble on a particular model if the model/balance combination has an axial force frequency of about 100 to 200 Hz and low damping. Thus the slender wing still cannot be safely tested in this section at a reasonable Reynolds number (cf. the model response in the closed, top and bottom slotted sectlons and slotted transonic section Fig.12).
The unsteadiness in the slotted transonic sections in the 3ft x 3ft and 4in x 4in tunnels with the slots open is similar in character, although the 3ft x 3ft tunnel appears about 2 to 4 times as bad as the 4in x 4111 tunnel
(Fig.21).
3.4 Origin of unsteadiness in the model tunnel
Pressure fluctuation measurements in the slotted transonic working section
of the model tunnel ware followed by comparative measurements at a series of different points down the diffuser with the slotted and perforated working
sections. These measurements showed (Fig.22) that with the slotted working section there were large pressure fluctuatums in the extraction region with a peak of m(n)= 0.036 at n = 0.8. With the perforated working section the pressure fluctuations at the same point were small and the spectrum was flat with a level m 2 0.002. The large pressure fluctuations originating in the extraction region of the slotted working section rapidly decayed as the pressure transducer was moved downstream. There was a small increase in the weak pressure fluctuations associated with the perforated working section as the transducer moved downstream through the re-attachment point on the sidewalls (Fig.22) and the pressure fluctuations then decayed towards the end of the mobile diffuser. The general correspondence between the spectra measured in
the extractxm reglon (Fig.22a) and the working sections (Fig.23.a) was good so that the extraction regxm was definitely identified as the origin of the
unsteadiness.
13
High speed tine schlieren films taken of the flow in the extraction region
of the top and bottom slotted section of the 4in x 4in tunnel suggested an hypothesis to explain the generation of the unsteadiness. (This region is
included in the tine film). Two shear layers were visible, a steady shear
layer from the slats and an unsteady flow from the slots which oscillated so that a re-attachment point appeared to move upstream and downstream in the diffuser. The perforated screens placed across the slots in the 3ft x 3ft
tunnel probably inhibited this oscillation of the slot flow and hence reduced the pressure fluctuations (sections 3.2 and 3.3). The same argument would apply with greater force to the perforated working section. This hypothesis was also
substantiated by a test made m the model tunnel. In this test, pressure fluctuations in the working section and extraction regmn were compared with the slots open (10% open area ratio) and with the slots closed by shaped
inserts. The results (Fig.24) show a large reduction in pressure fluctuations
both in the working section and in the diffuser when the slots are closed and the separatmn point fixed at the periphery of the working section. With the slots closed the pressure fluctuations at both points are almost identical with
those measured with the perforated working section.
This test also confirms the prevmus result that with the closed working section (Fig.3) and the revised balance section there is no high frequency
unsteadiness associated with the sudden enlargement to the mobile diffuser
(Figs.16 and 17). This flow over the step has a fixed separation line and m-attaches to a fixed surface. In the original balance section although there were fixed separation lines from the bluff base of the centre body the flow did not re-attach, but formed a wake which moved down the centre of the diffuser. (The much smaller pressure fluctuations with the step in the side- wall compared to those with the bluff base on the centre line recall the reduct- ion in pressure fluctuations, vortex shedding and base drag achieved by the insertion of splitter plates into the wakes of bluff bodies 13 .)
The pressure transducer could not detect any organ pipmg in the transonic balance sectmn at stream&e stations (a) to (d) (Fig.22) when traversed vertically nor were any sigmficant horizontal variations of pressure fluctuations detected in the extraction region with either the slotted or perforated working sections. Despite the absence of organ piping in the
transonic diffuser there was a characteristic peak excitation frequency in all the slotted working sections (Figs.20, 21). This frequency is about the same

14
for all 3ft x 3ft and 4in x 4in working sections when expressed as a Strouhal number in terms of the slot width ws, rather than the tunnel width w (Fig.25), with a fairly well defined range
0.030 Q s* G 0.040 .
Fig.26 shows comparative measurements of plenum chamber pressure fluctuations for both slotted and perforated working sections. (Measurements are presented for positions 1 and 4 shown in Fig.22; position 1 was on the sidewall centre line at the same stream&e position as the reference static hole.) At
position 1 the slotted tunnel has a peak of JnF(n)= 0.0053 at n = 0.77 (Fig.26a) compared to the extraction region which has a peak of JnF(n)-- 0.036 at n = 0.80 (Fig.24a). In the plenum chamber of the per- forated section there is no high frequency excitation and only a relatively small amount of low frequency excitation below n = 0.08 similar to that in the slotted section. These spectra are not significantly different when the Mach number is increased to M = 1.04 (Fig.26b). At position 4 upstream the high frequency excitation in the slotted section is about 40X of that at position 1, but the low frequency fluctuations are unaltered (Fig.26c and d). These measurements may be sumarized by saying that in the plenum chamber the high frequency pressure fluctuations resemble those in the extraction region but attenuate fairly rapidly moving upstream whereas the low frequency com- ponent is not attenuated moving upstream.
An interesting comparison may be made between the pressure fluctuations in the slotted working section and plenum cha.n&r.
Mach number Working section Plenum chamber Fig.23 Fig.26
Subsonic Peak JnPo= 0.010 Peak m= 0.0053
M = 0.80 at n = 0.60 at n = 0.77
Supersonic Peak JnFo= 0.004 Peak JnFo= 0.0055
M = 1.03 at n = 0.5 at n = 0.65
The table shows that at subsonic speeds the working section pressure fluctuations are greater than those in the plenum chamber. This is because at subsonic speeds the working section receives pressure fluctuations from the extraction region via the mainstream and the plenum chamber. However at

15
supersonic speeds the working section only receives pressure fluctuations from
the extraction region vra the plenum chamber, and there is probably some
attenuation through the narrow slots. (The unsteadiness of the plenum chamber flow might induce additional unsteadiness by boundary layer movement on the
liners.) Hence these measurements explarn why the slotted working section is inferior to the perforated working sectlon even at supersonic speeds (Fig.23),
for the perforated working section has little unsteadiness in the extraction region, even less in the plenum chamber and little chance of radiating energy
through the small inclined perforations into the working section.
The plenum chamber pressure fluctuation measurements show some attenuation movrng upstream. According to the theory developed by Eggink 14 weak compression waves moving upstream through the working section at high subsonrc speeds must intensify into shock waves and then be dissipated as heat. Hence the corresponding wall pressure fluctuations would first increase and then decrease. This theory was verified in the model tunnel top and bottom slotted working
section by measuring the srdewall pressure fluctuations at M = 0.80 as the transducer was moved upstream. The measurements (Fig.27) show a small initial increase in the peak pressure fluctuations just upstream of the ends of the
slots (probably just srgnrflcant) and then an almost monotonic decrease. There is no alteration rn the frequency of peak excitation (about 1360 Hz)
along the working section. The high speed tine film also suggests that the waves are attenuated movrng upstream.
No normal waves could move upstream from the extraction region through
the working section at supersonic speeds. Sidewall pressure fluctuation measurements at drfferent posrtioniwere attempted at M = 1.11 but were not repeatable because of large changes induced by small alterations in the test
section Mach number (rO.005). The spectra measured ware characterised by a large low frequency fluctuation from 20 to 200 Hz (m 2 0.005)
associated with the movement of the tunnel shock system of inclined waves; the spectra were very flat from 1000 to 2000 Hz with a general level JnF(n)= 0.0020 (see lower half of Frg.27).
3.5 Perforated section (Table 4)
A low level of unsteadiness was expected for the 3ft x 3ft tunnel perforated working sectlon on the basis of the model tunnel tests described
above. However, during the first runs the tunnel was extremely noisy at speeds up to M = 0.70 and large working section pressure fluctuations
(m= 0.10) were measured which Increased in frequency from 30 to 50 Hz

16
as speed increased. This phenomenon recalled the unsteadiness observed in a slotted water tunnel which was traced to edge-tones shed from the diffuser collectors and eliminated by changing the geometry of the collectors 15 . A similar process seemed possible with the perforated working section because the side collectors had a small leading-edge radius. Hence bluff side baffles were added to the side collectors and these reduced the audible noise and the working section pressure fluctuations (Flg.28). (No further improvement was obtained with more streamlined baffles.) These side baffles suppressed the shedding of vorticity inevitably associated with a stagnation point oscillation on the sharp collector nose. [No comparable unsteadiness was observed in the slotted transonic sectlon with these collectors because the streamwise flow was then constrained to a few discrete areas downstream of the four complete slots (Fig.lO).l
Significant unsteadiness remained at 50 Hz and another experiment* was
made to determine its origin. All the holes in the perforated working section were covered with adhesive tape and the working section pressure fluctuations reduced as anticipated (Fig.29). Then the tapes were removed
progressively from every wall in the sequence illustrated; the unsteadiness at 50 Hz only returned when both sidewalls were uncovered (Fig.29b). (This effect was also observed in the plenum chamber.) This suggested that the generation of edge-tones depended on a symmetric sidewall configuration and also that the edge-tones might be influenced by the degree of interconnection between the side plenum chambers. Hence longitudinal wooden baffles were lnserte in every corner of the plenum chamber. These reduced the unsteadiness at M = 0.60 but introduced large pressure fluctuations and excessive external noise at other speeds. These solid baffles were then removed and perforated with 2 in diameter holes drilled halfway between the transverse venting holes spaced every 8 in along the longitudinal I beams (these venting holes are 4 in
diameter). When the perforated corner baffles were inserted the pressure fluctuations at 50 Hz were reduced (Fig.30) and there was no increase in pressure fluctuations or external noise at other speeds. Perforated corner baffles are desirable to equalize small static pressure differences between the plenum chambers induced by lifting models.
For the next series of tests another pressure transducer was placed near the downstream end of the plenum chamber. Fig.3la shows that in the plenum
*This was suggested by Mon. R. Destuynder in the light of comparable experi-
ments in the ONERA 6ft tunnel 16 .

17
chamber the pressure fluctuatmns at 50 Hz were higher than those in the work- mg section, suggesting resonance at the longitudinal organ pipe frequency (the 11 ft length corresponds with a closed/closed mode of 50 Hz). This hypothesis was confirmed by the insertion of a paper honeycomb at the end of the plenum chamber. This introduced attenuation between the diffuser and the plenum chamber and thus reduced the plenum chamber pressure fluctuations at 50 Hz. However, the honeycomb did not alter the working section pressure fluctuations (Fig.3lb), Indicating that the unsteadiness was excited in the
diffuser or working section rather than the plenum chamber. The honeycomb Was
then removed because it interfered with the flow through the downstream end of the perforated lx~ers and absorbed extra power. The honeycomb was replaced by
a series of plenum chamber baffles wedged through the 4in diameter transverse venting holes. In the upstream part of the plenum chamber these baffles were set at 45' to produce high acoustic damping for the longitudinal mode. In the downstream part of the plenum chamber the baffles were set at zero incidence to provide some limited acoustic damping and to partially inhibit the unsteady lateral flow in the plenum chamber indicated by nylon tufts. These combined baffles reduced the plenum chamber pressure fluctuations more effectively than the honeycomb and also reduced the sidewall pressure fluctuations over a wider range (Fig.3lc). This improvement probably came from a more stable plenum chamber flow although no noticeable improvement in steadiness of the nylon tufts was observed.
One other serious problem was encountered with this perforated section. When operated at low Reynolds numbers (e.g. as obtalned when starting the tunnel or when running at high subsonic speeds but low density) strong high frequency edge-tones were emitted from the holes which seriously Impeded
dynamic measurements. Fig.32 shows how the pressure fluctuations at M = 0.80 increased from w(n)- 0.004 to 0.060 at the edge-tone frequency as the tunnel total pressure was reduced from 136 to 34 kN/m2 (20 to 5 lb/in2). The measured Strouhal number of these edge-tones (based on the hole diameter d
rather than the tunnel width w) did not vary much with Mach number although first, second and third modal frequencies could sometimes be distinguished
(Flg.33). These Strouhal numbers can be predicted from Brown's formula 17 if we make two assumptions.
(1) The effective jet velocity is the free stream velocity V.
(2) The effective distance between the jet orifice and the sharp edge
is the hole diameter d.

18
(The streamwise distance from the jet orifice to the sharp edge varies from 0 to 2d round the periphery of these inclined holes. However there are obviously
no edge-tones in the limit when this distance tends to zero so that the assumption of a weighted, effective mean value of d is not unreasonable.) With these assumptions and for V% 40 cm/s and d = 0.95 cm Brown's formula becomes:
s* = fd/u = 0.0466j (1 - 40/v) (1 - 0.07d) = 0.0433j
where j = 1.0, 2.3, 3.8, give the frequencies corresponding with the first,
second and third modes. The predicted edge-tone Strouhal numbers are then in fair agreement with the measurements for the first 3 modes (Fig.33a). The amplitude of the pressure fluctuations at the edge-tone frequency did not vary strongly with Mach number up to M = 0.70 (Fig.33b) so that acoustic resonances
at fixed frequencies in the plenum chamber , working section or diffuser (whose yplification factor would vary as frequency changed) could not influence this phenomenon. It is interesting to note that the Strouhal number derived from previous measurements la (Appendix C) in the ONRRA 6ft x 6ft tunnel at M = 0.80,
Pt = 102 kN/m2 (14.8 lb/in2) agreed exactly with that measured in the RAB 3ft x 3ft tunnel at M = 0.80, P t = 34 kN/m* (5 lb/in*) (Fig.33a) and that even the pressure fluctuation amplitudes were comparable (m = 0.038 and 0.050 respectively in Fig.33b) despite many detailed differences between the
tunnels. Hence edge-tones from the holes were generating the pressure fluctuations in both facilities.
In both facilities the edge-tones were completely eliminated by taping over the wind swept surfaces. When one of the sidewalls of the RAE 3ft x 2.7ft tunnel was then untaped (Fig.34a), edge-tones were generated almost as
strongly as with four walls untaped+. However, as this open sidewall was progressively taped over again, working upstream from the end of the liner, the pressure fluctuations were reduced and the unit Reynolds number for the onset of edge-tones was also reduced. This suggested that the effect of reducing
unit Reynolds number was to increase the boundary layer thickness 6*, and
t Interference between the four walls produced this apparently anomalous result; large mutual interference effects were clearly demonstrated in additional experiments.
Detailed measurements of the boundary layer thickness in the corners of the working section would probably have been needed to interpret these anomalous pressure fluctuation measurements correctly.

19
that edge-tones were generated when 6*/d exceeded some critical value. As
the tapes were extended upstream the boundary layer at the open holes just
upstream of the tape became thinner at any given unit Reynolds number. HL3Ke
a progressively lower unit Reynolds number was required to achieve the crltical
value of 6*/d necessary to initiate edge-tones. A critical value of about
6*/d aO.4 to 0.5 can be inferred from the measurements given 1x1 Fig.34a.
Tests in the ONRRA 6ft tunnel 16 showed that the edge-tones could also be
eliminated by reducing the wall porosrty from 6% to 3%. This variation of
wall porosity was achieved, not by sealing 50% of the holes, but by moving
perforated plates extending over the full length of the plenum chamber side
of the top and bottom lrners. A comparable experiment was made usrng the small
length of variable porosity sidewall of the RAE 3ft x 2.7ft tunnel, the remain-
ing walls being taped over. Frg.34b shows that the pressure fluctuations fell
suddenly as the open area ratio was reduced from 3% to 2.2%. This modificatron
was then applied over a wider area by sticking perforated cardboard underneath
the rear 2 ft of the top and bottom liners from which the tapes were removed.
The cardboard was displaced so as to grve the desired open area ratlo of 2.2%
and a large reductron in pressure fluctuations was achieved (Fig.35a).
Alumrnium strrps were subsequently used to modify every hole in the liners in
this fashion. This modiflcatron virtually eliminated the edge-tones (Fig.35b)
at the fundamental mode, although the third mode (Fig.33) stili persisted.
An hypothesis to explain the generation of the edge-tones is suggested
by the flow patterns found in individual holes (Fig.36). This shows a
herring-bone pattern, indicative of a complex threedimensional shear layer
separating from the upstream edge of the hole. The mean shear layer contains
streamwise vorticity components of opposite sense on either side. Under
certain conditions (e.g. as 6*/d increases), the mean shear layer may not
reattach to the inner surface of the hole. The shear flow 1s probably
always unsteady, but the degree of unsteadiness may be much greater when the
mean shear layer does not reattach onto a solid surface. The mass flow into
the hole would then vary strongly with time, which would generate stronger
edge-tones from the downstream edge of the hole. The downstream movement of
the variable porosity plate reduces the edge-tones either by permitting
reattachment or by severely lrmrting the amplitude of the shear layer oscilla-
tion. There 1s not enough evidence to confirm this hypothesis, but the flow
model inferred is at least consistent with Roshko’s explanation 13 of the
effect of splitter plates on the flow in the wake of bodres with a bluff base.

20
The movement of the variable porosity plate to the critical posltion
should not greatly alter the outflow characteristics. With this flow model
some low amplitude edge-tones will be generated by the transverse mixing of
the turbulent boundary layer even without the shear layer oscillation. This
inference 1s supported by the persistence of a low level first mode in the
modrfied tunnel, even when the shear layers are stabllized (Fig.37). This low
amplitude component could probably be eliminated by rounding the sharp leading-
edge at the top of every hole. This modification would be a formidable task
for 8000 holes. At supersonic speeds the rounded holes might introduce much
stronger shock waves which would spoil the Mach number distribution.
Apart from the fairly low level residual pressure fluctuations corres-
ponding with the first and third mode edge-tones, the pressure fluctuations
now approach those measured with all the holes sealed on the wind swept
surfaces (Flg.37). These pressure fluctuations vary from JnF(n)= 0.003 to
0.006 III the frequency range from 20 to 1000 Hz. The pressure fluctuations
only vary slightly with unit Reynolds number and are generally significantly
lower than those recently measured to the same degree of accuracy in the
top and bottom slotted section at subsonx and supersonic speeds (Fig.38).
4 DISCUSSION
The principal features which may determine the unsteadiness in slotted or
perforated working sections are now revlewed.
4.1 Unsteadiness in slotted sections with diffuser suction
The measurements in section 3.4 showed that the unsteadiness came from
the extraction region and was reduced by covering the slots with perforated
metal. Both slotted sections are serviceable. The 3ft x 3ft section (Pig.5)
1s occasionally used for force measurements on large subsonic models but
balance vibration problems are probable III the speed range from M = 0.75 to
0.90, where accurate drag measurements are important. The 3ft x 2.2ft section
(Fig.4) is used for most static and dynamic tests, although dynamic measurements
are sometimes dlfflcult and occasionally impossible at supersonic speeds.
The unsteadiness of other slotted tunnels operated with diffuser suction
may be reduced by coverIng the slots with perforated metal screens as in the
3ft x 3ft tunnel (Flgs.12 and 20) although this may alter the steady force 19 interference corrections . Moore and Wight have shown 20 that the large dynamic
Interference effects on a half model mounted III a top and bottom slotted tunnel
can be reduced to small proportlons at all speeds when perforated screens are

21
fitted behind the slots. Larger reductions in unsteadmess might be achieved
if there is an optimum position for the screens, perhaps corresponding with
the 'time-average' posltion of the dividing streamline of the slot flow. An
optimum position for the screen may exist because the HS 2ft x 2ft working
section with screens 18 mm (0.7 in) below the slots IS superior to the RAE top
and bottom slotted sectmn with screens 13 mm (0.5 in) below the slots
(Appendix B).
Measurements in the 3ft x 3ft tunnel suggest that even with screens
beneath the slots the peak excitation frequency or Strouhal number associated
with the slots width ws is (Fig.25)
s* = f ws/v = 0.035 ,
which is almost the same as the Strouhal number for the first edge-tone mode
for perforated tunnels with 60' inclined holes (Fig.33a).
New slotted tunnels should incorporate a reasonably large number of
narrow slots, because this will raise the peak excitation frequency above the
range of balance frequencies (typically 50 to 300 Hz) and lower the peak
ampflitude. Thus comparing Figs.20 and 19 the peak amplitude at M = 0.80 m the
3ft x 3ft tunnel falls from JnF(n)= 0.013 with 6 slots to 0.004 with
10 slots (a reduction remains even after making a linear adjustment for the
reduction in open area ratio from 10 to 8%). No waves have been observed 1x1
the NPL top and bottom slotted sections which have from 20 to 24 slots only
about 5.1 m (0.2 in) wide. A study of transonic similarity relations
appropriate to tunnel interference parameters suggests that 6 to 8 slots per
side are best 21 and open area ratios as low as 3% have been recommended 22 for
test.s up to M = 1.00.
The present tests also suggest that half slots in the corners of the
working section introduce additional unsteadiness (Appendix A). Pressure
fluctuations at the model can be further reduced by extending the working
section downstream (Fig.27), but the tunnel would then require a somewhat
higher pressure ratm.
4.2 Unsteadmess in perforated sections with diffuser suction
Fig.37 shows that the unsteadiness of a perforated tunnel may be reduced
to a level comparable with that of a closed tunnel by careful attention to
the geometry of the plenum chamber, the extraction region and the holes

22
(cf. F1gs.28 to 35). The unsteadiness of the perforated working section 1s
generally lower than that of the top and bottom slotted workmg section except
at frequencxs above about 900 Hz where weak edge-tones persist (Fig.38). The
improvement is particularly large at supersonic speeds where flutter tests
were previously most difficult m the top and bottom slotted section (Fig.38c).
The unsteadmess of both sections is of the same order as the unsteadiness
measured in three much larger wind tunnels (Appendix D).
Perforated tunnels mth 60' . Inclined holes may develop edge-tones if
although other parameters may influence the edge-tones.
J. Lukasuzwicz 23 recommended that 6*/d GO.5 to ensure linear interference
charactenstlcs for the cancellation of shock and expansion waves for
perforated walls at transonic speeds. Goethert 24 suggests that reasonable
interference characteristics can still be obtained if this criterion is
relaxed and
However application of this critermn will allow the development of edge-tones
as observed in the RAE 3ft x 3ft tunnel at low densities, the AEDC 16ft x 16ft
tunnel and the ONERA 6ft x 6ft tunnel (Fig.42b and c). These edge-tones may
be reduced by modifying the hole geometry as demonstrated first in the ONERA
6ft x-6ft tunnel and then in the RAE 3ft x 3ft tunnel. There will be probably
only a small alteration in the tunnel calibration, and the lift and blockage
corrections associated with this modification, because the hole flow
characteristics should only be slightly modified (see the discussion of Fig.36
In 3.5).
5 CONCLUSIONS
Flow unsteadiness and model vibration in the 3ft x 3ft tunnel have impeded
static and dynamc measurements at subsonic and transonic speeds. The
unsteadiness was measured with pressure transducers in both the 3ft x 3ft
tunnel and a l/9 scale model of the 3ft x 3ft tunnel and good agreement obtained.
For the closed 3ft x 3ft tunnel successive modifications to the balance
section and diffuser derived from tests of the model tunnel have reduced the
unsteadmess at subsonic speeds (Figs.12 and 17).

23
The unsteadiness in the slotted tunnels operated by diffuser suction originated in the extraction region and was reduced in the 3ft x 3ft tunnel
by covering the slots with perforated screens (Figs.12 and 20); the unsteadmess was still higher than in the closed tunnel.
The perforated and closed working sections of the model tunnel had nearly the same low level of unsteadiness and a similar result was achieved for the new perforated working section for the 3ft tunnel after some imtial difficulties. These included the generation of edge-tones at low unit Reynolds number, which were eliminated by a modification to the hole geometry.


The author would like to thank Mr. G. F. McCanless for indicating
(private commnication, May 1971) that Brown's formula for the edge-tone frequency is quoted incorrectly on p.18, as in several text books on acoustics.
The correct formula, given by Brown III Ref.19, has a constant
= 0.466
mstead of a constant
= 0.0466
quoted on p.18.
Thus although the measured Strouhal numbers for 60' inclined holes are
unaltered they are much lower than those predlcted by the correct formula together with the assumptions made on p.17 (Fig.33a).
In retrospect it is probably unwise to try to predict a Strouhal number for a complex threedimensional flow under a thick boundary layer (Fig.36) directly from the edge-tone frequency excited by a twodimensional jet strikmg a sharp wedge, for Brown did not investigate the effects of variations m wedge angle or wedge inclination appropriate to Jets. The fundamental question remaxx If 60' inclined holes really do emit edge-tones. McCanless discusses this questlon in some detail*. He concludes that 60° inclined holes do emit edge- tones and that there is an analogy between the critical ratio of boundary layer thickness/hole diameter (6*/d, p.22) at which the holes start to emit noise and the critical ratio of jet thickness/jet separation distance at which a sharp edge starts to generate edge-tones**. McCanless also supports the critrcal ratio of 6*/d given on p.22 by addItIona experiments.
*G. F. McCanless J. R. Boone
**K. Karamcheti et aL
Noise reduction in transonic wind tunnels (paper in preparation).
Some features of an edge-tone flow field. NASA SP 207 pp.275-304 (July 1969)


25
Appendix A
ADVERSE EFFECT OF CORNER HALF SLOTS
Some brief tests were made with 2 configuratrons of the model tunnel:
Configuration Open area ratio 4 half slots 4 complete slots % -
1 3.3 open Closed
2 6.7 Closed Ope*
The working section unsteadiness was much higher for Configuration 1 than
for Configuration 2 and extended over a wider frequency range (Fig.39) although the open area ratio was only 3.3% Instead of 6.7%. Hence half slots III the corners of the workrng sectron apparently introduce excessive unsteadrness.
One tentative explanation for thus effect is illustrated in the small insert in Frg.39. The pair of vortices formed by flow into the plenum chamber from complete slots are equal III magnitude and opposite in sign; they probably drffuse rapidly 111 the extraction region giving zero total circulatron. In
contrast the single vortex formed from the corner half slot may persist 1x1 the corner of the diffuser inducrng additIona streamline curvature and momentum transfer and hence addltional pressure fluctuations. (Even without the half slots strong secondary flows exist in corner boundary layers.)
In the 3ft x 3ft tunnel the half slots in the slotted transonic section are now covered wrth perforated screens and could be completely eliminated.
Wrth the top and bottom slotted section the corner half slots provide clearance to avoid damaglng the side walls of the supersonic working sectron, and
cannot easrly be eliminated. For this reason they are not covered with perforated screens.

26
Appendix B
UNSTEADINESS MEASLJREMENTS IN OTHER SLOTTED TUNNELS
This appendix presents observations made in 2 other slotted tunnels with diffuser suction.
The HS 2ft x 2ft tunnel at Hatfield“ has 5 complete slots/side. com- parative buffetmg tests on Model B of Ref.1 Indicated that at the wing
fundamental frequency of 280 Hz this 2ft x 2ft tunnel had much less unsteadi- ness than the unmodified RAE 3ft x 3ft tunnel which superficially had a similar slot geometry. (A detailed comparison made in Fig.40 suggested that the
significant differences between the tunnels were the presence of perforated metal under the slots and the absence of corner half slots in the HS tunnel.) Spark schlieren photographs in August 1963 confirmed that there were only weak waves in the working section of the HS tunnel at subsonic speeds. The first wall pressure fluctuation measurements ware made in December 1966 when the working size was 0.61 m x 0.61 m (2 ft x 2 ft). The tunnel total pressure was just below atmospheric. The initial measurements Qig.41) ware made without
any recirculation of exhaust gases at a total temperature Tt of 16'~. The spectra are flat with a general level of JnF(n)= 0.0005. This level is about the same as that in the 3ft x 3ft tunnel with the closed working section and must be close to the practical limit. This unsteadiness is better than in the modified 3ft x 3ft top and bottom slotted section (Fig.19) and has a smaller Mach number variation. The measurements were continued with recirculation of exhaust gases and Tt = 84'C (the normal transonic operating temperature used
in the buffeting tests of Model B). There was no difference between the spectra at Ttm= 84'C and 16'C at the first test Mach number M = 0.50 but the
transducer then developed an electrical fault (attributed to the effects of temperature gradient in the transducer) and the tests were terminated. Since there was no difference between the spectra at Tt = 84'~ and 16'C at M = 0.50 the differences at higher Mach numbers were probably small (owing to the relatively small increase in the maximum section velocity) and Fig.41 then represents a fair approximation to the working section unsteadiness at Tt = 84'C. The values of excitation m. q at the wing bending frequency for Model B derived from these spectra show little variation from M = 0.50 to 0.90 and explain the flat curve of wing response to tunnel unsteadiness in this tunnel (Fig.10, Ref.1).

Appendix B 27
The second set of measurements was made in February 1970 with Improved instrumentation (2.2) when the working section .s~ze had been increased from 0.61 m x 0.61 m (2 ft x 2 ft) to 0.76 m x 0.61 m (2.5 ft x 2 ft). The tunnel unsteadiness is still quite low, despite the increased velocities in the
maximum sectlon, but shows some increase compared to the original measurements at M = 0.50 and 0.90, although being unchanged at M = 0.80.
The intermittent 20in x 20in in HS transonic tunnel at Woodford has 9
complete slots 11.7 mm (0.46 in) wide and 2 half slots/side and some spark
schlieren photographs were taken in May 1964. The schlieren photographs (not reproduced here) clearly show strong normal waves in the working section at
subsonic speeds but only weak inclined waves at supersonic speeds (cf. Fig.11 for the 3ft x 3ft tunnel). The principal wave frequency deduced at M = 0.83 is about 780 Hz, which gives a Strouhal number based on the slot width ws of
s* = f wsfV = 0.033 .
This compares very well with the 3ft x 3ft tunnel values (Fig.25). The complete slots on the 20in x 20in tunnel are covered with perforated screens but the corner half slots are not covered. The existence of strong waves suggests that either the position of the perforated screen below the slots or the presence of half slots may be important. The model balance frequencies are
much lower than the peak excitation frequency (780 Hz at M = 0.83) and there have been no balance fatigue failures. Small vibrations have been observed on some balance measurements.
Some spark schlieren photographs taken when the 20in x 20 in tunnel was
driven by jet engines and had a poor temperature distribution also showed normal waves in the working sectlon.
28
Appendix C
UNSTEADINESS MEASUREMRNTS IN OTHER PERFORATED TUNNELS WITH 60' INCLINED ROLES
There was initially no information available on the unsteadiness of
perforated tunnels operated with diffuser suction larger than the model
RAF 4in x 4in tunnel. Measurements on a larger tunnel seemed desirable and so
some tests in the ARDC lft x lft perforated tunnel at Tullahoma, USA were
requested. This tunnel has similar hole geometry to that selected for the
3ft x 3ft tunnel; viz. 60' inclined holes and an open area ratio of 6%.
The working section wall pressure fluctuations ware measured with 100%
auxiliary suction (the normal operating condition as reported in the previous
measurements of Ref.26) and then wrth 100% diffuser suction (obtained by extend-
ing the diffuser flaps). The measurements reported in a private communication
show (Fig.42a) no significant difference between the total rms pressure
fluctuations for the 2 tunnel operating conditions. This result implies that
the extraction region of a perforated tunnel operated with diffuser suction
makes only a small contribution to the working section unsteadiness. This is a
valuable confirmation of the model tunnel results presented in Figs.22 and 23.
The previous measurements in the AEDC lft x lft tunnel 26 suggested that the
unsteadiness was concentrated at discrete frequencies associated with the
compressors and was transmitted from the maximum section into the working
section. There was no evidence of edge-tones, possibly because the pressure
fluctuations above 1250 Hz were removed by a filter 26 . There is some evidence
that edge-tones are generated by the inclined holes in the working section of
the AEDC 16ft x 16ft tunnel. Thus Fig.42b, (based on Fig.13 of Ref.27) shows
a Strouhal number of 0.052 at M = 0.60 and 0.70, which is almost identical with
that measured in the 3ft x 3ft tunnel (cf. Fig.33a). The amplitude of the
pressure fluctuatrons are JnF(n)= 0.027 and 0.036 respectively, of the same
order as those measured in the RAE 3ft X 3ft tunnel and the ONRRA 6ft x 6ft
tunnel (cf. Fig.33b). In the ARDC 16ft x 16ft tunnel the Strouhal number falls
to 0.043 and m falls to 0.011 at M = 0.80. This parallels the behaviour
of the first edge-tone mode in the 3ft x 3ft tunnel shown in Fig.33. The total
rms pressure fluctuations p/q also appear to increase as total pressure is
decreased (Fig.11, Ref.27). Although some of this increase may be attributed
to the increased effect of electronic noise it may also reflect higher values of
JnFog enerated by larger areas of the sidewalls exceeding the critical ratio
of 6*/d (cf. 3.5).

Appendix C 29
The ONERA 6ft x 6ft transonic tunnel at Modane operates with diffuser suction and has perforated walls with 60' ' inclined holes and an open area rat10 of 6%. Wall pressure fluctuations were measured III this tunnel in preparation for some buffetingI measurements. Some typical spectra are shown in Flg.42~.
The spectra are flat except from M = 0.68 to 0.90 when there are large pressure fluctuations at 500 Hz from the edge-tones. A change in hole geometry
subsequently eliminated these edge-tones 16 . The residual unsteadiness in the ONERA 6ft x 6ft perforated working section is characterized by flat spectra
with a relatively low level of excitation. Comparable edge-tones were sub- sequently measured in the RAE 3ft x 3ft tunnel at low Reynolds numbers and
eliminated by a similar change III hole geometry (3.5).
Some addltional noise measurements in perforated tunnels with 60' inclined
holes have been recently reported 28,30,31 . Ref.30 is particularly interesting,
because the hole Strouhal number at M = 0.775 is about 0.05 and the level Am- = 0.05, closely resembling those measured in the RAF 3ft x 3ft and ONERA 6ft x 6ft tunnels.

30
Appendix D
UNSTEADINESS MEASUREMENTS IN 3 LARGE WIND TUNNELS
Some pressure fluctuations measured when assessing the suitability of 3
large nod tunnels for dynamic tests are presented. These measurements set the unsteadiness levels achieved in the RAE 3ft x 3ft tunnel in a wider perspective.
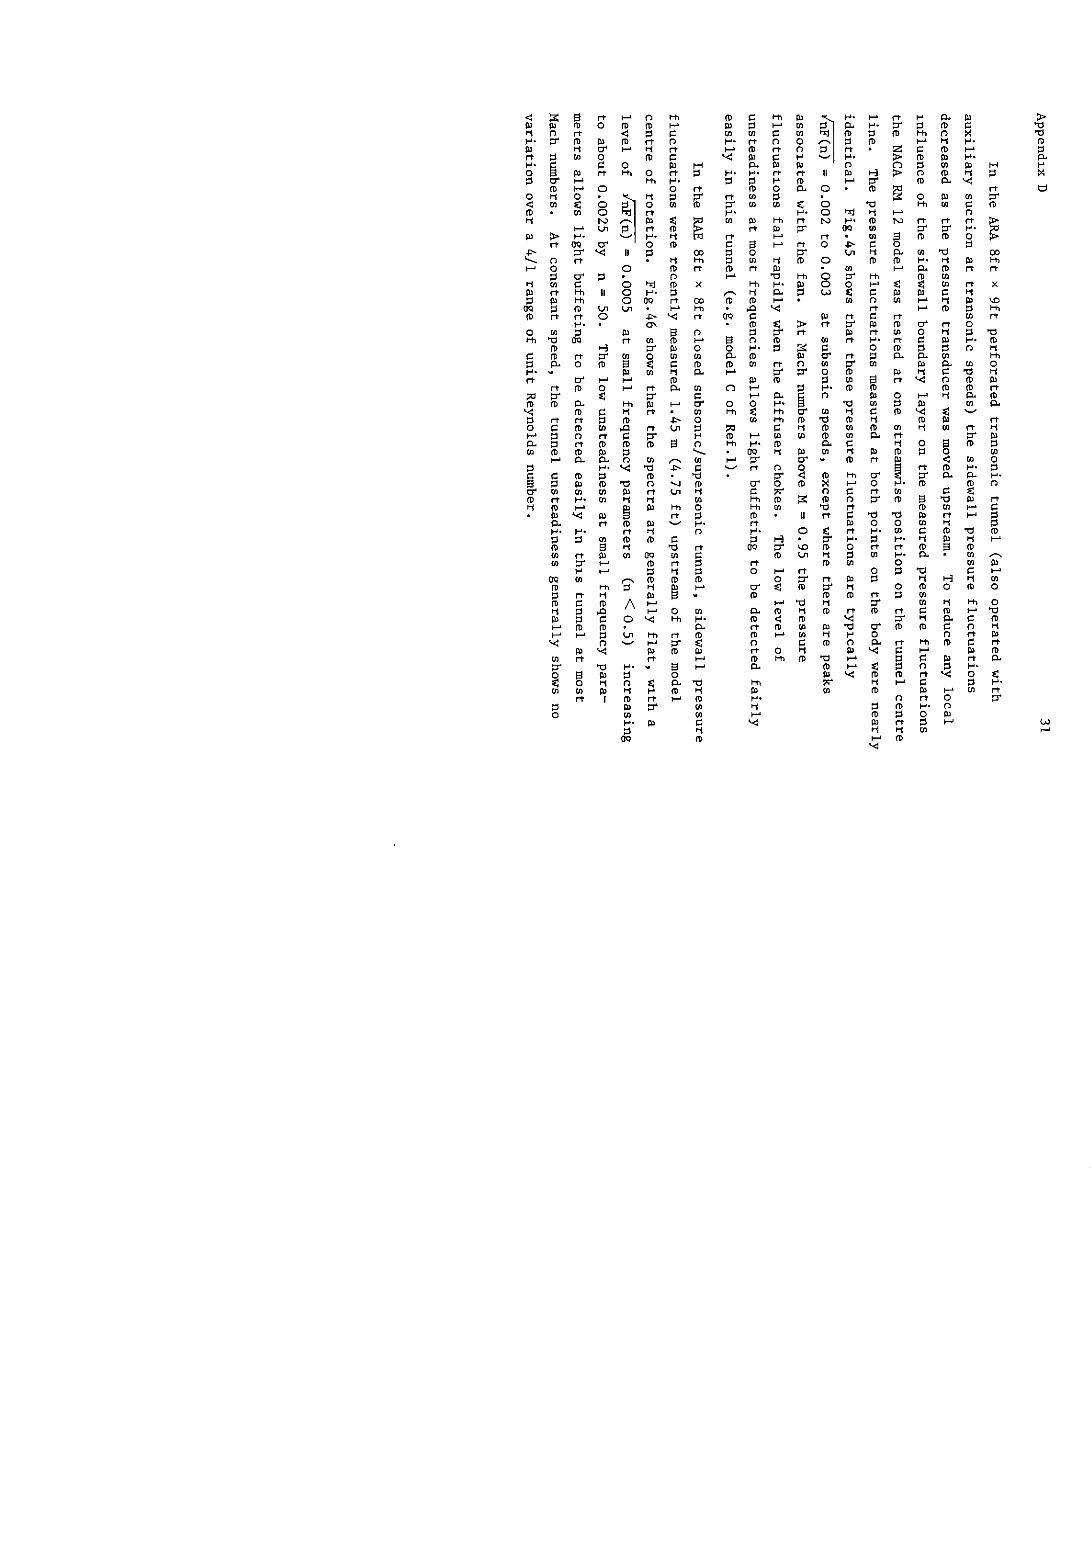
In the RAE 8ft x 6ft slotted transonic tunnel (operated with auxiliary suction at transonic speeds) the spectra (Fig.43),measured on the centre of a slat,up to M = 0.65 are characterized by high peaks associated with the fan, which is immediately downstream of the working section. The peak frequencies are given by the relation
f 0-m = N x (number of fan blades) x fan rev/set
where N = 1, 2, 3 etc.
The unsteadiness level at the peaks is high, e.g. at M = 0.65
f Hz N JnF
140 1 0.036
290 2 0.020
530 3 0.009
At M = 0.70 and higher speeds these peaks are largely suppressed and the general
level of unsteadiness falls to about e= 0.005. Additional measurements were also made near the nose and at the maximum section of a NACA RM 12 model mounted on the tunnel centre line. Fig.44 shfis a com~,~$s;n,bqtween the
-/ *"I presiure fluctuations measured near the nose of the body U on the tunnel side-
wall. The agreement is fair at low values of unsteadiness and good at the much higher unsteadiness at the peak frequencies. Some differences must be expected because of the differing contributions to the measured pressure
fluctuations from the boundary layer on the tunnel slat and from the boundary Iayer on the curved surface of the model. Interaction between the local con- straints imposed by the model and its sting (supervelocities and curvature) and the tunnel unsteadiness may also account for some of the differences. The unsteadiness level in this tunnel is too high for dynamic tests at the peak
frequencies.


37
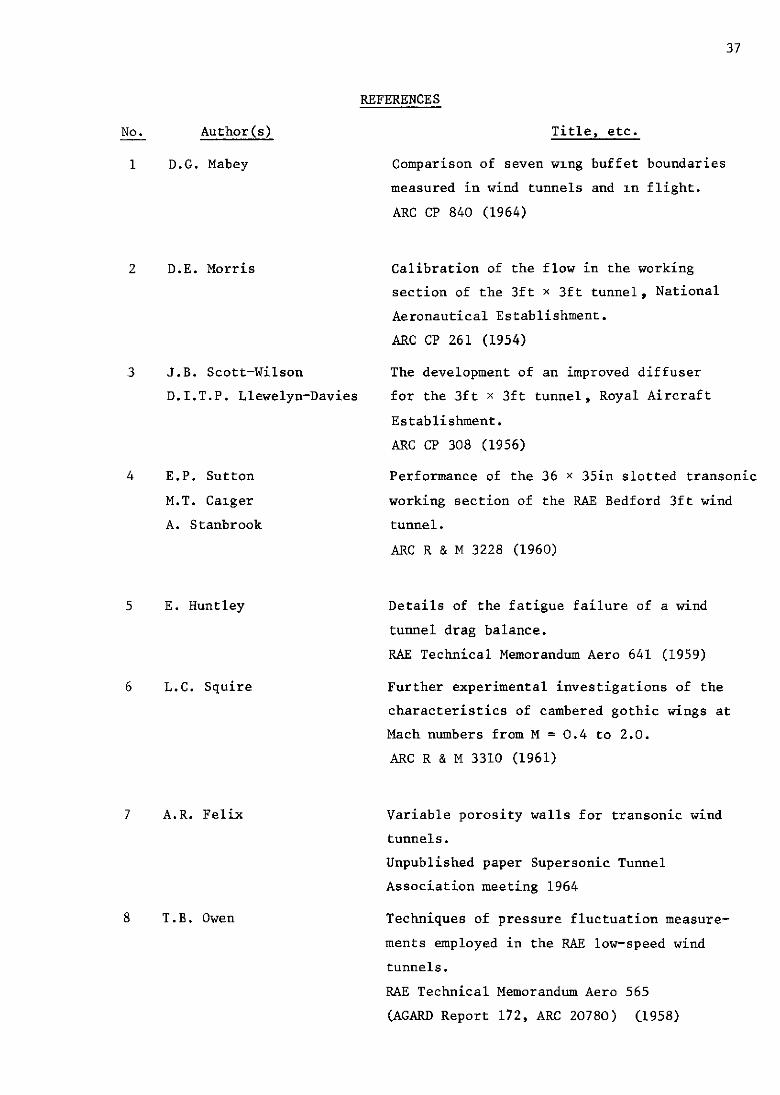
NO. Author(s) -
1 D.G. Mabey
2 D.E. Morris
REFERENCES
Title, etc.
Comparison of seven Wang buffet boundaries
measured in wind tunnels and III flight.
ARC CP 840 (1964)
Calibration of the flow in the working section of the 3ft x 3ft tunnel, National Aeronautical Establishment.
ARC CP 261 (1954)
3 J.B. Scott-Wilson The development of an improved diffuser
D.I.T.P. Llewelyn-Davies for the 3ft x 3ft tunnel, Royal Aircraft
Establishment. ARC CP 308 (1956)
4 E.P. Sutton
M.T. Calger A. Stanbrook
Performance of the 36 x 35in slotted transonic
working section of the RAE Bedford 3ft wind tunnel.
5 E. Huntley
6 L.C. Squire
7 A.R. Felix
8 T.B. Owen
ARC R & M 3228 (1960)
Details of the fatigue failure of a wind
tunnel drag balance. RAE Technical Memorandum Aero 641 (1959)
Further experimental investigations of the characteristics of cambered gothic wings at Mach numbers from M = 0.4 to 2.0. ARC R & M 3310 (1961)
Variable porosity walls for transonic wind tunnels. Unpublished paper Supersonic Tunnel Association meeting 1964
Techniques of pressure fluctuation measure- ments employed in the RAE low-speed wind tunnels. RAE Technical Memorandum Aero 565
(AGARD Report 172, ARC 20780) C1958)

38
No. Author(s) -
9 T.B. Owen
10 W.R. MacDonald
11 D.G. Mabey
12 E.P. Sutton
13 A. Roshko
14 H. Eggmk
15 J.L. King
16 J.M. Christophe J.M. Loniewski
17 G.B. Brown
18 D.G. Mabey
19 D.R. Holder
REFERENCES (Contd.1
Title, etc.
An interim note on measurements of airflow unsteadiness 1x1 several RAE wind tunnels. RAE TechnIcal Memorandum Aero 634 (ARC 20936)
(1959)
A sub-miniature differential pressure transducer for use in wind tunnel models. RAF, Technical Note Inst 169 (1961)
Aerodynamically induced vibration in coolers.
RAE Technical Report 65098 (1965) Journal Roy. Aero. Sm., December 1965
The development of slotted working section liners for transonic operation of the RAE
Bedford 3 ft wind tunnel. ARC R & M 3085 (1955)
On the wake and drag of bluff bodies.
J. Aer. Sci., Vo1.22, p.124-132, February 1955
On unsteady processes in high speed tunnels. Vdlkenrode Translations RT 948, September 1947
Instability m slotted wall tunnels. _- Journ. Fluid Mech., Vo1.4, p.283, July 1958
Reduction of pressure fluctuations in a transonic test section. ONBRA unpublished
The vortex motion causing edge-tones. Physical Society 49, p.493 (1937)
RAE unpublished
Upwash interference on wings of finite span in a rectangular wind tunnel with closed
side walls and porous-slotted floor and roof. ARC R & M 3395 (1965)

39
No. Author(s)
20 A.W. Moore K.C. Wight
21 S.B. Berndt
22 H.H. Pearcey
23 J. Lukasiewicz
24 B.H. Goethert
25 J.A. Kirk
26 J.E. Robertson
27 H.L. Chevalier
H.E. Todd
REFERENCES (Contd.)
Title, etc.
On achieving interference-free results from dynamic tests on half-models in
transonic wind tunnels. NPL Aero Report 1293 (1969)
Theory of wall interference III tramsoniC
wind tunnels. Symposium Trans-Sonicum (ed. Oswatitsch) Sprmger-Verlag, Berlin, p.288 (1964)
Some effects of wind tunnel interference observed in tests on two dimensional aero-
foils at high subsonic and transonic
speeds. AGARD Report 296 (1959)
Effects of boundary layer and geometry on
the characteristics of perforated walls for
transonlc wind tunnels. Aero Space Engineering, Vo1.20, No.4 (1964)
Transonic wind tunnel testing. Pergamon Press, p.269 (1961)
Design and operational problems of the trrvnsonw jet-driven wind tunnel.
Journ. Roy. Aero. Sot., Vo1.62, January 1958
Measurements of the pressure fluctuations in
the test sectlon of the 1 ft transonic tunnel in the frequency range from 5 to 1250 c/s. AEDC-TDR-62-109, May 1962
Measurement of the pressure fluctuations in
the test section of the 16ft transonic circuit III the frequency range from 5 to
1000 cjs . AEDC-TN-61-51, May 1961

REFERENCES (Contd.)
Title, etc.
Application of the techniques for evaluating
the acoustic sources of background noise in wind tunnel facilities.
TR NAS s-20336, March 1969
Analysis of factors influencing the stability characteristics of symmetric twin-intake air-induction systems.
NACA TN 2049, March 1950
Measurements of fluctuating pressures in an 8ft x 6ft supersonic wind tunnel for Mach number range of 0.56 to 2.07. NASA TMK 2009, May 1970
Additional correction of 4X Saturn V protuber- ance test data. US Chrysler Corporation (Space Division). Technical Report HSM-Rl-71, January 1971
NO. Author(s) -
28 J.R. Boone G.F. McCanless
29 N.J. Martin
K. Holzhauseh
30 R.J. Karabinus B.W. Sanders
31 G.F. McCanless
Return circuit
Aerodynamic noise from plpewor k
I I
I f
Unsteadiness from -Plenum chamber --- _-_---_-_-_-__-- plenum chamber floLu
Ventlloted W S slotted or perforated - Llnsteodlness from _- - -_ -- ---- --- extractlon reqlon
LOUJ frequency ed e-tones from diffuser COI ectors 7
Fig.12 Sources of unsteadiness in transonlc tunnels

o-04 Tunnel
unsteadiness
d%J O-02
o-01
O-008
0.006
0.004
0.002
o-001
1
Worklnq sectlons =I 3sfottClF wE2ft
3ft x 2.7ft perforated
X Axial force 1Balance failure X I
i lmposslble
Impassible
Marqmal i Adequate I
Adequate ! Good
FigqT Tunnel unsteadiness criteria for buffetlng tests
Steel shell
V Contraction ratlo 40/l
E,e”ati.n(OTQ’)
Sidewall Dressure
Plan view oilers extende
a General arrangement
Fig 3 3ft x 3ft tunnel - closed working section

-snq jack
Ortqmal spoilers
Orlglnal Revised Mobile diffuser
b Balance section for closed working section c New spoilers
Fig.3 contd 3ft x 3ft tunnel-closed working section

Open area ratio 1 i”L. 1 Td% 8 complete slots 4 t slots
Pi Quadrant - Steel- shell _
Contractlon ratlo 55/l
a Elevation
Sideruall pressure transducer
b Plan view
Fig.4 3ft x 3ft tunnel-top and bottom slotted working section

Screens Harco pattern 91 hole dla Z-16 mm open area ratlo 33 %
I N B No screens over half slots I
25mm
Y mm
12.5
sJ=T on parallel
sectlon Ortqrnal perforated channel screen x-o to 2.95 m (116 m)
Fmal perforated flat screen
x=l.lZm to 2.95m c Section across complete slot
Slat
. _ 1 CL
0.5
Wrien Slot
I I I I I 20 40 60 80 100 x I20 (Ill)
Al Al I!0 (m) Olstance dolunstreom from throat
d Slot and screen geometry
Fig.4contd 3ft x 3ft tunnel- top and bottom slotted working sectton

Mobile diffuser balance sectton
Contractlon a Elevation
rat.10 41/l Slat pressure
b Plan view
Fig 5 3ftx 3ft tunnel- slotted working section

,Woodcn slat ,3 mm (0.12 In) rad
b30m (12 In) deep ’ Perforated flat screen added Plenum chamber Marco pattern 208
Hole dla 6 3mm (O-Z5tn) Open area rat10 50%
75
3
(“4
50
25
C Section across complete slot
/ II centre o/ rotation
I I I I I I 20 40 60 80 90 100 x 120 in
I!0 2l.O J!O m
,O
I”>
5
.O
,5
.O
1.5
Distance downstream of throat d Slot and screen geometry
Fig5 contd 3ft x 3ft tunnel slotted working sectton

Open area ratio 6"/, Hole diameter-plate thickness- 9-55mm (0.375m) Holes 60’ to normal
diffuser spoilers
Transonlc worklnq sectlon Transonic Moblle diffuser balance section
Q Elevation Contractlon ratio 45/l Plenum chamber
pressure transducep
Sidewall/ tul
pressure transducer b Plan
Fig.6 3ft x 3ft tunnel-perforated workrng section
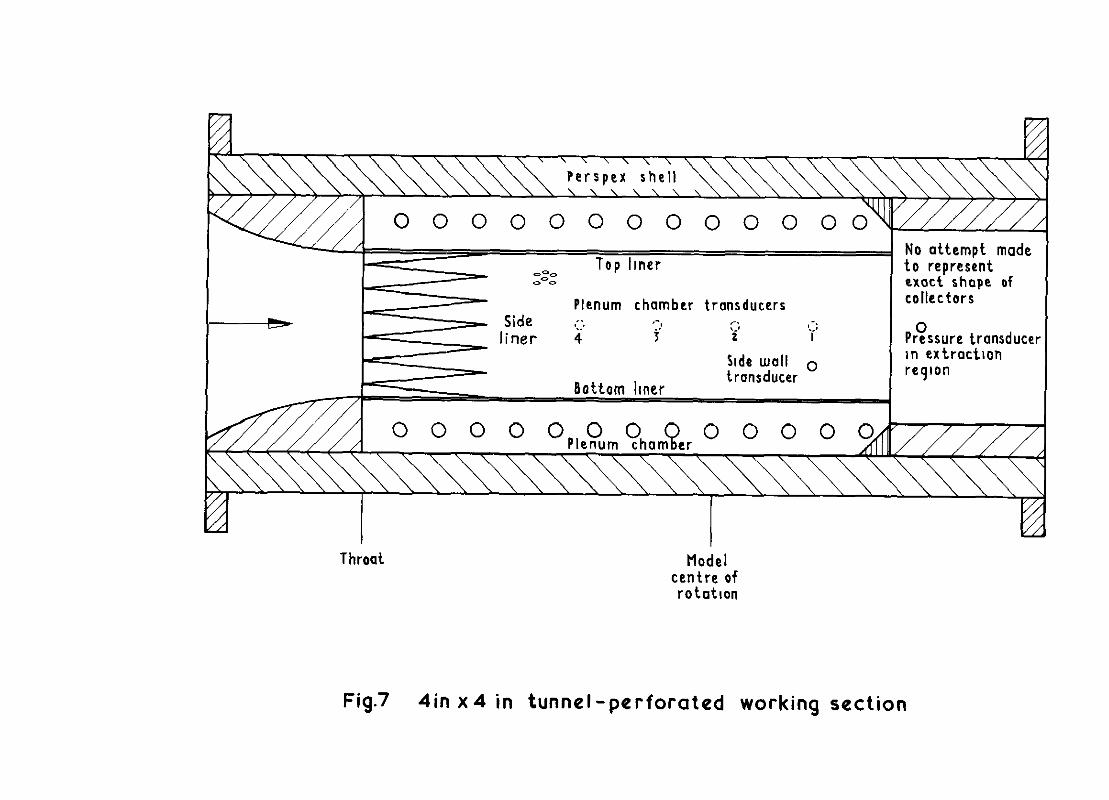
Plenum chamber transducers
in extraction
Throat Node1 centre of rototlon
Fig.7 4in x4 in tunnel-perforated working section

Plenum chamber
5 mm CO-375 In 079mm (0 031 j In
0.79 mm (0 031 In)
Fl0L.U
dIrectIon w
Fig.8 Geometry of perforated walls 3ft x 3ft and 4in x 4in tunnels

ST
=0*25C,
IJ Stlnq uuth Internal strain qauqe balance
Natural frequency of vlbratlon In the axial force direction 140 HZ
Natu the
Winq section
Fig 9 Slender wing

Y


GQi) _ n, XX
0.005 - / X
0 , I
@-kw o-5 M
t Posed working
0.015
4iF@)
0.010
O*OO!
% 1 Diffuser fairlnq out x/~
7 \ ?
Top and bottom slotted section
Tunnel unsteodlness 6@i) and model vlbratlon u/q Both at 140 Hz
I I 0.5 pj I.0
Slotted section 0.5 M I.0
1500
1000
Fig.12 3ftx 3ft tunnel- comparison of unsteadiness and model vibration in different working sections

0.030
&Tfi) 0.025
0.020
o*or5
0.010
0 005
Flq. 13 3ft
Diffuser organ p:fe resonance
It0 Hz
i’\ \ : ‘\
2”: 220Hz
Diffuser falrrnq out
w-&/l _ O’ff”_““T_f!x!! in \__---
I I I I I I I I I I 0.05 0.1 0.2 o-4 0.4 O-8 I.0 2.0 4.0 6-O B-0
x3ft tunnel - pressure fluctuations in closed working section wit{-% diffuser fairlnq M = 0.80
1-O
without

/
& < . c

&lj5 0.030 -
41n x 4tn -.. .,... n ---- >tt x >tt
O-025-
0.020 -
0.015 -
0.015 - a DiFfuser fairlng out
0 0005-
----- I l-t-f
- o-02 0.04 0.06 008 01 0.2 04 0.6 0.8 1.0 2.0 4-o ----ii.0 80 IO.0
b Diffuser fairmg In n=fup
Fig.15 Comparison of pressure fluctuations in closed working sections of 3ft x 3ft and 4 in x 4 in tunnels M = O-80
SuDersonlc balance
0.005 - #- -. 2----------N
0 -M=O.67
Fig 16 4in x 4in tunnel- pressure fluctuations in closed working section with original and revised balance sections

0
0 010
0 00:
0
0.005
0 J
0 005 - 1
0 M=(J.60 I I I f I f I I
0.01 0 02 0.04 006 048 0.10 020 020 0 0 40 40 0 0 60 60 0301-O 0301-O 2.0 2.0 4,o 4,o 6.0 6.0 8.0 8.0 IO.0 IO.0
- Supersomc balance section-diffuser faIrIn In
M=I+075 ---- Revised balance sectlon 1
n =f u/v
Fig.17 3ftx 3ft tunnel - pressure fluctuations in closed working section with original and revised balance sections

0 005 1 M-0.98
O- Supersonic balance section-diffuser famnq in
---- P.,“,‘tiil”,“R bal ante
i-J 010 -
a.005 - ----_
o M=O-91 --------__--_----e-m
0 015 -
0 005 - o ---_
0.01 0.02 0.04 0 06 008 0.10 0.2 0,4 0.6 0 8 I.0 24 n-f U/V
Fig. 16 4in x 4in tunnel- pressure fluctuations in closed working sectlon with original and revised balance sections

-
0
0.010
O-00!
0
0 00:
0
o*oo:
0
0,005
0
L -
A
- 1
1=1*075
SupersonIc balance section - diffuser famnq In
---- Revised balance sectlon
1=0 60 < __- me- cc---
I I I I + I I/ I 0 02 ’ WI4 , 006 0. 0 40 0 60 0.80 I-O 2.0 40 6-O 8.0 IO.0
n-f w/v
Fig .I7 3ftx 3ft tunnel - pressure fluctuations in closed working section with original and revised balance sections

0 015 dzjq
o NO -0rlamal balance 3
0005 Rewed balance o--------
0 sect,on - -- -- --- .
section ’
---- 1 I I I I I I I I I 0.01 0 02 o-04 O-06 048 0 IO 0.2 0.4 0.6 O-8 I.0
n=fur/v
Fig 18 4inx4tn tunnel-pressure fluctuations on quadrant M= 2.0
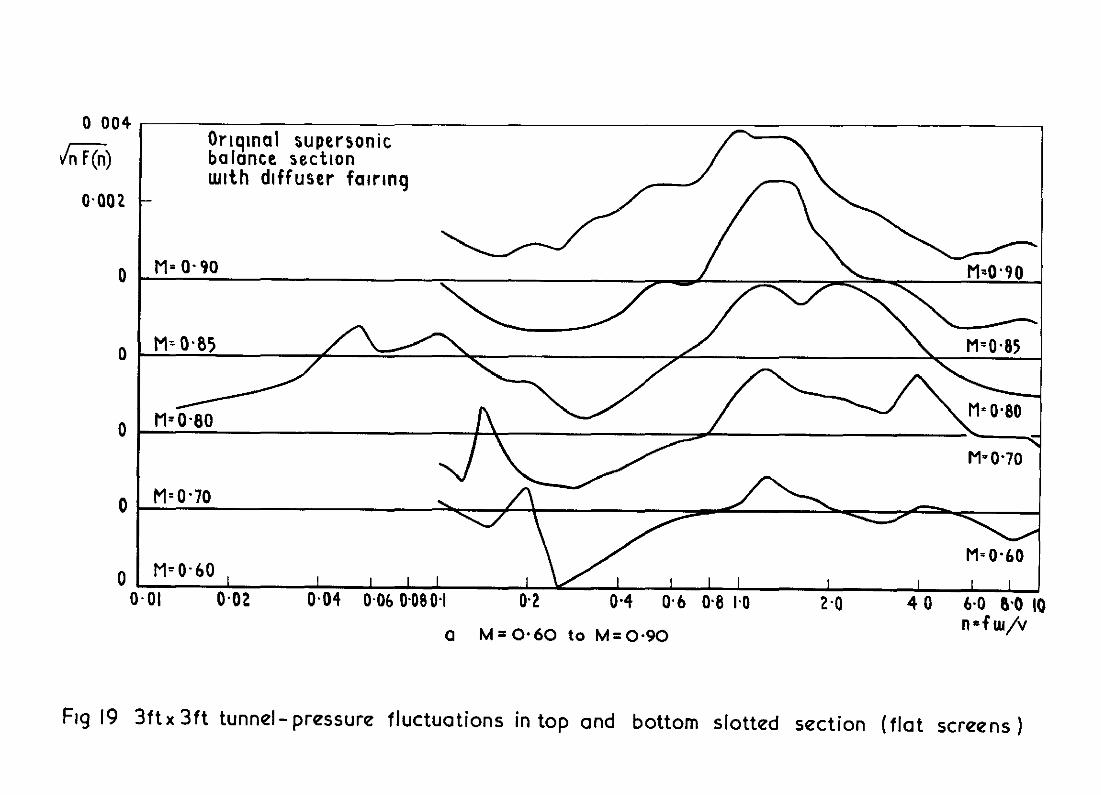
0 004
AT&
0.002
0
0
0
0
0
Orlqlnal supersonic Orlqinal supersonic balance sectron balance sectron wth diffuser fawlnq wth diffuser fawlnq
M= O-90 M= O-90
Mz 0.80 Mz 0.80
M- 0.70 M- 0.70
M=O.70 M=O.70 - -
M- 0.60 M=O-60 , I I I I I I I I I I I I
II o-02 0.04 0.06 0.080-I 0.2 0.4 0.6 0.8 I.0 2.0 40 6.0 8.0 10 n=f uI/v
Fig 19 3ftx 3ft tunnel- pressure fluctuations in top and bottom slotted section (flat screens )

hiT(i) 0.002
0
0
0
0
0
M=O-95
=o-95
=I-28 I I I I I I I I I I I I I I
I 0.02 O-04 O-06 0.080-I 0.2 0.4 0.6 o-8 I.0 2.0 4-o 6.0 8.0 IO n=f u/v
b M=0.95 to M=I*28
Fig 19contd 3ft 3ft tunnel- pressure fluctuations in top and bottom slotted section (flat screens)


m#‘5 0~010 - 0.005
0
o-005
0
0.005
0
o-005
0
O-005
0 ,04 0.06 O-00 0-I O-2 0.4 0.6 0.8 I.0
b M=O-90 to M=I-20
Fig. 20contd 3ftx 3ft tunnel comparison of pressure fluctuations in slotted working section

I \ \
I I I I
m C .-
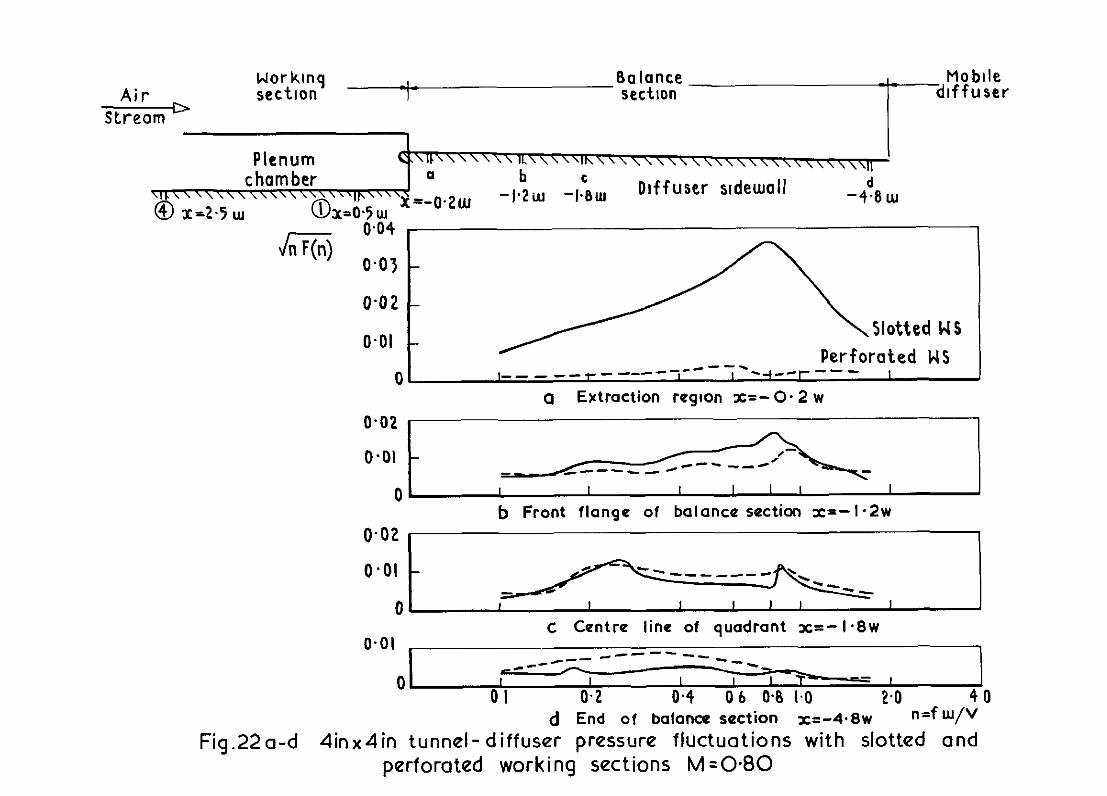
Air Stream D
VT.\\\\\\\\\\\\\ @ x-2.5 UJ
~~~\~~~\\1C\\\\\lh\\\\\\\\\\\\\\\\\ I
a b \\ \ \\,,
C Diffuser sldeuJall
-0.ZUJ -‘.*l” -‘-Blu -4s w
D-01 -
0
Slotted WS
Perforated WS __ _ _- - ----- ----. N _- --- I
a Extraction region x=-O. 2 w D-02
0’
0.02
I I I I I I I b Front flange of balance section x=-1.2~
O-01 -
O- , I I I I I I
o-01 c Centre line of quadrant x=- 1-8~
----- -- __ r
0 I I I 01 0.2 0.4 0 6 0.8 I.0 2.0 40
d End of balance saction XI-4.8~ n=f w/V
Fig.22a-d 4inx4in tunnel- diffuser pressure fluctuations with slotted and perforated working sections M =0*80

0~010
diqii)
0.008
O-006
o-004
0*002
M=0.130 -c-.
O-04
#H R-5--
----- /.((
I I
0.10 o-2
a M=O-80 to M=O-86 n=flu/v
Fig 23 4inx 4in tunnel -comparison of pressure fluctuations in slotted and perforated secttons
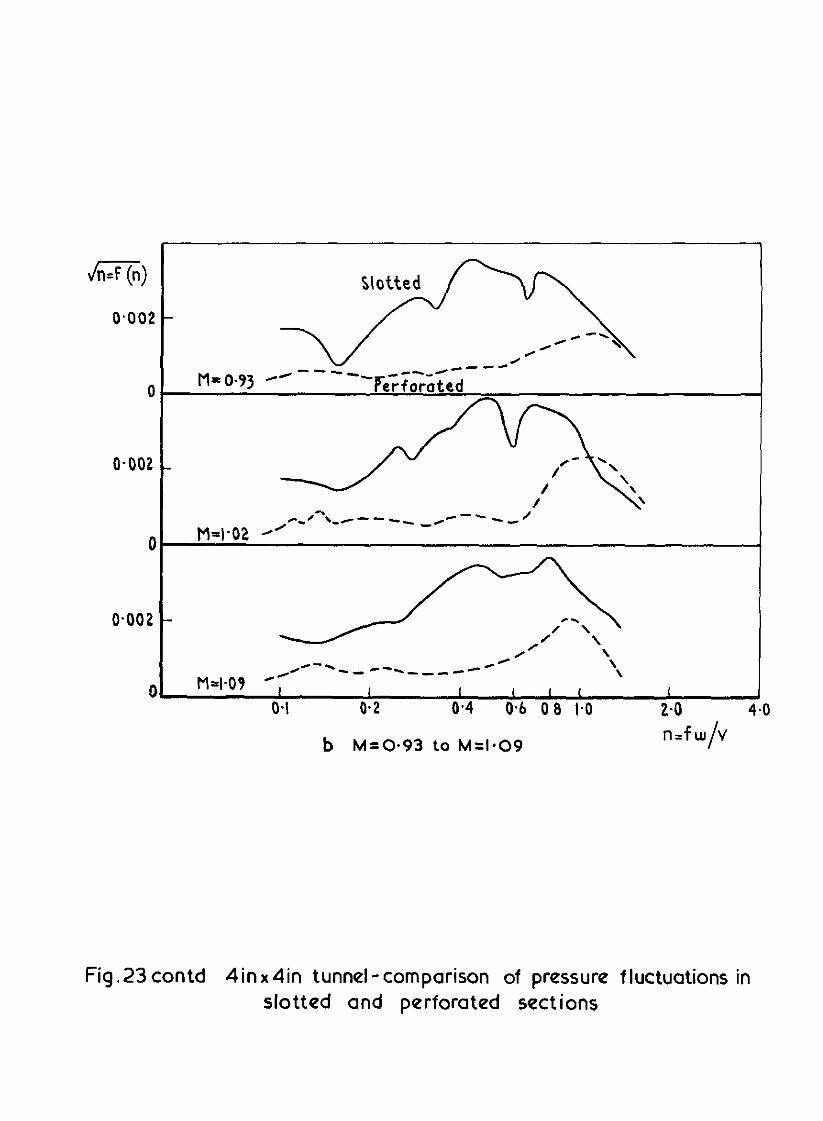
Cl.002 -
0 M3 0.93
o-002 -
o.,,I- ;
\ /C-. -_ --I m-w-- CH \
PM*09 ‘; \
0 I I I i I I 0.1 0.2 0.4 0.6 0 8 I.0 2.0 4.0
b M=O-93 to M=I.09 n=f w/v
Fig.23 contd 4inx4in tunnel-comparison of pressure fluctuations in slotted and perforated sections
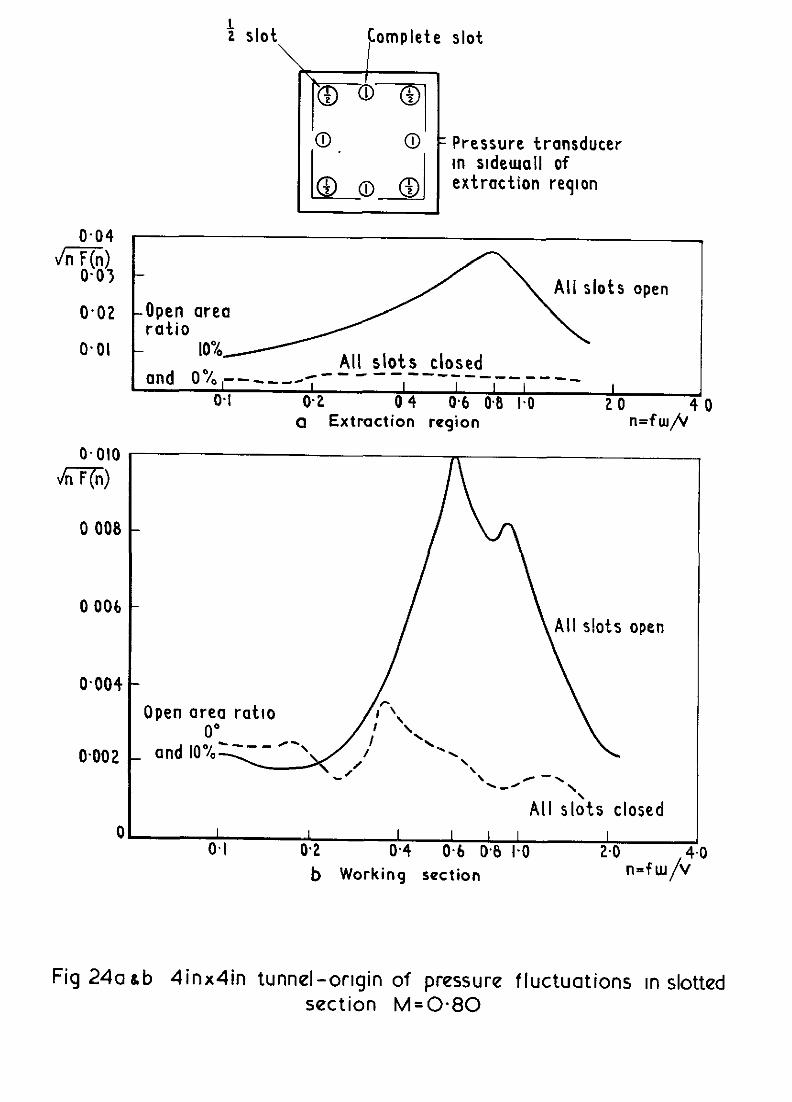
1 2 slot Complete slot
k? 00 @ 1
Pressure transducer m sldeurall of extraction reqlon
0006
fill slots open ,
Yiiyo :i~l~s c,osed \ an(j O%---,,,------------------ I I I I
0.1 0.2 04 0.6 03 I4 20 40
Open area ratlo area ratlo Open
_ and
a Extraction reqion n=fu/l/’ -
\ \ \ \ .,H .,H /-\ /-\
All skts closed All skts closed 01 I
0.1 I I I I I I
OS! 0.4 0.6 0.8 I.0 2.0 4-o b Working section n=fu/v
Fig 24a sb 4inx4in tunnel-origin of pressure fluctuations In slotted section M=0*80

7.0 n=fu/V
2.0
I.0
0 IO
S*=f ills/v
OTI!
[:
M=O.80 M=O 05
+ 0 +
bottom slotted
3.0
n
2.0
I.0
0
+ 0 +
t ?ft 4+m
Y Slotted
bottom slotted
a II based on tunnel width w
M-0.80
0 + O +
t t t t 3ft 4ln 3ft 4m
-w Top and bottom slotted
0 II
5’
O-0
0
M=O-85
0 + 0 +
3tft 4?ns Jtt 4)ln \ Y I \
Top and Slotted bottom slotted
b S* based on slot width ws
Fig 25ar b Frequency of peak excitation In slotted working sections
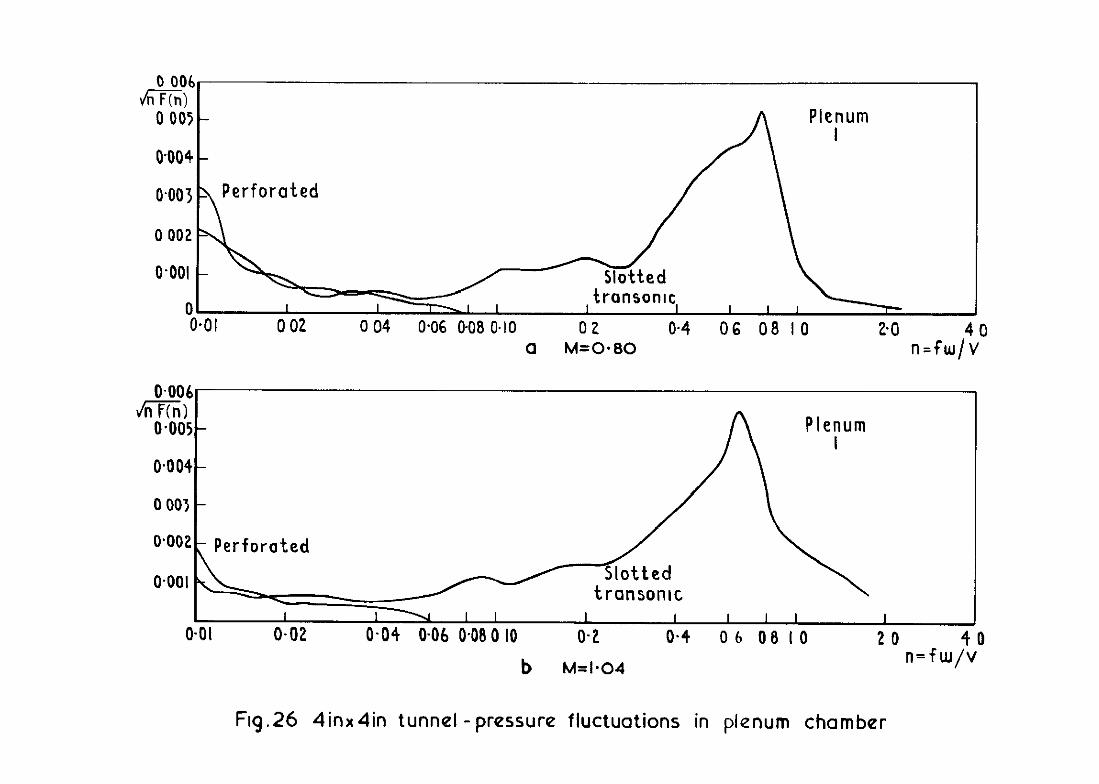
transonlc. I I I I I I I
0.01 0 02 0 04 0.06 O-08 0.10 02 0.4 06 08 IO 40 a M=0*80
O-006 JnFo
0.005 -
0.004 -
Plenum I
0 003 -
@002- Perforated
I I I 0.01 0.02 0.04 006 0.08 0 IO 0.2 0.4 060810 20 40
b M=I-04 n=flu/v
Flq.26 4inx4in tunnel -pressure fluctuations in plenum chamber

0 004 m) Plenum
I I 1 A 4 , I I 0.01 OOZ 0.04 0 06 O-08 0.10 0.2 0.4 0.6 0.8 I.0 2.0 4.0
C M=0~80 n=Cw/V
0.004 dimI) ’ om3 - Slotted P’eq”um
oooet
0 001
1 I I I I I I
0.01 0.02 004 004 cl.08 0.10 0.2 0.4 0.6 0.6 I.0 20 40
d M=l.O4 n=fu/v
Fiq.26contd 4inx 4in tunnel -pressure fluctuations in plenum chamber

o-014 r + m) 0.012
0~010
o*ooe
0.006
0.004
I- ,
/+ -7 + AIM Flolu
\ +
\ x + / ‘\
/ >+JL+
/I X
\ 0.002 -
Fnfl
/ x--x-- ---xc
M’; I.11 \ + -..- of Model posItIon (No peak) Start
o slots nx r I..&.
t “I JlVCJ
I I 0 I.0 2.0 ‘I*O x/w
Fig 27 4inx4in tunnel-attenuation of working section pressure fluctuations

Wor kmq sectlon
tor
Pt-98kN/mz=(14.3 lb/m’)
, 0.1 0.2 0.4 0.6 0.8 I.0 2.0 4.0 6.0 8.0
n-f w/v
Fig 28 3ftx3ft perforated tunnel-effect of side collector baffles on edge-tones M= 0.60
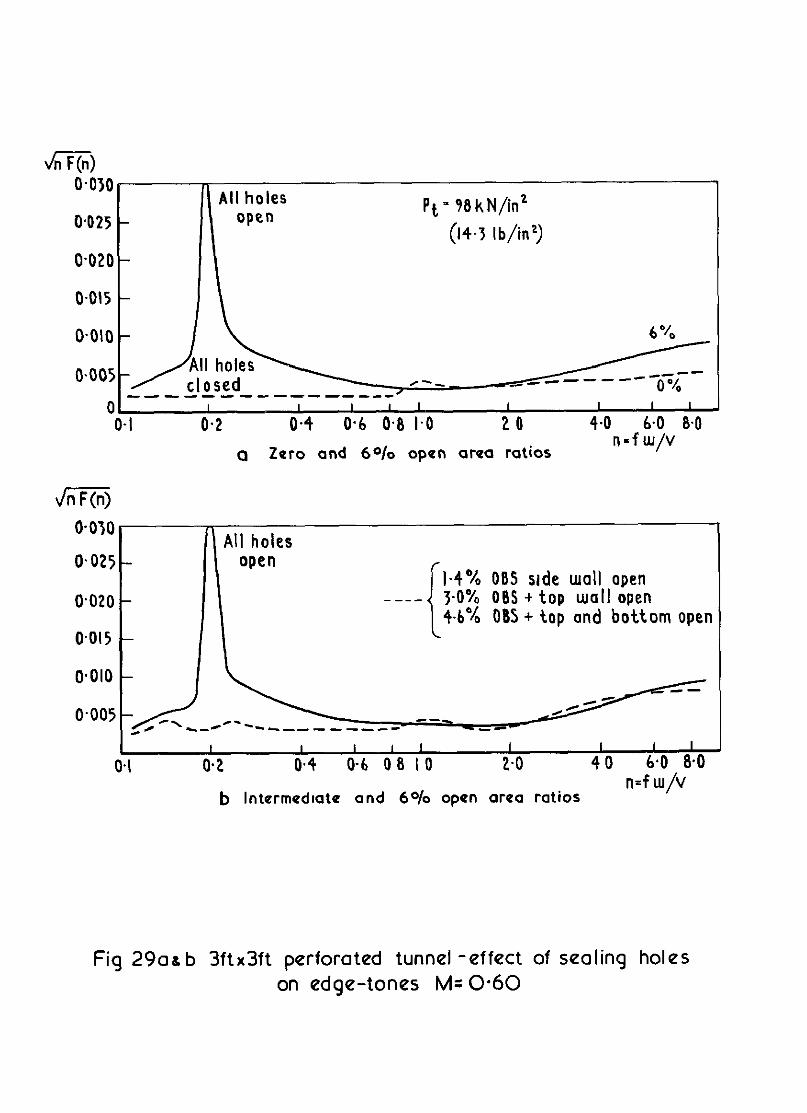
din F(n) ii30
0.025 -
0.020 -
All holes open
Pt= 98kN/in2 (14.3 lb/in’-)
01 I I I I I I I 1 I I O-I 0.2 0.4 0.6 0.8 I.0 20 4.0 -6.0 8.0
4iFR
O*O’IO
0.025 -
0.020 -
0.015 -
O*OlO -
Q Zero and 6010 open area ratios n=f u/v
’ All holes open
----I
1.4% 085 side Luall open 3-O% OM + top wall open 4.6% OSS + top and bottom open
0.1 I I I I I I I , I
0.2 o-4 O-6 08 IO 2.0 40 6.0 8.0
b Intermedtate and 6% open area ratios n=f w/v
Fig 29as b 3ftx3ft perforated tunnel -effect of sealinq holes on edqe-tones M= 0.60
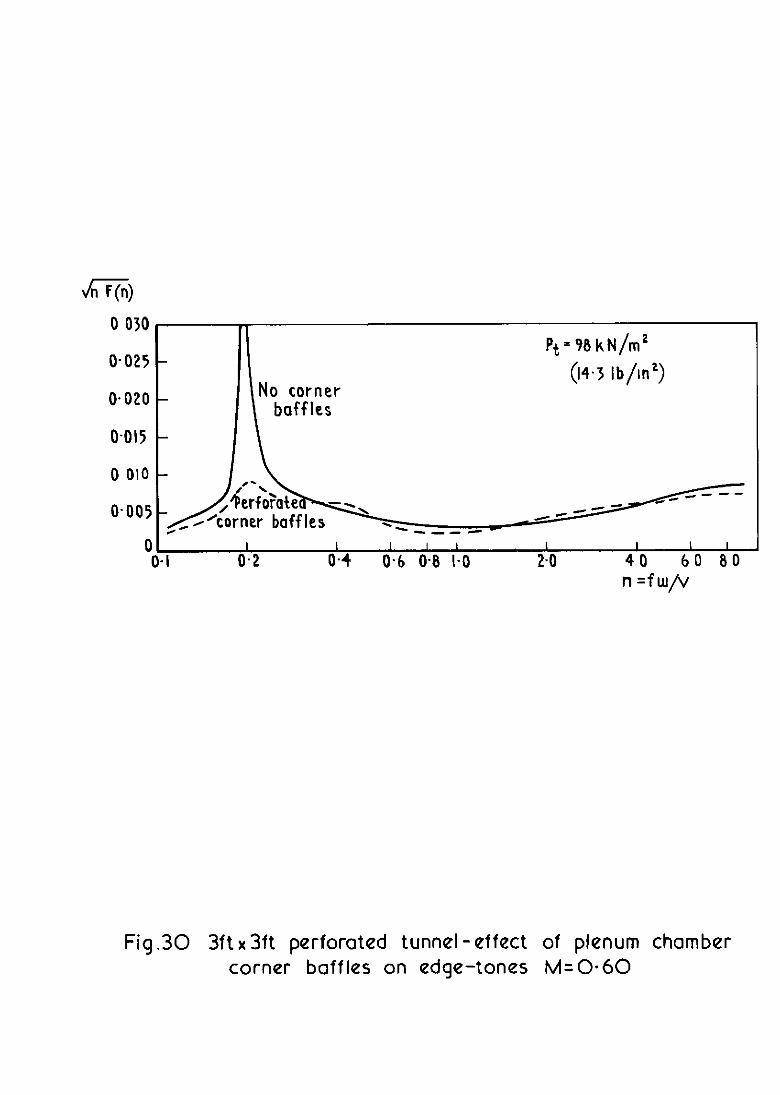
Pt=98kN/mZ (14.3 lb/In’)
0 I I I 1 1 I I I I 0-I 0.2 0.4 0.6 0.8 I-O 2.0 40 60 80
n =f w/v
Fig .30 3ft x 3ft perforated tunnel - effect of plenum chamber corner baffles on edge-tones M=0*60
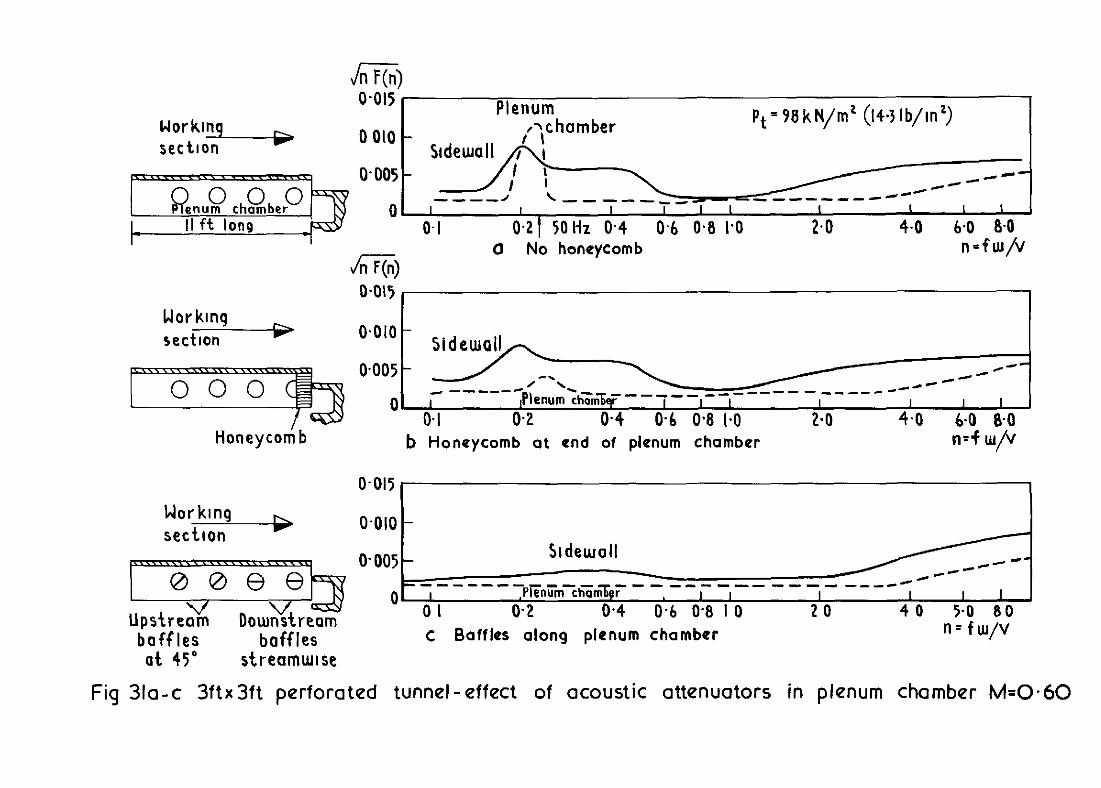
Jn F(n) * “I, Plenum Pt=98kN/mZ (14?Ib/m') 0 010 -
0.005 - ----A
0 0-I 0.21 50Hz 0.4 0.6 0.8 I.0 2.0 4.0 6.0 8.0
a Nb honeycomb n=fw/v
Workmq sectlon 3
Working secG--+
baffles baffles at 45" streamwlse
0.1 0.2 0.4 0.6 0.8 I-O 2.0 4.0 6.0 6.0 b Honeycomb at end of plenum chamber n=f IA/~
O-015
0.010 -
o-005- Sldewoll
0 "-------p~n~m-ch-m.-~
I e I I I I I I 01 o-2 0.4 0.6 0.8 IO 70 40 5.0 80 c Baffles along plenum chamber n=fup
Fig 3la-c 3ftx3ft perforated tunnel-effect of acoustic attenuators in plenum chamber M=O,60
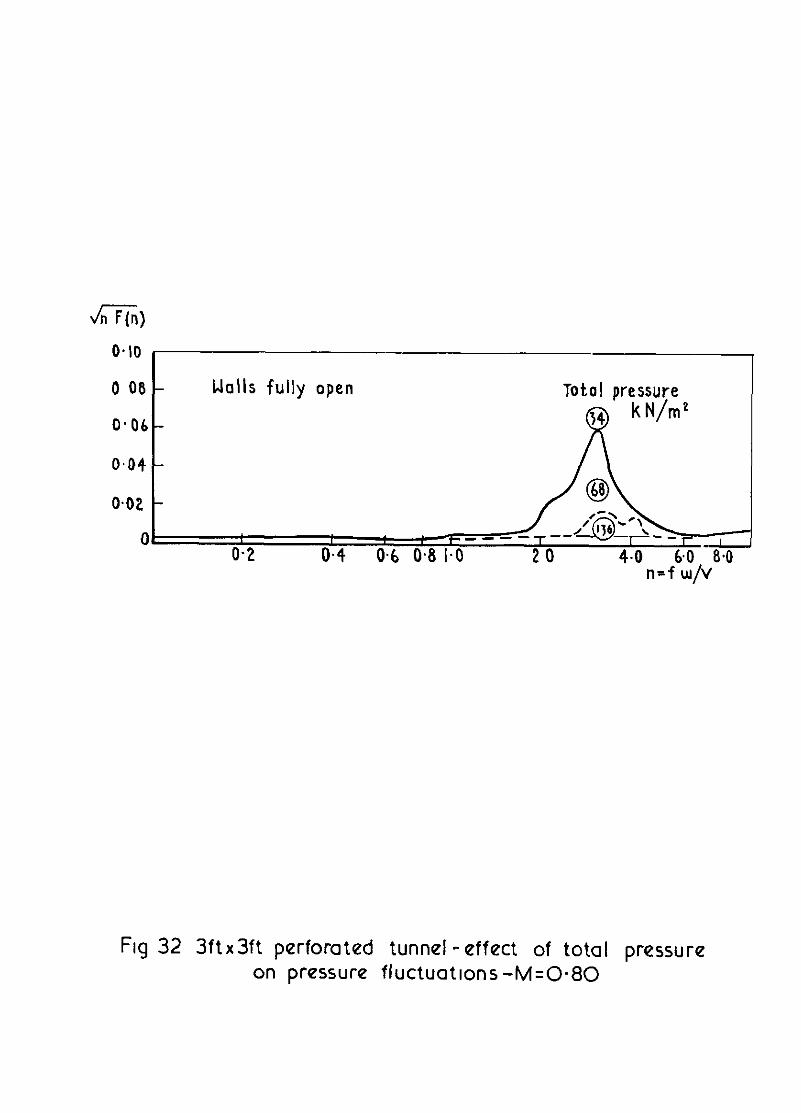
0 08 -
O-06 -
Walls fully open
0.04 -
0.02 -
00 o-2 0.4 0.6 04
n=f w/v
Fig 32 3ftx3ft perforated tunnel -effect of total pressure on pressure fluctuations -M=0*80

II*20
S*=fd/v
O*I5
II.10
0.05
Theoreticat edge - tone freguenclts
---- -1 =3*8
Pi = 36 kN/m’ (5lb/m’)
-js?ri, 2nd mode
- --- j=i-0 v IS’ mode
I I I I I
O-2 o-4 0.6 0.8 I-0 M
a Variation of Strouhal number with Mach number
G$ I2 Walls fully o-10
0.08: v\ ~ n Open 0.06 -
0*04-
0.02 -
0 I I , I o-2 0.4 0.6 0.8 I.0 M I.2
b Variation of pressure fluctuations with Mach number for different modes
Fig.33a 8 b 3ftx3ft perforated tunnel -edge-tones generated at low unit Reynolds numbers

o-12 s*=o.o46 3 Lualls
Fully taped -.-.- [ U,L j
z-5, 5.0 , 75 20 40
lb/,“’ kN/m*
0 Variation of pressure fluctuations with total pressure (sidewall parttally taped)
4Yq)“.020 * . 0.015 -;t :0q~;lk/,“’ x--x <
/ X
o~olo,~-x-x--x 4 lualls
0.005 - taped
0 I 2
I 4 b %
Open area rotlo b Variotion of pressure fluctuations with open area ratio
of vorioble porosity sidewall plate
Fig 34arb 3ftx3ft perforated tunnel - reduction of edge-tones M=0.60

0.05 fi)
6 SIdeuaIIs full taped Before
.04 - 2ft of top an J bottom liners open 31 kN/m2 (4.5 Ib/m2)
0.03 - 5,
: ’ \ 0.02 - : \
/ o-01 - I
/ Ot I I I I I I I I 0.1 o-2 o-4 0.6 0.6 I.0 2.0 40 6.0 80 IO
a Rear 2ft of top and bottom n=f tu/v
liner before and after treatment
Before lP’ ; ‘1
0.02 -
0.01 - _---- -----__
l I 0.;
I-f 0-I 0.2 0.4 ii.8
__--- --- I I I I.0 2.0 4-o 6.0 8.0
b All four liners before and after treatment
Fig 35asb 3ftx3tt perforated tunnel - elimination of
edge- tones M=060

Main stream Ll
Edqe - tones qenerat;iqeot shorp
Variable I///////< n\\\\\\\\\\\\ -.
porosity plate- moved doumstreom to stablhze shear layer
1
‘Mean shear layer no lonqer reactaches
( Compl;;o<ear 1
pattern on surface of holes
Fig 36 Possible flow model for edge-tone excitation

dipi) 0 015
0.010 - All holes
0.005 -
0 --v---m--- ____ d'
I I t I -------6~~"~-~,-ho?es-~~o~ed--- I I I I I
0.1 0.2 0.4 0.6 O-8 I.0 2.0 4,O 6.0 8.0
h-F@) Cl M= 0.60 n=flu/v
0.015-
0.010 -
b M-o-80 n=fw/v
Fig 37aa b 3ft x3ft tunnel-final comparison of pressure fluctuations measured wtth perforations open and closed
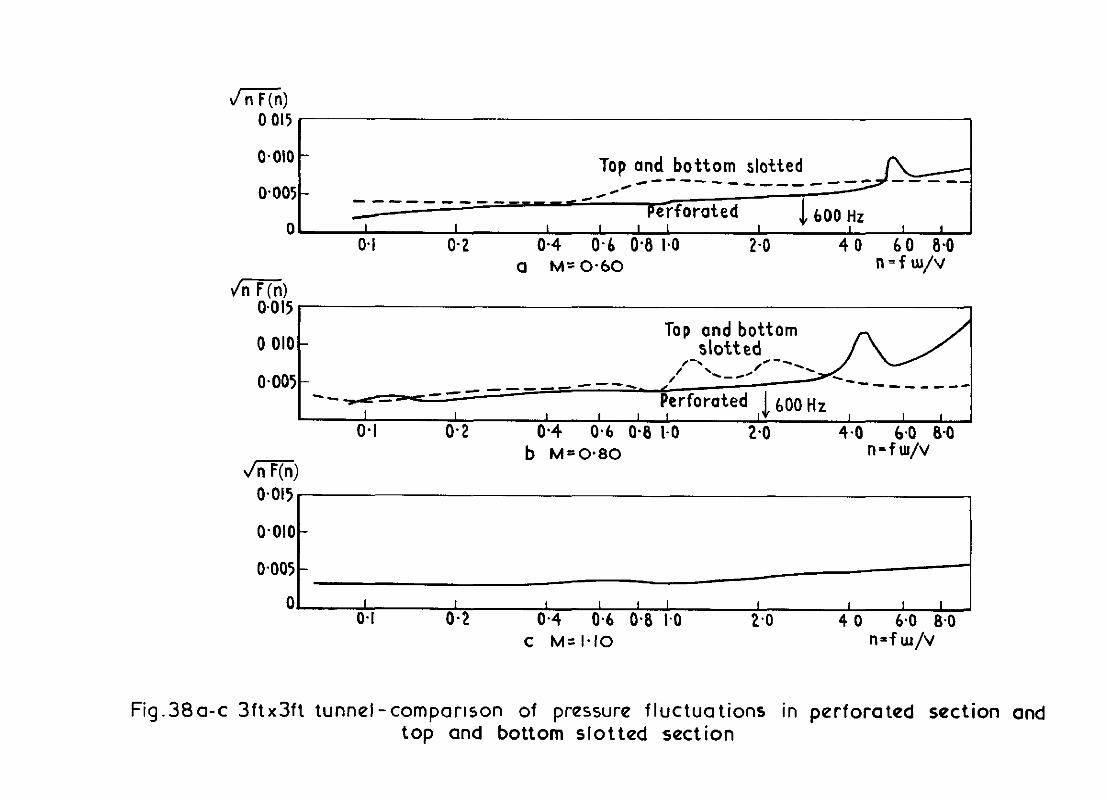
lh?G) 0 015
0~010 - Top and bottom slotted
0305- ---------_---d _---- _______-
#C #-- /
Perforated 0 5. 600 Hz I I I t I I I , I I
0.1 O-2 0.4 0.6 0.8 I.0 2.0 40 60 8.0 a M' O-60 n=f w/v
m-&l5
0.1 0.2 0.4 0-b O-8 I-O 2.0 4.0 6.0 8.0 b M=O*80 n=f w/v
0.010 -
0.005 -
0 I I I I I I 1 , 1 I 0.1 0.2 0.4 0.6 0.8 I.0 2.0 40 6.0 8.0
c M= I.10 n-fur/v
Fig.38a-c 3ftx3ft tunnel-comparison of pressure fluctuations in perforated section and top and bottom slotted section

0.012
6)
0.010
0 ooe
O.OOf
0.004
0.002
1
Slotted section
Confq 4 xaopen I-
I 4 x @ Closed
Conf iq 4 x@ Closed 2 ---
I 4 x 0 Open
I I I 1 I I I
05 0.1 0.2 0.4 0.6 03 1.0 2-o 4 r n=t U/V
-K +K Flow Into
complete slot
+K FloLmto half slot
Fig.39 4inx4in tunnel-adverse effect of half slots M=0*80

ODen area rat10
Hole dla I.75 mm I(0 053in)
a H S 2rtx 2ft tunnel
I”l,“I depth
of screen
b RAE 3ft x 3ft tunnel (top and bottom slotted section)
Flg.40ag b Comparison of slots in HS 2ftx2f 3 ft x 3ft tunnels
Open area ratto of screens 33 % Hole d/a 2 16mm
(o.@a5wi)
and RAE

0.1%
t
Pt=lOO kN/m’ (14 4lb/in’) Tt =Iboc
0.001
0 M=O 95 I
hiT@ -1 /’ / /
0.76m x 0.61 m ~. A’ \ \ .cc- --
‘\--=---%--_-.--~RH --* O-002
0.001 t
0 M-0.90
dZ(ii) t o-002
0.001 1 0 M-0*80 c ---
” ““‘L /
0.001 - M-0.60
0 M-0.50 I I I I I I 0 04 0.06 O-08 0.1 0.2 0.4 0.6 04 I.0 20 4.0 6.0 8.0 10-O
n=fw/v
Fig 41 HS 2ft tunnel-working section pressure fluctuations

% auxiliary suction VIOUS tests Ref 26
0.01 6”/0 open area ratto 60” inclined holes Holes O-125 In dla
0 0.2 0.4 0.6 0.8 I.0 pj 12
0 AEDC Ift x Ift perforated tunnel - rms pressure fluctuations
Fig.42 Pressure fluctuations In perforated tunnels with 60’ inclined holes

6% open area ratlo 60” mcllned holes
M=0*60-
hqj O I I I I I I I 1 I
0.035 - Data from 0.030 -fl 13 Ref 27
of transducer 9 O-025 -
0.020 -
o-015 - M=O-70
O-010
0.005 rl=odl p&q
01 I 1 I I I 1 I I I I 2 4 6 8 IO 20 40 60 80
b AEDC 16ft x 1611 perforated tunnel-unsteadiness n=flu/v
Fig 42contd Pressure fluctuations in perforated tunnels with 60° inclined holes

0 005 v6&i M-O 60
0.035 - 6% area ratio open _ 60" tncllned holes
omo3o Holes 0.71 In dla o.025 _ diffuser suction
8*//d -0 67 0.020 -
0.015 -
0.010 -
I I , I I I I I I 0-I 0.2 0.4 0.6 0.8 IO 2.0 4-O 6.0
c ONERA 6ftx 6ft perforated tunnel -unsteadiness n=flu/v
Fig.42concld Pressure fluctuations in perforated tunnels with 60’ inclined holes

0*035 -
0.030 -
0.025 -
0.020 -
0.015 -
O-010 -
0.005 -
0 -M=0*65
0.005 -
0 ,M=0.60
0.005 -
0 ,M= 0 50
” n 005 - M-0.40
o M-0.40 , I 1 , I I O-I 02 0.4 0.6 0.8 I.0 20 40 6-O 8-O IO 20 40 60 80 100
Fan peaks
W- 8ft
a M=O-40 to M=0*65 n=luf/v
Fig. 43 Unsteadiness in RAE 8ftx 6ft slatted tunnel

0.015 r I w= aft
0 M=l.IO
r-PO-95 0.005 -
M-0.90 0.005 -
M-0-80 0.005 -
0.005 -
4 0 6-O 84 IO.0
b M-O-70 to M=l.20
Fig 43 contd Unsteadiness in RAE 8ftx6ft slotted tunnel
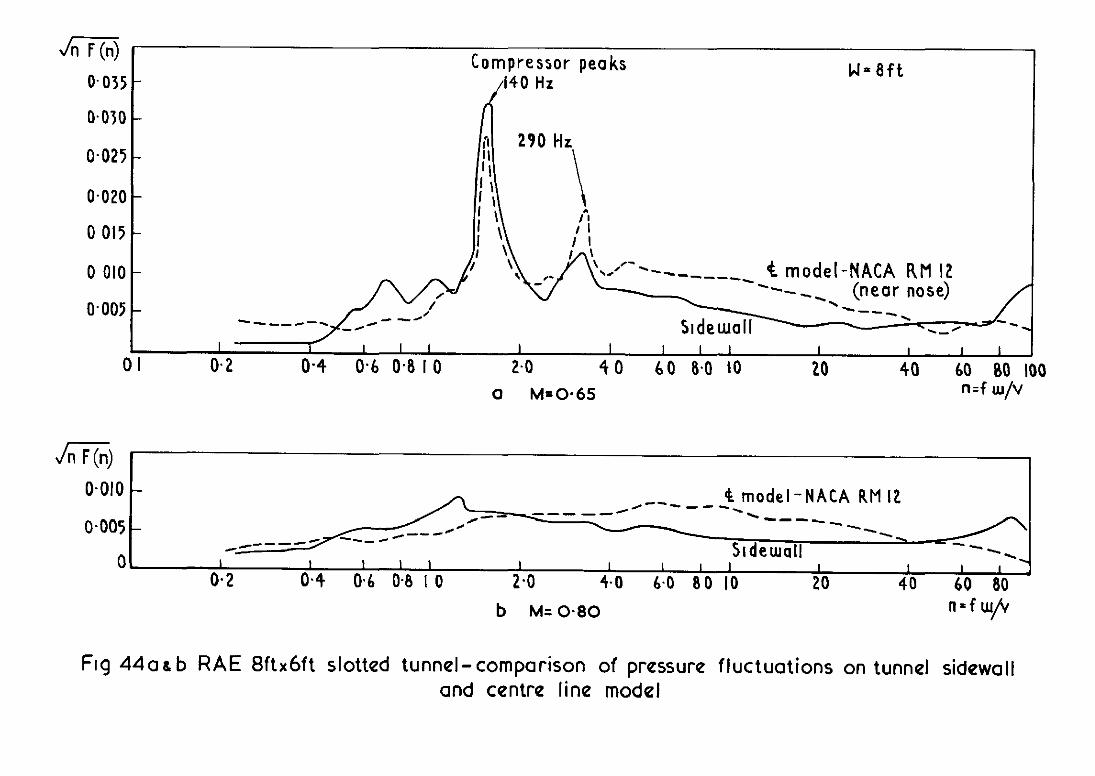
.s W-Bft Compressor peak- 140 Hz
I I f I I I I I I I I I I I I I 01 0.2 0.4 0.6 0.8 IO 2.0 40 60 8.0 IO 20 40 60 80 100
0 W0.65 n=fuJ/v
4-1 F(n) 1 1 0.010 - &model .----es -NACA RMI2
0.005 -
0, 1 I I I I I I I I I I 0.2 0.4 I I I 0.6 0.8 I 0 2.0 4.0 6.0 80 IO 20
I 40 60 80
b tvko.80 n=full
Ftg 44asb RAE 8ftx6ft slotted tunnel-comparison of pressure fluctuations on tunnel sidewall and centre line model
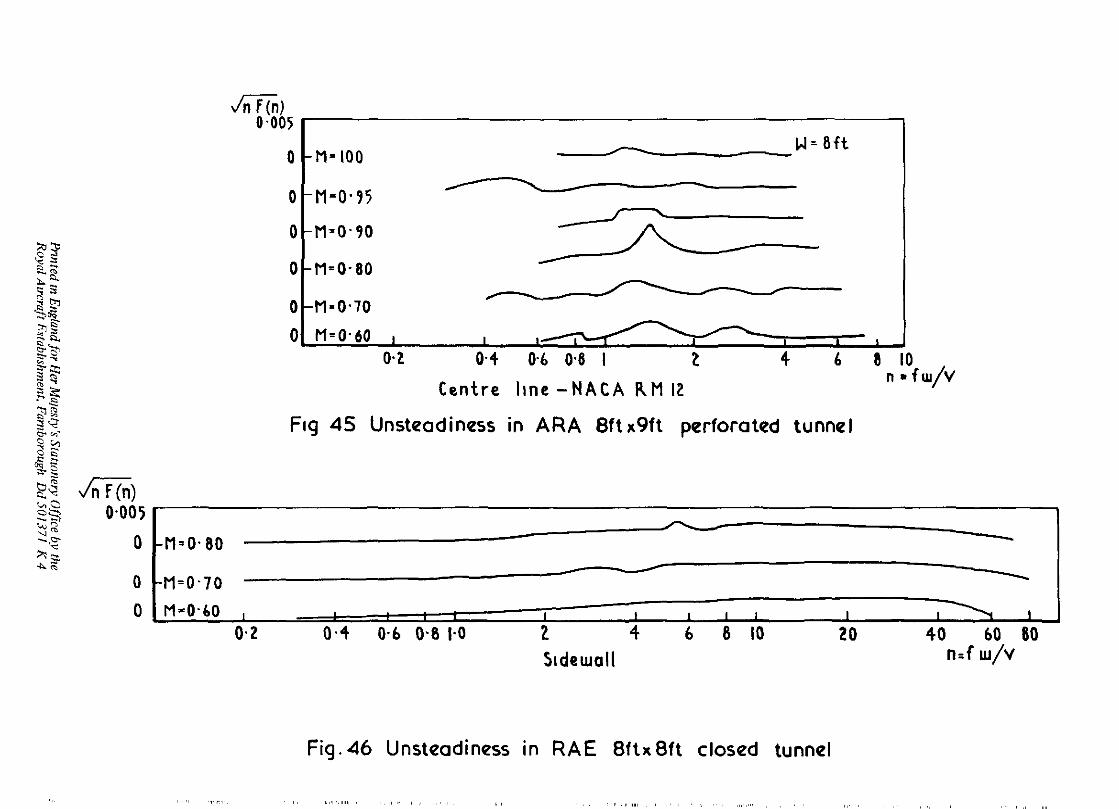
Jn F(n) 0.005
0 -M-l00 W= 8ft
0 M-0.95
t
0 M-0.90
0 PI-0.80
0 -rl-o~70
0.2 0.4 0.6 0.8 I 2 4 6 8 io
Centre line -NACA RM 12 n .fu/V
Fig 45 Unsteadiness in ARA 8ftx9ft perforated tunnel
0.2 I I I I I I I
0.4 0.6 O-8 I-0 2 4 6 8 IO 20 40 60 80
Sidewall n=f w/v
,,, ,,.” ,,,,
Fig.46 Unsteadiness in RAE 8ftx8ft closed tunnel

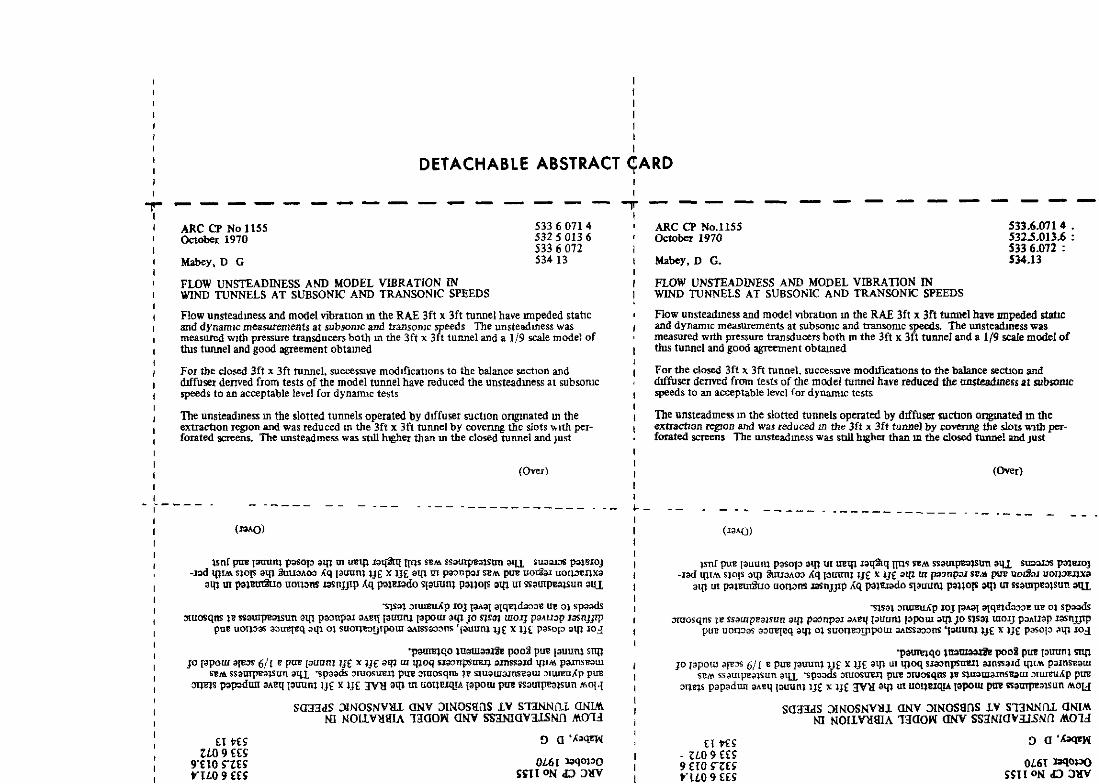
, I I DETACHABLE ABSTRACT <ARD , I
FLOW UNSTEADINESS AND MODEL VIBRATION IN WIND TUNNELS AT SUBSONIC AND TRANSONIC SPEEDS
F!ow unsteadmess and model viimtmn m the RAE 3ft x 3ft tunnel have impeded statx and dynamic measurements at subsomc and transon~ speeds The unsteadmess was measured wth pressure transducers both m the 3ft x 3ft tunnel and a l/9 scale model of 011s tunnel and good ageement obtamed
For the dosed 3ft x 3ft tunnel, successwe moddkauans to the balance szctmn and tifusa derived Oom tests of the model tunnel have reduced the unsteadlncss at subsomc speeds to an acce@able level far dynam,c tests
ARC CP No.1155 octohcr 1970
Mahe,‘, D G.
FLOW UNSTEADmSS AND MODEL VIBRATION IN WIND TUNNELS AT SUBSONIC AND TRANSONIC SPEEDS
_- - ._ --_--. __---__----- - - . - - - - _ _

- -
__- - . 1 __--__
__---_ - - - - - _. -
__. -
acceptable In the 0.9,mx 0.69m (3fi I. 22ft21t) vo* SctloD and lmacceptabk 111 tk 0.91m t 0 91mf3h x 3ft) worknag se&an


C.P. No. I 155
TO be purchased from 49 High Holborn, London WC1 V 6HB 13a Cd& Street, Edmburgh EH2 3AR
109 St iMary Street, Carddf WI 11% Brazcnnose Street, Manchester M60 8AS
50 Falrfav street, Bmtol BSI 3DE 258 Broad Street, Bmungham B1 2HE 80 Ch,che\ter Street, Belfast BT, 4,Y
or through booksellers
C.P. No. I 155 SBN 11 470423 6