Embed Size (px)
Citation preview
FlowJo Basic Tutorial
FlowJo software is used for the analysis of flow cytometry data. This tutorialis designed to introduce you to FlowJo by demonstrating the analysis of asimple experiment. A FITC anti-CD8 reagent was titrated to determine theappropriate reagent concentration.

Table of Contents
Introduction .......................................................................................... 3 Step 1: Load samples into the workspace ........................................ 5 Step 2: Analyze the control sample in detail .................................. 9Step 3: Copy gates and statistics to all samples .............................. 13Step 4: Verify gates on all samples .................................................... 15Step 5: Generate a graphical report .................................................. 19Step 6: Generate a table of statistics ................................................ 23
FlowJo Basic Tutorial by Jennifer Wilshire.
FlowJo was written by Adam Treister and Mario Roederer, based on conceptsdeveloped with David Parks, Martin Bigos, and Wayne Moore.
We are indebted to the Herzenberg laboratory at Stanford and our active andenthusiastic users for their ideas, discussions, and tireless testing of new versions.
FlowJo is Copyright © Trustees of Leland Stanford Jr. University, 1996-97FlowJo is Copyright © Tree Star, Inc. 1997-2002.FlowJo Tutorial and Web Site are Copyright © Tree Star, Inc. 1997-2002.
Revision Date: March 2002Version 1.1
2 FlowJo Basic Tutorial
22581_LH_imp_flyer.qx4 4/30/02 4:13 PM Page 2
Basic TutorialIntroduction
FlowJo software is used for the analysis of flow cytometry data. You can use FlowJo toanalyze all of your flow cytometry data - regardless of the cytometer used to collectyour data files. This tutorial is designed to introduce you to FlowJo and to the 6 stepsinvolved in analyzing a basic immunophenotyping experiment.
1. Load samples into the workspace.2. Analyze the control sample in detail (gate subsets and add statistics).3. Copy gates and statistics to all samples.4. Verify gates on all samples 5. Generate a graphical report including all samples.6. Generate a table of statistics from all samples.
Learning to use FlowJo to efficiently analyze your flow experiments is not difficult,although it is worth noting that there are several differences between FlowJo and otherflow cytometry analysis packages. The power of FlowJo and the ease with which ithandles data analysis are a direct result of these differences.
FlowJo organizes and displays all the data files from an experiment in a Workspacewindow. The Workspace window not only lists all the sample files being analyzed, butalso displays each gated subpopulation and statistic as a node under the sample name.Nodes are organized in a hierarchical manner so that it is easy to distinguish the rela-tionship between each population. Being able to view the summary of an entire experi-ment in a Workspace window means that there is no need to keep track of gates or sta-tistics and your data analysis is organized in a biologically meaningful way.
The repetitive tasks required to analyze flow data are greatly simplified by FlowJo.Batch processing is used to apply analyses (gated subpopulations and statistics) tomany samples effortlessly. FlowJo also produces tables of statistics and graphicalreports that summarize multiple data samples with a click of a button.
Instructions to guide you through the analysis of a basic immunophenotyping experi-ment are contained in this tutorial. Follow along with the provided data files to get afeel of how FlowJo works! If you wish to skip steps, we provide premade Workspacefiles that correspond to each analysis step. The demonstration data and premadeWorkspace files can be found in the “Basic Tutorial” folder on the FlowJo CD or atwww.flowjo.com/tutorial.html.
Introduction 3
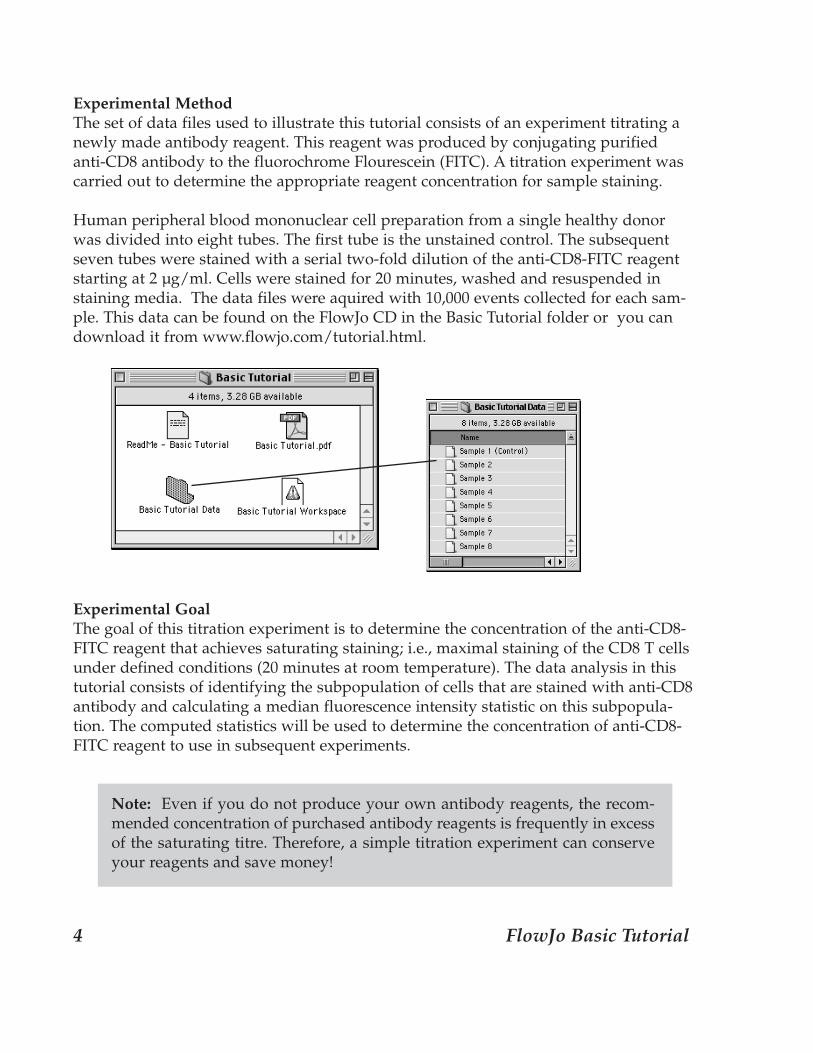
Experimental MethodThe set of data files used to illustrate this tutorial consists of an experiment titrating anewly made antibody reagent. This reagent was produced by conjugating purifiedanti-CD8 antibody to the fluorochrome Flourescein (FITC). A titration experiment wascarried out to determine the appropriate reagent concentration for sample staining.
Human peripheral blood mononuclear cell preparation from a single healthy donorwas divided into eight tubes. The first tube is the unstained control. The subsequentseven tubes were stained with a serial two-fold dilution of the anti-CD8-FITC reagentstarting at 2 µg/ml. Cells were stained for 20 minutes, washed and resuspended instaining media. The data files were aquired with 10,000 events collected for each sam-ple. This data can be found on the FlowJo CD in the Basic Tutorial folder or you candownload it from www.flowjo.com/tutorial.html.
Experimental GoalThe goal of this titration experiment is to determine the concentration of the anti-CD8-FITC reagent that achieves saturating staining; i.e., maximal staining of the CD8 T cellsunder defined conditions (20 minutes at room temperature). The data analysis in thistutorial consists of identifying the subpopulation of cells that are stained with anti-CD8antibody and calculating a median fluorescence intensity statistic on this subpopula-tion. The computed statistics will be used to determine the concentration of anti-CD8-FITC reagent to use in subsequent experiments.
Note: Even if you do not produce your own antibody reagents, the recom-mended concentration of purchased antibody reagents is frequently in excessof the saturating titre. Therefore, a simple titration experiment can conserveyour reagents and save money!
4 FlowJo Basic Tutorial
1. Load samples into the workspace.
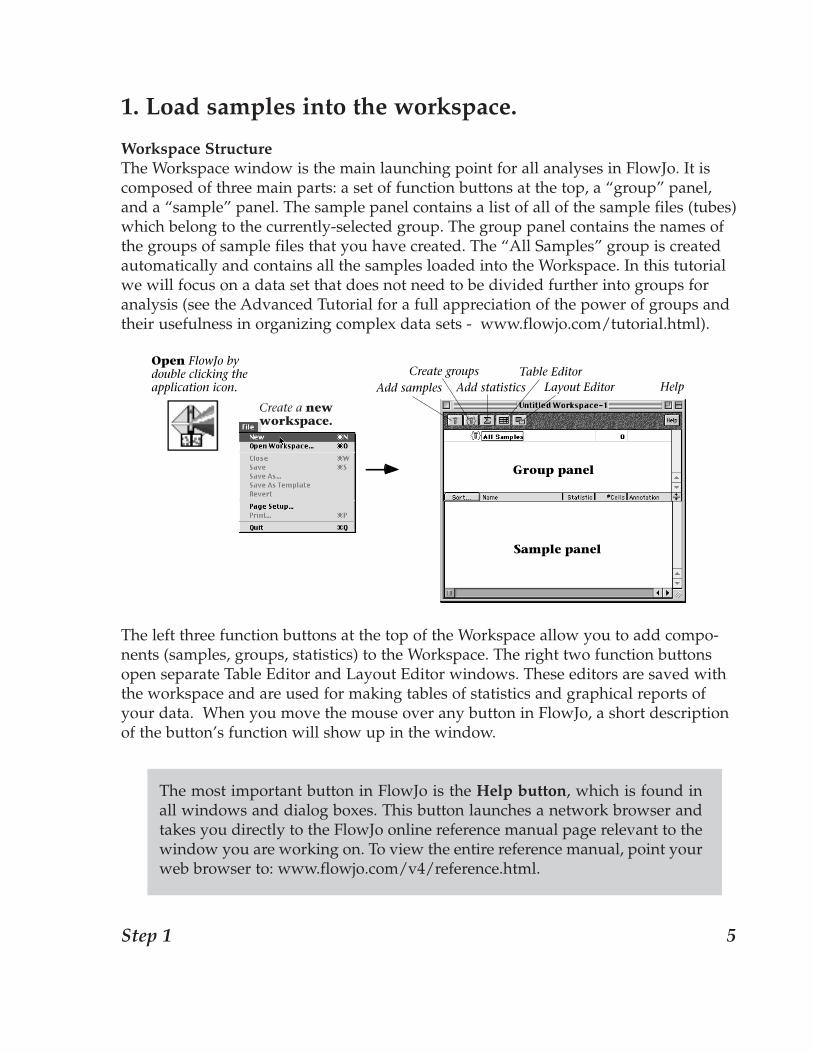
Workspace StructureThe Workspace window is the main launching point for all analyses in FlowJo. It iscomposed of three main parts: a set of function buttons at the top, a “group” panel,and a “sample” panel. The sample panel contains a list of all of the sample files (tubes)which belong to the currently-selected group. The group panel contains the names ofthe groups of sample files that you have created. The “All Samples” group is createdautomatically and contains all the samples loaded into the Workspace. In this tutorialwe will focus on a data set that does not need to be divided further into groups foranalysis (see the Advanced Tutorial for a full appreciation of the power of groups andtheir usefulness in organizing complex data sets - www.flowjo.com/tutorial.html).
The left three function buttons at the top of the Workspace allow you to add compo-nents (samples, groups, statistics) to the Workspace. The right two function buttonsopen separate Table Editor and Layout Editor windows. These editors are saved withthe workspace and are used for making tables of statistics and graphical reports ofyour data. When you move the mouse over any button in FlowJo, a short descriptionof the button’s function will show up in the window.
The most important button in FlowJo is the Help button, which is found inall windows and dialog boxes. This button launches a network browser andtakes you directly to the FlowJo online reference manual page relevant to thewindow you are working on. To view the entire reference manual, point yourweb browser to: www.flowjo.com/v4/reference.html.
Open FlowJo by double clicking the application icon.
Create a new workspace.
Add samplesCreate groups
Add statisticsTable Editor
Layout Editor Help
Group panel
Sample panel
Step 1 5
Create a New WorkspaceLaunch FlowJo by clicking on the application Icon. Select New Workspace from theFile menu to create a new Workspace.
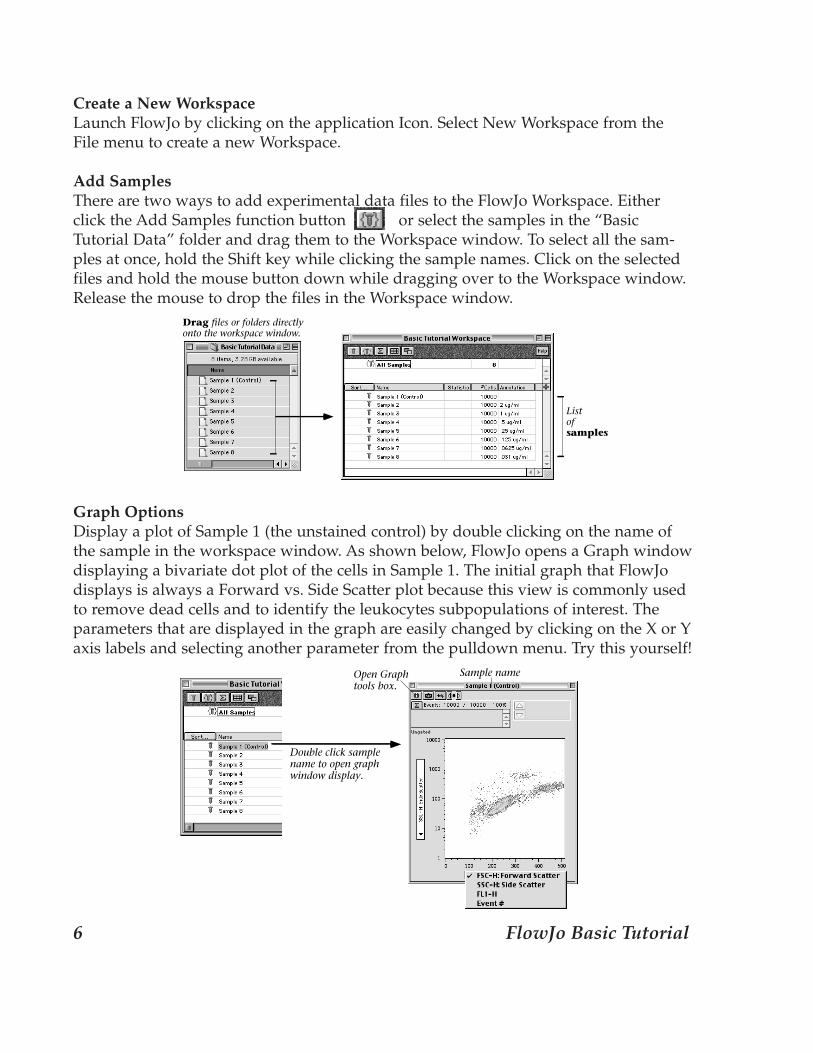
Add Samples There are two ways to add experimental data files to the FlowJo Workspace. Eitherclick the Add Samples function button or select the samples in the “BasicTutorial Data” folder and drag them to the Workspace window. To select all the sam-ples at once, hold the Shift key while clicking the sample names. Click on the selectedfiles and hold the mouse button down while dragging over to the Workspace window.Release the mouse to drop the files in the Workspace window.
Graph OptionsDisplay a plot of Sample 1 (the unstained control) by double clicking on the name ofthe sample in the workspace window. As shown below, FlowJo opens a Graph windowdisplaying a bivariate dot plot of the cells in Sample 1. The initial graph that FlowJodisplays is always a Forward vs. Side Scatter plot because this view is commonly usedto remove dead cells and to identify the leukocytes subpopulations of interest. Theparameters that are displayed in the graph are easily changed by clicking on the X or Yaxis labels and selecting another parameter from the pulldown menu. Try this yourself!
Drag files or folders directly onto the workspace window.
List of samples
Open Graph tools box.
Sample name
Double click sample name to open graph window display.
6 FlowJo Basic Tutorial
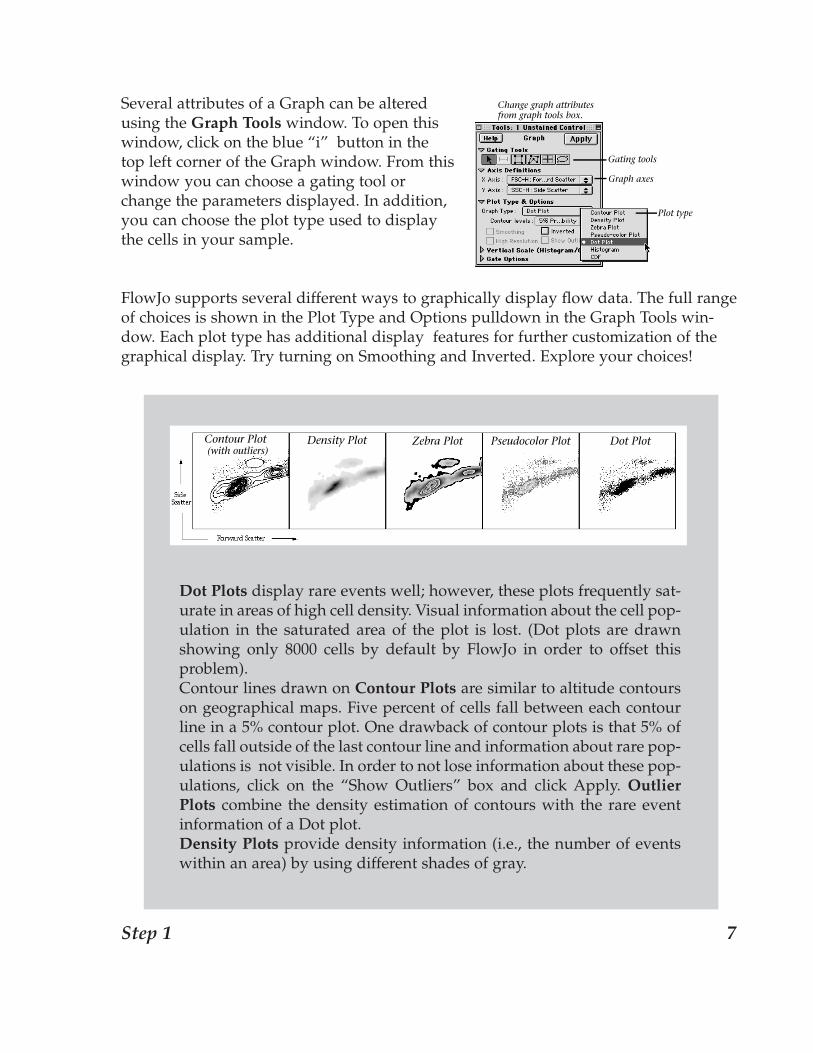
Several attributes of a Graph can be alteredusing the Graph Tools window. To open thiswindow, click on the blue “i” button in thetop left corner of the Graph window. From thiswindow you can choose a gating tool orchange the parameters displayed. In addition,you can choose the plot type used to displaythe cells in your sample.
FlowJo supports several different ways to graphically display flow data. The full rangeof choices is shown in the Plot Type and Options pulldown in the Graph Tools win-dow. Each plot type has additional display features for further customization of thegraphical display. Try turning on Smoothing and Inverted. Explore your choices!
Change graph attributes from graph tools box.
Gating tools
Graph axes
Plot type
Contour Plot (with outliers)
Density Plot Zebra Plot Pseudocolor Plot Dot Plot
Dot Plots display rare events well; however, these plots frequently sat-urate in areas of high cell density. Visual information about the cell pop-ulation in the saturated area of the plot is lost. (Dot plots are drawnshowing only 8000 cells by default by FlowJo in order to offset thisproblem). Contour lines drawn on Contour Plots are similar to altitude contourson geographical maps. Five percent of cells fall between each contourline in a 5% contour plot. One drawback of contour plots is that 5% ofcells fall outside of the last contour line and information about rare pop-ulations is not visible. In order to not lose information about these pop-ulations, click on the “Show Outliers” box and click Apply. OutlierPlots combine the density estimation of contours with the rare eventinformation of a Dot plot. Density Plots provide density information (i.e., the number of eventswithin an area) by using different shades of gray.
Step 1 7

Zebra Plots are a mix of contour (20%) and density plots. Pseudocolor Dot Plots provide benefits of a dot plot without the loss ofinformation due to saturation. Saturating is avoided by drawing dots indifferent colors according to the cell density in that area. Turn on thesmoothing option for the pseudocolor plot to display a Color DensityPlot.
8 FlowJo Basic Tutorial
2. Analyze the control sample in detail.
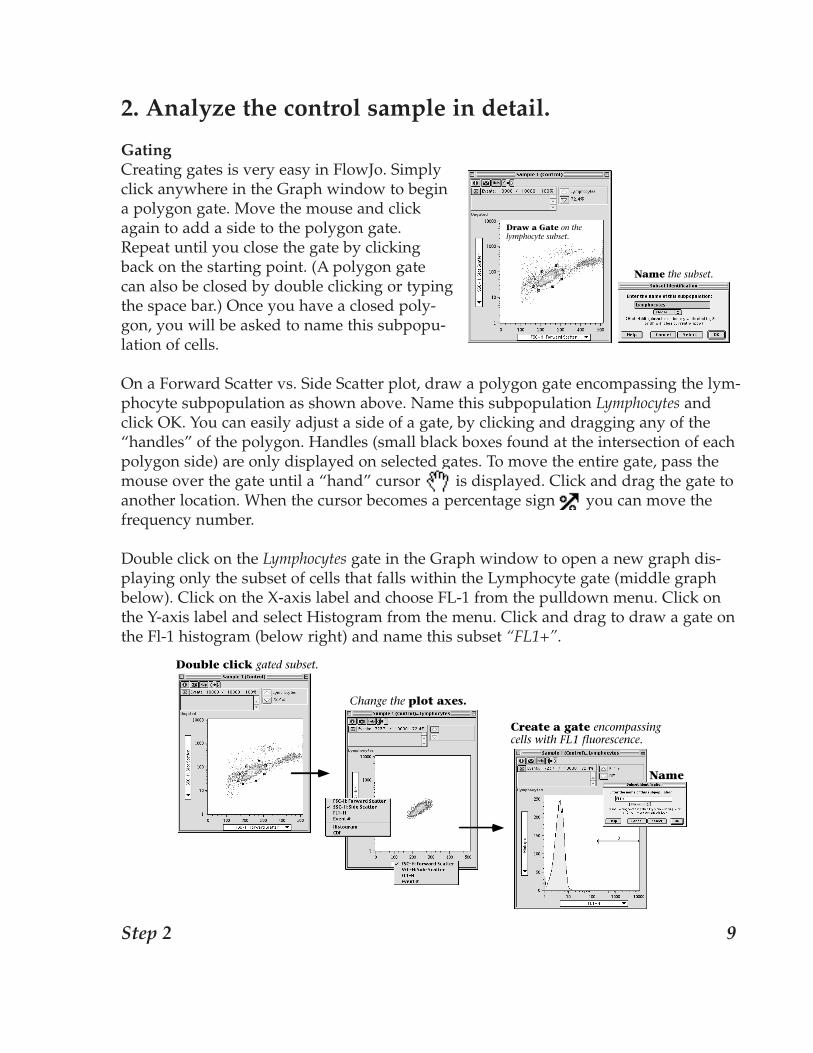
GatingCreating gates is very easy in FlowJo. Simplyclick anywhere in the Graph window to begina polygon gate. Move the mouse and clickagain to add a side to the polygon gate.Repeat until you close the gate by clickingback on the starting point. (A polygon gatecan also be closed by double clicking or typingthe space bar.) Once you have a closed poly-gon, you will be asked to name this subpopu-lation of cells.
On a Forward Scatter vs. Side Scatter plot, draw a polygon gate encompassing the lym-phocyte subpopulation as shown above. Name this subpopulation Lymphocytes andclick OK. You can easily adjust a side of a gate, by clicking and dragging any of the“handles” of the polygon. Handles (small black boxes found at the intersection of eachpolygon side) are only displayed on selected gates. To move the entire gate, pass themouse over the gate until a “hand” cursor is displayed. Click and drag the gate toanother location. When the cursor becomes a percentage sign you can move thefrequency number.
Double click on the Lymphocytes gate in the Graph window to open a new graph dis-playing only the subset of cells that falls within the Lymphocyte gate (middle graphbelow). Click on the X-axis label and choose FL-1 from the pulldown menu. Click onthe Y-axis label and select Histogram from the menu. Click and drag to draw a gate onthe Fl-1 histogram (below right) and name this subset “FL1+”.
Draw a Gate on the lymphocyte subset.
Name the subset.
Change the plot axes.
Create a gate encompassing cells with FL1 fluorescence.
Double click gated subset.
Name
Step 2 9
Hint: The polygon is the default gating tool, however, there are several othertools that can be chosen from the Graph Tools window (opened by clickingthe “i” button in the Graph window). A Rectangle, Quadrant or Oval gatingtool can be selected from this window.
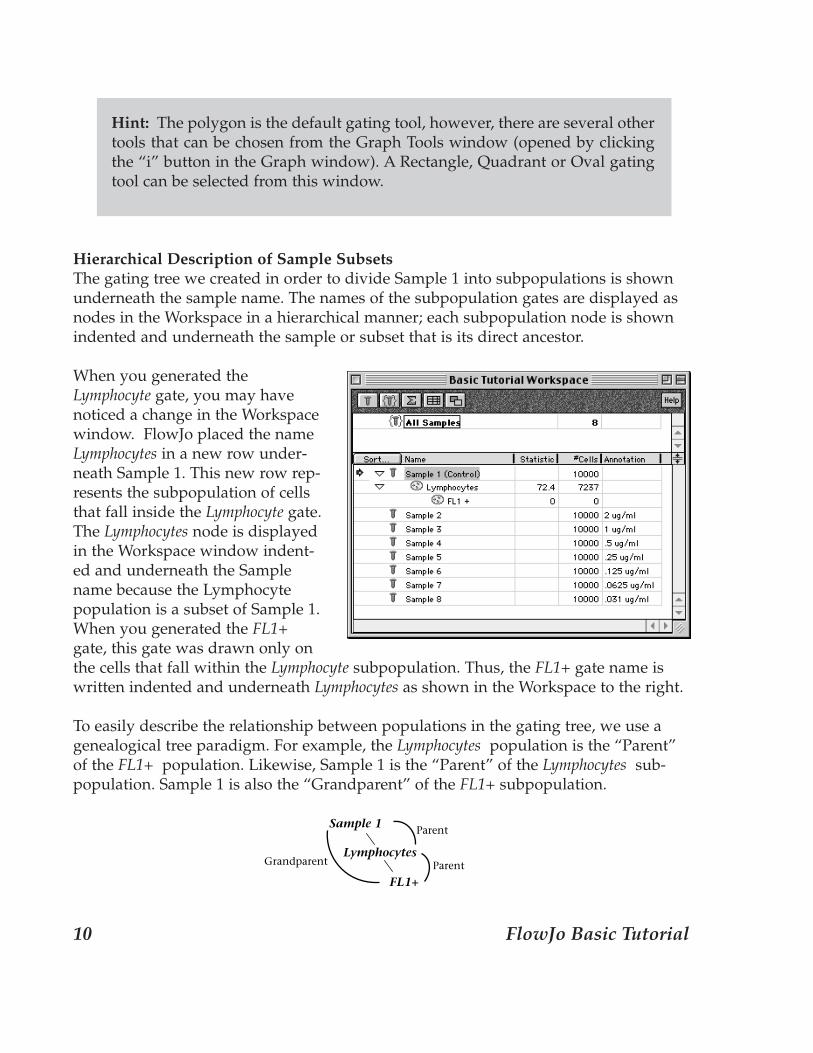
Hierarchical Description of Sample SubsetsThe gating tree we created in order to divide Sample 1 into subpopulations is shownunderneath the sample name. The names of the subpopulation gates are displayed asnodes in the Workspace in a hierarchical manner; each subpopulation node is shownindented and underneath the sample or subset that is its direct ancestor.
When you generated theLymphocyte gate, you may havenoticed a change in the Workspacewindow. FlowJo placed the nameLymphocytes in a new row under-neath Sample 1. This new row rep-resents the subpopulation of cellsthat fall inside the Lymphocyte gate.The Lymphocytes node is displayedin the Workspace window indent-ed and underneath the Samplename because the Lymphocytepopulation is a subset of Sample 1.When you generated the FL1+gate, this gate was drawn only onthe cells that fall within the Lymphocyte subpopulation. Thus, the FL1+ gate name iswritten indented and underneath Lymphocytes as shown in the Workspace to the right.
To easily describe the relationship between populations in the gating tree, we use agenealogical tree paradigm. For example, the Lymphocytes population is the “Parent”of the FL1+ population. Likewise, Sample 1 is the “Parent” of the Lymphocytes sub-population. Sample 1 is also the “Grandparent” of the FL1+ subpopulation.
Lymphocytes
Sample 1
FL1+
Grandparent
Parent
Parent
10 FlowJo Basic Tutorial
Adding StatisticsThere are many statistics that can be computed and displayed by FlowJo. Except forthe “Frequency of Parent” statistic, which is always displayed for each subpopulation,statistics must be added as separate nodes in the Workspace window. Each statisticnode holds a single value (a single statistic), which is recomputed whenever a gate thataffects that statistic changes. The full list of statistics includes such computations as flu-orescence intensity, CV or frequency within a parent population.
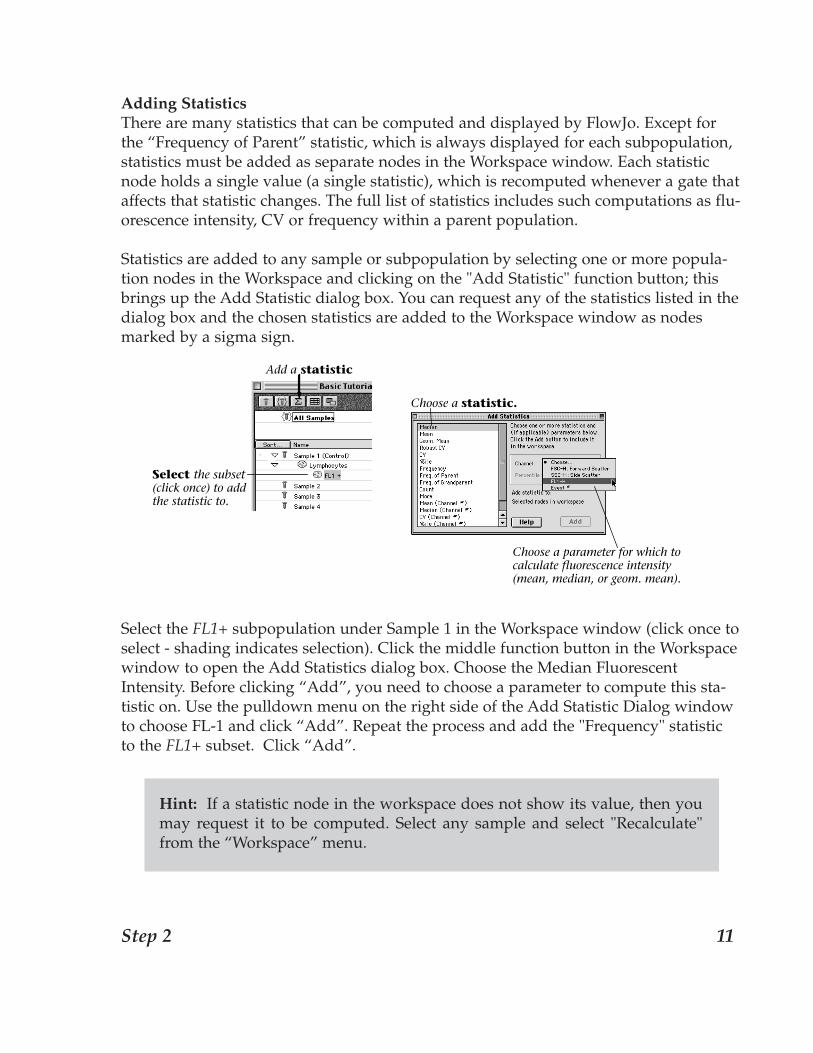
Statistics are added to any sample or subpopulation by selecting one or more popula-tion nodes in the Workspace and clicking on the "Add Statistic" function button; thisbrings up the Add Statistic dialog box. You can request any of the statistics listed in thedialog box and the chosen statistics are added to the Workspace window as nodesmarked by a sigma sign.
Select the FL1+ subpopulation under Sample 1 in the Workspace window (click once toselect - shading indicates selection). Click the middle function button in the Workspacewindow to open the Add Statistics dialog box. Choose the Median FluorescentIntensity. Before clicking “Add”, you need to choose a parameter to compute this sta-tistic on. Use the pulldown menu on the right side of the Add Statistic Dialog windowto choose FL-1 and click “Add”. Repeat the process and add the "Frequency" statisticto the FL1+ subset. Click “Add”.
Hint: If a statistic node in the workspace does not show its value, then youmay request it to be computed. Select any sample and select "Recalculate"from the “Workspace” menu.
Add a statistic
Select the subset (click once) to add the statistic to.
Choose a statistic.
Choose a parameter for which to calculate fluorescence intensity (mean, median, or geom. mean).
Step 2 11

Notice that in the Workspace window, there are two new nodes (lines of text) underthe FL1+ subpopulation name. The “Median Fluorescence Intensity” (MFI) describesthe brightness of the FITC parameter and the “Frequency” is the frequency of theentire sample (Frequency of Total).
Statistics: The statistic “Frequency” refers to the frequency of the whole sam-ple and can be thought of as Frequency of Total. The Frequency of Parentrefers to the frequency of the direct ancestor population (referred to as the“Parent” population in the genealogical tree metaphor). The Frequency ofParent is calculated by dividing the number of cells in the subpopulation bythe number of cells in its direct ancestor population. The Frequency of Parentstatistic is automatically calculated for every population of cells in theWorkspace.
This is a good time to save your Workspace. At this point, you should have addeddata files to a new Workspace, drawn gates to divide Sample 1 into subpopulations,and asked for statistics to be calculated for the subpopulations. If you wish to continuewith the tutorial but have not made your own Workspace, premade Workspaces areprovided that correspond to each analysis step. Premade Workspaces can be found inthe “Basic Tutorial” folder on the FlowJo CD or at www.flowjo.com/tutorial.html.
7,237 cells10,000 cells Frequency of Parent 0 cells 7,237 cells
72.4% =
0% =
Median Fluorescence Intensity (FL1)
Frequency of Total 0 cells 10,000 cells
0% =
12 FlowJo Basic Tutorial
3. Copy gates and statistics to all samples.
Drag and Drop Gates and Statistics.In FlowJo, all analysis nodes (gated subpopulations and statistics) can be applied toany other sample using drag and drop. Dragging any node (population or statistic)onto the name of another population will create a new node. This is an easy way tobuild and expand analysis trees. This method allows flexibility as you can drag one ormore node from any sample to build a new gating tree. The gating tree represents thesubsets of a sample in the same way Boolean expressions, such as AND and NOT, doin other analysis programs.
Since you have already saved this Workspace, feel free to play with drag and drop inorder to create analysis trees on other samples or expand the gating tree on Sample 1.When you wish to continue with Step 3 of the Tutorial choose “Revert” from the Filemenu to revert to the previously saved Workspace and eliminate the extra nodes youhave created. You should now have a Workspace with a gating tree applied to Sample1 only. If you wish you can also use the premade Workspace (Step 2) to continue withthe Tutorial.
Apply the Gating Tree to Every Sample.Analyses can be applied to every sample simultaneously by dragging the gating treeonto the All Samples group name in the upper panel of the workspace window. InStep 2 we analyzed the control sample in detail and now it is appropriate to apply thegating tree to the other seven samples in the experimental data set.
Select all the gates and statistics (Shift-click) and drag them onto the All Samples groupin the group (upper) panel of the Workspace. Release the mouse when you roll overthe All Samples name (it becomes shaded). Watch as the gating tree is applied to alleight samples.
Before FlowJo will apply the gates to each sample in the group, you will encounter a"Confirm Action" dialog box (shown on the next page). This box asks you to confirmthat you want to apply the gating tree that we created for Sample 1 to the rest of thesamples. FlowJo is warning us that we did not stain all of the samples in the same way(i.e., Sample 1 (unstained control) was not stained with FITC-CD8 antibody). Theannotation of each sample during collection reflects this fact. Thus, FlowJo is remind-ing us that we are "dragging gates based on stains that are not in the destination sam-ple". In this case, this action is perfectly reasonable, so click “Yes”.
Step 3 13
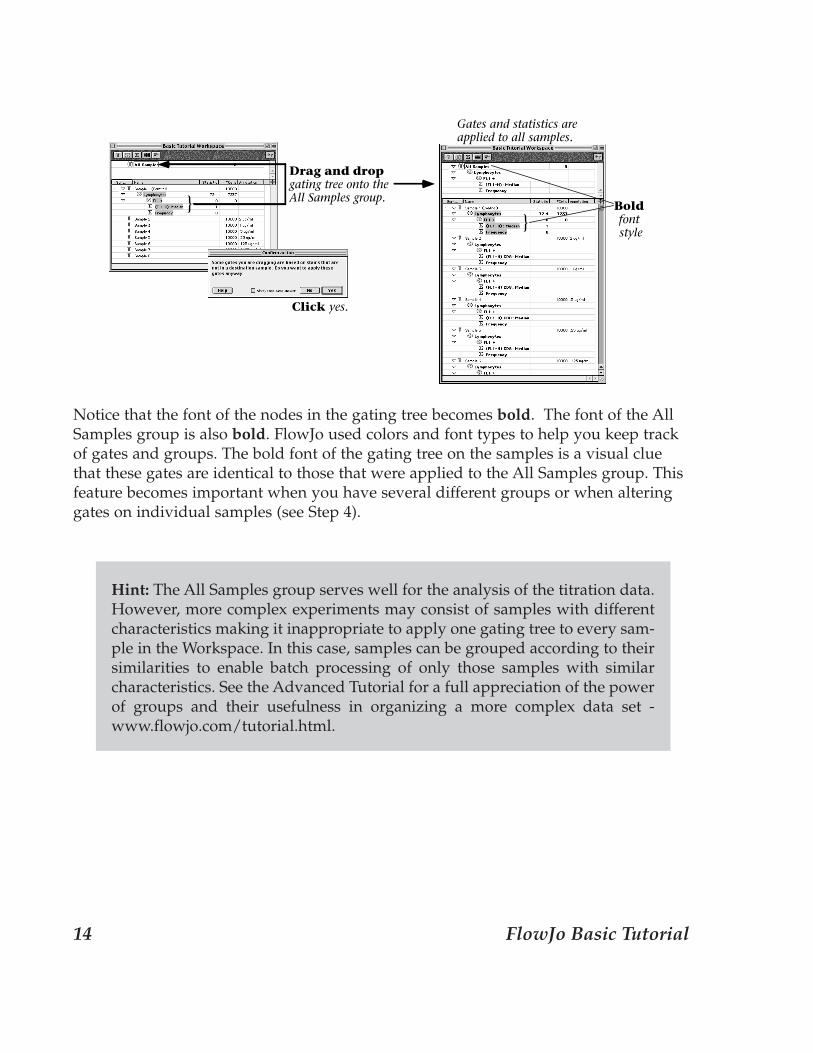
Notice that the font of the nodes in the gating tree becomes bold. The font of the AllSamples group is also bold. FlowJo used colors and font types to help you keep trackof gates and groups. The bold font of the gating tree on the samples is a visual cluethat these gates are identical to those that were applied to the All Samples group. Thisfeature becomes important when you have several different groups or when alteringgates on individual samples (see Step 4).
Hint: The All Samples group serves well for the analysis of the titration data.However, more complex experiments may consist of samples with differentcharacteristics making it inappropriate to apply one gating tree to every sam-ple in the Workspace. In this case, samples can be grouped according to theirsimilarities to enable batch processing of only those samples with similarcharacteristics. See the Advanced Tutorial for a full appreciation of the powerof groups and their usefulness in organizing a more complex data set -www.flowjo.com/tutorial.html.
Gates and statistics are applied to all samples.
Drag and drop gating tree onto the All Samples group.
Bold font style
Click yes.
}}
14 FlowJo Basic Tutorial
4. Verify gates on all samples.
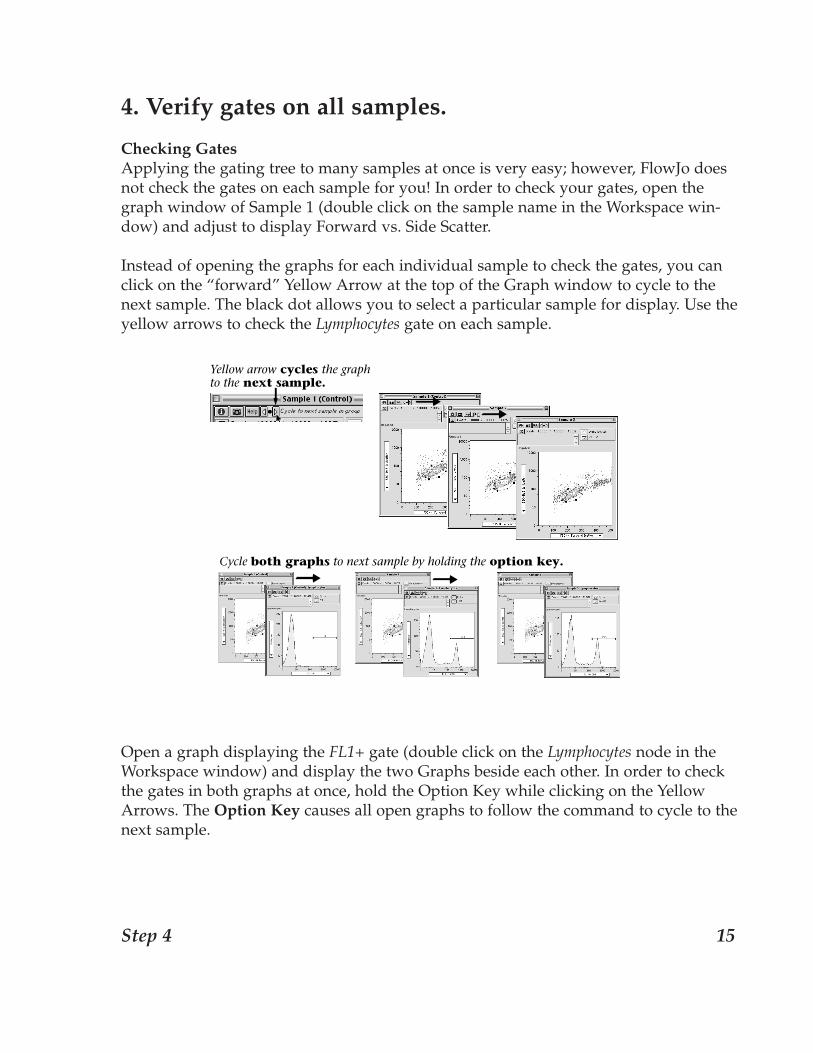
Checking GatesApplying the gating tree to many samples at once is very easy; however, FlowJo doesnot check the gates on each sample for you! In order to check your gates, open thegraph window of Sample 1 (double click on the sample name in the Workspace win-dow) and adjust to display Forward vs. Side Scatter.
Instead of opening the graphs for each individual sample to check the gates, you canclick on the “forward” Yellow Arrow at the top of the Graph window to cycle to thenext sample. The black dot allows you to select a particular sample for display. Use theyellow arrows to check the Lymphocytes gate on each sample.
Open a graph displaying the FL1+ gate (double click on the Lymphocytes node in theWorkspace window) and display the two Graphs beside each other. In order to checkthe gates in both graphs at once, hold the Option Key while clicking on the YellowArrows. The Option Key causes all open graphs to follow the command to cycle to thenext sample.
Yellow arrow cycles the graph to the next sample.
Cycle both graphs to next sample by holding the option key.
Step 4 15
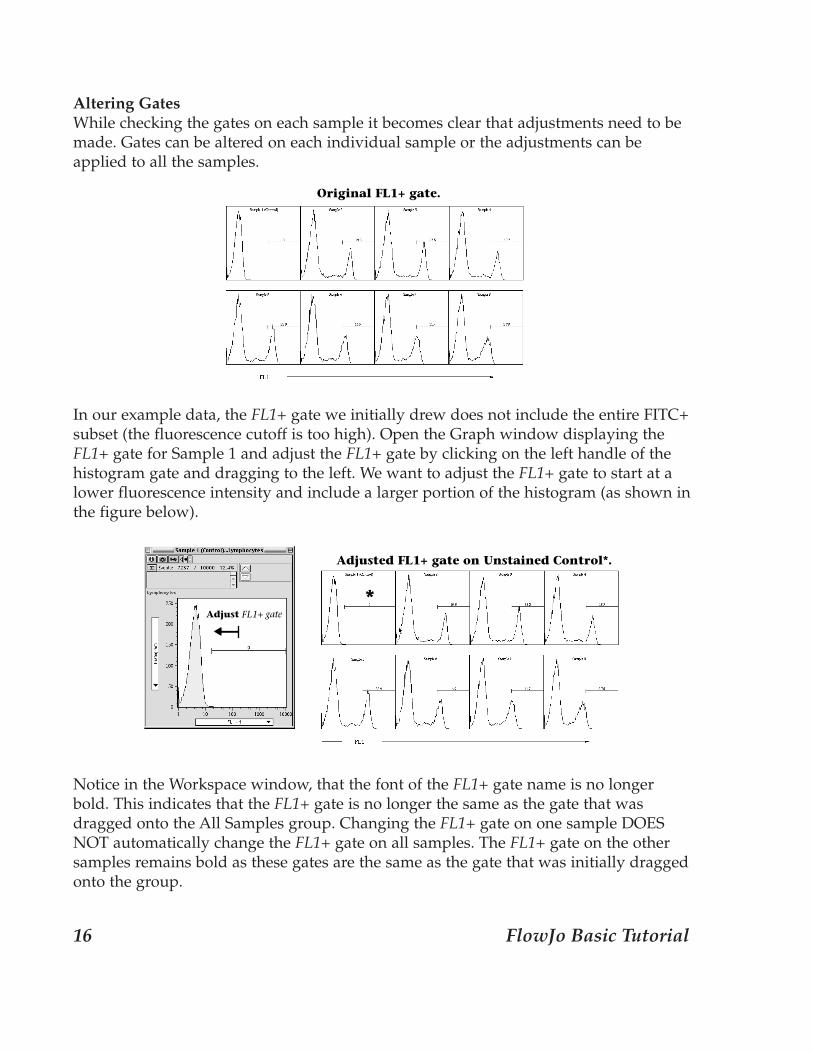
Altering GatesWhile checking the gates on each sample it becomes clear that adjustments need to bemade. Gates can be altered on each individual sample or the adjustments can beapplied to all the samples.
In our example data, the FL1+ gate we initially drew does not include the entire FITC+subset (the fluorescence cutoff is too high). Open the Graph window displaying theFL1+ gate for Sample 1 and adjust the FL1+ gate by clicking on the left handle of thehistogram gate and dragging to the left. We want to adjust the FL1+ gate to start at alower fluorescence intensity and include a larger portion of the histogram (as shown inthe figure below).
Notice in the Workspace window, that the font of the FL1+ gate name is no longerbold. This indicates that the FL1+ gate is no longer the same as the gate that wasdragged onto the All Samples group. Changing the FL1+ gate on one sample DOESNOT automatically change the FL1+ gate on all samples. The FL1+ gate on the othersamples remains bold as these gates are the same as the gate that was initially draggedonto the group.
Original FL1+ gate.
*
Adjusted FL1+ gate on Unstained Control*.
Adjust FL1+ gate
16 FlowJo Basic Tutorial
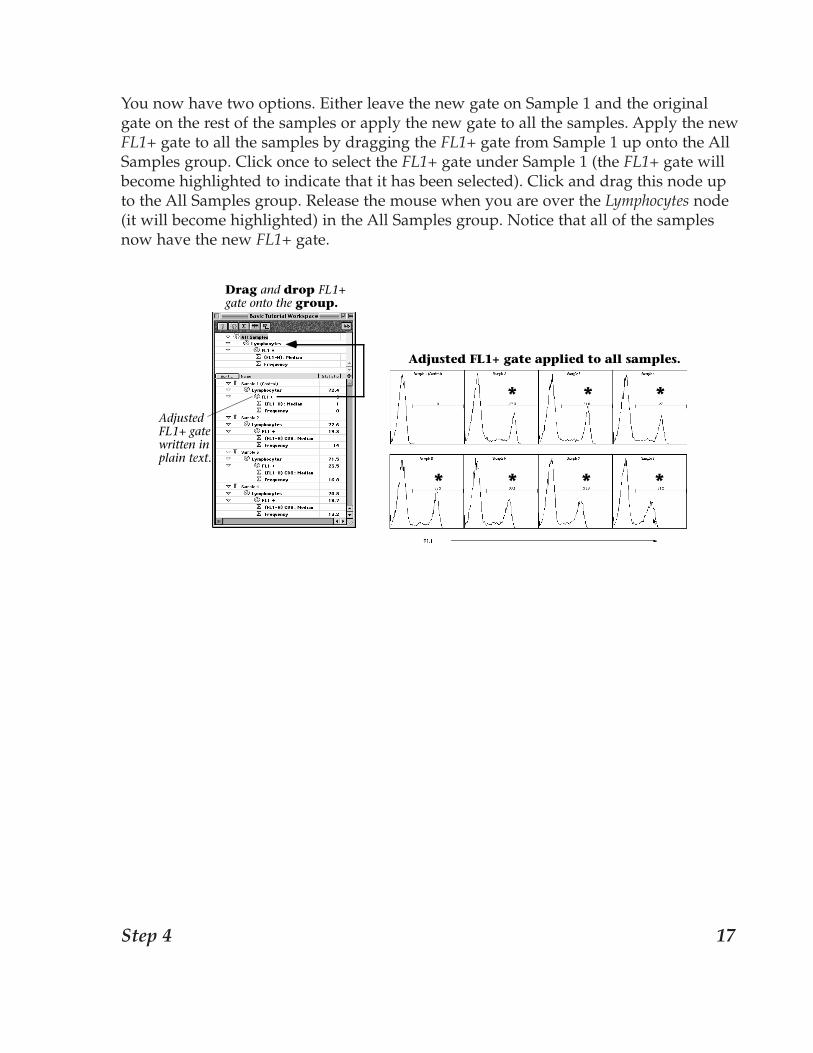
You now have two options. Either leave the new gate on Sample 1 and the originalgate on the rest of the samples or apply the new gate to all the samples. Apply the newFL1+ gate to all the samples by dragging the FL1+ gate from Sample 1 up onto the AllSamples group. Click once to select the FL1+ gate under Sample 1 (the FL1+ gate willbecome highlighted to indicate that it has been selected). Click and drag this node upto the All Samples group. Release the mouse when you are over the Lymphocytes node(it will become highlighted) in the All Samples group. Notice that all of the samplesnow have the new FL1+ gate.
Drag and drop FL1+ gate onto the group.
*
*
** *
*
Adjusted FL1+ gate applied to all samples.
Adjusted FL1+ gate written in plain text.
*
Step 4 17
Hint: This exercise illustrates two of the powerful features of FlowJo. First,FlowJo gives you the ability to make sure that all of your samples are ana-lyzed identically--i.e., have exactly the same gates, statistics, and other analy-ses, in order to limit subjectivity in the data analysis. Second, FlowJo givesyou the ability to make sample-specific modifications. There are times whenthe Lymphocyte gate (or any other gate) must be moved slightly to accommo-date a specific sample. FlowJo lets you move the gate or change the analysisfor individual samples without affecting all the rest. The workspace providesfeedback that this has occurred, but allows you to proceed with your batchanalyses and report generation using the sample-specific modifications forthose samples where it is necessary. With these two features, FlowJo provides
an environment which can be as rigid or as flexible as you need!
18 FlowJo Basic Tutorial
5.Generate a graphical report of all samples.
Layout Editor
The Layout Editor and Table Editor are used for making graphical and statisticalreports to summarize all the samples. Now that we have drawn gates to divide eachsample into subpopulations, added statistics, and checked our gates, it is time to makea summary of this experiment. The Table and Layout Editors work in similarly; eacheditor opens a new window that is saved with the Workspace. In these editor win-dows, you define which statistics or graphs to display in your report and FlowJo com-piles them into one document. The repetitive tasks are done for you!
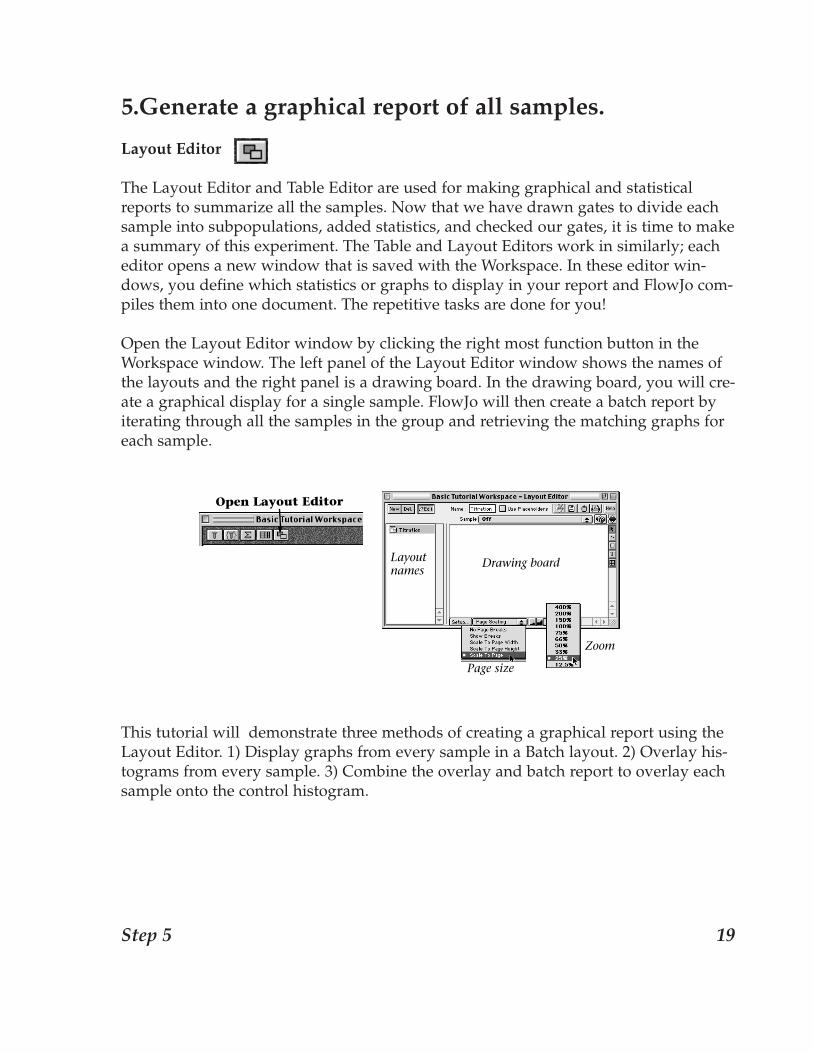
Open the Layout Editor window by clicking the right most function button in theWorkspace window. The left panel of the Layout Editor window shows the names ofthe layouts and the right panel is a drawing board. In the drawing board, you will cre-ate a graphical display for a single sample. FlowJo will then create a batch report byiterating through all the samples in the group and retrieving the matching graphs foreach sample.
This tutorial will demonstrate three methods of creating a graphical report using theLayout Editor. 1) Display graphs from every sample in a Batch layout. 2) Overlay his-tograms from every sample. 3) Combine the overlay and batch report to overlay eachsample onto the control histogram.
Open Layout Editor
Drawing board
Zoom
Page size
Layout names
Step 5 19
1) Batch Report
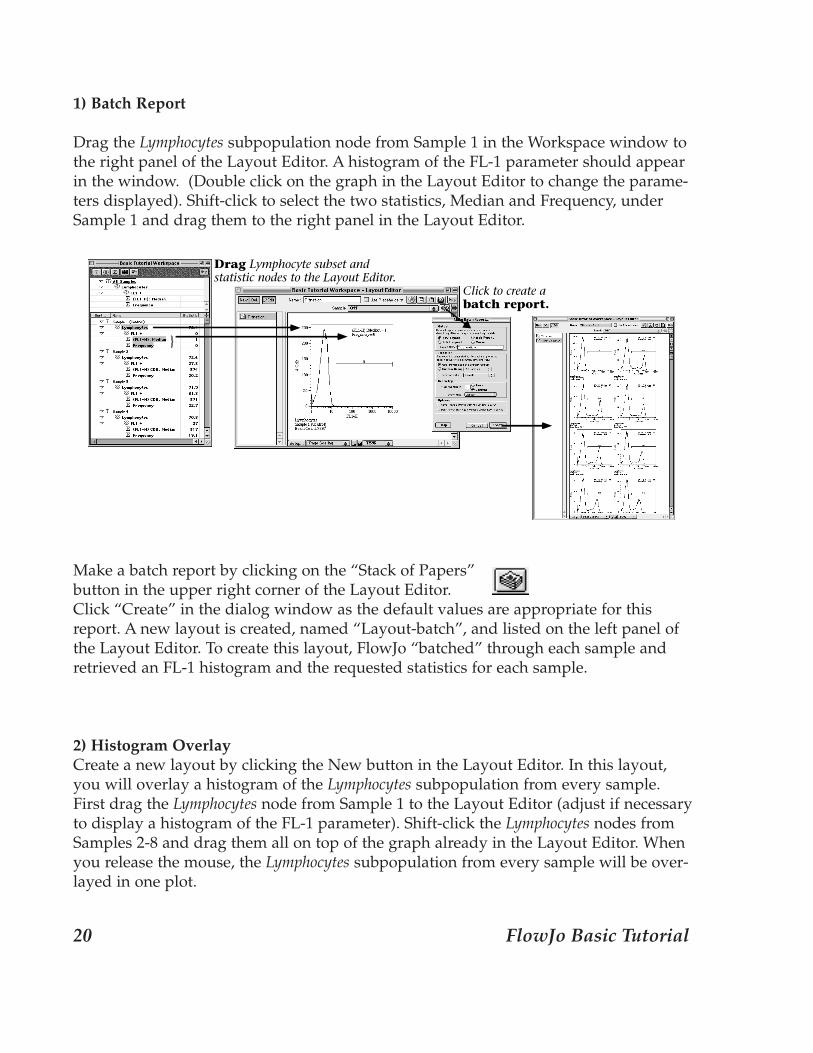
Drag the Lymphocytes subpopulation node from Sample 1 in the Workspace window tothe right panel of the Layout Editor. A histogram of the FL-1 parameter should appearin the window. (Double click on the graph in the Layout Editor to change the parame-ters displayed). Shift-click to select the two statistics, Median and Frequency, underSample 1 and drag them to the right panel in the Layout Editor.
Make a batch report by clicking on the “Stack of Papers” button in the upper right corner of the Layout Editor. Click “Create” in the dialog window as the default values are appropriate for thisreport. A new layout is created, named “Layout-batch”, and listed on the left panel ofthe Layout Editor. To create this layout, FlowJo “batched” through each sample andretrieved an FL-1 histogram and the requested statistics for each sample.
2) Histogram OverlayCreate a new layout by clicking the New button in the Layout Editor. In this layout,you will overlay a histogram of the Lymphocytes subpopulation from every sample.First drag the Lymphocytes node from Sample 1 to the Layout Editor (adjust if necessaryto display a histogram of the FL-1 parameter). Shift-click the Lymphocytes nodes fromSamples 2-8 and drag them all on top of the graph already in the Layout Editor. Whenyou release the mouse, the Lymphocytes subpopulation from every sample will be over-layed in one plot.
Click to create a batch report.
Drag Lymphocyte subset and statistic nodes to the Layout Editor.
20 FlowJo Basic Tutorial
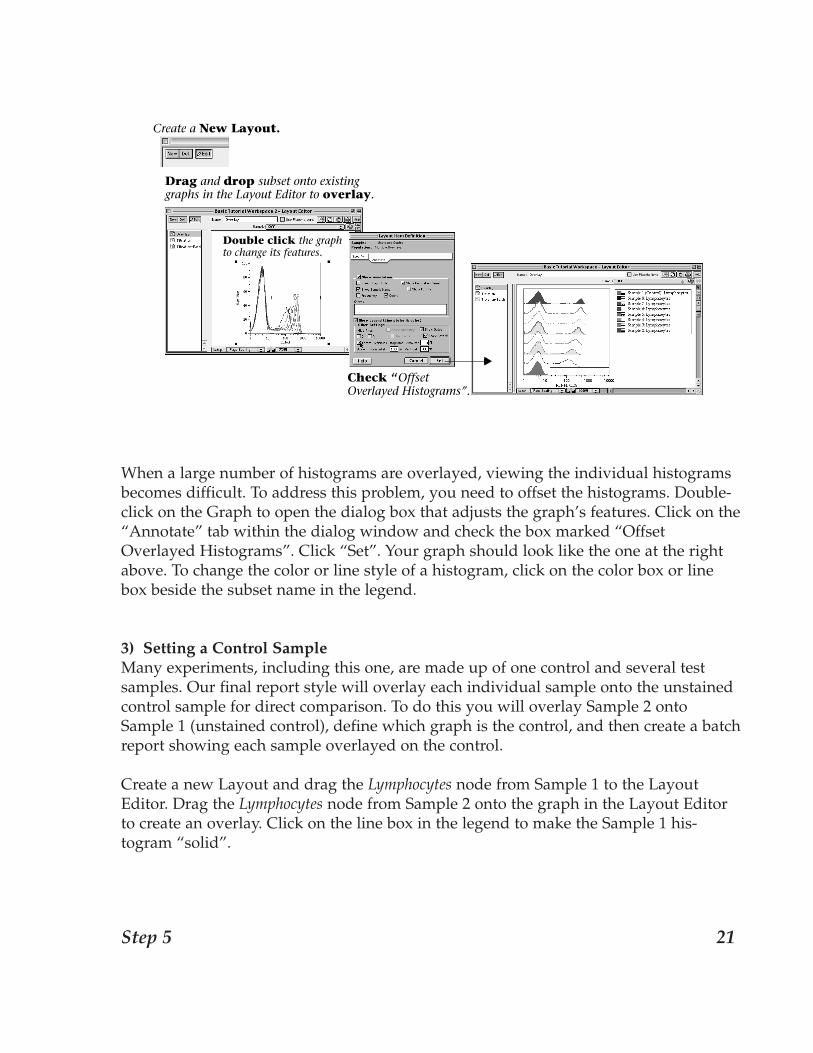
When a large number of histograms are overlayed, viewing the individual histogramsbecomes difficult. To address this problem, you need to offset the histograms. Double-click on the Graph to open the dialog box that adjusts the graph’s features. Click on the“Annotate” tab within the dialog window and check the box marked “OffsetOverlayed Histograms”. Click “Set”. Your graph should look like the one at the rightabove. To change the color or line style of a histogram, click on the color box or linebox beside the subset name in the legend.
3) Setting a Control SampleMany experiments, including this one, are made up of one control and several testsamples. Our final report style will overlay each individual sample onto the unstainedcontrol sample for direct comparison. To do this you will overlay Sample 2 ontoSample 1 (unstained control), define which graph is the control, and then create a batchreport showing each sample overlayed on the control.
Create a new Layout and drag the Lymphocytes node from Sample 1 to the LayoutEditor. Drag the Lymphocytes node from Sample 2 onto the graph in the Layout Editorto create an overlay. Click on the line box in the legend to make the Sample 1 his-togram “solid”.
Drag and drop subset onto existing graphs in the Layout Editor to overlay.
Create a New Layout.
Double click the graph to change its features.
Check “Offset Overlayed Histograms”.
Step 5 21
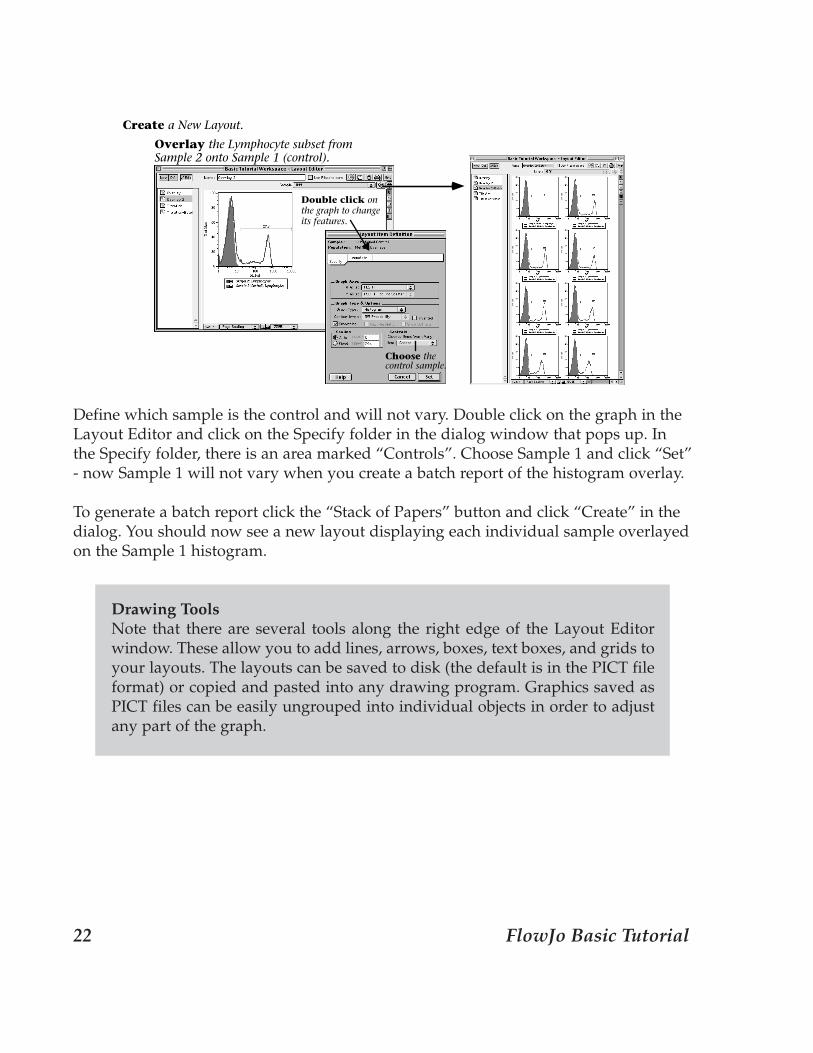
Define which sample is the control and will not vary. Double click on the graph in theLayout Editor and click on the Specify folder in the dialog window that pops up. Inthe Specify folder, there is an area marked “Controls”. Choose Sample 1 and click “Set”- now Sample 1 will not vary when you create a batch report of the histogram overlay.
To generate a batch report click the “Stack of Papers” button and click “Create” in thedialog. You should now see a new layout displaying each individual sample overlayedon the Sample 1 histogram.
Drawing ToolsNote that there are several tools along the right edge of the Layout Editorwindow. These allow you to add lines, arrows, boxes, text boxes, and grids toyour layouts. The layouts can be saved to disk (the default is in the PICT fileformat) or copied and pasted into any drawing program. Graphics saved asPICT files can be easily ungrouped into individual objects in order to adjustany part of the graph.
Overlay the Lymphocyte subset from Sample 2 onto Sample 1 (control).
Create a New Layout.
Choose the control sample.
Double click on the graph to change its features.
22 FlowJo Basic Tutorial
6. Generate a table of statistics from all samples.
Table Editor
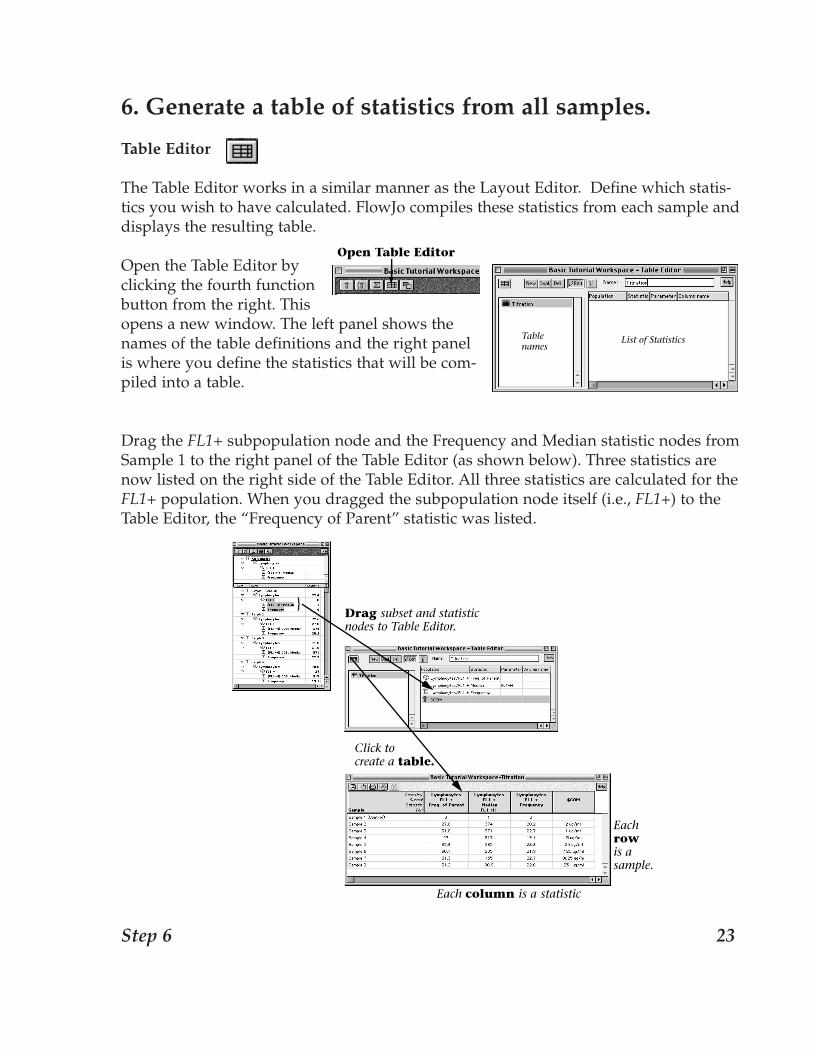
The Table Editor works in a similar manner as the Layout Editor. Define which statis-tics you wish to have calculated. FlowJo compiles these statistics from each sample anddisplays the resulting table.
Open the Table Editor byclicking the fourth functionbutton from the right. Thisopens a new window. The left panel shows thenames of the table definitions and the right panelis where you define the statistics that will be com-piled into a table.
Drag the FL1+ subpopulation node and the Frequency and Median statistic nodes fromSample 1 to the right panel of the Table Editor (as shown below). Three statistics arenow listed on the right side of the Table Editor. All three statistics are calculated for theFL1+ population. When you dragged the subpopulation node itself (i.e., FL1+) to theTable Editor, the “Frequency of Parent” statistic was listed.
Open Table Editor
List of StatisticsTable names
Step 6 23
In order to add information stored in an FCS keyword, click the “Key” buttonat the top of the Table Editor. In this experiment, the Comments field ($COMkeyword) was used to note the concentration of antibody each sample was stainedwith. To add this information to the table definition, choose $COM from the keywordlist and click “Include”.
Create the table by clicking the “grid” button in the upper left corner of theTable Editor. Each statistic listed in the Table Editor will become a column in the tableand each sample will become a row. This table will not be saved with the workspaceand must be saved, copied to the clipboard (for easy pasting into another program), orprinted using the buttons along the top left of the table to perform these functions.
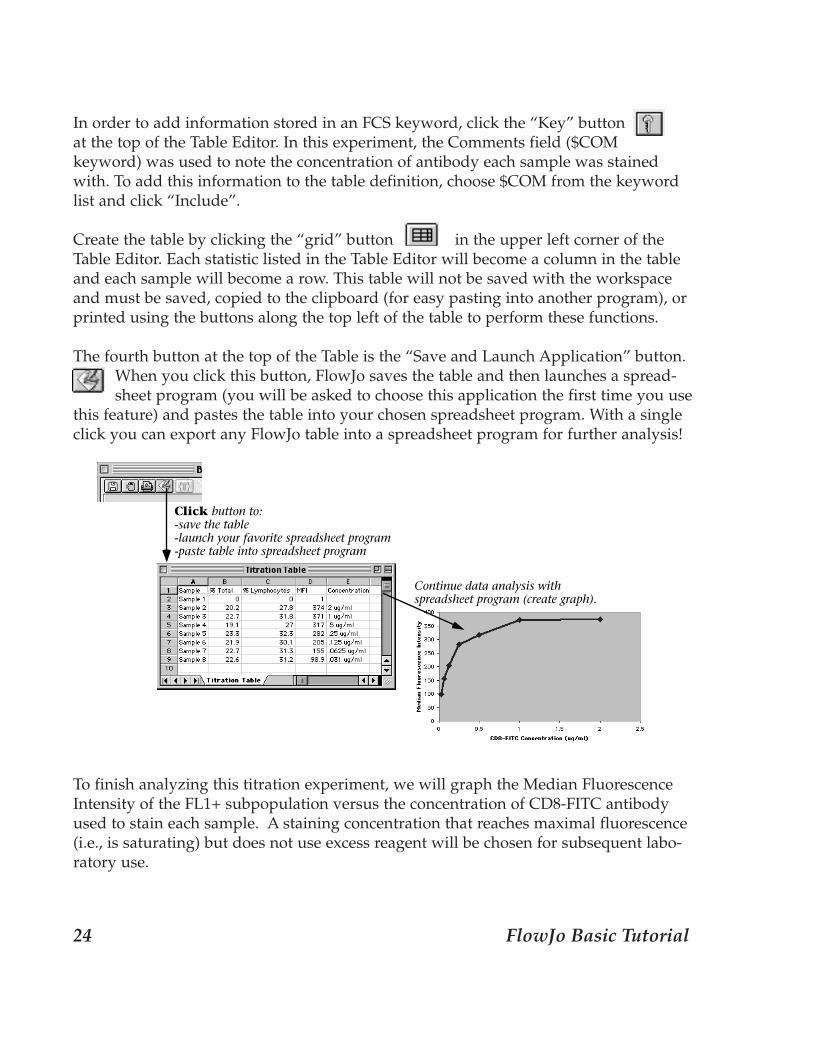
The fourth button at the top of the Table is the “Save and Launch Application” button.When you click this button, FlowJo saves the table and then launches a spread-sheet program (you will be asked to choose this application the first time you use
this feature) and pastes the table into your chosen spreadsheet program. With a singleclick you can export any FlowJo table into a spreadsheet program for further analysis!
To finish analyzing this titration experiment, we will graph the Median FluorescenceIntensity of the FL1+ subpopulation versus the concentration of CD8-FITC antibodyused to stain each sample. A staining concentration that reaches maximal fluorescence(i.e., is saturating) but does not use excess reagent will be chosen for subsequent labo-ratory use.
Click button to:-save the table-launch your favorite spreadsheet program -paste table into spreadsheet program
Continue data analysis with spreadsheet program (create graph).
24 FlowJo Basic Tutorial

Click the fourth button in the upper left corner of the table. This saves the Table andtransfers the data to the spreadsheet program of your choice. Use the spreadsheet pro-gram to produce a graph of Concentration of CD8-FITC reagent versus MedianFluorescence Intensity (as shown below). The saturating concentration of this reagentis 1 µg/ml. Therefore this CD8-FITC antibody reagent should be used at 1 µg/ml infurther experiments as long as the same staining conditions are used.
Step 6 25

Getting Help
Clicking on the HELP button in any FlowJo window launches a web brows-er to access a web page describing that topic, giving you "context-sensitivehelp".
Visit the FlowJo web page to view the entire Reference Manual:www.flowjo.com/v4/reference.html
For a more in depth tutorial, download the Advanced Tutorial at:www.flowjo.com/tutorial.html
Tech Notes - short step-by-step guides to FlowJo applications are available at:www.flowjo.com/tutorial.html
We encourage feedback! Please contact us with your comments about FlowJo,this Tutorial, or any of our Help files at:[email protected]
• FlowJo Basic Tutorial •FlowJo is a product of Tree Star, Inc.
www.flowjo.com800-366-6045
26 FlowJo Basic Tutorial