Embed Size (px)
Citation preview

Page 1

Page 2
Acknowledgements Written by James Hewitt
Edited by Ed Fenton
Produced by FERN
July 2011
ISBN 978-1-906607-16-6
The research and publication of this report has been made possible with support from DG
Development and DG Environment of the European Commission. The views in this report are
those of the author, and do not necessarily reflect those of FERN or any of the donors.
© FERN, July 2011
This material is offered free of charge for personal and non-commercial use, provided the source is acknowledged. For commercial or any other use, prior written permission must be obtained from FERN. In no case may this material be altered, sold or rented

Page 3
Contents
Section Heading Page
Summary
1 Introduction 1
2 National Renewable Energy Action Plans 2
3 EU trade with countries outside the EU 3
4 Trade between EU Member States 5
5 Production and trade in roundwood 7
6 The USA 9
7 Canada 11
8 Russia 13
9 Brazil 15
10 Other potential sources 16
11 Supplies of other potential forms of bioenergy 18
12 Conclusion
Appendix Charts and commentary on each EU Member States’ trade 21
Chart Heading Page
1 The EU’s imports of primary woody biomass from outside the EU (by importing country)
3
2 The EU’s imports of primary woody biomass from outside the EU (by supplying country)
4
3 Exports of woody biomass from the EU (by exporting country) 4
4 Intra-EU imports of primary woody biomass (by importing country) 5
5 Intra-EU exports of primary woody biomass (by exporting country) 5
6 Trends in the weight and import value of intra-EU trade in primary woody biomass
6
7 Production of roundwood in selected regions 7
8 Roundwood production in selected countries of the EU-27 8
9 Roundwood production in Europe other than the EU-27 and Russia 8
10 Exports of wood chips and mill residues from the USA 9
11 Exports of mill residues from the USA 9
12 Exports of wood chips and mill residues from Canada 11
13 Exports of mill residues from Canada 11
14 EU-27 imports of primary woody biomass from Russia 13
15 Russia’s exports of wood-based products 14
16 Brazil’s exports of wood-based products 15
17 EU-27 imports of chips, residues and logs from selected countries in Europe 16
18 Imports of chips and residues from selected countries 17
19 EU Member States’ imports of ethanol (HS code 2207) 18
20 EU Member States’ imports of palm oil 19

List of abbreviations
EU: European Union
FSC: Forest Stewardship Council
NREAP: National Renewable Energy Action Plan
RED: Renewable Energy Directive
RSPO: Roundtable on Sustainable Palm Oil
RWE volume: roundwood equivalent volume
UK: United Kingdom
USA: United States of America

Summary
The European Union’s (EU) Renewable Energy Directive of 2009 required each Member State to submit a National Renewable Energy Action Plan by June 2010, to indicate how it would meet its legally binding 2020 targets for renewable energy. As part of this, Member States were asked to provide data about the quantities of solid biomass produced domestically or imported, and about the energy which might be derived from that biomass.
Analysis of these data and trade statistics reveals that the quantity of wood required to satisfy the 2020 targets is likely to be too large to be met by increased production within the EU. Instead, Member States will have to rely on importing wood products from elsewhere, at the risk of damaging ecosystems in other parts of the world, while actually increasing the EU’s own carbon footprint.
Assuming that the mix of product types remains the same, Member States will need to use between 50 and 100 per cent more wood than is currently consumed as fuel.
Most of the increase in imports is likely to be for electricity generation, probably in the form of wood pellets supplied to a small number of large power stations. The most likely sources are Canada and the USA, and perhaps also Russia (if the risks associated with imports from Russia do not become prohibitive when the EU’s Illegal Timber Regulation is fully implemented in 2013).
Production of roundwood in North America fell during the economic downturn at the end of the last decade – and coincidentally, the shortfall is comparable to the additional volume of roundwood that will be required to meet the EU’s 2020 targets. Therefore, competition for suitable wood is likely to increase. Sustainability, particularly in the ‘catchment’ area of large wood pellet plants, may become difficult to maintain if, as is likely, the market for wood fuel within North America expands, and also if levels of timber and paper consumption in the region rebound to their pre-recession level.
The data provided in the Appendix indicates that the increase in Member States‟ use of wood for fuel will probably be between 100 and 200 million cubic metres and that in most Member States, the area of productive woodland that currently exists is unlikely to be large enough to meet the substantial increases in the volume of woody biomass required.
In some Member States it is possible that changes in forest management practice could result in increased supplies of woody biomass,1
The report concludes that if left unchanged, future flows of biomass from and to the EU risks not only damaging ecosystems in other parts of the world, but will also increasing the EU‟s own carbon footprint.
but this would take years (given the time it takes for trees to grow) and might not be consistent with sustainable forestry practices.
1 Much of the woodland in Germany is said to be over-mature.

Page 1Page 1
This report assesses the consumption of wood-based products in the context of the National Renewable Energy Action Plans (NREAPs) which EU Member States have prepared to show how they intend to meet targets set by the European Commission to ensure that 20 per cent of EU-wide energy consumption derives from renewable energy by 2020. It does so with reference to other forms of biomass.
1 - Introduction
Unfortunately, these NREAPs are an insufficient policy response to the increasing urgency with which deep cuts in greenhouse gas emissions associated with consumption must be made worldwide (except by those whose carbon footprint is minimal) if the target2
It is unclear how the NREAPs would be affected by changes in subsidies and taxation
to which governments around the world have committed themselves is to be met. Given the gas and particulate emissions attributable to the life cycle of wood fuel (from planting to extraction, processing, transporting and disposal), wood-based fuel is not carbon-neutral.
3
The sources of fuel described in the NREAPs include solid biomass. However, most of the NREAPs give little indication of the extent to which wood-based products – either in general or as specific products – contribute to the energy anticipated from solid biomass. Nor do they discuss the differences in energy content or probable sources of the components of that solid biomass.
– or indeed by changes in other input costs (particularly transportation), the price of alternative fuels (especially fossil fuel) and competition for raw material with alternative end-uses.
Firewood and charcoal are, and wood chips, mill residues, wood pellets and logs can be, produced specifically for use as fuel. This report refers to these six products as ‘primary woody biomass’.4
Particularly if traded, wood chips, mill residues and logs tend to be used as raw material for making pulp, panels such as particleboard or, in the case of logs, other products. Sawdust is the ingredient of first choice for wood pellets, provided that its raw material is consistent and homogenous.
The term ‘woody biomass’ comprises all these products but also includes the wooden products (including furniture but excluding pulp, paper and fuel) which are made from them. Some, perhaps much, primary woody biomass derives from sources such as private gardens which are not included in national statistics of roundwood production, and which are unlikely to be traded.
5
The end-use of these products is not apparent from national statistics, and is likely to vary according to local expedients and changes in price and demand.
At the end of its life in service, wood (if it is not prohibitively contaminated) can be used as fuel.
This report considers the production and trade in firewood, wood chips, mill residues, wood pellets and logs, and compares this with the trade in all wood-based products. This data focuses on the EU and the countries which have potential as suppliers of wood-based fuel. The figures alone, however, do not reveal whether the timberland being used to meet increased demand is being managed in a sustainable way.
Increased quantities of woody biomass are likely to be used primarily either with coal in a small number of large power stations (as in Belgium, Denmark, the Netherlands and the United Kingdom (UK), or widely as domestic or district heating (as in Austria, Finland and Sweden).
2 Ensuring that global average temperature does not exceed 2ºC above pre-industrial levels. 3 Sweden is progressively taxing fossil fuels in order to become independent of such fuel by 2020. http://www.svebio.se/?p=726 4 Solid “direct” and “indirect” supplies – Section 2a ‘Joint Wood Energy Enquiry 2008 Background Data Analysis’ UNECE Timber Section (03 2009) http://timber.unece.org/fileadmin/DAM/meetings/jwee2-data-report-24march.pdf . 5 If kept dry, pellets tend to be regarded as superior to wood chips particularly because they have a greater energy content per unit of weight than chips. However, energy is expended in drying their wood raw material.

Page 2Page 2
2 –
The NREAPs which EU Member States have prepared are meant to include separate, standardised estimates of how much solid biomass they consumed during 2006, and how much they anticipate consuming during 2015 and 2020, both as primary woody biomass and as other biomass. Each NREAP includes a schedule of the quantity of energy which the Member State anticipates generating for electricity, and separately for heating and cooling.
National Renewable Energy Action Plans
Unfortunately there is much scope for error when converting statistics from one unit of measurement to another (such as from energy to roundwood equivalent volume),6
This, coupled with inconsistencies
particularly for aggregates of products as different as thinnings and wood pellets.
7
Separate data sources
and omissions in the statistics, makes it unwise to draw firm conclusions about the physical quantity of woody biomass which the NREAPs anticipate. However, the quantity used in generating electricity from solid biomass within the EU is likely to double between 2010 and 2020, while the quantity used (perhaps independently from electricity generation) for heating and cooling will increase by about 50 per cent.
8
As the data provided in the Appendix indicates, that increase is probably between 100 and 200 million cubic metres. This is the same order of magnitude as the amount by which production of roundwood in Canada and the USA declined during the second half of last decade (see Chart 7).
tend to confirm the scale of additional woody biomass which may be required within the next ten years or so.
The increase for France, Germany and the UK would be between about 20 and 30 million cubic metres each. It would be between 10 and 20 million cubic metres each for Belgium, Italy, the Netherlands and Spain.
The increase in consumption anticipated for electricity generation tends to be much larger than that for heating and cooling. Given that just a few utility companies and opportunist developers of power projects9 will account for most of that increase, it is imperative that they make commitments (to the relevant planning authorities) to ensure that the (wood) fuel for their new power stations derives from sustainably managed sources.10
In most EU Member States, the area of productive woodland that currently exists is unlikely to be large enough to meet the substantial increases in the volume of woody biomass required. In some Member States it is possible that changes in forest management practice could result in increased supplies of woody biomass,
11 but this would take years (given the time it takes for trees to grow) and might not be consistent with sustainable forestry practices. Discrepancies between what is likely to be feasible and what national plans hope to achieve have been apparent for some time.12
6 Roundwood equivalent volume (abbreviated herein as RWE volume) is a unit of measure which represents the volume of logs (i.e. roundwood) from which a given quantity of wood-based products derives.
7 Particularly concerning units of measure and in converting between different units of measure. 8 Amongst the most rigorous of these is a study by U. Mantau et al., ‘Real potential for changes in growth and use of EU forests’ for EU wood (06 2010) http://ec.europa.eu/energy/renewables/studies/doc/bioenergy/euwood_final_report.pdf 9 For example MTG in the UK http://www.mgtpower.com/ 10 A number of agro–fuel power projects which might use palm oil as their primary fuel have been proposed in the UK. The planning approval process tends to be less rigorous concerning sustainability and legality than it should be (- the legality of products certified under the RSPO is not assured). 11 Much of the woodland in Germany is said to be over-mature. 12 Final paragraph, p. v, ‘Wood resources availability and demands – implications of renewable energy policies. A first glance at 2005, 2010 and 2020 in European countries.’ UNECE, 19 October 2007 http://www.unece.org/timber/docs/tc-sessions/tc-65/policyforum/Wood_availability_and_demand.pdf

Page 3Page 3
3 – EU trade with countries outside the EU13
Chart 1 – The EU’s imports of primary woody biomass from outside the EU (by importing country)
0
1
2
3
4
5
yt 31-12-2009
yt 30-06-2010
yt 31-12-2010
yt 31-12-2009
yt 30-06-2010
yt 31-12-2010
yt 31-12-2009
yt 30-06-2010
yt 31-12-2010
yt 31-12-2009
yt 30-06-2010
yt 31-12-2010
yt 31-12-2009
yt 30-06-2010
yt 31-12-2010
yt 31-12-2009
yt 30-06-2010
yt 31-12-2010
Wei
ght im
porte
d du
ring
succ
essi
ve 1
2-m
onth
per
iods
(milli
on to
nnes
)
0
2
4
6
8
10
12
Vol
ume
impo
rted
durin
gsu
cces
sive
12-
mon
th p
erio
ds(m
illion
cub
ic m
etre
s)
Belgium Denmark Finland ItalyNetherlands Spain Sweden Others
Firewood PelletsChips Residues LogsCharcoal
As Chart 1 indicates, the Netherlands consumes about 35 per cent of the wood pellets imported by the EU. Towards the end of 2010, Belgium, Denmark and Sweden each accounted for a further 10 per cent of the total. By contrast most of the firewood, wood chips and other residues are imported by Finland, Italy and Sweden.
The weight of wood pellets and mill residues imported by the EU has tended to increase more slowly than imports of wood chips. However, the increase in imports of pellets since mid-2010 is attributable primarily to imports by the UK.
During 2010, the energy content of this trade would have been in the order of 150 petajoules and 40 terawatt hours.14
The EU is said to be responsible for the consumption of the great majority of global wood pellet production – roughly 80 per cent of approximately 10 million tonnes during 2009.
15
The commercial viability of wood-pellet stoves and wood-pellet power stations is affected by the difference in price of alternative fuels if these are used in competing facilities.
16
13 This section is based on data published by Eurostat (CN8, monthly)
The use of pellets would increase if it were commercially viable to torrefy them.
http://epp.eurostat.ec.europa.eu/newxtweb/ January 2009 is the first month for which the source published data under heading (HS code) 44013020, which is why the charts in this section do not cover prior time periods. Commentators interpret that heading as referring exclusively to wood pellets, although the word pellet is not included in the official description. The letters “yt” before dates on the x-axis of the charts is an abbreviation for “year to” – for example, yt 31-12-2010 refers to the twelve month period 01-01-2010 to 31-12-2010 and yt 30-06-2009 refers to the twelve months from 01-07-2008 to 30-06-2009. Presenting data in this way smoothes out intra-monthly and seasonal variations. 14 Assuming the following (somewhat notional factors) in giga joules per tonne: 12 (firewood, wood chips, mill residues and logs), 18 (wood pellets). 1petajoule = 10^15 joules = 277 gigawatt hour. 15 http://www.pellet.org/linked/2010-07-09%20wpac%20nb-doe.pdf A second source suggests EU consumption amounted to 80% of 12 million tonnes of pellets during 2008 – Slide 3 http://www.pellet.org/linked/2010-12-06%20g%20murray%20northern%20pellet%20symposiu.pdf 16 Final two paragraphs, section 3, of the report by Don Roberts (2007) ‘Convergence of the Fuel, Food and Fiber Markets: A Forest Sector Perspective’ http://www.fs.fed.us/global/forum/dec07/Roberts_Fuel_Food_Fiber_Markets.doc

Page 4Page 4
Chart 2 – The EU’s imports of primary woody biomass from outside the EU (by supplying country)
0
1
2
3
4
5
yt 31-12-2009
yt 30-06-2010
yt 31-12-2010
yt 31-12-2009
yt 30-06-2010
yt 31-12-2010
yt 31-12-2009
yt 30-06-2010
yt 31-12-2010
yt 31-12-2009
yt 30-06-2010
yt 31-12-2010
yt 31-12-2009
yt 30-06-2010
yt 31-12-2010
yt 31-12-2009
yt 30-06-2010
yt 31-12-2010
Wei
ght i
mpo
rted
durin
gsu
cces
sive
12-
mon
th p
erio
ds(m
illion
tonn
es)
0
2
4
6
8
10
12
Vol
ume
impo
rted
durin
gsu
cces
sive
12-
mon
th p
erio
ds(m
illion
cub
ic m
etre
s)
Canada Norway Russia SwitzerlandUkraine Uruguay USA Others
Firewood PelletsChips Residues LogsCharcoal
Chart 2 shows that Canada, Russia and the United States of America (USA) account for most of the wood pellets imported into the EU. The supply of primary woody biomass from those three countries is described in separate sections below.
Comparing those figures with those in Chart 3, it is evident that the EU imports approximately ten times more primary woody biomass than it exports.
Chart 3 – Exports of primary woody biomass from the EU (by exporting country)
0.0
0.1
0.2
0.3
0.4
0.5
0.6
yt 31-12-2009
yt 30-06-2010
yt 31-12-2010
yt 31-12-2009
yt 30-06-2010
yt 31-12-2010
yt 31-12-2009
yt 30-06-2010
yt 31-12-2010
yt 31-12-2009
yt 30-06-2010
yt 31-12-2010
yt 31-12-2009
yt 30-06-2010
yt 31-12-2010
yt 31-12-2009
yt 30-06-2010
yt 31-12-2010
Wei
ght e
xpor
ted
durin
gsu
cces
sive
12-
mon
th p
erio
ds(m
illion
tonn
es)
0
1
2
3
4
5
Vol
ume
expo
rted
durin
gsu
cces
sive
12-
mon
th p
erio
ds(m
illion
cub
ic m
etre
s)
Bulgaria Denmark Estonia FranceGermany Latvia Sweden Others
B l i D k E t i
Firewood PelletsChips Residues LogsCharcoal
Clearly therefore (and given also the scale of intra-EU trade, see Charts 4 and 5) a reduction in the EU’s exports of these products would have negligible impact on their supply to end-users within the EU.
Page 5Page 5
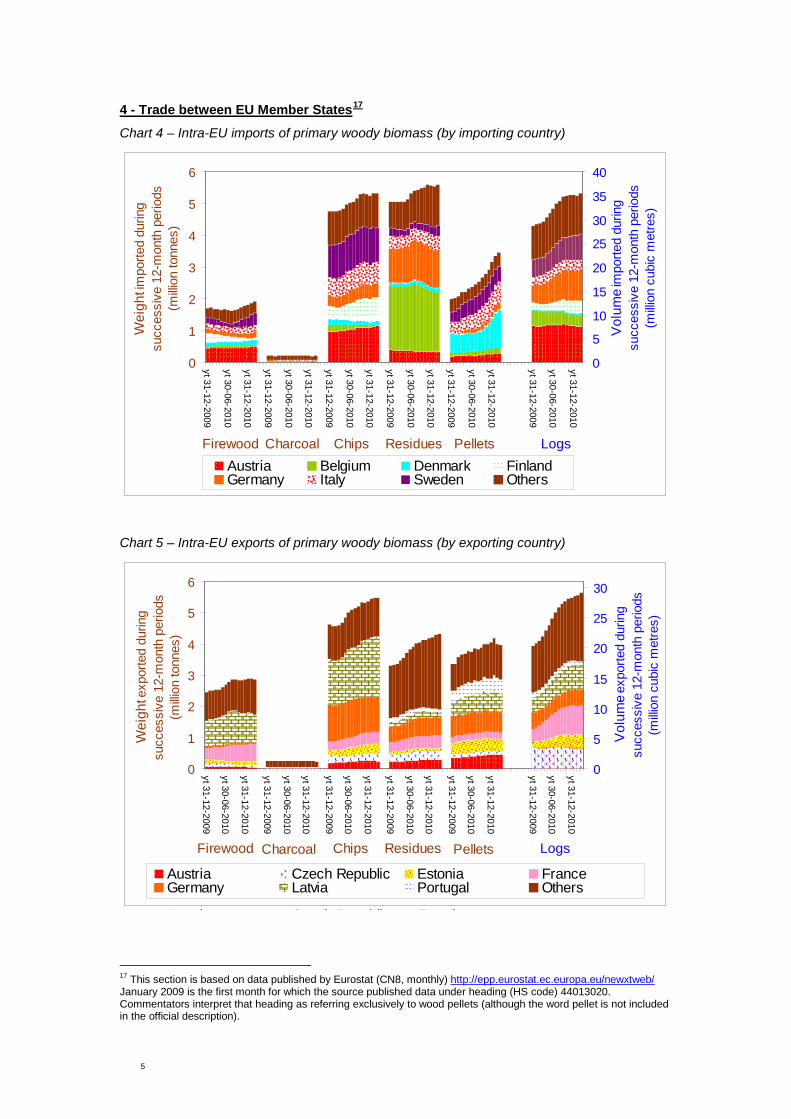
4 - Trade between EU Member States17
Chart 4 – Intra-EU imports of primary woody biomass (by importing country)
0
1
2
3
4
5
6
yt 31-12-2009
yt 30-06-2010
yt 31-12-2010
yt 31-12-2009
yt 30-06-2010
yt 31-12-2010
yt 31-12-2009
yt 30-06-2010
yt 31-12-2010
yt 31-12-2009
yt 30-06-2010
yt 31-12-2010
yt 31-12-2009
yt 30-06-2010
yt 31-12-2010
yt 31-12-2009
yt 30-06-2010
yt 31-12-2010
Wei
ght im
porte
d du
ring
succ
essi
ve 1
2-m
onth
per
iods
(milli
on to
nnes
)
0
5
10
15
20
25
30
35
40
Vol
ume
impo
rted
durin
gsu
cces
sive
12-
mon
th p
erio
ds(m
illion
cub
ic m
etre
s)
Austria Belgium Denmark FinlandGermany Italy Sweden Others
Firewood PelletsChips Residues LogsCharcoal
Chart 5 – Intra-EU exports of primary woody biomass (by exporting country)
0
1
2
3
4
5
6yt 31-12-2009
yt 30-06-2010
yt 31-12-2010
yt 31-12-2009
yt 30-06-2010
yt 31-12-2010
yt 31-12-2009
yt 30-06-2010
yt 31-12-2010
yt 31-12-2009
yt 30-06-2010
yt 31-12-2010
yt 31-12-2009
yt 30-06-2010
yt 31-12-2010
yt 31-12-2009
yt 30-06-2010
yt 31-12-2010
Wei
ght e
xpor
ted
durin
gsu
cces
sive
12-
mon
th p
erio
ds(m
illion
tonn
es)
0
5
10
15
20
25
30
Vol
ume
expo
rted
durin
gsu
cces
sive
12-
mon
th p
erio
ds(m
illion
cub
ic m
etre
s)
Austria Czech Republic Estonia FranceGermany Latvia Portugal Others
A t i C h R bli E t i
Firewood PelletsChips Residues LogsCharcoal
17 This section is based on data published by Eurostat (CN8, monthly) http://epp.eurostat.ec.europa.eu/newxtweb/ January 2009 is the first month for which the source published data under heading (HS code) 44013020. Commentators interpret that heading as referring exclusively to wood pellets (although the word pellet is not included in the official description).

Page 6Page 6
Charts 4 and 5 indicate that the trade in wood pellets within the EU has tended to increase since 2009.18
The two charts make it clear that there are substantial discrepancies between the figures given for intra-EU imports and exports, particularly of wood pellets, whereas technically the figures should be the same. The discrepancies make it difficult to formulate and audit EU policy, and reflect inconsistencies in product classification and in identifying the country of origin and/or destination.
The same is true for the trade in wood chips and mill residues during 2010.
Concerning intra-EU trade in wood pellets, Denmark, Italy, and Sweden are the leading importers and have accounted for most of the increase since 2009.
Germany, the Baltic States (primarily Latvia), Austria and Portugal are the main suppliers in the intra-EU trade in wood pellets.
Chart 6 – Trends in the weight and import value of intra-EU trade in primary woody biomass19
05
101520253035404550
yt 31-12-2007
yt 31-12-2008
yt 31-12-2009
yt 31-12-2010
yt 31-12-2007
yt 31-12-2008
yt 31-12-2009
yt 31-12-2010
Wei
ght im
porte
d du
ring
succ
essi
ve 1
2-m
onth
per
iods
(milli
on to
nnes
)
0.0
0.5
1.0
1.5
2.0
2.5
3.0
3.5
4.0
Impo
rt va
lue i
mpo
rted
durin
gsu
cces
sive
12-
mon
th p
erio
ds(E
uro
billio
n, c
if, n
omin
al)
Firewood Charcoal Chips Residues* Pellets* Logs
Ch l Chi R id * P ll * L
Weight Import value
* Wood pellets were classified under the same commodity code as mill residues prior to 2009.
Comparing the proportions of each product in the total on the left hand side of Chart 6 with those of the right hand side, it is clear that the unit export value (in Euros per tonne) for wood pellets (and charcoal) considerably exceeds that for firewood, wood chips and mill residues – reflecting the degree to which pellets differ from the products with which they compete as woody biomass fuel.
18 Since January 2009, the trade in wood pellets has been assigned a unique commodity code – 44013010 – in the statistics published by Eurostat, which provides bilateral trade statistics on behalf of the EU’s Member States. One might extrapolate the trend in trade in wood pellet backwards from that date by inspection of Chart 6. 19 Where Eurostat provides volume but not weight for logs, the volume to weight ratio assumed in this chart is 1.2 cubic metres per tonne.
Page 7Page 7
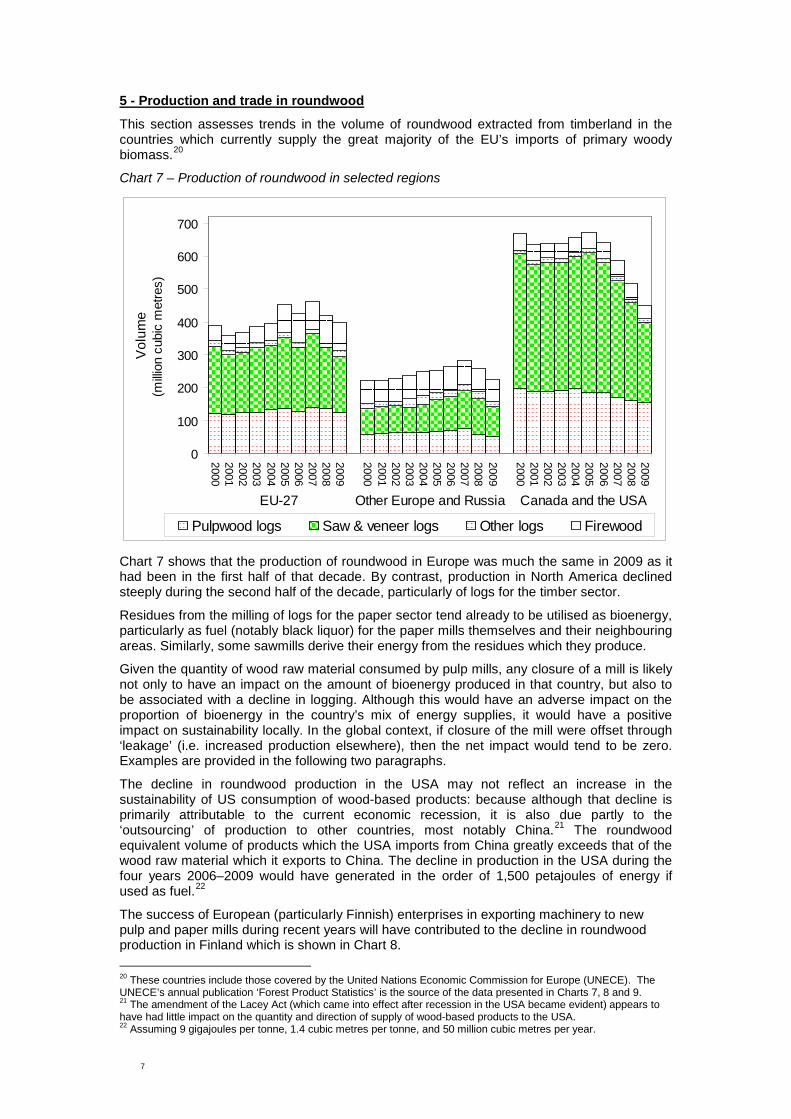
This section assesses trends in the volume of roundwood extracted from timberland in the countries which currently supply the great majority of the EU’s imports of primary woody biomass.
5 - Production and trade in roundwood
20
Chart 7 – Production of roundwood in selected regions
0
100
200
300
400
500
600
700
2000200120022003200420052006200720082009
2000200120022003200420052006200720082009
2000200120022003200420052006200720082009
Vol
ume
(milli
on c
ubic
met
res)
Pulpwood logs Saw & veneer logs Other logs Firewood
EU-27 Canada and the USAOther Europe and Russia
Chart 7 shows that the production of roundwood in Europe was much the same in 2009 as it had been in the first half of that decade. By contrast, production in North America declined steeply during the second half of the decade, particularly of logs for the timber sector.
Residues from the milling of logs for the paper sector tend already to be utilised as bioenergy, particularly as fuel (notably black liquor) for the paper mills themselves and their neighbouring areas. Similarly, some sawmills derive their energy from the residues which they produce.
Given the quantity of wood raw material consumed by pulp mills, any closure of a mill is likely not only to have an impact on the amount of bioenergy produced in that country, but also to be associated with a decline in logging. Although this would have an adverse impact on the proportion of bioenergy in the country’s mix of energy supplies, it would have a positive impact on sustainability locally. In the global context, if closure of the mill were offset through ‘leakage’ (i.e. increased production elsewhere), then the net impact would tend to be zero. Examples are provided in the following two paragraphs.
The decline in roundwood production in the USA may not reflect an increase in the sustainability of US consumption of wood-based products: because although that decline is primarily attributable to the current economic recession, it is also due partly to the ‘outsourcing’ of production to other countries, most notably China.21 The roundwood equivalent volume of products which the USA imports from China greatly exceeds that of the wood raw material which it exports to China. The decline in production in the USA during the four years 2006–2009 would have generated in the order of 1,500 petajoules of energy if used as fuel.22
The success of European (particularly Finnish) enterprises in exporting machinery to new pulp and paper mills during recent years will have contributed to the decline in roundwood production in Finland which is shown in Chart 8.
20 These countries include those covered by the United Nations Economic Commission for Europe (UNECE). The UNECE’s annual publication ‘Forest Product Statistics’ is the source of the data presented in Charts 7, 8 and 9. 21 The amendment of the Lacey Act (which came into effect after recession in the USA became evident) appears to have had little impact on the quantity and direction of supply of wood-based products to the USA. 22 Assuming 9 gigajoules per tonne, 1.4 cubic metres per tonne, and 50 million cubic metres per year.

Page 8Page 8
Chart 8 – Roundwood production in selected countries of the EU-27
0
50
100
150
200
250
2000200120022003200420052006200720082009
2000200120022003200420052006200720082009
2000200120022003200420052006200720082009
2000200120022003200420052006200720082009
Vol
ume
(milli
on c
ubic
met
res)
Austria Baltic States Finland FranceGermany Poland Sweden Other EU-27
Pulpwood logs Other logsSaw & veneer logs Firewood
The discontinuity between 2004 and 2005 in data for production of firewood in France presumably reflects a change in definition of both the product and the range of sources.
Chart 9 – Roundwood production in Europe other than the EU-27 and Russia
0
5
10
15
20
25
30
352000200120022003200420052006200720082009
2000200120022003200420052006200720082009
2000200120022003200420052006200720082009
2000200120022003200420052006200720082009
Vol
ume
(milli
on c
ubic
met
res)
Belarus Bosnia-Herzegovina Croatia NorwaySwitzerland Turkey Ukraine Others
Pulpwood logs Other logsSaw & veneer logs Firewood
Chart 9 indicates that roundwood production during the last decade tended to increase in Turkey and Ukraine, but changed little overall elsewhere. However, source data for several countries in Europe, including Belarus and Ukraine, have remained unchanged for a number of years. In contrast, EU-27 imports of timber sector products (mainly sawn wood) from those countries tended to decrease during 2008 and 2009 (and those from Belarus decreased throughout the second half of last decade).

Page 9Page 9
6 - The USA23
Chart 10 - Exports of wood chips and mill residues (including wood pellets) from the USA
0
1
2
3
4
5
6
20002001200220032004200520062007200820092010
20002001200220032004200520062007200820092010
Wei
ght
(milli
on to
nnes
)
0
50
100
150
200
250
300
350
400
450
Exp
ort v
alue
(US$
milli
on, f
ob, n
omin
al)
EU-27 Japan Canada Rest of World
J C d
Export valueWeight
Chart 10 indicates that the weight of wood chips and mill residue (including wood pellets) exported from the USA to the EU (roughly 10 per cent of the total export during 2010) is dwarfed by that exported to Canada and Japan. In 2010, however, in terms of export value the EU accounted for almost as large a proportion of the total as Canada and Japan – reflecting the difference in unit export value between wood pellets (mainly exported to the EU) and wood chips (mainly exported to Canada and Japan).
Chart 11 - Exports of mill residues from the USA
0
100
200
300
400
500
600
20002001
200220032004
20052006
200720082009
2010
2000
200120022003
20042005
200620072008
20092010
Wei
ght
(thou
sand
tonn
es)
Belgium Netherlands UKOther EU-27 Canada Rest of World
Rest of worldEU-27
23 The data presented in the charts in this section come from the United States International Trade Commission Trade DataWeb http://dataweb.usitc.gov/scripts/user_set.asp

Page 10Page 10
Chart 11 illustrates the surge in exports of mill residues from the USA during 2008 and 2009. Belgium, the Netherlands and the UK now account for almost all the total, most of which comprises wood pellets made in a small number of new mills and shipped from Mobile (Alabama) and Tampa (Florida).
The quantity exported to the EU was lower in 2010 than in 2009, perhaps because of the closure of a large pellet plant in Selmer (Alabama) which was having difficulties concerning its finances (despite subsidies) and the quality of its pellets.24
Some, perhaps most, of the large wood-pellet plants which supply the EU from the USA are at least partly owned by investors based in the EU. Structural changes in the USA’s paper and timber sectors have helped plantations and forests in the southern states to mature. Exporting pellets to the EU (primarily for use as fuel to generate electricity) will tend to reverse the decline in the region’s logging industry.
There is considerable interest in producing wood pellets in north-eastern states of the USA, notably Maine, both for export to the EU and to stimulate sales locally to consumers who are not connected to natural gas networks.25
By importing wood pellets, the EU is outsourcing the production of its carbon-based fuel. Under the (still current) Kyoto Protocol this enables the EU to claim that its carbon emissions are decreasing, as signatories to the protocol must report their emissions from production rather than consumption or both.
In the longer term, the availability of raw material for the USA’s exports of wood pellets will tend to decline as a consequence of efforts to increase the proportion of the national energy consumption that is supplied from ‘renewable’ sources – 25 per cent by 2025. Proposed legislation, which would support such a Renewable Energy Standard has not been accepted.26 The quality of the plans which state governments in the USA have devised in order to meet that target is said to be poor and to have been influenced by political considerations (the fossil fuel lobby). Relevant industry groups continue to advocate for that “25 per cent by 2025” target.27The USA is said to subsidise the production of pellets by US$45 per tonne.28
If the EU’s Illegal Timber Regulation is fit for purpose and rigorously implemented, then importers in the USA might follow the example of their EU counterparts and reduce their exposure to wood-based products of uncertain origin supplied from China, which would help revitalise the USA’s wood-processing sector.
German and Swedish enterprises (RWE Innogy and BMC) have jointly invested in a large (750,000 tonne/year) wood pellet mill at Waycross, Georgia. Due to become operational in 2011, the mill will use its output to co-fire a power station at Amer, in the Netherlands,29 before being switched to supply a plant in Tilbury, UK.30
A Swedish enterprise (JCE)
31
The availability of sawdust, the most usual wood raw material for pellets has decreased over recent years as the recession has led to reduced sales of sawn timber. Pellet manufacturers have tended to use wood chips and even logs in order to supplement the sawdust that remains available at a competitive price.
owns the 560,000 tonne/year mill of Green Core Biomass (in Cottonville, Florida). That mill has been constructed in order to supply the EU market.
24 http://timberbuysell.com/Community/DisplayNews.asp?id=5282 25 Natural gas is a major competitor of wood pellets for residential heating. 26 The “American Clean Air Act 2009” as proposed by congressmen Waxman and Markey. 27 http://www.cleanenergy.org/images/files/SACE%20IRP%20comments%20Attachment%203.pdf also http://www.heatne.com/ and http://www.futuremetrics.net/ 28 http://www.pellet.org/linked/2010-07-09%20wpac%20nb-doe.pdf 29 http://biomassmagazine.com/articles/3546/georgia-biomass-will-ship-pellets-to-europe 30 http://www.powergenworldwide.com/index/display/articledisplay/6267724905/articles/powergenworldwide/renewables/biomass/2010/11/rwe-npower_to_convert.html 31 http://www.jcegroup.se/the_jce_story/green_circle_bio_energy.aspx

Page 11Page 11
7 - Canada32
Chart 12 - Exports of wood chips and mill residues from Canada
0.0
0.2
0.4
0.6
0.8
1.0
1.2
1.4
1.6
1.8
20002001200220032004200520062007200820092010
20002001200220032004200520062007200820092010
Wei
ght (
estim
ated
)(m
illion
tonn
es)
0
50
100
150
200
250
300
350
400
Exp
ort v
alue
(US
$ m
illion
, fob
, nom
inal
)
Netherlands UK Other EU-27Japan USA Rest of World
Export valueWeight (estimated )
Chart 12 indicates that, during 2010, the EU (primarily the Netherlands and the UK) was the destination for almost two thirds of Canada’s exports of wood chips and mill residues in terms of export value. Wood pellets comprise a large majority of those exports to the EU.33
Chart 13 - Exports of mill residues from Canada
0
50
100
150
200
20002001
2002
20032004
20052006
20072008
2009
2010
2000
2001
20022003
20042005
20062007
2008
20092010
Exp
ort v
alue
(US
$ m
illion
, fob
, nom
inal
)
Alberta British Colombia New Brunswick Nova ScotiaOntario Quebec Others
Exports to the EU-27 Rest of the world
32 Source of data presented in Charts 12 and 13 (export value): http://www.ic.gc.ca/sc_mrkti/tdst/tdo/tdo.php?lang=30&headFootDir=/sc_mrkti/tdst/headfoot&productType=HS6&cacheTime=962115865#tag and (weight): Eurostat (CN8, monthly) http://epp.eurostat.ec.europa.eu/newxtweb/ 33 Based on assessment of import statistics published by Eurostat, Japan Customs, US International Trade Commission Trade DataWeb

Page 12Page 12
Chart 13 indicates that British Columbia accounts for most of the mill residues which are exported from Canada – particularly to the EU, even though British Columbia is further away from the EU than any other Canadian province except Yukon.
Canada’s other exports of mill residues to the EU are supplied from Nova Scotia and, to a lesser extent, New Brunswick.
Suppliers’ profits have declined considerably as a consequence of changes in the exchange rate between the Canadian dollar and the Euro.
Discussion
34 Most of Canada’s production of wood pellets is exported to the EU,35 though some is exported to Japan.36
The proportion of the EU’s imports of wood pellets which is supplied from British Columbia has decreased in recent years, transportation costs having become prohibitive (and volatile).
In both destinations, the pellets are used primarily as fuel for large power stations co-fired with coal. British Columbia supplies most of those pellets.
The province is seeking to offset the decline in demand for its pellets from the EU by exporting to South Korea.37
A number of provinces plan to reduce their use of fossil fuel for heating. If those plans are implemented, then local demand will tend to divert supplies away from export markets.
In Newfoundland and Labrador, consumption of woody biomass is likely to have increased as a consequence of the government reimbursing 25 per cent of the retail price paid by residential users for the purchase of new wood stoves.38
The area of forest in British Columbia which has been affected by an exceptionally severe epidemic of mountain pine beetle is very large. The export of wood-pellet fuel from the province to the EU partly reflects efforts to maximise the commercial value of the affected trees (which declines to zero over a period of 15 years).
34 http://www.trurodaily.com/News/Local/2010-05-31/article-1207106/Shaw-Resources-lays-off-workers,-cuts-production-at-N.B.-wood-pellet-plant/1 See also slide 10 http://www.pellet.org/linked/2010-07%20gordon-murray%20pfi.pdf 35 Slide 15 http://www.pellet.org/linked/2010-07-07(2)%20wpac%20env%20canada.pdf 36 Penultimate paragraph, page 107 http://timber.unece.org/fileadmin/DAM/publications/FPAMR2009.pdf 37 Presentation by Gordon Murray at Wood Pellet conference, Wels, 2011 (03 03 2011) 38 http://www.nr.gov.nl.ca/nr/forms/forestry/wood_pellet_rebate_application.pdf

Page 13Page 13
Chart 14 – EU-27 imports of primary woody biomass from Russia
8 - Russia 39
0.0
0.2
0.4
0.6
0.8
1.0
1.2
1.4
1.6
1.8
yt 31-12-2009
yt 30-06-2010
yt 31-12-2010
yt 31-12-2009
yt 30-06-2010
yt 31-12-2010
yt 31-12-2009
yt 30-06-2010
yt 31-12-2010
yt 31-12-2009
yt 30-06-2010
yt 31-12-2010
yt 31-12-2009
yt 30-06-2010
yt 31-12-2010
yt 31-12-2009
yt 30-06-2010
yt 31-12-2010
Wei
ght im
porte
d du
ring
succ
essi
ve 1
2-m
onth
per
iods
(milli
on to
nnes
)
0.0
0.5
1.0
1.5
2.0
2.5
3.0
3.5
4.0
4.5
Vol
ume
impo
rted
durin
gsu
cces
sive
12-
mon
th p
erio
ds(m
illion
cub
ic m
etre
s)
Denmark Finland Sweden Others
D k Fi l d
Firewood PelletsChips Residues LogsCharcoal
Chart 14 indicates that Denmark and Sweden each accounted for roughly one third of the weight of wood pellets which were imported into the EU from Russia towards the end of 2010. Finland imports most of the weight of wood chips and mill residues imported into the EU. The weight of wood chips is increasing rapidly, not least to help offset the reduction in the volume of wood logs which had previously been imported for Finland’s pulp industry but which are now subject to increased export tariffs on departure from Russia.
A very large pellet plant should be fully operational in Russia by the end of 2011; the Vyborgskaya Cellulose mill will have an annual output capacity of one million tonnes and its pellets will be sold mainly on the spot market. Other substantial pellet plants are planned. However, some plants have closed, particularly as a consequence of changes in exchange rates and an increase in the cost of Russian wood raw material.40 During 2009, just two enterprises supplied approximately 40 per cent of the 600,000 tonnes of wood pellets exported from Russia to the EU.41
Russia revised its Forestry Code during 2006, but the revised code is unclear and dysfunctional.
Discussion
42 Consequently, it will be difficult for those who first place wood-based products from Russia on the EU market to carry out due diligence when, from 3 March 2013,43 the EU’s Illegal Timber Regulation applies fully.44
39 Source: Eurostat (CN8, monthly)
http://epp.eurostat.ec.europa.eu/newxtweb/ 40 Final three paragraphs, page 2, presentation by Olga Rakitova at Pellet Conference, Wels (03 03 2011). 41 Final three paragraphs, page 1, presentation by Olga Rakitova at Pellet Conference, Wels (03 03 2011). 42 Final four paragraphs, Executive Summary ‘Transition in the Taiga The Russian Forest Code 2006 and its Implementation Process’, Feja Lesniewska, Andrei Laletin, Anatoly Lebedev and Katy Harris (11 2008). 43 Article 21 ‘Regulation (Eu) No 995/2010 of the European Parliament and of the Council of 20 October 2010 laying down the obligations of operators who place timber and timber products on the market’, Official Journal of the European Union (12 11 2010). 44 There is now considerable Russian interest in a potential Voluntary Partnership Agreement with the EU concerning the supply of wood-based products – final paragraph, page 18 ‘FLEGT 6th Annual Coordination Meeting’ (01 2011) http://www.euflegt.efi.int/files/attachments/euflegt/flegtweek_finalreport_en.pdf

Page 14Page 14
For the same reasons, it will be difficult to audit legal compliance for certification schemes such as that of the Forest Stewardship Council (FSC) – a substantial proportion of the wood-based products which are imported into the EU from Russia derives from FSC-certified forest.
Nevertheless, agents for the Vyborgskaya pellet mill claim that documentation which confirms the legality of its wood raw material supplies is currently available.45
Finland’s timber and paper sectors had a scheme which assessed the provenance of logs supplied from Russia. However, the volume of logs imported into Finland from Russia has greatly declined since 2005, making the scheme less cost-effective. Further, it is unclear whether Finland’s biomass energy sector would adopt a similar scheme in order to comply with the Illegal Timber Regulation when importing firewood, wood chips, mill residues and wood pellets from Russia.
As Chart 15 indicates, the volume of logs exported from Russia46
Owing to the risks of doing business in Russia, and the recession in the EU, the increase in tariffs has not led to an increase in investment in export-oriented production capacity sufficient to offset much of the decline in the volume of logs exported.
to the EU-27 declined markedly in the second half of the last decade, primarily as a consequence of the increase in export tariffs levied by Russia, and destination markets being hit by the recession. However, the volume of logs being imported into the EU (primarily Finland) from Russia has now started to rise again.
Chart 15 – Russia’s exports of wood-based products47
0
10
20
30
40
50
60
20002001200220032004200520062007200820092010
20002001200220032004200520062007200820092010
20002001200220032004200520062007200820092010
Est
imat
ed R
WE
vol
ume
(milli
on c
ubic
met
res)
EU-27 China Japan Others
Logs Other Timber Sector* Paper Sector*
* logs supplied to the EU for use as pulpwood are shown in the chart as if they were for use by the timber sector
As climate change causes the tundra to melt (and methane to be released, in turn accelerating climate change further), ground conditions in some areas currently suitable for logging may become unsuitable.
Statistics about the volume of standing timber in Russia are likely to be misleading if they do not distinguish between timberland of substantial commercial value and that which has little or no commercial value. The cost of transportation on the current road, rail and river network should also be taken into account when assessing whether timberland is likely to be of commercial value to exporters of wood-based fuel to the EU. 45 Intervention by Ekman representative, Wood Pellet conference, Wels (03 03 2011). 46 Most of the wood-based products imported into the EU from Russia derive from timberland in the north west. 47 Source: UN Comtrade – for access try http://comtrade.un.org/db/dqQuickQuery.aspx?cc=4403*,%20-4403&px=H0&r=643&y=2009&p=ALL&rg=2&so=8

Page 15Page 15
Brazil is considered by some to be the EU’s most promising potential source of wood-based fuel in the southern hemisphere, due particularly to its infrastructure and proximity. However, given that wood plantations in Brazil (and elsewhere) – which account for most of Brazil’s exports of wood-based products – are not necessarily managed sustainably and suitable land is increasingly scarce, it would not be prudent to assume that wood-based fuel exported from Brazil would meet EU criteria for sustainability. The wood raw material used in making most of the timber and almost all the pulp and paper which is exported from Brazil derives from plantations. Most of the tropical timber which is logged in Brazil is being used in Brazil.
9 - Brazil
As Chart 16 indicates, the USA accounted for most of the change in the roundwood equivalent volume of timber exported from Brazil over the last decade, and paper sector exports (predominantly pulp) accounted for a much greater roundwood equivalent volume than the timber sector during 2009.
Chart 16 – Brazil’s exports of wood-based products
0
10
20
30
40
50
2000
2001
2002
2003
2004
2005
2006
2007
2008
2009
2010
2000
2001
2002
2003
2004
2005
2006
2007
2008
2009
2010E
stim
ated
RW
E v
olum
e(m
illion
cub
ic m
etre
s)
EU-27 China South America USA Others
Timber Sector Paper Sector

Page 16Page 16
Belarus, Norway, Switzerland and Ukraine supply a substantial volume of primary woody biomass to the EU, mainly as mill residues and logs, mill residues, and (in rapidly increasing quantity) firewood and logs respectively. Croatia and, to a lesser extent, Bosnia-Herzegovina account for a smaller proportion of the total supplied from non-EU Europe (see Chart 17).
10 – Other potential sources of supply
Chart 18 shows that Australia, Chile, South Africa and Vietnam currently export large quantities of wood chips, mainly to Japan and, increasingly, China. The cost of transportation from Australia, Chile and Vietnam might make supplies from these two countries uncompetitive in the EU market. Although most of the wood chips which are produced in South Africa derive from FSC-certified plantations, there is growing evidence that those plantations are not being managed sustainably.48
Brazil, Indonesia, Uruguay and to a lesser extent Congo (Brazzaville)
49
Chart 17 – EU-27 imports of wood chips, residues and logs from selected countries in Europe
supply substantial (but smaller) quantities of wood chips.
0.0
0.5
1.0
1.5
2.0
2.5
20002001200220032004200520062007200820092010
20002001200220032004200520062007200820092010
Wei
ght o
f chi
ps a
nd re
sidu
es(m
illion
tonn
es)
0
1
2
3
4
5
6
7
Vol
ume
of lo
gs(m
illion
cub
ic m
etre
s)
Belarus Bosnia Croatia Norway Switzerland Ukraine
B l C i N Uk i
Wood chips and residues Logs
48 See among others: www.wrm.org.uy and www.fscwatch. org 49 The country’s only large plantation used to export eucalyptus logs to pulp mills in Europe and North Africa.

Page 17Page 17
Chart 18 – Imports of wood chips and residues from selected countries
0
1
2
3
4
5
6
7
200020022004200620082010
200020022004200620082010
200020022004200620082010
200020022004200620082010
200020022004200620082010
200020022004200620082010
200020022004200620082010
Wei
ght
(milli
on to
nnes
)
EU-27 China Japan South Korea Taiwan USA
Australia VietnamUruguaySouth AfricaIndonesiaChileBrazil

Page 18Page 18
11 – Supplies of other potential forms of bioenergy
Miscanthus (elephant grass) is widely grown in the EU for use as fuel, including in power stations co-fired with coal (such as at the Drax power plant in the UK).
Ethanol is imported into the EU in large quantities, the main supplier from outside the EU being Brazil, where its origin is presumably sugar cane. It is unclear how much of this is used as fuel. However, Chart 17 indicates that the great majority of the total which EU Member States imported during 2010 was supplied from within the EU. Supplies from Brazil accounted for less than 10 per cent of the total.
Chart 19 – EU Member States’ imports of ethanol (HS code 2207) 50
0.0
0.5
1.0
1.5
2.0
2.5
3.0
3.5
4.0
2001
2002
2003
2004
2005
2006
2007
2008
2009
2010
2001
2002
2003
2004
2005
2006
2007
2008
2009
2010V
olum
e(b
illion
litre
s)
Belgium France Germany Netherlands UK Brazil Others
From within the EU-27 From outside the EU-27
Trade statistics for biodiesel (included under the HS codes 1518009*, 27101941 and 3824909)*51
Most of the palm oil (including palm kernel products) which is imported into the EU is destined for end-use in foodstuff. Indonesia, Malaysia and, to a lesser extent, Colombia and Papua New Guinea supply most of this. Although some of these imports are certified as sustainable palm oil, they are certified under a scheme (the Roundtable on Sustainable Palm Oil (RSPO) which in effect launders the output of plantations established on land illegally cleared prior to December 2005.
show that although most of the imports into the EU come from countries known for their fossil fuels, substantial amounts also come from Indonesia, Malaysia and Singapore. Anti-dumping proceedings have been initiated by the EU against suppliers of biodiesel from the USA.
52
As Chart 20 indicates, Indonesia and Malaysia account for the great majority of the palm oil imported into the EU, and most of this is imported through the Netherlands. The rate of
Unlike for wood-based products, there is no proposal to make it illegal to import illegal palm oil onto the market. Among the public, however, there has been such hostility to the use of palm oil as a fuel in power stations and for vehicles that its use as a fuel may remain rare.
50 Source: Eurostat (CN8, monthly) http://epp.eurostat.ec.europa.eu/newxtweb/ 51 The EU has initiated anti-dumping investigations into imports of biodiesel made in the USA. http://eur-lex.europa.eu/LexUriServ/LexUriServ.do?uri=OJ:L:2010:211:0001:0005:EN:PDF 52 Criterion 7.3 ‘RSPO Principles and Criteria for Sustainable Palm Oil Production’ RSPO (10 2007) http://www.rspo.org/sites/default/files/RSPO%20Principles%20&%20Criteria_0.pdf

Page 19Page 19
growth seems to have slowed during 2010, perhaps as a consequence of campaigns by consumers and pressure groups such as Greenpeace.
Chart 20 – EU Member States’ imports of palm oil53
0
10
20
30
40
50
60
70
2000
2001
2002
2003
2004
2005
2006
2007
2008
2009
2010
2000
2001
2002
2003
2004
2005
2006
2007
2008
2009
2010W
eigh
t(th
ousa
nd to
nnes
)
Belgium Germany Italy Netherlands SpainColombia Indonesia Malaysia PNG Others
From within the EU-27 From outside the EU-27
53 Source: Eurostat (CN8, monthly) http://epp.eurostat.ec.europa.eu/newxtweb/

Page 20Page 20
12 - Conclusion
Analysis of the data and trade statistics looked at in this report shows that the quantity of wood required to satisfy the 2020 targets is likely to be too large to be met by increased production within the EU. Assuming that the mix of product types remains the same, Member States will need to use between 50 and 100 per cent more wood than is currently consumed as fuel. The data provided in the Appendix indicates that increase will probably be between 100 and 200 million cubic metres. In most EU Member States, the area of productive woodland that currently exists is unlikely to be large enough to meet the substantial increases in the volume of woody biomass required.
In some Member States it is possible that changes in forest management practice could result in increased supplies of woody biomass,54
54 Much of the woodland in Germany is said to be over-mature.
but this would take years (given the time it takes for trees to grow) and might not be consistent with sustainable forestry practices. Most of the increase in imports will therefore most likely come from Canada, the USA, and perhaps also Russia (if the risks associated with imports from Russia do not become prohibitive when the EU’s Illegal Timber Regulation is fully implemented in 2013). This risks not only damaging ecosystems in other parts of the world, but will also increase the EU’s own carbon footprint.

Page A 21Page 21
Appendix
This section examines the scale and trends of each EU Member State’s trade in wood-based products, focusing on ‘primary woody biomass’.
It also provides brief remarks concerning that trade and the quantities anticipated in the National Renewable Energy Action Plans.
The trade statistics presented here are based on those published in Eurostat (CN8, monthly).55
Conversion factors (approximate)
1.4 cubic metres per tonne for air-dried roundwood and firewood56
1.15 tonnes of roundwood per tonne of wood chips and wood residues
12 megawatt hours per tonne oil equivalent
42 gigajoules per tonne oil equivalent
0.2 to 0.4 tonne oil equivalent per tonne of woody biomass
55 Suggestions about how to download and process this source data are available from http://www.efi.int/portal/projects/flegt/trade_statistics_data/ 56 The potential for error in this notional amount may be as much as 30%, depending on the moisture content of different forms of solid woody biomass and the density of different tree species.

Page A 22Page 22
Chart A1 - Austria’s trade in wood-based products
0
5
10
15
20
25
30
35
40
20002001200220032004200520062007200820092010
20002001200220032004200520062007200820092010
20002001200220032004200520062007200820092010
20002001200220032004200520062007200820092010
Est
imat
ed R
WE
vol
ume
(milli
on c
ubic
met
res)
Primary woody biomass Other Timber Sector Other Paper Sector
within the EU-27 outside the EU-27 within the EU-27 outside the EU-27Imported from countries Exported to countries
Chart A2 - Austria’s imports of primary woody biomass (product, by supplying country)
0.0
0.2
0.4
0.6
0.8
1.0
1.2
1.4yt 31-12-2009
yt 30-06-2010
yt 31-12-2010
yt 31-12-2009
yt 30-06-2010
yt 31-12-2010
yt 31-12-2009
yt 30-06-2010
yt 31-12-2010
yt 31-12-2009
yt 30-06-2010
yt 31-12-2010
yt 31-12-2009
yt 30-06-2010
yt 31-12-2010
yt 31-12-2009
yt 30-06-2010
yt 31-12-2010
Wei
ght im
porte
d du
ring
succ
essi
ve 1
2-m
onth
per
iods
(milli
on to
nnes
)
0123456789
Vol
ume
impo
rted
durin
gsu
cces
sive
12-
mon
th p
erio
ds(m
illion
cub
ic m
etre
s)
Czech Republic Germany Hungary PolandSlovakia Slovenia Switzerland Others
Firewood PelletsChips Residues LogsCharcoal
No change anticipated by NREAP, no change in imports of primary woody biomass during 2010. Primary woody biomass is a major component of imports for the timber sector. Woody biomass already intensively farmed for local and district heating.

Page A 23Page 23
Chart A3 - Belgium’s trade in wood-based products
0
5
10
15
20
25
30
35
40
20002001200220032004200520062007200820102010
20002001200220032004200520062007200820102010
20002001200220032004200520062007200820102010
20002001200220032004200520062007200820092010
Est
imat
ed R
WE
vol
ume
(milli
on c
ubic
met
res)
Primary woody biomass Other Timber Sector Other Paper Sector
within the EU-27 outside the EU-27 within the EU-27 outside the EU-27Imported from countries Exported to countries
Chart A4 - Belgium’s trade in wood-based product Belgium’s imports of primary woody biomass (product, by supplying country)
0.0
0.5
1.0
1.5
2.0
2.5yt 31-12-2009
yt 30-06-2010
yt 31-12-2010
yt 31-12-2009
yt 30-06-2010
yt 31-12-2010
yt 31-12-2009
yt 30-06-2010
yt 31-12-2010
yt 31-12-2009
yt 30-06-2010
yt 31-12-2010
yt 31-12-2009
yt 30-06-2010
yt 31-12-2010
yt 31-12-2009
yt 30-06-2010
yt 31-12-2010
Wei
ght im
porte
d du
ring
succ
essi
ve 1
2-m
onth
per
iods
(milli
on to
nnes
)
0.0
0.5
1.0
1.5
2.0
2.5
3.0
3.5
Vol
ume
impo
rted
durin
gsu
cces
sive
12-
mon
th p
erio
ds(m
illion
cub
ic m
etre
s)
Canada France Germany LuxembourgNetherlands Spain UK Others
Firewood PelletsChips Residues LogsCharcoal
Belgium’s NREAP anticipates a three-to-fourfold increase in energy consumption from solid biomass but little change in supply from within Belgium. The quantity of primary woody biomass imported declined during 2010, as it did in the preceding years.

Page A 24Page 24
Chart A5 - Bulgaria’s trade in wood-based products
0.0
0.2
0.4
0.6
0.8
1.0
1.2
1.4
1.6
1.8
20002001200220032004200520062007200820092010
20002001200220032004200520062007200820092010
20002001200220032004200520062007200820092010
20002001200220032004200520062007200820092010
Est
imat
ed R
WE
vol
ume
(milli
on c
ubic
met
res)
Primary woody biomass Other Timber Sector Other Paper Sector
within the EU-27 outside the EU-27 within the EU-27 outside the EU-27Imported from countries Exported to countries
Bulgaria’s NREAP anticipates a modest increase in consumption as energy. There is little trade in primary woody biomass.
Page A 25Page 25
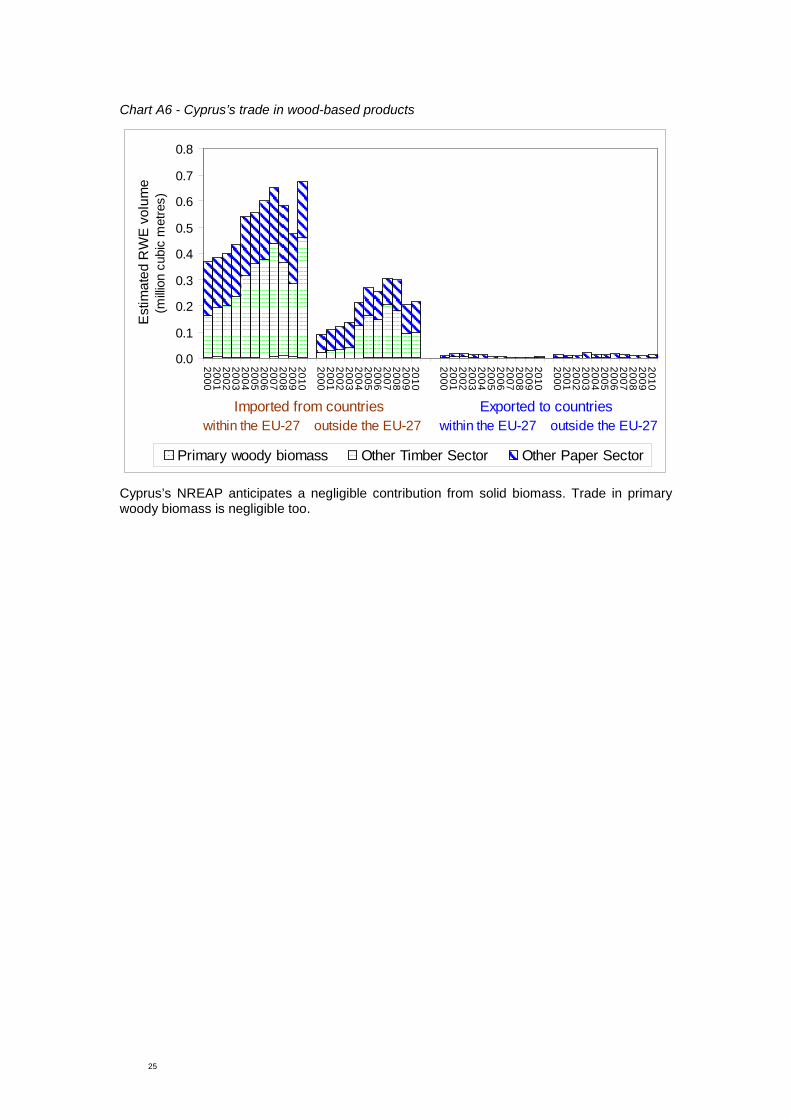
Chart A6 - Cyprus’s trade in wood-based products
0.0
0.1
0.2
0.3
0.4
0.5
0.6
0.7
0.8
20002001200220032004200520062007200820092010
20002001200220032004200520062007200820092010
20002001200220032004200520062007200820092010
20002001200220032004200520062007200820092010
Est
imat
ed R
WE
vol
ume
(milli
on c
ubic
met
res)
Primary woody biomass Other Timber Sector Other Paper Sector
within the EU-27 outside the EU-27 within the EU-27 outside the EU-27Imported from countries Exported to countries
Cyprus’s NREAP anticipates a negligible contribution from solid biomass. Trade in primary woody biomass is negligible too.

Page A 26Page 26
Chart A7 - Czech Republic’s trade in wood-based products
0
2
4
6
8
10
12
14
16
20002001200220032004200520062007200820092010
20002001200220032004200520062007200820092010
20002001200220032004200520062007200820092010
20002001200220032004200520062007200820092010
Est
imat
ed R
WE
vol
ume
(milli
on c
ubic
met
res)
Primary woody biomass Other Timber Sector Other Paper Sector
within the EU-27 outside the EU-27 within the EU-27 outside the EU-27Imported from countries Exported to countries
Chart A8 - Czech Republic’s imports of primary woody biomass (product, by supplying country)
0.0
0.1
0.2yt 31-12-2009
yt 30-06-2010
yt 31-12-2010
yt 31-12-2009
yt 30-06-2010
yt 31-12-2010
yt 31-12-2009
yt 30-06-2010
yt 31-12-2010
yt 31-12-2009
yt 30-06-2010
yt 31-12-2010
yt 31-12-2009
yt 30-06-2010
yt 31-12-2010
yt 31-12-2009
yt 30-06-2010
yt 31-12-2010
Wei
ght im
porte
d du
ring
succ
essi
ve 1
2-m
onth
per
iods
(milli
on to
nnes
)
0.0
0.5
1.0
1.5
2.0
Vol
ume
impo
rted
durin
gsu
cces
sive
12-
mon
th p
erio
ds(m
illion
cub
ic m
etre
s)
Austria Germany Poland Slovakia Ukraine Others
Firewood PelletsChips Residues LogsCharcoal
In the Czech Republic, the NREAP anticipates the use of solid biomass for energy to almost double between 2010 and 2020. However, imports of primary woody biomass, which grew rapidly during the first two or three quarters of 2010, seem subsequently to have declined. The Czech Republic is a net exporter of timber sector products.
Page A 27Page 27
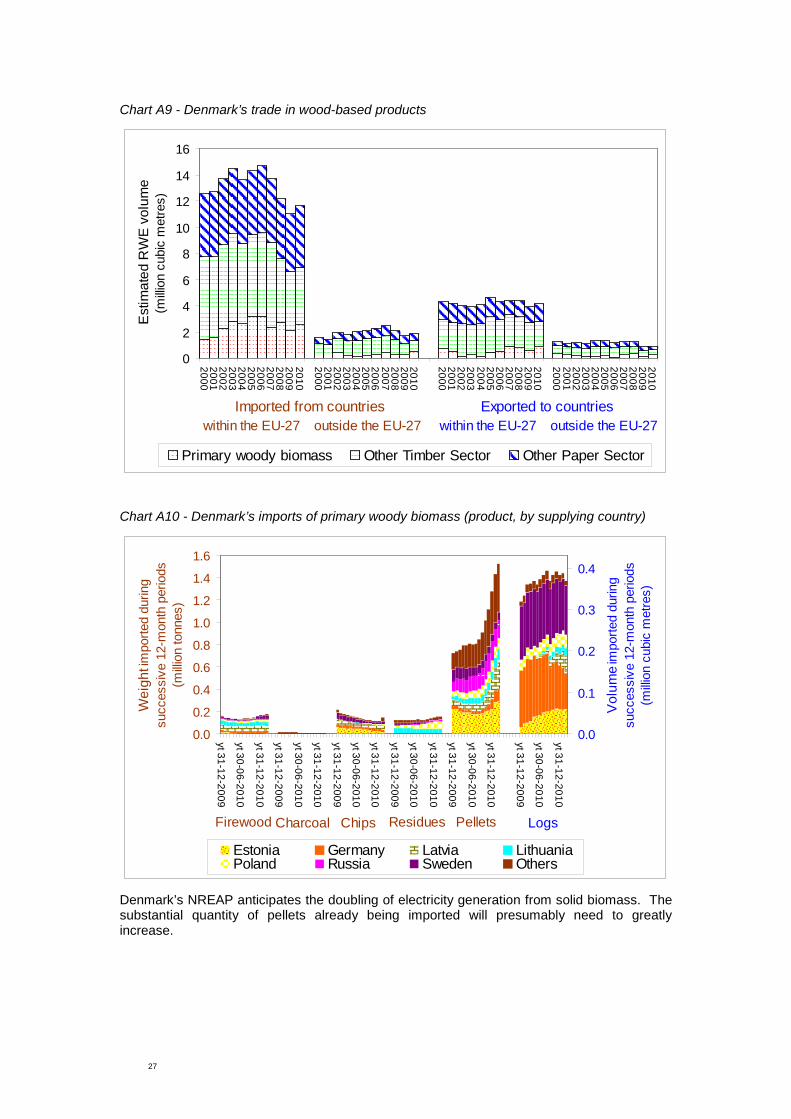
Chart A9 - Denmark’s trade in wood-based products
0
2
4
6
8
10
12
14
16
20002001200220032004200520062007200820092010
20002001200220032004200520062007200820092010
20002001200220032004200520062007200820092010
20002001200220032004200520062007200820092010
Est
imat
ed R
WE
vol
ume
(milli
on c
ubic
met
res)
Primary woody biomass Other Timber Sector Other Paper Sector
within the EU-27 outside the EU-27 within the EU-27 outside the EU-27Imported from countries Exported to countries
Chart A10 - Denmark’s imports of primary woody biomass (product, by supplying country)
0.0
0.2
0.4
0.6
0.8
1.0
1.2
1.4
1.6yt 31-12-2009
yt 30-06-2010
yt 31-12-2010
yt 31-12-2009
yt 30-06-2010
yt 31-12-2010
yt 31-12-2009
yt 30-06-2010
yt 31-12-2010
yt 31-12-2009
yt 30-06-2010
yt 31-12-2010
yt 31-12-2009
yt 30-06-2010
yt 31-12-2010
yt 31-12-2009
yt 30-06-2010
yt 31-12-2010
Wei
ght im
porte
d du
ring
succ
essi
ve 1
2-m
onth
per
iods
(milli
on to
nnes
)
0.0
0.1
0.2
0.3
0.4
Vol
ume
impo
rted
durin
gsu
cces
sive
12-
mon
th p
erio
ds(m
illion
cub
ic m
etre
s)
Estonia Germany Latvia LithuaniaPoland Russia Sweden Others
Firewood PelletsChips Residues LogsCharcoal
Denmark’s NREAP anticipates the doubling of electricity generation from solid biomass. The substantial quantity of pellets already being imported will presumably need to greatly increase.

Page A 28Page 28
Chart A11 - Estonia’s trade in wood-based products
0
1
2
3
4
5
6
7
8
9
20002001200220032004200520062007200820092010
20002001200220032004200520062007200820092010
20002001200220032004200520062007200820092010
20002001200220032004200520062007200820092010
Est
imat
ed R
WE
vol
ume
(milli
on c
ubic
met
res)
Primary woody biomass Other Timber Sector Other Paper Sector
within the EU-27 outside the EU-27 within the EU-27 outside the EU-27Imported from countries Exported to countries
Chart A12 - Estonia’s imports of primary woody biomass (product, by supplying country)
0.0
0.1yt 31-12-2009
yt 30-06-2010
yt 31-12-2010
yt 31-12-2009
yt 30-06-2010
yt 31-12-2010
yt 31-12-2009
yt 30-06-2010
yt 31-12-2010
yt 31-12-2009
yt 30-06-2010
yt 31-12-2010
yt 31-12-2009
yt 30-06-2010
yt 31-12-2010
yt 31-12-2009
yt 30-06-2010
yt 31-12-2010
Wei
ght im
porte
d du
ring
succ
essi
ve 1
2-m
onth
per
iods
(milli
on to
nnes
)
0.0
0.1
0.2
0.3
0.4
Vol
ume
impo
rted
durin
gsu
cces
sive
12-
mon
th p
erio
ds(m
illion
cub
ic m
etre
s)
Latvia Russia Others
L i R i
Firewood PelletsChips Residues LogsCharcoal
In Estonia, little change is anticipated by the NREAP. Imports of primary woody biomass were low during 2010. Estonia is a net exporter of timber, but the quantities traded declined steeply during the second half of last decade.

Page A 29Page 29
Chart A13 - Finland’s trade in wood-based products
0
10
20
30
40
50
60
20002001200220032004200520062007200820092010
20002001200220032004200520062007200820092010
20002001200220032004200520062007200820092010
20002001200220032004200520062007200820092010
Est
imat
ed R
WE
vol
ume
(milli
on c
ubic
met
res)
Primary woody biomass Other Timber Sector Other Paper Sector
within the EU-27 outside the EU-27 within the EU-27 outside the EU-27Imported from countries Exported to countries
Chart A14 - Finland’s imports of primary woody biomass (product, by supplying country)
0.0
0.5
1.0
1.5
2.0
2.5
3.0yt 31-12-2009
yt 30-06-2010
yt 31-12-2010
yt 31-12-2009
yt 30-06-2010
yt 31-12-2010
yt 31-12-2009
yt 30-06-2010
yt 31-12-2010
yt 31-12-2009
yt 30-06-2010
yt 31-12-2010
yt 31-12-2009
yt 30-06-2010
yt 31-12-2010
yt 31-12-2009
yt 30-06-2010
yt 31-12-2010
Wei
ght im
porte
d du
ring
succ
essi
ve 1
2-m
onth
per
iods
(milli
on to
nnes
)
0
1
2
3
4
5
6
7
Vol
ume
impo
rted
durin
gsu
cces
sive
12-
mon
th p
erio
ds(m
illion
cub
ic m
etre
s)
Estonia Latvia Russia Sweden Others
Firewood PelletsChips Residues LogsCharcoal
In Finland, production and trade in wood-based products declined at the end of the last decade. Consequently, energy production from woody biomass (including black liquor) is likely also to have reduced. Imports of primary woody biomass increased strongly during 2010, especially from Russia. The NREAP anticipates a 50 per cent increase in consumption of solid biomass as energy between 2010 and 2020.57
57 This decline presumably does not reflect the closure of pulp and paper mills which generate energy from mill residues, because much of that energy derives from liquid biomass (black liquor)

Page A 30Page 30
Chart A15 - France’s trade in wood-based products
0
10
20
30
40
50
60
2000200120022003200420052006200720082009
20002001200220032004200520062007200820092010
20002001200220032004200520062007200820092010
20002001200220032004200520062007200820092010
Est
imat
ed R
WE
vol
ume
(milli
on c
ubic
met
res)
Primary woody biomass Other Timber Sector Other Paper Sector
within the EU-27 outside the EU-27 within the EU-27 outside the EU-27Imported from countries Exported to countries
Chart A16 - France’s imports of primary woody biomass (product, by supplying country)
0.000.050.100.150.200.250.300.350.400.45
yt 31-12-2009
yt 30-06-2010
yt 31-12-2010
yt 31-12-2009
yt 30-06-2010
yt 31-12-2010
yt 31-12-2009
yt 30-06-2010
yt 31-12-2010
yt 31-12-2009
yt 30-06-2010
yt 31-12-2010
yt 31-12-2009
yt 30-06-2010
yt 31-12-2010
yt 31-12-2009
yt 30-06-2010
yt 31-12-2010
Wei
ght im
porte
d du
ring
succ
essi
ve 1
2-m
onth
per
iods
(milli
on to
nnes
)
0.00.20.40.60.81.01.21.41.61.82.0
Vol
ume
impo
rted
durin
gsu
cces
sive
12-
mon
th p
erio
ds(m
illion
cub
ic m
etre
s)
Belgium Germany LuxembourgSpain Switzerland Others
L b
Firewood PelletsChips Residues LogsCharcoal
France’s NREAP anticipates a large increase in consumption of solid biomass as energy. Imports of primary woody biomass declined between 2007 and 2009 but increased during 2010. The quality of the primary woody biomass exported from France is generally greater than that which is likely to be used directly as fuel. The roundwood equivalent volume of timber sector products imported into France during 2009 is similar to the amount by which the NREAP anticipates consumption of solid biomass as fuel should have increased by 2020.

Page A 31Page 31
Chart A17 - Germany’s trade in wood-based products
010
2030
405060
7080
90100
20002001200220032004200520062007200820092010
20002001200220032004200520062007200820092010
20002001200220032004200520062007200820092010
20002001200220032004200520062007200820092010
Est
imat
ed R
WE
vol
ume
(milli
on c
ubic
met
res)
Primary woody biomass Other Timber Sector Other Paper Sector
within the EU-27 outside the EU-27 within the EU-27 outside the EU-27Imported from countries Exported to countries
Chart A18 - Germany’s imports of primary woody biomass (product, by supplying country)
0.0
0.2
0.4
0.6
0.8
1.0
1.2
1.4
1.6yt 31-12-2009
yt 30-06-2010
yt 31-12-2010
yt 31-12-2009
yt 30-06-2010
yt 31-12-2010
yt 31-12-2009
yt 30-06-2010
yt 31-12-2010
yt 31-12-2009
yt 30-06-2010
yt 31-12-2010
yt 31-12-2009
yt 30-06-2010
yt 31-12-2010
yt 31-12-2009
yt 30-06-2010
yt 31-12-2010
Wei
ght im
porte
d du
ring
succ
essi
ve 1
2-m
onth
per
iods
(milli
on to
nnes
)
0
1
2
3
4
5
6
7
8
Vol
ume
impo
rted
durin
gsu
cces
sive
12-
mon
th p
erio
ds(m
illion
cub
ic m
etre
s)
Austria Belgium Czech Republic FranceNetherlands Poland Switzerland Others
A t i
Firewood PelletsChips Residues LogsCharcoal
Germany’s NREAP anticipates considerable growth in consumption of solid biomass as energy, particularly electricity generation. Germany could probably meet its NREAP targets for heating and cooling by increasing the rate at which mature forest is logged and/or by greatly reducing its exports of timber sector products. Those exports are of much greater quality and command a much higher price than the sort of timber which one might normally burn. The increase in roundwood equivalent volume which the NREAP anticipates is similar to that which was imported into Germany for the timber sector during 2009.

Page A 32Page 32
Chart A19 - Greece’s trade in wood-based products
0
1
2
3
4
5
6
7
20002001200220032004200520062007200820092010
20002001200220032004200520062007200820092010
20002001200220032004200520062007200820092010
20002001200220032004200520062007200820092010
Est
imat
ed R
WE
vol
ume
(milli
on c
ubic
met
res)
Primary woody biomass Other Timber Sector Other Paper Sector
within the EU-27 outside the EU-27 within the EU-27 outside the EU-27Imported from countries Exported to countries
Chart A20 - Greece’s imports of primary woody biomass (product, by supplying country)
0.0
0.1
0.2
0.3yt 31-12-2009
yt 30-06-2010
yt 31-12-2010
yt 31-12-2009
yt 30-06-2010
yt 31-12-2010
yt 31-12-2009
yt 30-06-2010
yt 31-12-2010
yt 31-12-2009
yt 30-06-2010
yt 31-12-2010
yt 31-12-2009
yt 30-06-2010
yt 31-12-2010
yt 31-12-2009
yt 30-06-2010
yt 31-12-2010
Wei
ght im
porte
d du
ring
succ
essi
ve 1
2-m
onth
per
iods
(milli
on to
nnes
)
0.0
0.1
Vol
ume
impo
rted
durin
gsu
cces
sive
12-
mon
th p
erio
ds(m
illion
cub
ic m
etre
s)
Argentina Bulgaria Gabon Ukraine Others
A ti B l i G b Uk i
Firewood PelletsChips Residues LogsCharcoal
The NREAP of Greece anticipates little change in the quantity of solid biomass which is consumed for energy.

Page A 33Page 33
Chart A21 - Hungary’s trade in wood-based products
0
1
2
3
4
5
6
7
8
20002001200220032004200520062007200820092010
20002001200220032004200520062007200820092010
20002001200220032004200520062007200820092010
20002001200220032004200520062007200820092010
Est
imat
ed R
WE
vol
ume
(milli
on c
ubic
met
res)
Primary woody biomass Other Timber Sector Other Paper Sector
within the EU-27 outside the EU-27 within the EU-27 outside the EU-27Imported from countries Exported to countries
Chart A22 - Hungary’s imports of primary woody biomass (product, by supplying country)
0.0
0.1
0.2yt 31-12-2009
yt 30-06-2010
yt 31-12-2010
yt 31-12-2009
yt 30-06-2010
yt 31-12-2010
yt 31-12-2009
yt 30-06-2010
yt 31-12-2010
yt 31-12-2009
yt 30-06-2010
yt 31-12-2010
yt 31-12-2009
yt 30-06-2010
yt 31-12-2010
yt 31-12-2009
yt 30-06-2010
yt 31-12-2010
Wei
ght im
porte
d du
ring
succ
essi
ve 1
2-m
onth
per
iods
(milli
on to
nnes
)
0.0
0.1
0.2
0.3
Vol
ume
impo
rted
durin
gsu
cces
sive
12-
mon
th p
erio
ds(m
illion
cub
ic m
etre
s)
Croatia Romania Slovakia Ukraine Others
C i Sl ki Uk i
Firewood PelletsChips Residues LogsCharcoal
Hungary’s NREAP anticipates an increase of about 50 per cent in the production of energy from solid biomass between 2010 and 2020. The quantity of primary woody biomass increased during 2010, reversing the trend experienced during the second half of last decade.

Page A 34Page 34
Chart A23 - Ireland’s trade in wood-based products
0
1
2
3
4
5
6
20002001200220032004200520062007200820092010
20002001200220032004200520062007200820092010
20002001200220032004200520062007200820092010
20002001200220032004200520062007200820092010
Est
imat
ed R
WE
vol
ume
(milli
on c
ubic
met
res)
Primary woody biomass Other Timber Sector Other Paper Sector
within the EU-27 outside the EU-27 within the EU-27 outside the EU-27Imported from countries Exported to countries
Chart A24 - Ireland’s imports of primary woody biomass (product, by supplying country)
0.0
0.1yt 31-12-2009
yt 30-06-2010
yt 31-12-2010
yt 31-12-2009
yt 30-06-2010
yt 31-12-2010
yt 31-12-2009
yt 30-06-2010
yt 31-12-2010
yt 31-12-2009
yt 30-06-2010
yt 31-12-2010
yt 31-12-2009
yt 30-06-2010
yt 31-12-2010
yt 31-12-2009
yt 30-06-2010
yt 31-12-2010
Wei
ght im
porte
d du
ring
succ
essi
ve 1
2-m
onth
per
iods
(milli
on to
nnes
)
0.0
0.1
0.2
0.3
Vol
ume
impo
rted
durin
gsu
cces
sive
12-
mon
th p
erio
ds(m
illion
cub
ic m
etre
s)
Finland UK Others
Firewood PelletsChips Residues LogsCharcoal
Ireland’s NREAP anticipates that production of energy from solid biomass will more than double between 2010 and 2020, while there will be little change in production of solid biomass within Ireland itself. The quantity of primary woody biomass imported into Ireland tended to decline during both the second half of the last decade and 2010.

Page A 35Page 35
Chart A25 - Italy’s trade in wood-based products
05
1015
202530
3540
4550
20002001200220032004200520062007200820092010
20002001200220032004200520062007200820092010
20002001200220032004200520062007200820092010
20002001200220032004200520062007200820092010
Est
imat
ed R
WE
vol
ume
(milli
on c
ubic
met
res)
Primary woody biomass Other Timber Sector Other Paper Sector
within the EU-27 outside the EU-27 within the EU-27 outside the EU-27Imported from countries Exported to countries
Chart A26 - Italy’s imports of primary woody biomass (product, by supplying country)
0.00.10.20.30.40.50.60.70.80.9
yt 31-12-2009
yt 30-06-2010
yt 31-12-2010
yt 31-12-2009
yt 30-06-2010
yt 31-12-2010
yt 31-12-2009
yt 30-06-2010
yt 31-12-2010
yt 31-12-2009
yt 30-06-2010
yt 31-12-2010
yt 31-12-2009
yt 30-06-2010
yt 31-12-2010
yt 31-12-2009
yt 30-06-2010
yt 31-12-2010
Wei
ght im
porte
d du
ring
succ
essi
ve 1
2-m
onth
per
iods
(milli
on to
nnes
)
0.0
0.5
1.0
1.5
2.0
2.5
3.0
3.5
Vol
ume
impo
rted
durin
gsu
cces
sive
12-
mon
th p
erio
ds(m
illion
cub
ic m
etre
s)
Austria Bosnia Herzegovina Croatia France GermanyHungary Slovakia Slovenia Switzerland Others
A t i C ti
Firewood PelletsChips Residues LogsCharcoal
Italy’s NREAP anticipates that production of energy from solid biomass will more than double between 2010 and 2020. However, since the middle of the last decade, the quantity of primary woody biomass imported into Italy has tended to decline. Italy’s imports of wood pellets (from within the EU) are rapidly increasing.

Page A 36Page 36
Chart A27 - Latvia’s trade in wood-based products
0
5
10
15
20
25
20002001200220032004200520062007200820092010
20002001200220032004200520062007200820092010
20002001200220032004200520062007200820092010
20002001200220032004200520062007200820092010
Est
imat
ed R
WE
vol
ume
(milli
on c
ubic
met
res)
Primary woody biomass Other Timber Sector Other Paper Sector
within the EU-27 outside the EU-27 within the EU-27 outside the EU-27Imported from countries Exported to countries
Chart A28 - Latvia’s imports of primary woody biomass (product, by supplying country)
0.0
0.1yt 31-12-2009
yt 30-06-2010
yt 31-12-2010
yt 31-12-2009
yt 30-06-2010
yt 31-12-2010
yt 31-12-2009
yt 30-06-2010
yt 31-12-2010
yt 31-12-2009
yt 30-06-2010
yt 31-12-2010
yt 31-12-2009
yt 30-06-2010
yt 31-12-2010
yt 31-12-2009
yt 30-06-2010
yt 31-12-2010
Wei
ght im
porte
d du
ring
succ
essi
ve 1
2-m
onth
per
iods
(milli
on to
nnes
)
0.0
0.1
0.2
0.3
0.4
0.5
Vol
ume
impo
rted
durin
gsu
cces
sive
12-
mon
th p
erio
ds(m
illion
cub
ic m
etre
s)
Belarus Lithuania Russia Others
R i B l
Firewood PelletsChips Residues LogsCharcoal
Latvia is a net exporter of timber. Its NREAP anticipates little change in the production of energy from solid biomass.

Page A 37Page 37
Chart A29 - Lithuania’s trade in wood-based products
0
1
2
3
4
5
6
7
20002001200220032004200520062007200820092010
20002001200220032004200520062007200820092010
20002001200220032004200520062007200820092010
20002001200220032004200520062007200820092010
Est
imat
ed R
WE
vol
ume
(milli
on c
ubic
met
res)
Primary woody biomass Other Timber Sector Other Paper Sector
within the EU-27 outside the EU-27 within the EU-27 outside the EU-27Imported from countries Exported to countries
Chart A30 - Lithuania’s imports of primary woody biomass (product, by supplying country)
0.0
0.1
0.2
0.3yt 31-12-2009
yt 30-06-2010
yt 31-12-2010
yt 31-12-2009
yt 30-06-2010
yt 31-12-2010
yt 31-12-2009
yt 30-06-2010
yt 31-12-2010
yt 31-12-2009
yt 30-06-2010
yt 31-12-2010
yt 31-12-2009
yt 30-06-2010
yt 31-12-2010
yt 31-12-2009
yt 30-06-2010
yt 31-12-2010
Wei
ght im
porte
d du
ring
succ
essi
ve 1
2-m
onth
per
iods
(milli
on to
nnes
)
0.0
0.1
0.2
0.3
0.4
Vol
ume
impo
rted
durin
gsu
cces
sive
12-
mon
th p
erio
ds(m
illion
cub
ic m
etre
s)
Belarus Latvia Russia Ukraine Others
Firewood PelletsChips Residues LogsCharcoal
Lithuania’s NREAP anticipates that a small but increasing quantity of solid biomass will be used for energy production between 2010 and 2020. Primary woody biomass accounts for much of the roundwood equivalent volume which is imported or exported from Lithuania.

Page A 38Page 38
Chart A31 - Luxembourg’s trade in wood-based products
0.0
0.5
1.0
1.5
2.0
2.5
3.0
3.5
4.0
20002001200220032004200520062007200820092010
20002001200220032004200520062007200820092010
20002001200220032004200520062007200820092010
20002001200220032004200520062007200820092010
Est
imat
ed R
WE
vol
ume
(milli
on c
ubic
met
res)
Primary woody biomass Other Timber Sector Other Paper Sector
within the EU-27 outside the EU-27 within the EU-27 outside the EU-27Imported from countries Exported to countries
Chart A32 - Luxembourg’s imports of primary woody biomass (product, by supplying country)
0.0
0.1
0.2
0.3yt 31-12-2009
yt 30-06-2010
yt 31-12-2010
yt 31-12-2009
yt 30-06-2010
yt 31-12-2010
yt 31-12-2009
yt 30-06-2010
yt 31-12-2010
yt 31-12-2009
yt 30-06-2010
yt 31-12-2010yt 31-12-2009
yt 30-06-2010
yt 31-12-2010
yt 31-12-2009
yt 30-06-2010
yt 31-12-2010
Wei
ght im
porte
d du
ring
succ
essi
ve 1
2-m
onth
per
iods
(milli
on to
nnes
)
0.0
0.2
0.4
0.6
0.8
1.0
1.2
Vol
ume
impo
rted
durin
gsu
cces
sive
12-
mon
th p
erio
ds(m
illion
cub
ic m
etre
s)
Belgium France Germany Others
Firewood PelletsChips Residues LogsCharcoal
Primary woody biomass accounts for a substantial proportion of the timber which is imported into Luxembourg. The NREAP anticipates that there will be very little change in the quantities destined for energy.

Page A 39Page 39
Chart A33 - Malta’s trade in wood-based products
0.0
0.1
0.2
0.3
20002001200220032004200520062007200820092010
20002001200220032004200520062007200820092010
20002001200220032004200520062007200820092010
20002001200220032004200520062007200820092010
Est
imat
ed R
WE
vol
ume
(milli
on c
ubic
met
res)
Primary woody biomass Other Timber Sector Other Paper Sector
within the EU-27 outside the EU-27 within the EU-27 outside the EU-27Imported from countries Exported to countries
The NREAP for Malta anticipates that solid biomass will continue to be used as energy in small quantities. Malta has negligible trade in solid woody biomass.

Page A 40Page 40
Chart A34 - The Netherlands’ trade in wood-based products
0
5
10
15
20
25
30
35
20002001200220032004200520062007200820092010
20002001200220032004200520062007200820092010
20002001200220032004200520062007200820092010
20002001200220032004200520062007200820092010
Est
imat
ed R
WE
vol
ume
(milli
on c
ubic
met
res)
Primary woody biomass Other Timber Sector Other Paper Sector
within the EU-27 outside the EU-27 within the EU-27 outside the EU-27Imported from countries Exported to countries
Chart A35 - The Netherlands’ imports of primary woody biomass (product, by supplying country)
0.00.10.20.30.40.50.60.70.80.91.0
yt 31-12-2009
yt 30-06-2010
yt 31-12-2010
yt 31-12-2009
yt 30-06-2010
yt 31-12-2010
yt 31-12-2009
yt 30-06-2010
yt 31-12-2010
yt 31-12-2009
yt 30-06-2010
yt 31-12-2010
yt 31-12-2009
yt 30-06-2010
yt 31-12-2010
yt 31-12-2009
yt 30-06-2010
yt 31-12-2010
Wei
ght im
porte
d du
ring
succ
essi
ve 1
2-m
onth
per
iods
(milli
on to
nnes
)
0.0
0.1
0.2
0.3
Vol
ume
impo
rted
durin
gsu
cces
sive
12-
mon
th p
erio
ds(m
illion
cub
ic m
etre
s)
Belgium Canada France GermanyLuxembourg Russia USA Others
Firewood PelletsChips Residues LogsCharcoal
The NREAP of the Netherlands anticipates a doubling in the amount of electricity generated from solid biofuels between 2010 and 2020. A large quantity of pellets was imported in 2010, but latterly there has been a decline, partly because of difficulties with supplies from the USA.

Page A 41Page 41
Chart A36 - Poland’s trade in wood-based products 58
0
5
10
15
20
25
20002001200220032004200520062007200820092010
20002001200220032004200520062007200820092010
20002001200220032004200520062007200820092010
20002001200220032004200520062007200820092010
Est
imat
ed R
WE
vol
ume
(milli
on c
ubic
met
res)
Primary woody biomass Other Timber Sector Other Paper Sector
within the EU-27 outside the EU-27 within the EU-27 outside the EU-27Imported from countries Exported to countries
Chart A37 - Poland’s imports of primary woody biomass (product, by supplying country)
0.0
0.1
0.2yt 31-12-2009
yt 30-06-2010
yt 31-12-2010
yt 31-12-2009
yt 30-06-2010
yt 31-12-2010
yt 31-12-2009
yt 30-06-2010
yt 31-12-2010
yt 31-12-2009
yt 30-06-2010
yt 31-12-2010
yt 31-12-2009
yt 30-06-2010
yt 31-12-2010
yt 31-12-2009
yt 30-06-2010
yt 31-12-2010
Wei
ght im
porte
d du
ring
succ
essi
ve 1
2-m
onth
per
iods
(milli
on to
nnes
)
0.0
0.5
1.0
1.5
2.0
2.5
3.0
Vol
ume
impo
rted
durin
gsu
cces
sive
12-
mon
th p
erio
ds(m
illion
cub
ic m
etre
s)
Belarus Germany Lithuania Slovakia Ukraine Others
Firewood PelletsChips Residues LogsCharcoal
Poland is a net exporter of timber. Its imports of primary woody biomass, almost all of which consisted of logs, increased steeply during 2010.
The NREAP anticipates there being only a small increase in production of woody biomass between 2010 and 2020.
58 Statistics for the bilateral trade of Poland have only been published by the source since mid-2004.

Page A 42Page 42
Chart A38 - Portugal’s trade in wood-based products
0
2
4
6
8
10
12
20002001200220032004200520062007200820092010
20002001200220032004200520062007200820092010
20002001200220032004200520062007200820092010
20002001200220032004200520062007200820092010
Est
imat
ed R
WE
vol
ume
(milli
on c
ubic
met
res)
Primary woody biomass Other Timber Sector Other Paper Sector
within the EU-27 outside the EU-27 within the EU-27 outside the EU-27Imported from countries Exported to countries
Chart A39 - Portugal’s imports of primary woody biomass (product, by supplying country)
0.0
0.2
0.4
0.6
0.8
1.0
1.2yt 31-12-2009
yt 30-06-2010
yt 31-12-2010
yt 31-12-2009
yt 30-06-2010
yt 31-12-2010
yt 31-12-2009
yt 30-06-2010
yt 31-12-2010
yt 31-12-2009
yt 30-06-2010
yt 31-12-2010
yt 31-12-2009
yt 30-06-2010
yt 31-12-2010
yt 31-12-2009
yt 30-06-2010
yt 31-12-2010
Wei
ght im
porte
d du
ring
succ
essi
ve 1
2-m
onth
per
iods
(milli
on to
nnes
)
0.00.10.20.30.40.50.60.70.80.91.0
Vol
ume
impo
rted
durin
gsu
cces
sive
12-
mon
th p
erio
ds(m
illion
cub
ic m
etre
s)
Congo DR Congo France Spain Uruguay Others
C S i U
Firewood PelletsChips Residues LogsCharcoal
Portugal’s NREAP anticipates little change in the quantity of solid biomass consumption between now and 2020.

Page A 43Page 43
Chart A40 - Romania’s trade in wood-based products
0
1
2
3
4
5
6
7
20002001200220032004200520062007200820092010
20002001200220032004200520062007200820092010
20002001200220032004200520062007200820092010
20002001200220032004200520062007200820092010
Est
imat
ed R
WE
vol
ume
(milli
on c
ubic
met
res)
Primary woody biomass Other Timber Sector Other Paper Sector
within the EU-27 outside the EU-27 within the EU-27 outside the EU-27Imported from countries Exported to countries
Chart A41 - Romania’s imports of primary woody biomass (product, by supplying country)
0.0
0.1yt 31-12-2009
yt 30-06-2010
yt 31-12-2010
yt 31-12-2009
yt 30-06-2010
yt 31-12-2010
yt 31-12-2009
yt 30-06-2010
yt 31-12-2010
yt 31-12-2009
yt 30-06-2010
yt 31-12-2010
yt 31-12-2009
yt 30-06-2010
yt 31-12-2010
yt 31-12-2009
yt 30-06-2010
yt 31-12-2010
Wei
ght im
porte
d du
ring
succ
essi
ve 1
2-m
onth
per
iods
(milli
on to
nnes
)
0.0
0.1
0.2
0.3
0.4
0.5
0.6
Vol
ume
impo
rted
durin
gsu
cces
sive
12-
mon
th p
erio
ds(m
illion
cub
ic m
etre
s)
Hungary Russia Slovakia Ukraine Others
H R i Sl ki Uk i
Firewood PelletsChips Residues LogsCharcoal
In Romania, the NREAP anticipates little change in the production of energy from solid biomass. Romania is a net exporter of wood.

Page A 44Page 44
Chart A42 - Slovakia’s trade in wood-based products 59
01
23
456
78
910
20002001200220032004200520062007200820092010
20002001200220032004200520062007200820092010
20002001200220032004200520062007200820092010
20002001200220032004200520062007200820092010
Est
imat
ed R
WE
vol
ume
(milli
on c
ubic
met
res)
Primary woody biomass Other Timber Sector Other Paper Sector
within the EU-27 outside the EU-27 within the EU-27 outside the EU-27Imported from countries Exported to countries
Chart A43 - Slovakia’s imports of primary woody biomass (product, by supplying country)
0.0
0.1yt 31-12-2009
yt 30-06-2010
yt 31-12-2010
yt 31-12-2009
yt 30-06-2010
yt 31-12-2010
yt 31-12-2009
yt 30-06-2010
yt 31-12-2010
yt 31-12-2009
yt 30-06-2010
yt 31-12-2010
yt 31-12-2009
yt 30-06-2010
yt 31-12-2010
yt 31-12-2009
yt 30-06-2010
yt 31-12-2010
Wei
ght im
porte
d du
ring
succ
essi
ve 1
2-m
onth
per
iods
(milli
on to
nnes
)
0.0
0.1
0.2
0.3
0.4
0.5
0.6
0.7
Vol
ume
impo
rted
durin
gsu
cces
sive
12-
mon
th p
erio
ds(m
illion
cub
ic m
etre
s)
Czech Republic Hungary PolandSweden Ukraine Others
C h R bli H
Firewood PelletsChips Residues LogsCharcoal
Slovakia’s NREAP anticipates a modest increase in the consumption of energy in Slovenia.
59 Data for Slovakia have only been published by the source since mid-2004.

Page A 45Page 45
Chart A44 - Slovenia’s trade in wood-based products
0.00.5
1.01.5
2.02.53.0
3.54.0
4.55.0
20002001200220032004200520062007200820092010
20002001200220032004200520062007200820092010
20002001200220032004200520062007200820092010
20002001200220032004200520062007200820092010
Est
imat
ed R
WE
vol
ume
(milli
on c
ubic
met
res)
Primary woody biomass Other Timber Sector Other Paper Sector
within the EU-27 outside the EU-27 within the EU-27 outside the EU-27Imported from countries Exported to countries
Chart A45 - Slovenia’s imports of primary woody biomass (product, by supplying country)
0.0
0.1
0.2
0.3yt 31-12-2009
yt 30-06-2010
yt 31-12-2010
yt 31-12-2009
yt 30-06-2010
yt 31-12-2010
yt 31-12-2009
yt 30-06-2010
yt 31-12-2010
yt 31-12-2009
yt 30-06-2010
yt 31-12-2010
yt 31-12-2009
yt 30-06-2010
yt 31-12-2010
yt 31-12-2009
yt 30-06-2010
yt 31-12-2010
Wei
ght im
porte
d du
ring
succ
essi
ve 1
2-m
onth
per
iods
(milli
on to
nnes
)
0.0
0.1
0.2
0.3
Vol
ume
impo
rted
durin
gsu
cces
sive
12-
mon
th p
erio
ds(m
illion
cub
ic m
etre
s)
Austria Bosnia Herzegovina Croatia Hungary Others
A t i C ti H
Firewood PelletsChips Residues LogsCharcoal
Slovenia’s imports of primary woody biomass during 2010 tended to increase.

Page A 46Page 46
Chart A46 - Spain’s trade in wood-based products
0
5
10
15
20
25
30
20002001200220032004200520062007200820092010
20002001200220032004200520062007200820092010
20002001200220032004200520062007200820092010
20002001200220032004200520062007200820092010
Est
imat
ed R
WE
vol
ume
(milli
on c
ubic
met
res)
Primary woody biomass Other Timber Sector Other Paper Sector
within the EU-27 outside the EU-27 within the EU-27 outside the EU-27Imported from countries Exported to countries
Chart A47 - Spain’s imports of primary woody biomass (product, by supplying country)
0.0
0.1
0.2
0.3
0.4
0.5
0.6
0.7
0.8yt 31-12-2009
yt 30-06-2010
yt 31-12-2010
yt 31-12-2009
yt 30-06-2010
yt 31-12-2010
yt 31-12-2009
yt 30-06-2010
yt 31-12-2010
yt 31-12-2009
yt 30-06-2010
yt 31-12-2010
yt 31-12-2009
yt 30-06-2010
yt 31-12-2010
yt 31-12-2009
yt 30-06-2010
yt 31-12-2010
Wei
ght im
porte
d du
ring
succ
essi
ve 1
2-m
onth
per
iods
(milli
on to
nnes
)
0.00.20.40.60.81.01.21.41.61.82.0
Vol
ume
impo
rted
durin
gsu
cces
sive
12-
mon
th p
erio
ds(m
illion
cub
ic m
etre
s)
Argentina France Portugal Uruguay Others
Firewood PelletsChips Residues LogsCharcoal
Spain’s NREAP anticipates that a doubling of consumption of solid biomass for electricity generation will be necessary. Spain is unlikely to be able to meet its NREAP target sustainably without importing. The sustainability of wood plantations in north-western Spain has been questioned.

Page A 47Page 47
Chart A48 - Sweden’s trade in wood-based products
0
10
20
30
40
50
60
70
20002001200220032004200520062007200820092010
20002001200220032004200520062007200820092010
20002001200220032004200520062007200820092010
20002001200220032004200520062007200820092010
Est
imat
ed R
WE
vol
ume
(milli
on c
ubic
met
res)
Primary woody biomass Other Timber Sector Other Paper Sector
within the EU-27 outside the EU-27 within the EU-27 outside the EU-27Imported from countries Exported to countries
Chart A49 - Sweden’s imports of primary woody biomass (product, by supplying country)
0.0
0.2
0.4
0.6
0.8
1.0
1.2
1.4
1.6yt 31-12-2009
yt 30-06-2010
yt 31-12-2010
yt 31-12-2009
yt 30-06-2010
yt 31-12-2010
yt 31-12-2009
yt 30-06-2010
yt 31-12-2010
yt 31-12-2009
yt 30-06-2010
yt 31-12-2010
yt 31-12-2009
yt 30-06-2010
yt 31-12-2010
yt 31-12-2009
yt 30-06-2010
yt 31-12-2010
Wei
ght im
porte
d du
ring
succ
essi
ve 1
2-m
onth
per
iods
(milli
on to
nnes
)
0
1
2
3
4
5
6
7
Vol
ume
impo
rted
durin
gsu
cces
sive
12-
mon
th p
erio
ds(m
illion
cub
ic m
etre
s)
Estonia Finland Latvia Norway Russia Others
E i Fi l d L i N R i
Firewood PelletsChips Residues LogsCharcoal
Sweden – a net exporter of timber sector products – plans to eliminate fossil fuel from its economy by 2020 and should be able to meet its NREAP targets without importing more wood, although there may be competition for raw material with export markets. Sweden’s imports of primary woody biomass (particularly logs) tended to increase during 2010.

Page A 48Page 48
Chart A50 - The UK’s trade in wood-based products
0
10
20
30
40
50
60
20002001200220032004200520062007200820092010
20002001200220032004200520062007200820092010
20002001200220032004200520062007200820092010
20002001200220032004200520062007200820092010
Est
imat
ed R
WE
vol
ume
(milli
on c
ubic
met
res)
Primary woody biomass Other Timber Sector Other Paper Sector
within the EU-27 outside the EU-27 within the EU-27 outside the EU-27Imported from countries Exported to countries
Chart A51 - The UK’s imports of primary woody biomass (product, by supplying country)
0.0
0.1
0.2
0.3
0.4
0.5
0.6
0.7yt 31-12-2009
yt 30-06-2010
yt 31-12-2010
yt 31-12-2009
yt 30-06-2010
yt 31-12-2010
yt 31-12-2009
yt 30-06-2010
yt 31-12-2010
yt 31-12-2009
yt 30-06-2010
yt 31-12-2010
yt 31-12-2009
yt 30-06-2010
yt 31-12-2010
yt 31-12-2009
yt 30-06-2010
yt 31-12-2010
Wei
ght im
porte
d du
ring
succ
essi
ve 1
2-m
onth
per
iods
(milli
on to
nnes
)
0.0
0.1
0.2
0.3
0.4
0.5
0.6
Vol
ume
impo
rted
durin
gsu
cces
sive
12-
mon
th p
erio
ds(m
illion
cub
ic m
etre
s)
Canada Finland France Germany IrelandRussia South Africa Sweden USA Others
Firewood PelletsChips Residues LogsCharcoal
Most of the very large increase in solid biomass anticipated in the UK’s NREAP is for electricity generation and is similar in magnitude to the roundwood equivalent volume of timber sector products which entered end-use within the UK during 2009. The power stations would require planning permission and consideration of the sustainability of fuel supplies.60
60 But such consideration might not be rigorous judging by the success and continued efforts of developers in promoting palm oil and its derivatives as a possible fuel for new power stations – see
http:///www.biofuelwatch.org.uk

Page A 49Page 49
FERN works to achieve greater environmental and social justice, focusing on forests and
forest peoples’ rights in the policies and practices of the European Union
FERN office UK, 1C Fosseway Business Centre, Stratford Road, Moreton in Marsh,
GL56 9NQ, UK
FERN office Brussels, Rue d'Edimbourg, 26, 1040 Brussels, Belgium
www.fern.org
July 2011