Embed Size (px)
Citation preview

FLUID NITROGEN/SULFUR FORMULATIONS TO MITIGATE SULFUR DEFICIENCIES AND MAXIMIZE
COTTON YIELDS IN THE UPPER SOUTHEAST COASTAL PLAIN
William “Hunter” FrameField Crops Agronomist/ Assistant ProfessorVirginia TechTidewater Agricultural Research and Extension CenterSuffolk, VA
Febraury 21, 20172017 Fluid Fertilizer Forum
Scottsdale, AZ
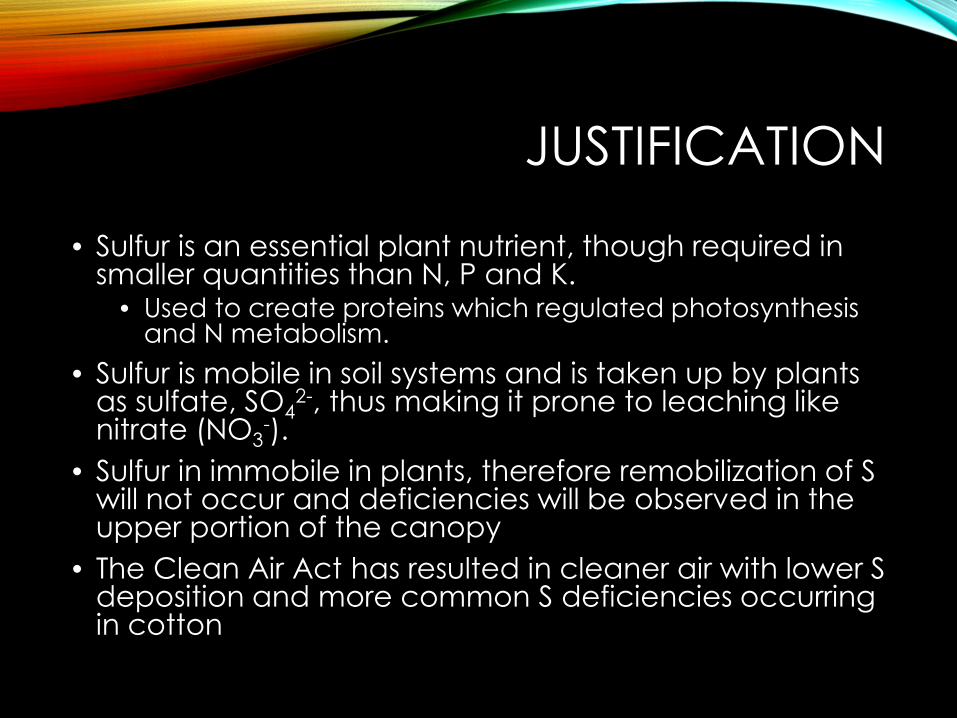
JUSTIFICATION
• Sulfur is an essential plant nutrient, though required in smaller quantities than N, P and K.
• Used to create proteins which regulated photosynthesis and N metabolism.
• Sulfur is mobile in soil systems and is taken up by plants as sulfate, SO4
2-, thus making it prone to leaching like nitrate (NO3
-).
• Sulfur in immobile in plants, therefore remobilization of S will not occur and deficiencies will be observed in the upper portion of the canopy
• The Clean Air Act has resulted in cleaner air with lower S deposition and more common S deficiencies occurring in cotton
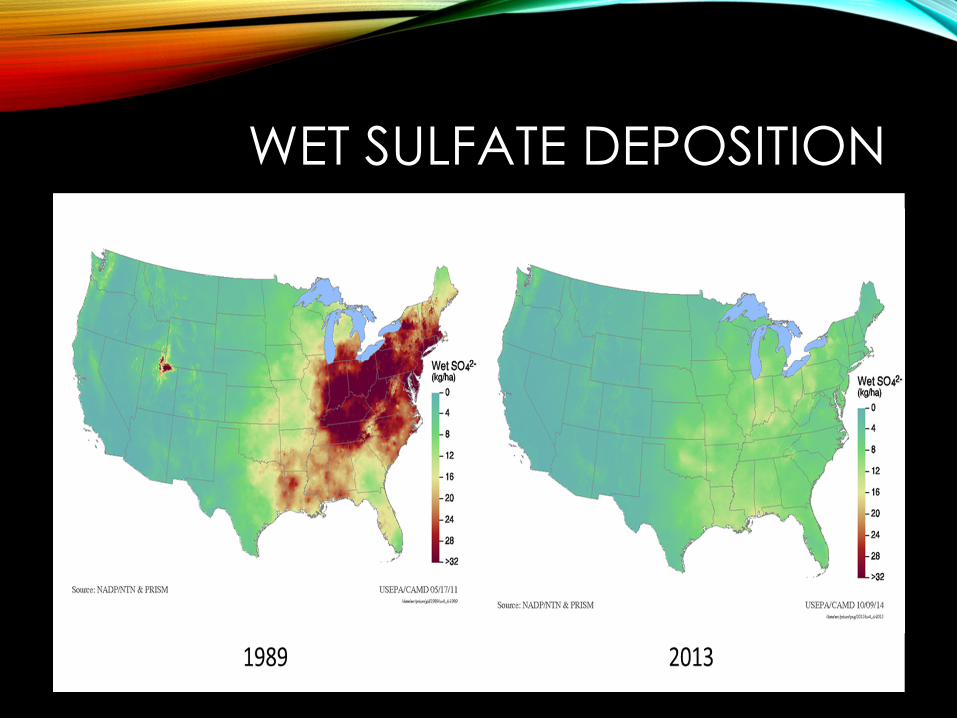
WET SULFATE DEPOSITION

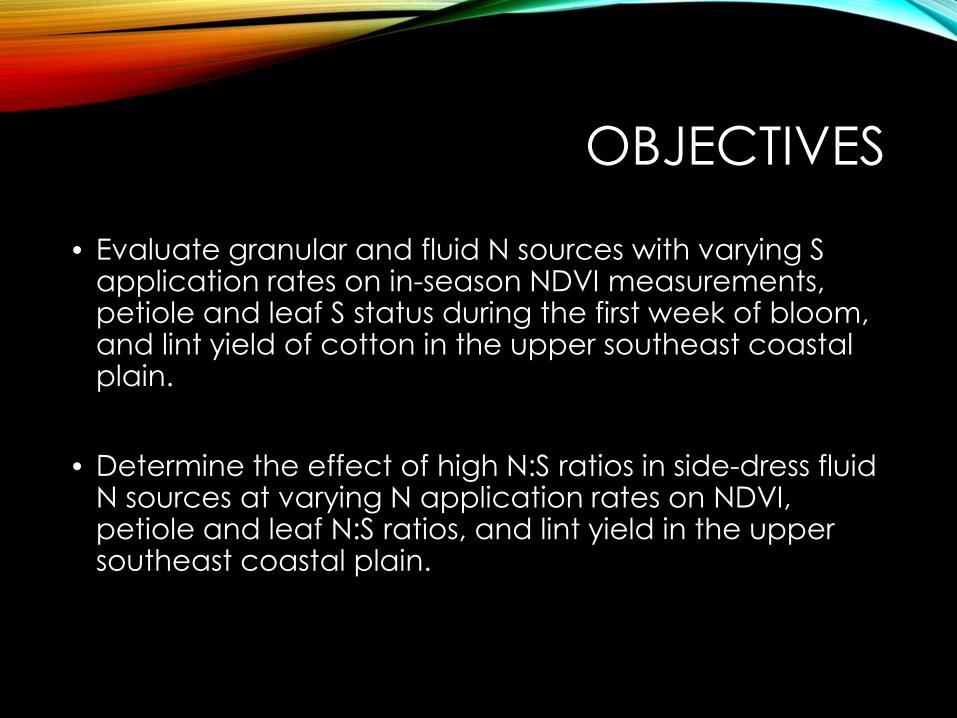
OBJECTIVES
• Evaluate granular and fluid N sources with varying S application rates on in-season NDVI measurements, petiole and leaf S status during the first week of bloom, and lint yield of cotton in the upper southeast coastal plain.
• Determine the effect of high N:S ratios in side-dress fluid N sources at varying N application rates on NDVI, petiole and leaf N:S ratios, and lint yield in the upper southeast coastal plain.

MATERIALS AND METHODS• Three locations during 2016
• Randomized complete block design with 17 treatments and 4 replications
• Compared granular and fluid side-dress sources
• Urea + ammonium sulfate (AMS)• UAN32 + ammonium thiosulfate (12-0-0-
26S)• 24-0-0-3S• 24-0-0-6S• 24-0-0-9S
• NDVI measured from a week after fertilizer application for five weeks (data not shown)
• Petiole and leaf tissue samples were collected from each plot during the first week of bloom
• Yield was measured from the center two rows of the four row plot
• PROC GLIMMIX was used for ANOVA with an alpha = 0.05.
• Treatment design was• 2 S Sources x 4 S rates• 4 Fluid Formulations x 3 N rates

NITROGEN AND SULFUR TREATMENTS
Trt N-S Formulations Total N Side-dress N Sulfur Total N:SFluid Fertilizer
N:S
------------- lbs acre-1 -------------
1No Applied N or S
Control- - - -
-
2ǂ Urea 100 80 0 100:0 -
3ǂ Urea + AMS† 100 80 10 10:1 -
4ǂ Urea + AMS 100 80 20 5:1 -
5ǂ Urea + AMS 100 80 30 3:1 -
6 32-0-0 60 40 0 60:0 32:0
7ǂ 32-0-0 100 80 0 100:0 32:0
8 32-0-0 140 120 0 140:0 32:0
9 24-0-0-3S 60 40 5 12:1 8:1
10ǂ 24-0-0-3S 100 80 10 10:1 8:1
11 24-0-0-3S 140 120 15 9.33:1 8:1
12 24-0-0-6S 60 40 10 6:1 4:1
13ǂ 24-0-0-6S 100 80 20 5:1 4:1
14 24-0-0-6S 140 120 30 4.67:1 4:1
15 24-0-0-9S 60 40 15 4:1 2.66:1
16ǂ 24-0-0-9S 100 80 30 3:1 2.66:1
17 24-0-0-9S 140 120 45 3.11:1 2.66:1
†AMS = granular ammonium sulfate (21-0-0-24S)
ǂ Treatments to be compared to evaluate sulfur application rates and granular vs fluid N-S sources.
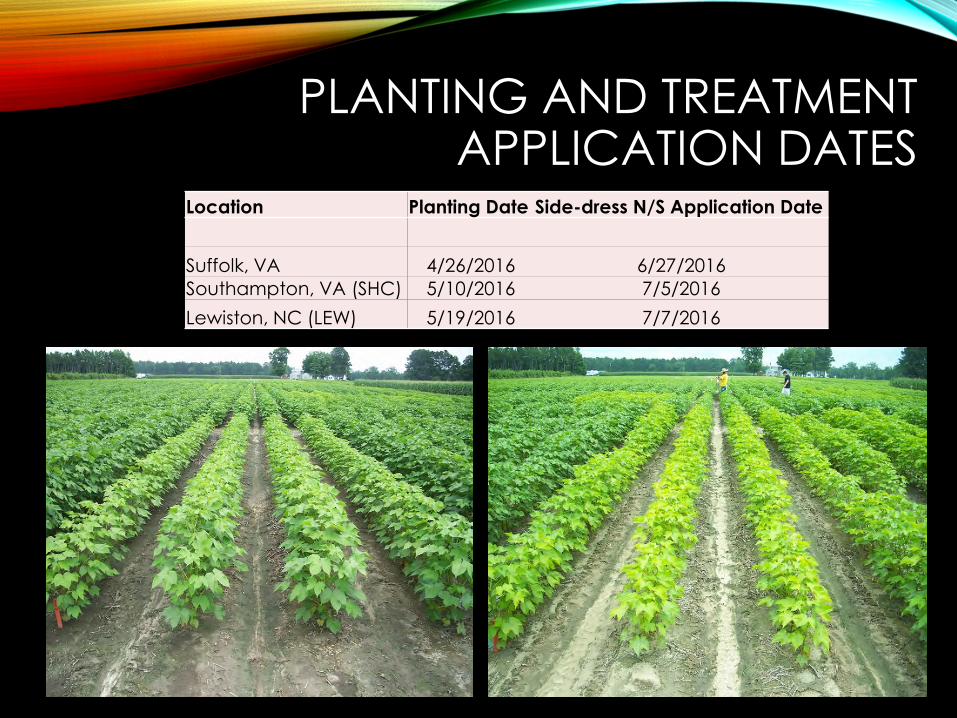
PLANTING AND TREATMENT APPLICATION DATES
Location Planting Date Side-dress N/S Application Date
Suffolk, VA 4/26/2016 6/27/2016Southampton, VA (SHC) 5/10/2016 7/5/2016
Lewiston, NC (LEW) 5/19/2016 7/7/2016
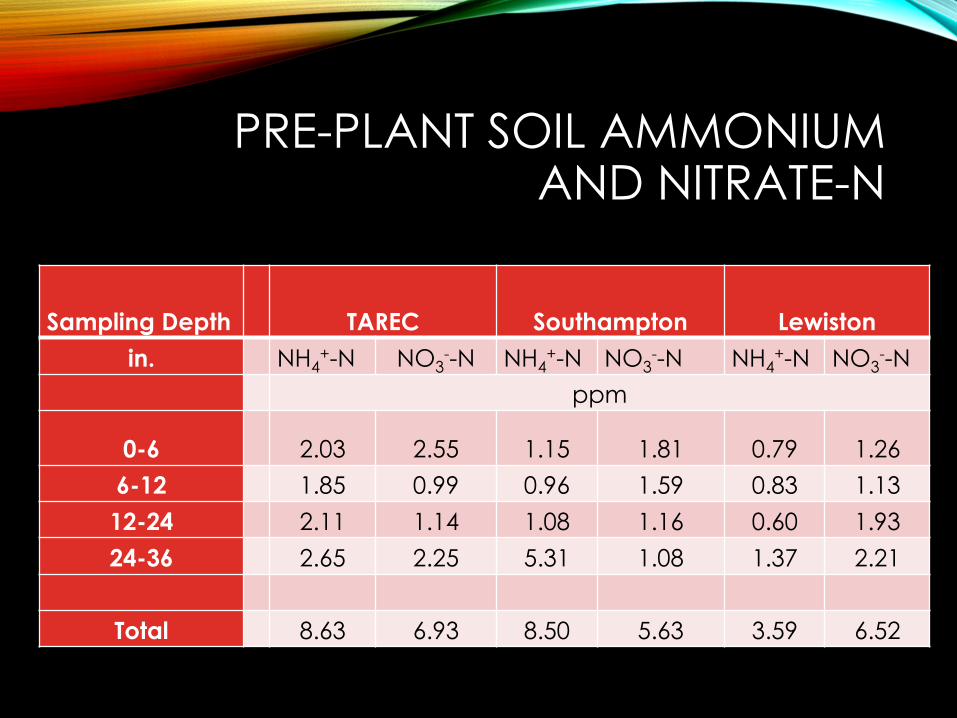
PRE-PLANT SOIL AMMONIUM AND NITRATE-N
Sampling Depth TAREC Southampton Lewiston
in. NH4+-N NO3
--N NH4+-N NO3
--N NH4+-N NO3
--N
ppm
0-6 2.03 2.55 1.15 1.81 0.79 1.26
6-12 1.85 0.99 0.96 1.59 0.83 1.13
12-24 2.11 1.14 1.08 1.16 0.60 1.93
24-36 2.65 2.25 5.31 1.08 1.37 2.21
Total 8.63 6.93 8.50 5.63 3.59 6.52

RESULTS
GRANULAR N/S FORMULATIONS
VERSUS
FLUID N/S FORMULATIONS

PETIOLE S CONCENTRATION AND FERTILIZER SOURCE
Suffolk SHC LEW
Petiole
Sulfur (p
pm
)
0
200
400
600
800
1000
1200
1400
1600
1800
Urea + AMSUAN32 + ATS
B
A
A
B

PETIOLE SULFUR DURING 1ST WEEK OF BLOOM
Sulfur Application Rate (lb. S ac-1
)
0 10 20 30
Petiole
Sulfur (p
pm
)
0
200
400
600
800
1000
1200
1400
1600
1800
2000
Suffolk, VASouthampton, VALewiston, NC
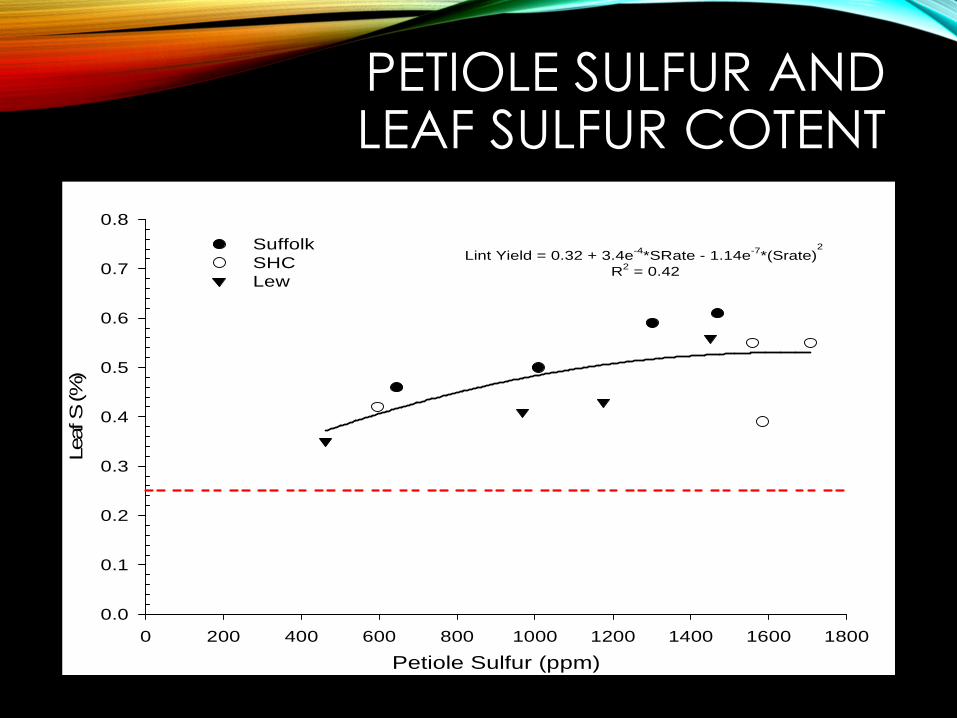
PETIOLE SULFUR AND LEAF SULFUR COTENT
Petiole Sulfur (ppm)
0 200 400 600 800 1000 1200 1400 1600 1800
Leaf S (%
)
0.0
0.1
0.2
0.3
0.4
0.5
0.6
0.7
0.8
SuffolkSHCLew
Lint Yield = 0.32 + 3.4e-4*SRate - 1.14e-7*(Srate)2
R2 = 0.42

FERTILIZER SOURCE AND PETIOLE NITRATE-N AT 100 LB N ACRE-1
Suffolk SHC LEW
Petio
le N
itrate
-N (ppm
)
0
2000
4000
6000
8000
10000
12000
14000Urea + AMSUAN32 + ATSA
B
B
A
A
B

PETIOLE NITRATE-N AND SULFUR RATE DURING THE 1ST
WEEK OF BLOOM
Suffolk SHC Lew
Petiole N
itra
te-N
(ppm
)
0
2000
4000
6000
8000
10000
12000
0 lb S acre-1
10 lb S acre-1
20 lb S acre-1
30 lb S acre-1
A
AB
BB
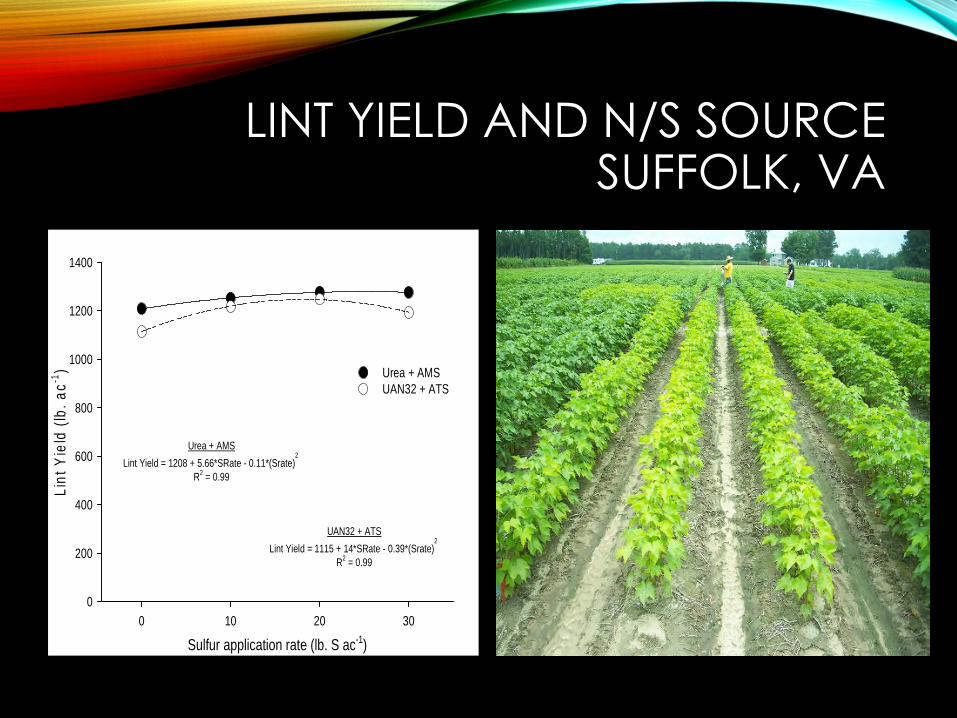
Sulfur application rate (lb. S ac-1)
0 10 20 30
Lin
t Y
ield
(lb
. a
c-1)
0
200
400
600
800
1000
1200
1400
Urea + AMSUAN32 + ATS
UAN32 + ATS
Lint Yield = 1115 + 14*SRate - 0.39*(Srate)2
R2 = 0.99
Urea + AMS
Lint Yield = 1208 + 5.66*SRate - 0.11*(Srate)2
R2 = 0.99
LINT YIELD AND N/S SOURCESUFFOLK, VA

Southampton, VA Lewiston, NC
Sulfur Application Rate (lb. S ac-1)
0 10 20 30
Lin
t Y
ield
( l
b.
ac-1
)
0
200
400
600
800
1000
1200
1400
Urea + AMSUAN32 + ATS
LINT YIELD AND N/S SOURCE
Sulfur Application Rate (lb. S ac-1)
0 10 20 30
Lin
t Y
ield
(lb
. a
c-1
)
0
200
400
600
800
1000
1200
1400
Urea + AMSUAN32 + ATS
RESULTS
FLUID N/S FORMULATIONS AND
VARYING NITROGEN RATES
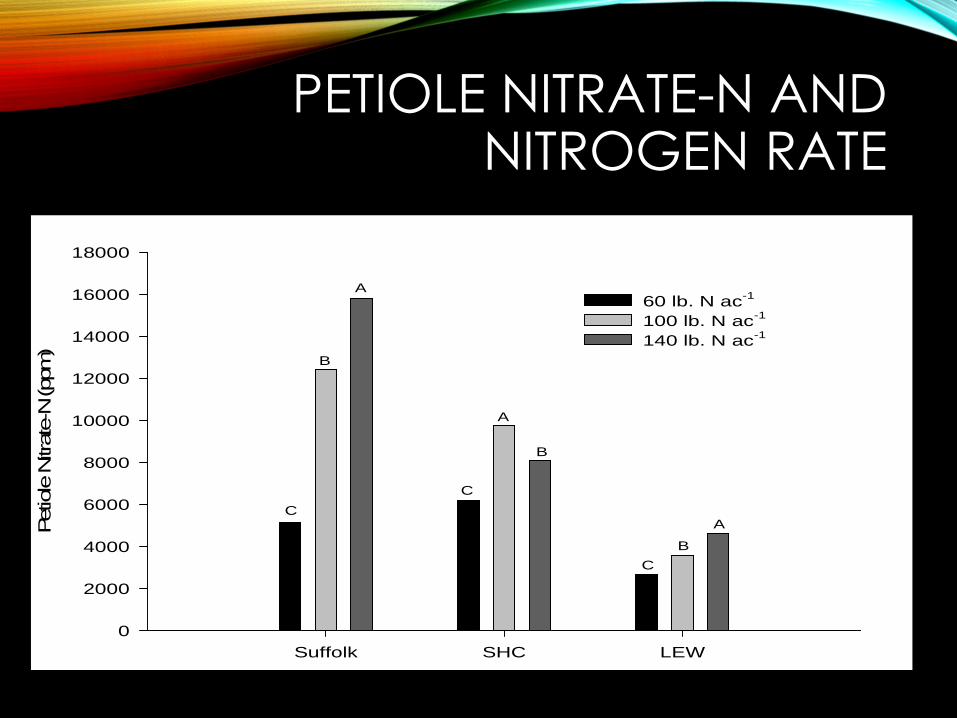
PETIOLE NITRATE-N AND NITROGEN RATE
Suffolk SHC LEW
Petiole
Nitra
te-N
(ppm
)
0
2000
4000
6000
8000
10000
12000
14000
16000
18000
60 lb. N ac-1
100 lb. N ac-1
140 lb. N ac-1
A
B
C
A
B
C
A
B
C
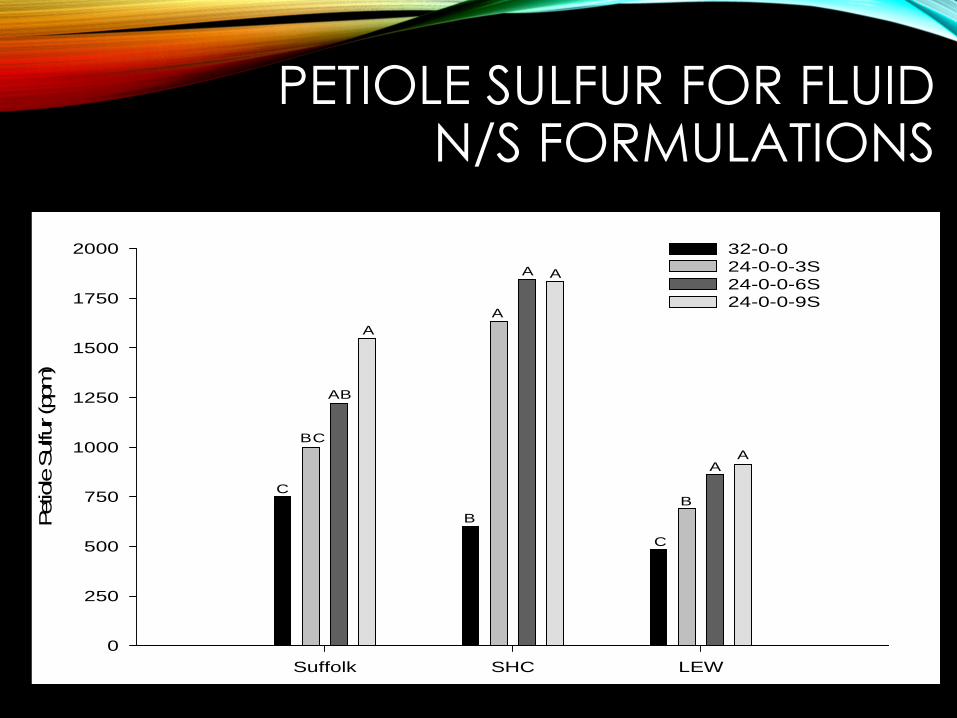
PETIOLE SULFUR FOR FLUID N/S FORMULATIONS
Suffolk SHC LEW
Petio
le S
ulfu
r (p
pm
)
0
250
500
750
1000
1250
1500
1750
2000 32-0-024-0-0-3S24-0-0-6S24-0-0-9S
C
B
AA
B
A
A A
A
AB
BC
C

FLUID N/S FORMULATIONS AND LINT YIELD
Suffolk SHC LEW
Lin
t Y
ield
(lb
. a
c-1
)
0
200
400
600
800
1000
1200
1400 32-0-024-0-0-3S24-0-0-6S24-0-0-9S
A AA
B
Suffolk SHC LEW
Lin
t Y
ield
(lb
. a
c-1)
0
200
400
600
800
1000
1200
1400
60 lb. N ac-1
100 lb. N ac-1
140 lb. N ac-1
AA
B
A A
B
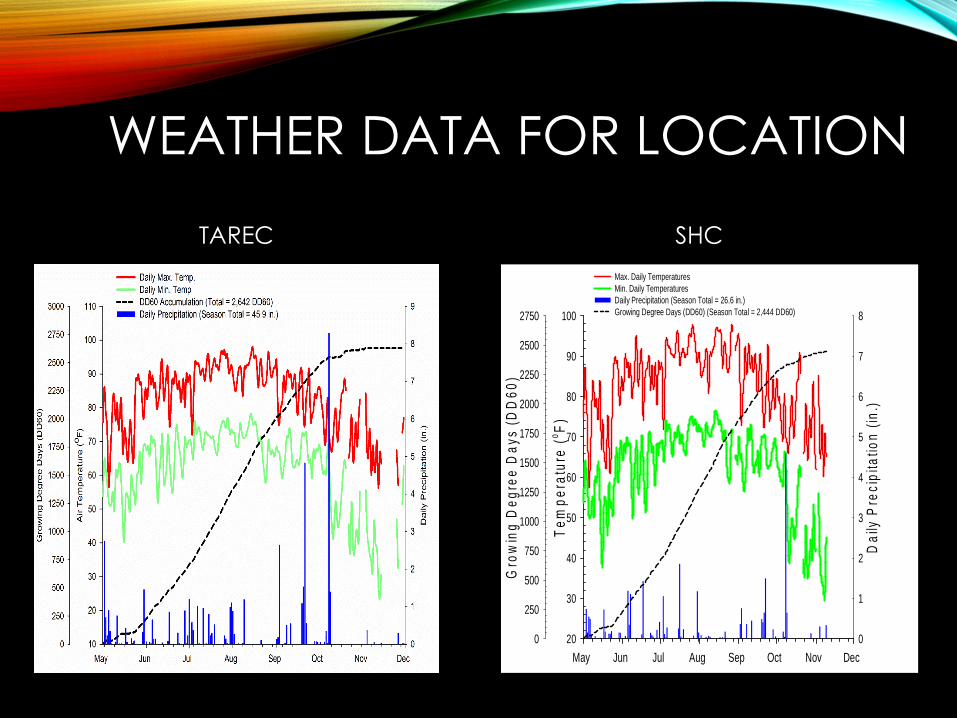
WEATHER DATA FOR LOCATION
TAREC
May Jun Jul Aug Sep Oct Nov Dec
Te
mp
era
ture
(oF
)
20
30
40
50
60
70
80
90
100
Da
ily P
rec
ipita
tion
(in
.)
0
1
2
3
4
5
6
7
8
Gro
win
g D
eg
ree
Da
ys (
DD
60
)
0
250
500
750
1000
1250
1500
1750
2000
2250
2500
2750
Max. Daily TemperaturesMin. Daily TemperaturesDaily Precipitation (Season Total = 26.6 in.)Growing Degree Days (DD60) (Season Total = 2,444 DD60)
SHC

WEATHER DATA FOR LOCATION
TAREC Lewiston
May Jun Jul Aug Sep Oct
Te
mp
era
ture
(o
F)
0
10
20
30
40
50
60
70
80
90
100
110
Da
ily P
rec
ipit
ati
on
(in
ch
es)
0
1
2
3
4
5
6
7
8
Gro
win
g D
eg
ree
Da
ys
(DD
60
)
0
500
1000
1500
2000
2500
3000
Max. Daily TemperatureMin. Daily TemperatureDaily Precipitation (Season Total = 32.2 inches)Cumulative DD60 (Season Total = 2,453 DD60)