Embed Size (px)
Citation preview
Special Issue Article
Fluid rheology, traction/creeprelationships and friction in machineelements with rolling contacts
GWG Poll and D Wang
Abstract
The correct prediction of shear stresses in lubricants applied to concentrated rolling/sliding contacts has been an issue of
intense debate for many years. Traction testers of various kinds such as two-disc roller rigs or ball on disc apparatus have
been extensively used in order to obtain experimental data, as well as, more recently, molecular dynamics simulations.
Several, partly competing, phenomenological models have been developed to describe the dependence of shear stresses
on various parameters. Evidently, the importance lies in the need to predict and reduce friction, or, more accurately,
resistance to motion of rolling element bearings in order to increase efficiency of machines and vehicles. Also, it plays a
crucial role in design and performance of traction drives. As a prerequisite, experimental data for a wide variety of fluids
were obtained from two-disc roller tests with a wide variation of contact pressures, rolling speeds and slide-to-roll
ratios. Following earlier investigations, the amount of slip created by the elastic deformation of the discs was separated
from the contribution of the fluids and their rheological properties. In accordance with experiments of Jacobson a
threshold pressure in the fluid was identified which marks the onset of a nearly linear relationship between a limiting
shear stress and pressure. However, this threshold does not appear to be constant but rather declining with decreasing
hydrodynamic film thickness respective of rolling speed, while the slope changes to a lesser extent. When measurements
were extended far into the mixed lubrication regime close to the limiting case of boundary lubrication, the shear stress/
pressure relationship became quasi-Coulomb with a virtually zero threshold pressure. These results have successfully
been used to predict the friction torque of angular contact ball bearings and the traction characteristics in toroidal drives.
Keywords
Lubricant rheology, rolling contacts, traction–creep relationship, limiting shear stress, viscoelasticity
Date received: 7 September 2011; accepted: 24 October 2011
Introduction
The rheology of lubricating fluids has been studied for along time, but there are still some aspects which con-tinue to be subject to debate. In the study of Bair andKotzalas,1,2 two of those are addressed:
(a) the existence and nature of a limiting shear stress;(b) the determination of the elastic modulus of fluids.
Especially, there are still questions how to interprettraction–creep curves measured at roller test machineswith respect to basic rheological properties of the inves-tigated fluids.
In this article, traction measurements involving awide range of parameter variations at a two-disc
roller test rig are re-evaluated with the aim to promotethe ongoing discussion.
Figure 1 shows typical traction measurements with atwo-disc roller test machine (Figure 2). Figure 1(a) and(b) shows the mean Hertzian contact pressure and therolling speed, respectively, which are the varied param-eters, while the oil inlet temperature is controlled to bea constant 60�C.
Institute of Machine Elements, Engineering Design and Tribology (IMKT),
Leibniz Universitaet Hannover, Germany
Corresponding author:
GWG Poll, Institute of Machine Elements, Engineering Design and
Tribology (IMKT), Leibniz Universitaet Hannover, Welfengarten 1A,
Hannover D-30167, Germany.
Email: [email protected]
Proc IMechE Part J:
J Engineering Tribology
226(6) 481–500
! IMechE 2012
Reprints and permissions:
sagepub.co.uk/journalsPermissions.nav
DOI: 10.1177/1350650111431790
pij.sagepub.com
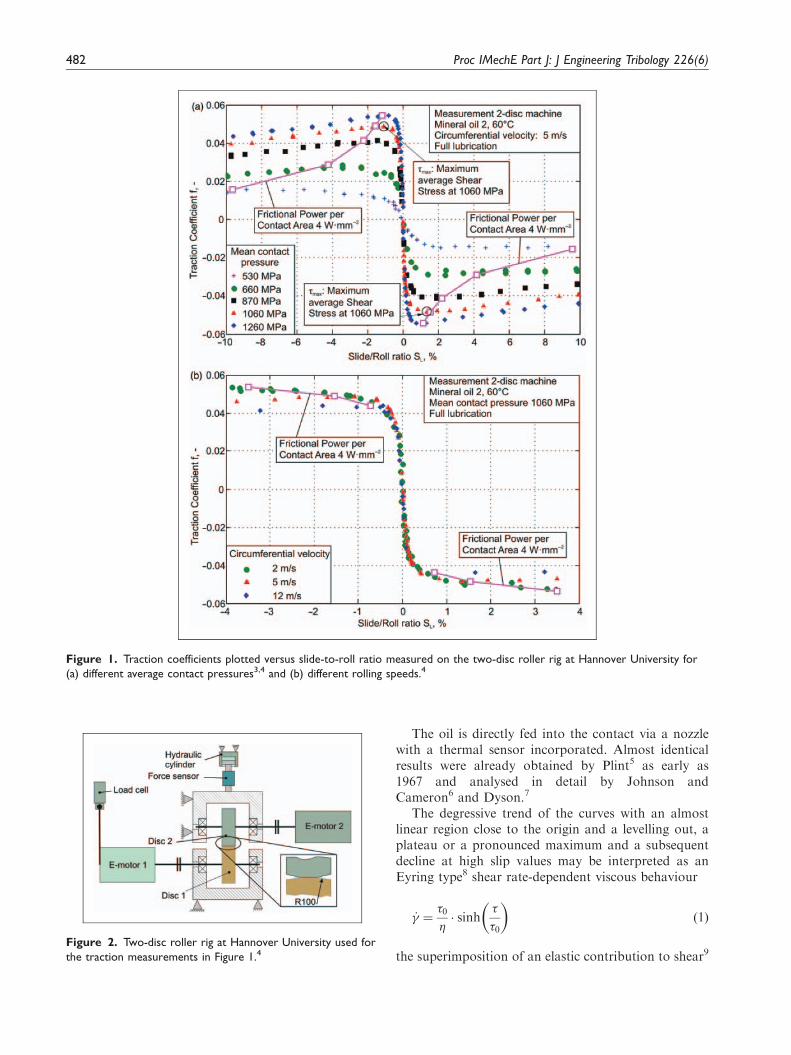
The oil is directly fed into the contact via a nozzlewith a thermal sensor incorporated. Almost identicalresults were already obtained by Plint5 as early as1967 and analysed in detail by Johnson andCameron6 and Dyson.7
The degressive trend of the curves with an almostlinear region close to the origin and a levelling out, aplateau or a pronounced maximum and a subsequentdecline at high slip values may be interpreted as anEyring type8 shear rate-dependent viscous behaviour
_� ¼�0�� sinh
�
�0
� �ð1Þ
the superimposition of an elastic contribution to shear9
Figure 1. Traction coefficients plotted versus slide-to-roll ratio measured on the two-disc roller rig at Hannover University for
(a) different average contact pressures3,4 and (b) different rolling speeds.4
Figure 2. Two-disc roller rig at Hannover University used for
the traction measurements in Figure 1.4
482 Proc IMechE Part J: J Engineering Tribology 226(6)
_� ¼1
G�d�
dtþ�0�� sinh
�
�0
� �ð2Þ
or the additional introduction of a limiting shearstress10
_� ¼1
G1�d�
dtþ�L�� ln 1�
�
�L
� ��1 !ð3Þ
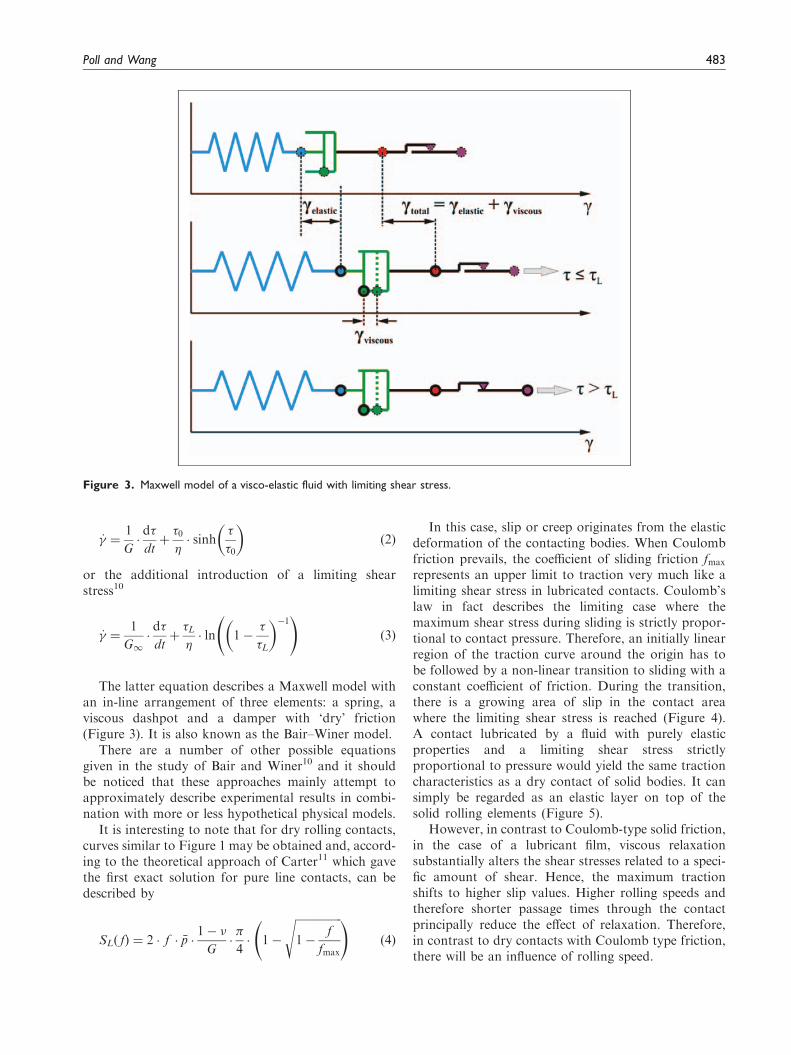
The latter equation describes a Maxwell model withan in-line arrangement of three elements: a spring, aviscous dashpot and a damper with ‘dry’ friction(Figure 3). It is also known as the Bair–Winer model.
There are a number of other possible equationsgiven in the study of Bair and Winer10 and it shouldbe noticed that these approaches mainly attempt toapproximately describe experimental results in combi-nation with more or less hypothetical physical models.
It is interesting to note that for dry rolling contacts,curves similar to Figure 1 may be obtained and, accord-ing to the theoretical approach of Carter11 which gavethe first exact solution for pure line contacts, can bedescribed by
SL fð Þ ¼ 2 � f � �p �1� �
G��
4� 1�
ffiffiffiffiffiffiffiffiffiffiffiffiffiffiffiffiffi1�
f
fmax
s !ð4Þ
In this case, slip or creep originates from the elasticdeformation of the contacting bodies. When Coulombfriction prevails, the coefficient of sliding friction fmax
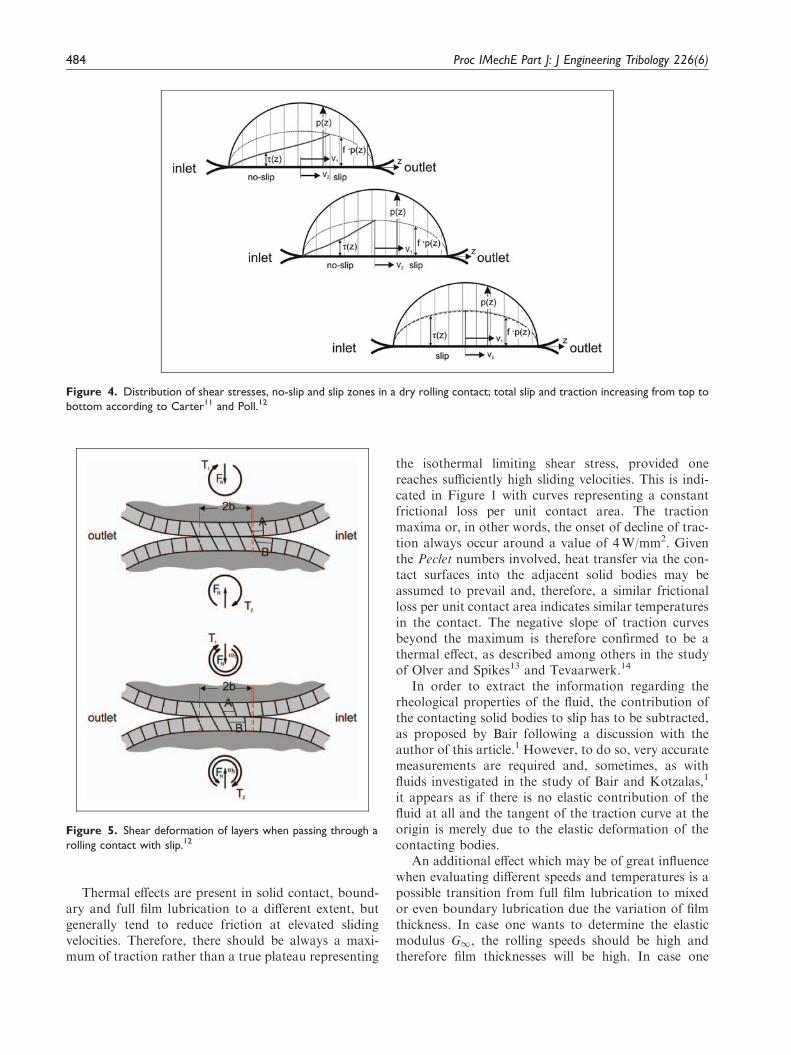
represents an upper limit to traction very much like alimiting shear stress in lubricated contacts. Coulomb’slaw in fact describes the limiting case where themaximum shear stress during sliding is strictly propor-tional to contact pressure. Therefore, an initially linearregion of the traction curve around the origin has tobe followed by a non-linear transition to sliding with aconstant coefficient of friction. During the transition,there is a growing area of slip in the contact areawhere the limiting shear stress is reached (Figure 4).A contact lubricated by a fluid with purely elasticproperties and a limiting shear stress strictlyproportional to pressure would yield the same tractioncharacteristics as a dry contact of solid bodies. It cansimply be regarded as an elastic layer on top of thesolid rolling elements (Figure 5).
However, in contrast to Coulomb-type solid friction,in the case of a lubricant film, viscous relaxationsubstantially alters the shear stresses related to a speci-fic amount of shear. Hence, the maximum tractionshifts to higher slip values. Higher rolling speeds andtherefore shorter passage times through the contactprincipally reduce the effect of relaxation. Therefore,in contrast to dry contacts with Coulomb type friction,there will be an influence of rolling speed.
Figure 3. Maxwell model of a visco-elastic fluid with limiting shear stress.
Poll and Wang 483
Thermal effects are present in solid contact, bound-ary and full film lubrication to a different extent, butgenerally tend to reduce friction at elevated slidingvelocities. Therefore, there should be always a maxi-mum of traction rather than a true plateau representing
the isothermal limiting shear stress, provided onereaches sufficiently high sliding velocities. This is indi-cated in Figure 1 with curves representing a constantfrictional loss per unit contact area. The tractionmaxima or, in other words, the onset of decline of trac-tion always occur around a value of 4W/mm2. Giventhe Peclet numbers involved, heat transfer via the con-tact surfaces into the adjacent solid bodies may beassumed to prevail and, therefore, a similar frictionalloss per unit contact area indicates similar temperaturesin the contact. The negative slope of traction curvesbeyond the maximum is therefore confirmed to be athermal effect, as described among others in the studyof Olver and Spikes13 and Tevaarwerk.14
In order to extract the information regarding therheological properties of the fluid, the contribution ofthe contacting solid bodies to slip has to be subtracted,as proposed by Bair following a discussion with theauthor of this article.1 However, to do so, very accuratemeasurements are required and, sometimes, as withfluids investigated in the study of Bair and Kotzalas,1
it appears as if there is no elastic contribution of thefluid at all and the tangent of the traction curve at theorigin is merely due to the elastic deformation of thecontacting bodies.
An additional effect which may be of great influencewhen evaluating different speeds and temperatures is apossible transition from full film lubrication to mixedor even boundary lubrication due the variation of filmthickness. In case one wants to determine the elasticmodulus G1, the rolling speeds should be high andtherefore film thicknesses will be high. In case one
Figure 4. Distribution of shear stresses, no-slip and slip zones in a dry rolling contact; total slip and traction increasing from top to
bottom according to Carter11 and Poll.12
Figure 5. Shear deformation of layers when passing through a
rolling contact with slip.12
484 Proc IMechE Part J: J Engineering Tribology 226(6)
wants to study viscosity and reduce the influence ofelasticity by increasing relaxation time, one prefersvery low speeds which lead to thinner films. Then, the
maximum or possibly limiting shear stress may partlybe due to Coulomb type boundary friction and the �ratio of fluid film thickness to roughness has to be care-fully observed.
One interpretation of measurements is to assumestrict proportionality between pressure and limitingshear stress, that means an almost linear relationwhich passes through the origin.15 Others, like Bair10
and Jacobson16 also report measurements where thelinear increase starts from a threshold value of pressure.This leads to the question if the extrapolation of mea-surements through the origin found in literature isalways correct.
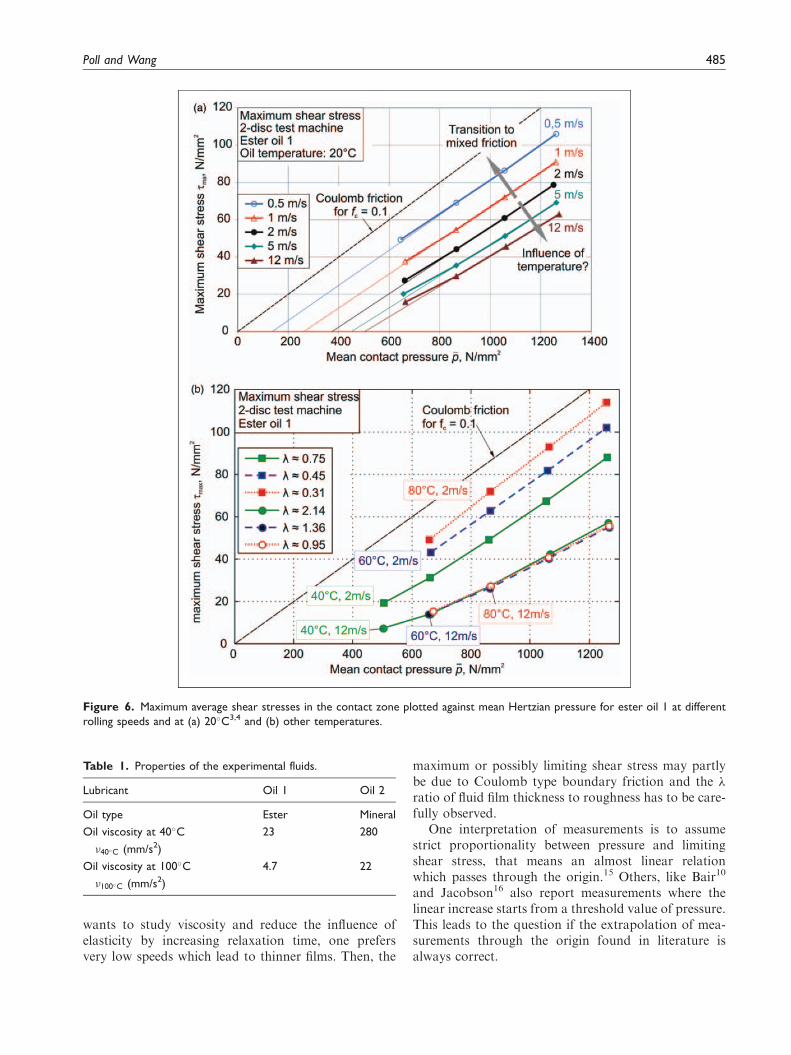
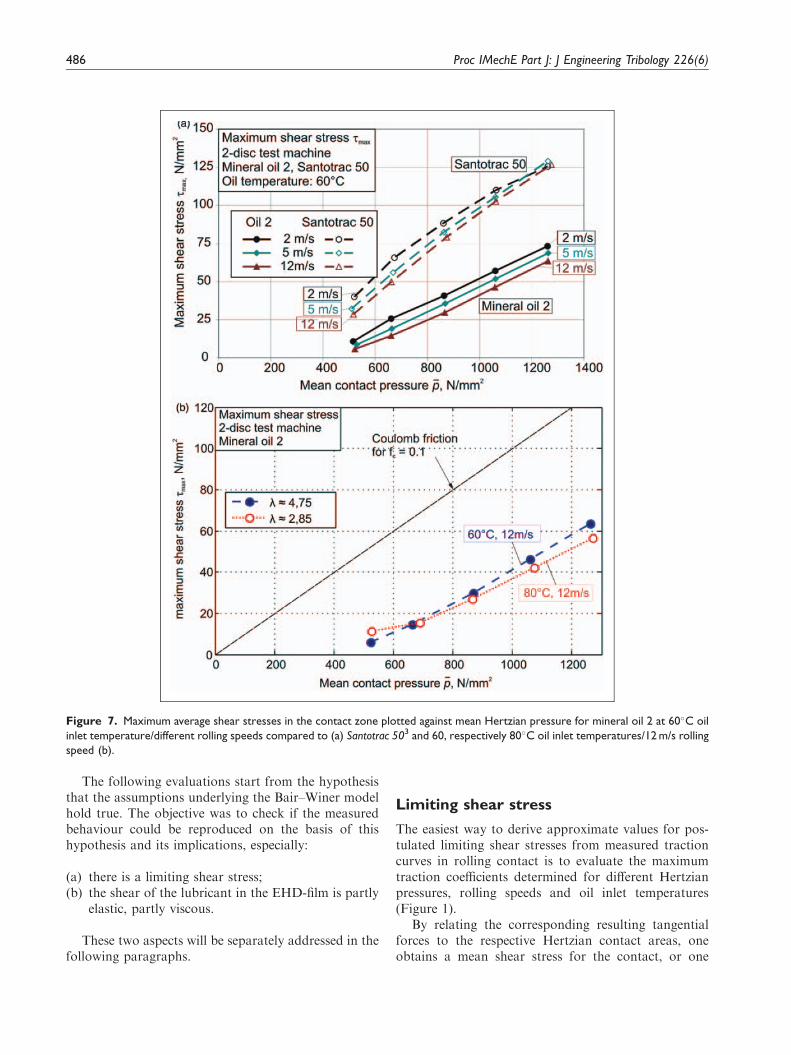
Figure 6. Maximum average shear stresses in the contact zone plotted against mean Hertzian pressure for ester oil 1 at different
rolling speeds and at (a) 20�C3,4 and (b) other temperatures.
Table 1. Properties of the experimental fluids.
Lubricant Oil 1 Oil 2
Oil type Ester Mineral
Oil viscosity at 40�C 23 280
�40�C (mm/s2)
Oil viscosity at 100�C 4.7 22
�100�C (mm/s2)
Poll and Wang 485
The following evaluations start from the hypothesisthat the assumptions underlying the Bair–Winer modelhold true. The objective was to check if the measuredbehaviour could be reproduced on the basis of thishypothesis and its implications, especially:
(a) there is a limiting shear stress;(b) the shear of the lubricant in the EHD-film is partly
elastic, partly viscous.
These two aspects will be separately addressed in thefollowing paragraphs.
Limiting shear stress
The easiest way to derive approximate values for pos-tulated limiting shear stresses from measured tractioncurves in rolling contact is to evaluate the maximumtraction coefficients determined for different Hertzianpressures, rolling speeds and oil inlet temperatures(Figure 1).
By relating the corresponding resulting tangentialforces to the respective Hertzian contact areas, oneobtains a mean shear stress for the contact, or one
Figure 7. Maximum average shear stresses in the contact zone plotted against mean Hertzian pressure for mineral oil 2 at 60�C oil
inlet temperature/different rolling speeds compared to (a) Santotrac 503 and 60, respectively 80�C oil inlet temperatures/12 m/s rolling
speed (b).
486 Proc IMechE Part J: J Engineering Tribology 226(6)
may also multiply the mean Hertzian pressure with thetraction coefficient
�� ¼Ft
� � a � b¼ �p � f ð5Þ
and therefore
��L �p, v, �ð Þ ¼ �p � fmax �p, v, �ð Þ ð6Þ
Consequently, it should then be plotted versus themean Hertzian pressure (Figures 6 and 7). This averag-ing approach is a first approximation, as it would onlyrepresent the exact correlation between limiting shearstress and pressure in case there would be a strict pro-portionality between pressure and shear stress through-out the contact. Also, as mentioned before, it is notpossible to measure isothermal limiting shear stresses.
However, as the evaluated maxima are all roughlysubject to the same frictional heating, the resulting plotsat least represent maximum average shear stresses at a
fairly constant average contact temperature. Therefore,the experimentally determined maximum average shearstresses are subsequently simply addressed as limitingshear stresses. On the other hand, there are importantvariations of film thickness as a result of the purposelyvaried speeds and oil inlet temperatures and therefore,the � ratios are indicated as well. Here, the classic for-mula for � is used
� ¼hcffiffiffiffiffiffiffiffiffiffiffiffiffiffiffiffi
21 þ 22
q ð7Þ
1,2 ¼
ffiffiffi�
2
r� Ra1,2 ð8Þ
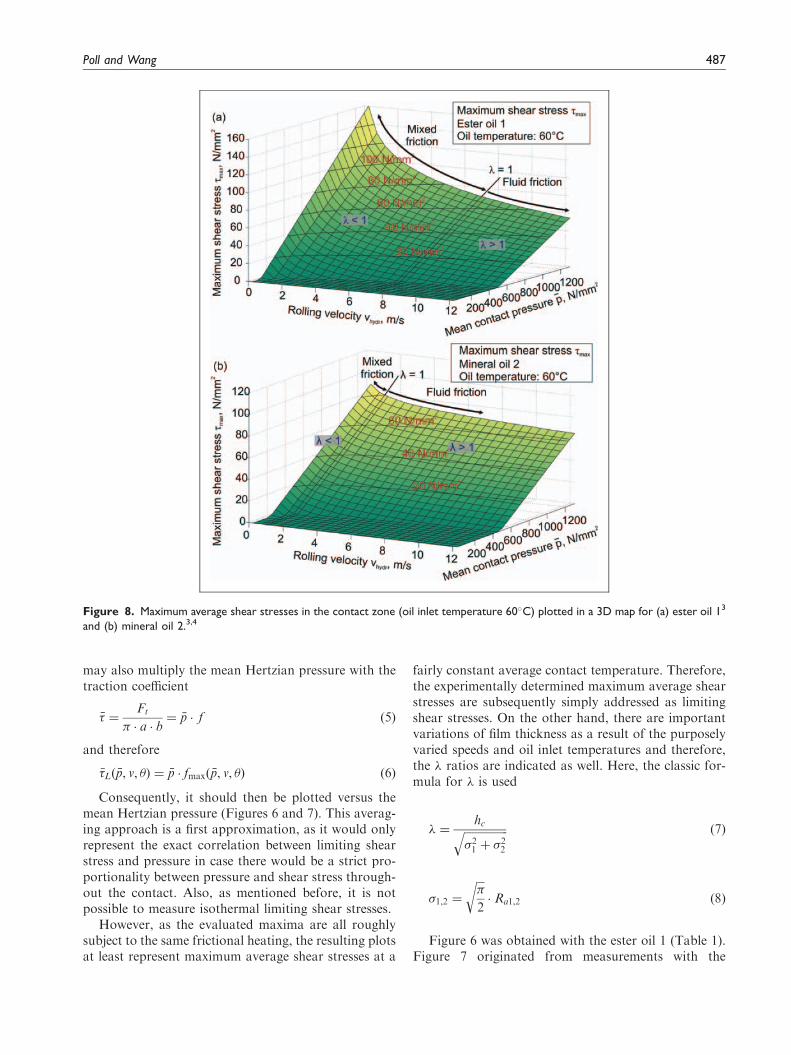
Figure 6 was obtained with the ester oil 1 (Table 1).Figure 7 originated from measurements with the
Figure 8. Maximum average shear stresses in the contact zone (oil inlet temperature 60�C) plotted in a 3D map for (a) ester oil 13
and (b) mineral oil 2.3,4
Poll and Wang 487
mineral oil 2. For a better understanding, the sameresults can also be represented with 3D plots like inFigure 8.
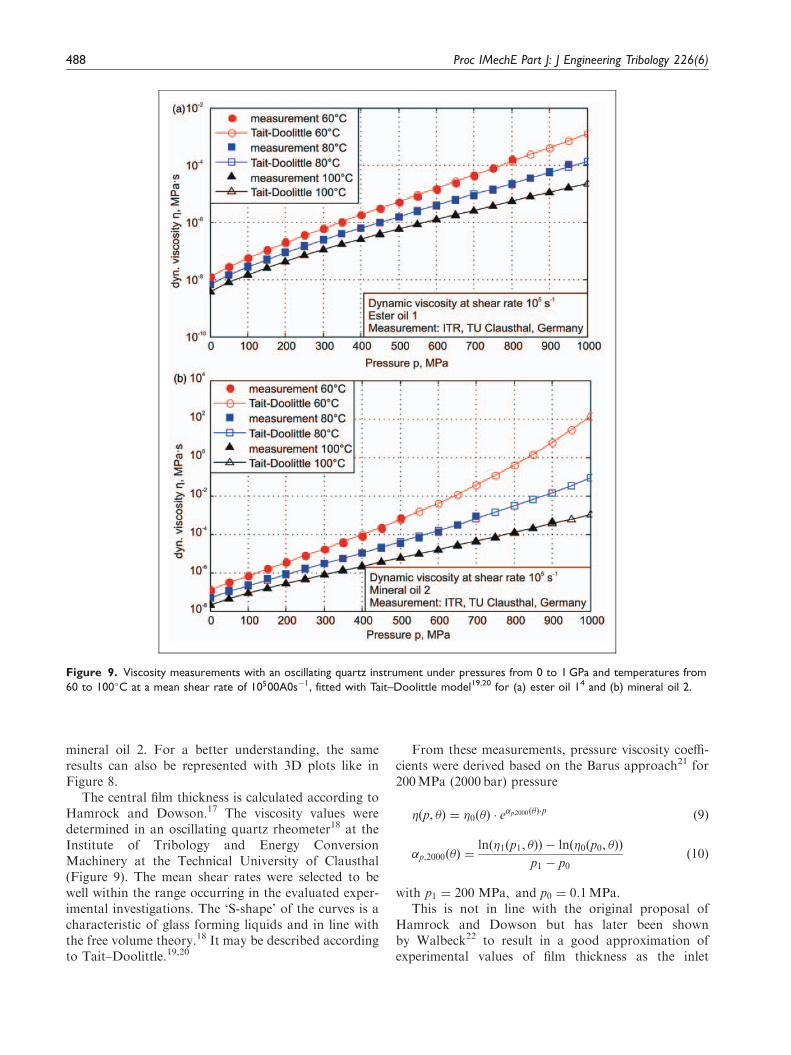
The central film thickness is calculated according toHamrock and Dowson.17 The viscosity values weredetermined in an oscillating quartz rheometer18 at theInstitute of Tribology and Energy ConversionMachinery at the Technical University of Clausthal(Figure 9). The mean shear rates were selected to bewell within the range occurring in the evaluated exper-imental investigations. The ‘S-shape’ of the curves is acharacteristic of glass forming liquids and in line withthe free volume theory.18 It may be described accordingto Tait–Doolittle.19,20
From these measurements, pressure viscosity coeffi-cients were derived based on the Barus approach21 for200MPa (2000 bar) pressure
� p, �ð Þ ¼ �0 �ð Þ � ep,2000 �ð Þ�p ð9Þ
p,2000 �ð Þ ¼ln �1 p1, �ð Þð Þ � lnð�0 p0, �ð ÞÞ
p1 � p0ð10Þ
with p1 ¼ 200 MPa, and p0 ¼ 0:1MPa.This is not in line with the original proposal of
Hamrock and Dowson but has later been shownby Walbeck22 to result in a good approximation ofexperimental values of film thickness as the inlet
Figure 9. Viscosity measurements with an oscillating quartz instrument under pressures from 0 to 1 GPa and temperatures from
60 to 100�C at a mean shear rate of 10500A0s�1, fitted with Tait–Doolittle model19,20 for (a) ester oil 14 and (b) mineral oil 2.
488 Proc IMechE Part J: J Engineering Tribology 226(6)
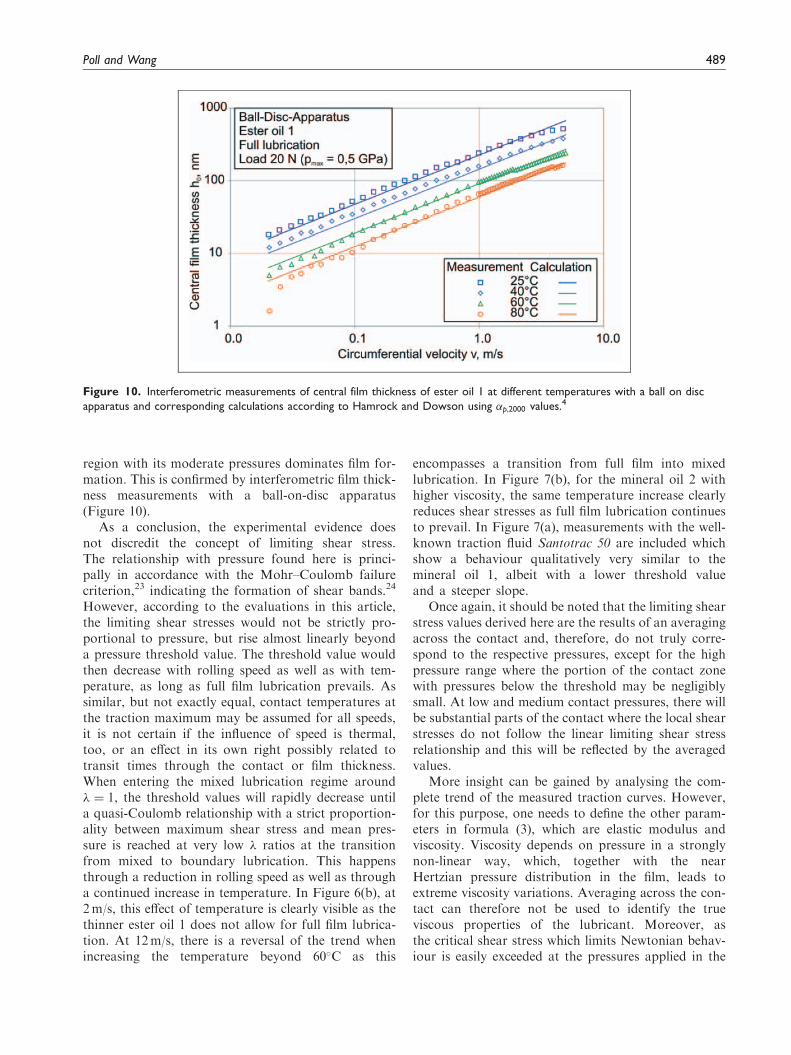
region with its moderate pressures dominates film for-mation. This is confirmed by interferometric film thick-ness measurements with a ball-on-disc apparatus(Figure 10).
As a conclusion, the experimental evidence doesnot discredit the concept of limiting shear stress.The relationship with pressure found here is princi-pally in accordance with the Mohr–Coulomb failurecriterion,23 indicating the formation of shear bands.24
However, according to the evaluations in this article,the limiting shear stresses would not be strictly pro-portional to pressure, but rise almost linearly beyonda pressure threshold value. The threshold value wouldthen decrease with rolling speed as well as with tem-perature, as long as full film lubrication prevails. Assimilar, but not exactly equal, contact temperatures atthe traction maximum may be assumed for all speeds,it is not certain if the influence of speed is thermal,too, or an effect in its own right possibly related totransit times through the contact or film thickness.When entering the mixed lubrication regime around� ¼ 1, the threshold values will rapidly decrease untila quasi-Coulomb relationship with a strict proportion-ality between maximum shear stress and mean pres-sure is reached at very low � ratios at the transitionfrom mixed to boundary lubrication. This happensthrough a reduction in rolling speed as well as througha continued increase in temperature. In Figure 6(b), at2m/s, this effect of temperature is clearly visible as thethinner ester oil 1 does not allow for full film lubrica-tion. At 12m/s, there is a reversal of the trend whenincreasing the temperature beyond 60�C as this
encompasses a transition from full film into mixedlubrication. In Figure 7(b), for the mineral oil 2 withhigher viscosity, the same temperature increase clearlyreduces shear stresses as full film lubrication continuesto prevail. In Figure 7(a), measurements with the well-known traction fluid Santotrac 50 are included whichshow a behaviour qualitatively very similar to themineral oil 1, albeit with a lower threshold valueand a steeper slope.
Once again, it should be noted that the limiting shearstress values derived here are the results of an averagingacross the contact and, therefore, do not truly corre-spond to the respective pressures, except for the highpressure range where the portion of the contact zonewith pressures below the threshold may be negligiblysmall. At low and medium contact pressures, there willbe substantial parts of the contact where the local shearstresses do not follow the linear limiting shear stressrelationship and this will be reflected by the averagedvalues.
More insight can be gained by analysing the com-plete trend of the measured traction curves. However,for this purpose, one needs to define the other param-eters in formula (3), which are elastic modulus andviscosity. Viscosity depends on pressure in a stronglynon-linear way, which, together with the nearHertzian pressure distribution in the film, leads toextreme viscosity variations. Averaging across the con-tact can therefore not be used to identify the trueviscous properties of the lubricant. Moreover, asthe critical shear stress which limits Newtonian behav-iour is easily exceeded at the pressures applied in the
Figure 10. Interferometric measurements of central film thickness of ester oil 1 at different temperatures with a ball on disc
apparatus and corresponding calculations according to Hamrock and Dowson using p,2000 values.4
Poll and Wang 489
evaluated measurements, shear thinning will certainlyoccur, although partly being obscured by the domi-nance of the limiting shear stresses. Therefore, insteadof one viscosity value for a given pressure and tem-perature, viscosity would depend on shear rate accord-ing to the Carreau equation.25 Even the initial slope ofthe traction curve may seem to change as a result,because the critical shear stress for the transition tonon-Newtonian behaviour is in the range of 5MPaand will be exceeded already at very small slide-to-roll ratios. Therefore, using the averaging approachwithout considering the local shear stresses based onphysical models and laboratory measurements, onecan only derive ‘equivalent’ or ‘effective’ rheological
parameters fitted to make the Bair–Winer modelmatch the measured data.
Characterisation of viscoelastic properties
The analysis of traction curves in the vicinity of theorigin principally allows to study the influence of vis-cous and elastic fluid properties almost independentlyfrom the questions concerning the limiting shear stressand frictional heating. However, as pointed out before,it is hard to escape from the effects of shear thinning.The measured data for 1GPa average Hertzian contactpressure in Figure 1 were in a first step stripped of theportion of slip contributed by the elastic deformation of
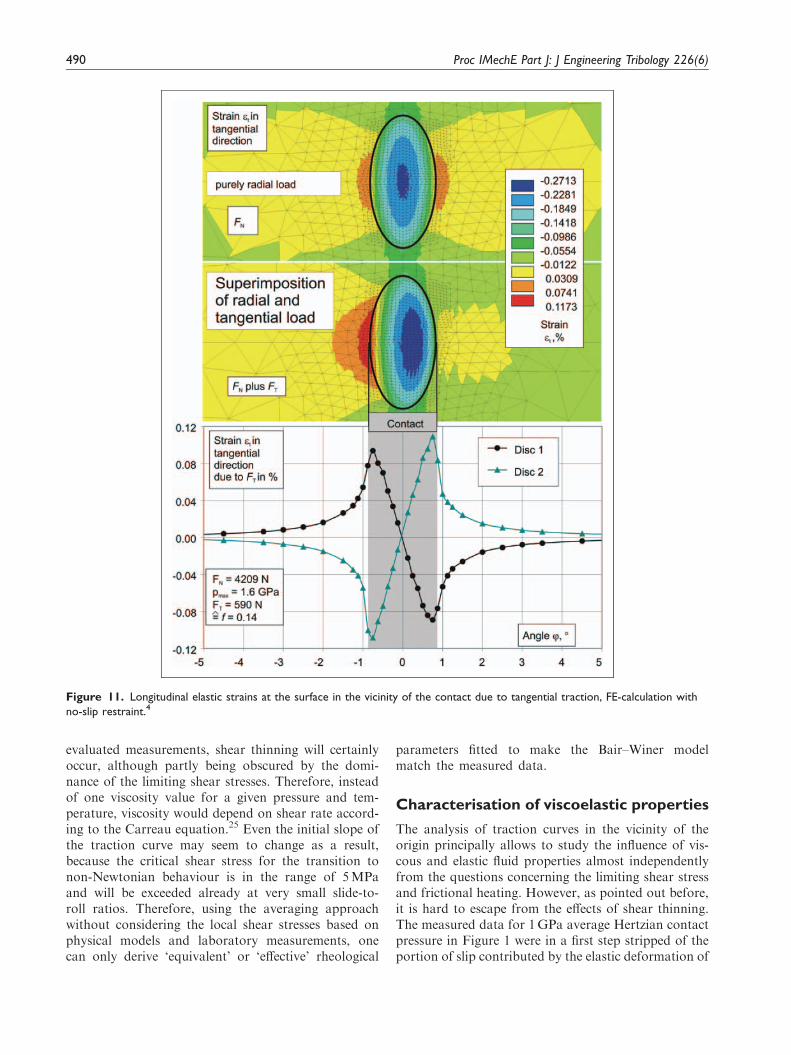
Figure 11. Longitudinal elastic strains at the surface in the vicinity of the contact due to tangential traction, FE-calculation with
no-slip restraint.4
490 Proc IMechE Part J: J Engineering Tribology 226(6)
the contacting solid bodies in order to obtain the truerelationship for the fluid itself. For that purpose, twomethods were applied and compared. The experimentalapproach was to experimentally determine the slope atthe origin by carefully cleaning the surfaces and mea-sure traction and slip in the vicinity of the origin in dryconditions. Because the maximum coefficient of frictionin dry condition exceeds 0.15, traction is practicallyproportional to slip in the range investigated. Then,the elastic strains at the surface of the discs were deter-mined using a finite element model (FEM) of the twodiscs with an appropriate discretisation in the contactzone. As in this case only the linear behaviour at verysmall slip values is of interest, the onset of a slidingzone at the trailing edge of the contact can be neglected
and no relative motion was allowed between the surfaceelements. One way to determine slip is then to add theamounts of the tangential surface strains caused bytraction at the inlet of the contact area (Figure 11)
SL ¼ "T,1�� ��þ "T,2
�� �� ð11Þ
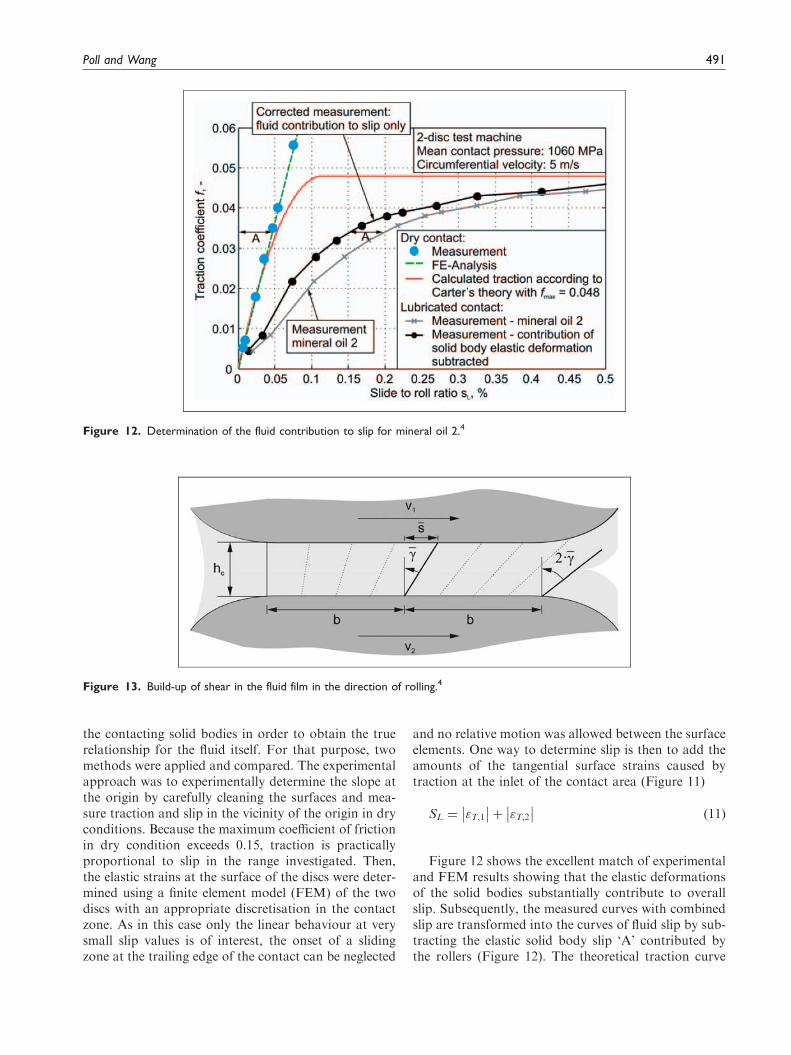
Figure 12 shows the excellent match of experimentaland FEM results showing that the elastic deformationsof the solid bodies substantially contribute to overallslip. Subsequently, the measured curves with combinedslip are transformed into the curves of fluid slip by sub-tracting the elastic solid body slip ‘A’ contributed bythe rollers (Figure 12). The theoretical traction curve
Figure 12. Determination of the fluid contribution to slip for mineral oil 2.4
Figure 13. Build-up of shear in the fluid film in the direction of rolling.4
Poll and Wang 491
for a dry contact and Coulomb-type friction accordingto Carter11 is indicated as well. The Coulomb frictioncoefficient fmax was chosen equal to the maximum trac-tion coefficient found in lubricated condition. The dis-crepancy between dry and lubricated traction curvesclearly indicates the viscoelastic contribution of thefluid. It should be noted that, in contrast to the fluidcontribution, the slip produced by the elastic
deformation of the rolling elements is completely inde-pendent of rolling speed and therefore only needs to bedetermined once for a given normal load and contactgeometry. The curves representing fluid behaviour arethen further transformed by calculating average shearvalues and shear rates by relating the tangential dis-placement of the walls given by slip to the central filmthicknesses
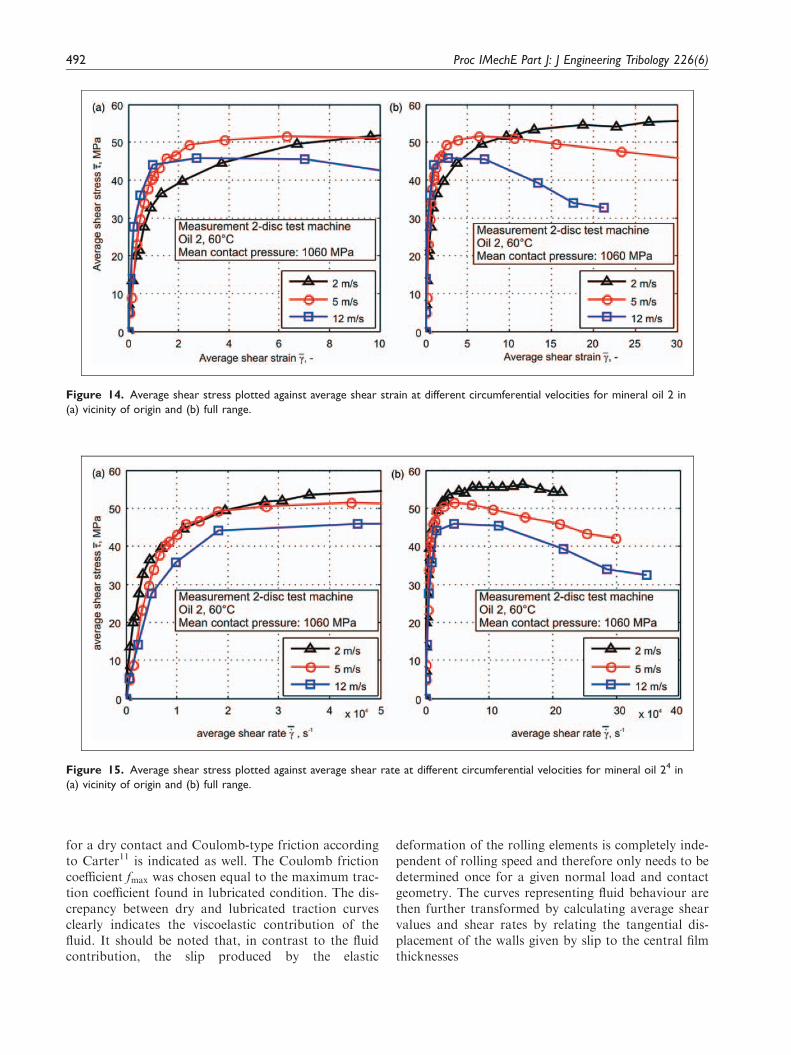
Figure 14. Average shear stress plotted against average shear strain at different circumferential velocities for mineral oil 2 in
(a) vicinity of origin and (b) full range.
Figure 15. Average shear stress plotted against average shear rate at different circumferential velocities for mineral oil 24 in
(a) vicinity of origin and (b) full range.
492 Proc IMechE Part J: J Engineering Tribology 226(6)
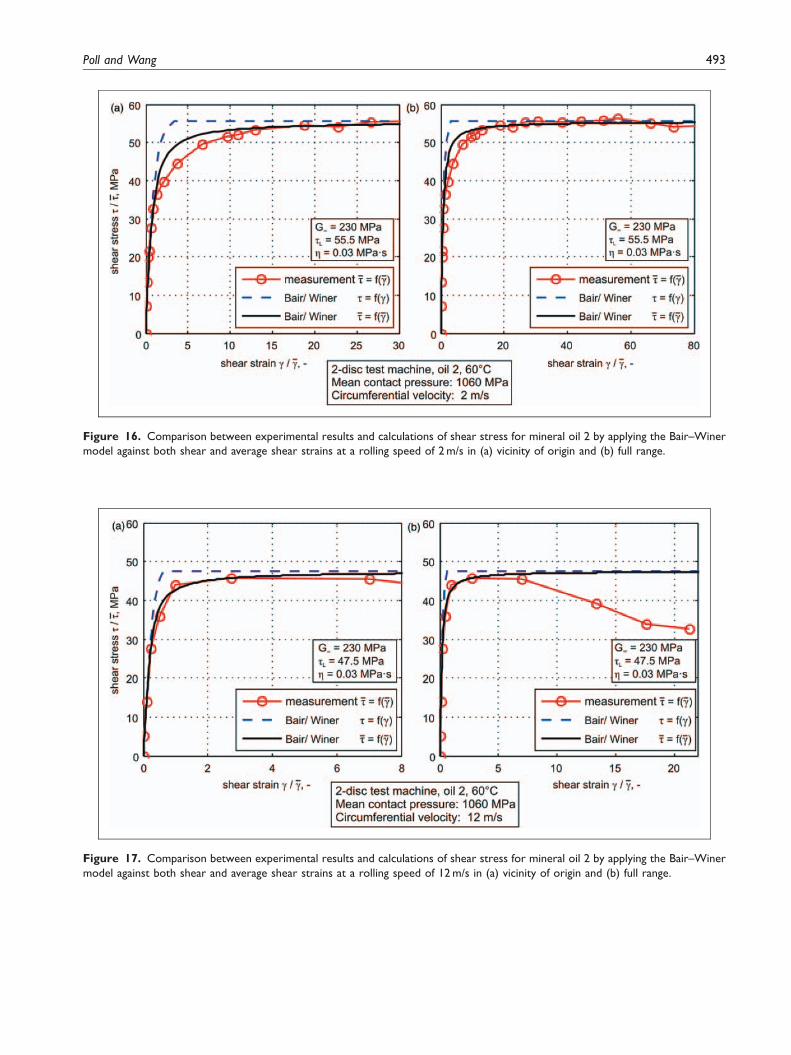
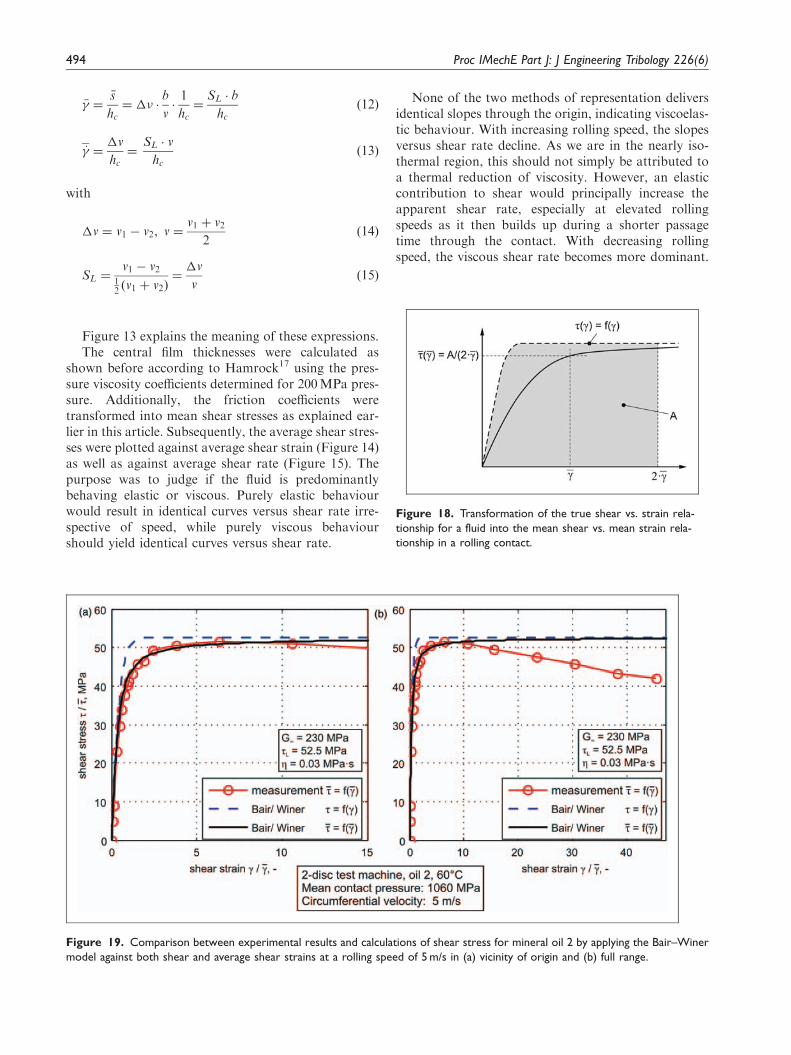
Figure 16. Comparison between experimental results and calculations of shear stress for mineral oil 2 by applying the Bair–Winer
model against both shear and average shear strains at a rolling speed of 2 m/s in (a) vicinity of origin and (b) full range.
Figure 17. Comparison between experimental results and calculations of shear stress for mineral oil 2 by applying the Bair–Winer
model against both shear and average shear strains at a rolling speed of 12 m/s in (a) vicinity of origin and (b) full range.
Poll and Wang 493
�� ¼�s
hc¼ �� �
b
v�1
hc¼
SL � b
hcð12Þ
_� ¼�v
hc¼
SL � v
hcð13Þ
with
�v ¼ v1 � v2, v ¼v1 þ v2
2ð14Þ
SL ¼v1 � v2
12 v1 þ v2ð Þ
¼�v
vð15Þ
Figure 13 explains the meaning of these expressions.The central film thicknesses were calculated as
shown before according to Hamrock17 using the pres-sure viscosity coefficients determined for 200MPa pres-sure. Additionally, the friction coefficients weretransformed into mean shear stresses as explained ear-lier in this article. Subsequently, the average shear stres-ses were plotted against average shear strain (Figure 14)as well as against average shear rate (Figure 15). Thepurpose was to judge if the fluid is predominantlybehaving elastic or viscous. Purely elastic behaviourwould result in identical curves versus shear rate irre-spective of speed, while purely viscous behaviourshould yield identical curves versus shear rate.
None of the two methods of representation deliversidentical slopes through the origin, indicating viscoelas-tic behaviour. With increasing rolling speed, the slopesversus shear rate decline. As we are in the nearly iso-thermal region, this should not simply be attributed toa thermal reduction of viscosity. However, an elasticcontribution to shear would principally increase theapparent shear rate, especially at elevated rollingspeeds as it then builds up during a shorter passagetime through the contact. With decreasing rollingspeed, the viscous shear rate becomes more dominant.
Figure 19. Comparison between experimental results and calculations of shear stress for mineral oil 2 by applying the Bair–Winer
model against both shear and average shear strains at a rolling speed of 5 m/s in (a) vicinity of origin and (b) full range.
Figure 18. Transformation of the true shear vs. strain rela-
tionship for a fluid into the mean shear vs. mean strain rela-
tionship in a rolling contact.
494 Proc IMechE Part J: J Engineering Tribology 226(6)
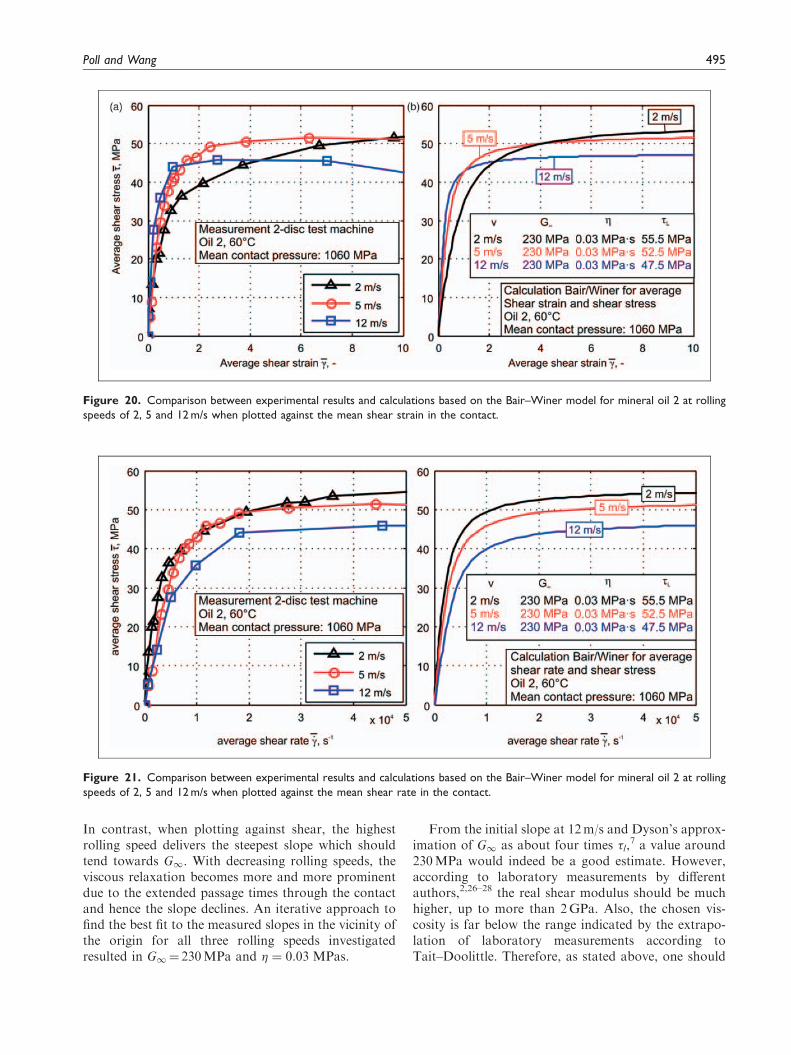
In contrast, when plotting against shear, the highestrolling speed delivers the steepest slope which shouldtend towards G1. With decreasing rolling speeds, theviscous relaxation becomes more and more prominentdue to the extended passage times through the contactand hence the slope declines. An iterative approach tofind the best fit to the measured slopes in the vicinity ofthe origin for all three rolling speeds investigatedresulted in G1¼ 230MPa and � ¼ 0:03 MPas.
From the initial slope at 12m/s and Dyson’s approx-imation of G1 as about four times �l,
7 a value around230MPa would indeed be a good estimate. However,according to laboratory measurements by differentauthors,2,26–28 the real shear modulus should be muchhigher, up to more than 2GPa. Also, the chosen vis-cosity is far below the range indicated by the extrapo-lation of laboratory measurements according toTait–Doolittle. Therefore, as stated above, one should
Figure 20. Comparison between experimental results and calculations based on the Bair–Winer model for mineral oil 2 at rolling
speeds of 2, 5 and 12 m/s when plotted against the mean shear strain in the contact.
Figure 21. Comparison between experimental results and calculations based on the Bair–Winer model for mineral oil 2 at rolling
speeds of 2, 5 and 12 m/s when plotted against the mean shear rate in the contact.
Poll and Wang 495
be careful to interpret the selected set of parameters astrue fluid properties. Shear thinning may well have anoticeable influence.
In a next step, identical values for shear modulusand viscosity were implemented into the Bair–Winermodel for each speed together with �l values takenfrom Figure 7(a), that means, different for each speed.The results were treated like a constitutive model forthe fluid and then applied to the rolling contact in thetwo-disc machine in an attempt to reproduce the mea-sured traction curves.
With the selected parameter set, the Bair–Winer rela-tion was able to reproduce the slope of all measuredtraction curves around the origin by setting � equal to��, respectively � equal to �� in the contact (Figures 16, 17and 19). With increasing shear, respectively, shear stres-ses the slopes of the measured curves become less steepand the limiting values �l are reached at larger shearvalues than with the formula. However, the formula issupposed to give the real relationship for the fluidwhich can be locally applied, whereas the measure-ments represent an averaged shear stress as a functionof average shear in the contact. When defining �� as theshear in the middle of the contact, the minimum shearat the inlet will be 0 and the maximum shear at theoutlet 2 ��, if one assumes constant film thickness andrelative tangential velocity throughout the contact(Figure 13). Therefore, the limiting shear stresses willnot be reached at all points of the contact area at thesame time. If the assumption of a sensible contributionof elastic shear strain would hold true for the entirecontact, infinitely high slip values would be requiredto reach the limiting stress at the inlet to the contact,
as shear strain always starts from zero and increasesduring the passage of the contact. As a first approxi-mation, one may integrate � over the interval from 0 to2 �� in order to obtain the corresponding ��, in rollingcontact (Figure 18)
�� ��ð Þ ¼1
2 ��
Z2 ��
0
� �ð Þd� ð16Þ
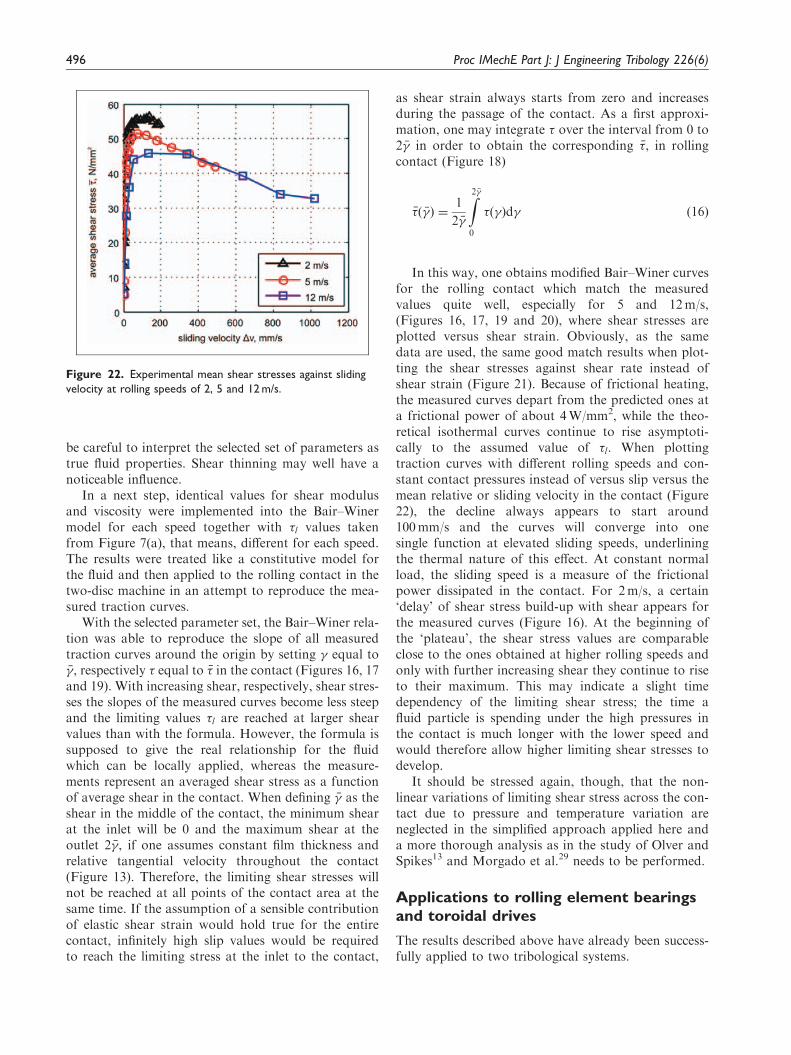
In this way, one obtains modified Bair–Winer curvesfor the rolling contact which match the measuredvalues quite well, especially for 5 and 12m/s,(Figures 16, 17, 19 and 20), where shear stresses areplotted versus shear strain. Obviously, as the samedata are used, the same good match results when plot-ting the shear stresses against shear rate instead ofshear strain (Figure 21). Because of frictional heating,the measured curves depart from the predicted ones ata frictional power of about 4W/mm2, while the theo-retical isothermal curves continue to rise asymptoti-cally to the assumed value of �l. When plottingtraction curves with different rolling speeds and con-stant contact pressures instead of versus slip versus themean relative or sliding velocity in the contact (Figure22), the decline always appears to start around100mm/s and the curves will converge into onesingle function at elevated sliding speeds, underliningthe thermal nature of this effect. At constant normalload, the sliding speed is a measure of the frictionalpower dissipated in the contact. For 2m/s, a certain‘delay’ of shear stress build-up with shear appears forthe measured curves (Figure 16). At the beginning ofthe ‘plateau’, the shear stress values are comparableclose to the ones obtained at higher rolling speeds andonly with further increasing shear they continue to riseto their maximum. This may indicate a slight timedependency of the limiting shear stress; the time afluid particle is spending under the high pressures inthe contact is much longer with the lower speed andwould therefore allow higher limiting shear stresses todevelop.
It should be stressed again, though, that the non-linear variations of limiting shear stress across the con-tact due to pressure and temperature variation areneglected in the simplified approach applied here anda more thorough analysis as in the study of Olver andSpikes13 and Morgado et al.29 needs to be performed.
Applications to rolling element bearingsand toroidal drives
The results described above have already been success-fully applied to two tribological systems.
Figure 22. Experimental mean shear stresses against sliding
velocity at rolling speeds of 2, 5 and 12 m/s.
496 Proc IMechE Part J: J Engineering Tribology 226(6)
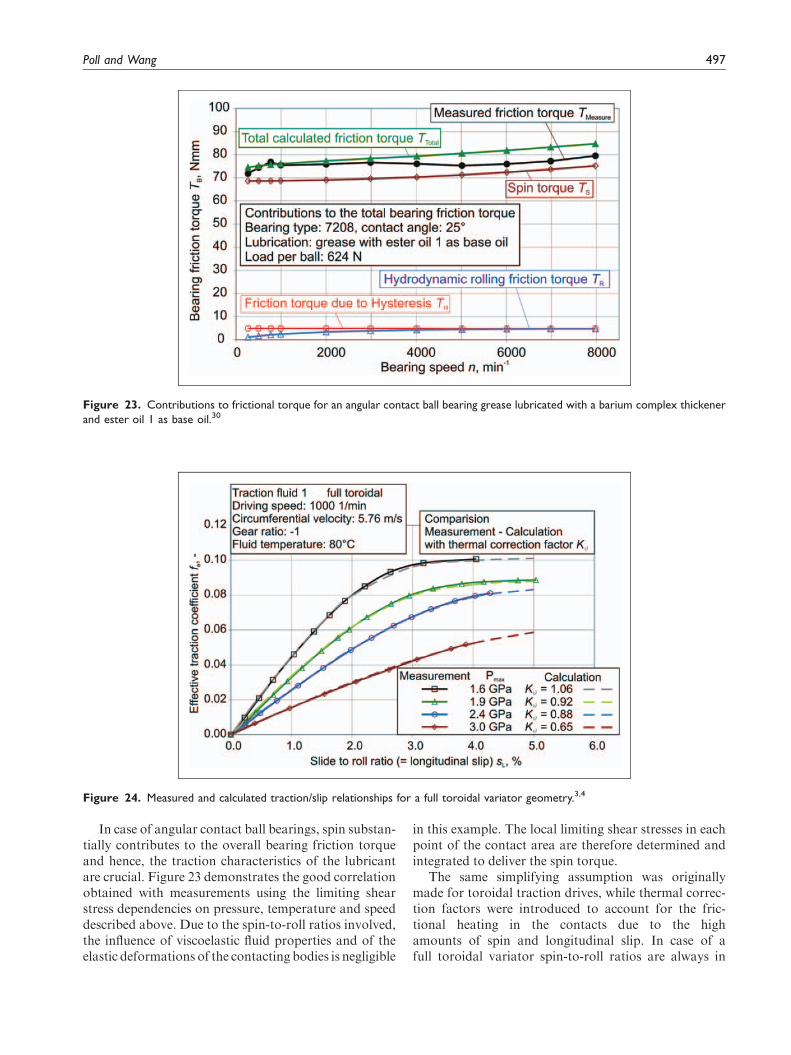
In case of angular contact ball bearings, spin substan-tially contributes to the overall bearing friction torqueand hence, the traction characteristics of the lubricantare crucial. Figure 23 demonstrates the good correlationobtained with measurements using the limiting shearstress dependencies on pressure, temperature and speeddescribed above. Due to the spin-to-roll ratios involved,the influence of viscoelastic fluid properties and of theelastic deformations of the contacting bodies is negligible
in this example. The local limiting shear stresses in eachpoint of the contact area are therefore determined andintegrated to deliver the spin torque.
The same simplifying assumption was originallymade for toroidal traction drives, while thermal correc-tion factors were introduced to account for the fric-tional heating in the contacts due to the highamounts of spin and longitudinal slip. In case of afull toroidal variator spin-to-roll ratios are always in
Figure 23. Contributions to frictional torque for an angular contact ball bearing grease lubricated with a barium complex thickener
and ester oil 1 as base oil.30
Figure 24. Measured and calculated traction/slip relationships for a full toroidal variator geometry.3,4
Poll and Wang 497
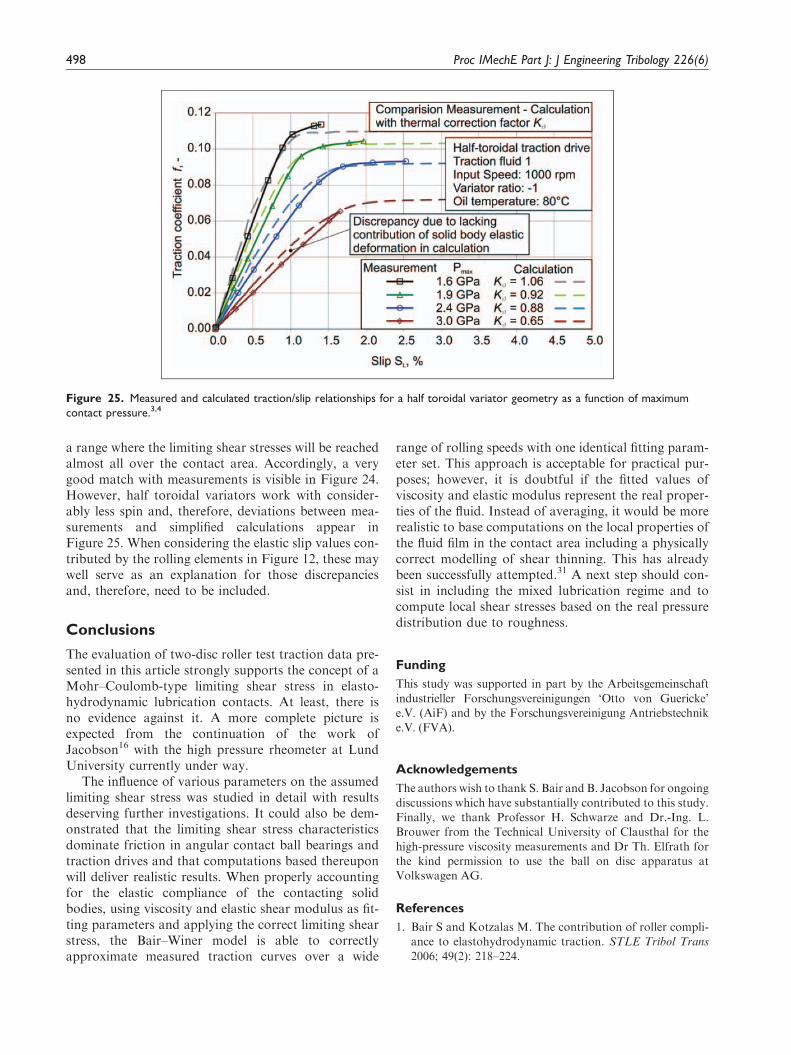
a range where the limiting shear stresses will be reachedalmost all over the contact area. Accordingly, a verygood match with measurements is visible in Figure 24.However, half toroidal variators work with consider-ably less spin and, therefore, deviations between mea-surements and simplified calculations appear inFigure 25. When considering the elastic slip values con-tributed by the rolling elements in Figure 12, these maywell serve as an explanation for those discrepanciesand, therefore, need to be included.
Conclusions
The evaluation of two-disc roller test traction data pre-sented in this article strongly supports the concept of aMohr–Coulomb-type limiting shear stress in elasto-hydrodynamic lubrication contacts. At least, there isno evidence against it. A more complete picture isexpected from the continuation of the work ofJacobson16 with the high pressure rheometer at LundUniversity currently under way.
The influence of various parameters on the assumedlimiting shear stress was studied in detail with resultsdeserving further investigations. It could also be dem-onstrated that the limiting shear stress characteristicsdominate friction in angular contact ball bearings andtraction drives and that computations based thereuponwill deliver realistic results. When properly accountingfor the elastic compliance of the contacting solidbodies, using viscosity and elastic shear modulus as fit-ting parameters and applying the correct limiting shearstress, the Bair–Winer model is able to correctlyapproximate measured traction curves over a wide
range of rolling speeds with one identical fitting param-eter set. This approach is acceptable for practical pur-poses; however, it is doubtful if the fitted values ofviscosity and elastic modulus represent the real proper-ties of the fluid. Instead of averaging, it would be morerealistic to base computations on the local properties ofthe fluid film in the contact area including a physicallycorrect modelling of shear thinning. This has alreadybeen successfully attempted.31 A next step should con-sist in including the mixed lubrication regime and tocompute local shear stresses based on the real pressuredistribution due to roughness.
Funding
This study was supported in part by the Arbeitsgemeinschaft
industrieller Forschungsvereinigungen ‘Otto von Guericke’e.V. (AiF) and by the Forschungsvereinigung Antriebstechnike.V. (FVA).
Acknowledgements
The authors wish to thank S. Bair and B. Jacobson for ongoing
discussions which have substantially contributed to this study.Finally, we thank Professor H. Schwarze and Dr.-Ing. L.Brouwer from the Technical University of Clausthal for the
high-pressure viscosity measurements and Dr Th. Elfrath forthe kind permission to use the ball on disc apparatus atVolkswagen AG.
References
1. Bair S and Kotzalas M. The contribution of roller compli-ance to elastohydrodynamic traction. STLE Tribol Trans
2006; 49(2): 218–224.
Figure 25. Measured and calculated traction/slip relationships for a half toroidal variator geometry as a function of maximum
contact pressure.3,4
498 Proc IMechE Part J: J Engineering Tribology 226(6)
2. Bair S. High pressure rheology for quantitative elasto-hydrodynamics. Tribology and Interface EngineeringSeries, No. 54. Amsterdam, The Netherlands:
Elsevier, 2007.3. Poll G and Meyer C. Rheology model for traction fluids
used in toroidal traction drives. In: Proceedings ofthe CVT-hybrid international conference, Maastricht,
Eindhoven University of Technology, AutomotiveTechnology Centre, Eindhoven, The Netherlands, 17–19November 2010, pp.61–66.
4. Meyer C. Reibung in hoch belasteten EHD-Walzkontakten. PhD Thesis, Leibniz UniversitatHannover, 2010.
5. Plint MA. Traction in elastohydrodynamic contacts. ProcInstn Mech Engrs 1967; 182(14, Pt. 1): 300–306.
6. Johnson KL and Cameron R. Shear behavior of elasto-
hydrodynamic oil films at high rolling contact pressures.Proc Instn Mech Engrs 1967; 182(14, Pt. 1): 307–319.
7. Dyson A. Frictional traction and lubrication rheology inelastohydrodynamic lubrication. Philos Trans R Soc
London Ser A 1970; 266: 1–33.8. Eyring H. Viscosity, plasticity and diffusion as examples
of reaction rates. J Chem Phys 1936; 4: 283–291.
9. Tevaarwerk JL and Johnson KL. Shear behaviour ofelastohydrodynamic oil films. Proc R Soc London Ser A1977; 356(1685): 215–236.
10. Bair S and Winer WO. The high shear stress rheology ofliquid lubricants at pressures of 2 to 200 MPa. ASME JTribol 1990; 112(2): 246–253.
11. Carter FJ. On the action of a locomotive driving wheel.
Proc R Soc London Ser A 1926; 112: 151–157.12. Poll G. Der Einfluss der realen Systemeigenschaften auf
die Kraftschlussgesetze bei walzender Relativbewegung.
PhD Thesis, Rheinisch-Westfalische TechnischeHochschule Aachen, 1983.
13. Olver AV and Spikes HA. Prediction of traction in elas-
tohydrodynamic lubrication. Proc IMechE Part J: JEngineering Tribology 1998; 212: 321–332.
14. Tevaarwerk JL. Traction in lubricated contacts. In:
Proceedings of the contact mechanics and wear of rail/wheel systems, Vancouver, Canada, 6–9 July 1982,pp.121–132. Waterloo, Canada: University of WaterlooPress.
15. Evans CR and Johnson KL. The rheological properties ofelastohydrodynamic lubricants. Proc IMechE Part C: JMechanical Engineering Science 1986; 200(5): 303–312.
16. Jacobson BO. High-pressure chamber measurements.Proc IMechE Part J: J Engineering Tribology 2006;220(3): 199–206.
17. Hamrock BJ. Fundamentals of fluid film lubrication, 2nded. New York: Dekker, 2004.
18. Bode B. Entwicklung eines Quarzviskosimeters furMessungen bei hohen Drucken. TU Clausthal, Tribologie
und Schmierungstechnik, 35. Jahrgang, Heft 5, 1988.19. Hirschfelder JO, Curtiss CF and Bird RB.
Molecular theory of gases and liquids. New York: Wiley,
1954, p.261.20. Doolittle AK. Studies in Newtonian flow. II. The depen-
dence of viscosity of liquids on free space. J Appl Phys
1951; 22(12): 1471–1475.
21. Barus C. Isothermals, isopiestics and isometrics relativeto viscosity. Am J Sci 1893; 45(266): 87–96.
22. Walbeck T. Das Viskositatsverhalten und dieSchmierfilmbildung von Schmierstoffen in Abhangigkeitvon Druck und Temperatur. PhD Thesis, Technische
Hochschule Aachen, 2004.
23. Bowden PB. The yield behavior of glassy polymers.
In: RN Haward (ed.) The physics of glassy polymers.New York, NY: Halstead Press, 1973, pp.279–339.
24. Bair S and McCabe C. A study of mechanical shearbands in liquids at high pressure. Tribol Int 2004; 37:783–789.
25. Carreau PJ. Rheological equations from molecular net-work theories. Trans Soc Rheol 1972; 16(1): 99–127.
26. Hutton JF and Philips MC. Shear modulus of liquids atelastohydrodynamic pressures. Nat Phys Sci 1972; 238:
141–142.
27. Barlow AJ, Harrison G, Irving JB, et al. The effect ofpressure on the viscoelastic properties of liquids. Proc RSoc London Ser A 1972; 327: 403–412.
28. Hutton JF. Reassessment of rheological properties ofLVI 260. ASME J Lubr Technol 1984; 106: 536–537.
29. Morgado PL, Otero JE, Munoz Sanz JL, et al. Modelsfor predicting friction coefficient and parameters with
influence in elastohydrodynamic lubrication. ProcIMechE Part J: J Engineering Tribology 2009; 223:949–958.
30. Poll G, Wang D and Neubauer T. Walzlager-Reib-momente unter Berucksichtigung der Schmierstoff-
Rheologie und Versorgung. In: Gleit- und Walzlagerungen.Dusseldorf: VDI-Verlag GmbH, 2011, VDI-Bericht,No. 2147, pp.125–146.
31. Habchi W, Vergne P, Bair S, et al. Influence of pressureand temperature dependence of thermal properties of a
lubricant on the behaviour of circular TEHD contacts.Tribol Int 2010; 43: 1842–1850.
Appendix
Notation
a semi-major axis of the Hertzian contact
ellipseA areab semi-minor axis of the Hertzian contact
ellipsef friction coefficientfC Coulomb friction coefficientfmax limiting friction coefficientFN normal forceFt traction forceG elastic shear modulus of a solidG1 limiting elastic shear modulus of a fluidhc central lubricant film thicknessK� thermal correction factorp contact pressure�p mean contact pressurepmax maximum pressure
Poll and Wang 499
Ra centreline averaged roughnesss displacementSL slide-to-roll ratiot timeT torquev rolling velocityz dimension z-axis
p,2000 viscosity pressure coefficient at 2000 bar� shear strain�elastic elastic shear strain in Maxwell model of an
elastic-visco fluid�viscous viscous shear strain in Maxwell model of an
elastic-visco fluid�total total shear strain in Maxwell model of an
elastic-visco fluid
�� average shear strain_� shear rate_� average shear rate" elastic strain� dynamic viscosity�0 dynamic viscosity at atmospheric pressure� temperature� film thickness parameter� Poisson’s ratio root mean square roughness� shear stress�� average shear stress�0 Eyring shear stress�L limiting shear stress��L average limiting shear stress’ angle
500 Proc IMechE Part J: J Engineering Tribology 226(6)