Embed Size (px)
Citation preview
If H6c.i-
QsbjL !w»*-J
Formation Water Chemistry andModeling of Fluid-Rock Interaction for
Improved Oil Recovery in Aux Vasesand Cypress Formations, Illinois Basin
llham Demir
Illinois Petroleum 148
1995
Department of Energy and Natural ResourcesILLINOIS STATE GEOLOGICAL SURVEY
&*v^ 4$
w &ov

ILLINOIS STATE GEOLOGICAL SURVEY
3 3051 00005 5586
Formation Water Chemistry andModeling of Fluid-Rock Interaction for
Improved Oil Recovery in Aux Vasesand Cypress Formations, Illinois Basin
llham Demir
Illinois Petroleum 148
1995
ILLINOIS STATE GEOLOGICAL SURVEYJonathan H. Goodwin, Acting Chief
Natural Resources Building
615 East Peabody Drive
Champaign, Illinois 61820-6964
rf»
DISCLAIMER
This report was prepared by the Illinois State Geological Survey (ISGS) for a project
sponsored by the State of Illinois and the U.S. Department of Energy (USDOE). It
presents reasonable interpretations of available scientific data. Any opinions, find-
ings, conclusions, or recommendations expressed herein are those of the author
and do not necessarily reflect the views of the USDOE. Neither the ISGS, any
member of the ISGS staff, the Illinois Department of Energy and Natural Resources
(ENR), nor the USDOE assumes any liability with respect to the use, or for any
damages resulting from the use, of any information contained in this report. Use of
trademarks and brand names in this report does not constitute endorsement of any
product by the ISGS, ENR, or USDOE.
Editor— E. Anne Latimer
Graphic Artist — Michael W. KnappGraphic Artist— Vicki Reinhart
Printed by the authority of the State of Illinois/1995/1000
printed with soybean ink on recycled paper
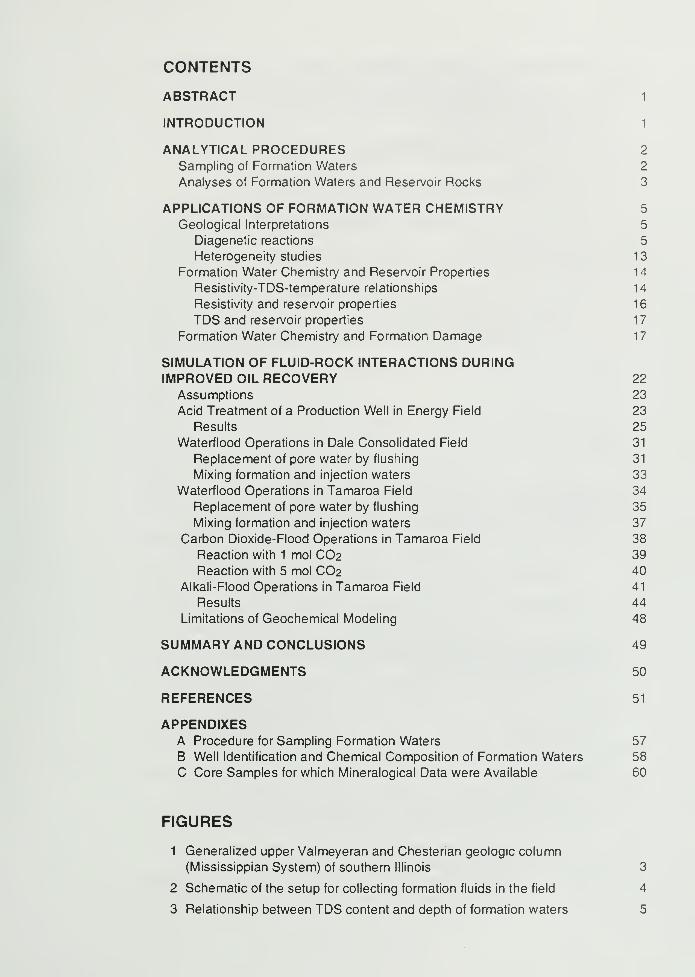
CONTENTS
ABSTRACT 1
INTRODUCTION 1
ANALYTICAL PROCEDURES 2
Sampling of Formation Waters 2
Analyses of Formation Waters and Reservoir Rocks 3
APPLICATIONS OF FORMATION WATER CHEMISTRY 5
Geological Interpretations 5
Diagenetic reactions 5
Heterogeneity studies 13
Formation Water Chemistry and Reservoir Properties 14
Resistivity-TDS-temperature relationships 14
Resistivity and reservoir properties 16
TDS and reservoir properties 17
Formation Water Chemistry and Formation Damage 17
SIMULATION OF FLUID-ROCK INTERACTIONS DURINGIMPROVED OIL RECOVERY 22
Assumptions 23
Acid Treatment of a Production Well in Energy Field 23
Results 25
Waterflood Operations in Dale Consolidated Field 31
Replacement of pore water by flushing 31
Mixing formation and injection waters 33
Waterflood Operations in Tamaroa Field 34
Replacement of pore water by flushing 35
Mixing formation and injection waters 37
Carbon Dioxide-Flood Operations in Tamaroa Field 38
Reaction with 1 mol CO2 39
Reaction with 5 mol CO2 40
Alkali-Flood Operations in Tamaroa Field 41
Results 44
Limitations of Geochemical Modeling 48
SUMMARY AND CONCLUSIONS 49
ACKNOWLEDGMENTS 50
REFERENCES 51
APPENDIXESA Procedure for Sampling Formation Waters 57
B Well Identification and Chemical Composition of Formation Waters 58
C Core Samples for which Mineralogical Data were Available 60
FIGURES
1 Generalized upper Valmeyeran and Chesterian geologic column
(Mississippian System) of southern Illinois 3
2 Schematic of the setup for collecting formation fluids in the field 4
3 Relationship between TDS content and depth of formation waters 5
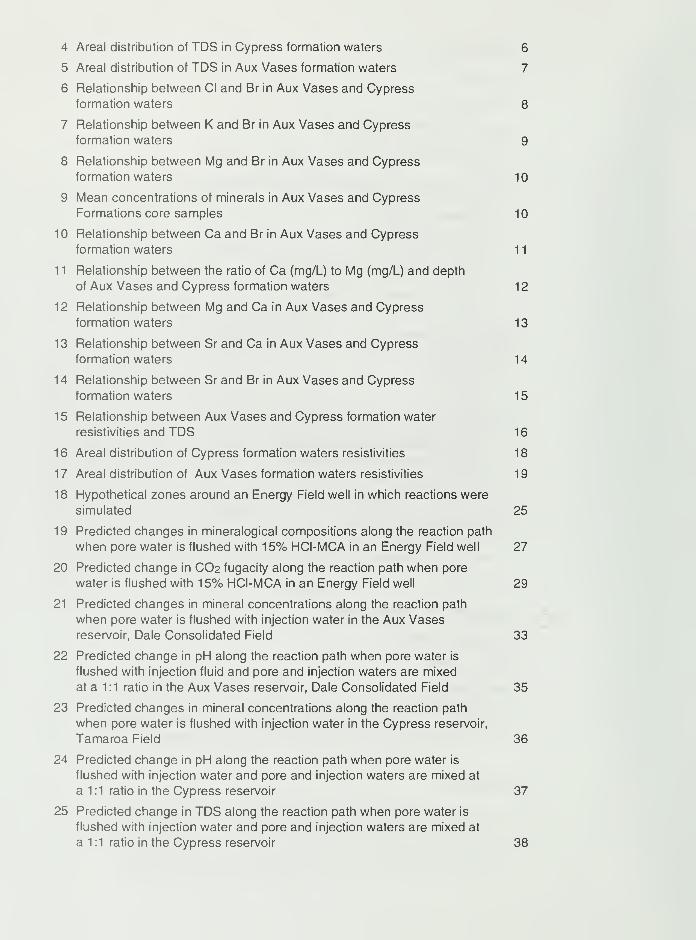
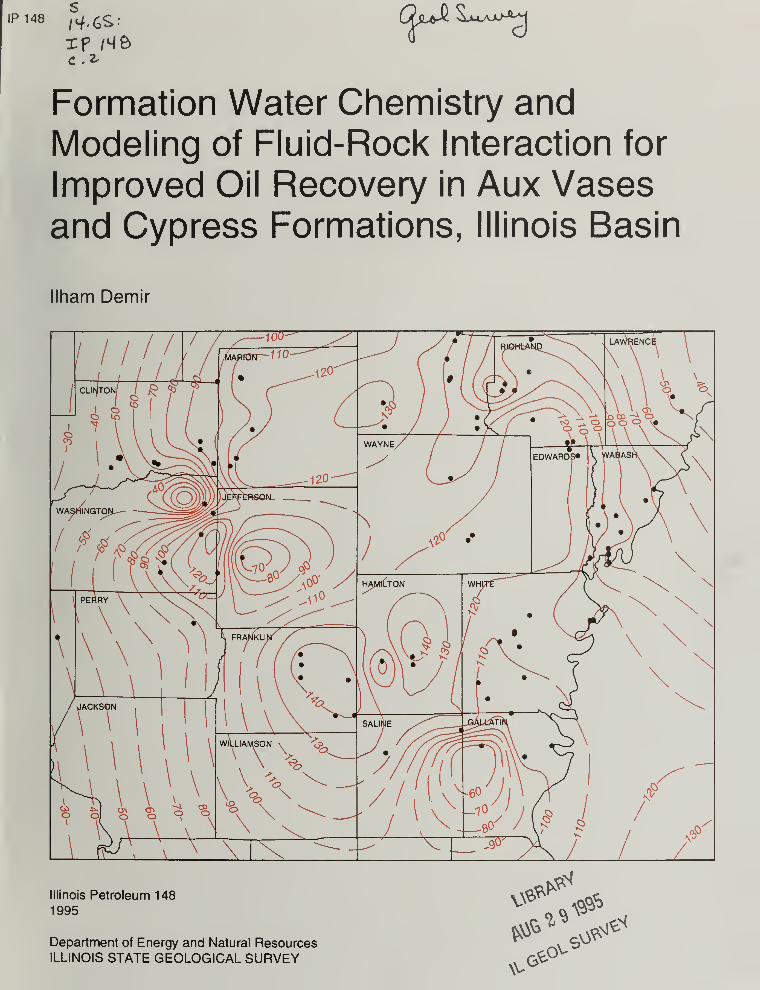
4 Areal distribution of TDS in Cypress formation waters 6
5 Areal distribution of TDS in Aux Vases formation waters 7
6 Relationship between CI and Br in Aux Vases and Cypress
formation waters 8
7 Relationship between K and Br in Aux Vases and Cypress
formation waters 9
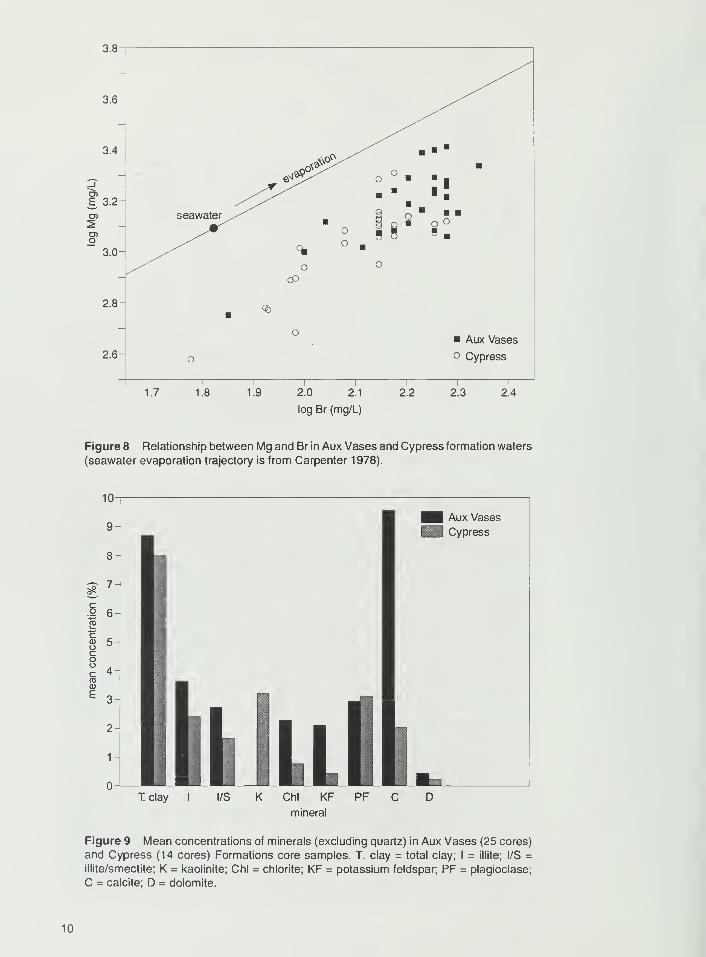
8 Relationship between Mg and Br in Aux Vases and Cypress
formation waters 10
9 Mean concentrations of minerals in Aux Vases and Cypress
Formations core samples 10
10 Relationship between Ca and Br in Aux Vases and Cypress
formation waters 11
1
1
Relationship between the ratio of Ca (mg/L) to Mg (mg/L) and depth
of Aux Vases and Cypress formation waters 12
12 Relationship between Mg and Ca in Aux Vases and Cypress
formation waters 13
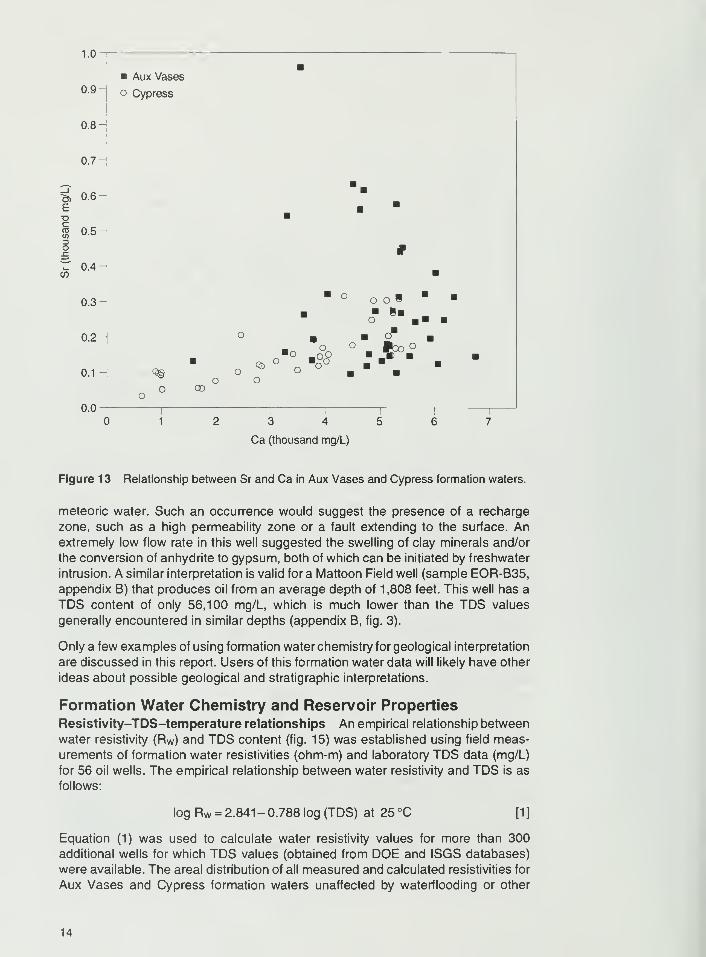
13 Relationship between Sr and Ca in Aux Vases and Cypress
formation waters 14
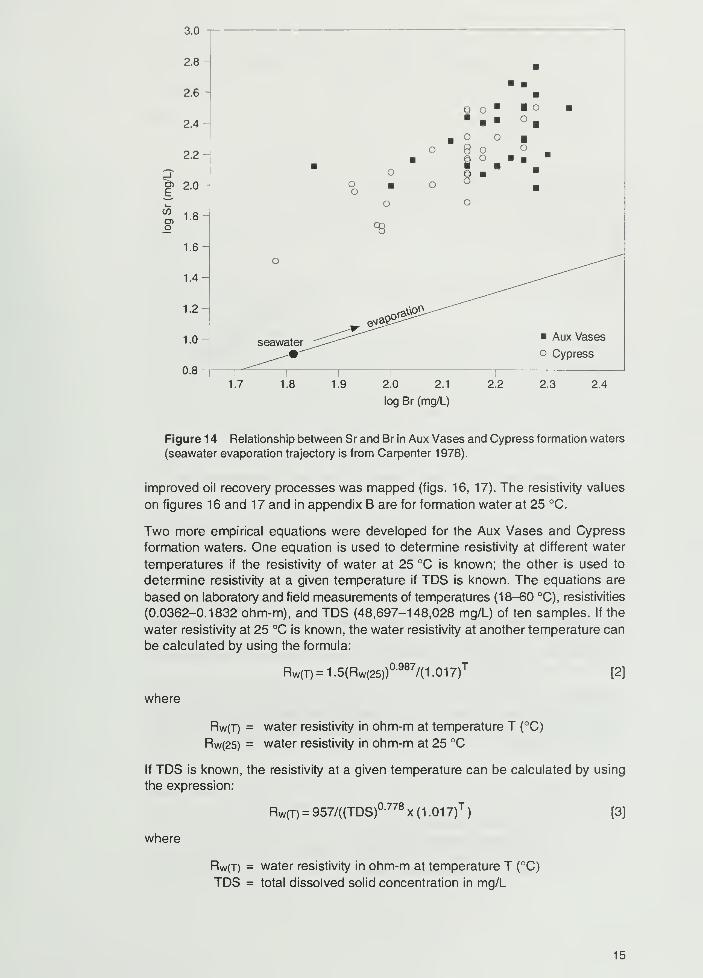
14 Relationship between Sr and Br in Aux Vases and Cypress
formation waters 15
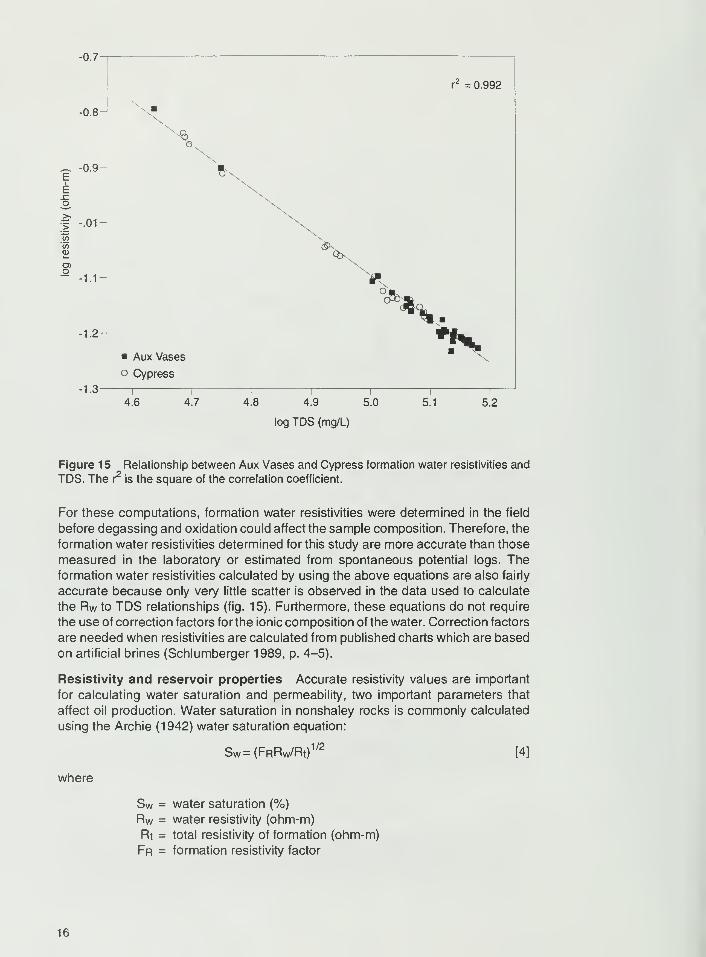
15 Relationship between Aux Vases and Cypress formation water
resistivities and TDS 16
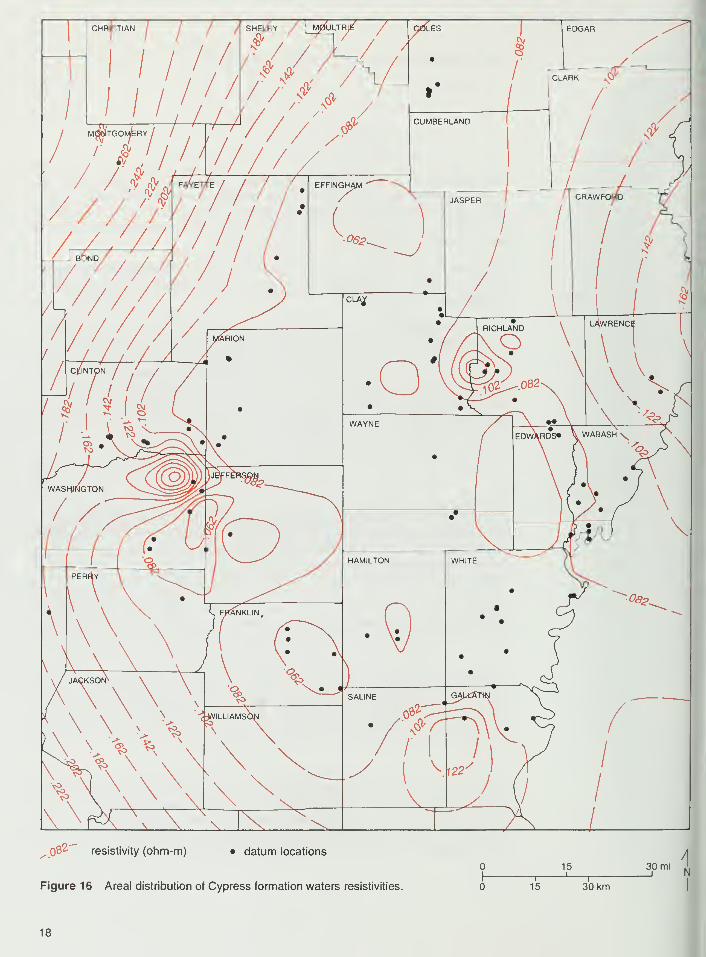
16 Areal distribution of Cypress formation waters resistivities 18
17 Areal distribution of Aux Vases formation waters resistivities 19
18 Hypothetical zones around an Energy Field well in which reactions were
simulated 25
19 Predicted changes in mineralogical compositions along the reaction path
when pore water is flushed with 15% HCI-MCA in an Energy Field well 27
20 Predicted change in CO2 fugacity along the reaction path when pore
water is flushed with 15% HCI-MCA in an Energy Field well 29
21 Predicted changes in mineral concentrations along the reaction path
when pore water is flushed with injection water in the Aux Vasesreservoir, Dale Consolidated Field 33
22 Predicted change in pH along the reaction path when pore water is
flushed with injection fluid and pore and injection waters are mixed
at a 1 :1 ratio in the Aux Vases reservoir, Dale Consolidated Field 35
23 Predicted changes in mineral concentrations along the reaction path
when pore water is flushed with injection water in the Cypress reservoir,
Tamaroa Field 36
24 Predicted change in pH along the reaction path when pore water is
flushed with injection water and pore and injection waters are mixed at
a 1 :1 ratio in the Cypress reservoir 37
25 Predicted change in TDS along the reaction path when pore water is
flushed with injection water and pore and injection waters are mixed at
a 1 :1 ratio in the Cypress reservoir 38
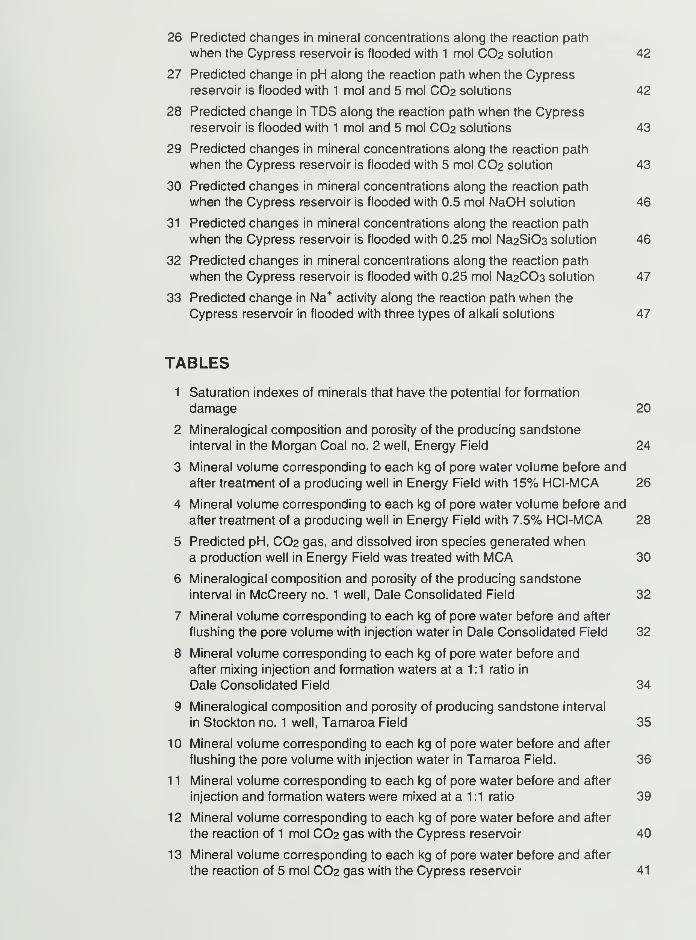
26 Predicted changes in mineral concentrations along the reaction path
when the Cypress reservoir is flooded with 1 mol CO2 solution 42
27 Predicted change in pH along the reaction path when the Cypress
reservoir is flooded with 1 mol and 5 mol CO2 solutions 42
28 Predicted change in TDS along the reaction path when the Cypress
reservoir is flooded with 1 mol and 5 mol CO2 solutions 43
29 Predicted changes in mineral concentrations along the reaction path
when the Cypress reservoir is flooded with 5 mol CO2 solution 43
30 Predicted changes in mineral concentrations along the reaction path
when the Cypress reservoir is flooded with 0.5 mol NaOH solution 46
31 Predicted changes in mineral concentrations along the reaction path
when the Cypress reservoir is flooded with 0.25 mol Na2Si03 solution 46
32 Predicted changes in mineral concentrations along the reaction path
when the Cypress reservoir is flooded with 0.25 mol Na2C03 solution 47
33 Predicted change in Na+activity along the reaction path when the
Cypress reservoir in flooded with three types of alkali solutions 47
TABLES
1 Saturation indexes of minerals that have the potential for formation
damage 20
2 Mineralogical composition and porosity of the producing sandstone
interval in the Morgan Coal no. 2 well, Energy Field 24
3 Mineral volume corresponding to each kg of pore water volume before and
after treatment of a producing well in Energy Field with 15% HCI-MCA 26
4 Mineral volume corresponding to each kg of pore water volume before and
after treatment of a producing well in Energy Field with 7.5% HCI-MCA 28
5 Predicted pH, CO2 gas, and dissolved iron species generated whena production well in Energy Field was treated with MCA 30
6 Mineralogical composition and porosity of the producing sandstone
interval in McCreery no. 1 well, Dale Consolidated Field 32
7 Mineral volume corresponding to each kg of pore water before and after
flushing the pore volume with injection water in Dale Consolidated Field 32
8 Mineral volume corresponding to each kg of pore water before and
after mixing injection and formation waters at a 1:1 ratio in
Dale Consolidated Field 34
9 Mineralogical composition and porosity of producing sandstone interval
in Stockton no. 1 well, Tamaroa Field 35
10 Mineral volume corresponding to each kg of pore water before and after
flushing the pore volume with injection water in Tamaroa Field. 36
1
1
Mineral volume corresponding to each kg of pore water before and after
injection and formation waters were mixed at a 1 :1 ratio 39
12 Mineral volume corresponding to each kg of pore water before and after
the reaction of 1 mol CO2 gas with the Cypress reservoir 40
13 Mineral volume corresponding to each kg of pore water before and after
the reaction of 5 mol CO2 gas with the Cypress reservoir 41

14 Mineral volume corresponding to each kg of pore water before and after
the reaction of 0.5 mol NaOH solution with the Cypress reservoir 44
15 Mineral volume corresponding to each kg of pore water before and after
the reaction of 0.25 mol Na2Si03 solution with the Cypress reservoir 45
16 Mineral volume corresponding to each kg of pore water before and after
the reaction of 0.25 mol Na2C03 solution with the Cypress reservoir 48
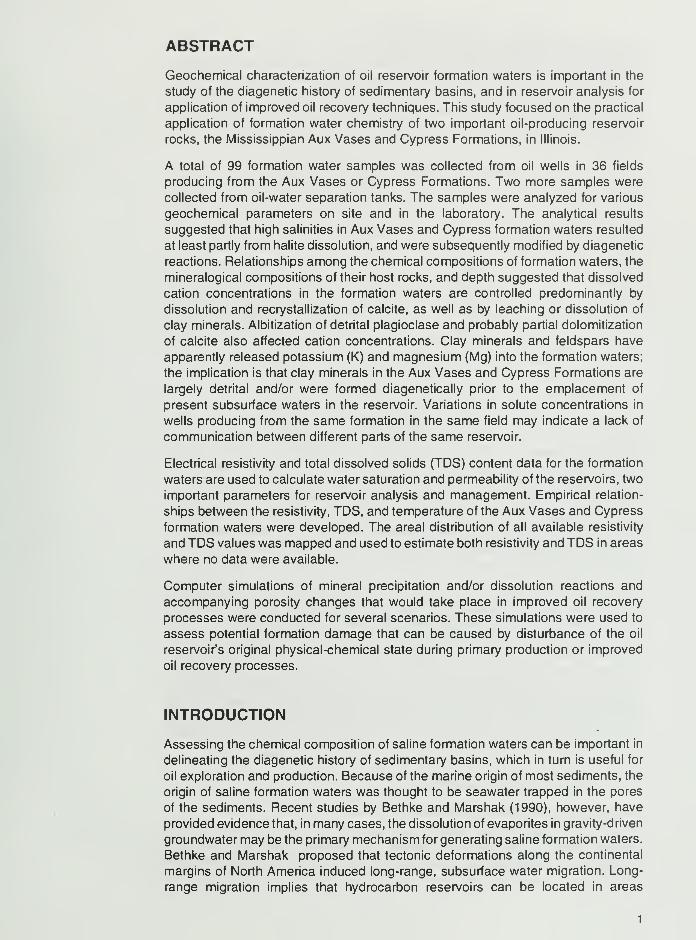
ABSTRACT
Geochemical characterization of oil reservoir formation waters is important in the
study of the diagenetic history of sedimentary basins, and in reservoir analysis for
application of improved oil recovery techniques. This study focused on the practical
application of formation water chemistry of two important oil-producing reservoir
rocks, the Mississippian Aux Vases and Cypress Formations, in Illinois.
A total of 99 formation water samples was collected from oil wells in 36 fields
producing from the Aux Vases or Cypress Formations. Two more samples were
collected from oil-water separation tanks. The samples were analyzed for various
geochemical parameters on site and in the laboratory. The analytical results
suggested that high salinities in Aux Vases and Cypress formation waters resulted
at least partly from halite dissolution, and were subsequently modified by diagenetic
reactions. Relationships among the chemical compositions of formation waters, the
mineralogical compositions of their host rocks, and depth suggested that dissolved
cation concentrations in the formation waters are controlled predominantly by
dissolution and recrystallization of calcite, as well as by leaching or dissolution of
clay minerals. Albitization of detrital plagioclase and probably partial dolomitization
of calcite also affected cation concentrations. Clay minerals and feldspars have
apparently released potassium (K) and magnesium (Mg) into the formation waters;
the implication is that clay minerals in the Aux Vases and Cypress Formations are
largely detrital and/or were formed diagenetically prior to the emplacement of
present subsurface waters in the reservoir. Variations in solute concentrations in
wells producing from the same formation in the same field may indicate a lack of
communication between different parts of the same reservoir.
Electrical resistivity and total dissolved solids (TDS) content data for the formation
waters are used to calculate water saturation and permeability of the reservoirs, two
important parameters for reservoir analysis and management. Empirical relation-
ships between the resistivity, TDS, and temperature of the Aux Vases and Cypress
formation waters were developed. The areal distribution of all available resistivity
and TDS values was mapped and used to estimate both resistivity and TDS in areas
where no data were available.
Computer simulations of mineral precipitation and/or dissolution reactions and
accompanying porosity changes that would take place in improved oil recovery
processes were conducted for several scenarios. These simulations were used to
assess potential formation damage that can be caused by disturbance of the oil
reservoir's original physical-chemical state during primary production or improved
oil recovery processes.
INTRODUCTION
Assessing the chemical composition of saline formation waters can be important in
delineating the diagenetic history of sedimentary basins, which in turn is useful for
oil exploration and production. Because of the marine origin of most sediments, the
origin of saline formation waters was thought to be seawater trapped in the pores
of the sediments. Recent studies by Bethke and Marshak (1990), however, have
provided evidence that, in many cases, the dissolution of evaporites in gravity-driven
groundwater may be the primary mechanism for generating saline formation waters.
Bethke and Marshak proposed that tectonic deformations along the continental
margins of North America induced long-range, subsurface water migration. Long-
range migration implies that hydrocarbon reservoirs can be located in areas
1
hundreds of miles away from the source rock. Long-range migration provides
opportunity for the migrating fluids (trapped seawater or meteoric water) to evolve
chemically as a result of reaction with the host sediments and mixing with waters of
different compositions, and as a result of changes in their pressure and temperature
along the migration path. During each process, existing minerals may dissolve and
new ones may precipitate, which can change the porosity and permeability of the
host rocks and leave various chemical signatures in the fluid composition.
Attempts to use the chemical composition of formation waters to infer paleoflow
paths and/or diagenetic reactions have been made by numerous investigators
(Clayton et al. 1966, Graf et al. 1966, Collins 1975, Hitchon et al. 1971, Carpenter
1 978, Frape et al. 1 984, Morton and Land 1 987, Sanders 1 991 , Stueber and Walter
1 991 , Land and Macpherson 1 992, Macpherson 1 992, Moldovanyi and Walter 1 992,
Stueber et al. 1993). Because the chemical composition of formation waters often
reflects the mineralogical composition of their host reservoirs, maps of geochemical
parameters often delineate changes in permeability, lithologic variations, diagenetic
changes and, therefore, possibly identify stratigraphic traps and structural features.
Collins (1 975) reported that petroleum accumulation is often correlated with salinity
transition zones. Moldovanyi and Walter (1992) perhaps summarized the impor-
tance of formation water chemistry best by stating that "a more complete under-
standing of processes active during the evolution of sedimentary basins emerges
when diagenetic studies of sedimentary rocks are integrated to geochemical trends
in subsurface waters."
Knowledge of the formation fluid chemistry can also be used to prevent formation
damage and improve the recovery of oil from existing fields. Differences in the
chemical composition of formation fluid from different wells within a reservoir in the
same field can indicate mineralogical heterogeneity or lack of communication, and
thus help in delineating separate flow units within a reservoir. Formation water
chemistry can be used to determine whether injection water has reached a produc-
ing well during secondary oil recovery. Mineral precipitation and dissolution reac-
tions that occur in reservoirs as a result of water, alkali, and C02-floodings, acidizing,
and other enhanced oil recovery processes can be investigated by using geochemi-
cal data as input for geochemical modeling.
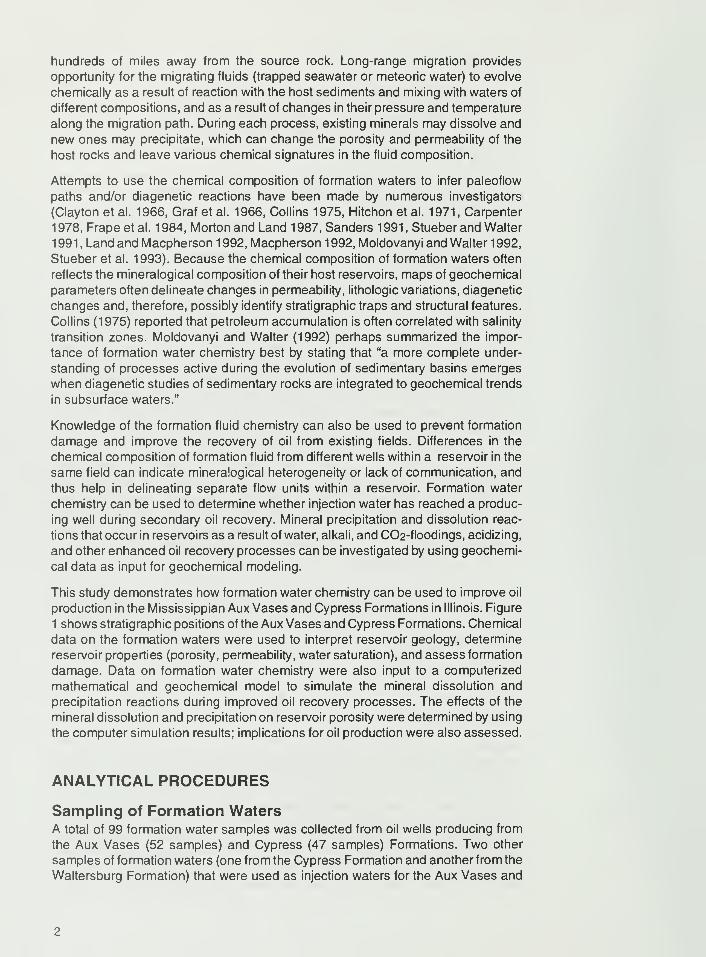
This study demonstrates how formation water chemistry can be used to improve oil
production in the Mississippian Aux Vases and Cypress Formations in Illinois. Figure
1 shows stratigraphic positions of the Aux Vases and Cypress Formations. Chemical
data on the formation waters were used to interpret reservoir geology, determine
reservoir properties (porosity, permeability, water saturation), and assess formation
damage. Data on formation water chemistry were also input to a computerized
mathematical and geochemical model to simulate the mineral dissolution and
precipitation reactions during improved oil recovery processes. The effects of the
mineral dissolution and precipitation on reservoir porosity were determined by using
the computer simulation results; implications for oil production were also assessed.
ANALYTICAL PROCEDURES
Sampling of Formation WatersA total of 99 formation water samples was collected from oil wells producing from
the Aux Vases (52 samples) and Cypress (47 samples) Formations. Two other
samples of formation waters (one from the Cypress Formation and another from the
Waltersburg Formation) that were used as injection waters for the Aux Vases and
Fraileys
Beech Creek
Cypress
Ridenhower
Bethel
^Downeys Bluff
Yankeetown
Renault
Aux Vases
Ste. Genevieve
-?
Figure 1 Generalized upper Valmeyeran and Chesterian geologic
column (Mississippian System) of southern Illinois (from Leetaru
1990).
Cypress reservoirs were collected from separation tanks. Each sample is identified
by well API number and field name in appendix B. Arrangements with oil companies
were made to discontinue chemical treatments (corrosion inhibitors, acidizing, etc.)
of the wells at least 4 hrs (usually 24 hrs) before they were sampled. The samples
remained isolated from the atmosphere as much as possible to minimize oxidation
and degassing until they were tested for pH, Eh, and resistivity and processed for
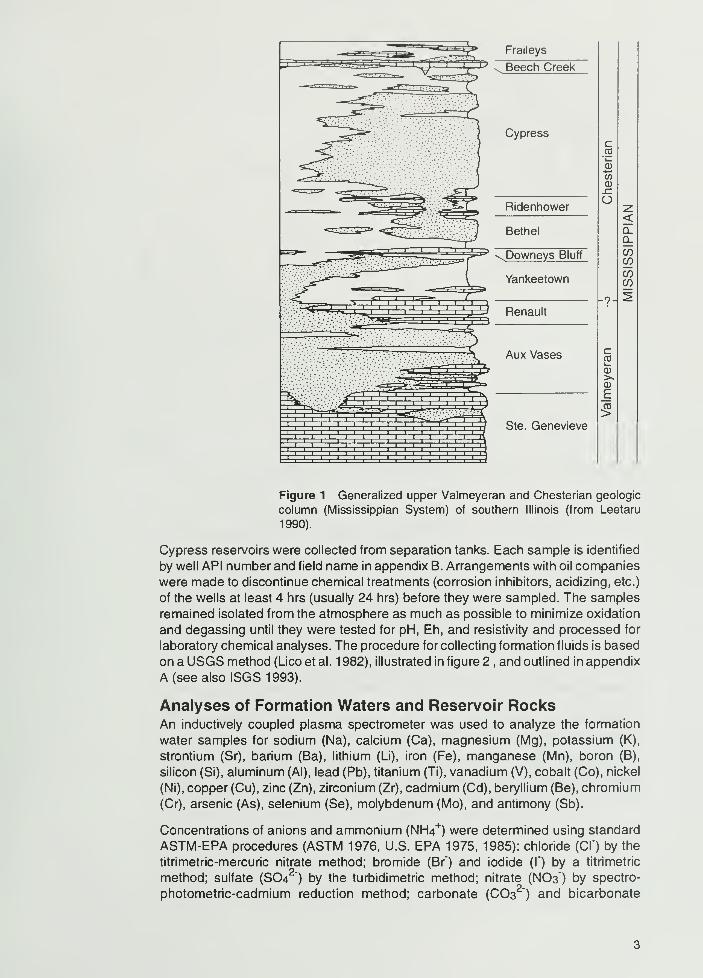
laboratory chemical analyses. The procedure for collecting formation fluids is based
on a USGS method (Lico et al. 1 982), illustrated in figure 2 , and outlined in appendix
A (see also ISGS 1993).
Analyses of Formation Waters and Reservoir RocksAn inductively coupled plasma spectrometer was used to analyze the formation
water samples for sodium (Na), calcium (Ca), magnesium (Mg), potassium (K),
strontium (Sr), barium (Ba), lithium (Li), iron (Fe), manganese (Mn), boron (B),
silicon (Si), aluminum (Al), lead (Pb), titanium (Ti), vanadium (V), cobalt (Co), nickel
(Ni), copper (Cu), zinc (Zn), zirconium (Zr), cadmium (Cd), beryllium (Be), chromium
(Cr), arsenic (As), selenium (Se), molybdenum (Mo), and antimony (Sb).
Concentrations of anions and ammonium (NH4+
) were determined using standard
ASTM-EPA procedures (ASTM 1976, U.S. EPA 1975, 1985): chloride (CI") by the
titrimetric-mercuric nitrate method; bromide (Br") and iodide (I") by a titrimetric
method; sulfate (SO42") by the turbidimetric method; nitrate (NO3") by spectro-
photometric-cadmium reduction method; carbonate (CO32") and bicarbonate
wellhead
separator
(2 gallon carboy)
glass
wool
columno
I jz §Q. LU i O
water sample
ice box lab
1.3 liter
IT"/
multiprobe
monitoring
chamber
Figure 2 Schematic of the setup for collecting formation fluids in the field.
(HCO3") by a titrimetric method; and NH4+by potentiometric-ion selective electrode
method. Details of these methods are in ISGS (1993).
Mineralogical data for the reservoir rocks were determined using X-ray diffraction
techniques (ISGS 1 993). The sources of the core samples analyzed for mineralogi-
cal composition are given in appendix C.
160
140
120
EoI 1003O
COQ
80
60-
Aux Vases
o Cypress
oo
oo oo o o
40i i i i i i i i i
1 1 1 1 1 1
—
0.6 1.0 1.4 1.8 2.2 2.6 3.0 3.4
depth (thousand ft)
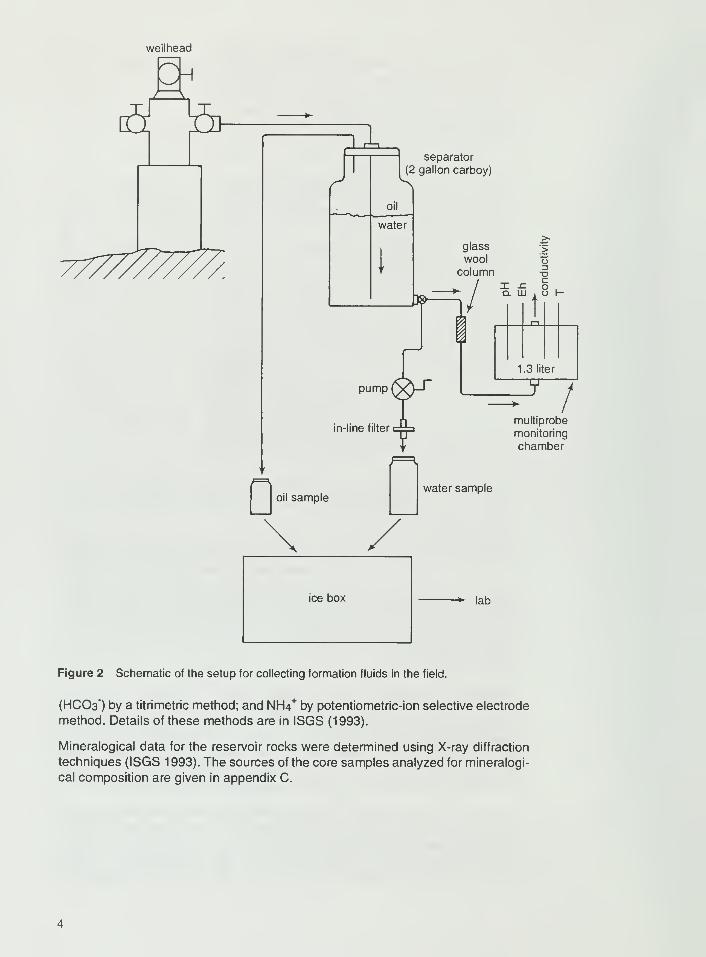
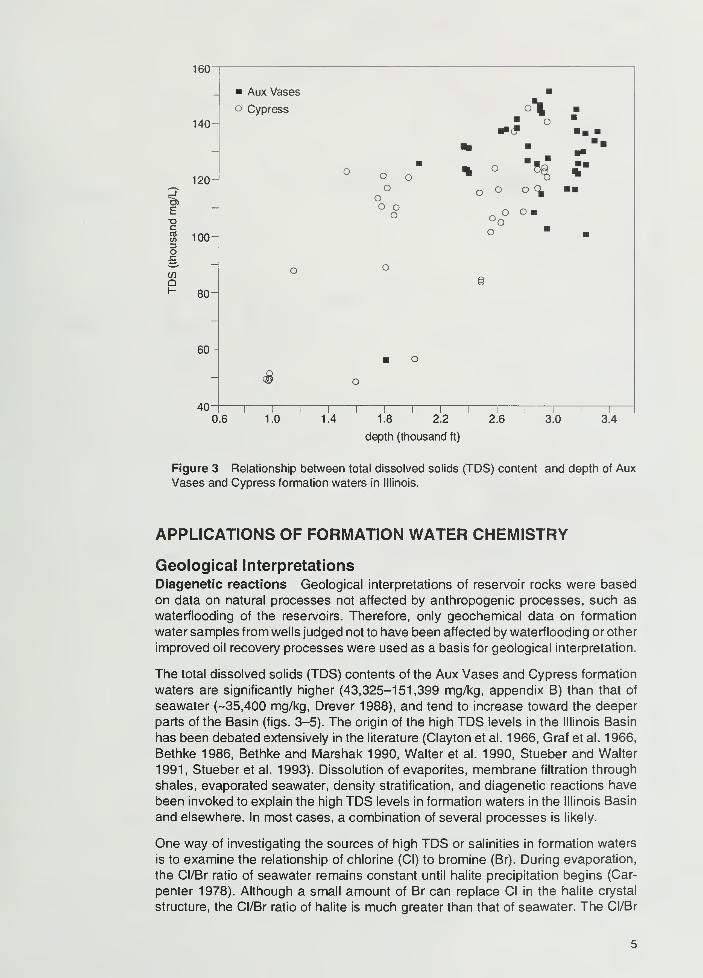
Figure 3 Relationship between total dissolved solids (TDS) content and depth of AuxVases and Cypress formation waters in Illinois.
APPLICATIONS OF FORMATION WATER CHEMISTRY
Geological Interpretations
Diagenetic reactions Geological interpretations of reservoir rocks were based
on data on natural processes not affected by anthropogenic processes, such as
waterflooding of the reservoirs. Therefore, only geochemical data on formation
water samples from wells judged not to have been affected by waterflooding or other
improved oil recovery processes were used as a basis for geological interpretation.
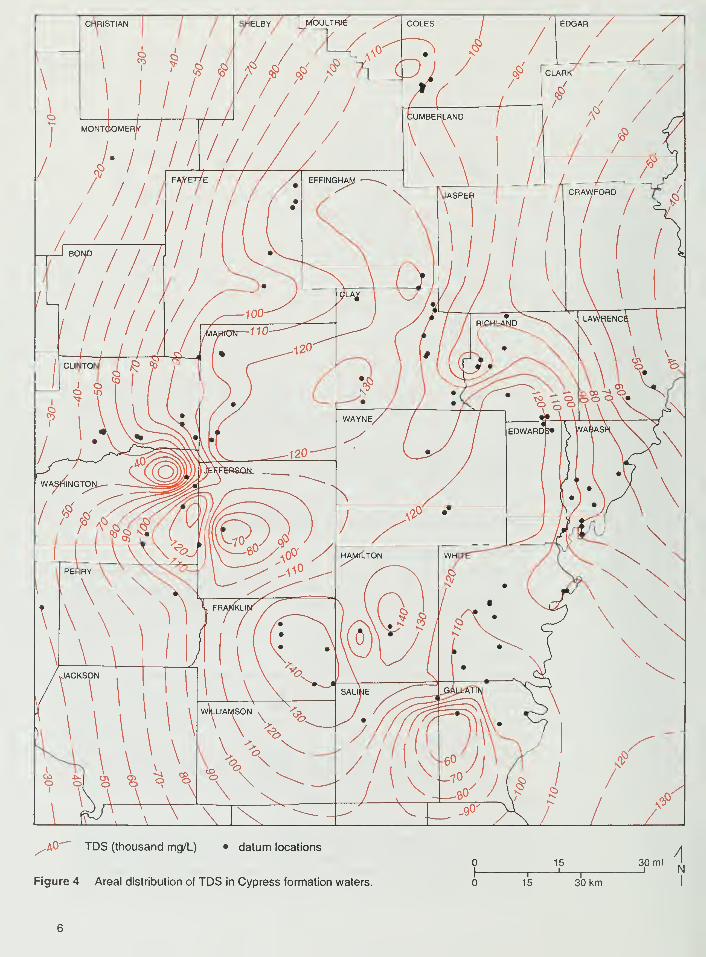
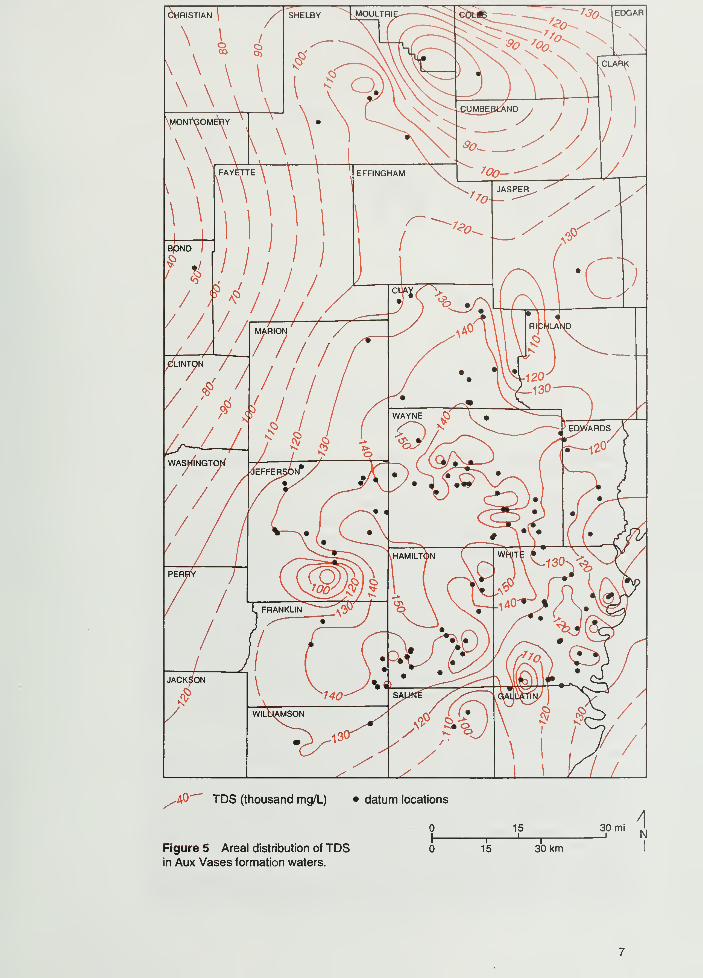
The total dissolved solids (TDS) contents of the Aux Vases and Cypress formation
waters are significantly higher (43,325-151,399 mg/kg, appendix B) than that of
seawater (-35,400 mg/kg, Drever 1988), and tend to increase toward the deeper
parts of the Basin (figs. 3-5). The origin of the high TDS levels in the Illinois Basin
has been debated extensively in the literature (Clayton et al. 1966, Graf et al. 1966,
Bethke 1986, Bethke and Marshak 1990, Walter et al. 1990, Stueber and Walter
1991, Stueber et al. 1993). Dissolution of evaporites, membrane filtration through
shales, evaporated seawater, density stratification, and diagenetic reactions have
been invoked to explain the high TDS levels in formation waters in the Illinois Basin
and elsewhere. In most cases, a combination of several processes is likely.
One way of investigating the sources of high TDS or salinities in formation waters
is to examine the relationship of chlorine (CI) to bromine (Br). During evaporation,
the CI/Br ratio of seawater remains constant until halite precipitation begins (Car-
penter 1978). Although a small amount of Br can replace CI in the halite crystal
structure, the CI/Br ratio of halite is much greater than that of seawater. The CI/Br
CHRISTIAN si4elby /1j/oultrZ
^aO" TDS (thousand mg/L) • datum locations
Figure 4 Areal distribution of TDS in Cypress formation waters.
15i_
A
15I
30 km
30 mi_i N
6
SHELBY | MOULTRI~ r30 I
EDGAR
-A0 TDS (thousand mg/L) • datum locations
15i
Figure 5 Areal distribution of TDSin Aux Vases formation waters.
15 30 km
A30 mi J._i N
I
O
O.f
5.2-
/ T/ halite/ precipitation
5.0-
4.8-
il«'gi. /Boo °"B /8 8 /
- rP ° /4.6-
wo Z7
4.4- / Aux Vases
A O
• seawater o Cypress
H.d.1 1 1 1 1 1 1
I 1 I I I 1
1.6 1.8 2.0 2.2 2.4
log Br (mg/L)
2.6 2.8
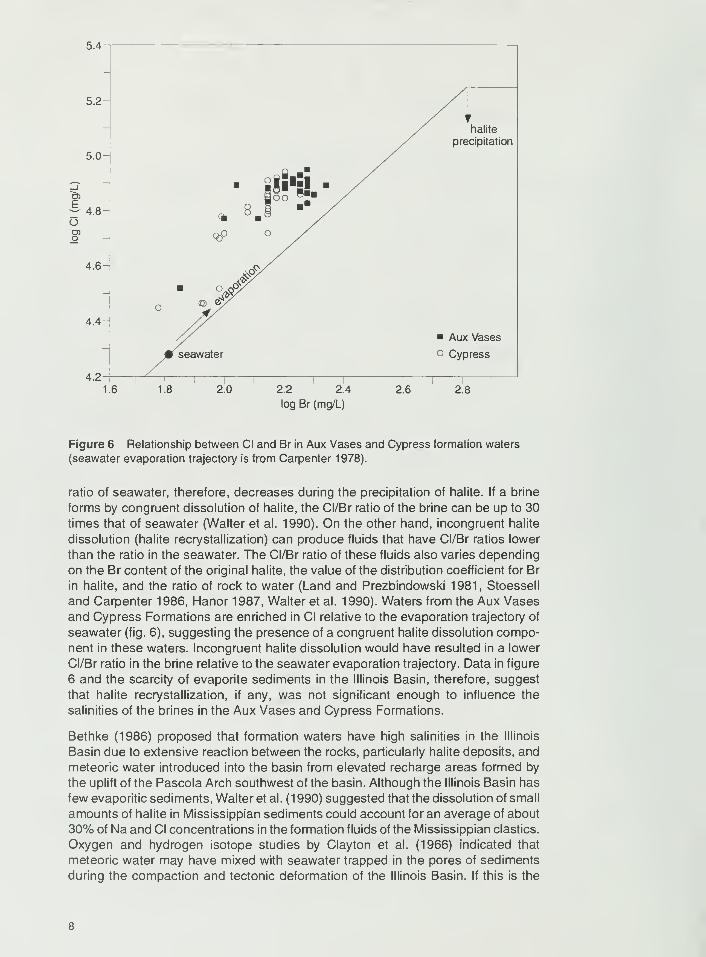
Figure 6 Relationship between CI and Br in Aux Vases and Cypress formation waters
(seawater evaporation trajectory is from Carpenter 1978).
ratio of seawater, therefore, decreases during the precipitation of halite. If a brine
forms by congruent dissolution of halite, the CI/Br ratio of the brine can be up to 30
times that of seawater (Walter et al. 1990). On the other hand, incongruent halite
dissolution (halite recrystallization) can produce fluids that have CI/Br ratios lower
than the ratio in the seawater. The CI/Br ratio of these fluids also varies depending
on the Br content of the original halite, the value of the distribution coefficient for Br
in halite, and the ratio of rock to water (Land and Prezbindowski 1981, Stoessell
and Carpenter 1986, Hanor 1987, Walter et al. 1990). Waters from the Aux Vases
and Cypress Formations are enriched in CI relative to the evaporation trajectory of
seawater (fig. 6), suggesting the presence of a congruent halite dissolution compo-
nent in these waters. Incongruent halite dissolution would have resulted in a lower
CI/Br ratio in the brine relative to the seawater evaporation trajectory. Data in figure
6 and the scarcity of evaporite sediments in the Illinois Basin, therefore, suggest
that halite recrystallization, if any, was not significant enough to influence the
salinities of the brines in the Aux Vases and Cypress Formations.
Bethke (1986) proposed that formation waters have high salinities in the Illinois
Basin due to extensive reaction between the rocks, particularly halite deposits, and
meteoric water introduced into the basin from elevated recharge areas formed by
the uplift of the Pascola Arch southwest of the basin. Although the Illinois Basin has
few evaporitic sediments, Walter et al. (1 990) suggested that the dissolution of small
amounts of halite in Mississippian sediments could account for an average of about
30% of Na and CI concentrations in the formation fluids of the Mississippian elastics.
Oxygen and hydrogen isotope studies by Clayton et al. (1966) indicated that
meteoric water may have mixed with seawater trapped in the pores of sediments
during the compaction and tectonic deformation of the Illinois Basin. If this is the
2.8
2.6
2.4-
w 2.2 H
o
2.0
1.8
1.6
seawater
oo
o
Boo
§ o
8o
o
o
Aux Vases
o Cypress
1.7 1.8 1.9 2.0 2.1
log Br (mg/L)
2.2 2.3 2.4
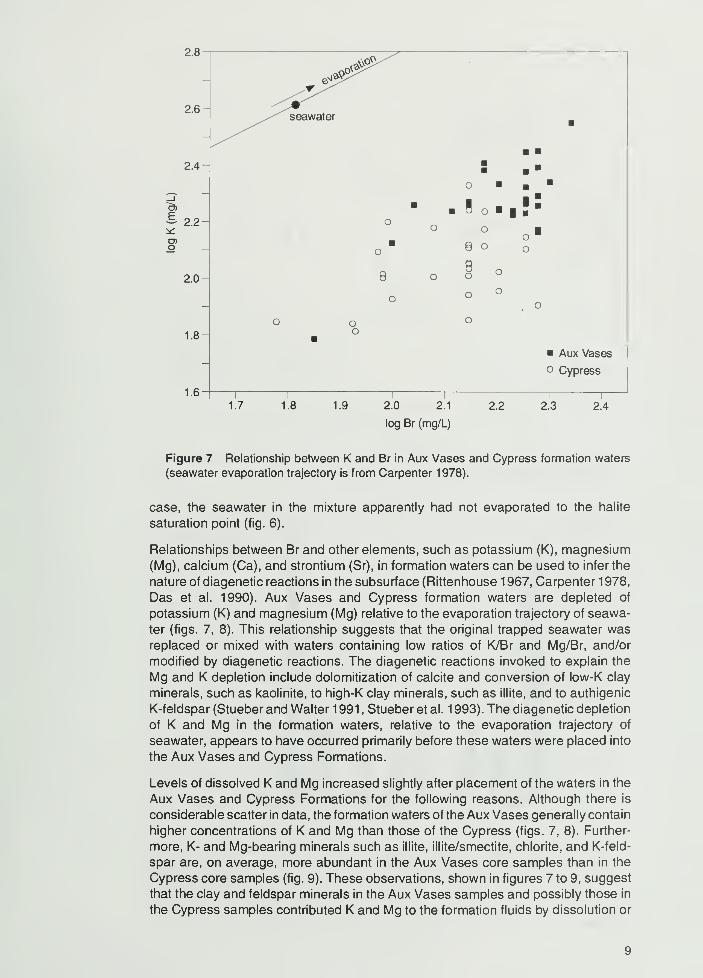
Figure 7 Relationship between K and Br in Aux Vases and Cypress formation waters
(seawater evaporation trajectory is from Carpenter 1978).
case, the seawater in the mixture apparently had not evaporated to the halite
saturation point (fig. 6).
Relationships between Br and other elements, such as potassium (K), magnesium(Mg), calcium (Ca), and strontium (Sr), in formation waters can be used to infer the
nature of diagenetic reactions in the subsurface (Rittenhouse 1 967, Carpenter 1 978,
Das et al. 1990). Aux Vases and Cypress formation waters are depleted of
potassium (K) and magnesium (Mg) relative to the evaporation trajectory of seawa-
ter (figs. 7, 8). This relationship suggests that the original trapped seawater wasreplaced or mixed with waters containing low ratios of K/Br and Mg/Br, and/or
modified by diagenetic reactions. The diagenetic reactions invoked to explain the
Mg and K depletion include dolomitization of calcite and conversion of low-K clay
minerals, such as kaolinite, to high-K clay minerals, such as illite, and to authigenic
K-feldspar (Stueber and Walter 1 991 , Stueber et al. 1 993). The diagenetic depletion
of K and Mg in the formation waters, relative to the evaporation trajectory of
seawater, appears to have occurred primarily before these waters were placed into
the Aux Vases and Cypress Formations.
Levels of dissolved K and Mg increased slightly after placement of the waters in the
Aux Vases and Cypress Formations for the following reasons. Although there is
considerable scatter in data, the formation waters of the Aux Vases generally contain
higher concentrations of K and Mg than those of the Cypress (figs. 7, 8). Further-
more, K- and Mg-bearing minerals such as illite, illite/smectite, chlorite, and K-feld-
spar are, on average, more abundant in the Aux Vases core samples than in the
Cypress core samples (fig. 9). These observations, shown in figures 7 to 9, suggest
that the clay and feldspar minerals in the Aux Vases samples and possibly those in
the Cypress samples contributed K and Mg to the formation fluids by dissolution or
3.8
3.6-
3.4-
E 3.2-
3.0-
2.8-
2.6-
Aux Vases
o Cypress
1.7 1.8 1.9 2.0 2.1
log Br (mg/L)
2.2 2.3 2.4
Figure 8 Relationship between Mg and Br in Aux Vases and Cypress formation waters
(seawater evaporation trajectory is from Carpenter 1978).
T clay I Chi KF
mineral
Figure 9 Mean concentrations of minerals (excluding quartz) in Aux Vases (25 cores)
and Cypress (14 cores) Formations core samples. T. clay - total clay; I = illite; l/S =
illite/smectite; K = kaolinite; Chi = chlorite; KF = potassium feldspar; PF = plagioclase;
C = calcite; D = dolomite.
10
4.0
3.8
3.6-
3.4-
Ecc
OCDO
;.:lO O
Aux Vases
o Cypress
2.0 2.1
log Br (mg/L)
2.3 2.4
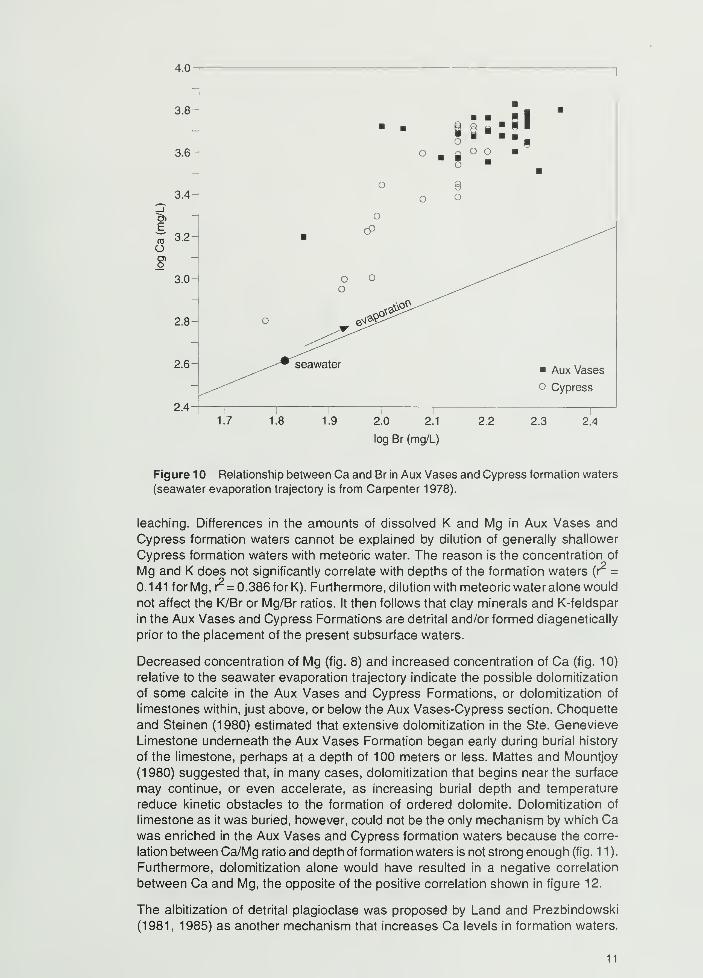
Figure 1 Relationship between Ca and Br in Aux Vases and Cypress formation waters
(seawater evaporation trajectory is from Carpenter 1978).
leaching. Differences in the amounts of dissolved K and Mg in Aux Vases and
Cypress formation waters cannot be explained by dilution of generally shallower
Cypress formation waters with meteoric water. The reason is the concentration of
Mg and K does not significantly correlate with depths of the formation waters (r =
0.141 for Mg, r2= 0.386 for K). Furthermore, dilution with meteoric water alone would
not affect the K/Br or Mg/Br ratios. It then follows that clay minerals and K-feldspar
in the Aux Vases and Cypress Formations are detrital and/or formed diagenetically
prior to the placement of the present subsurface waters.
Decreased concentration of Mg (fig. 8) and increased concentration of Ca (fig. 10)
relative to the seawater evaporation trajectory indicate the possible dolomitization
of some calcite in the Aux Vases and Cypress Formations, or dolomitization of
limestones within, just above, or below the Aux Vases-Cypress section. Choquette
and Steinen (1980) estimated that extensive dolomitization in the Ste. Genevieve
Limestone underneath the Aux Vases Formation began early during burial history
of the limestone, perhaps at a depth of 100 meters or less. Mattes and Mountjoy
(1980) suggested that, in many cases, dolomitization that begins near the surface
may continue, or even accelerate, as increasing burial depth and temperature
reduce kinetic obstacles to the formation of ordered dolomite. Dolomitization of
limestone as it was buried, however, could not be the only mechanism by which Cawas enriched in the Aux Vases and Cypress formation waters because the corre-
lation between Ca/Mg ratio and depth of formation waters is not strong enough (fig. 1 1 ).
Furthermore, dolomitization alone would have resulted in a negative correlation
between Ca and Mg, the opposite of the positive correlation shown in figure 12.
The albitization of detrital plagioclase was proposed by Land and Prezbindowski
(1981, 1985) as another mechanism that increases Ca levels in formation waters.
11
5.5
5.0
4.5
4.0-
3.5
3.0^
2.5
2.0
1.5H
1.0
o
• o o
o :
OBo o _
o .
^8°oo
00 o
o Aux Vases
o Cypress
l l 1 I l l l l
0.6 1.0 1.4 1.8 2.2
depth (thousand ft)
2.6 3.0 3.4
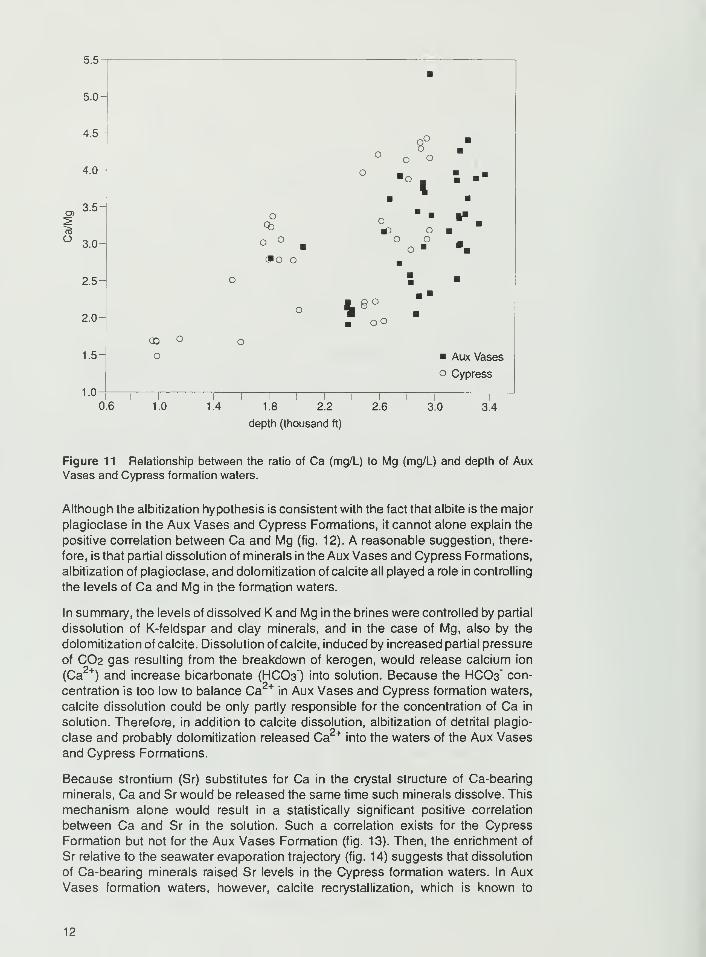
Figure 11 Relationship between the ratio of Ca (mg/L) to Mg (mg/L) and depth of Aux
Vases and Cypress formation waters.
Although the albitization hypothesis is consistent with the fact that albite is the major
plagioclase in the Aux Vases and Cypress Formations, it cannot alone explain the
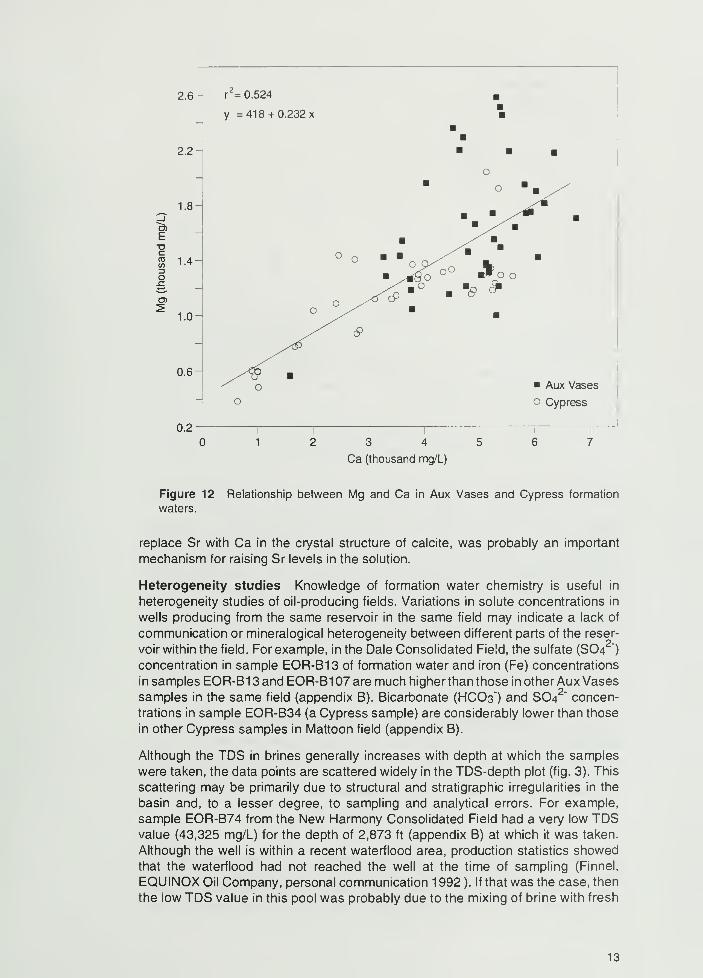
positive correlation between Ca and Mg (fig. 12). A reasonable suggestion, there-
fore, is that partial dissolution of minerals in the Aux Vases and Cypress Formations,
albitization of plagioclase, and dolomitization of calcite all played a role in controlling
the levels of Ca and Mg in the formation waters.
In summary, the levels of dissolved K and Mg in the brines were controlled by partial
dissolution of K-feldspar and clay minerals, and in the case of Mg, also by the
dolomitization of calcite. Dissolution of calcite, induced by increased partial pressure
of CO2 gas resulting from the breakdown of kerogen, would release calcium ion
(Ca2+
) and increase bicarbonate (HCO3") into solution. Because the HCO3" con-
centration is too low to balance Ca2+ in Aux Vases and Cypress formation waters,
calcite dissolution could be only partly responsible for the concentration of Ca in
solution. Therefore, in addition to calcite dissolution, albitization of detrital plagio-
clase and probably dolomitization released Caand Cypress Formations.
2+into the waters of the Aux Vases
Because strontium (Sr) substitutes for Ca in the crystal structure of Ca-bearing
minerals, Ca and Sr would be released the same time such minerals dissolve. This
mechanism alone would result in a statistically significant positive correlation
between Ca and Sr in the solution. Such a correlation exists for the Cypress
Formation but not for the Aux Vases Formation (fig. 13). Then, the enrichment of
Sr relative to the seawater evaporation trajectory (fig. 14) suggests that dissolution
of Ca-bearing minerals raised Sr levels in the Cypress formation waters. In AuxVases formation waters, however, calcite recrystallization, which is known to
12
2.6
2.2-
1.8-
E
to i 4DO
1.0-
0.6
r = 0.524
y =418 + 0.232 x
Aux Vases
o Cypress
0.2 12 3 4 5 6 7
Ca (thousand mg/L)
Figure 12 Relationship between Mg and Ca in Aux Vases and Cypress formation
waters.
replace Sr with Ca in the crystal structure of calcite, was probably an important
mechanism for raising Sr levels in the solution.
Heterogeneity studies Knowledge of formation water chemistry is useful in
heterogeneity studies of oil-producing fields. Variations in solute concentrations in
wells producing from the same reservoir in the same field may indicate a lack of
communication or mineralogical heterogeneity between different parts of the reser-
voir within the field. For example, in the Dale Consolidated Field, the sulfate (SO42")
concentration in sample EOR-B13 of formation water and iron (Fe) concentrations
in samples EOR-B1 3 and EOR-B1 07 are much higher than those in other Aux Vasessamples in the same field (appendix B). Bicarbonate (HCO3) and SO42 " concen-
trations in sample EOR-B34 (a Cypress sample) are considerably lower than those
in other Cypress samples in Mattoon field (appendix B).
Although the TDS in brines generally increases with depth at which the samples
were taken, the data points are scattered widely in the TDS-depth plot (fig. 3). This
scattering may be primarily due to structural and stratigraphic irregularities in the
basin and, to a lesser degree, to sampling and analytical errors. For example,
sample EOR-B74 from the New Harmony Consolidated Field had a very low TDSvalue (43,325 mg/L) for the depth of 2,873 ft (appendix B) at which it was taken.
Although the well is within a recent waterflood area, production statistics showedthat the waterflood had not reached the well at the time of sampling (Finnel,
EQUINOX Oil Company, personal communication 1 992 ). If that was the case, then
the low TDS value in this pool was probably due to the mixing of brine with fresh
13
1.0
0.9-
0.8-
0.7-
c» 0.6
EDI 0.5
o
c/5
0.4
0.3-
0.2
0.1
0.0
Aux Vases
o Cypress
_ o o
o «£oo
o o 8
o
. o"
..ft*.
CD
3 4
Ca (thousand mg/L)
Figure 13 Relationship between Sr and Ca in Aux Vases and Cypress formation waters.
meteoric water. Such an occurrence would suggest the presence of a recharge
zone, such as a high permeability zone or a fault extending to the surface. Anextremely low flow rate in this well suggested the swelling of clay minerals and/or
the conversion of anhydrite to gypsum, both of which can be initiated by freshwater
intrusion. A similar interpretation is valid for a Mattoon Field well (sample EOR-B35,appendix B) that produces oil from an average depth of 1 ,808 feet. This well has a
TDS content of only 56,100 mg/L, which is much lower than the TDS values
generally encountered in similar depths (appendix B, fig. 3).
Only a few examples of using formation water chemistry for geological interpretation
are discussed in this report. Users of this formation water data will likely have other
ideas about possible geological and stratigraphic interpretations.
Formation Water Chemistry and Reservoir Properties
Resistivity-TDS-temperature relationships An empirical relationship between
water resistivity (Rw) and TDS content (fig. 15) was established using field meas-
urements of formation water resistivities (ohm-m) and laboratory TDS data (mg/L)
for 56 oil wells. The empirical relationship between water resistivity and TDS is as
follows:
log Rw = 2.841- 0.788 log (TDS) at 25 °C [1]
Equation (1) was used to calculate water resistivity values for more than 300
additional wells for which TDS values (obtained from DOE and ISGS databases)
were available. The areal distribution of all measured and calculated resistivities for
Aux Vases and Cypress formation waters unaffected by waterflooding or other
14
3.0
2.8
2.6
2.4
2.2-
"g> 2.0
o1.8
1.6 i
1.4
1.2
1.0 H
0.8
seawater
e o-
O O I8 o o
oo
S3
1.7 1.8 2.0 2.1
log Br (mg/L)
Figure 1 4 Relationship between Sr and Br in Aux Vases and Cypress formation waters
(seawater evaporation trajectory is from Carpenter 1978).
improved oil recovery processes was mapped (figs. 16, 17). The resistivity values
on figures 16 and 17 and in appendix B are for formation water at 25 °C.
Two more empirical equations were developed for the Aux Vases and Cypress
formation waters. One equation is used to determine resistivity at different water
temperatures if the resistivity of water at 25 °C is known; the other is used to
determine resistivity at a given temperature if TDS is known. The equations are
based on laboratory and field measurements of temperatures (18-60 °C), resistivities
(0.0362-0.1832 ohm-m), and TDS (48,697-148,028 mg/L) of ten samples. If the
water resistivity at 25 °C is known, the water resistivity at another temperature can
be calculated by using the formula:
Rw(T) = 1 .5(Rw(25))0987
/(1 .01 7)T
[2]
where
RW(T) = water resistivity in ohm-m at temperature T (°C)
Rw(25) = water resistivity in ohm-m at 25 °C
If TDS is known, the resistivity at a given temperature can be calculated by using
the expression:
where
Rw(T) = 957/((TDS)0778
x (1 .01 7)T
)
Rw(T) = water resistivity in ohm-m at temperature T (°C)
TDS = total dissolved solid concentration in mg/L
[3]
15
-u./
r2 = 0.992
-0.8- \~ -0.9-EEszo
toCO
s -1.1-
X
X\\
*>
-1.2-
Aux Vases
-1.3-
o Cypress
l I i i i i i
4.6 4.7 4.8 4.9 5.0
log TDS (mg/L)
5.1 5.2
Figure 1 5 Relationship between Aux Vases and Cypress formation water resistivities and
TDS. The r2
is the square of the correlation coefficient.
For these computations, formation water resistivities were determined in the field
before degassing and oxidation could affect the sample composition. Therefore, the
formation water resistivities determined for this study are more accurate than those
measured in the laboratory or estimated from spontaneous potential logs. Theformation water resistivities calculated by using the above equations are also fairly
accurate because only very little scatter is observed in the data used to calculate
the Rw to TDS relationships (fig. 15). Furthermore, these equations do not require
the use of correction factors for the ionic composition of the water. Correction factors
are needed when resistivities are calculated from published charts which are based
on artificial brines (Schlumberger 1989, p. 4-5).
Resistivity and reservoir properties Accurate resistivity values are important
for calculating water saturation and permeability, two important parameters that
affect oil production. Water saturation in nonshaley rocks is commonly calculated
using the Archie (1942) water saturation equation:
J/2
where
Sw=(FRRw/Rt)
Sw = water saturation (%)
Rw = water resistivity (ohm-m)
Rt = total resistivity of formation (ohm-m)
Fr = formation resistivity factor
[4]
16
The formation resistivity factor is related to the porosity by
FR =1/(t)
m[5]
where
m = cementation exponent
(J)= porosity (%)
The value of m is 2.0 for sandstones that have no clay matrix; it can be as low as
1.5 in sandstones that contain substantial amounts of clay matrix (Leetaru 1990).
Once water saturation is calculated, the rock permeability can also be estimated
from empirical relationships of water saturation, porosity, and permeability (Schlum-
berger 1989, p. 138-139).
The resistivity maps (figs. 16, 17) can be used to estimate formation water resistivi-
ties in the Aux Vases and Cypress Formations in undrilled areas or in wells for which
no resistivity data are available.
TDS and reservoir properties Water saturation (Sw) of a reservoir can also be
determined by using the TDS of formation waters and a Dual-Spacing TDT-KThermal Decay Time log (Schlumberger 1989, p. 128-130). From a plot of the ratio
curve and neutron cross section recorded by the TDT-K Thermal Decay Time log,
apparent water salinity (AWS) can be determined. For gas-saturated formations or
gas-filled casings, the ratio curve cannot be used and porosity (if known) can be
used in lieu of the ratio curve. Once the AWS (mg/L) is determined, the Sw (%) of
a formation that has no or a small amount of clay can be calculated from the TDS(mg/L) (referred to as connate water salinity in Schlumberger charts):
Sw (%) = AWS/TDS [6]
Again, the permeability can be computed from Sw and porosity (Schlumberger 1 989,
p. 138-139). The TDS maps in figures 4 and 5 can be used to estimate TDS values
for undrilled areas or for wells for which no data are available. The TDS can also be
used to estimate water resistivities (equations 1-3). If water and formation resistivi-
ties and cementation exponent are known, and Sw is calculated from equation [6],
the porosity of the formation can be computed using equations [4] and [5].
As shown in the following section, TDS values and chemical compositions of
formation waters are also needed to evaluate and prevent the swelling of clay
minerals when another water is injected into the reservoir for improved oil recovery.
Formation Water Chemistry and Formation DamageKnowledge of the formation water chemistry is important in diagnosing and solving
hydrocarbon production problems such as formation damage. Disturbance of an oil
reservoir's physical-chemical state due to reservoir temperature and pressure
changes and reactions with externally introduced fluids can cause serious formation
damage.
Minerals that commonly precipitate in reservoirs and boreholes and thus reduce oil
production are calcite or aragonite (CaC03), gypsum (CaS04 2H2O) or anhydrite
(CaS04), celestite (SrS04), barite (BaS04), and various Fe-sulfide minerals (Collins
1975, Collins and Kayser 1985). Therefore, concentrations of Ca2+ , Sr2+
, Ba+
,
Fe+
, SO42", HCO3", and CO32 " and the pH and Eh in formation waters and injection
fluids should be considered when designing improved oil recovery processes.
17
CHRISTIAN 7 /SHELBY / [MJZtULTR^' G^L
\ \ I I '
flOTTGOIwkRY/ /
(//H/ii
resistivity (ohm-m) • datum locations
Figure 16 Areal distribution of Cypress formation waters resistivities.
15
15 30 km
30 mi '.
_i N
18

SHELBY
060" resistivity (ohm-m) • datum locations
Figure 17 Areal distribution of Aux Vases i
formation waters resistivities. o
15i
30 mi A
15I
30 km
19
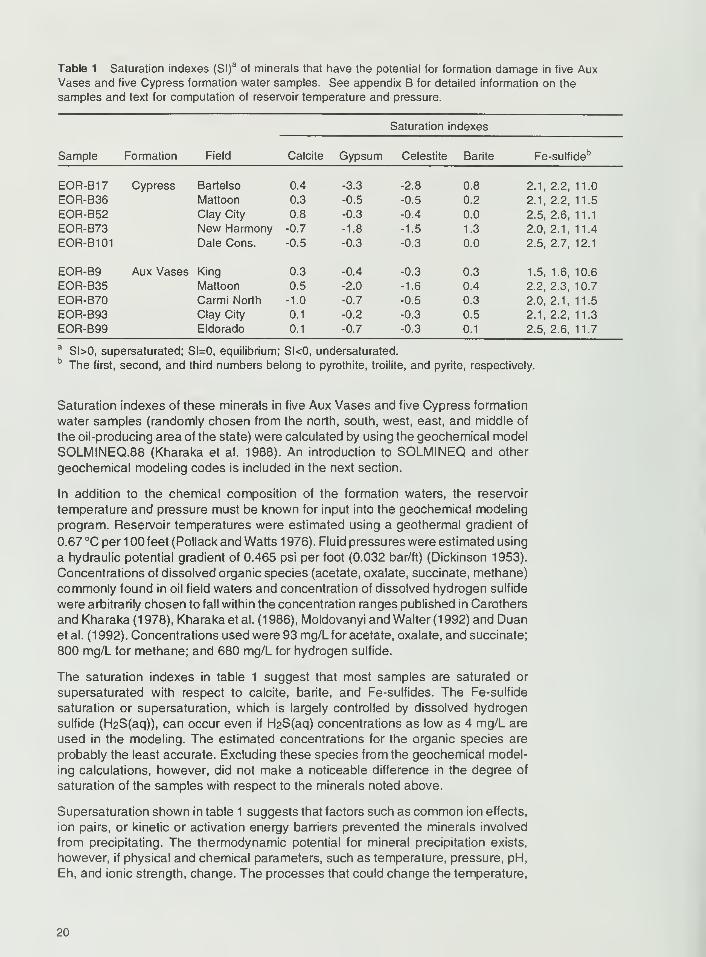
Table 1 Saturation indexes (Sl)aof minerals that have the potential for formation damage in five Aux
Vases and five Cypress formation water samples. See appendix B for detailed information on the
samples and text for computation of reservoir temperature and pressure.
Formation Field
Saturation indexes
Sample Calcite Gypsum Celestite Barite Fe-sulfideb
EOR-B17 Cypress Bartelso 0.4 -3.3 -2.8 0.8 2.1, 2.2, 11.0
EOR-B36 Mattoon 0.3 -0.5 -0.5 0.2 2.1, 2.2, 11.5
EOR-B52 Clay City 0.8 -0.3 -0.4 0.0 2.5,2.6, 11.1
EOR-B73 New Harmony -0.7 -1.8 -1.5 1.3 2.0,2.1, 11.4
EOR-B101 Dale Cons. -0.5 -0.3 -0.3 0.0 2.5, 2.7, 12.1
EOR-B9 Aux Vases King 0.3 -0.4 -0.3 0.3 1.5, 1.6, 10.6
EOR-B35 Mattoon 0.5 -2.0 -1.6 0.4 2.2, 2.3, 10.7
EOR-B70 Carmi North -1.0 -0.7 -0.5 0.3 2.0, 2.1, 11.5
EOR-B93 Clay City 0.1 -0.2 -0.3 0.5 2.1, 2.2, 11.3
EOR-B99 Eldorado 0.1 -0.7 -0.3 0.1 2.5, 2.6, 11.7
aSl>0, supersaturated; Sl=0, equilibrium; Sl<0, undersaturated.
b The first, second, and third numbers belong to pyrothite, troilite, and pyrite, respectively.
Saturation indexes of these minerals in five Aux Vases and five Cypress formation
water samples (randomly chosen from the north, south, west, east, and middle of
the oil-producing area of the state) were calculated by using the geochemical model
SOLMINEQ.88 (Kharaka et al. 1988). An introduction to SOLMINEQ and other
geochemical modeling codes is included in the next section.
In addition to the chemical composition of the formation waters, the reservoir
temperature and pressure must be known for input into the geochemical modeling
program. Reservoir temperatures were estimated using a geothermal gradient of
0.67 °C per 1 00 feet (Pollack and Watts 1 976). Fluid pressures were estimated using
a hydraulic potential gradient of 0.465 psi per foot (0.032 bar/ft) (Dickinson 1953).
Concentrations of dissolved organic species (acetate, oxalate, succinate, methane)
commonly found in oil field waters and concentration of dissolved hydrogen sulfide
were arbitrarily chosen to fall within the concentration ranges published in Carothers
and Kharaka (1 978), Kharaka et al. (1 986), Moldovanyi and Walter (1 992) and Duanet al. (1992). Concentrations used were 93 mg/L for acetate, oxalate, and succinate;
800 mg/L for methane; and 680 mg/L for hydrogen sulfide.
The saturation indexes in table 1 suggest that most samples are saturated or
supersaturated with respect to calcite, barite, and Fe-sulfides. The Fe-sulfide
saturation or supersaturation, which is largely controlled by dissolved hydrogen
sulfide (H2S(aq)), can occur even if H2S(aq) concentrations as low as 4 mg/L are
used in the modeling. The estimated concentrations for the organic species are
probably the least accurate. Excluding these species from the geochemical model-
ing calculations, however, did not make a noticeable difference in the degree of
saturation of the samples with respect to the minerals noted above.
Supersaturation shown in table 1 suggests that factors such as common ion effects,
ion pairs, or kinetic or activation energy barriers prevented the minerals involved
from precipitating. The thermodynamic potential for mineral precipitation exists,
however, if physical and chemical parameters, such as temperature, pressure, pH,
Eh, and ionic strength, change. The processes that could change the temperature,
20
pressure, pH, Eh, and ionic strength of formation waters and the effects of these
changes on the solubility and thus precipitation of the minerals that commonly cause
formation damage are discussed below.
The solubility of anhydrite and celestite tends to decrease, but that of barite tends
to increase, as temperature increases (Blount and Dickson 1969, Fletcher et
al.1981, Templeton 1960, Collins and Kayser 1985). Reservoir temperature can
change during secondary oil recovery; for example, a steam-flood operation raises
the reservoir temperature whereas a waterflood operation lowers it. Injecting other
cold fluids, such as acid, can also lower the reservoir temperature around the bore hole.
Reservoir temperature also decreases during normal primary production as a result
of the drop in pressure around a well bore; the pressure drop reduces the fluid
temperature because of an increase in the vapor pressure of formation water.
The solubility of anhydrite was reported to decrease with decreasing pressure in
solutions having dissolved NaCI concentration ranges (Fulford 1968, Collins 1975,
Collins and Kayser 1985) commonly found in the Illinois Basin formation waters.
Decreased reservoir pressure during normal primary production, or reduced pres-
sure around a borehole due to degassing, therefore, could trigger anhydrite precipi-
tation.
The pH and Eh of formation waters are important parameters influencing the
solubilities of minerals. If pH is sufficiently lowered by processes such as injection
of CO2 or acid, calcite dissolves. The dissolution of calcite generally improves
porosity and permeability in reservoirs containing clean calcite. For reservoirs
containing a substantial amount of clay minerals dispersed within the calcite cement,
calcite dissolution can release clay minerals, which can migrate and plug pore
throats, and thus cause a reduction in permeability. The change in Eh, commonlycaused by the introduction of injection fluids that have Eh values different from that
of the reservoir, could lead to oxidation or reduction of certain aqueous species. For
example, oxidation of H2S in high Ca brines could lead to precipitation of calcium
sulfate.
Ionic strength, a parameter that is a measure of the combined effect of TDS and the
ionic composition of a fluid, significantly influences the solubility of minerals. Thesolubility of Ca-, Ba-, and Sr-sulfate minerals in dominantly NaCI solutions generally
increases with increasing ionic strength of the solution (Davis and Collins 1971,
Collins 1 975, Collins and Kayser 1 985) at the TDS ranges of Aux, Vases and Cypress
formation waters. This increase in solubility is mainly the result of decreased ionic
activities of Ca, Ba, Sr, and SO4 caused by the formation of ion complexes, ion
pairs, and ionic interactions in the solution. If ionic activities of elements making up
of a mineral decreases in a solution, the solubility of that mineral in contact with the
solution generally increases. Diluting reservoir waters by injecting fresher waters in
waterflood operations reduces their overall ionic strength. This reduction greatly
increases the chance of sulfate-mineral precipitation in the reservoirs, especially wheneither the injection water or formation water, or both, contain a substantial amountof sulfate.
Ionic strength also affects the swelling of clay minerals and the anhydrite-gypsum
transformation. Injection of fresher (lower TDS) waters into a reservoir can cause
clay minerals to swell, depending on the ionic strength of the injected water.
Furthermore, lowering the TDS content of a brine increases the activity of water in
it. This increased water activity promotes the conversion of anhydrite (if present) to
gypsum, which has a molar volume 1 to 1.5 times greater than that of anhydrite.
21

The swelling of clay minerals and transformation of anhydrite to gypsum can reduce
the permeability of the reservoir rock and, thus, petroleum production.
Using the geochemical data produced by this study (appendix B) and the general
guidelines discussed above, oil producing or oil field service companies can
evaluate the potential production problems for each well, pool, or field. Once the
potential problem is identified, preventive measures, such as using scale inhibitors
or choosing compatible fluids, can be taken.
SIMULATION OF FLUID-ROCK INTERACTIONS DURINGIMPROVED OIL RECOVERY
The consequences of chemical reactions that take place during improved oil
recovery processes are difficult to predict because of the complexity of the systems
involved. A vast number of reactions that may take place simultaneously in such
systems can be simulated only with the help of quantitative, computerized mathe-
matical-geochemical models. Important advances have been made in computerized
geochemical modeling since the pioneering works of Garrels and Thompson (1 962)
and Helgeson et al. (1969, 1970). The purpose of computerized geochemical
modeling is to understand solution chemistry and predict the results of fluid-rock
interactions.
The two main types of geochemical models are speciation-solubility models and
reaction path models. Speciation-solubility models are used to describe the equilib-
rium distribution of aqueous species and the saturation state of the solution with
respect to various minerals. Mineral saturation states provide a measure of the
thermodynamic potential of mineral precipitation or dissolution. The speciation
solubility models commonly used include SOLMINEQ (Kharaka and Barnes 1973,
Kharaka et al. 1988), WATEQ series (Truesdell and Jones 1974, Plummer et al.
1976, Ball et al. 1981, Ball and Nordstrom 1991), MINEQL and MINTEQ series
(Westall et al. 1976, Felmy et al. 1984, Allison et al. 1991), and EQ3NR (Wolery
1 992a,b). Speciation-solubility models are static; that is, they treat aqueous systems
as isolated systems and ignore the exchange of mass and energy with the surround-
ing environment. Reaction path models, on the other hand, are dynamic because
they model reversible and irreversible reactions by which mass and energy are
exchanged between aqueous solutions and their surroundings in an open system.
Reaction path models are used to predict the dissolution and precipitation of
minerals and the evolution of fluid composition during consecutive stages (reaction
steps) of fluid-rock interaction en route to complete equilibrium. The reaction path
models can be instructed not to precipitate a mineral, thus putting that mineral into
disequilibrium with the water-rock systems. Rate data (rate of the dissolution or
precipitation of a mineral), if available, can be included in reaction path calculations
to understand the kinetics of water-rock interactions.
The first published reaction path model, PATH1, was developed by Helgeson et al.
(1970). Since then reaction path modeling has progressed significantly. Reaction
path models commonly used at present are EQ3/6 (Wolery 1979, 1992b), REACT(Bethke 1992), PHREEQE (Parkhurst et al. 1980), PHRQPITZ (Plummer et al.
1988), and SOLVEQ/CHILLER (Reed 1982, Spycherand Reed 1989a,b).
REACT was the reaction path model used in this study to simulate the chemical
aspects of improved oil recovery processes in the Aux Vases and Cypress Forma-
tions. Data on chemical composition, pH, Eh, density, and temperature of formation
and injection fluids, and on mineralogical composition of the reservoir rocks were
22
input to the model. The density of the fluids was calculated using the geochemical
model SOLMINEQ88 (Kharaka et al. 1988). For a given unit volume of reservoir
rock, changes in volume were calculated for those minerals that were predicted by
the reaction path model to precipitate and/or dissolve. The change in mineral volumewas then used to calculate change in porosity. The reaction path model used in this
study cannot calculate changes in permeability. Because mineral dissolution and
precipitation reactions take place in pores that are accessible to the injection fluids,
change in porosity implies change in permeability. Predicted changes in other
parameters, such as pH, oxygen fugacity, iron concentration, and TDS also are
reported, and their implications for reservoir properties are discussed.
AssumptionsWhen data on the mineralogy and fluid chemistry were incomplete, several assump-tions and estimations were made to complete the input file for the geochemical
modeling used in this study. Because the concentrations of gases in the formation
fluids were not measured, estimated values had to be used. The concentration of
CH4 in the formation water was assumed, on the basis of data given in Duan et al.
(1992), to be about 0.05 or 0.06 mol/kg (-800 or 960 mg/L) of water. The concen-
tration of H2S was assumed to be 0.02 mol/kg (680 mg/L) of water, a value close
to the highest H2S concentration reported in Moldovanyi and Walter (1992).
The average mineralogical composition determined from a core in a given field wasassumed to represent the mineralogy of the reservoir in that field. The formation
waters were assumed to be in equilibrium with quartz, calcite, and clay minerals
and not in equilibrium with feldspars. Also, because no or very little thermodynamic
data were available on mixed-layered clays of various compositions, the mixed-lay-
ered illite/smectite was assumed to be half illite and half smectite for modeling
purposes. Because cristobalite and tridymite are stable silica polymorphs only at
high temperatures (870 °C), they were not expected to precipitate under the
conditions modeled in this study. The model was, therefore, instructed to suppress
the precipitation of cristobalite and tridymite.
Initial simulation runs indicated that for some of the models, dolomite and/or somemetamorphic or hydrothermal minerals would precipitate under the conditions of
thermodynamic equilibrium. Past studies (Land 1983, Sibley et al. 1987) indicated,
however, that dolomite precipitation would be highly unlikely at temperatures and
time scales of the models used in this study because of kinetic barriers. Metamorphic
or hydrothermal minerals were also not expected to form under the reservoir
conditions modeled. The model was, therefore, instructed to suppress the precipi-
tation of dolomite and metamorphic and hydrothermal minerals, such as graphite,
paragonite, pyrophyllite, and others.
REACT computes geochemical reactions at standard (atmospheric) pressure; the
effect of pressure on such reactions is negligible under most reservoir conditions.
Therefore, the effect of reservoir pressure was ignored in all REACT runs. If needed,
additional assumptions specific to each geochemical modeling were made.
Acid Treatment of a Production Well in Energy Field
The Morgan Coal no. 3 well in Energy Field, Williamson County, Illinois, was treated
with 500 gallons of mud-cleaning acid (MCA), which contained about 15% hydro-
chloric acid (HCI). The field operator told the ISGS that production declined after
the treatment; however, the treatment of other wells in the same field with MCAcontaining 7.5% HCI helped production somewhat. Experimental data on the effect
of MCA and injection waters were reported by Haggerty and Seyler (in preparation).
23
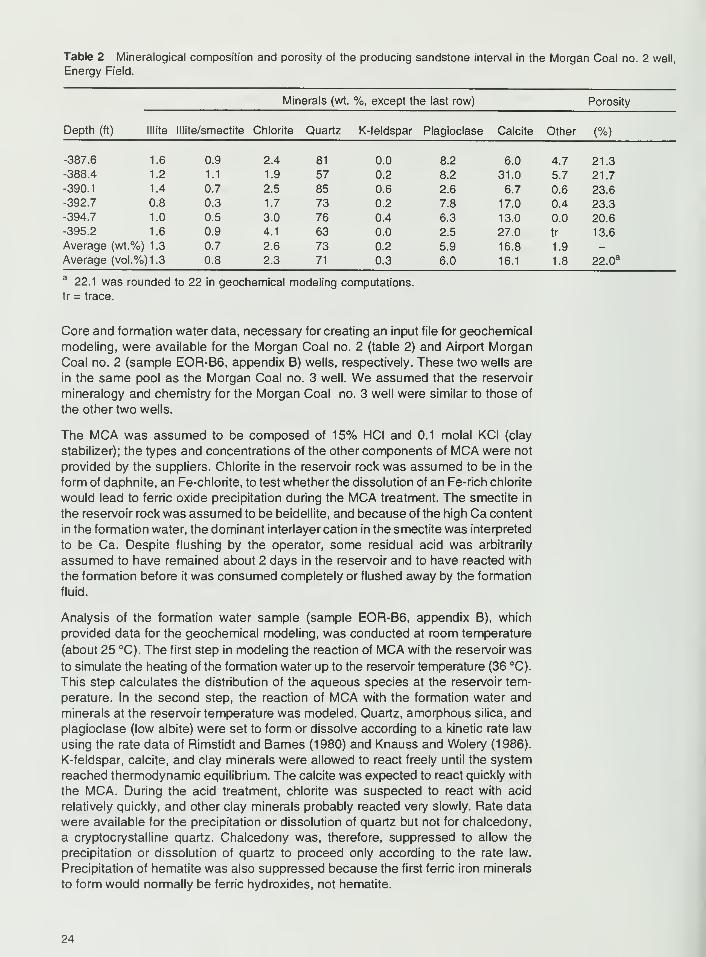
Table 2 Mineralogical composition and porosity of the producing sandstone interval in the Morgan Coal no. 2 well,
Energy Field.
Minerals (wt. %, except the last row) Porosity
Depth (ft) I Mite lllite/smectite Chlorite Quartz K-feldspar Plagioclase Calcite Other (%)
-387.6 1.6 0.9 2.4 81 0.0 8.2 6.0 4.7 21.3
-388.4 1.2 1.1 1.9 57 0.2 8.2 31.0 5.7 21.7
-390.1 1.4 0.7 2.5 85 0.6 2.6 6.7 0.6 23.6-392.7 0.8 0.3 1.7 73 0.2 7.8 17.0 0.4 23.3
-394.7 1.0 0.5 3.0 76 0.4 6.3 13.0 0.0 20.6
-395.2 1.6 0.9 4.1 63 0.0 2.5 27.0 tr 13.6
Average (wt.%) 1 .3 0.7 2.6 73 0.2 5.9 16.8 1.9 -
Average (vol.°'o)1.3 0.8 2.3 71 0.3 6.0 16.1 1.8 22.a
a22.1 was rounded to 22 in geochemical modeling computations,
tr = trace.
Core and formation water data, necessary for creating an input file for geochemical
modeling, were available for the Morgan Coal no. 2 (table 2) and Airport Morgan
Coal no. 2 (sample EOR-B6, appendix B) wells, respectively. These two wells are
in the same pool as the Morgan Coal no. 3 well. We assumed that the reservoir
mineralogy and chemistry for the Morgan Coal no. 3 well were similar to those of
the other two wells.
The MCA was assumed to be composed of 15% HCI and 0.1 molal KCI (clay
stabilizer); the types and concentrations of the other components of MCA were not
provided by the suppliers. Chlorite in the reservoir rock was assumed to be in the
form of daphnite, an Fe-chlorite, to test whether the dissolution of an Fe-rich chlorite
would lead to ferric oxide precipitation during the MCA treatment. The smectite in
the reservoir rock was assumed to be beidellite, and because of the high Ca content
in the formation water, the dominant interlayer cation in the smectite was interpreted
to be Ca. Despite flushing by the operator, some residual acid was arbitrarily
assumed to have remained about 2 days in the reservoir and to have reacted with
the formation before it was consumed completely or flushed away by the formation
fluid.
Analysis of the formation water sample (sample EOR-B6, appendix B), which
provided data for the geochemical modeling, was conducted at room temperature
(about 25 °C). The first step in modeling the reaction of MCA with the reservoir was
to simulate the heating of the formation water up to the reservoir temperature (36 °C).
This step calculates the distribution of the aqueous species at the reservoir tem-
perature. In the second step, the reaction of MCA with the formation water and
minerals at the reservoir temperature was modeled. Quartz, amorphous silica, and
plagioclase (low albite) were set to form or dissolve according to a kinetic rate law
using the rate data of Rimstidt and Barnes (1980) and Knauss and Wolery (1986).
K-feldspar, calcite, and clay minerals were allowed to react freely until the system
reached thermodynamic equilibrium. The calcite was expected to react quickly with
the MCA. During the acid treatment, chlorite was suspected to react with acid
relatively quickly, and other clay minerals probably reacted very slowly. Rate data
were available for the precipitation or dissolution of quartz but not for chalcedony,
a cryptocrystalline quartz. Chalcedony was, therefore, suppressed to allow the
precipitation or dissolution of quartz to proceed only according to the rate law.
Precipitation of hematite was also suppressed because the first ferric iron minerals
to form would normally be ferric hydroxides, not hematite.
24
MCA injection
reservoir *
.' zone 2 •
; flush '
pore '
. volume
. 1 0x with-
. MCA
• zone 3 '
90% MCA1 0% brine
mixture
' zone 4
10% MCA.90% brine
mixture
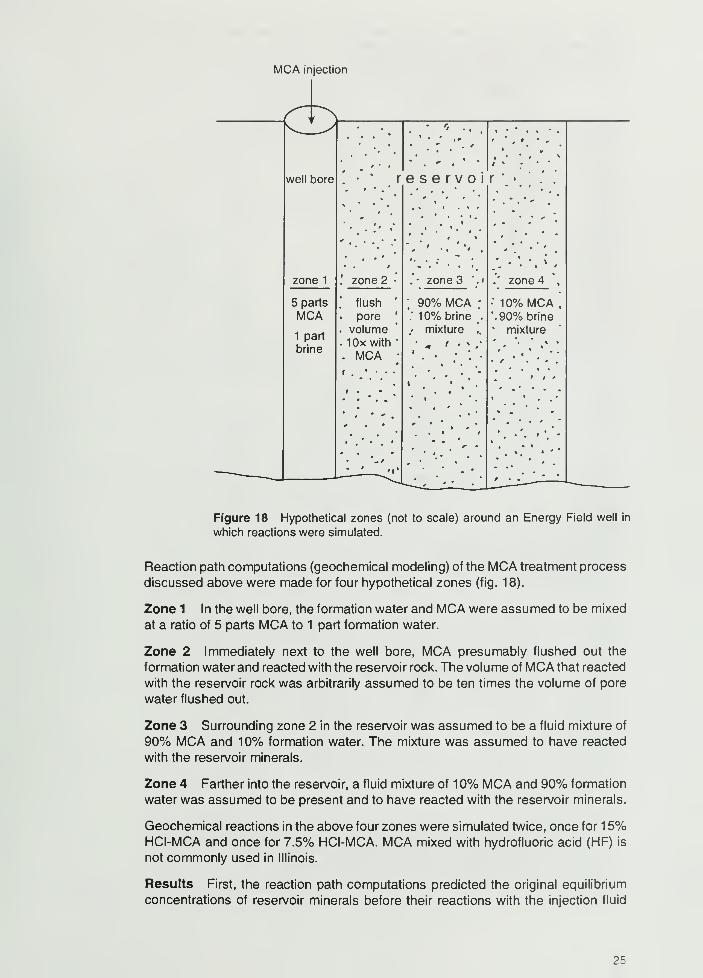
Figure 18 Hypothetical zones (not to scale) around an Energy Field well in
which reactions were simulated.
Reaction path computations (geochemical modeling) of the MCA treatment process
discussed above were made for four hypothetical zones (fig. 18).
Zone 1 In the well bore, the formation water and MCA were assumed to be mixed
at a ratio of 5 parts MCA to 1 part formation water.
Zone 2 Immediately next to the well bore, MCA presumably flushed out the
formation water and reacted with the reservoir rock. The volume of MCA that reacted
with the reservoir rock was arbitrarily assumed to be ten times the volume of pore
water flushed out.
Zone 3 Surrounding zone 2 in the reservoir was assumed to be a fluid mixture of
90% MCA and 10% formation water. The mixture was assumed to have reacted
with the reservoir minerals.
Zone 4 Farther into the reservoir, a fluid mixture of 1 0% MCA and 90% formation
water was assumed to be present and to have reacted with the reservoir minerals.
Geochemical reactions in the above four zones were simulated twice, once for 1 5%HCI-MCA and once for 7.5% HCI-MCA. MCA mixed with hydrofluoric acid (HF) is
not commonly used in Illinois.
Results First, the reaction path computations predicted the original equilibrium
concentrations of reservoir minerals before their reactions with the injection fluid
25
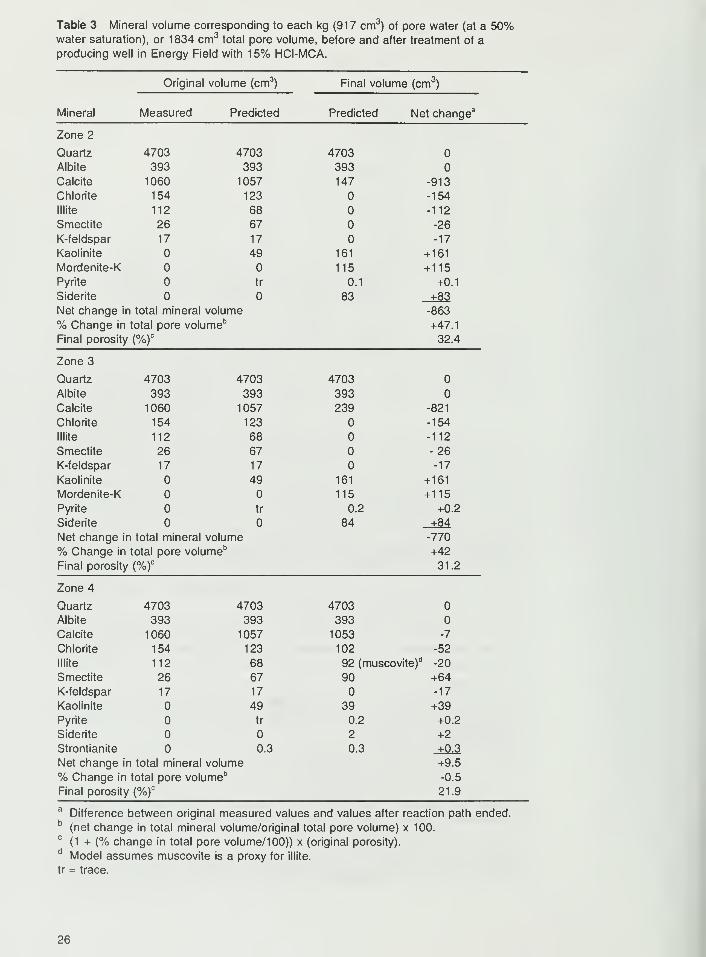
Table 3 Mineral volume corresponding to each kg (917 cm3) of pore water (at a 50%
water saturation), or 1834 cm3total pore volume, before and after treatment of a
producing well in Energy Field with 15% HCI-MCA.
Original volume (cm3
)
Measured Predicted
Final volume (cm3)
Mineral Predicted Net change3
Zone 2
Quartz 4703 4703 4703Albite 393 393 393
Calcite 1060 1057 147 -913
Chlorite 154 123 -154
Mite 112 68 -112
Smectite 26 67 -26
K-feldspar 17 17 -17
Kaolinite 49 161 +161
Mordenite-K 115 +115Pyrite tr 0.1 +0.1
Siderite 83 +83
Net change ir i total mineral volume -863
% Change in total pore volume6+47.1
Final porosity (%)c
32.4
Zone 3
Quartz 4703 4703 4703
Albite 393 393 393
Calcite 1060 1057 239 -821
Chlorite 154 123 -154
I Mite 112 68 -112
Smectite 26 67 -26
K-feldspar 17 17 -17
Kaolinite 49 161 +161
Mordenite-K 115 +115
Pyrite tr 0.2 +0.2
Siderite 84 +84
Net change in total mineral volume -770
% Change in total pore volume" +42
Final porosity (%)c
31.2
Zone 4
Quartz 4703 4703 4703
Albite 393 393 393
Calcite 1060 1057 1053 -7
Chlorite 154 123 102 -52
Mite 112 68 92 (muscovite)d -20
Smectite 26 67 90 +64
K-feldspar 17 17 -17
Kaolinite 49 39 +39
Pyrite tr 0.2 +0.2
Siderite 2 +2
Strontianite 0.3 0.3 +0.3
Net change in total mineral volume +9.5
% Change in total pore volume" -0.5
Final porosity (%)c
21.9
aDifference between original measured values and values after reaction path ended.
b(net change in total mineral volume/original total pore volume) x 100.
c(1 + (% change in total pore volume/100)) x (original porosity).
d Model assumes muscovite is a proxy for illite.
tr = trace.
26
2-
Quartz
Calcite
4520 25 30
H +reacted (moles)
50
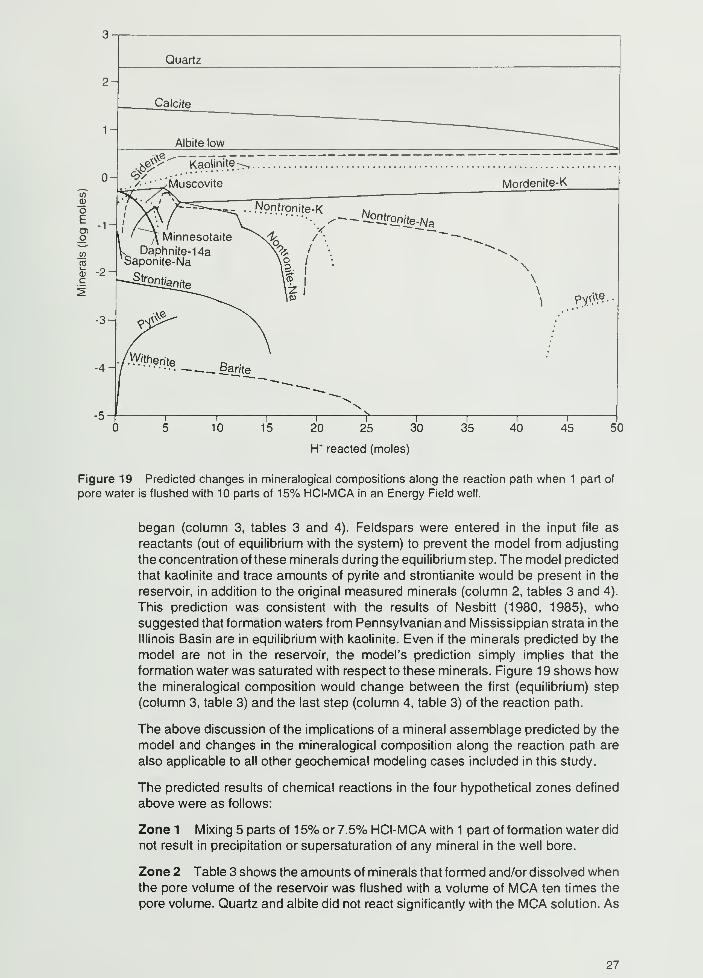
Figure 19 Predicted changes in mineralogical compositions along the reaction path when 1 part of
pore water is flushed with 10 parts of 15% HCI-MCA in an Energy Field well.
began (column 3, tables 3 and 4). Feldspars were entered in the input file as
reactants (out of equilibrium with the system) to prevent the model from adjusting
the concentration of these minerals during the equilibrium step. The model predicted
that kaolinite and trace amounts of pyrite and strontianite would be present in the
reservoir, in addition to the original measured minerals (column 2, tables 3 and 4).
This prediction was consistent with the results of Nesbitt (1980, 1985), whosuggested that formation waters from Pennsylvanian and Mississippian strata in the
Illinois Basin are in equilibrium with kaolinite. Even if the minerals predicted by the
model are not in the reservoir, the model's prediction simply implies that the
formation water was saturated with respect to these minerals. Figure 1 9 shows howthe mineralogical composition would change between the first (equilibrium) step
(column 3, table 3) and the last step (column 4, table 3) of the reaction path.
The above discussion of the implications of a mineral assemblage predicted by the
model and changes in the mineralogical composition along the reaction path are
also applicable to all other geochemical modeling cases included in this study.
The predicted results of chemical reactions in the four hypothetical zones defined
above were as follows:
Zone 1 Mixing 5 parts of 1 5% or 7.5% HCI-MCA with 1 part of formation water did
not result in precipitation or supersaturation of any mineral in the well bore.
Zone 2 Table 3 shows the amounts of minerals that formed and/or dissolved whenthe pore volume of the reservoir was flushed with a volume of MCA ten times the
pore volume. Quartz and albite did not react significantly with the MCA solution. As
27
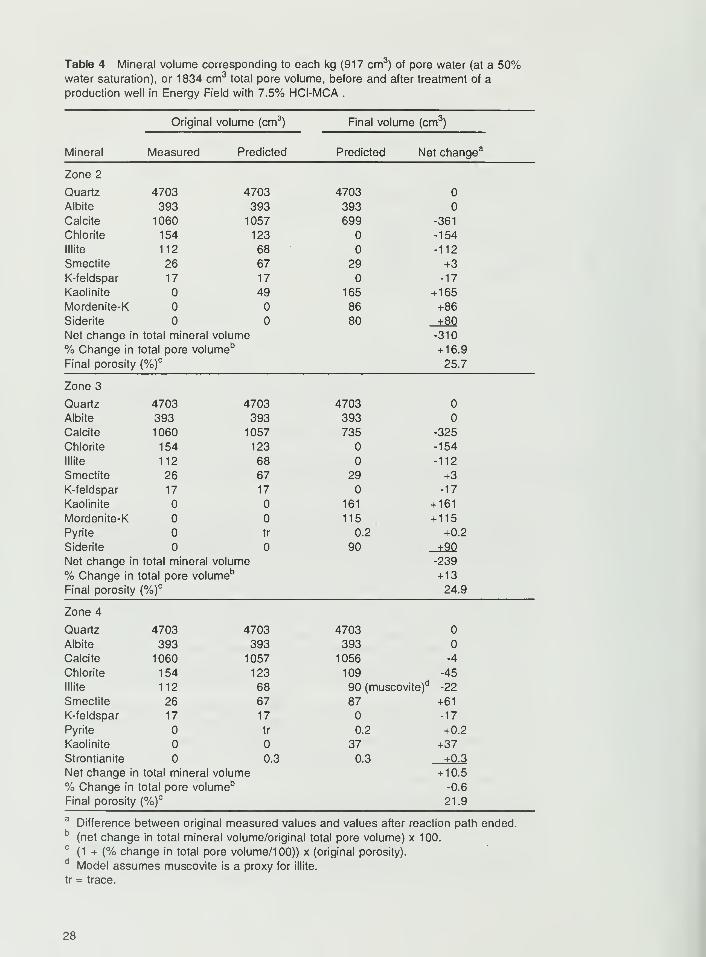
Table 4 Mineral volume corresponding to each kg (917 cm3) of pore water (at a 50%
water saturation), or 1834 cm3total pore volume, before and after treatment of a
production well in Energy Field with 7.5% HCI-MCA .
Original volume (cm 3Final volume (cm3
Mineral Measured Predicted Predicted Net change 3
Zone 2
Quartz 4703Albite 393Calcite 1060
Chlorite 154
lllite 112
Smectite 26
K-feldspar 17
Kaolinite
Mordenite-K
Siderite
4703
393
1057
123
68
67
17
49
Net change in total mineral volume
% Change in total pore volumeb
Final porosity (%)c
4703
393
699
29
165
86
80
-361
-154
-112
+3-17
+165
+86
+80-310
+16.9
25.7
4703
393
735 -325
-154
-112
29 +3-17
161 +161
115 +115
0.2 +0.2
90 +90-239
+1324.9
4703
393
1056 -4
109 -45
90 (muscovite)'i .22
87 +61
-17
0.2 +0.2
37 +370.3 +0.3
Zone 3
Quartz 4703
Albite 393Calcite 1060
Chlorite 154
lllite 112
Smectite 26K-feldspar 17
Kaolinite
Mordenite-K
Pyrite
Siderite
4703
393
1057
123
68
67
17
tr
Net change in total mineral volume
% Change in total pore volume*3
Final porosity (%)c
Zone 4
Quartz 4703
Albite 393Calcite 1060
Chlorite 154
lllite 112
Smectite 26K-feldspar 17
Pyrite
Kaolinite
Strontianite
4703
393
1057
123
68
67
17
tr
0.3
Net change in total mineral volume
% Change in total pore volume 13
Final porosity (%)c
+ 10.5
-0.6
21.9
aDifference between original measured values and values after reaction path ended.
(net change in total mineral volume/original total pore volume) x 100.c
(1 + (% change in total pore volume/100)) x (original porosity).d Model assumes muscovite is a proxy for illite.
tr = trace.
28
20 25 30
H +reacted (moles)
r35
T40
I
45 50
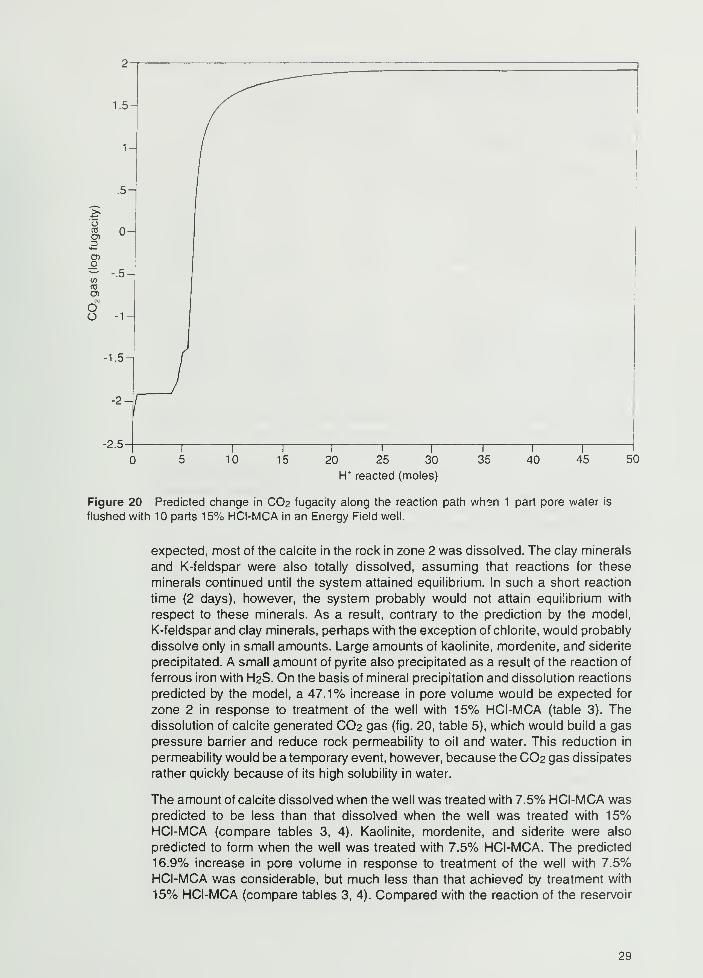
Figure 20 Predicted change in CO2 fugacity along the reaction path when 1 part pore water is
flushed with 10 parts 15% HCI-MCA in an Energy Field well.
expected, most of the calcite in the rock in zone 2 was dissolved. The clay minerals
and K-feldspar were also totally dissolved, assuming that reactions for these
minerals continued until the system attained equilibrium. In such a short reaction
time (2 days), however, the system probably would not attain equilibrium with
respect to these minerals. As a result, contrary to the prediction by the model,
K-feldspar and clay minerals, perhaps with the exception of chlorite, would probably
dissolve only in small amounts. Large amounts of kaolinite, mordenite, and siderite
precipitated. A small amount of pyrite also precipitated as a result of the reaction of
ferrous iron with H2S. On the basis of mineral precipitation and dissolution reactions
predicted by the model, a 47.1% increase in pore volume would be expected for
zone 2 in response to treatment of the well with 15% HCI-MCA (table 3). Thedissolution of calcite generated CO2 gas (fig. 20, table 5), which would build a gas
pressure barrier and reduce rock permeability to oil and water. This reduction in
permeability would be a temporary event, however, because the CO2 gas dissipates
rather quickly because of its high solubility in water.
The amount of calcite dissolved when the well was treated with 7.5% HCI-MCA waspredicted to be less than that dissolved when the well was treated with 15%HCI-MCA (compare tables 3, 4). Kaolinite, mordenite, and siderite were also
predicted to form when the well was treated with 7.5% HCI-MCA. The predicted
16.9% increase in pore volume in response to treatment of the well with 7.5%HCI-MCA was considerable, but much less than that achieved by treatment with
15% HCI-MCA (compare tables 3, 4). Compared with the reaction of the reservoir
29
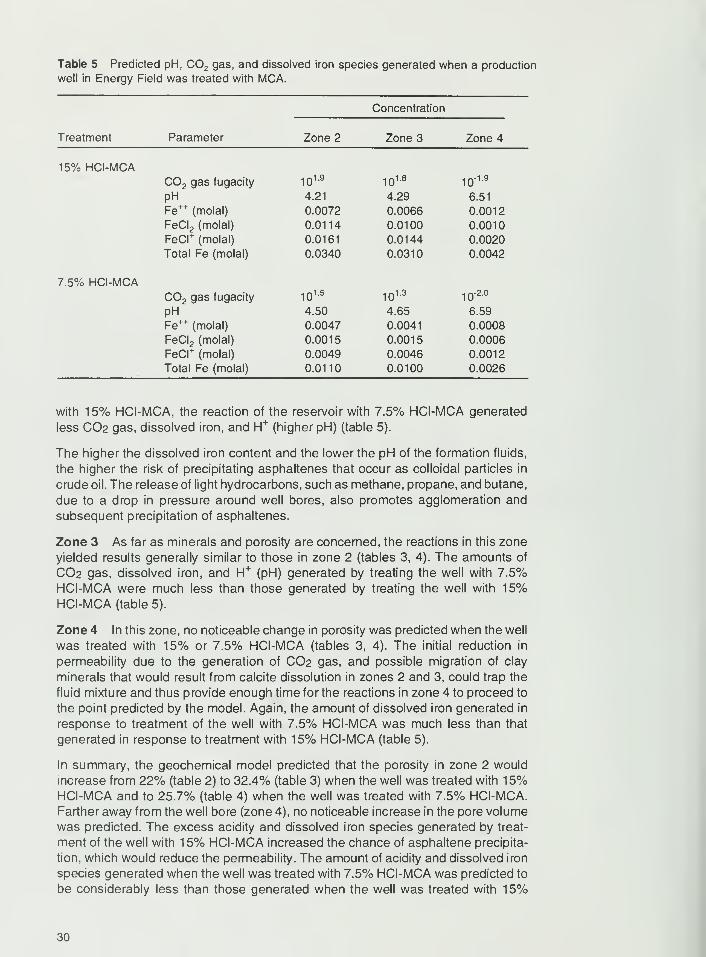
Table 5 Predicted pH, C02 gas, and dissolved iron species generated when a production
well in Energy Field was treated with MCA.
Parameter
Concentration
Treatment Zone 2 Zone 3 Zone 4
15% HCI-MCAC0
2gas fugacity 10
1.910
1.8 10"19
PH 4.21 4.29 6.51
Fe++
(molal) 0.0072 0.0066 0.0012
FeCI2(molal) 0.0114 0.0100 0.0010
FeCI+(molal) 0.0161 0.0144 0.0020
Total Fe (molal) 0.0340 0.0310 0.0042
7.5% HCI-MCAC0
2gas fugacity 10
1510
131
-2.0
PH 4.50 4.65 6.59
Fe++ (molal) 0.0047 0.0041 0.0008
FeCI2(molal) 0.0015 0.0015 0.0006
FeCI+(molal) 0.0049 0.0046 0.0012
Total Fe (molal) 0.0110 0.0100 0.0026
with 15% HCI-MCA, the reaction of the reservoir with 7.5% HCI-MCA generated
less CO2 gas, dissolved iron, and H+(higher pH) (table 5).
The higher the dissolved iron content and the lower the pH of the formation fluids,
the higher the risk of precipitating asphaltenes that occur as colloidal particles in
crude oil. The release of light hydrocarbons, such as methane, propane, and butane,
due to a drop in pressure around well bores, also promotes agglomeration and
subsequent precipitation of asphaltenes.
Zone 3 As far as minerals and porosity are concerned, the reactions in this zone
yielded results generally similar to those in zone 2 (tables 3, 4). The amounts of
CO2 gas, dissolved iron, and H+(pH) generated by treating the well with 7.5%
HCI-MCA were much less than those generated by treating the well with 15%HCI-MCA (table 5).
Zone 4 In this zone, no noticeable change in porosity was predicted when the well
was treated with 15% or 7.5% HCI-MCA (tables 3, 4). The initial reduction in
permeability due to the generation of CO2 gas, and possible migration of clay
minerals that would result from calcite dissolution in zones 2 and 3, could trap the
fluid mixture and thus provide enough time for the reactions in zone 4 to proceed to
the point predicted by the model. Again, the amount of dissolved iron generated in
response to treatment of the well with 7.5% HCI-MCA was much less than that
generated in response to treatment with 15% HCI-MCA (table 5).
In summary, the geochemical model predicted that the porosity in zone 2 would
increase from 22% (table 2) to 32.4% (table 3) when the well was treated with 15%HCI-MCA and to 25.7% (table 4) when the well was treated with 7.5% HCI-MCA.Farther away from the well bore (zone 4), no noticeable increase in the pore volume
was predicted. The excess acidity and dissolved iron species generated by treat-
ment of the well with 15% HCI-MCA increased the chance of asphaltene precipita-
tion, which would reduce the permeability. The amount of acidity and dissolved iron
species generated when the well was treated with 7.5% HCI-MCA was predicted to
be considerably less than those generated when the well was treated with 15%
30
HCI-MCA. The smaller the amount of acidity and dissolved iron, the smaller the
chance of asphaltene precipitation. Considering the amount of acidity and dissolved
iron predicted by the model and perhaps the amount of fine clay particles likely to
be released as a result of calcite dissolution, one can argue that the plugging of
pores with possible asphaltene precipitation and fine clay particles would appear to
be less during treatment of the well with 7.5% HCI-MCA than treatment with 15%HCI-MCA. This argument is consistent with the field observations that indicated
increased oil production (permeability) in response to well treatment with 7.5%HCI-MCA but not with 15% HCI-MCA. Both treatments generate a significant
amount of CO2 gas, which would initially reduce the permeability. The CO2 gas
pressure, however, would dissipate relatively quickly, allowing restoration of the
permeability. The model did not predict the expected ferric oxide precipitation
resulting from the dissolution of Fe-chlorite. Ferric oxide precipitation would require
much more dissolved oxygen than the 8 mg/L assumed to be introduced with the
MCA, which probably is not realistic under the conditions modeled.
Waterflood Operations in Dale Consolidated Field
Water produced from an average depth of about 2,959 feet in the Cypress Formation
was injected into the deeper Aux Vases reservoir to increase oil production in Dale
Consolidated Field, Franklin County, Illinois (Udegbunam et al. 1 993). The chemical
composition of the injection water is given in appendix B (sample EOR-B101). Thecomposition of the Aux Vases formation water was assumed to be represented by
that of water produced at an average depth of about 3,1 72 feet (appendix B, sample
EOR-B107). The average mineralogical composition and porosity of a core sample
from McCreery no.1 well (table 6) were assumed to represent those of the AuxVases reservoir in this field.
Geochemical reactions of the waterflood operation were simulated to estimate the
effect of the waterflood on the reservoir properties. For the Aux Vases formation
water, the pH of 5.34 measured in the field had to be adjusted to 5.85 in the
geochemical modeling input file to make the simulation run converge. The types of
chlorite and smectite (smectite portion of illite/smectite) reported in table 6 were
assumed to be ripidolite (Fe-Mg-chlorite) and beidellite, respectively.
The first step in modeling the waterflood operation was to compute the distribution
of aqueous species in the injection and reservoir waters at reservoir temperature
(37 °C). Then the reactions between injection water, formation water, and reservoir
minerals were simulated. Two different scenarios were modeled: (1) a volume of
injection water ten times the volume of pore water flushed out the pore water and
reacted with the reservoir rock during waterflood operations, and (2) somewhere in
the reservoir, the injection and pore waters mixed at a 1:1 ratio and then reacted
with the reservoir rock. All reactions were assumed to continue until thermodynamic
equilibrium was attained. This assumption is probably reasonable for most reac-
tions, perhaps with the exception of feldspar reactions, because the time scale of
waterflood operations is long enough (usually 10 years or more) for the system to
reach or approach the equilibrium.
Replacement of pore water by flushing During the simulated flushing of pore
water with injection fluid, the model predicted relatively small changes in the
volumes of the major components (quartz, calcite, and illite) of the reservoir rock
when compared with their original measured volumes (table 7, fig. 21 ). The volumes
of minor mineralogical components were predicted to change as a result of the
reaction of reservoir rock with the injection fluid. Feldspars were altered to illite,
smectite, and kaolinite. Some of the silica released from the dissolution of feldspars
31
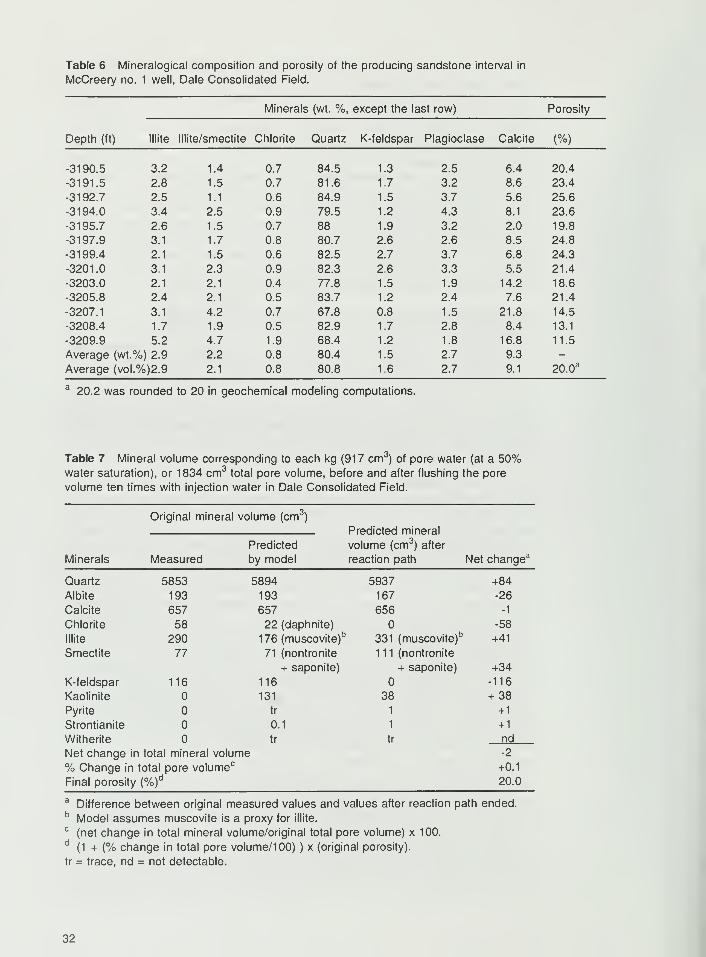
Table 6 Mineralogical composition and porosity of the producing sandstone interval in
McCreery no. 1 well, Dale Consolidated Field.
Minerals (wt. %, except the last row) Porosity
Depth (ft) lllite lllite/smectite Chlorite Quartz K-feldspar Plagioclase Calcite (%)
-3190.5 3.2 1.4 0.7 84.5 1.3 2.5 6.4 20.4
-3191.5 2.8 1.5 0.7 81.6 1.7 3.2 8.6 23.4
-3192.7 2.5 1.1 0.6 84.9 1.5 3.7 5.6 25.6
-3194.0 3.4 2.5 0.9 79.5 1.2 4.3 8.1 23.6
-3195.7 2.6 1.5 0.7 88 1.9 3.2 2.0 19.8
-3197.9 3.1 1.7 0.8 80.7 2.6 2.6 8.5 24.8
-3199.4 2.1 1.5 0.6 82.5 2.7 3.7 6.8 24.3
-3201.0 3.1 2.3 0.9 82.3 2.6 3.3 5.5 21.4
-3203.0 2.1 2.1 0.4 77.8 1.5 1.9 14.2 18.6
-3205.8 2.4 2.1 0.5 83.7 1.2 2.4 7.6 21.4
-3207.1 3.1 4.2 0.7 67.8 0.8 1.5 21.8 14.5
-3208.4 1.7 1.9 0.5 82.9 1.7 2.8 8.4 13.1
-3209.9 5.2 4.7 1.9 68.4 1.2 1.8 16.8 11.5
Average (wt.%](2.9 2.2 0.8 80.4 1.5 2.7 9.3 -
Average (vol.%)2.9 2.1 0.8 80.8 1.6 2.7 9.1 20.0a
20.2 was rounded to 20 in geochemical modeling computations.
Table 7 Mineral volume corresponding to each kg (917 cm3) of pore water (at a 50%
water saturation), or 1834 cm3total pore volume, before and after flushing the pore
volume ten times with injection water in Dale Consolidated Field.
Original mineral volume (cm3)
Predicted mineral
volume (cm3) afterPredicted
Minerals Measured by model reaction path Net change3
Quartz 5853 5894 5937 +84
Albite 193 193 167 -26
Calcite 657 657 656 -1
Chlorite 58 22 (daphnite) -58
lllite 290 176 (muscovite)k 1
331 (muscovite)b
+41
Smectite 77 71 (nontronite 111 (nontronite
+ saponite) + saponite) +34
K-feldspar 116 116 -116
Kaolinite 131 38 + 38
Pyrite tr 1 + 1
Strontianite 0.1 1 + 1
Witherite tr
i total mineral volume
tr nd
Net change ir -2
% Change in total pore volume +0.1
Final porosity (%)a 20.0
aDifference between original measured values and values after reaction path ended.
b Model assumes muscovite is a proxy for illite.
c(net change in total mineral volume/original total pore volume) x 100.
d(1 + (% change in total pore volume/100) ) x (original porosity).
tr = trace, nd = not detectable.
32
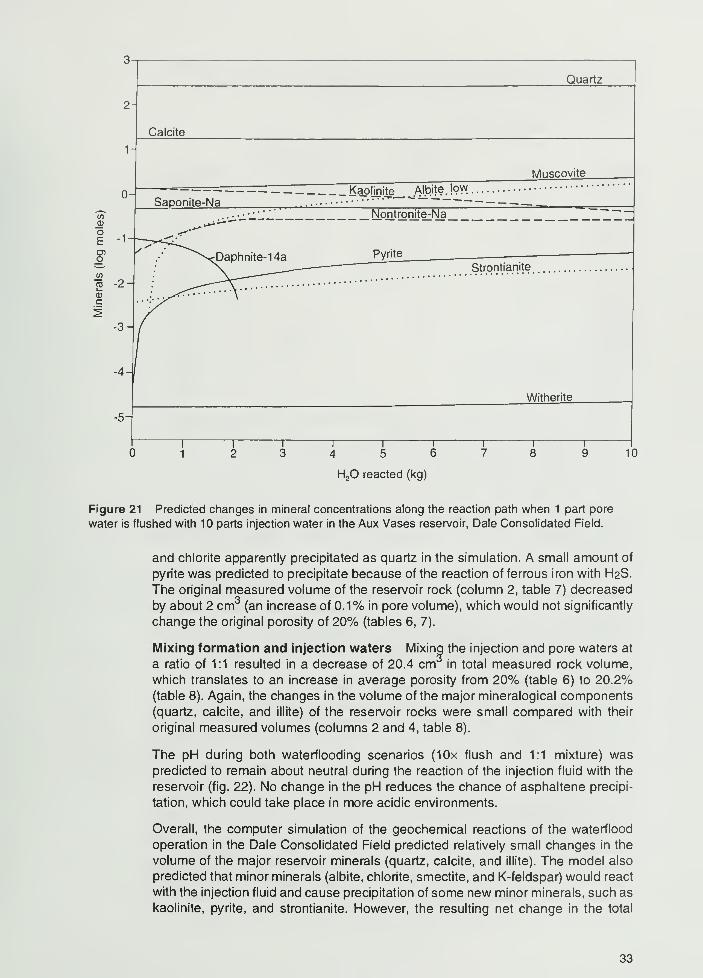
Quartz
2-
1-
Calcite
0-
V)
o£
o
d)c
Muscovite
Saponite-NaKap!ipite_JMj#?JW
H 2 reacted (kg)
Figure 21 Predicted changes in mineral concentrations along the reaction path when 1 part pore
water is flushed with 10 parts injection water in the Aux Vases reservoir, Dale Consolidated Field.
and chlorite apparently precipitated as quartz in the simulation. A small amount of
pyrite was predicted to precipitate because of the reaction of ferrous iron with H2S.
The original measured volume of the reservoir rock (column 2, table 7) decreased
by about 2 cm3(an increase of 0.1% in pore volume), which would not significantly
change the original porosity of 20% (tables 6, 7).
Mixing formation and injection waters Mixing the injection and pore waters at
a ratio of 1:1 resulted in a decrease of 20.4 cm in total measured rock volume,
which translates to an increase in average porosity from 20% (table 6) to 20.2%(table 8). Again, the changes in the volume of the major mineralogical components
(quartz, calcite, and illite) of the reservoir rocks were small compared with their
original measured volumes (columns 2 and 4, table 8).
The pH during both waterflooding scenarios (10x flush and 1:1 mixture) waspredicted to remain about neutral during the reaction of the injection fluid with the
reservoir (fig. 22). No change in the pH reduces the chance of asphaltene precipi-
tation, which could take place in more acidic environments.
Overall, the computer simulation of the geochemical reactions of the waterflood
operation in the Dale Consolidated Field predicted relatively small changes in the
volume of the major reservoir minerals (quartz, calcite, and illite). The model also
predicted that minor minerals (albite, chlorite, smectite, and K-feldspar) would react
with the injection fluid and cause precipitation of some new minor minerals, such as
kaolinite, pyrite, and strontianite. However, the resulting net change in the total
33
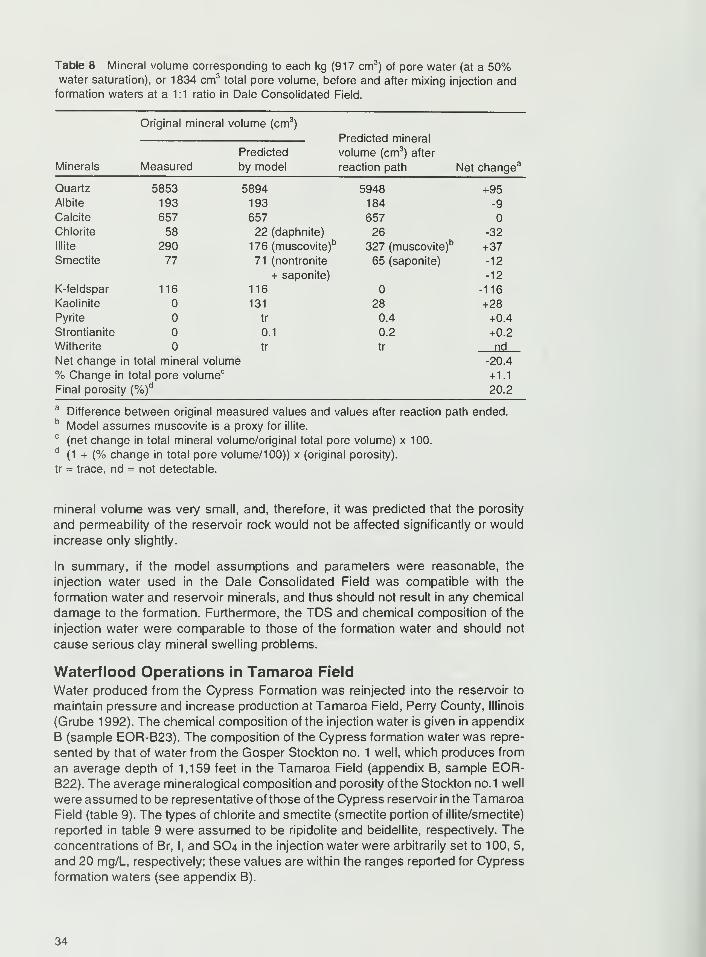
Table 8 Mineral volume corresponding to each kg (917 cm3) of pore water (at a 50%
water saturation), or 1834 cm 3total pore volume, before and after mixing injection and
formation waters at a 1:1 ratio in Dale Consolidated Field.
Original mineral volume (cm3
)
Predicted mineral
Predicted volume (cm3) after
Minerals Measured by model reaction path Net change3
Quartz 5853 5894 5948 +95Albite 193 193 184 -9
Calcite 657 657 657Chlorite 58 22 (daphnite) 26 -32
lllite 290 176 (muscovite)1
' 327 (muscovite)b +37
Smectite 77 71 (nontronite
+ saponite)
65 (saponite) -12
-12
K-feldspar 116 116 -116
Kaolinite 131 28 +28Pyrite tr 0.4 +0.4
Strontianite 0.1 0.2 +0.2
Witherite tr
i total mineral volume
tr nd
Net change ir -20.4
% Change in total pore volume +1.1
Final porosity (%)d
20.2
3Difference between original measured values and values after reaction path ended.
b Model assumes muscovite is a proxy for illite.
c(net change in total mineral volume/original total pore volume) x 100.
d(1 + (% change in total pore volume/100)) x (original porosity).
tr = trace, nd = not detectable.
mineral volume was very small, and, therefore, it was predicted that the porosity
and permeability of the reservoir rock would not be affected significantly or would
increase only slightly.
In summary, if the model assumptions and parameters were reasonable, the
injection water used in the Dale Consolidated Field was compatible with the
formation water and reservoir minerals, and thus should not result in any chemical
damage to the formation. Furthermore, the TDS and chemical composition of the
injection water were comparable to those of the formation water and should not
cause serious clay mineral swelling problems.
Waterflood Operations in Tamaroa Field
Water produced from the Cypress Formation was reinjected into the reservoir to
maintain pressure and increase production at Tamaroa Field, Perry County, Illinois
(Grube 1 992). The chemical composition of the injection water is given in appendix
B (sample EOR-B23). The composition of the Cypress formation water was repre-
sented by that of water from the Gosper Stockton no. 1 well, which produces from
an average depth of 1,159 feet in the Tamaroa Field (appendix B, sample EOR-B22). The average mineralogical composition and porosity of the Stockton no.1 well
were assumed to be representative of those of the Cypress reservoir in the TamaroaField (table 9). The types of chlorite and smectite (smectite portion of illite/smectite)
reported in table 9 were assumed to be ripidolite and beidellite, respectively. Theconcentrations of Br, I, and SO4 in the injection water were arbitrarily set to 100, 5,
and 20 mg/L, respectively; these values are within the ranges reported for Cypress
formation waters (see appendix B).
34
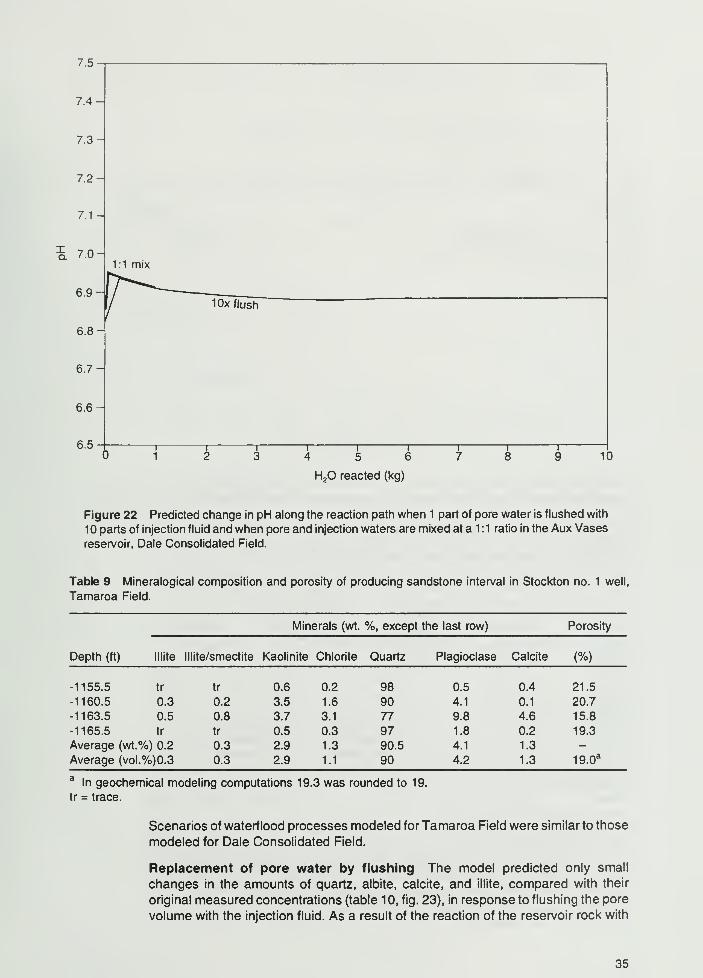
7.5
7.4-
7.3-
7.2-
7.1 -
o. 7.0 H1:1 mix
6.9
6.8-
6.7-
6.6-
6.5
1 0x flush
i 1 1 1 r2 3 4 5 6
H2 reacted (kg)
10
Figure 22 Predicted change in pH along the reaction path when 1 part of pore water is flushed with
10 parts of injection fluid and when pore and injection waters are mixed at a 1 :1 ratio in the Aux Vases
reservoir, Dale Consolidated Field.
Table 9 Mineralogical composition and porosity of producing sandstone interval in Stockton no. 1 well,
Tamaroa Field.
Minerals (wt. %, except the last row) Porosity
Depth (ft) Mite lllite/smectite Kaolinite Chlorite Quartz Plagioclase Calcite (%)
-1155.5 tr tr 0.6 0.2 98 0.5 0.4 21.5
-1160.5 0.3 0.2 3.5 1.6 90 4.1 0.1 20.7
-1163.5 0.5 0.8 3.7 3.1 77 9.8 4.6 15.8
-1165.5 tr tr 0.5 0.3 97 1.8 0.2 19.3
Average (wt %) 0.2 0.3 2.9 1.3 90.5 4.1 1.3 -
Average (vol.%)0.3 0.3 2.9 1.1 90 4.2 1.3 19.0a
aIn geochemical modeling computations 19.3 was rounded to 19.
tr = trace.
Scenarios of waterflood processes modeled for Tamaroa Field were similar to those
modeled for Dale Consolidated Field.
Replacement of pore water by flushing The model predicted only small
changes in the amounts of quartz, albite, calcite, and illite, compared with their
original measured concentrations (table 10, fig. 23), in response to flushing the pore
volume with the injection fluid. As a result of the reaction of the reservoir rock with
35
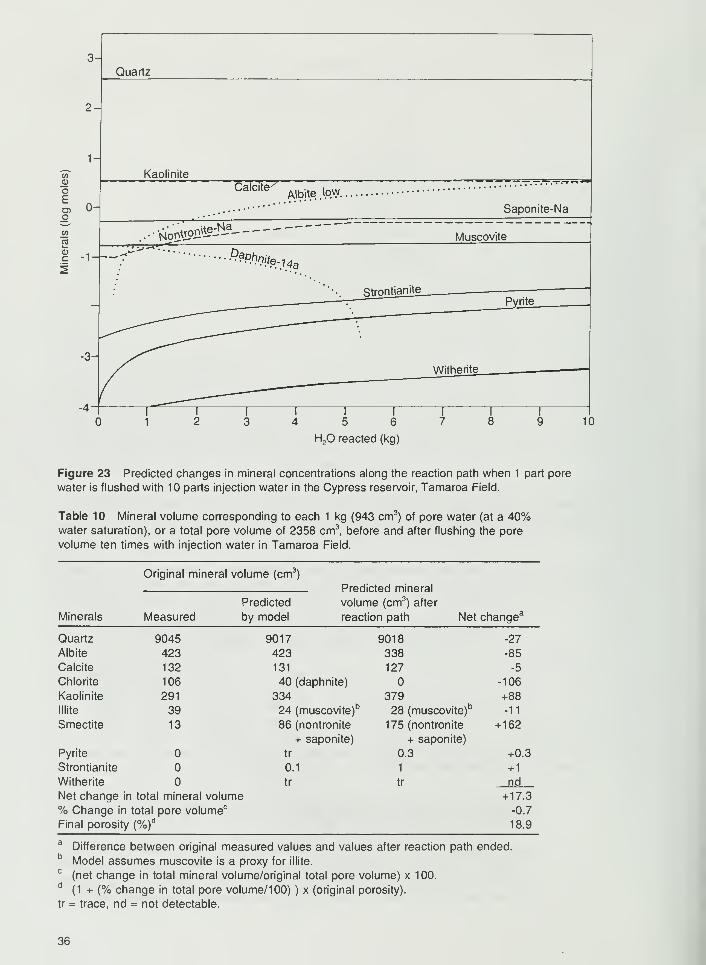
Quartz
2-
1-
(0
oE n
_o
_wCDl-
1 7
Kaolinite
Caldte/Albite low
- r "
...— " Saponite-Na
.•••^onM?Ii,- :--" Muscovite
'"P?^!te-74a
StrontianitePyrite
H2
reacted (kg)
Figure 23 Predicted changes in mineral concentrations along the reaction path when 1 part pore
water is flushed with 10 parts injection water in the Cypress reservoir, Tamaroa Field.
Table 10 Mineral volume corresponding to each 1 kg (943 cm 3) of pore water (at a 40%
water saturation), or a total pore volume of 2358 cm 3, before and after flushing the pore
volume ten times with injection water in Tamaroa Field.
Original mineral volume (cm3
)
PppHirtpH rnjnoral
Predicted volume (cm3) after
Minerals Measured by model reaction path Net change3
Quartz 9045 9017 9018 -27
Albite 423 423 338 -85
Calcite 132 131 127 -5
Chlorite 106 40 (daphnite) -106
Kaolinite 291 334 379 +88
lllite 39 24 (muscovite)b 28 (muscovite)
b-11
Smectite 13 86 (nontronite 175 (nontronite
+ saponite) + saponite)
+162
Pyrite tr 0.3 +0.3
Strontianite 0.1 1 + 1
Witherite tr tr
i total mineral volume
nd
Net change ir + 17.3
% Change in total pore volume -0.7
Final porosity (%)d
18.9
aDifference between original measured values and values after reaction path ended.
b Model assumes muscovite is a proxy for illite.
:
(net change in total mineral volume/original total pore volume) x 100.d
(1 + (% change in total pore volume/100) ) x (original porosity).
tr = trace, nd = not detectable.
36
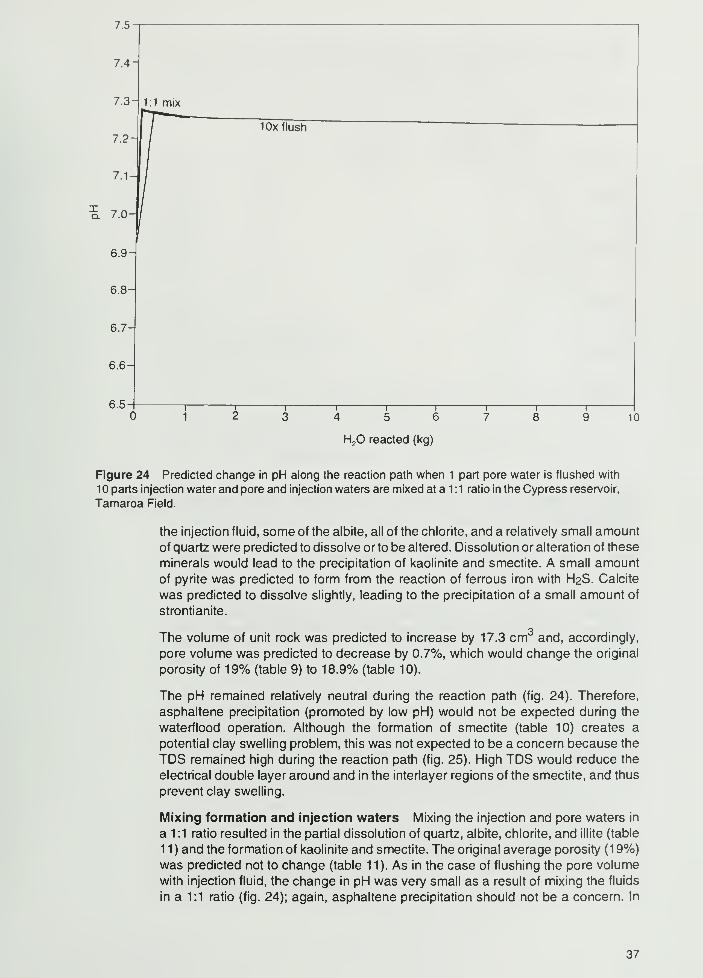
7.5
7.4-
7.3- 1:1 mix
1 0x flush
6.9H
6.8
6.7-
6.6-
6.5-
10
H2
reacted (kg)
Figure 24 Predicted change in pH along the reaction path when 1 part pore water is flushed with
1 parts injection water and pore and injection waters are mixed at a 1 : 1 ratio in the Cypress reservoir,
Tamaroa Field.
the injection fluid, some of the albite, all of the chlorite, and a relatively small amount
of quartz were predicted to dissolve or to be altered. Dissolution or alteration of these
minerals would lead to the precipitation of kaolinite and smectite. A small amount
of pyrite was predicted to form from the reaction of ferrous iron with H2S. Calcite
was predicted to dissolve slightly, leading to the precipitation of a small amount of
strontianite.
The volume of unit rock was predicted to increase by 17.3 cm3and, accordingly,
pore volume was predicted to decrease by 0.7%, which would change the original
porosity of 19% (table 9) to 18.9% (table 10).
The pH remained relatively neutral during the reaction path (fig. 24). Therefore,
asphaltene precipitation (promoted by low pH) would not be expected during the
waterflood operation. Although the formation of smectite (table 10) creates a
potential clay swelling problem, this was not expected to be a concern because the
TDS remained high during the reaction path (fig. 25). High TDS would reduce the
electrical double layer around and in the interlayer regions of the smectite, and thus
prevent clay swelling.
Mixing formation and injection waters Mixing the injection and pore waters in
a 1 :1 ratio resulted in the partial dissolution of quartz, albite, chlorite, and illite (table
1 1 ) and the formation of kaolinite and smectite. The original average porosity (1 9%)was predicted not to change (table 1 1). As in the case of flushing the pore volume
with injection fluid, the change in pH was very small as a result of mixing the fluids
in a 1:1 ratio (fig. 24); again, asphaltene precipitation should not be a concern. In
37
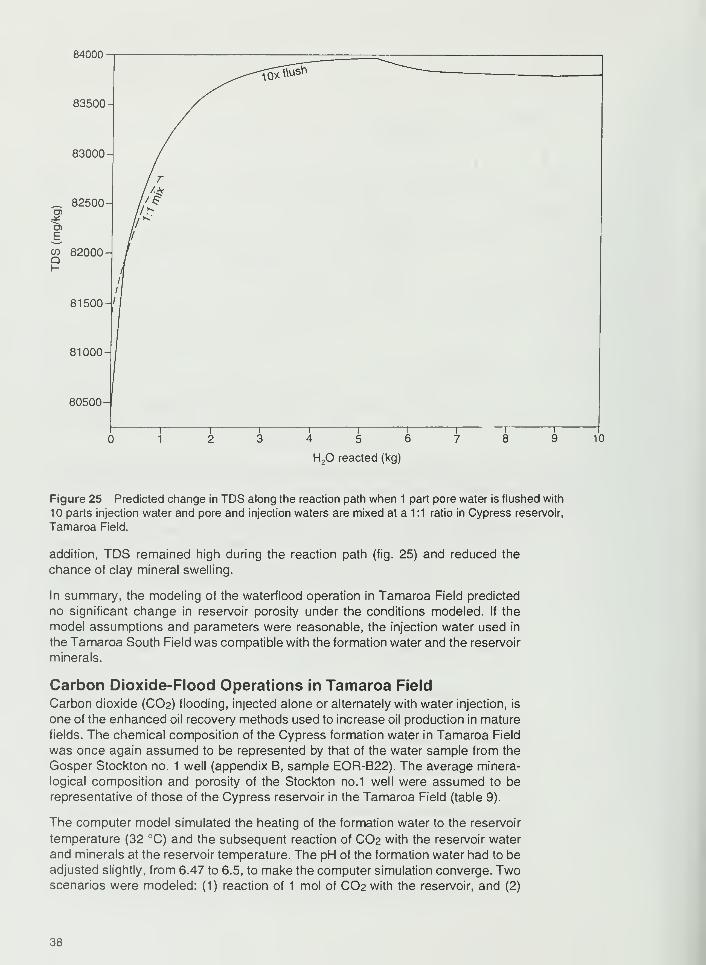
84000
83500-
83000
_ 82500-
co 82000-QH
81500-
81000-
80500-
H2
reacted (kg)
Figure 25 Predicted change in TDS along the reaction path when 1 part pore water is flushed with
10 parts injection water and pore and injection waters are mixed at a 1 :1 ratio in Cypress reservoir,
Tamaroa Field.
addition, TDS remained high during the reaction path (fig. 25) and reduced the
chance of clay mineral swelling.
In summary, the modeling of the waterflood operation in Tamaroa Field predicted
no significant change in reservoir porosity under the conditions modeled. If the
model assumptions and parameters were reasonable, the injection water used in
the Tamaroa South Field was compatible with the formation water and the reservoir
minerals.
Carbon Dioxide-Flood Operations in Tamaroa Field
Carbon dioxide (CO2) flooding, injected alone or alternately with water injection, is
one of the enhanced oil recovery methods used to increase oil production in mature
fields. The chemical composition of the Cypress formation water in Tamaroa Field
was once again assumed to be represented by that of the water sample from the
Gosper Stockton no. 1 well (appendix B, sample EOR-B22). The average minera-
logical composition and porosity of the Stockton no.1 well were assumed to be
representative of those of the Cypress reservoir in the Tamaroa Field (table 9).
The computer model simulated the heating of the formation water to the reservoir
temperature (32 °C) and the subsequent reaction of CO2 with the reservoir water
and minerals at the reservoir temperature. The pH of the formation water had to beadjusted slightly, from 6.47 to 6.5, to make the computer simulation converge. Twoscenarios were modeled: (1) reaction of 1 mol of CO2 with the reservoir, and (2)
38
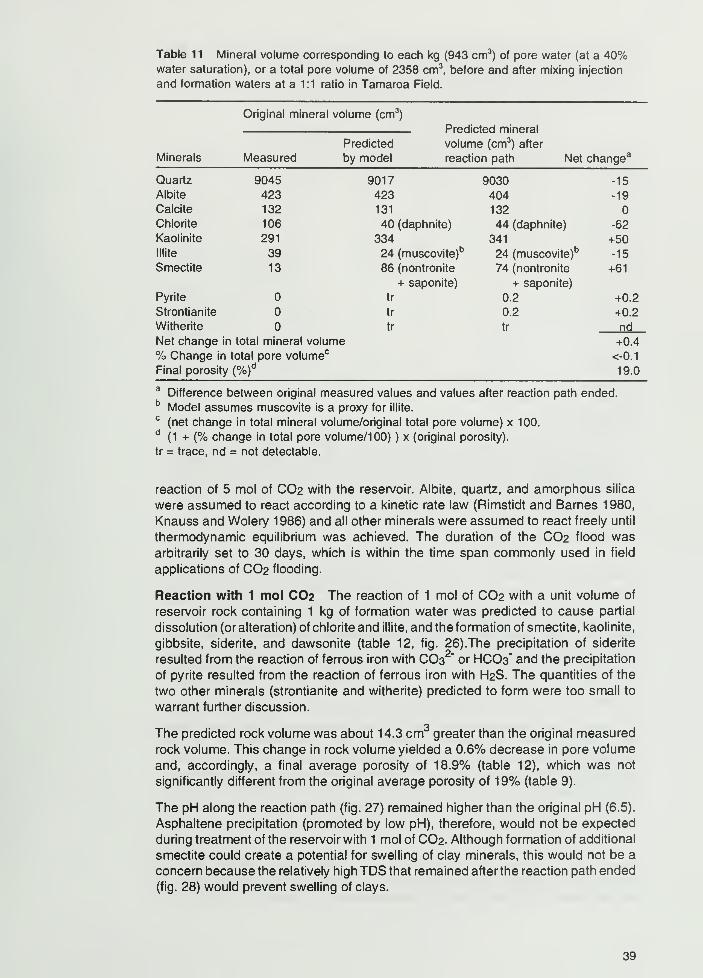
Table 11 Mineral volume corresponding to each kg (943 cm3) of pore water (at a 40%
water saturation), or a total pore volume of 2358 cm3, before and after mixing injection
and formation waters at a 1:1 ratio in Tamaroa Field.
Original mineral volume (cm3
)
PreHirtoH mineral
Predicted volume (cm3) after
Minerals Measured by model reaction path Net change3
Quartz 9045 9017 9030 -15
Albite 423 423 404 -19
Calcite 132 131 132
Chlorite 106 40 (daphnite) 44 (daphnite) -62
Kaolinite 291 334 341 +50Mite 39 24 (muscovite)
b 24 (muscovite)b -15
Smectite 13 86 (nontronite 74 (nontronite
+ saponite) + saponite)
+61
Pyrite tr 0.2 +0.2
Strontianite tr 0.2 +0.2
Witherite tr tr
i total mineral volumend
Net change ir +0.4
% Change in total pore volume <-0.1
Final porosity (%)a
19.0
Difference between original measured values and values after reaction path ended.b Model assumes muscovite is a proxy for illite.
c(net change in total mineral volume/original total pore volume) x 100.
d(1 + (% change in total pore volume/100) ) x (original porosity),
tr = trace, nd = not detectable.
reaction of 5 mol of CO2 with the reservoir. Albite, quartz, and amorphous silica
were assumed to react according to a kinetic rate law (Rimstidt and Barnes 1980,
Knauss and Wolery 1986) and all other minerals were assumed to react freely until
thermodynamic equilibrium was achieved. The duration of the CO2 flood wasarbitrarily set to 30 days, which is within the time span commonly used in field
applications of CO2 flooding.
Reaction with 1 mol CO2 The reaction of 1 mol of CO2 with a unit volume of
reservoir rock containing 1 kg of formation water was predicted to cause partial
dissolution (or alteration) of chlorite and illite, and the formation of smectite, kaolinite,
gibbsite, siderite, and dawsonite (table 12, fig. 26).The precipitation of siderite
resulted from the reaction of ferrous iron with CO32 ' or HCO3" and the precipitation
of pyrite resulted from the reaction of ferrous iron with H2S. The quantities of the
two other minerals (strontianite and witherite) predicted to form were too small to
warrant further discussion.
The predicted rock volume was about 14.3 cm3greater than the original measured
rock volume. This change in rock volume yielded a 0.6% decrease in pore volume
and, accordingly, a final average porosity of 18.9% (table 12), which was not
significantly different from the original average porosity of 19% (table 9).
The pH along the reaction path (fig. 27) remained higher than the original pH (6.5).
Asphaltene precipitation (promoted by low pH), therefore, would not be expected
during treatment of the reservoir with 1 mol of CO2. Although formation of additional
smectite could create a potential for swelling of clay minerals, this would not be a
concern because the relatively high TDS that remained after the reaction path ended
(fig. 28) would prevent swelling of clays.
39
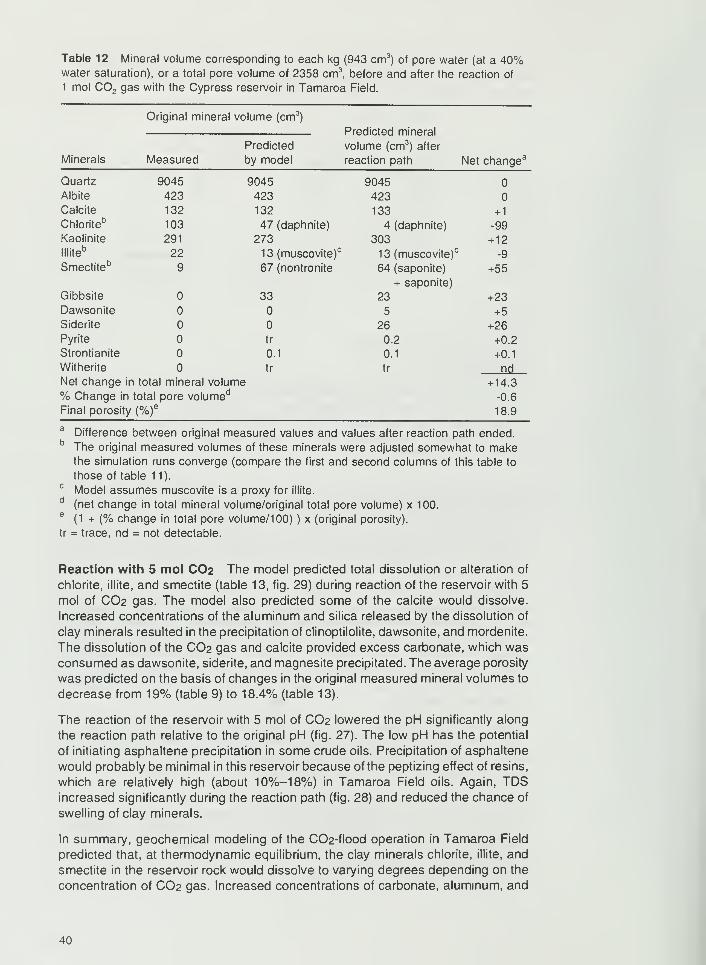
Table 12 Mineral volume corresponding to each kg (943 cm 3) of pore water (at a 40%
water saturation), or a total pore volume of 2358 cm 3, before and after the reaction of
1 mol C02 gas with the Cypress reservoir in Tamaroa Field.
Original mineral volume (cm 3
)
Predicted mineral
Predicted volume (cm 3) after
Minerals Measured by model reaction path Net change3
Quartz 9045 9045 9045Albite 423 423 423Calcite 132 132 133 + 1
Chloriteb
103 47 (daphnite) 4 (daphnite) -99
Kaolinite 291 273 303 +12lllite
b22 13 (muscovite)' 13 (muscovite) -9
Smectiteb9 67 (nontronite 64 (saponite)
+ saponite)
+55
Gibbsite 33 23 +23Dawsonite 5 +5Siderite 26 +26Pyrite tr 0.2 +0.2
Strontianite 0.1 0.1 +0.1
Witherite tr
i total mineral volumetr nd
Net change ir +14.3
% Change in total pore volumed-0.6
Final porosity (%)e
18.9
Difference between original measured values and values after reaction path ended.b The original measured volumes of these minerals were adjusted somewhat to make
the simulation runs converge (compare the first and second columns of this table to
those of table 11).c Model assumes muscovite is a proxy for illite.
d(net change in total mineral volume/original total pore volume) x 100.
e(1 + (% change in total pore volume/100) ) x (original porosity),
tr = trace, nd = not detectable.
Reaction with 5 mol CO2 The model predicted total dissolution or alteration of
chlorite, illite, and smectite (table 13, fig. 29) during reaction of the reservoir with 5
mol of CO2 gas. The model also predicted some of the calcite would dissolve.
Increased concentrations of the aluminum and silica released by the dissolution of
clay minerals resulted in the precipitation of clinoptilolite, dawsonite, and mordenite.
The dissolution of the CO2 gas and calcite provided excess carbonate, which wasconsumed as dawsonite, siderite, and magnesite precipitated. The average porosity
was predicted on the basis of changes in the original measured mineral volumes to
decrease from 19% (table 9) to 18.4% (table 13).
The reaction of the reservoir with 5 mol of CO2 lowered the pH significantly aiong
the reaction path relative to the original pH (fig. 27). The low pH has the potential
of initiating asphaltene precipitation in some crude oils. Precipitation of asphaltene
would probably be minimal in this reservoir because of the peptizing effect of resins,
which are relatively high (about 1 0%-1 8%) in Tamaroa Field oils. Again, TDSincreased significantly during the reaction path (fig. 28) and reduced the chance of
swelling of clay minerals.
In summary, geochemical modeling of the C02-flood operation in Tamaroa Field
predicted that, at thermodynamic equilibrium, the clay minerals chlorite, illite, and
smectite in the reservoir rock would dissolve to varying degrees depending on the
concentration of CO2 gas. Increased concentrations of carbonate, aluminum, and
40
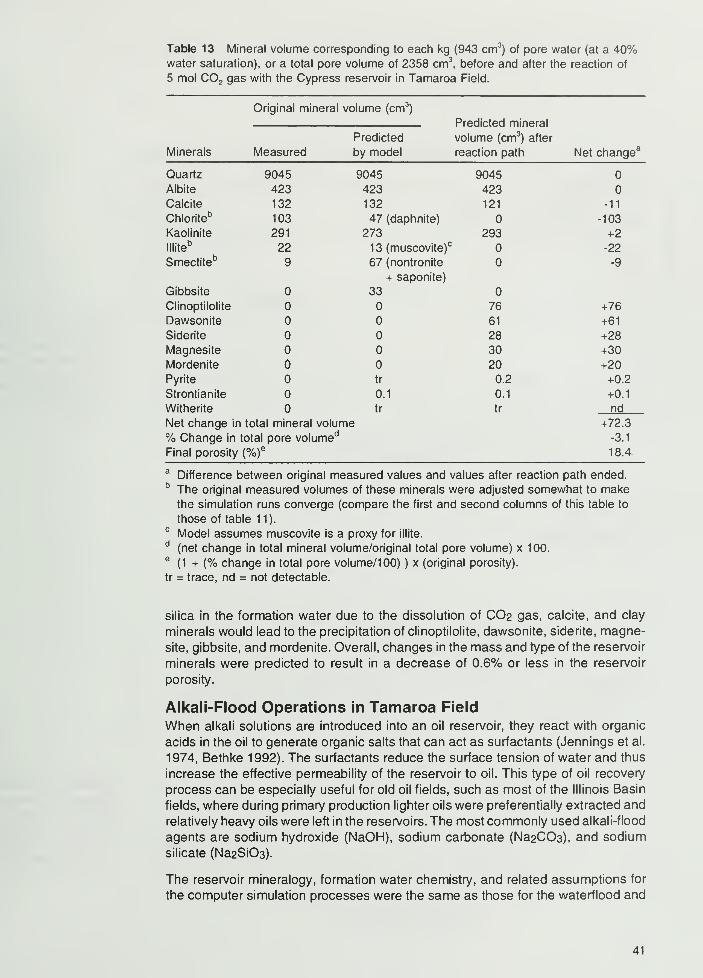
Table 13 Mineral volume corresponding to each kg (943 cm 3) of pore water (at a 40%
water saturation), or a total pore volume of 2358 cm 3, before and after the reaction of
5 mol C02 gas with the Cypress reservoir in Tamaroa Field.
Original mineral volume (cm3
)
Predicted mineral
Predicted volume (cm3
) after
Minerals Measured by model reaction path Net change3
Quartz 9045 9045 9045
Albite 423 423 423
Calcite 132 132 121 -11
Chlorite" 103 47 (daphnite) -103
Kaolinite 291 273 293 +2
llliteb 22 13 (muscovite)
c -22
Smectiteb
9 67 (nontronite
+ saponite)
-9
Gibbsite 33
Clinoptilolite 76 +76Dawsonite 61 +61
Siderite 28 +28Magnesite 30 +30
Mordenite 20 +20
Pyrite tr 0.2 +0.2
Strontianite 0.1 0.1 +0.1
Witherite tr tr nd
Net change ir i total mineral volume +72.3
% Change in total pore volumed-3.1
Final porosity (%)e
18.4.
aDifference between original measured values and values after reaction path ended.
b The original measured volumes of these minerals were adjusted somewhat to makethe simulation runs converge (compare the first and second columns of this table to
those of table 11).c Model assumes muscovite is a proxy for illite.
d(net change in total mineral volume/original total pore volume) x 100.
e(1 + (% change in total pore volume/100) ) x (original porosity),
tr = trace, nd = not detectable.
silica in the formation water due to the dissolution of CO2 gas, calcite, and clay
minerals would lead to the precipitation of clinoptilolite, dawsonite, siderite, magne-
site, gibbsite, and mordenite. Overall, changes in the mass and type of the reservoir
minerals were predicted to result in a decrease of 0.6% or less in the reservoir
porosity.
Alkali-Flood Operations in Tamaroa Field
When alkali solutions are introduced into an oil reservoir, they react with organic
acids in the oil to generate organic salts that can act as surfactants (Jennings et al.
1974, Bethke 1992). The surfactants reduce the surface tension of water and thus
increase the effective permeability of the reservoir to oil. This type of oil recovery
process can be especially useful for old oil fields, such as most of the Illinois Basin
fields, where during primary production lighter oils were preferentially extracted and
relatively heavy oils were left in the reservoirs. The most commonly used alkali-flood
agents are sodium hydroxide (NaOH), sodium carbonate (Na2CC>3), and sodium
silicate (Na2Si03).
The reservoir mineralogy, formation water chemistry, and related assumptions for
the computer simulation processes were the same as those for the waterflood and
41
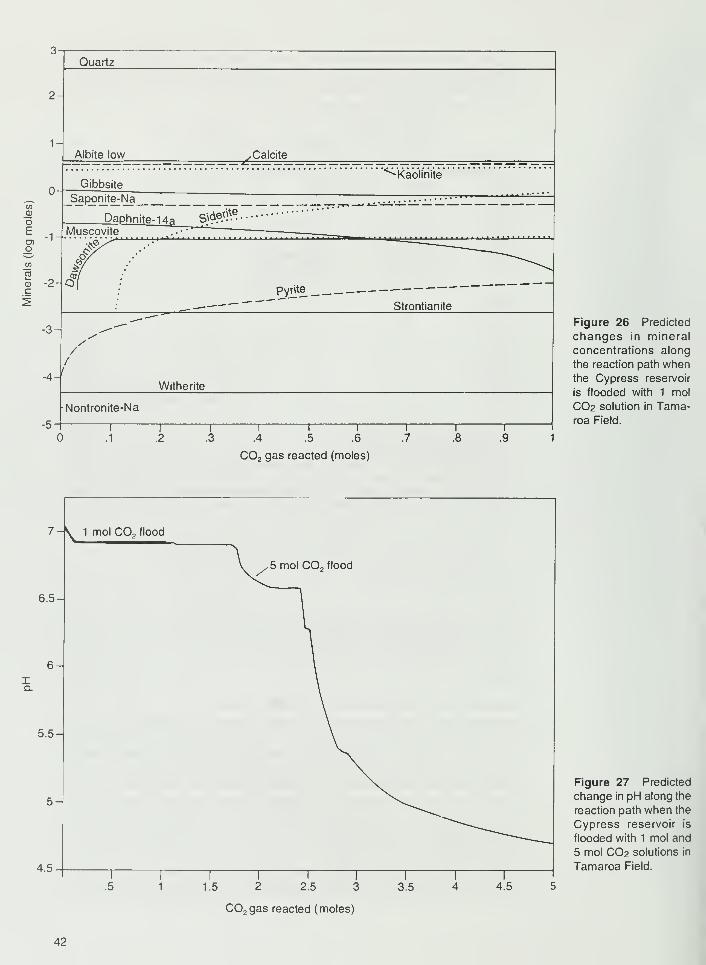
oEO)o
wCD
c
-3-
-4-
Pyrite
Strontianite
/
Witherite
-5
Nontronite-Na
.3 .6 .7 .8
r.9
Figure 26 Predicted
changes in mineral
concentrations along
the reaction path whenthe Cypress reservoir
is flooded with 1 mol
CO2 solution in Tama-roa Field.
C02 gas reacted (moles)
V
6.5-
6-IQ.
5.5-
5-
4.5
1 mol CO, flood
,5 mol C02 flood
^ ^ i i ii r
.5 1 1.5 2 2.5 3 3.5
C02 gas reacted (moles)
Figure 27 Predicted
change in pH along the
reaction path when the
Cypress reservoir is
flooded with 1 mol and
5 mol CO2 solutions in
Tamaroa Field.
4.5
42
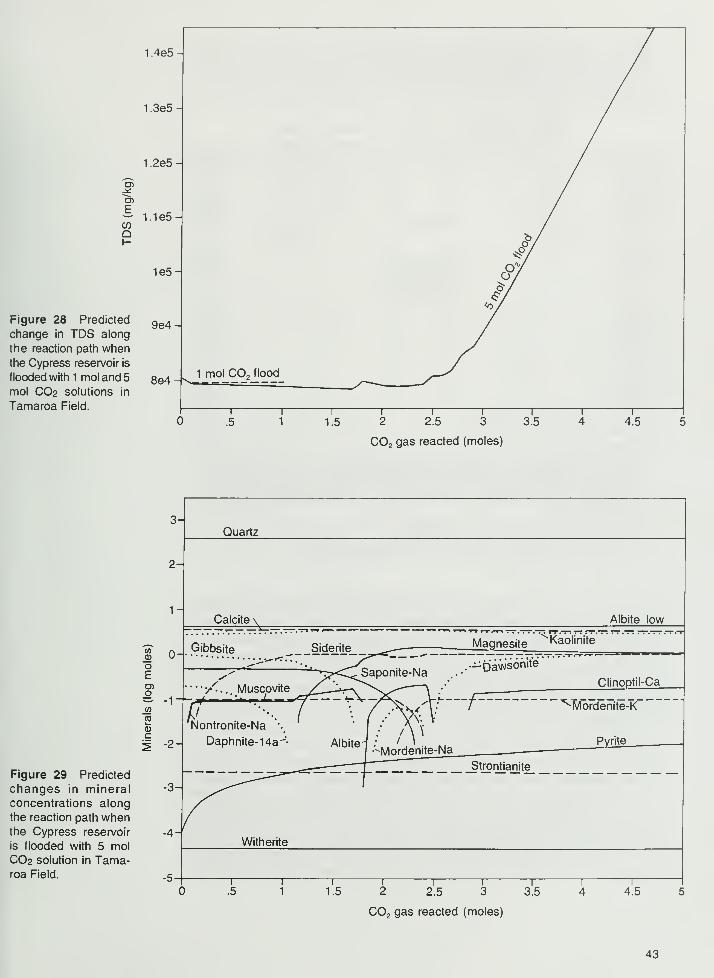
E
COa
Figure 28 Predicted
change in TDS along
the reaction path whenthe Cypress reservoir is
flooded with 1 mol and 5
mol CO2 solutions in
Tamaroa Field.
1 .4e5 -
1 ,3e5 -
1 2e5 -
1.1e5-
y1e5-
*/V
9e4-
8e4-\ 1 mol C02flood
i i i I I I I I
.5 1.5 2.5 3.5 4.5
C02gas reacted (moles)
3-
2-
Quartz
0-oEo>o
Figure 29 Predicted
changes in mineral
concentrations along
the reaction path whenthe Cypress reservoir
is flooded with 5 mol
CO2 solution in Tama-roa Field.
-2-
-3-
-4-
Calcite Albite low
Gibbsite Siderite
Muscovite
Nontronite-Na
1^
.5 1.5 2.5 3.5 4.5
C02gas reacted (moles)
43
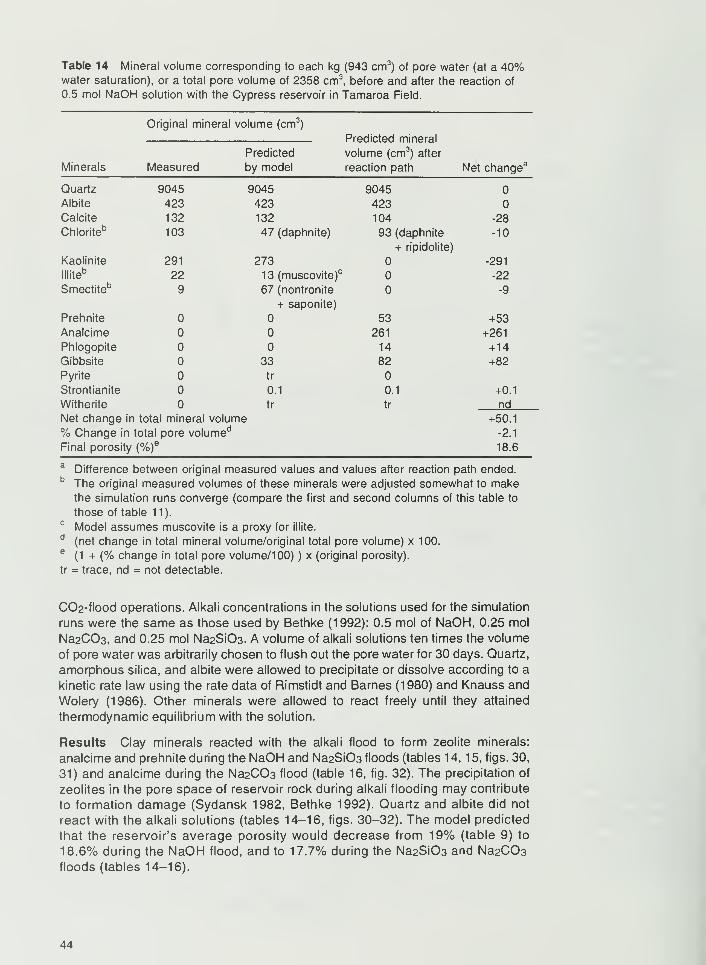
Table 14 Mineral volume corresponding to each kg (943 cm3) of pore water (at a 40%
water saturation), or a total pore volume of 2358 cm3, before and after the reaction of
0.5 mol NaOH solution with the Cypress reservoir in Tamaroa Field.
Original mineral volume (cm 3
)
Predicted mineral
Predicted volume (cm 3) after
Minerals Measured by model reaction path Net change3
Quartz 9045 9045 9045Albite 423 423 423Calcite 132 132 104 -28
Chlorite6
103 47 (daphnite) 93 (daphnite
+ ripidolite)
-10
Kaolinite 291 273 -291
llliteb
22 13 (muscovite)c -22
Smectite" 9 67 (nontronite
+ saponite)
-9
Prehnite 53 +53Analcime 261 +261
Phlogopite 14 +14Gibbsite 33 82 +82
Pyrite tr
Strontianite 0.1 0.1 +0.1
Witherite tr
i total mineral volume
tr nd
Net change ir +50.1
% Change in total pore volumed-2.1
Final porosity (%)e
18.6
Difference between original measured values and values after reaction path ended.
The original measured volumes of these minerals were adjusted somewhat to makethe simulation runs converge (compare the first and second columns of this table to
those of table 11).
Model assumes muscovite is a proxy for illite.
(net change in total mineral volume/original total pore volume) x 100.
(1 + (% change in total pore volume/100) ) x (original porosity).
= trace, nd = not detectable.
C02-flood operations. Alkali concentrations in the solutions used for the simulation
runs were the same as those used by Bethke (1992): 0.5 mol of NaOH, 0.25 mol
Na2C03, and 0.25 mol Na2Si03. A volume of alkali solutions ten times the volume
of pore water was arbitrarily chosen to flush out the pore water for 30 days. Quartz,
amorphous silica, and albite were allowed to precipitate or dissolve according to a
kinetic rate law using the rate data of Rimstidt and Barnes (1980) and Knauss and
Wolery (1986). Other minerals were allowed to react freely until they attained
thermodynamic equilibrium with the solution.
Results Clay minerals reacted with the alkali flood to form zeolite minerals:
analcime and prehnite during the NaOH and Na2Si03 floods (tables 14,15, figs. 30,
31) and analcime during the Na2C03 flood (table 16, fig. 32). The precipitation of
zeolites in the pore space of reservoir rock during alkali flooding may contribute
to formation damage (Sydansk 1982, Bethke 1992). Quartz and albite did not
react with the alkali solutions (tables 14-16, figs. 30-32). The model predicted
that the reservoir's average porosity would decrease from 19% (table 9) to
18.6% during the NaOH flood, and to 17.7% during the Na2Si03 and Na2C03floods (tables 14-16).
44
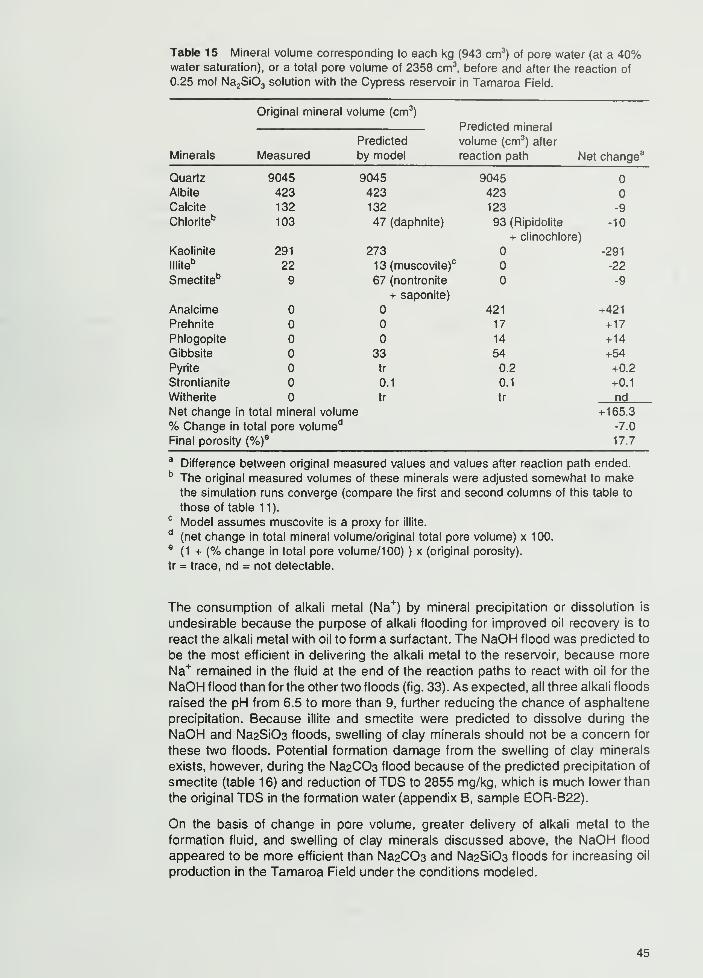
Table 15 Mineral volume corresponding to each kg (943 cm 3) of pore water (at a 40%
water saturation), or a total pore volume of 2358 cm3, before and after the reaction of
0.25 mol Na2Si0
3solution with the Cypress reservoir in Tamaroa Field.
Original mineral volume (cm 3
)
Predicted mineral
Predicted volume (cm 3) after
Minerals Measured by model reaction path Ne' t change3
Quartz 9045 9045 9045Albite 423 423 423Calcite 132 132 123 -9
Chloriteb 103 47 (daphnite) 93 (Ripidolite
+ clinochlore)
-10
Kaolinite 291 273 -291
lllite" 22 1 3 (muscovite)c -22
Smectite" 9 67 (nontronite
+ saponite)
-9
Analcime 421 +421
Prehnite 17 +17
Phlogopite 14 +14
Gibbsite 33 54 +54
Pyrite tr 0.2 +0.2
Strontianite 0.1 0.1 +0.1
Witherite tr
i total mineral volume
tr nd
Net change ir +165.3
% Change in total pore volume"3 -7.0
Final porosity (%)e
17.7
aDifference between original measured values and values after reaction path ended.
b The original measured volumes of these minerals were adjusted somewhat to makethe simulation runs converge (compare the first and second columns of this table to
those of table 11).c Model assumes muscovite is a proxy for illite.
d(net change in total mineral volume/original total pore volume) x 100.
e(1 + (% change in total pore volume/100) ) x (original porosity),
tr = trace, nd = not detectable.
The consumption of alkali metal (Na+
) by mineral precipitation or dissolution is
undesirable because the purpose of alkali flooding for improved oil recovery is to
react the alkali metal with oil to form a surfactant. The NaOH flood was predicted to
be the most efficient in delivering the alkali metal to the reservoir, because more
Na+remained in the fluid at the end of the reaction paths to react with oil for the
NaOH flood than for the other two floods (fig. 33). As expected, all three alkali floods
raised the pH from 6.5 to more than 9, further reducing the chance of asphaltene
precipitation. Because illite and smectite were predicted to dissolve during the
NaOH and Na2Si03 floods, swelling of clay minerals should not be a concern for
these two floods. Potential formation damage from the swelling of clay minerals
exists, however, during the Na2C03 flood because of the predicted precipitation of
smectite (table 16) and reduction of TDS to 2855 mg/kg, which is much lower than
the original TDS in the formation water (appendix B, sample EOR-B22).
On the basis of change in pore volume, greater delivery of alkali metal to the
formation fluid, and swelling of clay minerals discussed above, the NaOH flood
appeared to be more efficient than Na2C03 and Na2Si03 floods for increasing oil
production in the Tamaroa Field under the conditions modeled.
45
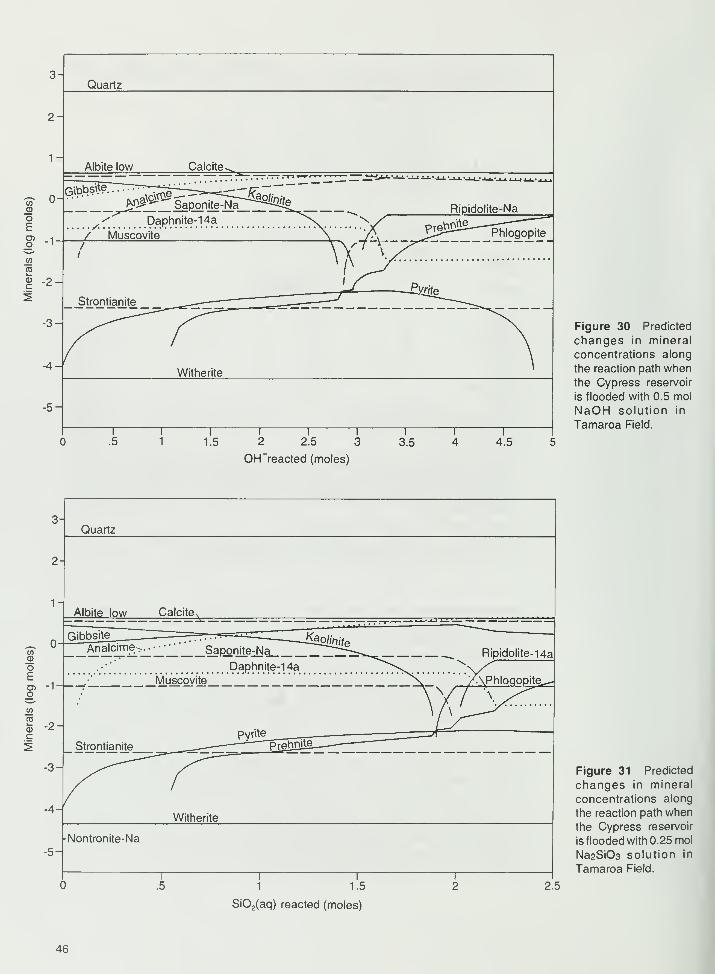
Figure 30 Predicted
changes in mineral
concentrations along
the reaction path whenthe Cypress reservoir
is flooded with 0.5 mol
NaOH solution in
Tamaroa Field.
2 2.5
OH "reacted (moles)
Figure 31 Predicted
changes in mineral
concentrations along
the reaction path when
the Cypress reservoir
is flooded with 0.25 mol
Na2Si03 solution in
Tamaroa Field.
1 1.5
Si02(aq) reacted (moles)
46
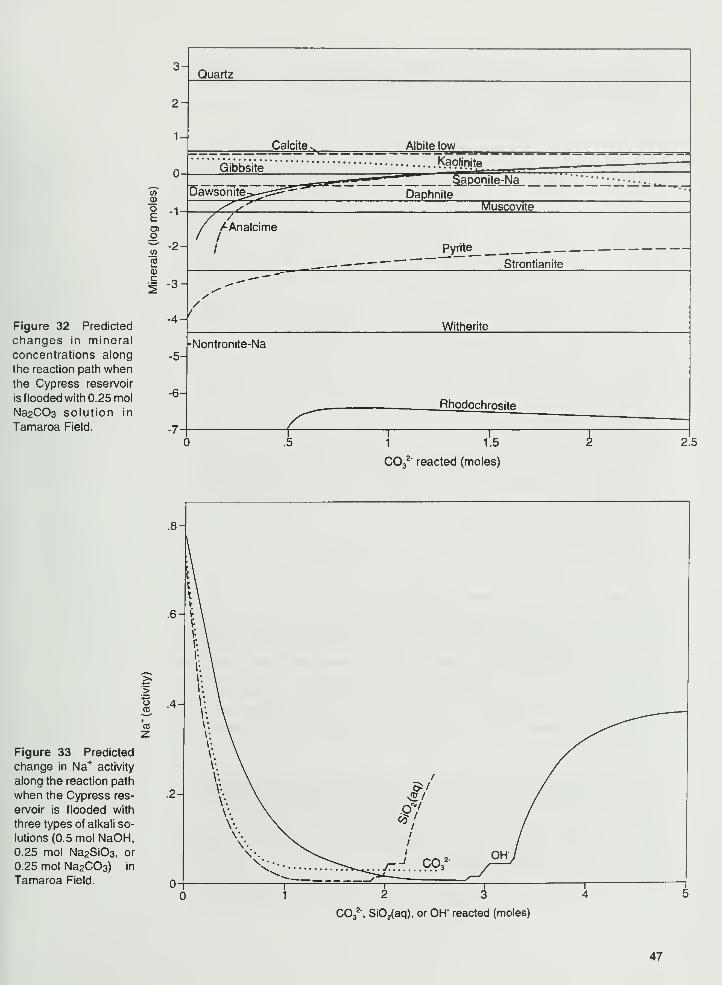
Figure 32 Predicted
changes in mineral
concentrations along
the reaction path whenthe Cypress reservoir
is flooded with 0.25 mol
Na2CC"3 solution in
Tamaroa Field.
>o
Figure 33 Predicted
change in Na+activity
along the reaction path
when the Cypress res-
ervoir is flooded with
three types of alkali so-
lutions (0.5 mol NaOH,0.25 mol Na2Si03, or
0.25 mol Na2C03) in
Tamaroa Field.
C03
2' reacted (moles)
.8-
.4-
C032', Si02(aq), or OH' reacted (moles)
47
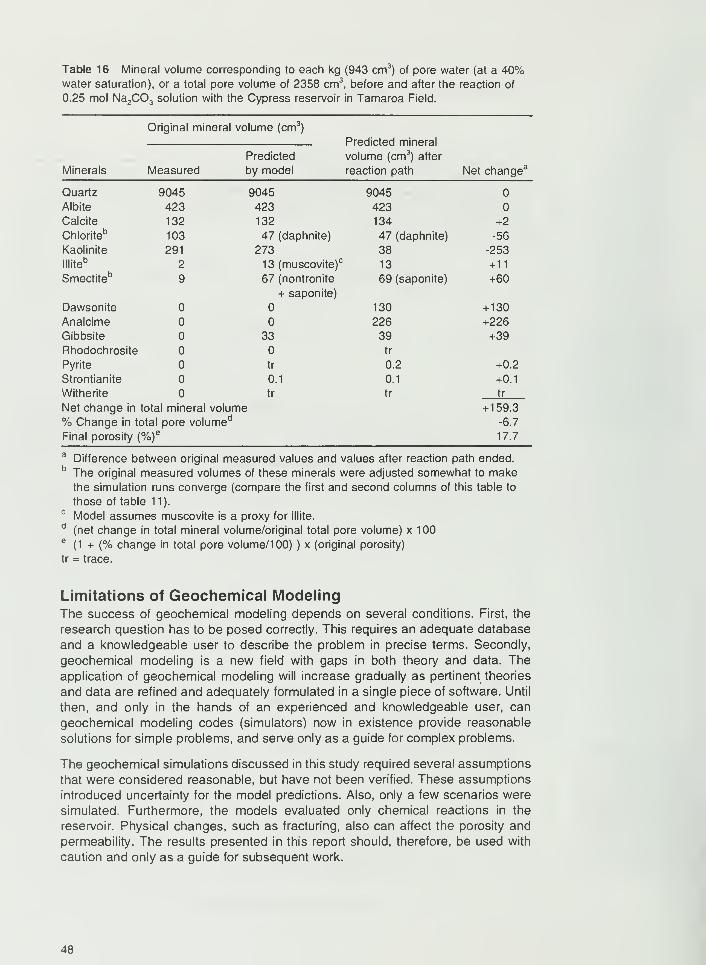
Table 16 Mineral volume corresponding to each kg (943 cm 3) of pore water (at a 40%
water saturation), or a total pore volume of 2358 cm 3, before and after the reaction of
0.25 mol Na2C03
solution with the Cypress reservoir in Tamaroa Field.
Original mineral volume (cm3
)
Predicted mineral
Predicted volume (cm 3) after
Minerals Measured by model reaction path Net change3
Quartz 9045 9045 9045
Albite 423 423 423
Calcite 132 132 134 +2
Chlorite6 103 47 (daphnite) 47 (daphnite) -56
Kaolinite 291 273 38 -253
llliteb
2 13 (muscovite)' 13 +11
Smectiteb
9 67 (nontronite
+ saponite)
69 (saponite) +60
Dawsonite 130 + 130
Analcime 226 +226
Gibbsite 33 39 +39
Rhodochrosite tr
Pyrite tr 0.2 +0.2
Strontianite 0.1 0.1 +0.1
Witherite tr
total mineral volume
tr tr
Net change in +159.3
% Change in total pore volumed-6.7
Final porosity (%)e
17.7
Difference between original measured values and values after reaction path ended.b The original measured volumes of these minerals were adjusted somewhat to make
the simulation runs converge (compare the first and second columns of this table to
those of table 11).c Model assumes muscovite is a proxy for illite.
d(net change in total mineral volume/original total pore volume) x 100
e(1 + (% change in total pore volume/100) ) x (original porosity)
tr = trace.
Limitations of Geochemical ModelingThe success of geochemical modeling depends on several conditions. First, the
research question has to be posed correctly. This requires an adequate database
and a knowledgeable user to describe the problem in precise terms. Secondly,
geochemical modeling is a new field with gaps in both theory and data. The
application of geochemical modeling will increase gradually as pertinent theories
and data are refined and adequately formulated in a single piece of software. Until
then, and only in the hands of an experienced and knowledgeable user, can
geochemical modeling codes (simulators) now in existence provide reasonable
solutions for simple problems, and serve only as a guide for complex problems.
The geochemical simulations discussed in this study required several assumptions
that were considered reasonable, but have not been verified. These assumptions
introduced uncertainty for the model predictions. Also, only a few scenarios were
simulated. Furthermore, the models evaluated only chemical reactions in the
reservoir. Physical changes, such as fracturing, also can affect the porosity and
permeability. The results presented in this report should, therefore, be used with
caution and only as a guide for subsequent work.
48
SUMMARY AND CONCLUSIONS
About 100 formation water samples were collected from oil wells producing from
reservoirs in the Mississippian Aux Vases and Cypress Formations. The samples
were analyzed in the field and laboratory for various geochemical parameters (pH,
Eh, resistivity, and concentrations of aqueous species). The geochemical compo-sition of the formation water samples, along with mineralogical compositions of core
samples from the Aux Vases and Cypress Formations, were used to aid geological
interpretation and reservoir analysis to improve oil recovery from these two forma-
tions. The findings and conclusions are summarized as follows:
•
•
•
The Cl-Br relationship in waters from the Aux Vases and Cypress Formations
suggest that these waters have a halite dissolution component and probably an
evaporated seawater component. The formation waters were depleted of K and
Mg relative to the seawater evaporation trajectory. Depletion of K and Mgsuggests that the original trapped seawater was either replaced or mixed with
waters containing low ratios of K/Br and Mg/Br, or modified by diagenetic
reactions. The concentrations of dissolved K and Mg were generally higher in the
Aux Vases Formation than in the Cypress Formation, which is relatively poor in
K- and Mg-bearing clay minerals and K-feldspar relative to the Aux Vases
Formation. The implications are that the K- and Mg-rich clay minerals and
K-feldspars in the Aux Vase and Cypress are detrital and/or formed primarily prior
to the emplacement of the present day subsurface waters. Ultimately these clay
minerals and K-feldspars contributed K and Mg to the formation waters through
dissolution. Dissolution and recrystallization of calcite appeared to significantly
influence Ca and Sr concentrations in solution. The observed Ca concentrations
in excess of amounts that would be provided by calcite dissolution were probably
caused by albitization of detrital plagioclase and possibly by partial dolomitization
of calcite.
Variations in water chemistry in a given reservoir in the same field can indicate
a lack of communication between different pools, or mineralogical heterogeneity
within the reservoir. Therefore, formation water data provided in this study maybe used to aid geological interpretations in relation to hydrocarbon production.
The formation water resistivities and TDS data included in this report can be used
to calculate water saturations and permeabilities in oil reservoirs in the Aux Vasesand Cypress Formations. Empirical relationships were determined to calculate
the electrical resistivity from the TDS or, vice versa, at any temperature encoun-
tered within the Aux Vases and Cypress Formations. The areal distributions of
all available resistivity and TDS data for the two formations were mapped. These
maps are useful for estimating TDS and resistivity in areas where data are
unavailable.
In oil reservoirs, disturbance produced in water-rock systems by changes in
temperature or pressure and reactions with externally introduced fluids can result
in serious formation damage, which reduces oil production. Minerals that com-monly precipitate in reservoirs and boreholes during primary production and thus
reduce production are calcite, aragonite, gypsum, anhydrite, celestite, barite, and
various Fe-sulfide minerals. The saturation indexes of these minerals in randomly
selected Aux Vases and Cypress formation waters were calculated under reser-
voir conditions. The results indicated that most of the samples were saturated or
supersaturated with respect to calcite, barite, and Fe-sulfides. Saturation with
49
respect to these minerals suggests that they can potentially precipitate if geo-
chemical parameters, such as pressure, temperature, ionic strength, and chemi-
cal composition of the reservoir water, change.
• Computerized geochemical models can help in predicting the results of fluid-rock
interactions during improved oil recovery processes. The reaction path model
REACT was used in this study to simulate the chemical aspects of improved oil
recovery processes in three fields under selected scenarios. The volume of
minerals that precipitated and/or dissolved and the accompanying changes in
porosity were calculated.
• Geochemical modeling predicted a consistent increase in pore volume
in the zone adjacent to a well bore, if a production well in the Energy
Field was treated with 15% or 7.5% HCI-MCA. The higher acidity and
dissolved iron concentration caused by treatment with 15% HCI-MCArelative to those caused by treatment with 7.5% HCI-MCA were pre-
dicted to increase the chance of asphaltene precipitation.
• The simulations of geochemical reactions of waterflood operations in
the Dale Consolidated and Tamaroa Fields predicted little change in
porosity. Therefore, injection waters used in these operations were
judged to be compatible with the reservoirs.
• In addition to waterflood operations, two other improved oil recovery
processes, CO2 and alkali (NaOH, Na2C03, and Na2Si03) floods, were
simulated for the Tamaroa Field. Geochemical modeling of the CO2-flood operation predicted a small or negligible decrease in reservoir
porosity. Simulation of alkali-flood operations indicated that clay min-
erals reacted with the alkali to form zeolites, a special concern for
formation damage. The purpose of alkali flooding is to allow the alkali
metal (Na+
in this case) to react with oil to form surfactants, which
improve the effective permeability to oil. The NaOH flood was predicted
to be the most efficient in delivering alkali metal to the reservoir and to
have the least adverse effect on the reservoir porosity.
• Because natural processes are complex, extreme caution should be
taken when geochemical modeling is used for prediction purposes. Thegeochemical simulations discussed in this report were based on several
unverified assumptions, and only a limited number of scenarios were
modeled. Therefore, the results should serve only as an introduction
and guide for future work in this area.
ACKNOWLEDGMENTS
I particularly thank R. T. Black for his technical assistance in contacting the oil
companies and in collecting and processing the samples. I thank D. S. Beaty for his
selfless assistance in sample collection and for providing, along with R. E. Hughes
and D. M. Moore, the mineralogical data. I am grateful to J. D. Steele of the ISGSand D. S. Dickerson of ARDL, Mt. Vernon, Illinois, who produced the solute
concentrations data for the formation water samples. I also thank W. R. Roy, W. T.
Frankie, G. B. Dreher, D. M. Moore, and J. H. Goodwin for critically reviewing the
50
manuscript. Finally, I greatly appreciate the guidance, support, and good sense of
humor of D. F. Oltz, the overall project leader.
This research was funded by the U.S. Department of Energy, Grant DE-FG22-89BC14250, and the Illinois Department of Energy and Natural Resources, Grant
AE-45. This support is gratefully acknowledged.
REFERENCES
Allison, J.D., D.S. Brown, and K.J. Novo-Gradac, 1991, MINTEQA2/PRODEFA2,A Geochemical Assessment Model for Environmental Systems, Version 3.0
User's Manual: U.S. Environmental Protection Agency, EPA/600/3-91/021, Ath-
ens, GA.
Archie, G.E., 1942, The electrical resistivity log as an aid in determining somereservoir characteristics: Transactions of AIME, v. 146, p. 54-62.
ASTM, 1976, Water (Part 31): Annual Book of ASTM Standards, 956 p.
Ball, J.W., E.A. Jenne, and M.W. Cantrell, 1981, WATEQ3—A Geochemical Model
with Uranium Added: U.S. Geological Survey, Open File Report 81-1 183, 81 p.
Ball, J.W., and D.K. Nordstrom, 1991, User's Manual for WATEQ4F, with Revised
Thermodynamic Data Base and Test Cases for Calculating Speciation of Major,
Trace, and Redox Elements in Natural Waters: U.S. Geological Survey, OpenFile Report 91-183, 193 p.
Bethke, CM., 1992, Geochemical Reaction Modeling Short Course Work Book:
Hydrogeology Program, University of Illinois at Urbana-Champaign, 275 p.
Bethke, CM., 1986, Hydrologic constraints on the genesis of the Upper Mississippi
Valley mineral district from Illinois Basin brines: Economic Geology, v. 81,
p. 233-249.
Bethke, CM., and S. Marshak, 1990, Brine migration across North America—Theplate tectonics of groundwater: Annual Review of Earth Planetary Science, v. 1 8,
p. 287-315.
Blount, C.W., and F.W. Dickson, 1969, The solubility of anhydrite (CaS04) in
NaCI-H20 from 100 to 450 °C and 1 to 1000 bars: Geochimica CosmochimicaActa, v. 33, p. 227-245.
Carothers, W.W., and Y.K. Kharaka, 1978, Aliphatic acid anions in oil field waters
—Implications for origin of natural gas: Association of American Petroleum
Geologists Bulletin, v. 62, p. 2441-2453.
Carpenter, A.B., 1978, Origin and chemical evolution of brines in sedimentary
basins: Oklahoma Geological Survey Circular, v. 79, p. 60-77.
Choquette, P.W., and R.P. Steinen, 1980, Mississippian non-supratidal dolomite,
Ste. Genevieve Limestone, Illinois Basin: Evidence for mixed-water dolomitiza-
tion, in D. H. Zenger, J. B. Dunham, and R. L. Ethington, editors, Concept and
Models of Dolomitization: Society of Economic Paleontologists and Mineralogists
Special Publication 28, p. 163-196.
Clayton, N.R., I. Friedman, D.L Graf, T.K. Mayeda, W.F. Meents, and N.F. Shimp,
1966, The origin of saline formation waters: I. Isotopic composition: Journal of
Geophysical Research, v. 71, p. 3869-3882.
LIBRARY
AUG 2 9 1995
,L GEOL SURVEY51
Collins, G.A.,1975, Geochemistry of Oil Field Waters: Elsevier, New York, p. 496.
Collins, G.A., and M.B. Kayser, 1985, Interaction, Compatibilities, and Long-TermEnvironmental Fate of Deep-Well- Injected EOR Fluids and/or Waste Fluids with
Reservoir Fluids and Rocks—State of the Art: National Institute for Petroleum
and Energy Research, Report NIPER-70 (DE85000146) 103 p.
Das, N., J. Horita, and H.D. Holland, 1990, Chemistry of fluid inclusions in halite
from the Salina Group of Michigan Basin—Implications for Late Silurian seawater
and origin of sedimentary brines: Geochimica et Cosmochimica Acta, v. 54,
p. 319-327.
Davis, J.W., and A.G. Collins, 1971, Solubility of barium and strontium sulfates in
strong electrolyte solutions: Environmental Science Technolology, v. 5, p. 1039-
1043.
Dickinson, G., 1953, Geological aspects of abnormal reservoir pressure in Gulf
Coast Louisiana: American Association of Petroleum Geologists Bulletin, v. 37,
p. 4100-432.
Drever, J. I., 1988, The Geochemistry of Natural Waters: Prentice Hall, Englewood
Cliffs, New Jersey 437 p.
Duan, Z.N. Moller, J. Greenberg, and J.H. Weare, 1992, The prediction of methane
solubility in natural waters to high ionic strength from to 250 °C and from to
1600 bar: Geochimica et Cosmochimica Acta, v. 56, p. 1451-1460.
Felmy, A.R., D.C. Girvin, and E.A. Jenne, 1984, MINTEQ—A Computer Program
for Calculating Aqueous Geochemical Equilibria: United States Environmental
Protection Agency, EPA-600/3-84-032, Athens, GA, 86 p.
Fletcher, G.E., T.R. French, and A.G. Collins, 1981, A Method for Calculating
Strontium Sulfate Solubility: U.S. Department of Energy, DOE/BETC/RI-80/10,
17 p.
Frape, S.K., P. Fritz, and R.H. McNutt, 1984, Water-rock interaction and chemistry
of groundwaters from the Canadian shield: Geochimica et Cosmochimica Acta,
v. 48, p. 1617-1627.
Fulford, R.S., 1968, Effects of brine concentration and pressure drop on gypsumscaling in oil wells: Journal of Petroleum Technology, v. 20, p. 559-564.
Garrels, R.M., and M.E. Thompson, 1962, A chemical model for seawater at 25 °C
and one atmosphere total pressure: American Journal of Science, v. 260,
p. 57-66.
Graf, D.L., W.F. Meents, and N.F. Shimp, 1966, The Origin of Saline Formation
Waters, III—Calcium Chloride Waters: Illinois State Geological Survey, Circular
397, 60 p.
Grube, J. P., 1992, Reservoir Characterization and Improved Oil Recovery from
Multiple Bar Sandstones, Cypress Formation, Tamaroa and Tamaroa South
Fields, Perry County, Illinois: Illinois State Geological Survey, Illinois Petroleum
Series 138, 49 p.
Haggerty, D.J., and B. Seyler, in preparation, Experimental Investigation of Forma-
tion Damage Caused by Mud Cleaning Acids and Injection Waters in Aux Vases
Sandstone Reservoirs: Illinois State Geological Survey, Illinois Petroleum Series.
Hanor, J.S., 1987, Origin and Migration of Subsurface Sedimentary Brines: Society
of Economic Paleontologists and Mineralogists Short Course No. 21, 247 p.
52
Helgeson, H.C., R.M. Garrels, and FT. Mackenzie, 1969, Evaluation of irreversible
reactions in geochemical processes involving minerals and aqueous solutions:
II, Applications: Geochimica et Cosmochimica Acta, v. 33, p. 455-481
.
Helgeson, H.C., T.H. Brown, A. Nigrini, and T.A. Jones, 1970, Calculation of masstransfer in geochemical processes involving aqueous solutions: Geochimica et
Cosmochimica Acta, v. 34, p. 569-592.
Hitchon, B., G.K. Billings, and J.E. Klovan, 1971, Geochemistry and origin of
formation waters in the western Canada sedimentary basin-Factors controlling
chemical composition: Geochimica et Cosmochimica Acta, v. 35, p. 567-598.
ISGS Oil and Gas Section, 1993, Improved and Enhanced Oil Recovery in Illinois
by Reservoir Characterization—Standard Operating and QA/QC Procedures:
Illinois State Geological Survey, Open File Series 1993-13, 174 p.
Jennings, H.Y., Jr., C.E. Johnson, Jr., and CD. McAuliffe, 1974, A caustic water
flooding process for heavy oils: Journal of Petroleum Technology, v. 26,
p. 1344-1352.
Kharaka, Y.K., and I. Barnes, 1973, SOLMINEQ: Solution—mineral—equilibrium
Computations: U.S. Geological Survey Computer Contributions, NTIS no.
PB21 5-899, 81 p.
Kharaka, Y.K., W.D. Gunter, P.K. Aggarwal, R.W. Hull, and E.H. Perkins, 1988,
SOLMINEQ88: A Computer Program for Geochemical Modeling of Water-Rock
Interactions: U.S. Geological Survey, Water Resources Investigations Report
88-4227, 420 p.
Kharaka, Y.K., L.M. Law, W.W. Carothers, W.W., and D.F. Goerlitz, 1986, Role of
organic species dissolved in formation waters from sedimentary basins in mineral
diagenesis, in D. Gautier, editor, Relationship of Organic Matter and Sediment
Diagenesis: Society of Economic Paleontologists and Mineralogists Special
Publication, v. 38, p. 111-122.
Knauss, K.J., and T.J. Wolery, 1986, Dependence of albite dissolution kinetics on
pH and time at 25 °C and 70 °C: Geochimica et Cosmochimica Acta, v. 50,
p. 2481-2497.
Land, L.S., 1983, Dolomitization: American Association of Petroleum Geologists,
Education Course Note Series 24, 20 p.
Land, L.S., and G.L. Macpherson, 1 992, Origin of saline formation waters, Cenozoic
section, Gulf of Mexico Sedimentary Basin: American Association of Petroleum
Geologists Bulletin, v. 76, p. 1344-1362.
Land, L.S., and D.R. Prezbindowski, 1981, The origin and evolution of saline
formation water, Lower Cretaceous carbonates, south-central Texas, U.S.A.:
Journal of Hydrology, v. 54, p. 51-74.
Land, L.S., and D.R. Prezbindowski, 1985, Chemical constraints and origins of four
groups of Gulf Coast reservoir fluids—Discussion: American Association of
Petroleum Geologists Bulletin, v. 69, p. 119-121.
Leetaru, H.E., 1990, Application of Old Electrical logs in the Analysis of Aux Vases
Sandstone (Mississippian) Reservoirs in Illinois: Illinois State Geological Survey,
Illinois Petroleum 134, 21 p.
53
Lico, M.S., Y.K. Kharaka, W.W. Carothers, and V.A. Wright, 1982, Methods for
Collection and Analysis of Geopressured Geothermal and Oil Field Waters: U.S.
Geological Survey, Water Supply Paper 21 94, 21 p.
Macpherson, G.L., 1992, Regional variations in formation water chemistry: Major
and minor elements, Frio formation fluids, Texas: American Association of
Petroleum Geologists Bulletin, v. 76, p. 740-757.
Mattes, B. W., and E.W. Mountjoy, 1 980, Burial dolomitization of the Upper DevonianMiette Buildup, Jasper National Park, Alberta, in D. H. Zenger, J. B. Dunham,and R. L. Ethington, editors, Concept and Models of Dolomitization: Society of
Economic Paleontologists and Mineralogists Special Publication 28, p. 259-297
Moldovanyi, E.P., and L.M. Walter, 1992, Regional trends in water chemistry,
Smackover formation, Southwest Arkansas—Geochemical and physical con-
trols: American Association of Petroleum Geologists Bulletin, v. 76, p. 864-894.
Morton, R.A.,andL.S. Land, 1987, Regional variations in formation water chemistry,
Frio formation (Oligocene), Texas Gulf Coast: American Association of Petro-
leum Geologists Bulletin, v. 71, p. 191-206.
Nesbitt, H.W., 1980, Characterization of mineral-formation water interactions in
carboniferous sandstones and shales of the Illinois Sedimentary Basin: American
Journal of Science, v. 280, p. 607-630.
Nesbitt, H.W., 1985, A chemical equilibrium model for the Illinois Basin formation
waters: American Journal of Science, v. 285, p. 436-458.
Parkhurst, D.L., D.C. Thorstenson, and L.N. Plummer, 1980, PHREEQE—A Com-puter Program for Geochemical Calculations: U.S. Geological Survey, Water
Resources Investigation Report 80-96, 210 p.
Plummer, L.N., B.F. Jones, and A.H. Truesdell, 1976, WATEQF—A FORTRAN IV
Version of WATEQ, A Computer Program for Calculating Chemical Equilibrium
of Natural Waters: U.S. Geological Survey, Water Resources Investigation
Report 76-13, 310 p.
Plummer, L.N., D.L. Parkhurst, G.W. Fleming, and S.A. Dunkle, 1988, A Computer
Program Incorporating Pitzer's Equations for Calculation of Geochemical Reac-
tions in Brines, U.S. Geological Survey, Water Resources Investigation Report
88-4153.
Pollack, H.N., and D. Watts, 1976, Thermal profile of the Michigan Basin: EOS,v. 57, 595 p.
Reed, M.H., 1982, Calculation of multicomponent chemical equilibria and reaction
processes in systems involving minerals, gases, and aqueous phase: Geo-
chimica et Cosmochimica Acta, v. 46, p. 513-528.
Rimstidt, J.D., and H.L. Barnes, 1980, The kinetics of silica-water reactions:
Geochimica et Cosmochimica Acta, v. 44, p. 1683-1699.
Rittenhouse, G., 1967, Bromine in oil field waters and its use in determining
possibilities of origin of these waters: American Association of Petroleum Geolo-
gists Bulletin, v. 51, p. 2430-2440.
Sanders, L.L., 1991, Geochemistry of formation waters from the Lower Silurian
Clinton formation (Albion Sandstone), Eastern Ohio: American Association of
Petroleum Geologists Bulletin, v. 75, p. 1593-1609.
54
Schlumberger Log Interpretation Charts for 1989: Schlumberger Education Serv-
ices, Houston, TX, 150 p.
Sibley, D.F., R.E. Dedoes, and T.R. Bartlett, 1987, Kinetics of dolomitization:
Geology, v. 15, p. 1112-1114.
Spycher, N.F., and M.H. Reed, 1989a, SOLVEQ—A Computer Program for Com-puting Aqueous-Mineral-Gas Equilibria (Revised Preliminary Edition): Depart-
ment of Geological Sciences, University of Oregon, Eugene, 36 p.
Spycher, N.F., and M.H. Reed, 1989b, CHILLER—A Program for ComputingWater-Rock Reactions, Boiling, Mixing and Other Reaction Processes in Aque-ous-Mineral-Gas Systems (Revised Preliminary Edition): Departmental of Geo-logical Sciences, University of Oregon, Eugene, 64 p.
Stoessell, R.K., and A.B. Carpenter, 1986, Stoichiometric saturations tests of
NaCli-xBrx and KCIi-xBrx : Geochimica et Cosmochimica Acta, v. 50, p. 465-
1474.
Stueber, A.M., and L.M. Walter, 1991, Origin and chemical evolution of formation
waters from Silurian-Devonian strata in the Illinois Basin: Geochimica et Cosmo-chimica Acta, v. 55, p. 309-325.
Stueber, A.M., L.M. Walter, T.J. Huston, and P. Pushkar, P., 1 993, Formation waters
from Mississippian-Pennsylvanian reservoirs, Illinois Basin, USA—Chemical and
isotopic constraints on evolution and migration: Geochimica et Cosmochimica
Acta, v. 57, p. 763-784.
Sydansk, R.D., 1982, Elevated-temperature caustic/sandstone interaction—Impli-
cations for improving oil recovery: Journal of the Society of Petroleum Engineers,
p. 453-462
Templeton, CO, 1 960, Solubility of barium sulfate in sodium chloride solutions from
25 °C to 95 °C: Journal of Chemical Engineering Data, v. 5, p. 514-516.
Truesdell, A.H., and B.F. Jones, 1974, WATEQ, a computer program for calculating
chemical equilibria of natural waters: Journal of Research, U. S. Geological
Survey, v. 2, p. 233-248.
Udegbunam, E.O., D.S. Beaty, and J. P. Fagan, Jr., 1993, Strategies for Improved
Oil Recovery from Aux Vases Reservoirs in McCreery and McCullum Waterflood
Units, Dale Consolidated Field, Franklin County, Illinois: Illinois State Geological
Survey, Illinois Petroleum 143, 39 p.
U.S. Environmental Protection Agency, 1975, Standard Method for Examination of
Water and Waste Water, 14th edition: American Public Health Association,
American Waterworks Association, and American Pollution Control Federation,
Washington, DC, 1 1 ,093 p.
U.S. Environmental Protection Agency, 1985, Standard Method for Examination of
Water and Waste Water, 16th edition: American Public Health Association,
American Waterworks Association, and American Pollution Control Federation,
Washington, DC, 1,268 p.
Walter, L.M., A.M. Stueber, and T.J. Huston, 1990, Br-CI-Na systematics in Illinois
Basin fluids: Constraints on fluid origin and evolution: Geology, v. 1 8, p. 31 5-31 8.
Westall, J.C., J.L Zachary, and F.M.M. Morell, 1976, MINEQL, A Computer
Program for Calculation of Chemical Equilibrium Composition of Aqueous Sys-
tems, Technical Note 18: Ralph M. Parson Laboratory for Water Resources and
55
Environmental Engineering, Department of Civil Engineering, Massachusett
Institute of Technology, Cambridge, 91 p.
Wolery, J.T., 1 979, Calculation of Chemical Equilibrium between Aqueous Solutions
and Minerals—The EQ3/6 Software Package: Lawrence Livermore National
Laboratory Report UCRL-52658, 41 p.
Wolery, J.T., 1992a, EQ3NR, A Computer Program for Geochemical AqueousSpeciation Solubility Calculations—Theoretical Manual, User's Guide, and Re-
lated Documentation (Version 7.0): Lawrence Livermore National Laboratory
Report UCRL-MA-1 100662 PT III, 246 p.
Wolery, J.T., 1992b, EQ3/6, A Software Package for Geochemical Modeling of
Aqueous Systems—Package Overview and Installation Guide (Version 7.0):
Lawrence Livermore National Laboratory Report UCRL-MA-1 100662 Pt I, 66 p.
56
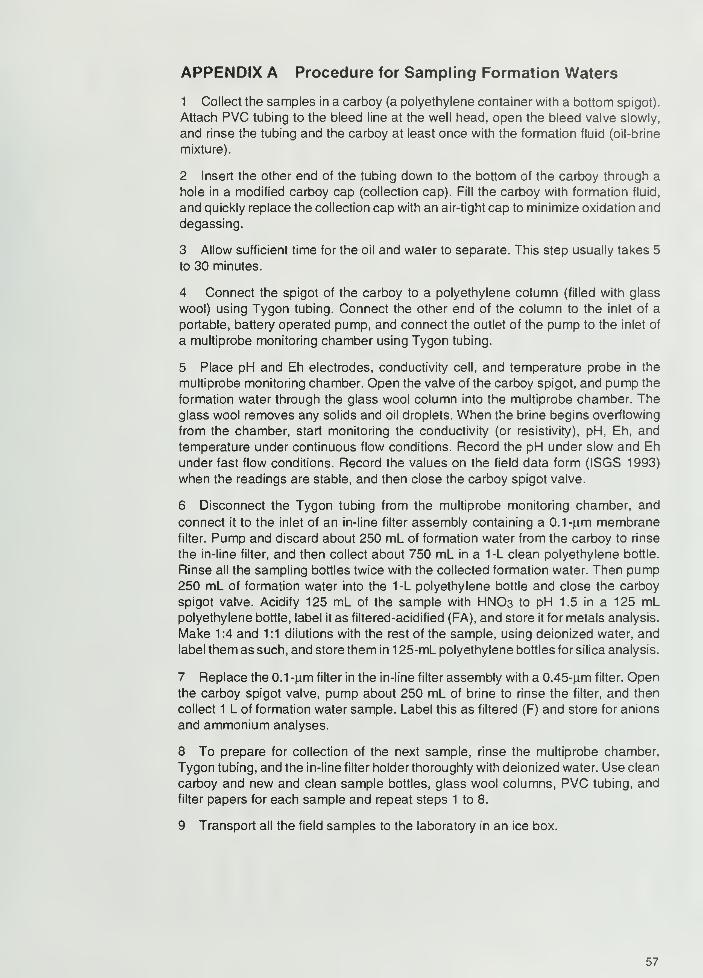
APPENDIX A Procedure for Sampling Formation Waters
1 Collect the samples in a carboy (a polyethylene container with a bottom spigot).
Attach PVC tubing to the bleed line at the well head, open the bleed valve slowly,
and rinse the tubing and the carboy at least once with the formation fluid (oil-brine
mixture).
2 Insert the other end of the tubing down to the bottom of the carboy through a
hole in a modified carboy cap (collection cap). Fill the carboy with formation fluid,
and quickly replace the collection cap with an air-tight cap to minimize oxidation and
degassing.
3 Allow sufficient time for the oil and water to separate. This step usually takes 5
to 30 minutes.
4 Connect the spigot of the carboy to a polyethylene column (filled with glass
wool) using Tygon tubing. Connect the other end of the column to the inlet of a
portable, battery operated pump, and connect the outlet of the pump to the inlet of
a multiprobe monitoring chamber using Tygon tubing.
5 Place pH and Eh electrodes, conductivity cell, and temperature probe in the
multiprobe monitoring chamber. Open the valve of the carboy spigot, and pump the
formation water through the glass wool column into the multiprobe chamber. Theglass wool removes any solids and oil droplets. When the brine begins overflowing
from the chamber, start monitoring the conductivity (or resistivity), pH, Eh, and
temperature under continuous flow conditions. Record the pH under slow and Eh
under fast flow conditions. Record the values on the field data form (ISGS 1993)
when the readings are stable, and then close the carboy spigot valve.
6 Disconnect the Tygon tubing from the multiprobe monitoring chamber, and
connect it to the inlet of an in-line filter assembly containing a 0.1 -u.m membranefilter. Pump and discard about 250 ml_ of formation water from the carboy to rinse
the in-line filter, and then collect about 750 ml_ in a 1-L clean polyethylene bottle.
Rinse all the sampling bottles twice with the collected formation water. Then pump250 ml_ of formation water into the 1-L polyethylene bottle and close the carboy
spigot valve. Acidify 125 ml_ of the sample with HNO3 to pH 1.5 in a 125 ml_
polyethylene bottle, label it as filtered-acidified (FA), and store it for metais analysis.
Make 1:4 and 1:1 dilutions with the rest of the sample, using deionized water, and
label them as such, and store them in 1 25-mL polyethylene bottles for silica analysis.
7 Replace the 0.1 -u.m filter in the in-line filter assembly with a 0.45-u.m filter. Openthe carboy spigot valve, pump about 250 ml_ of brine to rinse the filter, and then
collect 1 L of formation water sample. Label this as filtered (F) and store for anions
and ammonium analyses.
8 To prepare for collection of the next sample, rinse the multiprobe chamber,
Tygon tubing, and the in-line filter holder thoroughly with deionized water. Use clean
carboy and new and clean sample bottles, glass wool columns, PVC tubing, and
filter papers for each sample and repeat steps 1 to 8.
9 Transport all the field samples to the laboratory in an ice box.
57
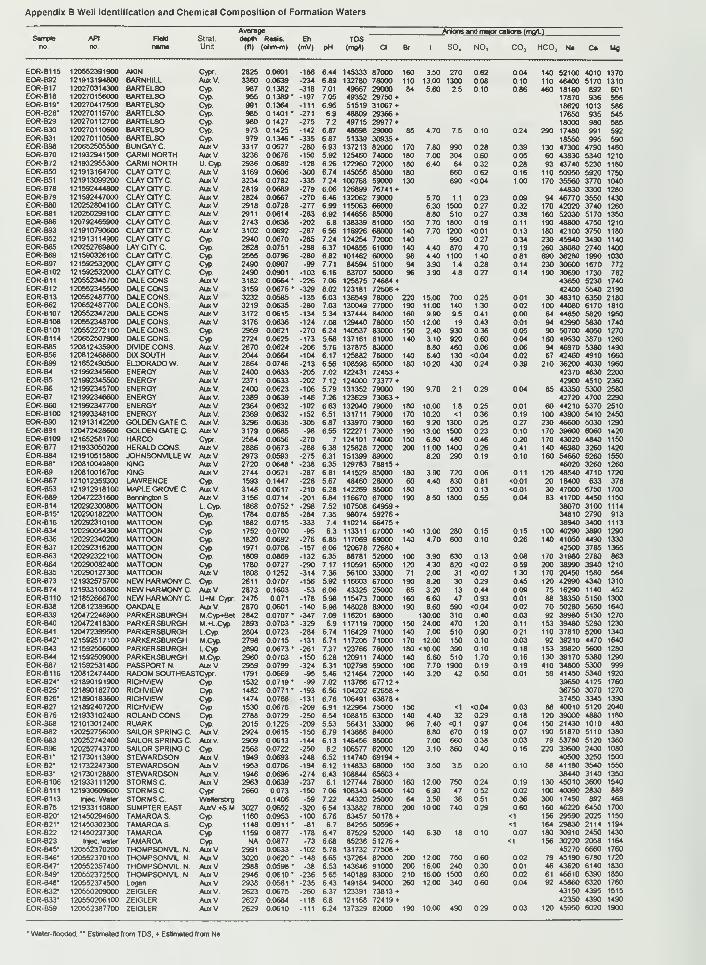
Appendix B Well Identification and Chemical Composition of Formation Waters
API Rati
Average
dep#> Reals. Eh TDSAnions and major cations (moA)
Sample Slrat.
no. no. name Unit («) ohm-m) (mV) pH (mg4) a Br 1 S04 NO, co 3 HCO Na Ca Mg
EOR-B115 120552391900 AKIN Cypr 2825 0.0601 -186 6.44 145333 87000 160 3.50 270 0.62 0.04 140 52100 4010 1370EOR-B92 121913194800 BARNHILL AuxV. 3360 0.0639 -234 6.89 132780 78000 110 1300 1300 0.08 0.10 110 46400 5170 1310EOR-B17 120270314300 BARTELSO Cyp 987 0.1382 -318 7.01 49667 29000 84 560 2.5 010 086 460 18160 892 601EOR-B18 120270156000 BARTELSO Cyp 955 0.1389' -197 7.06 49352 29750 + 17870 936 556EOR-B19* 120270417500 BARTELSO Cyp 991 0.1364 -111 6.95 51519 31057 + 18620 1013 586EOR-B28* 120270115700 BARTELSO Cyp 985 0.1401 * -271 6.9 48809 29366 + 17650 935 545EOR-B29 120270112700 BARTELSO Cyp. 980 0.1427 -275 7.2 49715 29977 + 18000 980 585EOR-B30 120270110600 BARTELSO Cyp. 973 0.1425 -142 687 48698 29000 85 4.70 7.5 0.10 0.24 290 17480 991 592EOR-B31 120270110500 BARTELSO Cyp 979 0.1346 • -335 687 51339 30935 + 18550 995 590EOR-B98 120652505500 BUNGAY C. AuxV 3317 00627 -280 6.93 137213 82000 170 7.80 990 0.28 0.39 130 47300 4790 1460EOR-B70 121932941500 CARMI NORTH AuxV. 3236 00676 -150 592 125460 74000 180 700 304 0.60 0.05 60 43830 5340 1210EOR-B72 121932955300 CARMI NORTH U.Cyp 2936 00689 -128 626 122960 72000 180 6.40 64 0.32 028 93 43740 5230 1180EOR-B50 121913164700 CLAY CITY C. AuxV 3169 00606 -300 6.74 145056 85000 180 660 062 0.16 110 50950 5920 1750EOR-B51 121913099200 CLAY CITY C. AuxV 3234 0.0782 -335 7.24 100768 59000 130 690 <0.04 1.00 170 35560 3770 1040EOR-B78 121592444800 CLAY CITY C. AuxV. 2819 0.0689 -279 6.05 126899 76741 + 44830 3300 1280EOR-B79 121592447000 CLAY CITY C. AuxV 2824 0.0667 -270 6.46 132062 79000 5.70 1.1 0.23 0.09 94 46770 3550 1430EOR-B80 120252804100 CLAY CITY C. AuxV. 2918 0.0728 -277 6.99 115063 66000 6.30 1500 0.27 0.32 170 42020 3740 1260EOR-B81 120250299100 CLAY CITY C. AuxV. 2911 00614 -283 6.92 144656 85000 8.80 510 0.27 0.38 160 52030 5170 1350EOR-B86 120792465900 CLAY CITY C. AuxV. 2743 0.0636 -202 6.8 138339 81000 150 7.70 1800 0.19 0.11 190 48800 4750 1210EOR-B93 121910790600 CLAY CITY C. AuxV. 3102 0.0692 -287 656 116926 68000 140 7.70 1200 <001 0.13 180 42100 3750 1180EOR-B52 121913114900 CLAY CITY C. Cyp. 2940 0.0670 -285 7.24 124254 72000 140 990 0.27 0.34 230 45940 3490 1140EOR-B65 120252769800 LAY CITY C. Cyp. 2628 0.0751 -288 6.37 104855 61000 140 4.40 870 4.70 019 260 38080 2740 1400EOR-B69 121590326100 CLAY CITY C. Cyp 2555 00796 -280 682 101462 60000 98 4.40 1100 1.40 081 690 36280 1990 1030EOR-B97 121592532000 CLAY CITY C. Cyp 2490 0.0907 -99 7.71 84594 51000 94 3.90 1.4 028 0.14 230 30600 1670 772EOR-B102 121592532000 CLAY CITY C. Cyp 2490 0.0901 -103 6.16 83707 50000 96 3.90 4.8 0.27 0.14 190 30690 1730 782EOR-B11 120552345700 DALE CONS AuxV 3182 0664* -226 7.06 125875 74684 + 43650 5230 1740EOR-B12 120552345500 DALE CONS AuxV 3159 0676 * -329 802 123181 72506 + 42400 5540 2190EOR-B13 120552487700 DALE CONS. AuxV 3232 0.0585 -135 6.03 136549 78000 220 15.00 700 0.25 0.01 30 48310 6350 2180EOR-B62 120652487700 DALE CONS. AuxV 3219 00635 -280 703 130049 77000 190 11.00 140 1.30 0.02 100 44080 6170 1810EOR-B107 120552347200 DALE CONS AuxV 3172 00615 -134 5.34 137444 84000 160 990 9.5 41 0.00 64 44850 5820 1960EOR-B108 120552348700 DALE CONS. AuxV 3176 00636 -124 7.08 129440 78000 150 12.00 19 043 0.01 94 42990 5830 1740EOR-B101 120552272100 DALE CONS. Cyp 2959 00621 -270 6.24 140537 83000 150 240 930 0.36 0.05 90 50700 4050 1270EOR-B114 120652507900 DALE CONS. Cyp 2724 0.0625 -173 5.68 137161 81000 140 3.10 920 060 0.04 160 49530 3870 1260EOR-B85 120812435900 DIVIDE CONS. AuxV 2670 0.0624 -206 576 137875 83000 880 460 0.06 0.06 94 46970 5380 1490EOR-B56 120812468600 DIX SOUTH AuxV. 2044 00664 -104 6.17 125882 76000 140 6.40 130 <0 04 002 67 42460 4910 1660EOR-B99 121652490500 ELDORADOW AuxV 2864 00746 -213 6.56 108598 65000 180 10.20 430 0.24 039 210 36200 4030 1960EOR-B4 121992345600 ENERGY AuxV 2400 0.0633 -205 702 122431 72453 + 42370 4630 2200EOR-B5 121992345500 ENERGY AuxV 2371 00633 -202 7.12 124000 73377 + 42900 4510 2360EOR-B6 121992345700 ENERGY AuxV 2400 0.0623 -106 5.79 131352 79000 190 9.70 2.1 0.29 0.04 85 43350 5300 2580EOR-B7 121992346600 ENERGY AuxV. 2389 00639 -146 7.26 123629 73063 + 42720 4700 2290EOR-B60 121992347700 ENERGY AuxV 2364 0.0632 -102 663 132040 79000 180 1000 1.8 0.25 0.01 60 44210 5370 2510EOR-B100 121993348100 ENERGY AuxV 2369 0.0632 -152 651 131711 79000 170 10 20 <1 0.36 0.19 100 43900 5410 2450EOR-B90 121913142200 GOLDEN GATE C. AuxV. 3296 0.0635 -305 6.87 133970 79000 160 9.20 1300 0.25 0.27 230 46600 5030 1290EOR-B91 120472428600 GOLDEN GATE C. AuxV 3179 0.0685 -98 6.55 122271 73000 190 13.00 1500 0.23 0.10 170 39600 6060 1420EOR-B109 121652581700 HARCO Cypr. 2584 0.0656 -270 7 124101 74000 150 6.80 480 0.46 020 170 43020 4840 1150EOR-B77 121933050200 HERALD CONS. AuxV 2886 00673 -288 6.38 125828 72000 200 11.00 1400 0.26 0.41 140 46980 3260 1420EOR-B84 121910515800 JOHNSONVILLEW. AuxV 2973 0.0593 -275 6.31 151399 89000 820 290 0.19 0.10 160 54660 5260 1550EOR-B8* 120810049800 KING AuxV 2720 0648* -238 635 129783 78815 + 46020 3260 1260EOR-B9 120810016700 KING AuxV 2744 00621 -287 6 81 141529 85000 180 3.90 720 006 0.11 120 48540 4710 1720EOR-B67 121012359300 LAWRENCE Cyp. 1593 1447 -228 567 48460 28000 60 440 830 0.81 <0.01 20 18400 633 378EOR-B53 121912918100 MAPLE GROVE C AuxV 3148 0.0617 -210 628 142269 85000 180 1200 0.13 <0.01 30 47000 6750 1700EOR-B89 120472231600 Bennington S AuxV. 3156 00714 -201 6.84 116670 67000 190 8.50 1800 055 0.04 83 41700 4450 1150
EOR-B14 120292300800 MATTOON L Cyp 1868 0.0752* -298 7.52 107508 64959 + 38070 3100 1114
EOR-B15* 120290182200 MATTOON Cyp 1784 0.0785 -284 735 98074 59276 + 34810 2790 913EOR-B16 120292310100 MATTOON Cyp 1882 00715 -333 74 110214 66475 + 38940 3400 1113EOR-B34 120290054300 MATTOON Cyp 1752 0.0700 -95 6.3 113311 67000 140 13.00 280 0.15 0.15 100 40290 3890 1290EOR-B36 120292340200 MATTOON Cyp 1820 0.0692 -276 685 117069 69000 140 4.70 600 0.10 0.26 140 41050 4490 1330EOR-B37 120292316200 MATTOON Cyp 1971 00708 -157 605 120678 72680 + 42500 3785 1365EOR-B63 120292322100 MATTOON Cyp 1809 00869 -132 6.35 88781 52000 100 390 630 0.13 008 170 31980 2780 663EOR-B64 120290082400 MATTOON Cyp 1780 00727 -290 7.17 110591 65000 120 430 820 <0.02 0.59 200 38990 3940 1210EOR-B35 120290127300 MATTOON AuxV 1808 0.1252 -314 736 56100 33000 71 2.00 31 <002 1.30 170 20450 1580 564EOR-B73 121932575700 NEW HARMONY C Cyp. 2611 00707 -156 592 116603 67000 190 8.20 30 029 0.45 120 42990 4340 1310EOR-B74 121933100800 NEW HARMONY C AuxV 2873 0.1603 -53 605 43325 25000 65 3.20 13 044 009 75 16290 1140 452EOR-B1 10 121852666700 NEW HARMONY C. U+M Cypr 2475 0071 -178 598 115473 70000 160 660 47 093 0.01 88 38350 5150 1300EOR-B38 120812389600 OAKDALE AuxV 2870 0601 -140 6 98 148028 89000 190 860 590 <0 04 002 70 50280 5650 1640EOR-B39 120472246900 PARKERSBURGH MCyp+Bet 2842 0707 * -347 709 116201 69000 130 00 310 0.40 003 92 39980 5130 1270EOR-B40 120472418300 PARKERSBURGH M.+L.Cyp. 2893 0703 * -329 69 117119 70000 150 24.00 470 1.20 0.11 153 39480 5280 1230EOR-B41 120472399500 PARKERSBURGH L.Cyp. 2804 00723 -284 6.74 116429 71000 140 7.00 510 0.90 021 110 37810 5200 1340EOR-B42* 121592517100 PARKERSBURGH M.Cyp. 2798 0.0715 -131 6.71 117205 71000 170 12.00 150 0.10 0.03 92 39210 4470 1640
EOR-B43 121592506000 PARKERSBURGH LCyp 2890 0673 * -261 7.37 123766 76000 180 <10 00 390 010 0.18 153 39820 5600 1280
EOR-B44 121592509000 PARKERSBURGH M.Cyp 2960 00703 -150 6.28 120911 74000 140 660 510 1.70 0.16 130 39170 5380 1290EOR-B87 121592531400 PASSPORT N AuxV 2959 0799 -324 6.31 102798 59000 100 7.70 1900 0.19 019 410 34800 5300 999EOR-B116 120812474400 RADOM SOUTHEASTCypr. 1791 00669 -95 546 121464 72000 140 320 42 050 0.01 59 41450 5340 1920
EOR-B24* 121890191900 RICHVIEW Cyp 1532 0.0719 * -99 7.02 113766 67712 + 39650 4125 1760
EOR-B25* 121890182700 RICHVIEW Cyp. 1482 00771 * -193 6.56 104202 62658 + 36750 3070 1270
EOR-B26* 121890183600 RICHVIEW Cyp 1474 0.0788 -131 676 106491 63878 + 37450 3345 1390
EOR-B27 121892407200 RICHVIEW Cyp 1530 00676 -209 691 122964 75000 150 <1 <004 0.03 88 40010 5120 2040EOR-B76 121933102400 ROLAND CONS Cyp 2788 00729 -250 654 108815 63000 140 440 32 029 0.18 120 39000 4880 1180
EOR-B68 121013012400 RUARK Cyp 2015 1225 -209 553 56431 33000 96 7.40 <0.1 0.97 0.04 150 21430 1010 480EOR-B82 120252756000 SAILOR SPRING C AuxV 2924 00615 -150 679 143686 84000 880 670 019 007 190 51870 5110 1380
EOR-B83 120252742400 SAILOR SPRING C. Aux v. 2909 00613 -144 6.13 146456 85000 700 660 0.38 003 79 53780 5120 1360
EOR-B96 120252743700 SAILOR SPRING C Cyp. 2568 0.0722 -250 6.2 106577 62000 120 3 10 860 040 016 220 39600 2400 1080
EOR-B1* 121730113900 STEWARDSON AuxV 1949 00693 -248 652 114740 69194 + 40500 3250 1500
EOR-B2* 121732247300 STEWARDSON AuxV 1953 00705 -194 612 114833 68000 150 350 35 020 0.10 88 41180 3540 1550
EOR-B3* 121730128800 STEWARDSON AuxV 1946 00696 -274 643 108844 65603 + 38440 3140 1350
EOR-B106 121933111200 STORMS C. AuxV 2963 00639 -237 6.1 127744 76000 160 1200 750 0.24 019 130 45010 3600 1540
EOR-B111 121930609600 STORMS C Cypr 2660 0.073 -150 706 108343 64000 140 6.90 47 052 002 100 40090 2830 889EOR-B113 Injec. Water STORMS C. Weltersbrg 01406 -59 7.22 44320 25000 64 3.50 36 051 036 300 17450 892 468
EOR-B75 121933110800 SUMPTER EAST AuxV+SM 3027 00652 -320 654 133882 78000 200 1000 740 029 060 160 46220 6450 1700
EOR-B20* 121450294600 TAMAROAS. Cyp 1160 0.0953 -100 676 83457 50178 + <1 156 29590 2025 1150
EOR-B21* 121450302300 TAMAROA 8. Cyp 1148 0911 * -81 67 84255 50596 + <1 164 29830 2114 1194
EOR-B22 121450227300 TAMAROA Cyp 1159 00877 -178 647 87529 52O00 140 630 18 0.10 007 180 30910 2450 1430
EOR-B23 ln)ec water TAMAROA Cyp NA 00877 -73 668 85236 51276 + <1 156 30220 2058 1164
EOR-B45* 120552370200 THOMPSONVIL N AuxV 2991 00633 -102 578 131732 77508 + 45270 6660 1760
EOR-B46* 120552370100 THOMPSONVIL N AuxV 3020 0620* -148 665 137264 82000 200 12 00 750 060 002 79 45190 6780 1720
EOR-B47* 120552357400 THOMPSONVIL N AuxV 2988 0598* -38 653 143646 91000 200 1600 240 030 001 46 43620 6140 1830
EOR-B49* 120552372500 THOMPSONVIL N AuxV 2946 00610* -236 565 140189 83000 210 1600 1500 060 002 61 46610 6390 1850
EOR-B48* 120552374500 Logan AuxV 2938 00581 * -235 643 149184 94000 260 1200 340 060 004 92 45860 6320 1760
EOR-B32* 120550209000 ZEIGLER AuxV 2623 0675 -260 637 123391 73813 + 43150 4395 1515
EOR-B33* 120550206100 ZEIGLER AuxV 2627 00684 -118 68 121168 72419 + 42350 4390 1490
EOR-B59 120552387700 ZEIGLER AuxV 2629 00610 -111 6 24 137329 82000 190 1000 490 029 003 120 45950 6020 1900
• Water-flooded. ** Estimated from TDS. + Estimated from Na
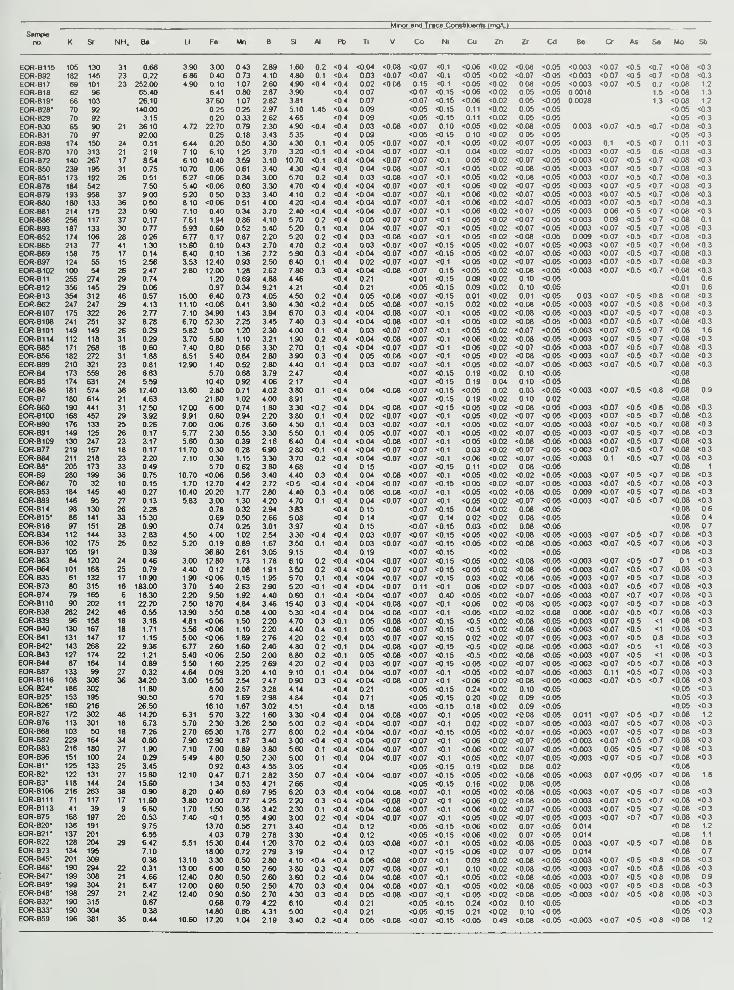
Minor and Trace Gonsfctuents (moA)Sampleno K Sr NH, Ba U Fe Mn B SI AJ Pb Ti V Co Nl Cu Zn Zr Cd Be a As Se Mo St)
EOR-B115 105 130 31 066 3.90 300 043 289 160 0.2 <04 <0 04 <008 <007 <0.1 <006 <002 <008 <005 <0003 <007 <05 <0 7 <0 08 <03EOR-B92 182 145 23 0.22 686 040 073 410 480 0.1 <04 003 <007 <0.07 <0.1 <005 <002 <007 <005 <0.003 <007 <05 <07 <0 08 <03EOR-B17 69 101 23 25200 490 010 107 260 490 <0.4 <04 02 <008 015 <0.1 <005 <002 008 <0.05 <0003 <007 <0.5 07 <0O8 1.2
EOR-B18 62 96 65 40 641 080 287 3.90 <0.4 07 <0 07 <0.15 <006 <002 005 <005 00018 15 <0 08 1.3
EOR-B19* 66 103 26.10 37 60 1.07 2.82 381 <04 007 <007 <0.15 <0.06 <0 02 005 <0.05 0028 1.3 <0 08 12EOR-B28* 70 92 140.00 0.25 025 2.97 5.10 145 <04 0.09 <0 05 <0 15 0.11 <002 005 <0.05 <005 <0 3
EOR-B29 70 92 315 020 033 262 465 <04 009 <0 05 <015 0.11 <0.02 0.05 <005 <005 <03EOR-B30 65 90 21 36.10 4.72 22.70 0.79 230 490 <0.4 <0.4 0.03 <008 <007 0.10 <005 <0.02 <008 <0.05 0003 <0.07 <0.5 <07 <008 <0.3
EOR-B31 70 97 92 00 0.25 0.18 343 535 <04 009 <005 <0 15 0.10 <0 02 005 <0.05 <005 <03EOR-B98 174 150 24 0.51 644 0.20 0.50 4.30 430 0.1 <04 005 <0.07 <007 <0.1 <005 <0 02 <007 <005 <0 003 0.1 <05 <0 7 0.11 <03EOR-B70 170 313 21 219 7.10 6.10 1.25 3.70 3.20 <0.1 <0.4 <0.04 <007 <0.07 <0.1 0.04 <002 <007 <0.05 <0.003 <007 <05 06 <0.08 <0.3
EOR-B72 140 267 17 854 6.10 1040 359 3.10 1070 <0.1 <04 <004 <007 <007 <0.1 005 <002 <007 <0.05 <0.003 <007 <05 <0.7 <0.08 <0 3
EOR-B50 239 195 31 0.75 10.70 006 061 3.40 430 <04 <04 004 <008 <007 <0.1 <0.05 <002 <0 08 <0.05 <0.003 <0.07 <0.5 <0.7 <0.08 <0.3
EOR-B51 173 192 26 051 627 <0 06 0.34 300 570 0.2 <0.4 003 <008 <007 <0.1 <0.05 <0 02 <0 08 <0.05 <0.003 <0.07 <0.5 <0.7 <0.08 <03EOR-B78 184 542 7.50 5.40 <0.06 060 330 4.70 <04 <0.4 <0.04 <007 <0.07 <0.1 <006 <002 <0.07 <005 <0.003 <007 <05 <0.7 <008 <03EOR-B79 193 958 37 9.00 520 050 033 340 4.10 0.2 <0.4 <0.04 <0.07 <007 <0.1 <006 <0 02 <0.07 <0.05 <0.003 <0.07 <0.5 <0.7 <0.08 <0.3
EOR-B80 180 133 36 0.50 8.10 <0.06 0.51 4.00 420 <04 <04 <0.04 <0.07 <007 <0.1 <006 <0 02 <0.07 <0.05 <0003 <0.07 <05 <0.7 <0.08 <03EOR-B81 214 175 23 090 7.10 040 034 370 240 <0.4 <0.4 <0.04 <007 <007 <0.1 <006 <0.02 <007 <0.05 <0.003 006 <05 <0.7 <0.08 <03EOR-B86 256 117 37 0.17 7.61 1.94 0.86 4.10 5.70 0.2 <0.4 0.05 <0.07 <007 <0.1 <0.O5 <0.02 <0.07 <0.05 <0.003 009 <0.5 <0.7 <0.08 0.1
EOR-B93 187 133 30 0.77 5.93 060 0.52 540 5.20 0.1 <0.4 0.04 <007 <007 <0.1 <005 <0 02 <007 <0.05 <0.003 <0.07 <05 <0.7 <0.08 <0.3
EOR-B52 174 106 28 0.26 6.77 0.17 087 2.20 5.20 0.2 <0.4 0.03 <0.08 <0.07 <0.1 <0O5 <002 <0 08 <0.05 0009 <0.07 <05 <07 <0 08 <0.3
EOR-B65 213 77 41 1.30 15 60 010 0.43 2.70 4.70 0.2 <0.4 0.03 <007 <007 <015 <005 <0.02 <0.07 <0.05 <0.003 <0.07 <05 <0.7 <0.08 <0.3
EOR-B69 158 75 17 0.14 6.40 0.10 1.36 2.72 5.90 0.3 <0.4 <0 04 <0.07 <007 <0.15 <0.05 <002 <0.07 <0.05 <0.003 <0.07 <0.5 <0.7 <0 08 <0.3
EOR-B97 124 55 15 256 3.53 12.40 093 2.50 640 0.1 <0.4 002 <0.07 <0.07 <0.1 <0.05 <0 02 <0.07 <0.05 <0003 <0.07 <0.5 <0.7 <0.08 <03EOR-B102 100 54 26 2.47 280 12.00 128 262 780 0.3 <0.4 <0.04 <008 <007 015 <005 <0 02 <0.08 <0.05 <0.003 <0.07 <0 5 <0.7 <0.08 <03EOR-B11 255 274 29 0.74 1.20 0.69 4.88 446 <0.4 021 <001 <0.15 0.09 <0.02 0.10 <0.05 <0.01 06EOR-B12 356 145 29 0.06 097 0.34 9.21 4.21 <0.4 021 <005 <015 0.09 <0.02 0.10 <005 <0.01 0.6
EOR-B13 354 312 46 0.57 15.00 6.40 0.73 405 4.50 0.2 <0.4 005 <0.08 <007 <0 15 0.01 <0.02 0.01 <005 0.03 <0.07 <0.5 <0.8 <0.08 <03EOR-B62 247 247 29 4.13 11.10 <006 0.41 3.80 4.30 <0.2 <0.4 0.05 <0.08 <007 <0.15 0.02 <0 02 <0 08 <005 <0.003 <007 <0.5 <0.8 <008 <0.3
EOR-B107 175 322 26 2.77 7.10 34.90 1.43 3.94 670 0.3 <04 <0.04 <0.08 <007 <0.1 <0.05 <0.02 <0.08 <0.05 <0.003 <007 <0.5 <0.7 <0.08 <03EOR-B108 241 251 32 8.28 6.70 52.30 2.25 345 7.40 0.3 <0.4 <0 04 <008 <0.07 <0.1 <005 <0.02 <0.08 <0.05 <0.003 <0.07 <0.5 <0.7 <0.08 <0.3
EOR-B101 149 149 26 0.29 5.82 500 1.20 230 4.00 0.1 <0.4 0.03 <0.07 •=007 <0.1 <0.05 <0.02 <0.07 <0.05 <0.003 <0.07 <0.5 <0.7 <008 1.6
EOR-B114 112 118 31 0.29 3.70 580 1.10 3.21 1.90 0.2 <0.4 <0 04 <008 <007 <0.1 <006 <0.02 <0.08 <0.05 <0 003 <007 <0.5 <0.7 <008 <0.3
EOR-B85 171 268 18 0.60 7.40 080 0.66 3.30 2.70 0.1 <0.4 <004 <0.07 <007 <0.1 <0.06 <0.02 <007 <0.05 <0.003 <0.07 <0.5 <0.7 <008 <03EOR-B56 182 272 31 188 8.51 540 0.84 2.80 3.90 0.3 <0.4 05 <008 <007 <0.1 <005 <0.02 <0 08 <0.05 <0.003 <0.07 <0.5 <0.7 <0.08 <03EOR-B99 210 321 23 081 12.90 1.40 0.52 2.80 4.40 0.1 <0.4 0.03 <0.07 <0.07 <0.1 <0.05 <002 <0.07 <0 05 <0003 <0.07 <0.5 <0.7 <0 08 <03EOR-B4 173 559 26 663 5.70 0.68 3.79 2.47 <0.4 <0.07 <0 15 0.19 <002 0.10 <0.05 <0.08
EOR-B5 174 631 24 559 1040 0.92 406 2.17 <0.4 <0.07 <0.15 0.19 0.04 0.10 <0.05 <0.08
EOR-B6 181 574 36 17.40 13.60 2.80 0.71 4.02 3.80 0.1 <0.4 0.04 <0.08 <007 <0.15 <005 0.02 003 <0.05 <0 003 <0.07 <0.5 <0.8 <0.08 09EOR-B7 180 614 21 4 63 2180 1.02 4.00 891 <0.4 <0.07 <0.15 0.19 <0 02 0.10 0.02 <0.08
EOR-B60 190 441 31 12.50 12.00 600 074 1.80 3.30 <0.2 <0.4 0.04 <0.08 <0 07 <0.15 <0.05 <0.02 <0 08 <0.05 <0.003 <0.07 <0.5 <08 <0.08 <0.3
EOR-B100 168 452 29 3.92 9.91 0.60 0.94 2.20 3.80 0.1 <0.4 0.02 <0.07 <007 <0.1 <0.05 <0.02 <0.07 <0.05 <0.003 <0.07 <0.5 <0.7 <0.08 <03EOR-B90 176 133 25 0.26 7.00 006 0.76 3.60 4.50 0.1 <0.4 0.03 <0.07 <007 <0.1 <0.05 <0.02 <0.07 •=0.05 <0.003 <0.07 <0.5 <0.7 <0.08 <03EOR-B91 149 125 26 017 5.77 2.30 055 3.30 5.50 0.1 <0.4 0.05 <007 <0.07 <0.1 <0.05 <0 02 <0.07 <0.05 <0.003 <0.07 <0.5 <0.7 <0.08 <03EOR-B109 130 247 23 3.17 5.60 0.30 0.39 2.16 6.40 0.4 <0.4 <0.04 <0 08 <007 <0.1 <0.05 <0.02 <0.08 <0.05 <0.003 <0.07 <0.5 <07 <0.08 <03EOR-B77 219 157 18 0.17 11.70 0.30 0.28 6.90 2.80 <0.1 <0.4 <0.04 <0.07 <0.07 <0.1 0.03 <0.02 <0.07 <0 05 <0.003 <0.07 <0.5 <0.7 <0.08 <03EOR-B84 211 218 23 2.20 7.10 0.30 1.15 330 3.70 0.2 <0.4 <0 04 <0.07 <0.07 <0.1 <006 <002 <007 <0.05 <0.003 0.1 <0.5 <0.7 <008 <0.3
EOR-B8* 205 173 33 0.49 5.70 0.62 3.80 4.68 <0.4 0.15 <0.07 <0.15 0.11 <0.02 008 <0.05 <0 08 1
EOR-B9 280 199 36 0.75 10.70 <0.06 0.56 340 4.40 0.3 <0.4 0.04 <0.08 <0.07 <0.1 <0.05 <0 02 <0.02 <0.05 <0.003 <007 <05 <0.7 <0.08 <0.3
EOR-B67 70 32 10 015 1.70 12.70 442 2.72 <0.5 <0.4 <04 <0.04 <007 <0.07 <0.15 <0.05 <0.02 <0.07 <0.05 <0.003 <007 <05 <0.7 <0.08 <0.3
EOR-B53 184 145 40 0.27 10.40 20.20 1.77 280 4.40 0.3 <0.4 0.06 <0.08 <0.07 <0.1 <005 <0.02 <0.08 <0.05 0.009 <007 <0.5 <0.7 <008 <0.3
EOR-B89 146 95 27 0.13 5.83 3.00 1.30 4.20 4.70 0.1 <0.4 0.04 <007 <0.07 <0.1 <005 <0.02 <0.07 <005 <0.003 <0.07 <0.5 <0.7 <0.08 <03EOR-B14 98 130 26 2.28 0.78 0.32 2.94 3.83 <0.4 0.15 <007 <0.15 0.04 <002 0.08 <0.05 <0.08 06EOR-B15* 86 141 33 15.30 0.69 0.50 2.66 508 <=0.4 0.14 <0.07 0.14 0.02 <0.02 0.08 <0.05 <0.08 04EOR-B16 97 151 28 0.90 0.74 0.25 301 3.97 <04 015 <007 <0.15 003 <002 0.08 <0.05 <0.08 0.7
EOR-B34 112 144 33 2.83 4.50 4.00 1.02 2.54 330 <0.4 <0.4 003 <0.07 <007 <015 <0.05 <002 <008 <0.05 <0.003 <007 <0.5 <0.7 <0.08 <0.3
EOR-B36 102 175 25 052 5.20 0.19 089 1.67 350 0.1 <0.4 0.03 •=0.07 <0.07 <0 15 <0.05 <0.02 >=008 <0.05 <0.003 <007 <0.5 <0.7 <0.08 <03EOR-B37 105 191 0.39 36.80 2.61 3.05 915 <0.4 0.19 <0.07 <0 15 <0.02 <0.05 <0.08 <0.3
EOR-B63 84 120 24 046 3.00 12.80 1.73 1.78 6.10 0.2 <0.4 <0 04 <0.07 <0.07 <0.15 <0.05 <0.02 <0.08 <005 <0.003 <0.07 <0.5 <0.7 0.1 <03EOR-B64 101 168 25 0.79 440 0.12 108 1.91 350 0.2 <0.4 <0.04 <0.07 <007 <0 15 <005 <0.02 <008 <0.05 <0 003 <0.07 <0.5 <0.7 <0.08 <0.3
EOR-B35 61 132 17 10.90 1.90 <0.06 0.15 1 95 5.70 0.1 <0.4 <0 04 <007 <007 <0 15 003 <0.02 <008 <005 <0.003 <0.07 <0 5 <0.7 <o.oe <03EOR-B73 80 315 16 183.00 370 540 2.63 2.90 5.20 <0.1 <0.4 <0.04 <007 0.11 <0.1 006 <0.02 <0.07 <0.05 <0.003 <0.07 <0.5 <0.7 <0.08 <03EOR-B74 79 165 6 16.30 2.20 950 1.92 440 060 0.1 <04 <0 04 <007 <0.07 0.40 <0 05 <0 02 <007 <005 <0.003 <0.07 <0.7 <0.7 <0.08 <0.3
EOR-B110 90 202 11 22.20 2.50 18.70 4.84 3.46 15.40 0.3 <04 <0.04 <0.08 <007 <0.1 <0.06 002 <0 08 <0.05 <0.003 <0.07 <0.5 <0.7 <0 08 <03EOR-B38 282 242 46 055 13.90 5.50 0.58 4.00 5 30 <0.4 <0.4 0.04 <008 <007 <0.1 <0.05 <0.02 <0.02 <0.08 0.008 <007 <0.5 <0.7 <0O8 <03EOR-B39 96 158 18 3.18 4.81 <0.06 1.50 2.20 4.70 0.3 <01 005 <008 <007 <0.15 <0.5 <0.02 <0.08 <0.05 <0.003 <007 <05 <1 <0.08 <03EOR-B40 130 167 18 1.71 5.56 <0.06 1.10 2.20 4.40 0.4 <0.1 005 <008 <0.07 <0.15 <0.5 <0.02 <0.08 <0.05 <0 003 <0.07 <0.5 <1 <0.08 <03EOR-B41 131 147 17 1.15 5.00 <0.06 189 2.76 420 0.2 <0.4 003 <007 <007 <0.15 002 <0.02 <0.07 <0.05 <00O3 <0.07 <0.5 0.8 <008 <0.3
EOR-B42* 143 268 22 936 6.77 2.60 1.60 2.40 4.80 0.2 <01 004 <0 08 <0.07 <0.15 <05 <0.02 <008 <005 <0.003 <0.07 <0.5 <1 <0.08 <0.3
EOR-B43 127 174 22 1.21 5.40 <006 2.50 2.00 8.80 0.2 <0.1 0.05 <0.08 <0.07 <0.15 <0.5 <0.02 <0.08 <0.O5 <0.003 <0.07 <05 <1 <0.08 <0.3
EOR-B44 87 164 14 089 5.50 160 2.25 269 4.20 0.2 <04 003 <007 <007 <0.15 <0.05 <0.02 <0.07 <0.05 <0 003 <007 <0.5 <07 <0.08 <0.3
EOR-B87 133 99 27 0.32 4.64 009 3.20 410 9.10 0.1 <0A 004 <007 <0.07 <0.1 •=005 <0.02 <0.07 <0.05 <0.003 0.11 <05 <0.7 <0.08 <0.3
EOR-B116 108 306 36 34.20 3.00 15.50 2.54 2.47 0.90 0.3 <0.4 <0 04 <008 <0.07 <0.1 <0.06 <0.02 <0.08 <0.05 <0003 <007 <05 <0.7 <0.08 <0.3
EOR-B24" 186 302 11.80 8.00 2.57 3.28 4.14 <04 0.21 <005 <0.15 0.24 <0.02 0.10 <0.05 <0.05 <0.3
EOR-B25* 153 195 90 50 5.70 1.69 2.98 484 <04 071 <005 <0.15 0.20 <002 0.09 <0.05 <0.05 <0.3
EOR-B26* 160 216 26.50 16.10 1.67 302 4.51 <04 0.18 <0.05 <0.15 0.18 <0 02 009 <0.05 <0.05 <0.3
EOR-B27 172 302 46 14.20 6.31 5.70 3.22 1.60 330 <0.4 <04 004 <008 <007 <0.1 <0.05 <0.02 <C08 <005 0.011 <007 <0.5 <0.7 <0.08 1.2
EOR-B76 113 301 18 673 5.70 2.30 3.26 250 5.00 0.2 <04 <004 <0.07 <0.07 <0.1 002 <0.02 <007 <0.05 <0003 <0.07 <05 <0.7 <008 <0.3
EOR-B68 103 50 18 7.26 2.70 65 30 1.78 2.77 600 02 <04 <0 04 <007 <0.07 <0 15 <0.05 <002 <0.07 <005 <0.003 <0.07 <0.5 <0.7 <008 <03EOR-B82 229 164 34 0.60 7.90 12.90 1.87 3.40 300 <0.4 <04 <004 <007 <0.07 <0.1 <006 <002 <0.07 <0.05 <0003 <007 <0.5 <0.7 <008 <0 3EOR-B83 216 180 27 1.90 7.10 7.00 0.89 3.80 5.60 0.1 <0.4 <004 <0.07 <0.07 <0.1 -=0.06 <0.02 <0.07 <0.05 <0.003 0.05 <0.5 <0.7 <008 <0.3
EOR-B96 151 100 24 0.29 549 480 0.50 2.30 5.00 0.1 <04 0.04 <0.07 <0.07 <0.1 <005 <0.02 <0.07 <0.05 <0.003 <0.07 <0.5 <0.7 <0.08 <03EOR-BV 125 133 25 345 0.92 0.43 455 305 <04 <0.05 <0 15 0.19 <0.02 0.08 0.02 <0.08
EOR-B2* 122 131 27 1580 12.10 0.47 0.71 2.82 3.50 0.7 <0.4 <0.04 <0.07 <0.07 <015 <0.05 <0.02 <0.08 <0.05 <0.003 0.07 <0.05 <0.7 <008 1.8
E0R-B3* 118 144 24 15.60 1.34 0.53 4.21 2.66 <0.4 <0.05 <0.15 0.16 <0.02 008 <0.05 <008EOR-B106 216 263 38 0.90 8.20 0.40 0.69 7.95 620 0.3 <04 <0.04 <008 <007 <0.1 <0.05 <0.02 <008 <0.05 <0003 <007 <0.5 <0.7 <008 <03EOR-B111 71 117 17 11.60 3.80 12 00 0.77 4.25 2.20 0.3 <0.4 <004 <0.08 <0.07 <0.1 <0.06 <0.02 <008 <0.05 <0.003 <0.07 <0.5 <0.7 <008 <03EOR-B113 41 39 9 6.60 1.70 1.50 0.38 342 2.30 1 <0 4 <004 <0 08 <0.07 <0.1 <0.06 <oxa <0.07 <0.05 <0.003 <0.07 <05 <07 <0.08 <03EOR-B75 168 197 20 0.53 7.40 <0.1 055 4.90 3.00 0.2 <04 <0.04 <0.07 <007 <0.1 <005 <002 <0.07 <0.05 <0003 <007 <0.7 <0.7 <008 <03EOR-B20* 136 191 9.75 13.70 0.56 2.71 3.40 <04 0.12 <0.05 <0.15 <0.06 <002 007 <0 05 0.014 <0O8 1.2
EOR-B2V 137 201 655 4.03 0.79 2.78 330 <04 0.12 <0 05 <015 <006 <0.02 0.07 <0.05 0.014 <0.08 1.1
EOR-B22 128 204 29 642 551 15.30 0.44 1.20 3.70 0.2 <04 0.03 <0.08 <007 <0.1 <0.05 <002 <008 <0.05 0.003 <007 <0.5 <07 <0 08 08EOR-B23 134 195 7.10 18.00 0.72 279 3.19 <0.4 0.12 <007 <0.15 <0O6 <0.02 0.07 <0.05 0.014 <008 0.7
EOR-B45* 201 309 0.38 13.10 330 0.50 2.80 4.10 <0.4 <04 006 <0 08 <007 <0.1 009 <0.02 <008 <0.05 <0.003 <0.07 <0.5 <08 <008 <03EOR-B46* 190 294 22 0.31 13.00 6.00 0.50 2.60 3.80 0.3 <04 0.07 <008 <007 <0.1 010 <002 <008 <0O5 <0.003 <0.07 <05 <08 <0.08 <0.3
EOR-B47 -199 308 21 4.66 12.40 080 0.50 2.60 3.60 0.2 <04 0.04 <008 <0.07 <0.1 <0.05 <0.02 <008 <0.05 <0003 <007 <0.5 <08 <0.08 0.9
EOR-B49* 199 304 21 6.47 12.00 0.60 0.50 2.50 4.70 0.3 <04 004 <0.08 <0.07 <0.1 <005 <0.02 <008 <0.05 <0.003 <007 <0.5 <08 <008 <0.3
EOR-B48* 198 297 21 2.42 12.40 090 0.50 2.70 430 03 <0.4 005 <008 <007 <0.1 <005 <002 <0 08 <0.05 <0003 <007 <0.5 <0.8 <0.08 <03EOR-B32* 190 315 0.67 068 079 4.22 610 <04 021 <0.05 <0.15 0.24 <0.02 0.10 <005 <005 <03EOR-B33" 190 304 0.38 14.80 065 4.31 5.00 <04 0.21 <005 <0.15 0.21 <0.02 0.10 <005 <0.05 <03EOR-B59 196 381 35 0.44 10.60 17.20 1.04 2.19 3.40 02 <0.4 005 <008 <007 <0 15 <0 05 0.49 <008 <005 <0003 <0.07 <0.5 <0.8 <008 12
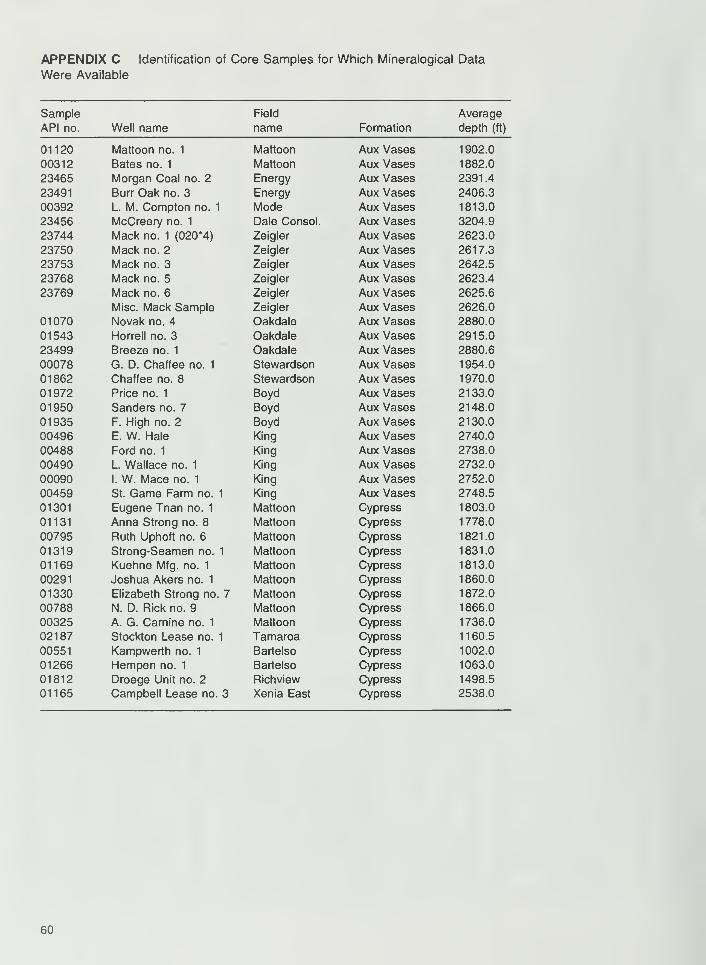
APPENDIX C Identification of Core Samples for Which Mineralogical Data
Were Available
Sample Field Average
API no. Well name name Formation depth (ft)
01120 Mattoon no. 1 Mattoon Aux Vases 1902.0
00312 Bates no. 1 Mattoon Aux Vases 1882.0
23465 Morgan Coal no. 2 Energy Aux Vases 2391.4
23491 Burr Oak no. 3 Energy Aux Vases 2406.3
00392 L. M. Compton no. 1 Mode Aux Vases 1813.0
23456 McCreery no. 1 Dale Consol. Aux Vases 3204.9
23744 Mack no. 1 (020*4) Zeigler Aux Vases 2623.0
23750 Mack no. 2 Zeigler Aux Vases 2617.3
23753 Mack no. 3 Zeigler Aux Vases 2642.5
23768 Mack no. 5 Zeigler Aux Vases 2623.4
23769 Mack no. 6 Zeigler Aux Vases 2625.6
Misc. Mack Sample Zeigler Aux Vases 2626.0
01070 Novak no. 4 Oakdale Aux Vases 2880.0
01543 Horrell no. 3 Oakdale Aux Vases 2915.0
23499 Breeze no. 1 Oakdale Aux Vases 2880.6
00078 G. D. Chaffee no. 1 Stewardson Aux Vases 1954.0
01862 Chaffee no. 8 Stewardson Aux Vases 1970.0
01972 Price no. 1 Boyd Aux Vases 2133.0
01950 Sanders no. 7 Boyd Aux Vases 2148.0
01935 F. High no. 2 Boyd Aux Vases 2130.0
00496 E. W. Hale King Aux Vases 2740.0
00488 Ford no. 1 King Aux Vases 2738.0
00490 L. Wallace no. 1 King Aux Vases 2732.0
00090 I. W. Mace no. 1 King Aux Vases 2752.0
00459 St. Game Farm no. 1 King Aux Vases 2748.5
01301 Eugene Tnan no. 1 Mattoon Cypress 1803.0
01131 Anna Strong no. 8 Mattoon Cypress 1778.0
00795 Ruth Uphoft no. 6 Mattoon Cypress 1821.0
01319 Strong-Seamen no. 1 Mattoon Cypress 1831.0
01169 Kuehne Mfg. no. 1 Mattoon Cypress 1813.0
00291 Joshua Akers no. 1 Mattoon Cypress 1860.0
01330 Elizabeth Strong no. 7 Mattoon Cypress 1872.0
00788 N. D. Rick no. 9 Mattoon Cypress 1866.0
00325 A. G. Carnine no. 1 Mattoon Cypress 1736.0
02187 Stockton Lease no. 1 Tamaroa Cypress 1160.5
00551 Kampwerth no. 1 Bartelso Cypress 1002.0
01266 Hempen no. 1 Bartelso Cypress 1063.0
01812 Droege Unit no. 2 Richview Cypress 1498.5
01165 Campbell Lease no. 3 Xenia East Cypress 2538.0
60