Embed Size (px)
Citation preview
Accepted for Publication in “Skin Research and Technology”
1
Fluorescent Silica Colloids for Study and Visualization
of Skin Care Products
Swaminathan Iyer, Yaroslav Kievsky, Igor Sokolov*
Dept. of Physics, Clarkson University, Potsdam, NY 13699
* Corresponding author.
Postal address: 8 Clarkson Ave., Dept. of Physics, Clarkson University, Potsdam, NY
13699-5820, USA.
Telephone: 1-315-268-2375, fax: 1-315-268-6610, email: [email protected]

Accepted for Publication in “Skin Research and Technology”
2
Abstract
Background: Efficacy of skin care products depends on the time and dynamics of their
absorbance by skin, its spatial distribution on skin. Regular scrape-based methods may
depend on the operator and are destructive, invasive in nature. Here we describe a novel
method based on non-contact optical measurements to trace location and dynamics of
skin-care products on skin.
Methods: We use fluorescent silica colloidal particles of micron sizes at rather small
concentration as non-invasive tracers. As an example of skin-care products, we use two
base materials, either glycerin or Vaseline. A mixture of each product with fluorescent
particles is applied on human skin. The amount of fluorescence is monitored by means of
a fluorescent spectrometer. Scraping method is used to compare with the spectroscopic
measurements.
Results: Fluorescent tracers make the skin care product visible under UV light. This
allows obtaining an optical image of the spatial distribution of the product on skin. The
quantitative data of fluorescence is well correlated with the scrape data. Comparing the
difference in the spectral and scrapped mass data reveals the details of accumulation of
the skin products in skin cracks and crevices.
Conclusion: We described an efficient non-invasive benign method to quantify dynamics
and to make mapping of emollients and humectants on skin.
Key words: Skin care products – Fluorescence – Colloids – Spectroscopy

Accepted for Publication in “Skin Research and Technology”
3
Human skin is the body first wall of defense against the outside environment. It
protects the body from dehydration, bleeding, and invasion of microorganisms, plays the
role of a “thermos” to maintain body temperature [1]. The skin has three major layers: the
epidermis, the dermis and the subcutaneous fat layer. Stratum corneum (part of the skin
that forms the junction of the body with external environment) has been widely
investigated by the cosmetic industries for skin care [2,3]. For example, the role of
stratum corneum for regulating the transepidermal water loss has been investigated [4]. It
has been reported that under normal condition up to 15% of the stratum corneum consists
of water [5]. The natural functions of skin do not work very well if the water content
drops below 10 % [6]. The protective oil produced by the sebaceous glands together with
the stratum corneum, plays a very vital role in determining the health and nature of the
human skin. Long exposure to water and excessive use of soap are among others the most
important reasons quoted for the removal of the protective oil layer from the skin. This
result in “dry” skin problems often experienced also during winter due to long exposures
to cold and dry air [7].
Different skin care products are used to hydrate dry skin. The two major kinds of
moisturizers available in the market are emollients (such as petroleum jelly, mineral oil,
and lanolin) and humectants (such as glycerin, sorbitiol, lactic acid, and urea) [8]. While
petroleum jelly provides the best barrier properties and is comparatively cheap it also has
several disadvantages. It is greasy and harder to wash off. While attempting to hold
moisture in skin, it traps the toxins and wastes that are inside your skin's layers. This, for
example, may result in premature aging of the skin. Glycerin, on the other hand, attracts
and holds water on the skin's surface. But while doing so, it will draw moisture from the

Accepted for Publication in “Skin Research and Technology”
4
lower layers of skin and hold it on the surface. That means that glycerin will dry the skin
from inside out. Moreover, there is evidence that glycerin is a human mutagen [9].
Though these products have been in use for a long time, the pharmaceutical companies
have often found it difficult to quantitatively validate the life span of their activity on the
skin.
In the present work we introduce a novel technique to trace and study the
presence of skin care products on skin using fluorescent silica particles [10,11]. To
demonstrate the method, we use two base materials, glycerin and Vaseline as skin care
products. Fluorescent particles are physically mixed with the products. The method is
comparatively benign due to encapsulation of the fluorescent dye within the silica
particles and does not use any complimentary modification of the silica surface for
tagging. The method does not require sophisticated instruments. It can be used both in
ambient conditions and in liquids directly.
Materials and Methods
Fluorescent silica colloids
Synthesis of fluorescent silica colloids is described in detail elsewhere [11].
Briefly, we used cetyltrimethylammonium chloride (CTACl, 25 wt. % aqueous solution)
and tetraethylorthosilicate (TEOS, 99.999%) obtained from Aldrich. Hydrochloric acid
(HCl 37.6 wt. % aqueous solution) was supplied by SafeCote. Formamide (HCONH2,
100%) and dimethylformamide (HCON(CH3)2, 100%) were produced by J.T.Baker.
Rhodamine family laser dyes (R640 and LD700) were purchased from Exciton. Solutions

Accepted for Publication in “Skin Research and Technology”
5
were diluted with distilled water (Corning AG-1b, 1M -cm distiller). All chemical were
used as received.
The molar composition of the reactants was 100 H2O : 7.8 HCl : 9.8 Formamide :
0.11 CTACl : 0.13 TEOS. Aqueous solution of concentrated laser dye was added to
create target dye concentration of 10-3 M in the synthesizing bath. For this work we used
a 50-50 mix of rhodamine 640 and LD700 lasing dyes. After initial 15 minute mixing, the
resulting solution was kept under quiescent conditions for 3 days at room temperature.
The particles were collected either by centrifugation or filtering. An image of the
synthesized particles is shown in Fig.1. One can see a mix of some amount of fiber-like
particles with a large amount of “discoids” with a typical size of ca. 5 m.
Preparation of the mix of Vaseline and glycerin with the fluorescent silica
colloids
Glycerin, Natural 99.5% USP (Humco Holding Group, Inc.) and Vaseline (100% pure
petroleum jelly, Vaseline Intensive Care) were used as received. Physical mixtures of
fluorescent silica particles with Vaseline and glycerin were prepared. The concentration
of the particles in the mixtures were maintained at approximately 0.2 wt. %. Prepared
mixes were stored and used for many days (months if needed) without noticeable
deterioration or possible dye leakage.
Measurements setup
The experimental setup for spectral analysis is illustrated in Fig. 2. The setup was placed
under a dark chamber to minimize interaction with the external light while recording
Accepted for Publication in “Skin Research and Technology”
6
data. An UV flash light was used a light source to induce fluorescence. An optical filter
(Omega 488 broadband) was used to screen the UV light from the source and allowed the
only fluorescent signal from the particles to reach the spectrometer. USB2000 UV-VIS
spectrometer (Ocean Optics) was used to detect the amount of fluorescent light. To do
absolute irradiation measurements of the amount of fluorescent material, the spectrometer
was calibrated by LS-1-CAL Calibrated Tungsten Halogen Light Source (Ocean Optics).
After such calibration, we can assume that the amount of fluorescent material on the
surface proportional to the area under the spectral curve. The area of skin exposed to the
skin care products were imaged using consumer digital cameras (Minolta DX1 and
Olympus 3030).
The area of the hand under study was cleaned with soap before the application of
the mixture to remove contaminants. Spectrometric and weight data were obtained at
intervals of 0, 20, 40, 60, 80, 120, 180, 240, 300 and 360 minutes after application. The
amount of glycerin and Vaseline left on the skin were measured by gently scraping them
out from the skin once with a piece of 0.5 mm thick aluminum foil. This was done at
different intervals of time passed since the product application.
Results and Discussion
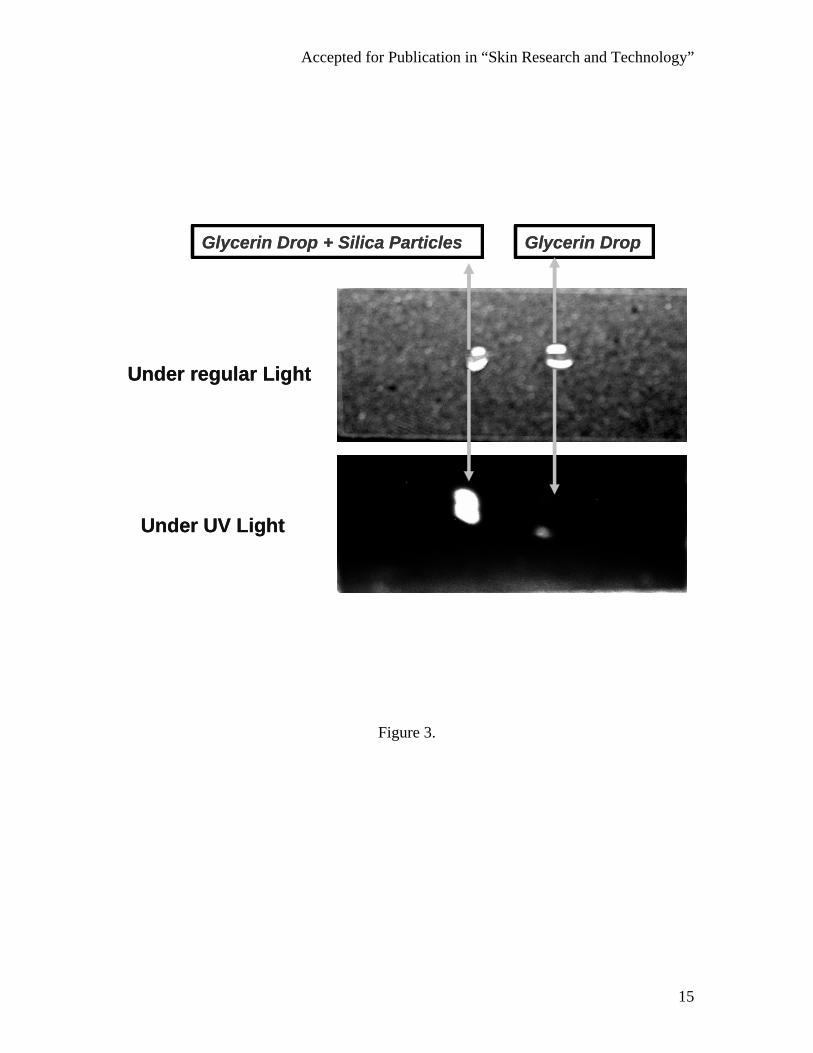
Fluorescence from the dyes encapsulated silica particles is very strong and stable.
A very small concentration of these particles is sufficient to obtain strong signal. Indeed
it can be noticed that the drop of glycerin mixture appears as a bright area under UV light
but cannot be differentiated from the glycerin drop under regular white light, Figure 3.
Typical size of the fluorescent particles is in the range of 5-20 microns, Fig.1. This

Accepted for Publication in “Skin Research and Technology”
7
prevents the articles from penetrating inside skin. Finally, silica is rather chemically inert
material. It is believed that the silica particles of such size at these small concentrations
will act as a non-invasive tracer with no interference with the skin care products.
After applying a small amount of the Vaseline and glycerin mixed with the
fluorescent particles, the area was imaged by taking images with a digital camera. Fig. 4
shows such images when the glycerin mix was applied onto a hand skin surface. While
under regular light it was virtually impossible to see the area with glycerin (top image), it
was clearly seen under UV light (bottom image). Somewhat washy bottom image is due
to low light conditions while camera was kept just by hands. Potentially, it is not difficult
to obtain high resolution images of the spatial distribution of the skin care products on
skin. Thus the strong fluorescence from the silica particles provided an effective method
to visually monitor the distribution of skin care products on skin surface.
The brightness of fluorescence can be correlated with the amount of the product
on skin. We show now that the fluorescence can be used for studying the dynamics of
adsorption/removal of the skin care products on skin. Because the mix of either Vaseline
or glycerin with the particles is rather homogeneous, it is plausible to assume that the
amount of fluorescent light is proportional to the amount of Vaseline / glycerin. After
applying Vaseline or glycerin, the area of the skin under study was further studied. It was
done under the UV light source for various time intervals to detect any visual change
first. This experiment was performed to give an approximate time frame of study for the
spectroscopic analysis. Visual analysis of the images, Fig. 5, revealed that the decay in
the fluorescence signal from the glycerin covered area was pronounced in the initial 80
Accepted for Publication in “Skin Research and Technology”
8
minutes of the experiment. The decay in the Vaseline covered area was at a significantly
slower rate when compared to glycerin.
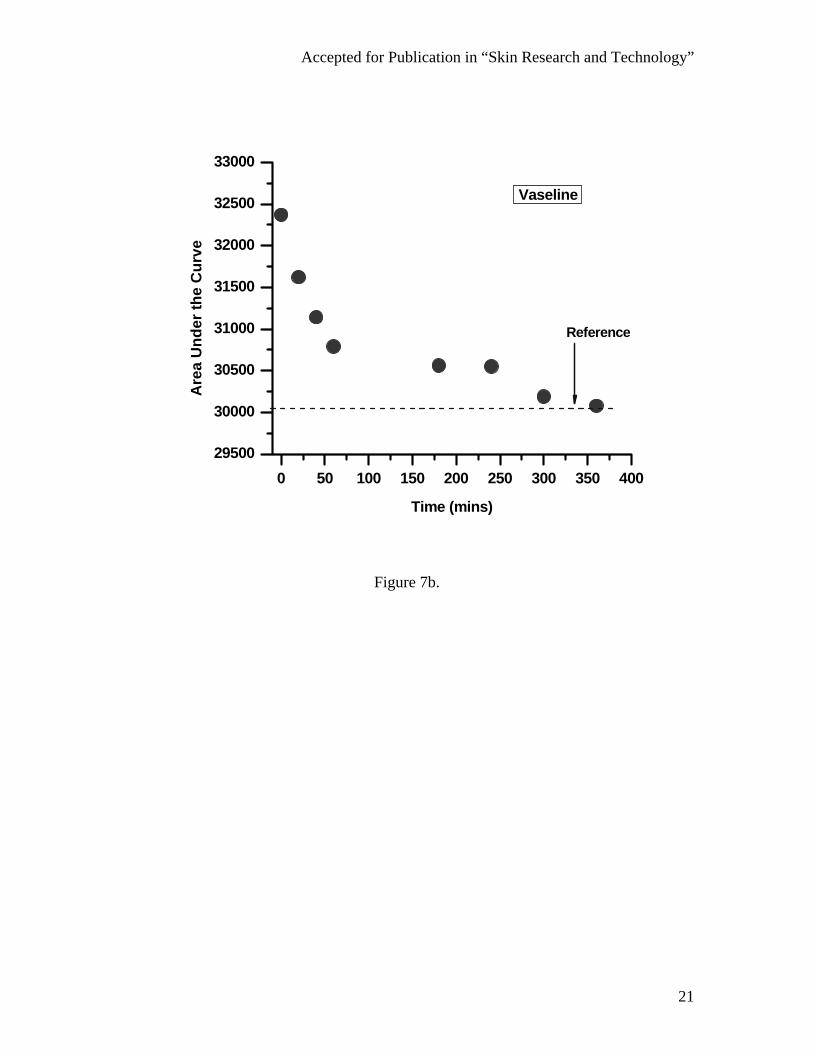
Spectral analysis for both Vaseline and glycerin indicated decay in fluorescence
signal with time, Figure 6 (distribution of relative intensity is shown). Analysis of the
area under the curves, shown in Figure 7, revealed that indeed the decay in the signal was
rapid in the case of glycerin, while the decay was slower for Vaseline. It can be noted that
the initial slope (within 80 minutes of application) was much higher for glycerin when
compared to Vaseline. This substantiated the earlier claim after visual analysis that the
loss in the activity of glycerin on skin was pronounced and rapid in the initial 80 minutes
of application.
To correlate these measurements with the actual amount of Vaseline or glycerin
on skin surface, a control experiment was performed by scraping Vaseline and glycerin
from the skin surface after different time intervals. Figures 8a, 8b show the results of
measurements of the mass of the scraped material. One can see a good correlation with
spectroscopic measurements, Figures 7a, 7b. Comparing these two methods of measures,
one has to keep in mind that the scrapping method is too much operator dependent (for
example, too hard to control the load force while scrapping). Consequently, it can provide
very limited quantitative measurements of the amount of the skin care product. It is
believed that the use of the fluorescent tracers is much less operator dependent.
Comparing Figures 7a, 7b and 8a, 8b, one can see that the initial slope in the
spectroscopic data, Figures 7a, 7b, is more pronounced than in the mass measurements,
Figures 8a, 8b. In particular, it is clearly seen for the case of glycerin, Figures 7a and 8a.
Such a behavior can presumably be explained by the analysis of what happens to the

Accepted for Publication in “Skin Research and Technology”
9
fluorescent particles after the application of the Vaseline/ glycerin. First, the particles can
be removed by an accident scrapping (testing individuals was allowed to behave freely
between the measurements). This, however, can explain general decrease of the amount
of the product and particles, but not the difference in the slopes. Secondly, the product is
being adsorbed by skin. This process is quite different for Vaseline and glycerin.
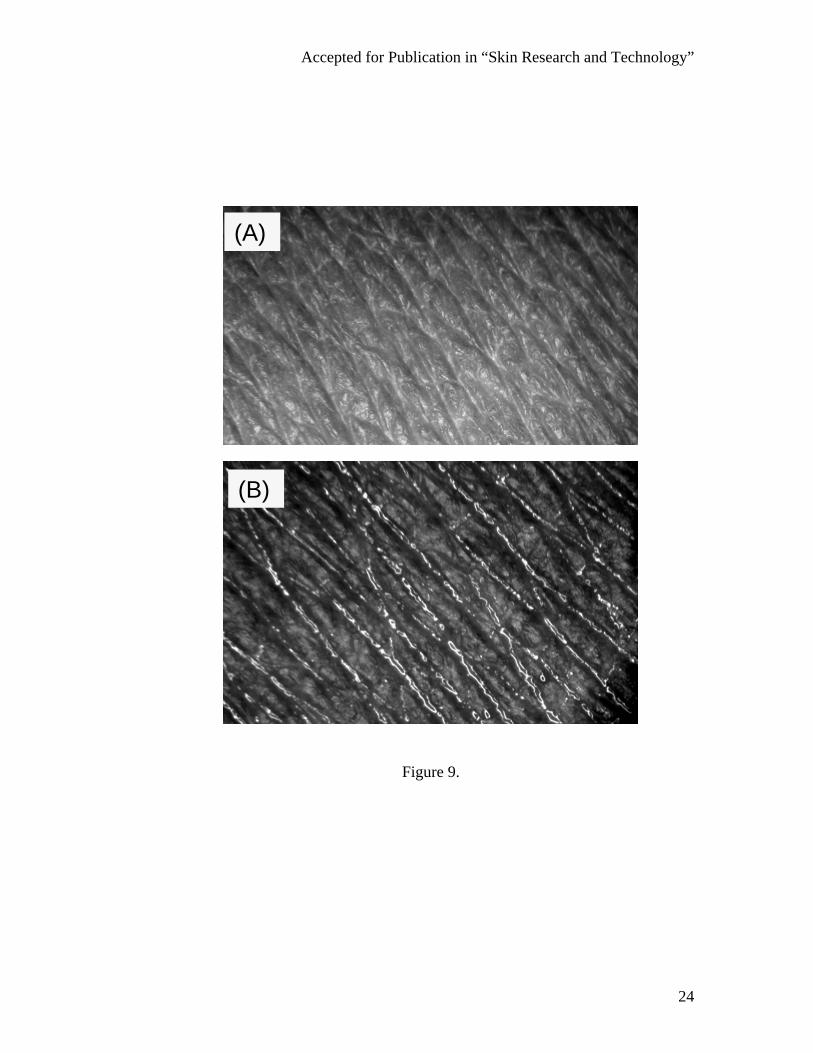
Vaseline is a very viscous and greasy comparing to glycerin. After some time, it can
clearly be seen than glycerin accumulates in skin crevices, Fig. 9 (regular light reflection
image). It should be noted that to get a similar image for Vaseline was virtually
impossible because of residual amount of Vaseline left on all cornea surface, which gave
even bright reflection from whole surface. Fluorescent images show accumulation of
fluorescent particles in crevices for both glycerin and Vaseline (not shown due to the lack
of high-sensitivity camera). However, this process is much faster for glycerin. Therefore,
we can explain the fast initial slop of Fig. 7a by relatively rapid removal of glycerin (with
particles) from the skin surface and its accumulation in the crevices. Subsequent
saturation/slow decrease in signal after the initial slump is now naturally explained by
long life of glycerin and particles inside the crevices. Similar process happens for
Vaseline but in slower rate.
At the end, it is worth saying that after soap washing virtually no particles were
left on skin as was checked by means of the fluorescent microscope.
Conclusion
The use of fluorescent silica colloidal particles is safe for topical applications, and can be
used for the labeling and non-contact tracing of skin care products. Encapsulation of the

Accepted for Publication in “Skin Research and Technology”
10
dyes inside the silica particles and relatively large sizes of the particles, makes the topical
application of the skin care products premixed with the silica colloids completely benign.
Strong fluorescence of the particles ensures that only a very small amount is necessary to
trace skin care products on the skin surface. This novel approach facilitates to
quantitatively monitor the efficacy of skin care products with the least amount
experimental errors. The similarity in the spectral analysis graphs and the scrapped mass
graphs shows that our approach of using fluorescent tracers is an efficient method to
quantify dynamics of emollients and humectants on skin. Analyzing the difference in the
spectral and scrapped mass graphs reveals details of accumulation of the skin products in
crevices. The later can probably be used for quantification of crevices and skin cracks.
Acknowledgement This work was partially supported by the Coulter Foundation (through Clarkson
University) and the US Army Research Office (grant W911NF-05-1-0339).

Accepted for Publication in “Skin Research and Technology”
11
Legends for Illustrations Figure 1. A 60x60 m2 optical image of fluorescent silica particles. The majority of the
particles are around “discoids” while there is some number of fibers.
Figure 2. Schematic representation of the spectroflurometric set up assembled for the
experiments described in the present work.
Figure 3. Image of a drop of glycerin with and without fluorescent particles under normal
light and UV light.
Figure 4. Image of a forearm showing the area of application of glycerin mixed with the
fluorescent particles. The area appears invisible under normal light while clearly
seen as a bright patch under UV light.
Figure 5. Series of consequent images of the area of application of glycerin/Vaseline mix
with the particles taken under UV light. T represents the time after the initial
application in minutes.
Figure 6. Spectrographs of the fluorescent signal from glycerin (a) and Vaseline (b)
mixed with the particles taken at different time intervals after application.
Figure 7. Area under the spectral curves of shown in Fig. 6 for glycerin (a) and Vaseline
(b) plotted versus time.
Figure 8. Mass of glycerin (a) and Vaseline (b) scraped from the skin surface plotted
versus time.

Accepted for Publication in “Skin Research and Technology”
12
Figure 9. High magnification reflection optical images of the forearm skin. (A): Bare skin
showing crevices/cracks with no glycerin applied. (B): Localization of glycerin
at the crevices/cracks soon after application.

Accepted for Publication in “Skin Research and Technology”
13
Figure 1.

Accepted for Publication in “Skin Research and Technology”
14
Figure 2.
UV Source
Skin
Optical Filter
Spectrometer
Fluorescent signal
UV light blocked by the filter
Accepted for Publication in “Skin Research and Technology”
15
Figure 3.
Under UV Light
Under regular Light
Glycerin Drop + Silica Particles Glycerin Drop
Under UV Light
Under regular Light
Glycerin Drop + Silica Particles Glycerin Drop

Accepted for Publication in “Skin Research and Technology”
16
Figure 4.
Under UV Light
Under regular Light
Under UV Light
Under regular Light
Under UV Light
Under regular Light
Under UV Light
Under regular Light

Accepted for Publication in “Skin Research and Technology”
17
Figure 5.

Accepted for Publication in “Skin Research and Technology”
18
Figure 6a.
450 500 550 600 650 700110
115
120
125
130
135
140
145
150Glycerin 0 min
10 min 40 min 60 min 120 min 360 min
Inte
nsity
(cou
nts)
Wavelenght (nm)

Accepted for Publication in “Skin Research and Technology”
19
Figure 6b.
450 500 550 600 650 700110
115
120
125
130
135
140
145
150Vaseline 0 min
20 min 40 min 60 min 120 min 360 min
Inte
nsity
(cou
nts)
Wavelenght (nm)

Accepted for Publication in “Skin Research and Technology”
20
Figure 7a.
0 50 100 150 200 250 300 350 40030500
31000
31500
32000
32500
Are
a U
nder
the
Cur
ve
Time (mins)
Glycerin
Reference
Accepted for Publication in “Skin Research and Technology”
21
Figure 7b.
0 50 100 150 200 250 300 350 40029500
30000
30500
31000
31500
32000
32500
33000
Are
a U
nder
the
Cur
ve
Time (mins)
Vaseline
Reference

Accepted for Publication in “Skin Research and Technology”
22
Figure 8a.
0 50 100 150 200 250 300 350 400
0.000
0.005
0.010
0.015
0.020
0.025
0.030
0.035
Scra
ped
mas
s (g
m)
Time (mins)
Glycerin

Accepted for Publication in “Skin Research and Technology”
23
Figure 8b.
0 50 100 150 200 250 300 350 4000.016
0.020
0.024
0.028
0.032
Scra
ped
mas
s (g
m)
Time (mins)
Vaseline
Accepted for Publication in “Skin Research and Technology”
24
Figure 9.
(A)
(B)
(A)
(B)

Accepted for Publication in “Skin Research and Technology”
25
References 1. González-Alonso J., Teller C., Andersen S. L., Jensen B.F., Hyldig T., and Nielsen B.
Influence of body temperature on the development of fatigue during prolonged exercise
in the heat. J. Appl. Physiol. 1999: 86: 1032-1039.
2. Ginger R., Blachford S., Rowland J., Rowson M., Harding C.R. Filaggrin repeat
number polymorphism is associated with a dry skin phenotype. Arch. Dermatol. Res.
2005: 1-7.
3. Strid J., Strobel S. Skin barrier dysfunction and systemic sensitization to allergens
through the skin. Curr. Drug Targets Inflamm. Allergy. 2005: 4: 531-541.
4. Wilhelm K.P, Cua A.B, Maibach H.I. Skin aging: Effect on transepidermal water loss,
stratum corneum hydration, skin surface pH, and casual sebum content. Arch. Dermatol.
1991:127(12):1806-1809.
5. Davison T.W. SonoPrep® ultrasonic skin permeation and drug delivery applications.
Drug Deliveries Company Report 2005© PharmaVentures Ltd. 2005.
6. Gray J. The world of skin care. © Procter & Gamble Haircare Research Centre 1997.
7. Rawlings A.V. Trends in stratum corneum research and the management of dry skin
conditions. Int. J. of Cosmetic Sci. 2003: 25 (1-2): 63.
Accepted for Publication in “Skin Research and Technology”
26
8. Rwalings A.V., Canestari D.A., Dobkowski B. Moisturizer technology versus clinical
performance. Dermatologic Therapy. 2004: 7: 49.
9. Wolfreys A.M., Basketter D.A. Mutagens and Sensitizers – An Unequal Relationship?
Journal of Toxicology: Cutaneous and Ocular Toxicology. 2004: 23: 197-205
10. Yang S.M., Sokolov I., Coombs N., Kresge C.T., and Ozin G.A. Formation of
hollow helicoids in mesoporous silica: Supramolecular Origami. Advanced Materials.
1999: 11(17): 1427-1431.
11. Kievsky Y, Sokolov I. Self-assembly of ultra-bright fluorescent silica particles,
Submitted for publication.