Embed Size (px)
Citation preview
22nd European Photovoltaic Solar Energy Conference, Fiera Milano, Italy, 3-7 September 2007 Version: 30 August 2007
FLUORINATED GREENHOUSE GASES IN PHOTOVOLTAIC MODULE MANUFACTURING: POTENTIAL EMISSIONS AND ABATEMENT STRATEGIES
M.J. de Wild-Scholten, [email protected], Phone +31 224 564736,
Energy research Centre of the Netherlands ECN, Unit Solar Energy, P.O. Box 1, 1755 ZG Petten, the Netherlands E.A. Alsema, [email protected], Phone +31 30 2537618,
Copernicus Institute, Utrecht University, Heidelberglaan 2, 3584 CS Utrecht, The Netherlands V.M. Fthenakis, [email protected], Phone +1 631 344 2830,
National Photovoltaic EH&S Research Center, Brookhaven National Laboratory, Upton, NY 11973, USA G. Agostinelli, [email protected], Phone +32 16 281555, H. Dekkers, [email protected], Phone +32 16 281 920,
IMEC vzw, Kapeldreef 75, B-300 Leuven, Belgium K. Roth, [email protected], Phone +49 37 23498823,
Roth & Rau AG, Gewerbering 3, 09337 Hohenstein-Ernstthal, Germany V. Kinzig, [email protected], Phone +49 7344 9181801,
Centrotherm Clean Solutions, Johannes-Schmid-Strasse 3, D-89143 Blaubeuren, Germany
ABSTRACT: Some fluorinated gases (F-gases) which are used, or considered to be used, in crystalline silicon photovoltaic solar cell and film silicon module manufacturing have a very high global warming effect. CF4, C2F6, SF6 and NF3 have global warming potentials 7390, 12200, 22800 and 17200 times higher than CO2. These gases can be used in texturing, phosphorus silicate glass removal (PSG), edge isolation and reactor cleaning operations from which unreacted species and reaction byproducts will be emitted. An inventory of the current use of fluorinated greenhouse gases by the European and U.S.A. photovoltaic industry shows that CF4 may be used in edge isolation and C2F6 or SF6 or NF3 for reactor cleaning after deposition of silicon nitride or film silicon. Currently only a few companies use these gases; however, dry texturing and PSG removal with F-gases is widely considered as replacement of wet processing. The environmental profile of these new processes can be improved by lowering the use and emissions of F-gases and energy consumption. Exhaust abatement is needed to decompose the unreacted fluorinated greenhouse gases if we want PV electricity to minimize the environmental impact of solar electricity. Although abatement equipment will also have a cost impact, we recommend installing such equipment to preserve the sustainable character of PV energy. Keywords: environmental effect, crystalline silicon, amorphous and microcrystalline silicon, manufacturing and processing 1 INTRODUCTION
Gases like CO2, CH4, N2O and the F-gases (like CF4,
C2F6, SF6, NF3) contribute 82%, 8%, 8% and 2% respectively to the greenhouse gas effect in the European Union in 2004 [1]. The global warming potentials (GWP) of F-gases is very high, as shown in table I. Often these gases are referred to as PFCs or perfluorocarbons. Strictly speaking PFCs don't include SF6 and NF3, therefore we use the term F-gases.
Table I: Global warming potential of certain greenhouse gases [2] Chemical species Formula Lifetime 100-yr GWP years kg CO2-eq carbon dioxide CO2 170-200* 1 methane CH4 12 25 nitrogen trifluoride NF3 740 17200 nitrous oxide N2O 114 298 perfluoromethane CF4 50000 7390 perfluoroethane C2F6 10000 12200 sulfurhexafluoride SF6 3200 22800 *the lifetime of CO2 is a function of its concentration [2], pp. 212-213
Some F-gases are used or considered to be used by the photovoltaic industry in processes like texturing, phosphorus silicate glass (PSG) removal, edge isolation
and reactor cleaning after deposition of silicon nitride or film silicon. Apart from the global warming effect of the F-gases, potential risks in operation need to be considered. Fluorine-containing gases are forming F-radicals inside the plasma chamber which react with the silicon. Besides forming SiF4, HF is generated if air moisture is involved. This presents a health risk for the operators. Among the primary F-gases NF3 is also toxic as it has the ability to destroy red blood cells and cause suffocation. On the other hand, hydrofluoric acid solutions used in wet chemical processing also pose a health risk to the operators.
The utilization of F-containing gases in etching processes is low. The higher the binding force between the F-C-bond, the lower the fragmentation in the process chamber will be. CF4 and SF6 have the lowest defraction rates, and, therefore the lower material utilization rates. As the utilization depends on the type of plasma source and reactor design, the efficiency inside the chamber can vary from one tool supplier to another.
Because of the risk employed by handling harmful reaction by-products from the fluorine gases as well from the global warming effect, these gases need to be treated by specifically designed exhaust abatement systems to provide a high thermal energy and the capability to wash out or react the fluorine following the thermal treatment process. The efficiency of abatement systems is typically 95% to 99%, according to abatement system manufacturers.

22nd European Photovoltaic Solar Energy Conference, Fiera Milano, Italy, 3-7 September 2007 Version: 30 August 2007
European regulation aims at reducing the emission of fluorinated greenhouse gases (F-gases) [3]. One of the first requirements is to aquire emission data (article 6.4):
"Member States shall establish reporting systems for the relevant sectors referred to in this Regulation, with the objective of acquiring, to the extent possible, emission data."
Although the photovoltaic industry is not explicitly mentioned in this regulation, it is recommended to take a proactive approach. The semiconductor industry has voluntary agreed to reduce F-gas emissions [4]. The IPCC recently published guidelines for compiling emission inventories in the semiconductor, liquid crystal display and PV industries [5]. It would be wise if the PV industry would actively collect data on F-gas consumption and emission, of only to prevent unreasonably high estimates by IPCC bases on semiconductor or LCD industry data.
In Paragraph 2 consumption and estimated emission data from the European and U.S.A. photovoltaic industry are presented.
In Paragraph 3 options to reduce the emissions of fluorinated greenhouse gases will be reviewed.
In Paragraph 5 an environmental impacts of dry and wet texturing of crystalline silicon wafers are assessed. The results are preliminary because the plasma processes only exist on lab-scale and are not tested with an abatement system in place.
In Paragraph 6 an environmental impact comparison is made between 1) separate wet PSG removal and silicon nitride PECVD deposition and 2) integrated dry PSG removal plus silicon nitride PECVD deposition. Here again the results are preliminary because the integrated system has not been tested with an abatement system in place.
In Paragraph 7 edge isolation is shortly discussed. In Paragraph 8 reactor cleaning is discussed and the
NF3 cleaning after deposition of film silicon is analyzed. Finally in Paragraph 9 the greenhouse gas emission
per kWh of electricity produced in Southern Europe are presented.
To determine the environmental impact the method
of environmental life cycle assessment is used. Thus the effect to the environment is determined over the whole life cycle including mining, production of materials, energy consumption, and treatment of waste and emissions. For this purpose the software tool SimaPro 7 with EcoInvent database 1.3 will be used. The Life Cycle Inventory data for the production of F-gases will be described in Paragraph 4. Data for the production of clean dry air and process cooling water were provided by M+W Zander (personal communication Martin Schottler 21 August 2007). As electricity mix we use the European UCTE average which corresponds to greenhouse gas emissions of 484 g CO2-eq per kWh. The impact assessment method used is CML 2 baseline 2000 (modified with latest GWPs of CF4, C2F6, SF6 and NF3 from [2]). The functional unit for the LCA comparison is 1 kWh of electricity produced by PV systems in Southern Europe.
2 USE OF FLUORINATED GASES IN PV CELL AND MODULE MANUFACTURING
The European- and U.S.A. crystalline- and film
silicon PV industries were requested to provide information about their use and emission of F-gases in their factory (percentages based on MWp produced in 2006 according to Photon International March 2007). 79% of the European- and 62% of the U.S.A. companies have provided information. Many companies do not use these gases at all because alternatives exist.
Some companies still use CF4 in edge isolation although it is not state of the art anymore because of high wafer breakage rates. The companies without abatement emit roughly 0.8 g CF4/m2. We assumed utilization in the production process of 10% for CF4 and an abatement efficiency of 95% for CF4. In most cases F-gases are not included in regular factory emission measurements because these gases are not regulated; this makes a good estimation of the emissions difficult.
Chamber cleaning can be done with F-gases. One company which uses NF3 could not detect F-gases in a recent emission measurement. 3 EMISSION REDUCTION OPTIONS
The International SEMATECH Manufacturing Initiative has published a report with technologies to reduce F-gas emissions [6]. The hierarchy in the development of F-gas emission reduction technology is as follows:
1. process optimization/alternative processing 2. alternative chemistries for the F-gases like the
use of F2 3. capture/recovery 4. abatement
Options 2, 3 and 4 will be reviewed in more detail below. 3.1 On-site generation of F2
F2 can be used as process gas and has the advantage providing a high reaction activity already without applying plasma resulting in lower energy consumption. Furthermore it has a global warming potential of zero and is easier to abate. Because of the toxicity of HF and F2 the PV industry is reluctant to use it.
It is not suited to remove silicon oxide however, so it is not suitable for PSG removal.
Equipment for on-site generation of F2 gas from anhydrous HF by electrolysis has been developed by BOC (now Linde Electronics) and Fluorine on Call (http://www.focltd.com/). 3.2 Supply of F2 in cylinders
F2 may be supplied in cylinders containing 20% F2 and 80% N2. This technology has been developed by Solvay as an alternative for the usage of SF6, and is considered for use in the PV Industry. However, safe installation and operation procedures need to be established in view of the corrosivity and toxicity of the compound. For example, special mass flow controllers and valves are required as well a special passivation process of the process gas lines is necessary to run F2 inside the fab. 3.3 Capture/recovery
The recovery of SF6 is a well known technology for

22nd European Photovoltaic Solar Energy Conference, Fiera Milano, Italy, 3-7 September 2007 Version: 30 August 2007
the electronic industry. Today almost all switch gears used in electric power supply are filled with SF6 as an insulator gas to extinguish sparks. As part of the maintenance, the SF6 in such switch gears need to be replaced by evacuation and refilled with purified SF6. As long as the gas is inert, the recovery by using a vacuum pump arrangement with a compressor unit to evacuate the gears and to compress the gas in a transportation cylinder is technically no problem (Solvay SF6-ReUse-Concept, AVENTEC Ecoprogram SF6). However, recovery of SF6 used in a plasma etching process is different. The SF6 contains several by-products generated during the etching process, e.g. SiF4, SO2, and several other compounds and gases, and N2 as purging gas for vacuum pumps. This multicomponent gas stream requires several cleaning and separation processes up-stream the compression step. The most frequently used separation processes are hollow fibre membrane, pressure swing absorption or liquefaction by cryo-condensation and distilling.
An on-site recycling tool for SF6 called rECOver is available from Linde-Nippon-Sanso and is applied in two installations of Oerlikon Solar equipment. It recycles back the not-used SF6 to the chamber with a quality higher than 99.9%. The tool is paid back by the savings in the SF6 consumption. 3.4 Abatement
For an extensive overview of abatement equipment we would like to refer to a publication of International SEMATECH [6]. It includes a brief description, technology status, applicability, required utilities, reported results (abatement efficiencies), byproducts, cost of technology, cost of ownership, pros, cons, contact person and references.
The type of abatement system which is mainly used today is the burner-scrubber because it has the lowest cost-of-ownership and best performance. In figure 1 a typical equipment scheme is presented.
First step is the burning of the waste gas using natural gas, propane or hydrogen with excess oxygen. CF4 and SF6 are more difficult to decompose than other F-gases because of their molecular structure. A high burner temperature thermally destructs the molecules, followed by a reaction with the burning gas compounds, hydrogen and oxygen. It is noted that effective treatment requires the presence of hydrogen. This can be supplied by methane or propane/butane or hydrogen as a burning gas. The F-radical produced in the combustion chamber will form HF immediately, which is going into the water of the wet scrubber stage after the combustion chamber. The carbon in the CF4 or sulfur in SF6 form CO2 or SO2. The generation of NOx is influenced by the temperature of the flame as well the amount of nitrogen from the vacuum pumps. (Pumps need purging with nitrogen to prevent excessive corrosion and blockages of the rotors by particulate. This means that a process solution which requires a lower nitrogen supply, will provide some advantages regarding the NOx generation and abatement costs.
In the second step of the treatment process the hot gas is cooled down rapidly to prevent undesired re-combinations of the combustion products. Post the quenching/cooling nozzle a wet scrubber removes the components which are soluble in a tap water. Although the solubility of HF in water is very high, using NaOH or
KOH in recirculating scrubber systems would enable the removal of SO2 while reducing the overall consumption of water.
The waste water produced needs treatment to remove the fluoride ions. This is typically done by reaction with CaCl2 producing solid CaF2.
In the last step an aerosol filter prevents particles and droplets escaping to the exhaust system. The exhaust stream contains a low amount of moisture and CO2 and NOx as reaction by-products of the abatement process.
Depending on the type of F-gas, the mass flow of the gas used and the dilution factor caused by the nitrogen purge of the vacuum pump, the efficiency of abatement systems is typically 95% to 99% for solar cell applications. To accurately determine the treatment efficiency, FTIR-measurements need to be established, following the guidelines set by the SEMI-Organization. It is noted that the treatment of the high molecular weight gases like C2F6 or C4F8 can generate other F-gases inside the plasma chamber as well the abatement system. To determine the treatment efficiency of a F-gas-abatement system requires a measurement of the complete spectra of all F-containing species.
Figure 1: Schematic diagram of burner-scrubber
Centrotherm CT-BW TWIN K8 4 LIFE CYCLE INVENTORY DATA OF F-
GASES Before we start with a discussion of our Life Cycle
Assessment results we shortly review the Life Cycle Inventory data on the production of relevant F-gases.
4.1 LCI data CF4
We assume that CF4 is produced via the following chemical reactions [7,8]: 1) 3 CHClF2 2 CHF3 + CHCl3, yield 98%, 2) CHF3 + F2 CF4 + HF, yield 95%.
22nd European Photovoltaic Solar Energy Conference, Fiera Milano, Italy, 3-7 September 2007 Version: 30 August 2007
LCI data for chlorodifluoromethane CHClF2 are taken from the EcoInvent database. Energy consumption and emission data are unknown and not included in the LCA. 4.1 LCI data C2F6
The forthcoming EcoInvent database version 2.0 will contain LCI data for C2F6. 4.2 LCI data SF6
The LCI data for SF6 are taken from EcoInvent database version 1.3. Data may be obtained from Solvay Fluor.
4.3 LCI data NF3
We assume that NF3 is produced via the following chemical reaction: 3 F2 + NH3 1 NF3 + 3 HF, yield 95%. There are many different methods for manufacturing NF3 with different amounts of energy consumed. Generally the energy consumption fall between 25-60 kWh for every kg of NF3 produced (personal communication Bob Carter, Air Products, 9 July 2007). We assume 43 kWh/kg NF3.
5 TEXTURING
Aim of this process it to create a rough surface thereby decreasing the reflection of light. For multicrystalline silicon wafers texturing is carried out with wet chemical acidic etching. The surface damage which remains after sawing the crystalline silicon wafers is removed simultaneously. For texturing monocrystalline silicon wafers and for dry texture etching however, the saw damage removal is done in a separate step before the texturing. The potential increase of the environmental impact because of this separate saw damage removal step is not included in the analysis because no data are available. 5.1 Dry texturing
Dry texturing is being developed by IMEC [9] and Fraunhofer ISE together with Roth&Rau [10]. They both use a SF6 / O2 gas mixture. It is not used on commercial scale at the moment. 5.2 Wet texturing
For monocrystalline silicon solar cell texturing alkaline etching is used. Typically a heated solution of NaOH or KOH and isopropanol is used. To neutralize the waste alkaline solution an acid like HCl can be used.
For multicrystalline silicon solar cell texturing acid etching using HF and HNO3 is used. As reaction products SiF4 and NOx are formed. The following NOx emission reduction possibilities exist: - 90% reduction by local scrubber with H2O2, - 60% reduction by local scrubber without H2O2, - 30% reduction by non-specific central scrubber. Typically only a central scrubber is used. To neutralize the acid waste solution an alkaline solution can be used.
After texturing the wafers are rinsed with deionized water. 5.3 Environmental impact
The following input data were used to evaluate the environmental impact of the texturing process. 1) For alkaline NaOH etching we used table 7.5 from Rentsch [11] which includes the use of NaOH, HF, isopropanol, deionized water, electricity and the treatment of the waste solution by HCl and CaCl2. No emission data are available, and we assumed 5% of the used isopropanol is emitted to the air. These data are projected to a 30 MW production capability, also the machine designs. 2) For acid etching we used the HNO3-HF based ECN recipe in RENA equipment including the use of deionized water, electricity (0.01 kWh per cell of 156 mm x 156 mm) and the treatment of the waste solution by NaOH and CaCl2. No emission data are available but we assume that a 30% reduction of the maximum possible NOx emission is achieved. 3) For dry etching we used the IMEC recipe which includes the use of SF6, Cl2, N2O, electricity (for the plasma generation + 20% for pumping) and the abatement. Clean dry air is used for cooling hot parts but the amount is unknown and not included in the analysis. No emission measurements are available but emissions of SF6, N2O were estimated by 2 burner-scrubber abatement equipment manufacturers (SF6 utilization 70%, DRE 95%). CO2 emission from the use of natural gas was calculated. All data are estimated for a large scale production based on laboratory scale experiments.
Nitrous oxide N2O is not present in the EcoInvent database. It is assumed to be produced from ammonium nitrate according to the following reaction [12] with 95% yield: NH4NO3 N2O + 2 H2O 4) For a second dry etching process we used table 7.5 from Rentsch [11] which includes the use of SF6, O2, electricity and abatement including KOH and CaCl2 to treat the acid waste. No emission data are available. The SF6 emission is estimated using a utilization of SF6 in the texturing process of 70% and a destruction and removal efficiency of SF6 in the abatement system of 95%.
Preliminary results reveal that the global warming effect of dry texturing is higher than for wet texturing because of the emissions of SF6 and CO2 and the use of electricity and SF6. The uncertainty in the data is large because the plasma texturing process only exists on lab-scale and is not tested with an abatement system in place. This means that the emissions are estimated. It is recommended to perform emission measurements, even when no abatement system is present. The company DILO (http://www.dilo-gmbh.de/) specializes in measuring equipment for SF6. The steps which have the highest contribution to the different environmental impacts are shown in the figures 2 and 3.

22nd European Photovoltaic Solar Energy Conference, Fiera Milano, Italy, 3-7 September 2007 Version: 30 August 2007
Analyzing 1 p material 'cell 156x156 mono, textured, w et, ISE'; Method: CML 2 baseline 2000 - GWPs 2007 for 4 Fgases V2.03 / West Europe, 1995 / characterization
cell 156x156 mono, textured, w et, ISE Electricity, medium voltage, production UCTE, at grid/UCTE U Sodium hydroxide, 50% in H2O, production mix, at plant/RER UHydrogen f luoride, at plant/GLO U Isopropanol, at plant/RER U Water, deionised, at plant/CH UHydrochloric acid, 30% in H2O, at plant/RER U Calcium chloride, CaCl2, at regional storage/CH U
abiotic depletion global w arming (GWP100)
ozone layer depletion (ODP
human toxicity fresh w ater aquatic ecotox
marine aquatic ecotoxicity
terrestrial ecotoxicity
photochemical oxidation
acidif ication eutrophication
%
120
115
110
105
100
95
90
85
80
75
70
65
60
55
50
45
40
35
30
25
20
15
10
5
0
Analyzing 1 p material 'cell 156x156 multi, textured, w et, ECN'; Method: CML 2 baseline 2000 - GWPs 2007 for 4 Fgases V2.03 / West Europe, 1995 / characterization
cell 156x156 multi, textured, w et, ECN Electricity, medium voltage, production UCTE, at grid/UCTE U Nitric acid, 50% in H2O, at plant/RER UHydrogen f luoride, at plant/GLO U other compounds - 1 Chemicals organic, at plant/GLO UWater, deionised, at plant/CH U Sodium hydroxide, 50% in H2O, production mix, at plant/RER U Calcium chloride, CaCl2, at regional storage/CH U
abiotic depletion global w arming (GWP100)
ozone layer depletion (ODP
human toxicity fresh w ater aquatic ecotox
marine aquatic ecotoxicity
terrestrial ecotoxicity
photochemical oxidation
acidif ication eutrophication
%
120
115
110
105
100
95
90
85
80
75
70
65
60
55
50
45
40
35
30
25
20
15
10
5
0
Figure 2: Environmental impact assessment of wet alkaline (upper) and acid (bottom) texturing including the treatment of the waste using a modified CML 2 baseline 2000 method
"cell 156x156 ...": environmental effect of emission to air from this process, in the case of alkaline etching the emission of isopropanol which causes photo-oxidant formation (summer smog).
Electricity UCTE: environmental effect of the production of the UCTE electricity mix. For example the global warming effect for the production of 1 kWh UCTE electricity is 484 gram CO2-eq/ kWh produced.
hydrogen fluoride: environmental effect of the production of hydrogen fluoride.

22nd European Photovoltaic Solar Energy Conference, Fiera Milano, Italy, 3-7 September 2007 Version: 30 August 2007
Analyzing 1 p material 'cell 156x156, textured, dry, IMEC'; Method: CML 2 baseline 2000 - GWPs 2007 for 4 Fgases V2.03 / West Europe, 1995 / characterization
cell 156x156, textured, dry, IMEC Electricity, medium voltage, production UCTE, at grid/UCTE U Sulphur hexafluoride, liquid, at plant/RER UChlorine, liquid, production mix, at plant/RER U dinitrogen monoxide Electricity, medium voltage, production UCTE, at grid/UCTE UNatural gas, high pressure, at consumer/RER U Tap w ater, at user/RER U Sodium hydroxide, 50% in H2O, production mix, at plant/RER UCalcium chloride, CaCl2, at regional storage/CH U
abiotic depletion global w arming (GWP100)
ozone layer depletion (ODP
human toxicity fresh w ater aquatic ecotox
marine aquatic ecotoxicity
terrestrial ecotoxicity
photochemical oxidation
acidif ication eutrophication
%
120
115
110
105
100
95
90
85
80
75
70
65
60
55
50
45
40
35
30
25
20
15
10
5
0
Analyzing 1 p material 'cell 156x156, textured, dry, ISE'; Method: CML 2 baseline 2000 - GWPs 2007 for 4 Fgases V2.03 / West Europe, 1995 / characterization
cell 156x156, textured, dry, ISE Electricity, medium voltage, production UCTE, at grid/UCTE U Sulphur hexafluoride, liquid, at plant/RER UOxygen, liquid, at plant/RER U Tap w ater, at user/RER U Sodium hydroxide, 50% in H2O, production mix, at plant/RER UCalcium chloride, CaCl2, at regional storage/CH U
abiotic depletion global w arming (GWP100)
ozone layer depletion (ODP
human toxicity fresh w ater aquatic ecotox
marine aquatic ecotoxicity
terrestrial ecotoxicity
photochemical oxidation
acidif ication eutrophication
%
120
115
110
105
100
95
90
85
80
75
70
65
60
55
50
45
40
35
30
25
20
15
10
5
0
Figure 3: Preliminary environmental impact assessment of dry texturing by IMEC (upper) and ISE (lower) including
abatement using the modified CML 2 baseline 2000 method
"cell....": environmental effect of the emission to air from this process. The SF6 leaving the abatement system as a global warming effect. Also when natural gas is used in the abatement system the emitted CO2 has a global warming effect.
Electricity UCTE: environmental effect of the production of UCTE electricity mix. sulphur hexafluoride: environmental effect of the production of SF6. We used the data from the EcoInvent database.

22nd European Photovoltaic Solar Energy Conference, Fiera Milano, Italy, 3-7 September 2007 Version: 30 August 2007
6 PSG REMOVAL
The aim of this process is the removal of phosphorus silicate glass. This layer is formed during the phosphorus diffusion process for crystalline silicon solar cells. 6.1 Dry PSG removal
Dry PSG removal is under development at Fraunhofer ISE together with Roth&Rau [13]. They use a CF4 / H2 gas mixture. In the new model of Roth&Rau MAiA, a PSG plasma etching unit is placed in front of the SiNA model. It comes in two versions: L for wafer throughput of 1250 wafers/hour and XL turbo for wafer throughput of 3375 wafers/hour. 6.2 Wet PSG removal
In industry the PSG is removed using a wet acid HF solution. 6.3 Environmental impact
A comparison of environmental impacts is made between 1) separate wet PSG removal and silicon nitride PECVD deposition and 2) integrated dry PSG removal plus silicon nitride PECVD deposition.
1) For wet acid PSG removal we used data from table
7.5 from Rensch [11] which includes the use of HF, deionized water, electricity and the treatment of the waste solution by CaCl2.
For silicon nitride PECVD deposition data of the Roth&Rau SiNA L equipment was used.
2) For integrated dry PSG removal plus silicon
nitride PECVD deposition data of the Roth&Rau MAiA L equipment was used. A CF4 utilization of 70% and an abatement efficiency of 99% in the Metron Ecosys Marathon 8500 abatement system were assumed..
The data include the use of CF4, H2, (no O2), SiH4, NH3, utilities and for the abatement NaOH, CaCl2 and tap water. This integrated system leads to less handling within the whole processing and hence to higher yield numbers. Differences in yield have not been included in this study.
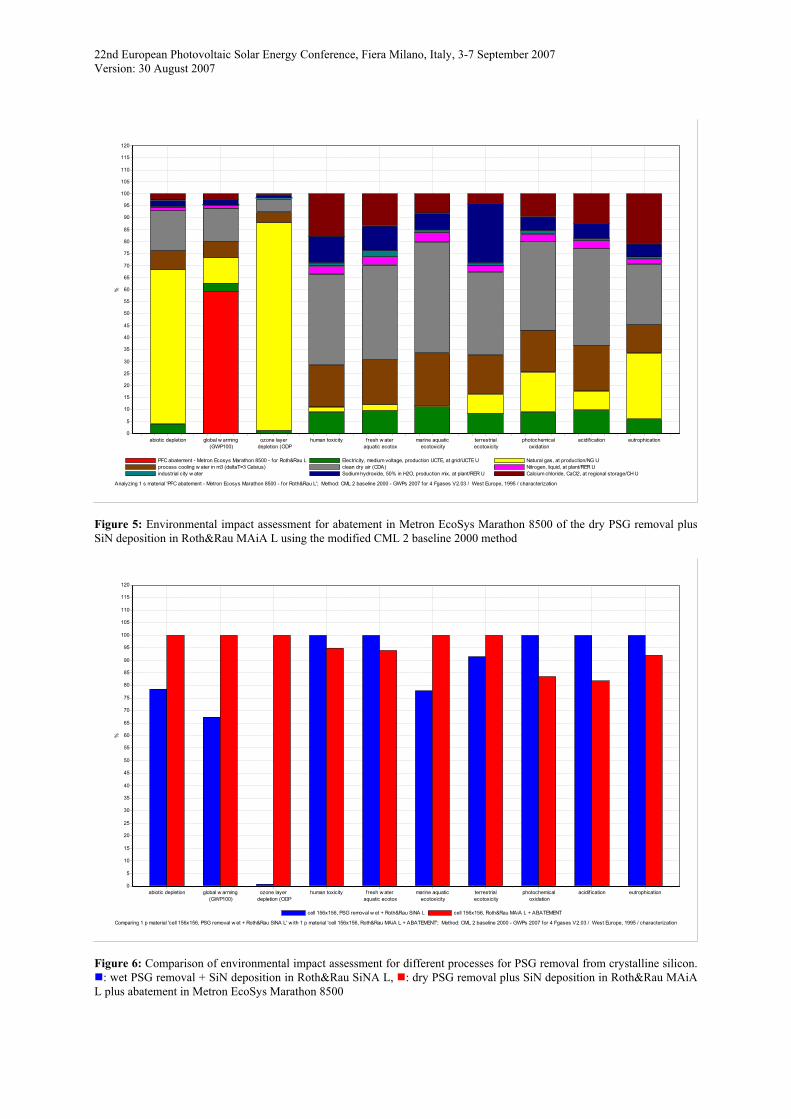
Figure 4 shows that abatement reduces the emissions of greenhouse gases significantly but slightly increases all other environmental impacts. The breakdown of the environmental impact of the abatement process is depicted in figure 5. It can be seen that the direct (electricity, natural gas) and indirect (process cooling water and clean dry air) consumption have the largest contribution.
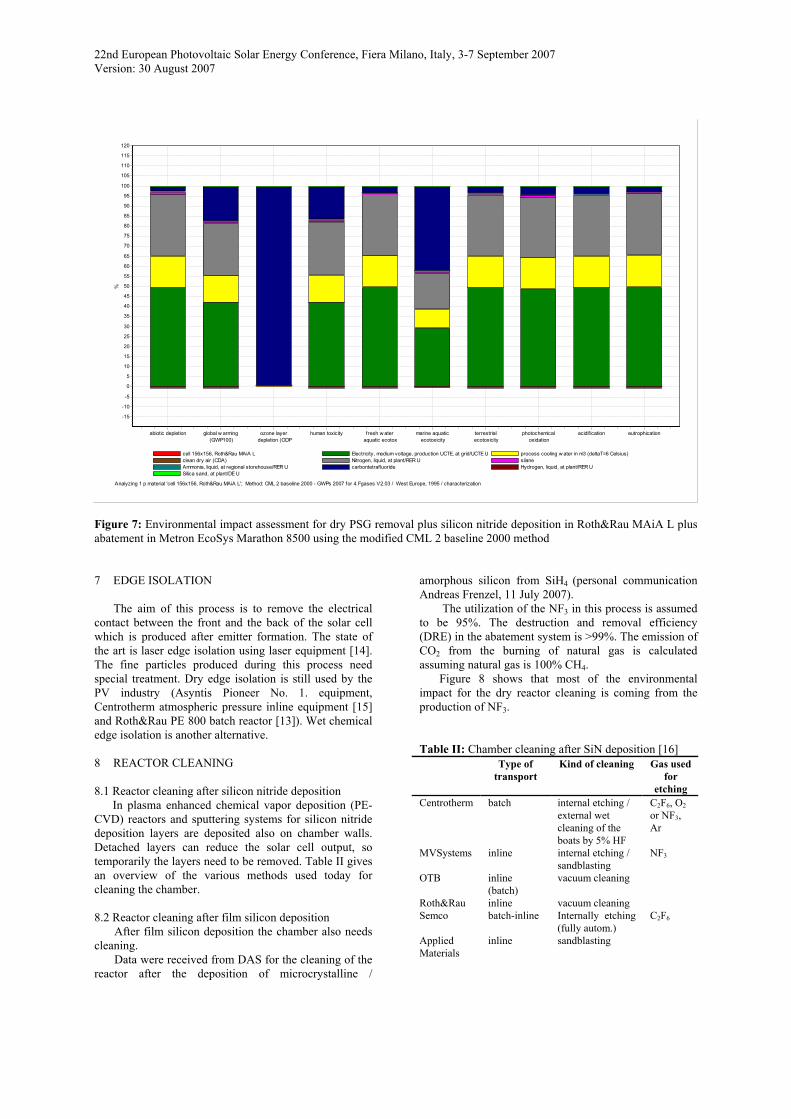
Figure 6 shows a preliminary comparison of the environmental impact of both techniques from PSG removal (wet and dry) up to silicon nitride deposition including abatement. The results are preliminary because the MAiA system has not been tested together with the abatement system so no measurements of energy consumption and emissions are available. Also no data for the energy consumption for the production of CF4 are available. The environmental impact do not differ much, except for the ozone layer depletion which is caused by the production of CF4. Figure 7 indicates that improvement options are the lowering of the electricity consumption and the nitrogen flow.
Comparing 1 p material 'cell 156x156, Roth&Rau MAiA L + NO ABATEMENT' w ith 1 p material 'cell 156x156, Roth&Rau MAiA L + ABATEMENT'; Method: CML 2 baseline 2000 - GWPs 2007 for 4 Fgases V2.03 / West Europe, 1995 / characterization
cell 156x156, Roth&Rau MAiA L + NO ABATEMENT cell 156x156, Roth&Rau MAiA L + ABATEMENT
abiotic depletion global w arming (GWP100)
ozone layer depletion (ODP
human toxicity fresh w ater aquatic ecotox
marine aquatic ecotoxicity
terrestrial ecotoxicity
photochemical oxidation
acidif ication eutrophication
%
120
115
110
105
100
95
90
85
80
75
70
65
60
55
50
45
40
35
30
25
20
15
10
5
0
Figure 4: Comparison of environmental impact assessment dry PSG removal plus SiN deposition in Roth&Rau MAiA L: without and with abatement in Metron EcoSys Marathon 8500 using the modified CML 2 baseline 2000 method
22nd European Photovoltaic Solar Energy Conference, Fiera Milano, Italy, 3-7 September 2007 Version: 30 August 2007
Analyzing 1 s material 'PFC abatement - Metron Ecosys Marathon 8500 - for Roth&Rau L'; Method: CML 2 baseline 2000 - GWPs 2007 for 4 Fgases V2.03 / West Europe, 1995 / characterization
PFC abatement - Metron Ecosys Marathon 8500 - for Roth&Rau L Electricity, medium voltage, production UCTE, at grid/UCTE U Natural gas, at production/NG Uprocess cooling w ater in m3 (deltaT=3 Celsius) clean dry air (CDA) Nitrogen, liquid, at plant/RER Uindustrial city w ater Sodium hydroxide, 50% in H2O, production mix, at plant/RER U Calcium chloride, CaCl2, at regional storage/CH U
abiotic depletion global w arming (GWP100)
ozone layer depletion (ODP
human toxicity fresh w ater aquatic ecotox
marine aquatic ecotoxicity
terrestrial ecotoxicity
photochemical oxidation
acidif ication eutrophication
%
120
115
110
105
100
95
90
85
80
75
70
65
60
55
50
45
40
35
30
25
20
15
10
5
0
Figure 5: Environmental impact assessment for abatement in Metron EcoSys Marathon 8500 of the dry PSG removal plus SiN deposition in Roth&Rau MAiA L using the modified CML 2 baseline 2000 method
Comparing 1 p material 'cell 156x156, PSG removal w et + Roth&Rau SiNA L' w ith 1 p material 'cell 156x156, Roth&Rau MAiA L + ABATEMENT'; Method: CML 2 baseline 2000 - GWPs 2007 for 4 Fgases V2.03 / West Europe, 1995 / characterization
cell 156x156, PSG removal w et + Roth&Rau SiNA L cell 156x156, Roth&Rau MAiA L + ABATEMENT
abiotic depletion global w arming (GWP100)
ozone layer depletion (ODP
human toxicity fresh w ater aquatic ecotox
marine aquatic ecotoxicity
terrestrial ecotoxicity
photochemical oxidation
acidif ication eutrophication
%
120
115
110
105
100
95
90
85
80
75
70
65
60
55
50
45
40
35
30
25
20
15
10
5
0
Figure 6: Comparison of environmental impact assessment for different processes for PSG removal from crystalline silicon.
: wet PSG removal + SiN deposition in Roth&Rau SiNA L, : dry PSG removal plus SiN deposition in Roth&Rau MAiA L plus abatement in Metron EcoSys Marathon 8500
22nd European Photovoltaic Solar Energy Conference, Fiera Milano, Italy, 3-7 September 2007 Version: 30 August 2007
Analyzing 1 p material 'cell 156x156, Roth&Rau MAiA L'; Method: CML 2 baseline 2000 - GWPs 2007 for 4 Fgases V2.03 / West Europe, 1995 / characterization
cell 156x156, Roth&Rau MAiA L Electricity, medium voltage, production UCTE, at grid/UCTE U process cooling w ater in m3 (deltaT=6 Celsius)clean dry air (CDA) Nitrogen, liquid, at plant/RER U silaneAmmonia, liquid, at regional storehouse/RER U carbontetraf luoride Hydrogen, liquid, at plant/RER USilica sand, at plant/DE U
abiotic depletion global w arming (GWP100)
ozone layer depletion (ODP
human toxicity fresh w ater aquatic ecotox
marine aquatic ecotoxicity
terrestrial ecotoxicity
photochemical oxidation
acidif ication eutrophication
%
120
115
110
105
100
95
90
85
80
75
70
65
60
55
50
45
40
35
30
25
20
15
10
5
0
-5
-10
-15
Figure 7: Environmental impact assessment for dry PSG removal plus silicon nitride deposition in Roth&Rau MAiA L plus abatement in Metron EcoSys Marathon 8500 using the modified CML 2 baseline 2000 method
7 EDGE ISOLATION
The aim of this process is to remove the electrical contact between the front and the back of the solar cell which is produced after emitter formation. The state of the art is laser edge isolation using laser equipment [14]. The fine particles produced during this process need special treatment. Dry edge isolation is still used by the PV industry (Asyntis Pioneer No. 1. equipment, Centrotherm atmospheric pressure inline equipment [15] and Roth&Rau PE 800 batch reactor [13]). Wet chemical edge isolation is another alternative. 8 REACTOR CLEANING 8.1 Reactor cleaning after silicon nitride deposition
In plasma enhanced chemical vapor deposition (PE-CVD) reactors and sputtering systems for silicon nitride deposition layers are deposited also on chamber walls. Detached layers can reduce the solar cell output, so temporarily the layers need to be removed. Table II gives an overview of the various methods used today for cleaning the chamber. 8.2 Reactor cleaning after film silicon deposition
After film silicon deposition the chamber also needs cleaning.
Data were received from DAS for the cleaning of the reactor after the deposition of microcrystalline /
amorphous silicon from SiH4 (personal communication Andreas Frenzel, 11 July 2007).
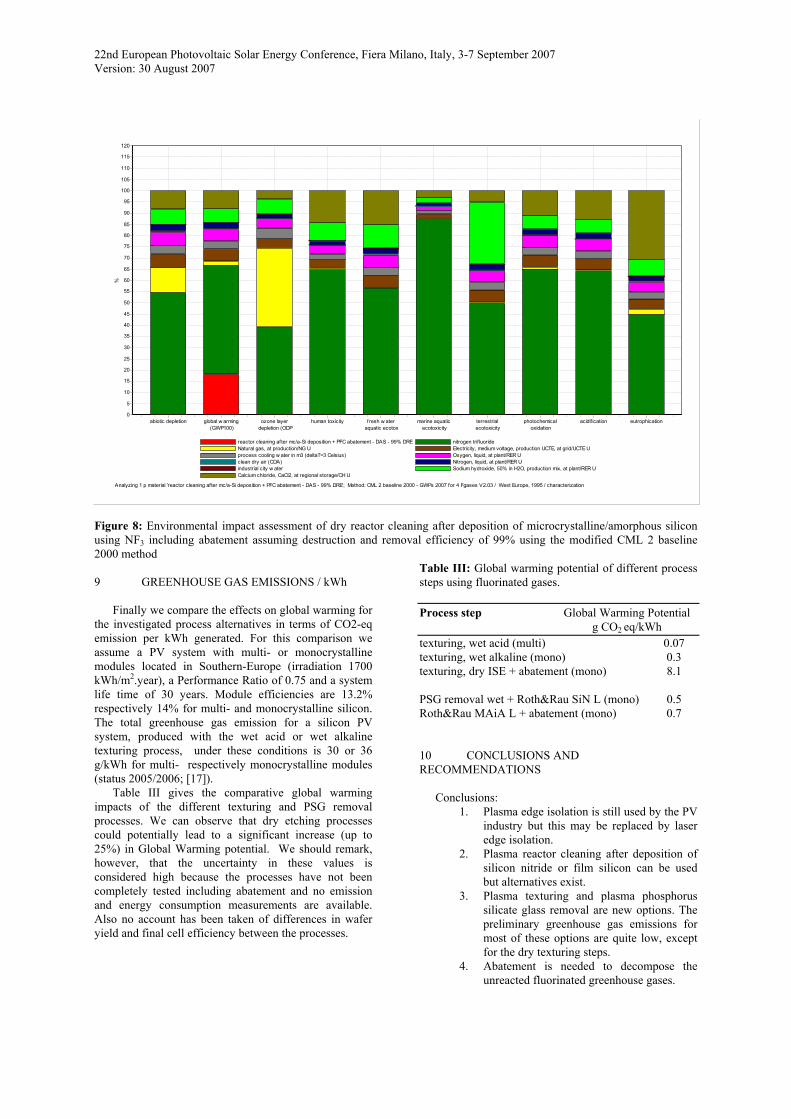
The utilization of the NF3 in this process is assumed to be 95%. The destruction and removal efficiency (DRE) in the abatement system is >99%. The emission of CO2 from the burning of natural gas is calculated assuming natural gas is 100% CH4.
Figure 8 shows that most of the environmental impact for the dry reactor cleaning is coming from the production of NF3.
Table II: Chamber cleaning after SiN deposition [16]
Type of transport
Kind of cleaning Gas used for
etching Centrotherm batch internal etching /
external wet cleaning of the boats by 5% HF
C2F6, O2 or NF3, Ar
MVSystems inline internal etching / sandblasting
NF3
OTB inline (batch)
vacuum cleaning
Roth&Rau inline vacuum cleaning Semco batch-inline Internally etching
(fully autom.) C2F6
Applied Materials
inline sandblasting
22nd European Photovoltaic Solar Energy Conference, Fiera Milano, Italy, 3-7 September 2007 Version: 30 August 2007
Analyzing 1 p material 'reactor cleaning after mc/a-Si deposition + PFC abatement - DAS - 99% DRE'; Method: CML 2 baseline 2000 - GWPs 2007 for 4 Fgases V2.03 / West Europe, 1995 / characterization
reactor cleaning after mc/a-Si deposition + PFC abatement - DAS - 99% DRE nitrogen trif luorideNatural gas, at production/NG U Electricity, medium voltage, production UCTE, at grid/UCTE Uprocess cooling w ater in m3 (deltaT=3 Celsius) Oxygen, liquid, at plant/RER Uclean dry air (CDA) Nitrogen, liquid, at plant/RER Uindustrial city w ater Sodium hydroxide, 50% in H2O, production mix, at plant/RER UCalcium chloride, CaCl2, at regional storage/CH U
abiotic depletion global w arming (GWP100)
ozone layer depletion (ODP
human toxicity fresh w ater aquatic ecotox
marine aquatic ecotoxicity
terrestrial ecotoxicity
photochemical oxidation
acidif ication eutrophication
%
120
115
110
105
100
95
90
85
80
75
70
65
60
55
50
45
40
35
30
25
20
15
10
5
0
Figure 8: Environmental impact assessment of dry reactor cleaning after deposition of microcrystalline/amorphous silicon using NF3 including abatement assuming destruction and removal efficiency of 99% using the modified CML 2 baseline 2000 method 9 GREENHOUSE GAS EMISSIONS / kWh
Finally we compare the effects on global warming for the investigated process alternatives in terms of CO2-eq emission per kWh generated. For this comparison we assume a PV system with multi- or monocrystalline modules located in Southern-Europe (irradiation 1700 kWh/m2.year), a Performance Ratio of 0.75 and a system life time of 30 years. Module efficiencies are 13.2% respectively 14% for multi- and monocrystalline silicon. The total greenhouse gas emission for a silicon PV system, produced with the wet acid or wet alkaline texturing process, under these conditions is 30 or 36 g/kWh for multi- respectively monocrystalline modules (status 2005/2006; [17]).
Table III gives the comparative global warming impacts of the different texturing and PSG removal processes. We can observe that dry etching processes could potentially lead to a significant increase (up to 25%) in Global Warming potential. We should remark, however, that the uncertainty in these values is considered high because the processes have not been completely tested including abatement and no emission and energy consumption measurements are available. Also no account has been taken of differences in wafer yield and final cell efficiency between the processes.
Table III: Global warming potential of different process steps using fluorinated gases. Process step Global Warming Potential g CO2 eq/kWh texturing, wet acid (multi) 0.07 texturing, wet alkaline (mono) 0.3 texturing, dry ISE + abatement (mono) 8.1 PSG removal wet + Roth&Rau SiN L (mono) 0.5 Roth&Rau MAiA L + abatement (mono) 0.7 10 CONCLUSIONS AND RECOMMENDATIONS
Conclusions: 1. Plasma edge isolation is still used by the PV
industry but this may be replaced by laser edge isolation.
2. Plasma reactor cleaning after deposition of silicon nitride or film silicon can be used but alternatives exist.
3. Plasma texturing and plasma phosphorus silicate glass removal are new options. The preliminary greenhouse gas emissions for most of these options are quite low, except for the dry texturing steps.
4. Abatement is needed to decompose the unreacted fluorinated greenhouse gases.
22nd European Photovoltaic Solar Energy Conference, Fiera Milano, Italy, 3-7 September 2007 Version: 30 August 2007
Recommendations/Outlook: 1. Include F-gases in factory emission
measurements. 2. Take a proactive approach in compiling
consumption and emission data for F-gases by the PV industry, following IPCC guidelines.
3. Perform emission and energy consumption measurements for the new processes.
4. Include wafer yield and cell efficiency differences in comparative LCA.
5. Investigate the applicability of F2 in cylinders and on-site recycling of SF6.
6. Perform LCA of dry reactor cleaning. 7. Perform LCA of texturing of silicon
ribbons. 8. Perform LCA of saw damage removal 9. Obtain data for energy consumption to
produce CF4.
11 ACKNOWLEDGEMENTS
This research was conducted within the Integrated Project CrystalClear and funded by the European Commission under contract nr. SES6-CT_2003-502583.
We are grateful to M+W Zander for providing facility performance data and discussion in the course of their national funded CO2 reduction project 01LS05090.
12 REFERENCES
[1] SenterNovem, ROB International Survey, country profiles (draft version February 21st, 2007), SenterNovem PN1607 the Netherlands, (2007), http://www.senternovem.nl/mmfiles/Final%20Draft%20Country-profiles%20(ERM%20210207)_tcm24-216730.pdf. [2] P.Forster, V.Ramaswamy, Chapter 2: Changes in atmospheric constituents and in radiative forcing, In: Climate Change 2007. The Physical Science Basis, S.Solomon, D.Qin et al. (eds.) (2007) http://ipcc-wg1.ucar.edu/wg1/Report/AR4WG1_Pub_Ch02.pdf. [3] European Union, Regulation (EC) No 842/2006 of the European Parliament and of the Council of 17 May 2006 on certain fluorinated greenhouse gases, (2006), http://eur-lex.europa.eu/LexUriServ/site/en/oj/2006/l_161/l_16120060614en00010011.pdf. [4] Semiconductor Industry Association, World Semiconductor Council- ESH Task Force, (2006), http://www.sia-online.org/downloads/Issue_WSC_ESH.pdf. [5] Intergovernmental Panel on Climate Change (IPCC), Chapter 6: Electronics industry emissions, In: 2006 IPCC Guidelines for National Greenhouse Gas Inventories, Volume 3 Industrial processes and product use, (2006) . [6] S.Laurie, Reduction of perfluorocompound (PFC) emissions: 2005 state-of-the-technology
report, Technology Transfer #05104693A-ENG International SEMATECH Manufacturing Initiative, (2005). [7] H.Paucksch, J.Massonne, A method of producing trifluoromethane, (assignees: Kali-Chemie, Hannover, Germany), GB1172215 (1969). [8] H.Ohno, T.Nakajo, T.Arai, T.Ohi, Process for producing tetrafluoromethane, (assignees: Showa Denko, Tokyo, Japan), GB2310853 (1997). [9] H.F.W.Dekkers, F.Duerinckx, L.Carnel, G.Agostinelli, G.Beaucarne, Plasma texturing processes for the next generations of crystalline Si solar cells, 21st European Photovoltaic Solar Energy Conference, Dresden, Germany (2006) 754. [10] J.Rentsch, N.Kohn, F.Bamberg, K.Roth, S.Peters, R.Lüdemann, R.Preu, Isotropic plasma texturing of mc-Si for industrial solar cell fabrication, 31th IEEE Photovoltaic Specialists Conference, Orlando, Florida (2005) http://www.ise.fraunhofer.de/english/current_topics/events/events2005/pdf/Textur_mcSi_Rentsch.pdf. [11] J.Rentsch, Trockentechnologien zur Herstellung von kristallinen Siliziumsolarzellen, -243 p. (2005). Albert-Ludwigs Universität Freiburg im Breisgau, Germany. http://www.freidok.uni-freiburg.de/volltexte/1917/. [12] M.Thiemann, E.Scheibler, K.W.Wiegand, Nitric acid, nitrous acid, and nitrogen oxides, In: Ullmann's Encyclopedia of Industrial Chemistry(2005) http://www.mrw.interscience.wiley.com/emrw/9783527306732/ueic/article/a17_293/current/pdf. [13] J.Rentsch, C.Schetter, H.Schlemm, K.Roth, R.Preu, Industrialization of dry phosphorus silicate glass etching and edge isolation for crystalline silicon solar cells, 20th European Photovoltaic Solar Energy Conference, Barcelona, Spain (2005) . [14] E.Schneiderlöchner, D.H.Neuhaus, F.Schitthelm, D.Hubatsch, R.Lüdemann, Review on different technologies for industrial solar cell edge isolation, 21st European Photovoltaic Solar Energy Conference, Dresden, Germany (2006) 923. [15] M.Heintze, A.Hauser, R.Möller, H.Wanke, E.Lòpez, I.Dani, V.Hopfe, J.W.Müller, A.Huwe, In-line plasma etching at atmospheric pressue for edge isolation in crystalline Si solar cells, IEEE 4th World Conference on Photovoltaic Energy Conversion, Waikoloa, Hawaii (2006) . [16] M.Schmela, Market survey on SiNx deposition systems, Photon International March (2007) 126. [17] M.J.de Wild-Scholten, E.A.Alsema, Environmental Life Cycle Inventory of Crystalline Silicon Photovoltaic System Production - Status 2005/2006 (Excel file), ECN-E--07-026 Energy research Centre of the Netherlands, Petten, the Netherlands, (2007), http://www.ecn.nl/publicaties/default.aspx?nr=ECN-E--07-026.

22nd European Photovoltaic Solar Energy Conference, Fiera Milano, Italy, 3-7 September 2007 Version: 30 August 2007