Embed Size (px)
Citation preview

3 r d Q u a r t e r 2 0 1 0 R e p o r t
The general economy is seeing mixed signs. GDP has been positive for
four quarters, consumer confidence is up, inflation remains under
control, and businesses have begun spending. However, consumer
spending has decreased from previous quarters, the recovery has been
jobless so far, credit remains tight, and the housing market remains a risk.
The general economy is seeing mixed signs.
GDP has been positive for four quarters,
consumer confidence is up, inflation remains
under control, and businesses have begun
spending. However, consumer spending has
decreased from previous quarters, the recov-
ery has been jobless so far, credit remains
tight, and the housing market remains a risk.
The outlook for put in place construction
for the remainder of 2010 also is bleak.
Total construction in 2010 will be down 7%
after declining 15% in 2009. Residential
construction is expected to begin recovering
in 2010. Nonresidential construction will
decline 18% in 2010 after declining 13% in
2009. An 18% increase in conservation and
development construction will offset losses
in nonbuilding construction.
The American Institute of Architects’ (AIA)
Architectural Billings Index hit its lowest
level since 1995 in the 4Q08 at 34.7. It
stood at 48.2 in August 2010. FMI’s
Non-Residential Construction Index
(NRCI) hit 34.1 in 4Q08, down from 52.6
(for the same time in 2007), and is at 51.3
in the 3Q10. Contractors are reporting
backlogs of 9 months in 3Q10 (up from 8
months in 2Q10), according to FMI’s NRCI.
The overall rates for project delays and
cancellations improved slightly, yet remain
at 3 times the normal rate and are currently
at 15% (the same rate as 3Q08). Project
cancellations are nearly 3 times the normal
rate and are currently at 8% of backlog
(less than doubled from 3Q08). While
credit is expected to loosen slightly
throughout 2010, delays and cancellations
are likely to remain high.
The construction industry should prepare for
another year of decline in nonresidential
construction. Construction gained 19,000
jobs in August (of which 10,000 were due
to the return of workers on strike in July).
There have been losses in 34 out of 37 con-
secutive months, bringing the construction
unemployment rate to 15.9%. That means
there are 1.5 million construction workers
out of work. An increase in residential
construction in 2010 could begin to turn
the employment situation, but it is unlikely
that it would do much to offset the losses
from nonresidential construction.
FMI’sC o n s t r u c t i o n O u t l o o k
700,000
600,000
500,000
400,000
300,000
200,000
100,000
0
1964
1966
1968
1970
1972
1974
1976
1978
1980
1982
1984
1986
1988
1990
1992
1994
1996
1998
2000
2002
2004
2006
2008
2010
2012
2014
Mill
ions
of
Cur
rent
Dol
lars
Put in Place Construction
Recession Residential Nonresidential Buildings Nonbuilding Structures

The residential sector is expected to begin to
recover in 2010. However, the expiration of the
federal home buyer tax credit poses risk to the
recovery of the sector. Single-family put in place
construction will recover at a slower rate than
single-family housing starts. The quality mix of
new single-family homes is shifting. It takes five
$150,000 housing starts to equal one $750,000
start. Therefore, starts will recover at a faster rate.
Multi family construction has been impacted
severely by tight credit and will not recover
until credit loosens. Residential improvements
construction is expected to increase slightly in
2010 as consumers make improvements rather
than moving up, and the age of the housing
stock requires improvements.
The nonresidential sector will see a double-digit
decline in 2010. Transportation construction
will be the only segment likely to see actual
growth. Public safety will remain flat to slightly
down. The highly cyclical lodging, office and
commercial segments will experience severe
declines in 2010. Manufacturing construction,
which has remained strong mostly due to refinery
work, will turn down when many of these mega
projects are completed.
The nonbuilding sector will remain positive
again in 2010. The largest contributors to this
growth are sewage and waste disposal, and
conservation and development construction.
Cleanup from the Gulf oil spill will add almost
$500 million to the conservation and develop-
ment segment. Highway and street construction
is expected to remain flat as the remaining
stimulus funds are used and the highway bill is
extended rather than reauthorized. Water and
wastewater construction is expected to remain
flat as well.
The general economy is a main driver for both
residential and nonresidential construction. Real
GDP increased at an annual rate of 1.6% in the
second quarter of 2010, according to the "second"
estimate. Real GDP increased 3.7% in the first
quarter of 2010. Consensus Forecasts predicts
that GDP will increase 3.3% in 2010. We believe
that this estimate is reasonable, but that it is
extremely sensitive to the drivers discussed below.
2Construction Outlook
U.S. Employment U.S. Unemployment Rate
1971 1973 1975 1977 1979 1981 1983 1985 1987 1989 1991 1993 1995 1997 1999 2001 2003 2005 2007 2009
10%
9%
8%
7%
6%
5%
4%
3%
Jobs and Unemployment 1971–2010
150
140
130
120
110
100
90
80
70
60
6%
4%
2%
0%
-2%
-4%
-6%
-8%Q1-05 Q3-05 Q1-06 Q3-06 Q1-07 Q3-07 Q1-08 Q3-08 Q1-09 Q3-09 Q1-10
Per
cent
Inc
reas
e
% Increase in Real GDP 2005–2010

The employment situation decreased slightly. The unemploy-
ment rate ticked upward to 9.6% in August after spending two
consecutive months at 9.5%. The loss of 114,000 temporary
census jobs offset gains of 67,000 employed workers in private-
sector employment. Since the recession began in December
2007, payroll employment has fallen by more than 8 million.
The Advance Monthly Retail Sales Report for July estimates
that retail and food service sales were $362.7 billion. This is an
increase of 0.4% from the previous month and 5.5% above
July 2009. Total sales for May 2010 through July 2010 were
up 5.9% from the same period a year ago, and the May 2010
to June 2010 percent change was revised from -0.5% to -0.3%.
Retail trade sales were up 0.4% from June 2010 and were up
5.9% from last year. Gasoline station sales were up 12.2%
from July 2009, and nonstore retailers sales were up 12.6%
from last year.
Total retail and food service sales, excluding motor vehicles
and parts dealers (ex auto), were up 0.2% in July over last
month and up 4.9% from a year ago.
The Conference Board's Consumer Confidence Index improved
moderately in August. The Index is now 53.5, up from 51.0
in July. The Expectations Index increased to 72.5 from 67.5.
The Present Situation Index decreased to 24.9 from 26.4.
"Consumer confidence posted a modest gain in August, the
result of an improvement in consumers’ short-term outlook,"
says Lynn Franco, director of The Conference Board Consumer
Research Center. "Consumers’ assessment of current conditions,
however, was less favorable as employment concerns continue
3Third Quarter 2010
Total Retail and Food Service Sales
92 94 96 98 00 02 04 06 08 10
$450,000
$400,000
$350,000
$300,000
$250,000
$200,000
$150,000
$100,000
$50,000
$0
to weigh heavily on consumers’ attitudes. Expectations about
future business and labor market conditions have brightened
somewhat, but overall, consumers remain apprehensive about
the future. All in all, consumers are about as confident today
as they were a year ago."
The economy may show some signs of improving, but it is still
a downturn for nonresidential construction. Nonresidential
construction typically lags behind the general economy by
approximately 18 months. Intense competition that has been
bringing down prices has been reported. This is good for owners,
but not so good for contractors. Nonbuilding construction will
remain positive for the forecast period with conservation and
development leading the sector.
2002 2003 2004 2005 2006 2007 2008 2009 2010
Consumer Confidence Index
120
100
80
60
40
20
0

4Construction Outlook
The residential construction market has been
decimated. For housing starts, 2009 was the
worst year since we began keeping records in
1959. Total residential construction will be
$268.7 billion in 2010, down from its 2006
high of $619.8 billion. At its peak, residential
construction accounted for 53% of total con-
struction. It will account for 31% in 2010.
Single-family construction has plummeted from
a 2005 high of $434.9 billion to $123.4 billion in
2010. Multi family construction and improve-
ments have seen declines as well, however not
of this magnitude. Multi family construction
peaked in 2006 at $54.3 billion; it will be
$20.9 billion in 2010. Improvements are down
to $124.2 billion from $147.9 billion in 2006.
R e s i d e n t i a l
Single-family Multi family
2000 2001 2002 2003 2004 2005 2006 2007 2008 2009 2010 2011 2012 2013 2014
500,000
450,000
400,000
350,000
300,000
250,000
200,000
150,000
100,000
50,000
0
Mill
ions
of
Cur
rent
Dol
lars
Value of Residential Construction
60,000
50,000
40,000
30,000
20,000
10,000
0
160,000
140,000
120,000
100,000
80,000
60,000
40,000
20,000
02000 2001 2002 2003 2004 2005 2006 2007 2008 2009 2010 2011 2012 2013 2014
Mill
ions
of
Cur
rent
Dol
lars
Value of Residential Improvements

5Third Quarter 2010
Trends:Total Occupied Units
Approximately 85.6% of the housing units
in the United States in 2Q 2010 were
occupied, and 14.4% were vacant. The
owner-occupied housing units were 57.3%
of total housing units, and renter-occupied
units made up 28.3% of total housing
units in 2Q 2010. Vacant housing units
comprised 14.4% of total housing units.
Housing AffordabilityHome ownership is currently much more
affordable to households earning the
median income. The March index was 161.8.
The median priced, existing single-family
home, mortgage rate and qualifying
income are at lows since the housing boom.
Share of Adjustable Rate Loans At the peak in April 2005, adjustable
loans accounted for 35% of all mortgage
applications. That share fell to about 2%
by the end of 2008, but has been edging
back up since. At the beginning of
September 2010, adjustable loans
accounted for 6.1% of all applications.
Household FormationHousehold formation has slowed to a growth
rate of 0.34% in 2009, down from 0.67% in
2008 and down from 2001’s high of 3.35%.
Some 398,000 households were formed in
2009, down from 772,000 in 2008 and
2001’s high of 3.5 million.
Homeownership Rate The homeownership rate is down from the
previous quarter and the same time a year
ago at 66.9%. The rate peaked at 69.2% in
4Q 2004. The current rate is in line with
early 2000.
Supply of Unsold HomesInventory of new homes for sale has been
trending up since January 2010 and
stands at a 9.1 months’ supply for July.
The volume of new homes for sale
(currently SA 276,000 homes) is down
59% from its peak in July 2006.
Vacant Homes for SaleVacant homes for sale in the 2nd quarter
were 1.9 million. This is slightly above the
lowest level in the 3rd quarter of 2006.
However, nearly 350,000 of this number
are considered an excess that needs to be
worked through before the housing market
can recover. Further, there is an additional
block of homes (unknown quantity) that
is owned by banks, but is being held off
the market at this time. In addition, there
is a large inventory of 2007 adjustable-rate
mortgages that will reset over the next two
quarters. If interest rates are to rise, it will
result in a new round of foreclosures.
Construction MixQuality mix is shifting strongly toward
smaller, more affordable homes with
reduced amenities.
Drivers:— Unemployment Rate
— Core CPI
— Income
— Mortgage Rate
Home Prices
Housing Starts
Housing Permits
ÔÔ
Ô
2,500
2,000
1,500
1,000
500
0
1959
1961
1963
1965
1967
1969
1971
1973
1975
1977
1979
1981
1983
1985
1987
1989
1991
1993
1995
1997
1999
2001
2003
2005
2007
2009
2010
Housing Starts
Trends:Securing financing remains the primary obstacle to new hotel construction
Minimal projects are progressing through the construction pipeline; many are postponed until
conditions improve.
All key-sector metrics forecast to continue sliding in 2010.
The green movement is losing traction due to greater initial cost perceptions.
Business and leisure travel are both down Technology is reducing need for
business travel.
Hotel performance is linked to local
economies.
Travelers are demanding rate concessions.
Hotels coming online in 2010 heavily concentrated on upscale as well as midscale without F&B chain segments
Midscale and upscale segments will be
the first to be renovated.
Lobby transformation is becoming a
differentiator and epicenter of hotels.
6Construction Outlook
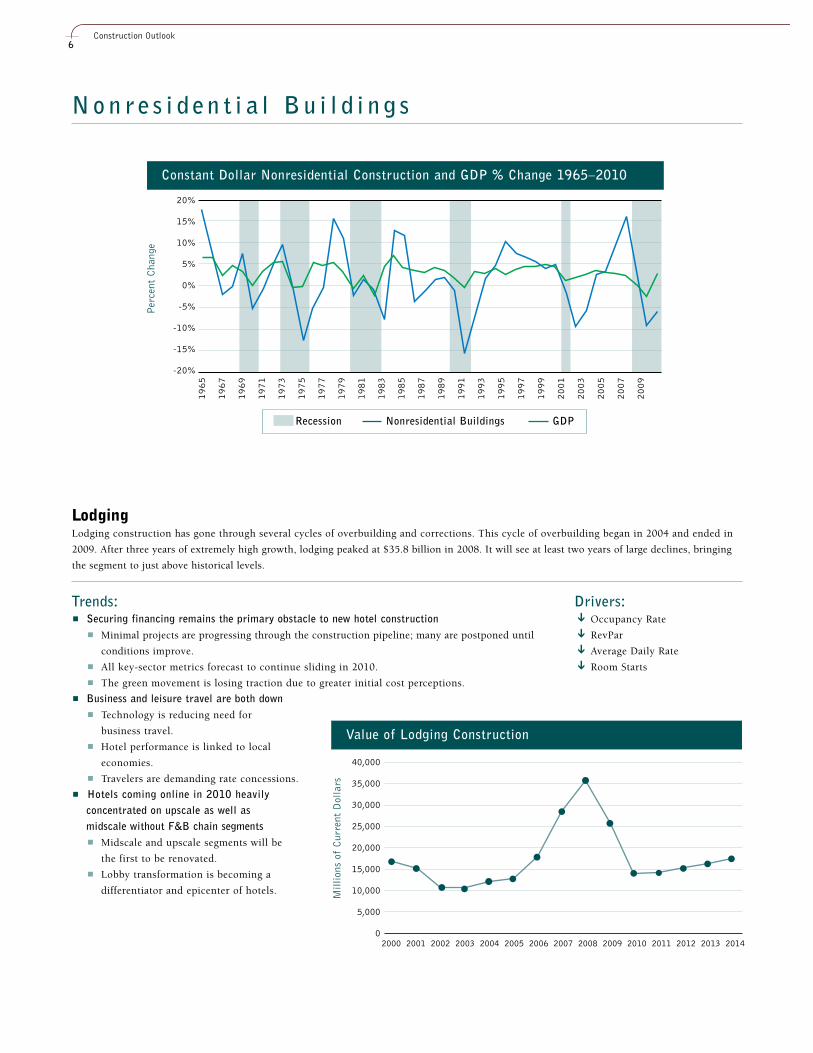
N o n r e s i d e n t i a l B u i l d i n g s
Recession Nonresidential Buildings GDP
20%
15%
10%
5%
0%
-5%
-10%
-15%
-20%
1965
1967
1969
1971
1973
1975
1977
1979
1981
1983
1985
1987
1989
1991
1993
1995
1997
1999
2001
2003
2005
2007
2009
Per
cent
Cha
nge
Constant Dollar Nonresidential Construction and GDP % Change 1965–2010
Drivers:Occupancy Rate
RevPar
Average Daily Rate
Room Starts
ÔÔ
ÔÔ
40,000
35,000
30,000
25,000
20,000
15,000
10,000
5,000
02000 2001 2002 2003 2004 2005 2006 2007 2008 2009 2010 2011 2012 2013 2014
Mill
ions
of
Cur
rent
Dol
lars
Value of Lodging Construction
LodgingLodging construction has gone through several cycles of overbuilding and corrections. This cycle of overbuilding began in 2004 and ended in
2009. After three years of extremely high growth, lodging peaked at $35.8 billion in 2008. It will see at least two years of large declines, bringing
the segment to just above historical levels.

7Third Quarter 2010
Trends:The rise in vacancy rates has led to a reduction in rents and increases in incentives and concessionsoffered by landlords
New space entering supply only compounds vacancy rate issues.
Many tenants are “trading up” by relocating or upgrading to higher-quality space.
National employment a key factor in demand for office building constructionUnemployment rate is expected to remain
near 10% in 2010.
The current recession has eliminated a net of
9.0 million jobs since it began in December
2007. 15.0 million Americans remain unem-
ployed.
New construction at a standstillSecured projects continue to enter inventory.
Many projects will be put on hold or
abandoned until economy and employment
situations improve.
OfficeOffice construction is highly dependent on employment. It will take several years until there is enough employment growth to
spur new construction. Office construction will fall from its 2008 high of $70.3 billion down to $35.4 billion at its low in 2011.
CommercialCommercial construction relies heavily on consumer spending and new housing construction. It will not return to high levels until the employment
situation improves. Commercial construction will follow a turnaround in the housing market by 12 to 18 months and is not expected to pick up
until 2012.
Trends:Increase in residential building activity
Commercial construction lags residential by 12 to 18 months.
Open-air centers replacing traditional, enclosed mallsOccupancy costs are lower.
Store chains are lost.
Renovation of vacant big-box storesStores are repositioned for health care and educational purposes.
Major expansion plans for discount and foodretailers.
Expansion meets the demand of
price-conscious shoppers.
Increasing online retail sales National retail square footage could
decrease by as much as 15% in 2010.
Drivers:Office Vacancy Rate
— Unemployment Rate
— Employment
Ô
Drivers:Retail Sales
— CPI
— Unemployment
— Employment
Income
Housing Starts
Ô
ÔÔ
80,000
70,000
60,000
50,000
40,000
30,000
20,000
10,000
02000 2001 2002 2003 2004 2005 2006 2007 2008 2009 2010 2011 2012 2013 2014
Mill
ions
of
Cur
rent
Dol
lars
Value of Office Construction
100,000
90,000
80,000
70,000
60,000
50,000
40,000
30,000
20,000
10,000
02000 2001 2002 2003 2004 2005 2006 2007 2008 2009 2010 2011 2012 2013 2014
Mill
ions
of
Cur
rent
Dol
lars
Value of Commercial Construction

8Construction Outlook
Drivers:Population
Population Change Age 75+
— Government Spending
Uninsured Population
Nonresidential Structure Investment
ÔÔ
ÔÔ
Trends:Aging population requires medical care
Elderly population (i.e., older than 65 years of age) is expected to double by 2040.
Retirement of baby boomersLife expectancy in the U.S. has climbed from 75 to 78 over the last 20 years.
People are migrating to suburban areas, particularly warmer climates.
Increased consumerism for health careA growing number of consumers are
seeking primary care at retail store clinics
(e.g., Walmart, Walgreens).
Multi-specialty ambulatory care centers are
more profitable.
Inadequate, aging facilitiesARRA provides more than $1 billion for
the Veterans Health Administration’s
Non-Recurring Maintenance (NRM)
projects and energy initiatives.
New building technologies and facility upgrades
increase.
Seismic retrofits in California grow.
Single-bed hospital rooms requirement
Health CareHealth care construction will decline in 2010. However, it will remain at a historically high level. Hospital construction will allow the segment to
maintain its volume. Special care construction will help to drive future growth.
Drivers:Population Change Below 18
Population Change Ages 18-24
Stock Market
— Government Spending
Nonresidential Structure Investment
Ô
ÔÔ
ÔEducationalEducational construction is expected to decline in 2010. State revenues are down, which affects K-12 construction, but the stock
market is recovering, which impacts endowments and spending at universities. It is expected that privately owned construction will
wait until 2011 before expanding.
Trends:Government investment in public education
21st Century Green High-Performing Public School Facilities Act (H.R. 2187) would
authorize $6.4 billion for school renovation and modernization projects in fiscal year 2010.
Additional renovation funding could come from nearly $40 billion in the ARRA for the State
Fiscal Stabilization Fund.
State bonds have passed (e.g., California, Texas).
Aging school facilitiesThousands of schools built more than 50 years
ago are in need of modernization or replacement.
Security enhancements are needed to meet
school concerns.
Increasing student enrollmentsU.S. Department of Education predicts that
enrollment in elementary and secondary
schools will grow by 7% to reach nearly 60
million by 2016.
Growth is slower for grades nine through 12.
Growing market for green constructionEducation is one of the top-three vertical markets
for green construction, in terms of volume.
University capital spending put on hold
70,000
60,000
50,000
40,000
30,000
20,000
10,000
02000 2001 2002 2003 2004 2005 2006 2007 2008 2009 2010 2011 2012 2013 2014
Mill
ions
of
Cur
rent
Dol
lars
Value of Health Care Construction
140,000
120,000
100,000
80,000
60,000
40,000
20,000
02000 2001 2002 2003 2004 2005 2006 2007 2008 2009 2010 2011 2012 2013 2014
Mill
ions
of
Cur
rent
Dol
lars
Value of Education Construction
9Third Quarter 2010
Churches are buildings that religious communities aresaving for and investing in for the long haul
Energy efficiency, green sustainability and long-lasting
quality are becoming top features many congregations
want in worship houses.
Drivers:GDP
Population
Income
Personal Savings ÔÔ
ÔÔ
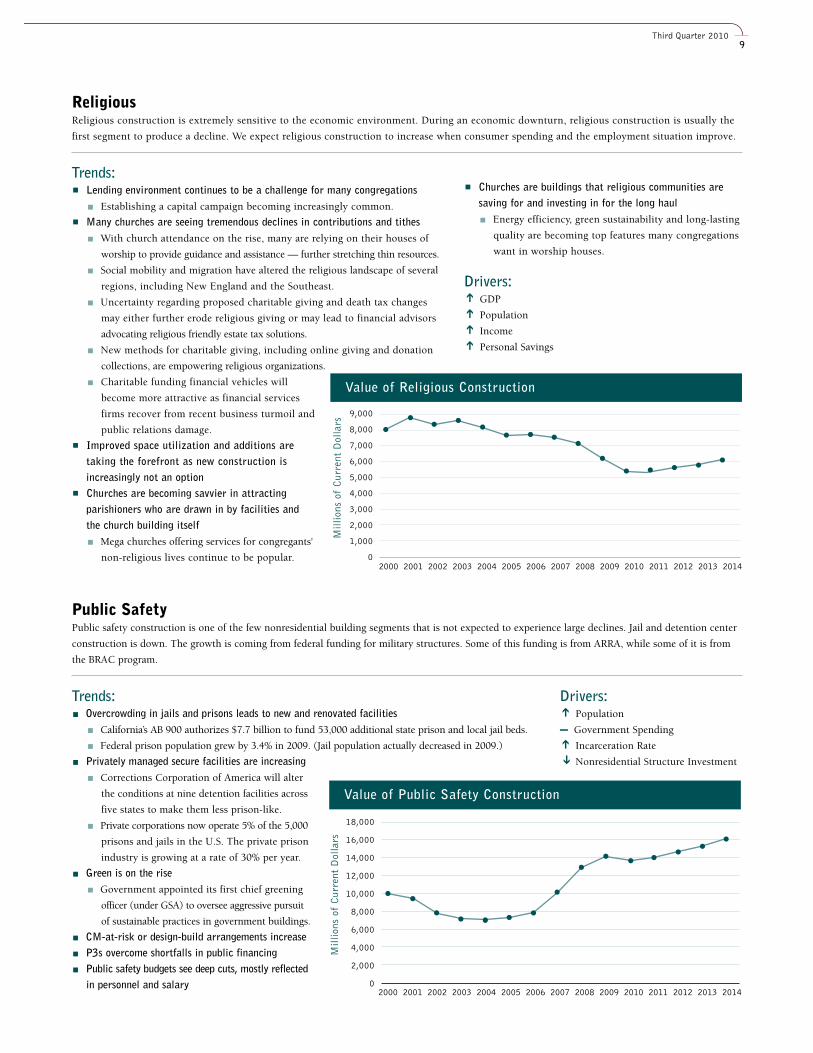
ReligiousReligious construction is extremely sensitive to the economic environment. During an economic downturn, religious construction is usually the
first segment to produce a decline. We expect religious construction to increase when consumer spending and the employment situation improve.
Trends:Lending environment continues to be a challenge for many congregations
Establishing a capital campaign becoming increasingly common.
Many churches are seeing tremendous declines in contributions and tithesWith church attendance on the rise, many are relying on their houses of
worship to provide guidance and assistance — further stretching thin resources.
Social mobility and migration have altered the religious landscape of several
regions, including New England and the Southeast.
Uncertainty regarding proposed charitable giving and death tax changes
may either further erode religious giving or may lead to financial advisors
advocating religious friendly estate tax solutions.
New methods for charitable giving, including online giving and donation
collections, are empowering religious organizations.
Charitable funding financial vehicles will
become more attractive as financial services
firms recover from recent business turmoil and
public relations damage.
Improved space utilization and additions aretaking the forefront as new construction isincreasingly not an optionChurches are becoming savvier in attractingparishioners who are drawn in by facilities andthe church building itself
Mega churches offering services for congregants'
non-religious lives continue to be popular.
9,000
8,000
7,000
6,000
5,000
4,000
3,000
2,000
1,000
02000 2001 2002 2003 2004 2005 2006 2007 2008 2009 2010 2011 2012 2013 2014
Mill
ions
of
Cur
rent
Dol
lars
Value of Religious Construction
Drivers:Population
— Government Spending
Incarceration Rate
Nonresidential Structure Investment
Ô
ÔÔ
Public SafetyPublic safety construction is one of the few nonresidential building segments that is not expected to experience large declines. Jail and detention center
construction is down. The growth is coming from federal funding for military structures. Some of this funding is from ARRA, while some of it is from
the BRAC program.
Trends:Overcrowding in jails and prisons leads to new and renovated facilities
California’s AB 900 authorizes $7.7 billion to fund 53,000 additional state prison and local jail beds.
Federal prison population grew by 3.4% in 2009. (Jail population actually decreased in 2009.)
Privately managed secure facilities are increasingCorrections Corporation of America will alter
the conditions at nine detention facilities across
five states to make them less prison-like.
Private corporations now operate 5% of the 5,000
prisons and jails in the U.S. The private prison
industry is growing at a rate of 30% per year.
Green is on the riseGovernment appointed its first chief greening
officer (under GSA) to oversee aggressive pursuit
of sustainable practices in government buildings.
CM-at-risk or design-build arrangements increaseP3s overcome shortfalls in public financingPublic safety budgets see deep cuts, mostly reflectedin personnel and salary
18,000
16,000
14,000
12,000
10,000
8,000
6,000
4,000
2,000
02000 2001 2002 2003 2004 2005 2006 2007 2008 2009 2010 2011 2012 2013 2014
Mill
ions
of
Cur
rent
Dol
lars
Value of Public Safety Construction

10Construction Outlook
Trends:Slowed by uncertain economic conditions
There is a lack of disposable income.
Activity surrounding new and expansion casino constructionSeveral projects were delayed in 2009 and 2010.
The new Greenbrier Resort Casino opened in
July 2010.
Several new stadiums (e.g., MeadowlandsStadium, Twins Ballpark) for professional sportsteams came online in 2009 and 2010
Other stadiums are facing funding concerns.
Drivers:Income
Personal Savings Rate
— Unemployment Rate
— Employment
ÔÔ
Amusement and RecreationAmusement and recreation construction is expected to decline as casino projects are delayed and canceled, sports stadiums are completed and a
spate of convention centers are finished. Tight credit, declining state revenues and decreases in consumer spending are a drag on this segment.
Trends:Growing population is putting increased pressure on the capacity of our currenttransportation infrastructure
This increases the need for mass transit.
Aviation spending is uncertainThe authorization of a federal aviation bill
is under consideration.
High-speed rail has yet to catch on, but is likely to eventually
Drivers:Population
— Government Spending
— Transportation Funding
Ô
TransportationAfter being flat in 2009, transportation construction is expected to recover in 2010 and remain at an elevated level. The size of the market should
double between 1999 and 2013. The growth will come mainly from rail and airport construction.
25,000
20,000
15,000
10,000
5,000
02000 2001 2002 2003 2004 2005 2006 2007 2008 2009 2010 2011 2012 2013 2014
Mill
ions
of
Cur
rent
Dol
lars
Value of Amusement and Recreation Construction
60,000
50,000
40,000
30,000
20,000
10,000
02000 2001 2002 2003 2004 2005 2006 2007 2008 2009 2010 2011 2012 2013 2014
Mill
ions
of
Cur
rent
Dol
lars
Value of Transportation Construction

11Third Quarter 2010
CommunicationCommunication construction had strong growth for four years before declining in 2008. It will decrease again in 2010. After the declines,
communication construction will be around historical levels at $186 billion in 2011.
Drivers:Innovation / Technology
Global Mobility
Population
Security/ Regulatory Standards
— Private Investment
ÔÔ
ÔÔ
ManufacturingManufacturing construction has experienced six years of strong growth, almost doubling the size of the market. We expect that it will decline from
2010 through 2012, but remains at an elevated level. Manufacturing has changed over the years. It is no longer textiles and autos. The growth has come
from billion dollar refinery projects, materials and electronic manufacturing. Investment from ARRA may spur some battery manufacturing projects.
Drivers:PMI
Industrial Production
Capacity Utilization
— Factory Orders
— Durable Goods Orders
— Manufacturing Inventories
Ô
ÔÔ
Trends:All signs would point to increased communication investment over the next five years, but reducedspending across the national nonresidential construction markets has significantly slowed privateinvestment in communication constructionGovernment and military are the two key parties supplying investments
Schools, BRAC and war efforts are large markets.
Immigration and anti-terrorism remain at high overall levels.
Much of the private market’s investment over thenext few years in communication will be toincrease securityThere will be more fiber-optic utilization anddeployment
Manufacturers, installers and builders using
fiber will see high growth.
Google is entering the networking market by
creating an ultra high-speed network for an
entire 50,000- to 500,000- person community.
United States established the NationalBroadband Plan on March 16, 2010
Trends:Over the last two years, manufacturing has been driven through the demand for upgraded technology and thereplacement of aging plants
Construction put in place for 2008 and 2009 are the high years for this segment.
After 2009, construction tapers and falls into a cycle much like the cycle nonresidential is in currently Economic effects such as the cost of natural gas and oil are expected to increase, and funding options are
expected to continue.
Manufacturing efforts are expected to continue to move out of the country or overseas where lower costsbenefit businessRate of growth for manufacturing exports is faster than for importsDraw-downs in business inventories are slowing, resulting in less opportunity for future manufacturing growthElectronic chip manufacturing is up as RFID use by retailers increases as marketers and advertisers arefinding more applications for these devicesA slowdown in defense and nondefense aircraftnew orders occurs after great gains for previouseight monthsAn end to the stimulus could point to slowdownin this segmentNew plants are being built to accommodateproduction of "green" energy makers (batteries,solar panels and wind turbines)Could "green" manufacturing fill the gap createdby auto and auto supplier manufacturing inMichigan and the Rust Belt?
30,000
25,000
20,000
15,000
10,000
5,000
02000 2001 2002 2003 2004 2005 2006 2007 2008 2009 2010 2011 2012 2013 2014
Mill
ions
of
Cur
rent
Dol
lars
Value of Communication Construction
70,000
60,000
50,000
40,000
30,000
20,000
10,000
02000 2001 2002 2003 2004 2005 2006 2007 2008 2009 2010 2011 2012 2013 2014
Mill
ions
of
Cur
rent
Dol
lars
Value of Manufacturing Construction

12Construction Outlook
N o n b u i l d i n g S t r u c t u r e s
PowerPower construction has seen four years of phenomenal growth. It has grown from $35.5 billion in 2005 to $88.7 billion in 2009. It is expected to
decline in 2010 before recovering in 2011 and reaching $127.5 billion in 2014. Environmental regulation and transmission and distribution projects
are mainly driving the growth. A spate of nuclear power projects is likely in the future, but it is unlikely to happen during the forecast period.
Trends:Call for a “nuclear renaissance”
EPA Administrator Christine Todd Whitman believes that the U.S. needs 25 to 27 new
reactors by 2030 for nuclear power to continue to produce 20% of the nation’s electricity.
The U.S. Nuclear Regulatory Commission expects applications for as many as 34 new
reactors by 2010.
The cost of building nuclear power plants is prohibitive without guaranteed loans,
changing regulations and solving waste disposal.
NEI lobbyist Richard Myers said a new, two-unit nuclear power plant could cost
as much as $14 billion; by comparison, the entire market capitalization of many
companies in the industry is barely double this, or smaller.
Obama pledges power loan guarantees.
Wind Power Generation will increaseToday only 1% of America’s power needs are generated by wind power. Experts believe
that it will generate 20% of America’s electricity needs by 2030.
The Pickens project was delayed due to lower energy prices from traditional sources.
Power grids are insufficient to handle the output of wind farms, especially in remote
areas where there is the most wind potential.
Solar Power is an alternativeFlorida Power & Light, the state's largest energy supplier, is building three solar plants.
It will take Florida from not being on the solar map to being the second-largest producer
in the nation (after California). By the end of next year, the plants will produce 110
megawatts of electricity, enough for 35,000 homes and businesses.
Big Solar will generate jobs as well as
electricity: solar thermal and photovoltaic
power plants.
Lower cost of traditional energy will slow
advancement of alternative energy plants.
Drivers:Industrial Production
Population
Nonresidential Structure Investment
Ô
ÔÔ
160,000
140,000
120,000
100,000
80,000
60,000
40,000
20,000
02000 2001 2002 2003 2004 2005 2006 2007 2008 2009 2010 2011 2012 2013 2014
Mill
ions
of
Cur
rent
Dol
lars
Value of Power Construction

13Third Quarter 2010
Highway and StreetHighway and street construction is facing a tough climate as state revenues decline. The funding from ARRA is just enough to offset these losses,
although funding is mostly for paving projects. The ARRA funding along with the extension of the highway bill will be enough to keep highway and
street construction flat. A new highway bill along with increases in state revenues has the potential to increase the level of construction.
Trends:AASHTO estimated in 2008 that it would cost roughly $140 billion to repair everydeficient bridge in the country—about $48 billion to repair structurally deficientbridges and $91 billion to improve functionally obsolete bridgesThe Highway Bill was extended through December 31, 2010
The Highway Bill transfers $19.5 billion to the Highway Trust Fund.
It restores states ability to spend money that had been rescinded.
Tax revenues decline as economy is in recession, resulting in a decrease inavailable state fundsPPP funding and more toll roads may seeincreased interestSlow residential construction in 2009 and 2010will decrease need for new roads in the near termNew funding sources are needed, possibledebates for more toll construction Continued loss of gas tax revenue as mileagestandards are increased through 2016; newrevenue source model neededAmerican Trucking Association projects increasesin over-the-road trucking Hauling of nonconcentrated detergents lessens (seeconservation and development construction below)
Drivers:Population
— Government Spending
Nonresidential Structure Investment
Ô
Ô
120,000
100,000
80,000
60,000
40,000
20,000
02000 2001 2002 2003 2004 2005 2006 2007 2008 2009 2010 2011 2012 2013 2014
Mill
ions
of
Cur
rent
Dol
lars
Value of Highway and Street Construction
Drivers:Population
Industrial Production
— Government Spending
ÔÔ
Trends:In need of replacement and upgrades, the 16,000 wastewater systems nationwide discharge morethan 850 billion gallons of untreated sewage into surface waters each year
Combined sewer systems (storm water and sewage) serve roughly 950 communities with about
40 million people. Most communities with CSOs are located in the Northeast and Great Lakes regions.
The EPA’s Storm Water Phase II Final Rule, published on December 8, 1999, expands the
Phase I storm water runoff regulations program by requiring programs and practices to control
polluted storm water runoffs.
The American Society of Civil Engineers (ASCE)gave Drinking Water and Wastewater “D”grades in its 2009 American InfrastructureReport CardThe Clean Water State Revolving Fund (CWSRF)programs have provided more than $5 billionannually in recent years to fund water qualityprotection projects
ARRA contributed $4 billion to the CWSRF.
The March 2010 U.S. Conference of MayorsWater Council report forecasts that futurespending for public water and wastewater systemswill range between $2.5 and $4.8 trillion over thenext 20-year period, 2009 to 2028
35,000
30,000
25,000
20,000
15,000
10,000
5,000
02000 2001 2002 2003 2004 2005 2006 2007 2008 2009 2010 2011 2012 2013 2014
Mill
ions
of
Cur
rent
Dol
lars
Value of Sewage and Waste Disposal Construction
Sewage and Waste DisposalSewage and waste disposal construction will remain at a historically high level. The market has more than doubled in size over the last decade
from $10.1 billion in 1999 to $25.9 billion in 2010. Slow, steady growth will push the market to reach $30.5 billion in 2014.

14Construction Outlook
Water SupplyWater supply construction will remain flat for the next two years. It has grown from $7.6 billion in 1999 to $15.5 billion in 2010. It will
grow to $19.8 billion in 2014. The aging water supply systems, along with many large EPA consent decrees, will eventually spur increases in
construction levels.
Drivers:Population
Industrial Production
— Government Spending
ÔÔ
Trends:Seven billion gallons of clean drinking water are lost to leaking pipes each day, owing to an annualinvestment shortfall of $11 billion (EPA) to replace old systemsApproximately 17 million people in the U.S. are served by substandard water facilities
The EPA is in the process of improving numerous drinking water standards for various impurities.
The agency is considering further revisions to
the lead and copper rule.
Federal assistance for the safe drinking waterState Revolving Fund (SRF) in the 11-year periodbetween 1997 and 2008 totaled $9.5 billion, justslightly more than the investment gap for each ofthose yearsARRA contributed just less than $2 million to theClean Water State Revolving Fund through the EPADesign-build and construction management at-riskproject delivery are continuing to grow and nowrepresent about 20% -30% of all U.S. water andwastewater projects
25,000
20,000
15,000
10,000
5,000
02000 2001 2002 2003 2004 2005 2006 2007 2008 2009 2010 2011 2012 2013 2014
Mill
ions
of
Cur
rent
Dol
lars
Value of Water Supply Construction
Conservation and DevelopmentConservation and development construction is one of the few surprise winners from the stimulus bill. The Army Corps of Engineers received
$4.6 billion from the stimulus. However, not all of these funds will be used for what we consider construction. It will take several years for the funds
to be worked into construction as it is a large amount of money, considering that the market was approximately $5.4 billion before the stimulus.
The Gulf oil spill will also contribute to the surging growth in this segment. The cleanup effort will contribute almost $500 million in 2010.
Drivers:Population
— Government Spending
Ô
Trends:The goal of EPA's Brownfields Program ($100 million) is to revitalize and restore neighborhoodsthrough environmental cleanup
The program has a proven history of attracting private investment, producing trained environmental
technicians, creating jobs and spurring local economic development.
Through the Recovery Act, EPA will issue competitive grants to evaluate and clean up brownfields,
which will in turn encourage redevelopment.
EPA's Superfund Hazardous Waste Cleanup($600 million) funds the cleanup of uncontrolledhazardous waste sites
The $600 million in Recovery Act funding will
further cleanup at Superfund National Priority
List sites, maximize job creation and retention,
and provide environmental and economic
benefits.
To speed cleanup conducted through the
Recovery Act, EPA will use the funds for sites
on the Superfund National Priority List and
use in-place, competitively awarded contracts;
interagency agreements; and cooperative agree-
ments for emergency response and cleanup activity.
9,000
8,000
7,000
6,000
5,000
4,000
3,000
2,000
1,000
02000 2001 2002 2003 2004 2005 2006 2007 2008 2009 2010 2011 2012 2013 2014
Mill
ions
of
Cur
rent
Dol
lars
Value of Conservation and Development Construction

15Third Quarter 2010
2000 2001 2002 2003 2004 2005 2006 2007 2008 2009 2010 2011 2012 2013 2014
RESIDENTIAL BUILDINGS
Single Family 238,269 251,123 267,205 311,879 378,934 434,912 417,518 306,990 187,609 107,487 123,610 148,332 183,932 211,522 232,674
Multi Family 29,740 32,342 34,268 36,420 41,321 48,699 54,324 52,570 47,823 35,499 31,239 28,740 36,787 39,730 43,306
Improvements* 84,054 89,096 100,487 102,952 118,153 133,896 147,973 140,909 121,977 116,235 119,722 125,708 129,479 133,364 140,032
Total Residential 352,063 372,561 401,960 451,251 538,408 617,507 619,814 500,468 357,408 259,221 274,571 302,780 350,198 384,615 416,012
NONRESIDENTIAL BUILDINGS
Lodging 16,850 15,486 10,869 10,712 12,363 12,840 18,139 28,706 35,818 25,174 16,363 15,381 16,150 17,281 18,663
Office 61,001 59,495 44,277 39,418 42,404 45,763 54,187 65,259 70,305 55,409 41,557 39,894 41,490 43,980 46,618
Commercial 67,873 68,506 62,520 61,529 67,057 70,242 76,713 89,684 84,942 57,473 40,806 38,357 40,659 43,505 47,421
Health Care 24,615 24,776 27,139 29,329 32,184 34,430 38,472 43,766 47,699 46,711 46,244 47,169 51,886 57,593 65,080
Educational 58,848 64,960 73,862 74,316 74,250 79,687 84,928 96,758 104,081 102,927 99,839 102,834 111,061 122,167 135,606
Religious 8,071 8,806 8,339 8,569 8,159 7,735 7,749 7,540 7,125 6,324 5,502 5,612 5,780 5,954 6,251
Public Safety 10,049 9,558 7,827 7,161 7,019 7,314 7,768 10,201 12,936 14,255 14,968 15,417 16,033 16,835 17,677
Amusement and Recreation 20,168 20,207 17,328 16,847 16,695 15,236 19,033 21,212 21,488 18,710 15,155 15,458 16,077 16,720 17,890
Transportation 22,887 24,409 25,781 24,710 25,059 25,052 27,964 31,877 33,953 35,308 36,720 38,924 41,259 44,147 48,120
Communication 18,958 20,173 18,457 14,550 15,546 18,906 22,219 27,580 25,649 20,302 18,475 19,214 20,175 21,385 22,668
Manufacturing 32,184 30,364 22,926 21,508 23,808 30,040 35,500 45,720 61,269 74,791 48,614 40,350 41,964 43,642 47,134
Total Nonresidential Buildings 341,503 346,739 319,325 308,649 324,544 347,245 392,672 468,303 505,265 457,384 384,243 378,610 402,534 433,209 473,128
NONBUILDING STRUCTURES
Power 32,289 35,025 36,804 41,450 35,395 35,466 39,754 59,305 80,160 88,912 94,247 102,729 113,002 125,432 142,992
Highway and Street 54,002 60,554 57,484 57,139 58,623 64,139 72,040 76,682 81,801 84,599 87,137 90,622 95,154 99,911 103,908
Sewage and Waste Disposal 10,949 12,006 16,237 16,581 17,929 19,867 23,186 24,872 25,143 24,920 25,668 26,694 28,029 29,711 31,493
Water Supply 8,587 9,397 12,442 12,492 12,620 14,028 14,960 15,798 16,951 15,804 15,962 16,441 17,592 18,823 20,329
Conservation and Development 3,362 3,967 3,621 3,935 4,044 4,453 5,130 5,260 5,405 5,855 6,382 6,893 7,168 7,455 7,679
Total Nonbuilding Structures 109,190 120,949 126,588 131,597 128,611 137,953 155,070 181,917 209,460 220,090 229,395 243,379 260,944 281,332 306,401
Total Put in Place 802,756 840,249 847,873 891,497 991,563 1,102,705 1,167,556 1,150,688 1,072,133 936,695 888,209 924,770 1,013,676 1,099,156 1,195,541
*Improvements include additions, alterations and major replacements. It does not include maintenance and repairs.
2000 2001 2002 2003 2004 2005 2006 2007 2008 2009 2010 2011 2012 2013 2014
RESIDENTIAL BUILDINGS
Single Family 6% 5% 6% 17% 22% 15% -4% -26% -39% -43% 15% 20% 24% 15% 10%
Multi Family 2% 9% 6% 6% 13% 18% 12% -3% -9% -26% -12% -8% 28% 8% 9%
Improvements* 7% 6% 13% 2% 15% 13% 11% -5% -13% -5% 3% 5% 3% 3% 5%
Total Residential 6% 6% 8% 12% 19% 15% 0% -19% -29% -27% 6% 10% 16% 10% 8%
NONRESIDENTIAL BUILDINGS
Lodging 2% -8% -30% -1% 15% 4% 41% 58% 25% -30% -35% -6% 5% 7% 8%
Office 17% -2% -26% -11% 8% 8% 18% 20% 8% -21% -25% -4% 4% 6% 6%
Commercial 7% 1% -9% -2% 9% 5% 9% 17% -5% -32% -29% -6% 6% 7% 9%
Health Care 8% 1% 10% 8% 10% 7% 12% 14% 9% -2% -1% 2% 10% 11% 13%
Educational 12% 10% 14% 1% 0% 7% 7% 14% 8% -1% -3% 3% 8% 10% 11%
Religious 9% 9% -5% 3% -5% -5% 0% -3% -6% -11% -13% 2% 3% 3% 5%
Public Safety 3% -5% -18% -9% -2% 4% 6% 31% 27% 10% 5% 3% 4% 5% 5%
Amusement and Recreation 3% 0% -14% -3% -1% -9% 25% 11% 1% -13% -19% 2% 4% 4% 7%
Transportation 17% 7% 6% -4% 1% 0% 12% 14% 7% 4% 4% 6% 6% 7% 9%
Communication 2% 6% -9% -21% 7% 22% 18% 24% -7% -21% -9% 4% 5% 6% 6%
Manufacturing -3% -6% -24% -6% 11% 26% 18% 29% 34% 22% -35% -17% 4% 4% 8%
Total Nonresidential Buildings 8% 2% -8% -3% 5% 7% 13% 19% 8% -9% -16% -1% 6% 8% 9%
NONBUILDING STRUCTURES
Power 30% 8% 5% 13% -15% 0% 12% 49% 35% 11% 6% 9% 10% 11% 14%
Highway and Street 7% 12% -5% -1% 3% 9% 12% 6% 7% 3% 3% 4% 5% 5% 4%
Sewage and Waste Disposal 9% 10% 35% 2% 8% 11% 17% 7% 1% -1% 3% 4% 5% 6% 6%
Water Supply 13% 9% 32% 0% 1% 11% 7% 6% 7% -7% 1% 3% 7% 7% 8%
Conservation and Development 9% 18% -9% 9% 3% 10% 15% 3% 3% 8% 9% 8% 4% 4% 3%
Total Nonbuilding Structures 14% 11% 5% 4% -2% 7% 12% 17% 15% 5% 4% 6% 7% 8% 9%
Total Put in Place 8% 5% 1% 5% 11% 11% 6% -1% -7% -13% -5% 4% 10% 8% 9%
*Improvements include additions, alterations and major replacements. It does not include maintenance and repairs.
2000 2001 2002 2003 2004 2005 2006 2007 2008 2009 2010 2011 2012 2013 2014
RESIDENTIAL BUILDINGS
Single Family 238,269 251,123 267,205 311,879 378,934 434,912 417,518 306,990 187,648 107,325 123,424 148,109 183,655 211,203 232,323
Multi Family 29,740 32,342 34,268 36,420 41,321 48,699 54,324 52,570 48,083 32,224 20,946 19,270 24,666 26,639 29,036
Improvements* 84,054 89,096 100,487 102,952 118,153 133,896 147,973 140,909 122,016 114,027 124,289 130,504 134,419 138,452 145,374
Total Residential 352,063 372,561 401,960 451,251 538,408 617,507 619,814 500,468 357,747 253,576 268,659 297,882 342,739 376,293 406,733
NONRESIDENTIAL BUILDINGS
Lodging 16,850 15,486 10,869 10,712 12,363 12,840 18,139 28,706 35,806 25,474 14,011 14,018 15,139 16,199 17,495
Office 61,001 59,495 44,277 39,418 42,404 45,763 54,187 65,259 68,563 52,717 36,902 35,426 36,843 39,053 41,397
Commercial 67,873 68,506 62,520 61,529 67,057 70,242 76,713 89,684 86,212 55,042 37,979 35,700 37,842 40,491 44,135
Health Care 24,615 24,776 27,139 29,329 32,184 34,430 38,472 43,766 46,902 45,111 41,051 43,104 47,414 52,629 59,471
Educational 58,848 64,960 73,862 74,316 74,250 79,687 84,928 96,758 104,890 102,907 92,616 95,395 103,026 113,329 125,795
Religious 8,071 8,806 8,339 8,569 8,159 7,735 7,749 7,540 7,225 6,206 5,399 5,507 5,672 5,843 6,135
Public Safety 10,049 9,558 7,827 7,161 7,019 7,314 7,768 10,201 13,083 14,099 13,676 14,086 14,650 15,382 16,151
Amusement and Recreation 20,168 20,207 17,328 16,847 16,695 15,236 19,033 21,212 21,829 18,901 15,499 15,809 16,441 17,099 18,296
Transportation 22,887 24,409 25,781 24,710 25,059 25,052 27,964 31,877 35,471 38,459 43,074 45,659 48,398 51,786 56,447
Communication 18,958 20,173 18,457 14,550 15,546 18,906 22,219 27,580 26,487 19,754 17,976 18,695 19,630 20,808 22,056
Manufacturing 32,184 30,364 22,926 21,508 23,360 28,568 32,677 40,633 53,234 58,513 42,129 33,703 32,355 34,620 37,390
Total Nonresidential Buildings 341,503 346,739 319,325 308,649 324,096 345,773 389,849 463,216 499,702 437,183 360,313 357,102 377,411 407,239 444,768
NONBUILDING STRUCTURES
Power 32,289 35,025 36,804 41,450 35,638 38,371 42,244 66,055 81,075 89,405 84,041 91,604 100,765 111,849 127,508
Highway and Street 54,002 60,554 57,484 57,139 58,623 64,139 72,040 76,682 81,361 82,028 82,110 85,394 89,664 94,147 97,913
Sewage and Waste Disposal 10,949 12,006 16,237 16,581 17,929 19,867 23,186 24,872 25,696 24,410 24,898 25,894 27,189 28,820 30,549
Water Supply 8,587 9,397 12,442 12,492 12,620 14,028 14,960 15,798 16,752 15,561 15,559 16,026 17,148 18,348 19,816
Conservation and Development 3,362 3,967 3,621 3,935 4,044 4,453 5,130 5,260 5,234 5,624 6,636 7,167 7,454 7,752 7,985
Total Nonbuilding Structures 109,190 120,949 126,588 131,597 128,854 140,858 157,560 188,667 210,118 217,028 213,245 226,086 242,220 260,917 283,771
Total Put in Place 802,756 840,249 847,873 891,497 991,358 1,104,138 1,167,223 1,152,351 1,067,567 907,787 842,216 881,070 962,370 1,044,450 1,135,273
*Improvements include additions, alterations and major replacements. It does not include maintenance and repairs.
2000 2001 2002 2003 2004 2005 2006 2007 2008 2009 2010 2011 2012 2013 2014
RESIDENTIAL BUILDINGS
Single Family 6% 5% 6% 17% 22% 15% -4% -26% -39% -43% 15% 20% 24% 15% 10%
Multi Family 2% 9% 6% 6% 13% 18% 12% -3% -9% -33% -35% -8% 28% 8% 9%
Improvements* 7% 6% 13% 2% 15% 13% 11% -5% -13% -7% 9% 5% 3% 3% 5%
Total Residential 6% 6% 8% 12% 19% 15% 0% -19% -29% -29% 6% 11% 15% 10% 8%
NONRESIDENTIAL BUILDINGS
Lodging 2% -8% -30% -1% 15% 4% 41% 58% 25% -29% -45% 0% 8% 7% 8%
Office 17% -2% -26% -11% 8% 8% 18% 20% 5% -23% -30% -4% 4% 6% 6%
Commercial 7% 1% -9% -2% 9% 5% 9% 17% -4% -36% -31% -6% 6% 7% 9%
Health Care 8% 1% 10% 8% 10% 7% 12% 14% 7% -4% -9% 5% 10% 11% 13%
Educational 12% 10% 14% 1% 0% 7% 7% 14% 8% -2% -10% 3% 8% 10% 11%
Religious 9% 9% -5% 3% -5% -5% 0% -3% -4% -14% -13% 2% 3% 3% 5%
Public Safety 3% -5% -18% -9% -2% 4% 6% 31% 28% 8% -3% 3% 4% 5% 5%
Amusement and Recreation 3% 0% -14% -3% -1% -9% 25% 11% 3% -13% -18% 2% 4% 4% 7%
Transportation 17% 7% 6% -4% 1% 0% 12% 14% 11% 8% 12% 6% 6% 7% 9%
Communication 2% 6% -9% -21% 7% 22% 18% 24% -4% -25% -9% 4% 5% 6% 6%
Manufacturing -3% -6% -24% -6% 9% 22% 14% 24% 31% 10% -28% -20% -4% 7% 8%
Total Nonresidential Buildings 8% 2% -8% -3% 5% 7% 13% 19% 8% -13% -18% -1% 6% 8% 9%
NONBUILDING STRUCTURES
Power 30% 8% 5% 13% -14% 8% 10% 56% 23% 10% -6% 9% 10% 11% 14%
Highway and Street 7% 12% -5% -1% 3% 9% 12% 6% 6% 1% 0% 4% 5% 5% 4%
Sewage and Waste Disposal 9% 10% 35% 2% 8% 11% 17% 7% 3% -5% 2% 4% 5% 6% 6%
Water Supply 13% 9% 32% 0% 1% 11% 7% 6% 6% -7% 0% 3% 7% 7% 8%
Conservation and Development 9% 18% -9% 9% 3% 10% 15% 3% 0% 7% 18% 8% 4% 4% 3%
Total Nonbuilding Structures 14% 11% 5% 4% -2% 9% 12% 20% 11% 3% -2% 6% 7% 8% 9%
Total Put in Place 8% 5% 1% 5% 11% 11% 6% -1% -7% -15% -7% 5% 9% 9% 9%
*Improvements include additions, alterations and major replacements. It does not include maintenance and repairs.
Millions of Current Dollars 3rd Quarter 2010
Change From Prior Year - Current Dollar Basis3rd Quarter 2010
C o n s t r u c t i o n P u t i n P l a c e
Estimated for The United States)

16Construction Outlook
About FMIFMI is the largest provider of management consulting, investment banking and research to the design and con-struction industry. We work in all segments of the industry providing clients with value-added business solu-tions, including:
Strategy Development Market Research and Business Development Leadership and Talent DevelopmentProject and Process Improvement Mergers, Acquisitions and Financial Consulting
Founded by Dr. Emol A. Fails in 1953, FMI has professionals in offices across the U.S. FMI delivers innovative,customized solutions to contractors; construction materials producers; manufacturers and suppliers of buildingmaterials and equipment; owners and developers; engineers and architects; utilities; and construction industrytrade associations. FMI is an advisor you can count on to build and maintain a successful business, from your leadership to your site managers.
About FMI’s Research Services GroupAs the construction industry becomes increasingly competitive, market intelligence becomes an important toolfor the building industry. A more complete understanding of the market, market trends, customer perceptions,buying practices, competitor profiles and other market influencers will enhance craft labor studies.
Since 1953 FMI has provided consulting and training services specialized for the construction industry. FMI’smarket research includes both secondary and primary research designed to meet clients’ specific needs. Bothtypes of research are used to provide accurate assessments in a timely, efficient and concise manner for clients.
Typical project work performed includes customer buying practices, competitive analyses, market-size modeling,market forecasts and trends, channel performance analyses, customer satisfaction surveys and sales performanceevaluations.
J. Randall (Randy) GiggardManaging Director, Research Services
Randy Giggard is responsible for design,
management, and performance of
primary and secondary market
research projects and related research
activities, including economic analysis
and modeling, construction market
forecasting and database management.
Randy’s particular expertise is in the
areas of market sizing and modeling,
competitive analysis, sales and market
performance evaluations, buying
practices and trends analysis.
Randy holds undergraduate degrees in
mechanical engineering from Southern
Illinois University and English from
Illinois State University and a master
of marketing and management policy
degree from Northwestern University.
T 919.785.9268 F 919.785.9320E-mail: [email protected]_____________________________FMI CORPORATIONRaleigh5171 Glenwood Ave., Ste. 200Raleigh, NC 27612P 919.787.8400 F 919.785.9320
Denver210 University Boulevard, Ste. 800Denver, CO 80206P 303.377.4740 F 303.398.7291
Tampa308 South Blvd.Tampa, FL 33606P 813.636.1364 F 813.636.9601
Phoenix5080 N. 40th St., Suite 245Phoenix, AZ 85018T 602.381.8108 F 602.381.8228
BenefitsA Construction Market Forecast from FMI’s Research Services Group can:_____________________________________________
Supply the market-oriented, economy-drivendimension essential for preparing, implementingand monitoring strategic plans.Be a significant aid in defining, targeting, implementing and monitoring other critical corporate decisions, such as long- and short-termsales goals, or redirecting resources (i.e., on a geographic or a product-line basis).Provide the basis for estimating submarkets.Provide the basis for comparing performanceamong markets.Provide the basis for identifying activities that arebeneficial or detrimental to performance.
FeaturesEach Standard Construction Market Forecast:_____________________________________________
Details construction put in place in three residentialbuilding, 11 nonresidential building and five non-building structure categories. It covers the currentyear, eight previous years and five forecast years.It is available for any county in the U.S. or anycombination of counties, metropolitan statisticalareas, states, regions, etc.Includes both construction values and annualpercentage changes. Delivery time depends on thesize of the request but is usually only a few days.It can be delivered in printed or electronic form,and in most major text or spreadsheet formats.Graphs can be provided at additional cost.
FMI’s Construction Market ForecastsBasis_____________________________________________
Historical information in FMI’s standard ConstructionMarket Forecast is based on building permits andconstruction put in place data as provided by theU.S. Commerce Department. Forecasts are based oneconometric and demographic relationships devel-oped by FMI, on information from specific projectsgathered from trade sources, and on FMI’s analysisand interpretation of current and expected socialand economic conditions.
Other Reports_____________________________________________Reports on state and federally financed highway construction are available for most counties or combinations of counties.Custom reports on a wide variety of construction-related topics can be prepared by FMI.Reports are based on multiple sources and areappropriate for preliminary analytical and planningpurposes, but contain little or no direct observationof the area described and are not guaranteed byFMI to be accurate.
_________________________________________
For more information, call 919.785.9268
_________________________________________
Copyright 2010 FMI Corporation. All rights reserved. Printed in the United States of America.Notice of Rights: No part of this publication may be reproduced or transmitted in any form, or by any means, without permission from the publisher: 919.787.8400.To order additional copies of this book, please call 800.669.1364 or complete the order form at the back of this publication.