Embed Size (px)
Citation preview

Copyright © 2016 Information Resources, Inc. (IRI). Confidential and proprietary. 1
FMI is the trade association that
serves as the voice of food
retail. We assist food retailers in
their role of feeding families and
enriching lives.

The Association
ASSET
PROTECTION EDUCATION RESEARCH
FOOD SAFETY & DEFENSE
GOVERNMENT RELATIONS
SUSTAINABILITY
SUPPLY CHAIN
HEALTH & WELLNESS
PRIVATE BRANDS
FRESH FOODS INFORMATION SERVICE
CENTER STORE CONSUMER &
COMMUNITY AFFAIRS INDEPENDENT
OPERATOR
COMMUNICATION WHOLESALER
TECHNOLOGY
Our members are food retailers, wholesalers and suppliers of all
types and sizes.
FMI provides comprehensive programs, resources and advocacy
for the food, pharmacy and grocery retail industry.

Fresh @ FMI Fresh Foods
Emphasis on fresh
• Produce
• Meat
• Seafood
• Deli/In-store, fresh
prepared foods and
assortments
FMI is committed to the growth and success of fresh companies and their partners. FMI provides resources and networks that support the interests of member companies throughout the global, fresh produce supply chain, including family-owned, private and publicly traded businesses as well as regional, national and international companies.
Rick Stein, Vice President, Fresh
Foods
Food Marketing Institute
202.220.0700
In-depth information, trends and insights to foster innovation, take
advantage of new opportunities and help develop winning
strategies
Share ideas, explore best practices and develop
business relations
Understand what is going on in Washington and make your voice heard
FMI Fresh Foods

FMI Fresh Executive Committee John Ruane (Co-Chair)
Ahold USA
Rick Steigerwald (Co-Chair)
Lund Food Holdings, Inc.
Tom DeVries (Past Chair)
Giant Eagle, Inc.
Jason Anderson
Affiliated Foods Midwest Cooperative, Inc.
Bill Artman
Giant Eagle, Inc.
John Beretta
Albertsons, LLC
Dave Bornmann
Publix Super Markets, Inc.
Scott Bradley
Target Corporation
David Bridges
Publix Super Markets, Inc.
Jerry Chadwick
Lancaster Foods, LLC
Alex Corbishley
Target Corporation
Chris Darling
Albertsons, LLC
Jerry Edney
Associated Wholesale Grocers, Inc.
Mary Fuhrman
Lomar Distributing
John Haggerty
Burris Logistics
Mark Hilton
Harris Teeter LLC
Christopher Lane
Wakefern Food Corporation
Pete Leung
Brookshire Grocery Company
Dan Murphy
Unified Grocers, Inc.
Pat Pessotto
Longo Brothers Fruit Markets Inc.
Jerry Suter
Meijer, Inc.
Geoff Waldau
Delhaize America
Blaine Bringhurst*
Price Chopper Supermarkets
Steve Mayer*
Schnuck Markets, Inc.
Nicole Wegman*
Wegmans Food Markets, Inc.
* Silent members
Fresh Foods
The FEC seeks to
• identify areas of
collaboration across all
fresh foods
departments
• promote
understanding and
cooperation
throughout the industry
and with sister fresh
associations
• maximize common
learning’s between
fresh categories and to
create a vision of
leadership for the
entire fresh category.

FMI Fresh Foods Leadership Council
John Ruane (Co-Chair)
Ahold USA
Rick Steigerwald (Co-Chair)
Lund Food Holdings, Inc.
FEC Members
FMI Fresh Executive Council
Chris Dubois
IRI
Michael Eardley
International Dairy-Deli-Bakery
Association
Jim Ethridge
National Cattleman's Beef
Association
Sherry Frey
Nielsen Perishables Group
Paul Mastronardi
Sunset Grown Produce
Jeff Oberman
United Fresh Produce Association
Janet Riley
North American Meat Institute
Tristan Simpson
Ready Pac Foods, Inc.
Tom Super
National Chicken Council
Jarrod Sutton
National Pork Board
Joe Watson
Produce Marketing Association
Joe Weber
Smithfield Foods Inc.
Art Yerecic
Yerecic Label
Fresh Foods
The FFLC is comprised
of FMI Member
companies, industry trade
association and fresh-
focused knowledge
partners.
Copyright © 2016 Information Resources, Inc. (IRI). Confidential and proprietary. 7

Fresh Top Trends in
Copyright © 2016 Information Resources, Inc. (IRI). Confidential and proprietary. 9
1
3
2
4
5
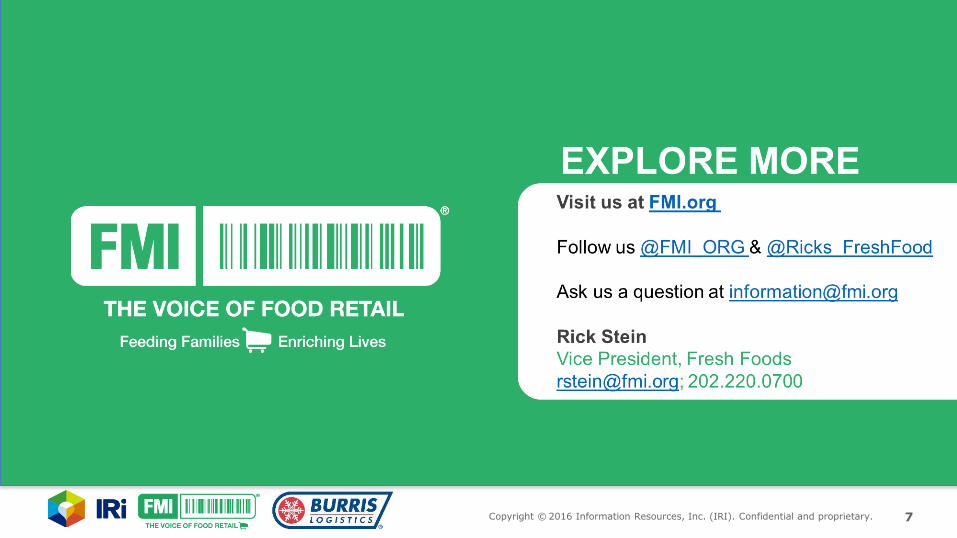
Definition
Size
Why It Will Continue
3 – 5 Year Projection/Implications
Top Trends in Fresh Foods Overview

Copyright © 2016 Information Resources, Inc. (IRI). Confidential and proprietary. 10
Perimeter growing twice as fast as Total F&B
1.0%
1.4% 2.0%
3.8%
5.4%
1.7% 2.2%
4.5%
$426 $61 $53 $175 $30 $140 $108
52-week Department Sales and % Growth ($ billions)
Source: IRI FreshLook POS data, MULO, 52 weeks ending 11/29/2015
$335
2X

Copyright © 2016 Information Resources, Inc. (IRI). Confidential and proprietary. 11
Perimeter
departments all
growing
$6.4B
+1.9%
$2.7B
+4.8%
$6.2B
+6.3%
$10.8B
+9.7%
$49.1B
+4.5%
$60.4B
+3.7%
$4.6B
+5.4%
Source: IRI FreshLook POS data, MULO, 52 weeks ending 11/29/2015

Copyright © 2016 Information Resources, Inc. (IRI). Confidential and proprietary. 12
Our study focused on finding the keys to outperformance
multi-year impact
presence across multiple fresh departments
critical to long term success
not reliant on legislation
multi-faceted
Trend Criteria
industry interviews data analysis secondary research
Trend Validation

Copyright © 2016 Information Resources, Inc. (IRI). Confidential and proprietary. 13
Consumer Demands
Industry Response 5
Trends

Copyright © 2016 Information Resources, Inc. (IRI). Confidential and proprietary. 14
Critical for long-term success
Trends still in early stages of growth
Embracing these trends drives sales
outperformance
Requires strategic planning across
categories and departments
Foundation for next generation of retail
business success

Copyright © 2016 Information Resources, Inc. (IRI). Confidential and proprietary. 15
Food Transparency 1

Copyright © 2016 Information Resources, Inc. (IRI). Confidential and proprietary. 16
Our Definition
The consumer desire to know how and where food was grown or made. The consumer expectation for clarity, accuracy and usefulness of food related information from the companies that produce and sell it.

Copyright © 2016 Information Resources, Inc. (IRI). Confidential and proprietary. 17
Primary Claims Likely Growers
Seafood
Sustainability
Fair
Wage/Food
GMOs Animal
Welfare
Organic Produce
$4.5B
+13% Sales
Deli NAE Meat
+29% Sales
Deli Organic Cheese
+66% Sales
NAE Meat
$2.9B
+23% Sales
Organic
Meat
$582M
+32% Sales
Source: IRI FreshLook POS data, MULO, 52 weeks ending 11/29/2015

Copyright © 2016 Information Resources, Inc. (IRI). Confidential and proprietary. 18
Primary Claims are Gaining Critical Mass
Chicken Produce Deli
12% of sales are
antibiotic free
3% of sales are
organic
31% combined
annual growth
+8% of sales are
organic
+10% 9 categories
> 10% in sales
13% sales
growth
40% of sales are
major brands with mixes of key attributes
Source: IRI FreshLook POS data, MULO, 52 weeks ending 11/29/2015
Copyright © 2016 Information Resources, Inc. (IRI). Confidential and proprietary. 19
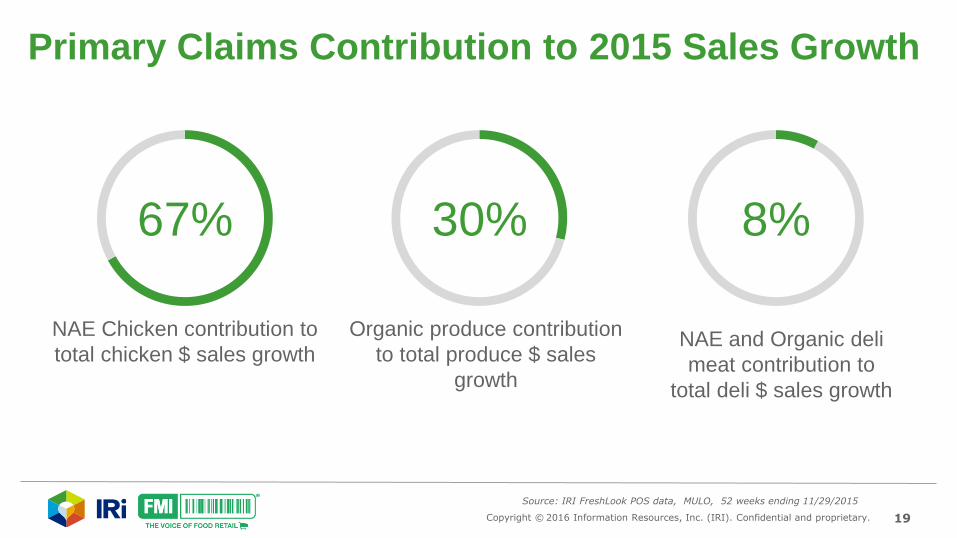
Primary Claims Contribution to 2015 Sales Growth
67% 30% 8%
NAE Chicken contribution to
total chicken $ sales growth
Organic produce contribution
to total produce $ sales
growth
NAE and Organic deli
meat contribution to
total deli $ sales growth
Source: IRI FreshLook POS data, MULO, 52 weeks ending 11/29/2015

Copyright © 2016 Information Resources, Inc. (IRI). Confidential and proprietary. 20
Likely Grower: Consumer interest in GMOs remains high
GMO Salmon
news released
Source: IRI Social Advantage Monitoring and Analysis, November 16, 2015 to January 4, 2016
10K-15K GMO postings per day (40 MM Internet sites tracked)
Avg. daily GMO post volume is nearly
3X Gatorade and
1/3 of Coca Cola
Spikes are typically
linked to news flow

Copyright © 2016 Information Resources, Inc. (IRI). Confidential and proprietary. 21
GMOs: For Most Consumers the “Jury Is Out”
• Debate about GMOs is ongoing and
dynamic
• Many consumers just want a “right-
to-know”
• There is opportunity to help shape
consumer conversations with
thought-leadership
• Negative sentiment is NOT targeted
at retailers
Source: IRI Social Advantage Monitoring and Analysis, November 16, 2015 to January 4, 2016

Copyright © 2016 Information Resources, Inc. (IRI). Confidential and proprietary. 22
GMO Labeling is Biggest Consumer Concern
10% All Other includes • Cancer
• Non-GMO Project
• Meat
• Fruit
• Regulation
• Toxins
• Gene transfer Sub-topics
of GMO
Conversations 34% Labeling
23% Monsanto
10% Herbicides/
Pesticides
10% Vegetables
7% Ban
6% Allergies
Source: IRI Social Advantage Monitoring and Analysis, November 16, 2015 to January 4, 2016

Copyright © 2016 Information Resources, Inc. (IRI). Confidential and proprietary. 23
Likely Grower:
Seafood Sustainability
1,290 posts/week avg.
61% microblog
28% news
2% social sites
8% blogs
1% message boards
Key Insights
More conversations are focused on
restaurants, but grocery is growing
Consumers are concerned about
environmental health and their own
health
“Aquaculture” is a rising theme – is it
sustainable, healthy? What about wild
caught?

Copyright © 2016 Information Resources, Inc. (IRI). Confidential and proprietary. 24
Sustainable Seafood Key Influencers
Top conversation influencers go beyond
niche advocacy organizations
1.6MM+ downloads

Copyright © 2016 Information Resources, Inc. (IRI). Confidential and proprietary. 25
Fair Wage / Food Animal Welfare
Retailer/grower partnerships
Linked with broader social issues
Formal governance
structure/broader advocacy
Major progress and change
Emotional topic/engaged consumer
3rd party certifications
becoming more important

Copyright © 2016 Information Resources, Inc. (IRI). Confidential and proprietary. 26
Why This Trend Will Continue
Fears They
Won’t Like
Natural/Organic
Products
Proud of Buying
Natural/Organic
Products
True Believers
Enlightened Environmentalists
Strapped Seekers Indifferent Traditionalists
Healthy Realists
Resistant Non-Believers
Struggling Switchers
10% 10% 26% 15%
16% 13% 10%
Full Spectrum of Natural/Organic Buyers
Source: IRI/Spins NaturalLink segmentation; IRI Consumer panel IRI FreshLook POS data; MULO, 52 weeks ending 11/29/2015, IRI analysis

Copyright © 2016 Information Resources, Inc. (IRI). Confidential and proprietary. 27
True Believers
$70K
College /
Post Grad
West
42 avg. age
75% Caucasian
My Top 3 Priorities for…
Willing to Pay More For…
What Holds Me Back
My Sources of Info.
Food & Beverage Personal Care Home Care
Made w/all natural
ingredients
Free of chemicals Most effective
Made w/organic
ingredients
Made w/all natural
ingredients
Eco-Friendly
Best taste Most effective
ingredients
Made w/all natural
ingredients
Food & Beverage Personal Care Home Care
Organic
Non-GMO
All Natural
Eco-Friendly
Fair Trade
Organic
All Natural
Eco-Friendly
Eco-Friendly
All Natural
Organic
• Expense of natural/organic products
• Availability of natural/organic options at
local store
• No all-natural/organic options available
for products I like
Source: IRI/Spins NaturalLink segmentation; IRI Consumer panel IRI FreshLook POS data; MULO, 52 weeks ending 11/29/2015, IRI analysis

Copyright © 2016 Information Resources, Inc. (IRI). Confidential and proprietary. 28
Enlightened Environmentalists
$59K
Post Grad
NE/West
61 avg. age
77% Caucasian Skew African American
My Top 3 Priorities for…
Willing to Pay More For…
What Holds Me Back
My Sources of Info.
Food & Beverage Personal Care Home Care
Made w/all natural
ingredients Free of chemicals Most effective
Best Taste Most effective
ingredients Eco-Friendly
Made w/organic
ingredients
Made w/all natural
ingredients Multi-purpose
Food & Beverage Personal Care Home Care
Organic
All Natural
Non-GMO
Eco-Friendly
Fair Trade
Organic
All Natural
Eco-Friendly
Eco-Friendly
All Natural
Organic
• Expense of natural/organic products
• Availability of natural/organic options at
local store
Celebrity Chefs
Product Labels
Source: IRI/Spins NaturalLink segmentation; IRI Consumer panel IRI FreshLook POS data; MULO, 52 weeks ending 11/29/2015, IRI analysis

Copyright © 2016 Information Resources, Inc. (IRI). Confidential and proprietary. 29
Healthy Realists
$70K Skews $100K+
College+
Throughout
U.S.
39 avg. age
75% Caucasian
My Top 3 Priorities for…
Willing to Pay More For…
What Holds Me Back
My Sources of Info.
Food & Beverage Personal Care Home Care
Best taste Most effective
ingredients Most effective
Made w/all natural
ingredients Is on sale/coupon Is on sale/coupon
Is on sale/coupon Not tested on
animals Multi-purpose
Food & Beverage Personal Care Home Care
All Natural
• Availability of natural/organic options at
local store
Source: IRI/Spins NaturalLink segmentation; IRI Consumer panel IRI FreshLook POS data; MULO, 52 weeks ending 11/29/2015, IRI analysis

Copyright © 2016 Information Resources, Inc. (IRI). Confidential and proprietary. 30
There’s still room to grow across major markets in the U.S.
Low
Adoption
High
Adoption
Source: IRI/Spins NaturalLink segmentation; IRI Consumer panel IRI FreshLook POS data; MULO, 52 weeks ending 11/29/2015, IRI analysis
NAE Meat and Organic Produce

Copyright © 2016 Information Resources, Inc. (IRI). Confidential and proprietary. 31
Seattle
NAE Meat
5.9% 11.6%
Organic Produce
US Average Share
Seattle Share
7.5% 15.5%
US Average Share
Seattle Share
96
163
132
Seattle: 2X share compared to US average
Source: IRI/Spins NaturalLink segmentation; IRI Consumer panel IRI FreshLook POS data; MULO, 52 weeks ending 11/29/2015, IRI analysis

Copyright © 2016 Information Resources, Inc. (IRI). Confidential and proprietary. 32
5.9% 4.9%
Organic Produce
US Average Share
Norfolk Share
7.5% 7.0%
US Average Share
Norfolk Share
95
112
202
Norfolk
NAE Meat
Similar consumer profile to Seattle: room to grow
Source: IRI/Spins NaturalLink segmentation; IRI Consumer panel IRI FreshLook POS data; MULO, 52 weeks ending 11/29/2015, IRI analysis

Copyright © 2016 Information Resources, Inc. (IRI). Confidential and proprietary. 33
Source: IRI FreshLook POS data; MULO, 52 weeks ending 11/29/2015, IRI analysis
Norfolk Seattle
+22% units/store
+20.5% sales
+8.4% units/store
+6.4% sales
TOTAL US MULO
+13.4% units/store
+13.0% sales
Norfolk growth outpacing Seattle…
Organic Produce

Copyright © 2016 Information Resources, Inc. (IRI). Confidential and proprietary. 34
Health and Wellness interest among consumers is high and organic attributes play a role
58% expected Millennial spending growth by 2020
25% of Millennials eat organic
45% of older Millennials are looking for
Organic snack options
33% of younger Millennials are looking for
Organic snack options
Source: IRI Consumer research; Millennial and NaturalLink surveys

Copyright © 2016 Information Resources, Inc. (IRI). Confidential and proprietary. 35
$1.55
$5.50
$1.54
$1.42
$3.54
$1.31
Decreasing price gaps between products with and without key attributes which will spur additional growth
2015 2011
NAE
Meat
Organic Deli
Cheese
Produce
Source: IRI FreshLook POS data; MULO, 52 weeks ending 11/29/2015, IRI analysis

Copyright © 2016 Information Resources, Inc. (IRI). Confidential and proprietary. 36
Baby Carrots: Decreasing price gaps between products with and without key attributes which will spur additional growth
$1.30
$1.26
$1.38
$1.45 2011
2015
Price Per LB
18%
30%
Organic Conventional
Organic % Share
70%
79%
US Dist.
Source: IRI FreshLook POS data; MULO, 52 weeks ending 11/29/2015, IRI analysis

Copyright © 2016 Information Resources, Inc. (IRI). Confidential and proprietary. 37
Small Tomatoes: Decreasing price gaps between products with and without key attributes which will spur additional growth
$2.28
$2.20
$3.41
$4.03 2011
2015
Price Per LB
3.1%
5.1%
Organic Conventional
Organic % Share
52%
62%
US Dist.
Source: IRI FreshLook POS data; MULO, 52 weeks ending 11/29/2015, IRI analysis

Copyright © 2016 Information Resources, Inc. (IRI). Confidential and proprietary. 38
Increasing Distribution
37 items/store Organic
Fruit
54 items/store
46 items/store Organic
Vegetables
67 items/store
From
To
Source: IRI FreshLook POS data; MULO, 52 weeks ending 11/29/2015, IRI analysis

Copyright © 2016 Information Resources, Inc. (IRI). Confidential and proprietary. 39
Organic Berries Increasing Distribution
9 items/store
2011
14 items/store
2015
6% of berry
sales in 2011
9% of berry
sales in 2015
Source: IRI FreshLook POS data; MULO, 52 weeks ending 11/29/2015, IRI analysis

Copyright © 2016 Information Resources, Inc. (IRI). Confidential and proprietary. 40
Transparency: Consumer Expectations for Traceability
Product Origin
(Farm)
Growing
Practices
Animal Welfare
Opportunity for
Feedback
Source: Company Website and App
Copyright © 2016 Information Resources, Inc. (IRI). Confidential and proprietary. 41
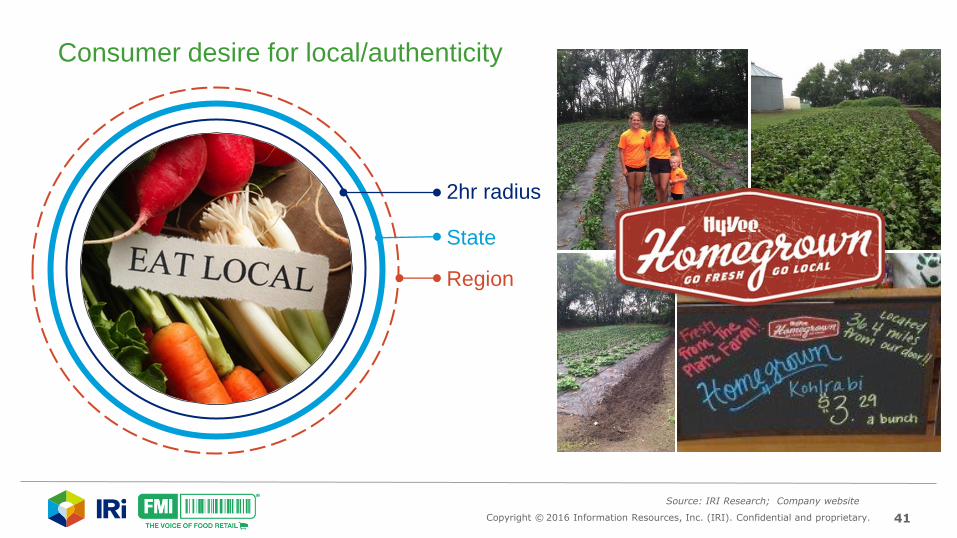
2hr radius
State
Region
Consumer desire for local/authenticity
Source: IRI Research; Company website

Copyright © 2016 Information Resources, Inc. (IRI). Confidential and proprietary. 42
Local: Farmers’ Markets Growing and Evolving
1,755
2,410
2,746
1,863
3,137
3,706
4,385
4,685
5,274
6,132
7,175
7,864 8,144
8,268
1994 1996 1998 2000 2002 2004 2006 2008 2009 2010 2011 2012 2013 2014
Farmers market growth
Source: USDA-AMS Marketing Services Division
Organizing
for scale

Copyright © 2016 Information Resources, Inc. (IRI). Confidential and proprietary. 43
Top
20% Retailers
Food Transparency Can Drive Faster Growth
NAE Meat Grow Total Meat 44% faster than total US
Organic Produce Grow Total Produce 40% faster than total US
Halo Effect
Source: IRI FreshLook POS data, MULO, 52 weeks ending 11/29/2015 based on Retailer Market Area-level analysis

Copyright © 2016 Information Resources, Inc. (IRI). Confidential and proprietary. 44
3-5 Outlook: NAE Chicken could become standard in the market
Producers Retailers & Restaurants
To
day
20
17
- 2
01
9
*Eliminate antibiotics also used by humans
*
*
12% NAE
2015
40%+ NAE
2022

Copyright © 2016 Information Resources, Inc. (IRI). Confidential and proprietary. 45
Animal Welfare: Gestation crate-free pork could be almost 50% of the pork market by 2022
Producers Retailers &
Restaurants
To
day
20
17
*Committed to sourcing 25% of all meat (including pork) from GAP or equivalent animal welfare certified sources
Today Estimated Pork
Production
Capacity
85% Conventional
14% Cage Free
1% NAE
Today Estimated Pork
Production
Capacity
53% Conventional
37% Cage Free
10% NAE
20
22
Retail Packaged Brands
*
* *
*
*
Source: NRDC Going Mainstream: Meat and Poultry Raised Without Routine Antibiotics Use
Company Owned Farms
Company Owned Farms
Company Owned
Farms Contract Farms
Contract Farms

Copyright © 2016 Information Resources, Inc. (IRI). Confidential and proprietary. 46
3-5 Year Outlook:
• Continued fast growth in Organic
Produce (at least 50% growth over the
next 5 years)
• Accelerating growth in Meat claims (NAE
chicken, gestation crate-free pork)
• Continued focus on health and wellness
from consumers
• Increased consumer engagement and
demand for traceability
• Evolving sophistication and growth in
local-based supply programs

Copyright © 2016 Information Resources, Inc. (IRI). Confidential and proprietary. 47
Retailer Impact
Winners will: • Drive major programs using
strategically selected claims and attributes
• Use store-level insight to target offerings and refine programs
• Create strong local programs that integrate local farmers to on-shelf marketing
• Expand dialogue with consumers
to educate and inform

Copyright © 2016 Information Resources, Inc. (IRI). Confidential and proprietary. 48
2016 Individual Trend Launches + Education Plan
Jan 28 Feb 25 Mar 31 Apr 28 May 26 June
Food
Transparency
Next:
Prepared
Foods &
Specialty
New Supply
Chains
Convenience
Connected
Consumer
Chris DuBois Steve Ramsey Chris DuBois
FMI Connect
Refresh/Update
Content Plan
Communication
Plan
Sally Lyons Wyatt
Webinar
Webinar
Webinar Webinar Webinar
Larry Levin