Embed Size (px)
Citation preview

fMRIfMRI Block Design and Data AnalysisBlock Design and Data Analysis
David C. Zhu, Ph.D.Cognitive Imaging Research Center
Departments of Psychology and Radiology
Reading materials
Henderson JM, Larson CL, Zhu DC. Cortical activation to indoor versus outdoor scenes: an fMRI study. Exp Brain Res. 200 1 9 842007;179:75-84.

Subsystem Subsystem Subsystemf(t) Subsystem1
Subsystem 2
Subsystem n y(t)
System with operator TSystem with operator T
y(t) = T{f(t)}
(1) Find T => Event-related design( ) g
(2) A T’ T b d d l(2) Assume T’ = T based on some modelFind expected y’(t) = T’{f(t)}Compare y(t) and y’(t)Compare y(t) and y (t) => Block related design
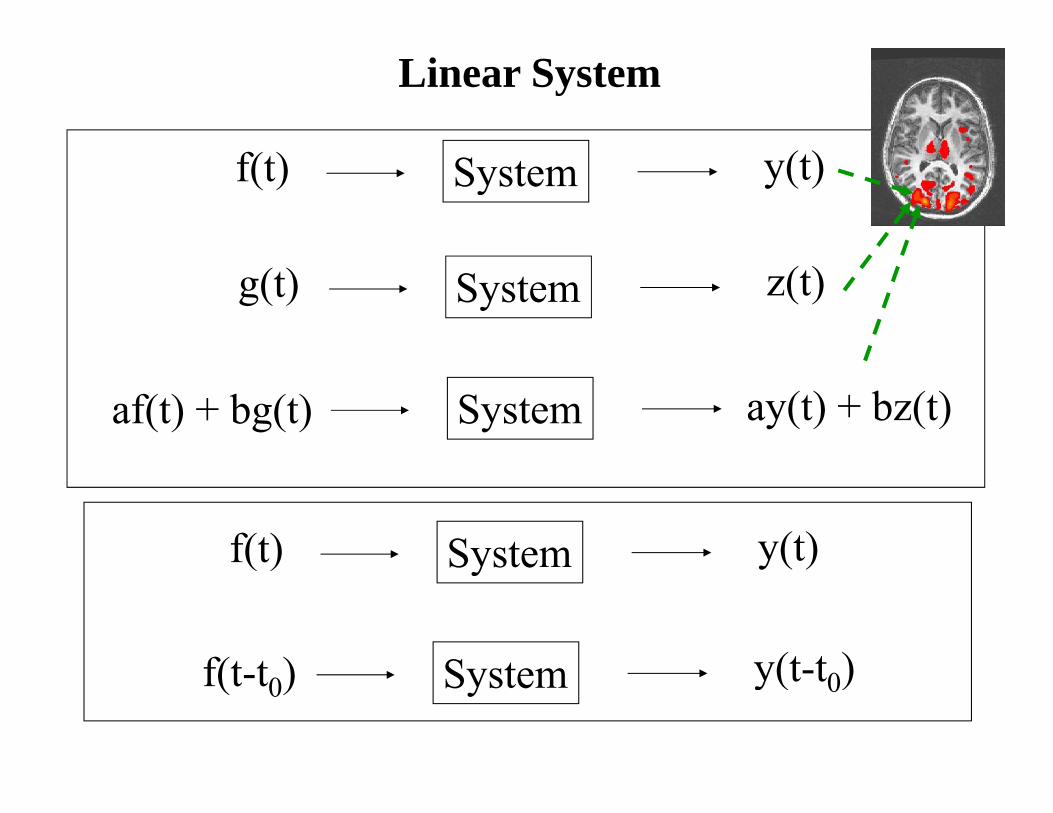
Linear System
( )f(t) System y(t)
g(t) System z(t)
af(t) + bg(t) System ay(t) + bz(t)
f(t) System y(t)f(t) System y(t)
f(t t ) S t y(t t )f(t-t0) System y(t-t0)
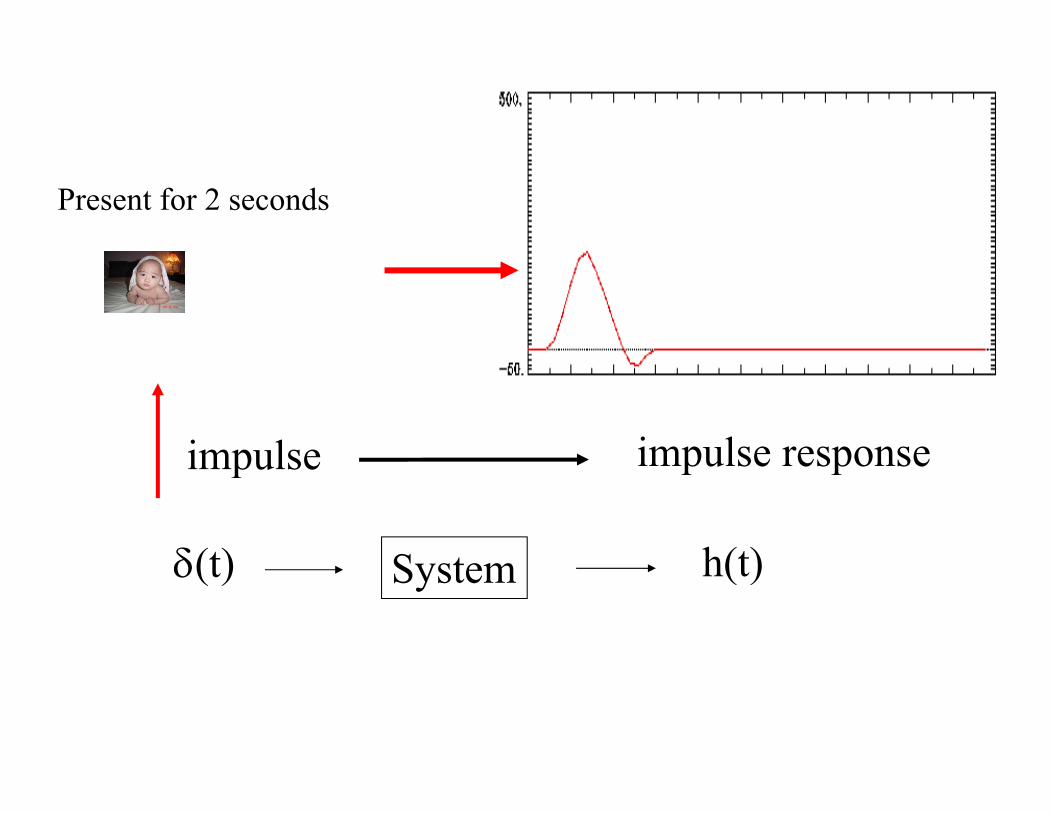
Present for 2 seconds
impulse impulse response
(t) S t h(t)
impulse impulse response
(t) System h(t)
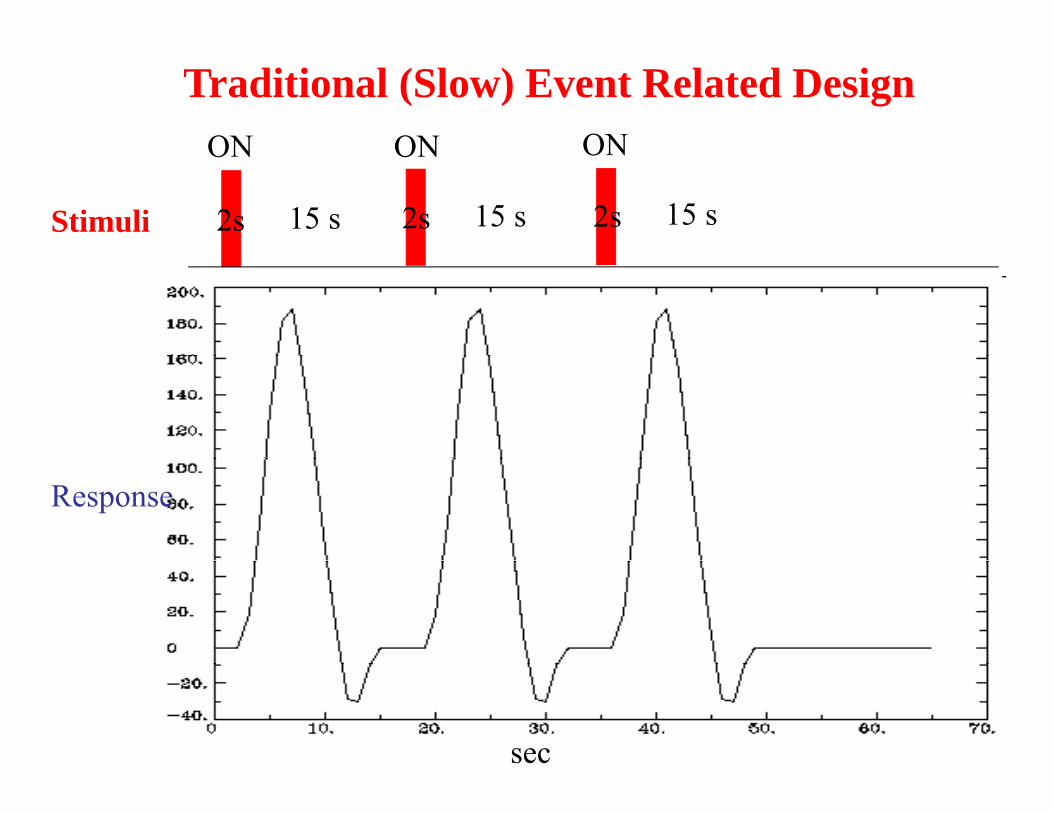
ON ON ON
Traditional (Slow) Event Related Design
Stimuli
ON ON ON
2s 15 s 2s 15 s 2s 15 s
Response
sec
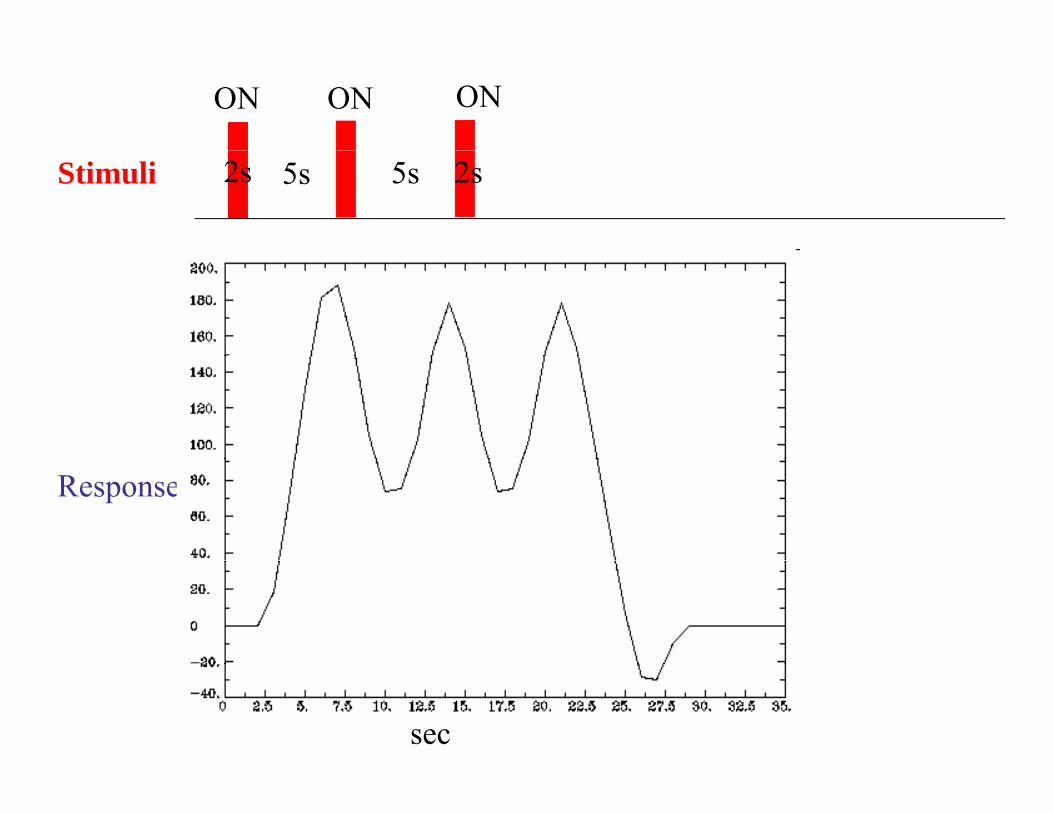
ON ON ON
2sStimuli 5s 5s 2s
Response
sec
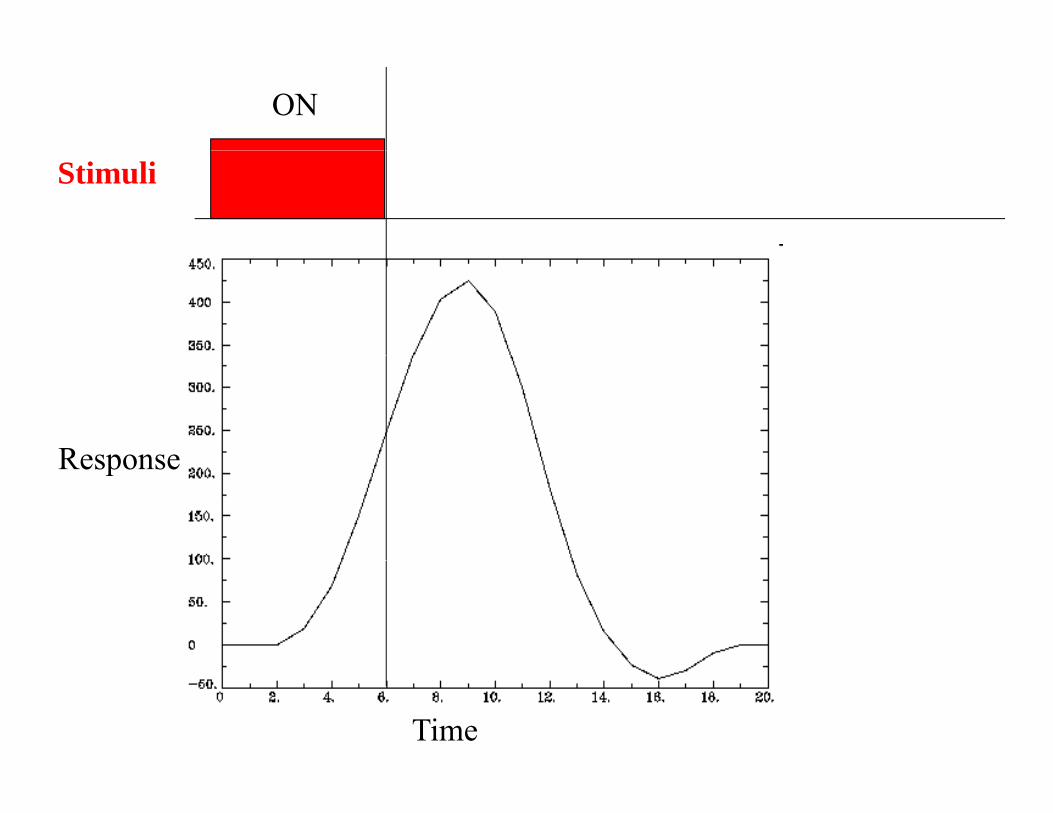
ON
Stimuli
ResponseResponse
Time
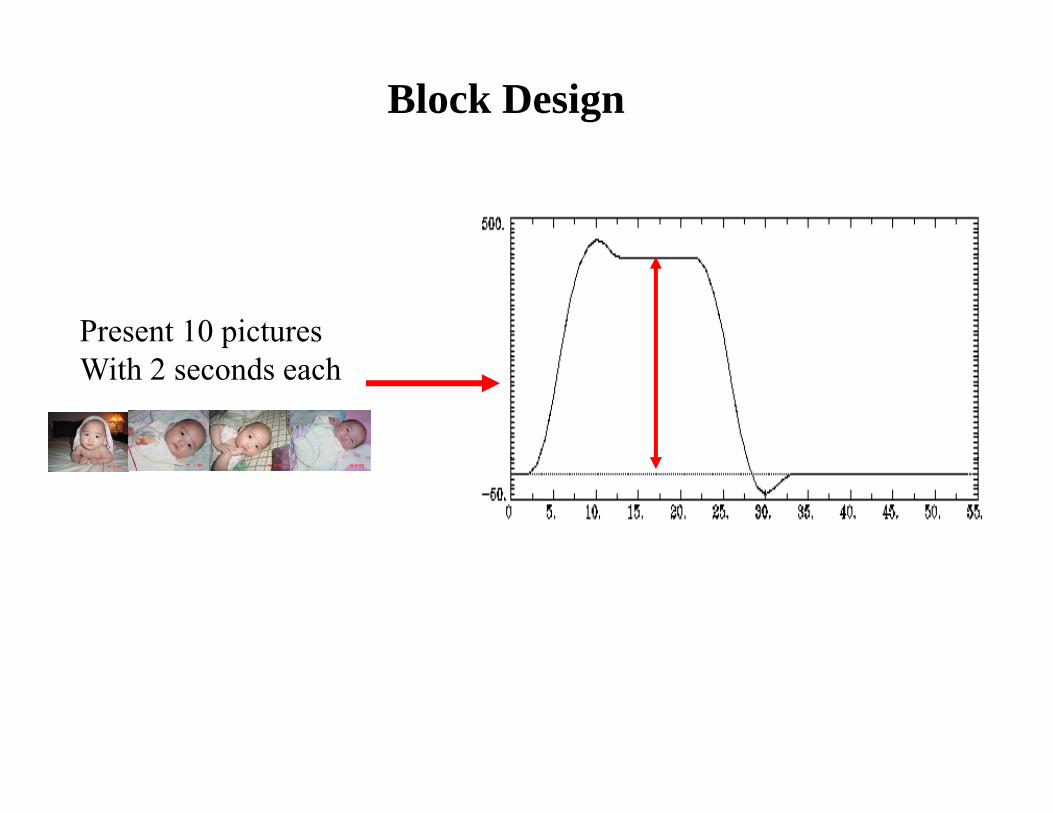
Block Design
Present 10 pictures With 2 seconds each
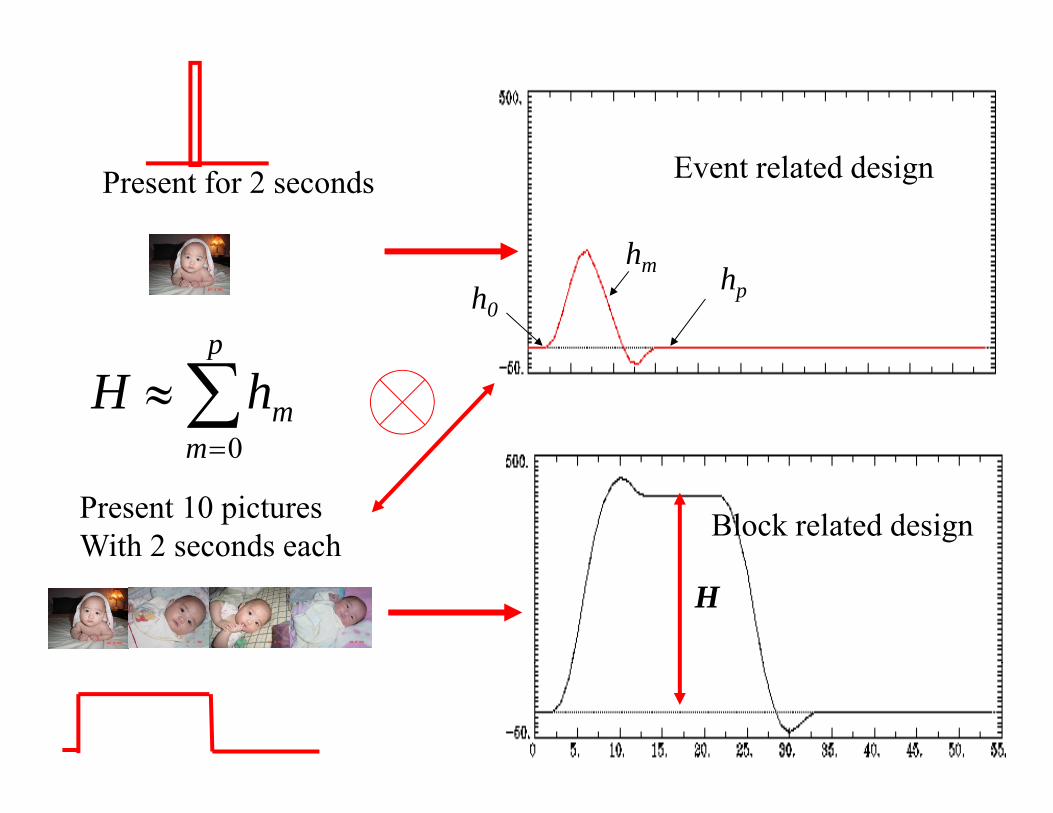
Present for 2 seconds Event related design
hhph0
hm
p
p
mmhH
0
Block related designPresent 10 pictures With 2 seconds each
m 0
H
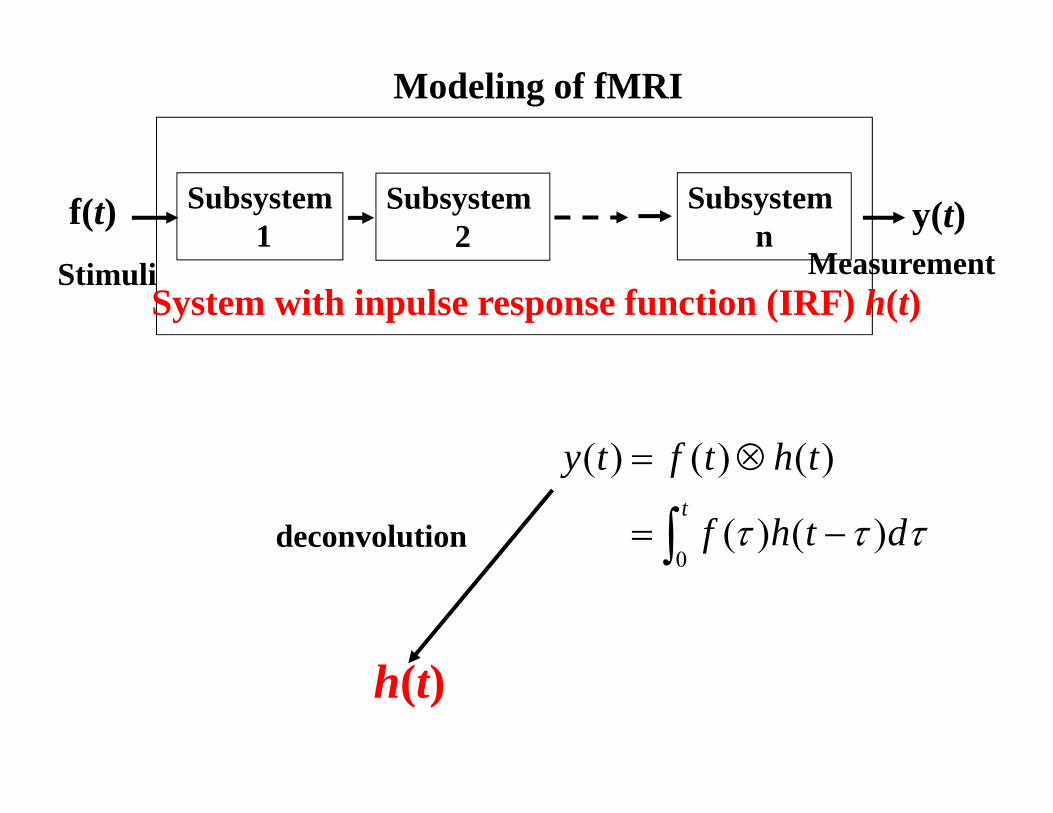
Modeling of fMRI
Mf(t) Subsystem
1Subsystem
2Subsystem
n y(t)Stimuli Measurement
System with inpulse response function (IRF) h(t)
thtfty )()()(
deconvolution
t
dthf
thtfty
0)()(
)()()(
0
h(t)
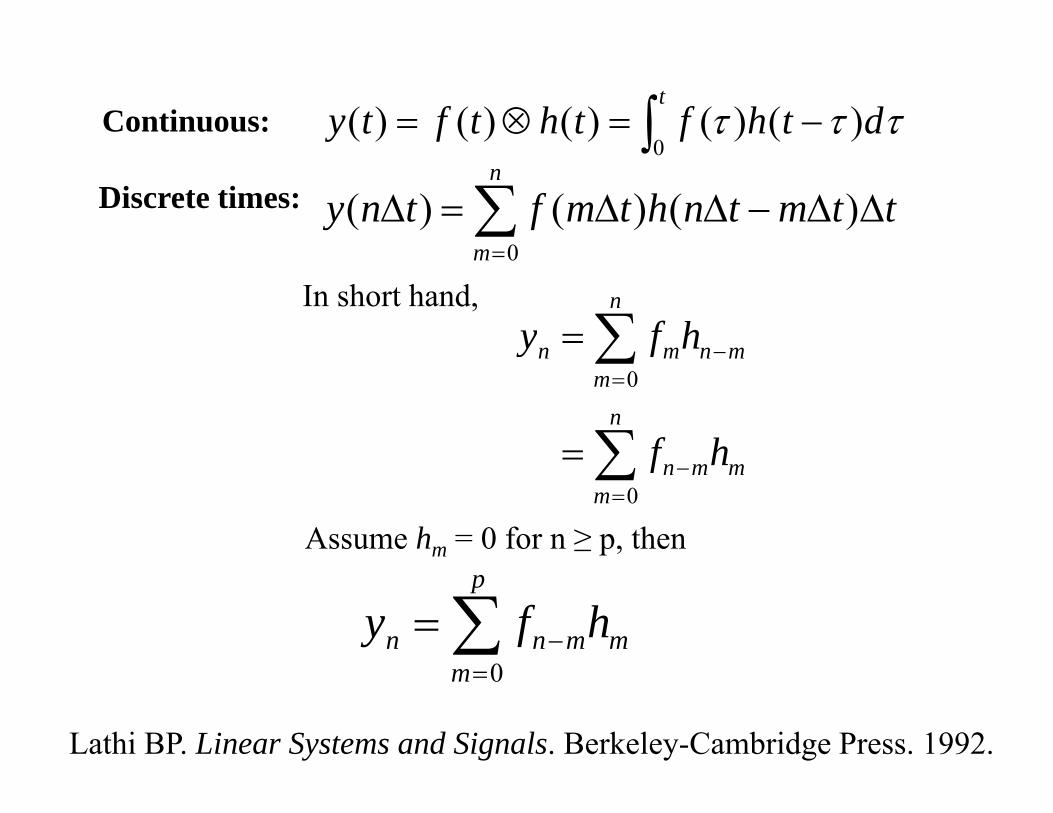
Continuous: t
dthfthtfty0
)()()()()(
Discrete times:
n
m
ttmtnhtmftny0
)()()(
0
m 0
mn
n
mn hfy In short hand,
n
mnm
mn
hf
fy
0
mm
mn hf
0
Assume hm = 0 for n ≥ p, then
m
p
mnn hfy m0
Lathi BP. Linear Systems and Signals. Berkeley-Cambridge Press. 1992.

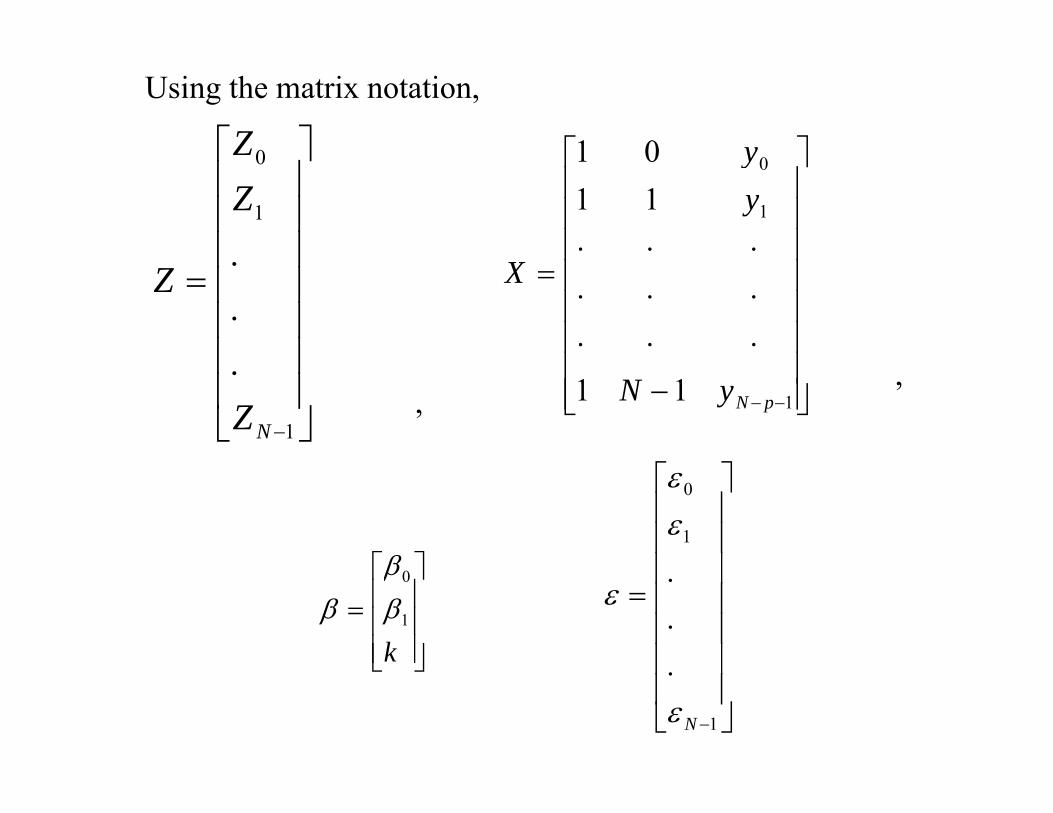
Using the matrix notation,
Z 0...1 ffp
1p
p
ZZ
11
0
........11...1
p
p
ffpffp
X
..Z
.
...
.
...
.
.X
1
.
NZ,
11 ...11 pNN ffN ,
0
1p
p
h0
1
0
.
.
.
..
1N
ph.
p
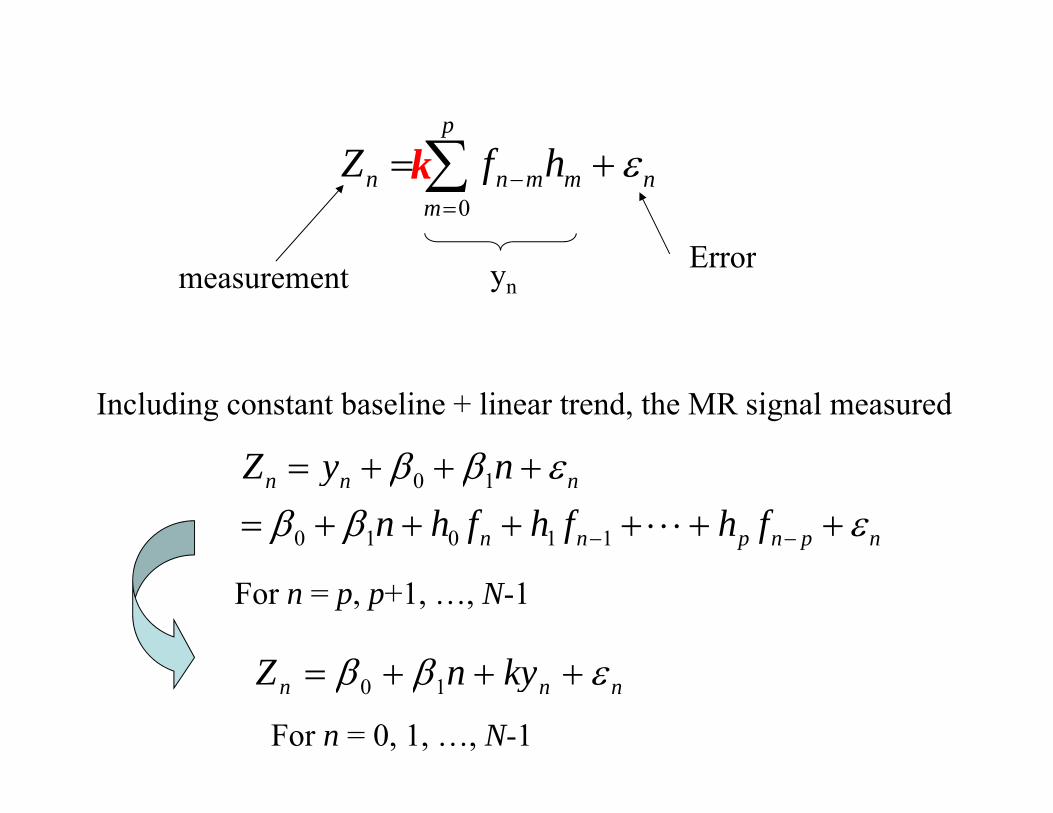
hfZ k nmm
mnn hfZ
0
Error
k
Errormeasurement yn
Including constant baseline + linear trend, the MR signal measured
Z
npnpnn
nnn
fhfhfhnnyZ
11010
10
For n = p, p+1, …, N-1
kZ nnn kynZ 10
For n = 0, 1, …, N-1
Using the matrix notation,
0Z 01 y
1
0
ZZ
1
0
1101
yy
..
Z
X
1
.
NZ ,,
111 pNyN
1
0
..
k1
0
1
.
N
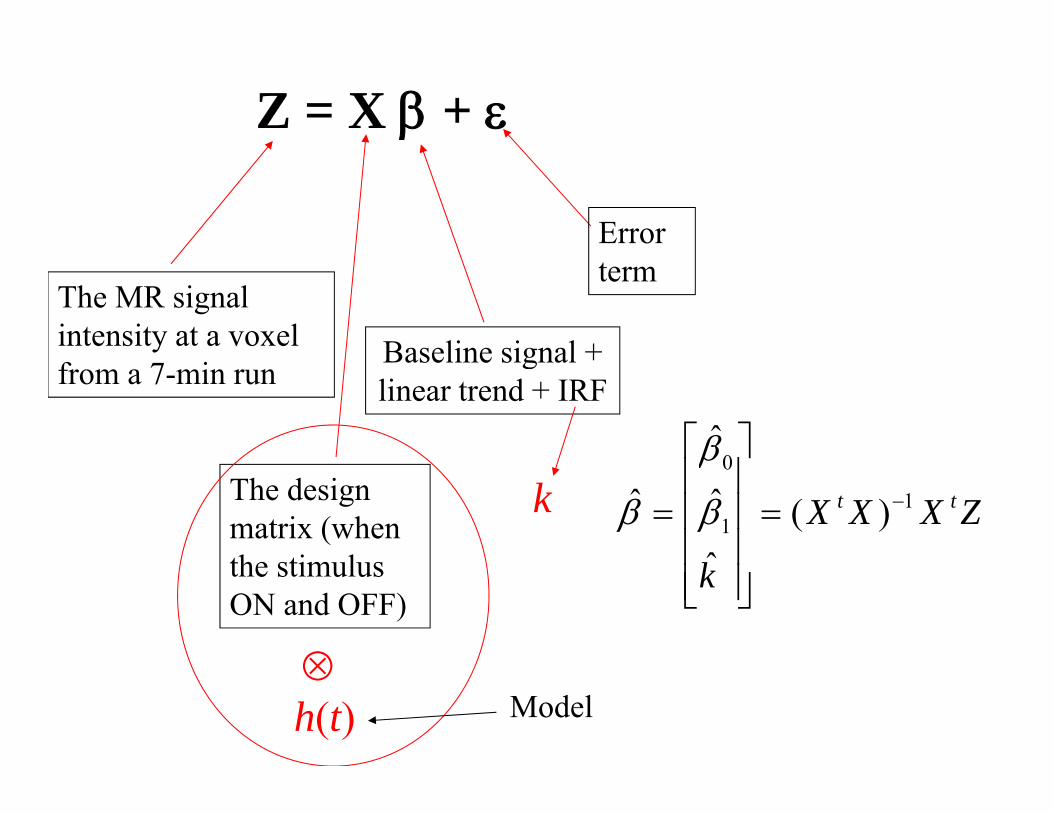
Z = X +
Error
The MR signal intensity at a voxel Baseline signal +
term
from a 7-min runBaseline signal + linear trend + IRF
0ˆ
The design matrix (when th ti l
k ZXXX tt 11
0
)(ˆ
ˆˆ
the stimulus ON and OFF)
k
h(t) Model

)()()( thtfty
Model In AFNI, gamma functions:(1) D f l C i l
)(')()(' thtfty
(1) Default: Cox special (2) Mark Cohen)(')( tkhth if
h)(')( tkyty
then
% i l hH
% signal change
ˆHk
0̂

E lExample
Henderson JM, Larson CL, Zhu DC. Cortical activation to indoor versus outdoor scenes: an fMRI study. Exp Brain Res. 2007;179:75-84.

Engineering ProcessIndoor and Outdoor belongs to different scene sub-categories. Does
Cognitive Question
the bran process them differently?
Cognitive Question
fMRI QuestionDo they have different BOLD activation at scene processing area PPA (parahippocampal place area)?
Experimental Design
Pilot Data
PPA (parahippocampal place area)? How about retrosplenial cortex?
Data AcquisitionFull1. Block design for good detection.2. Need Face as control to find PPA.3 N d l t f i ti li t
Data Analysis
Time & $
3. Need a lot of unique stimuli to find out if Indoor and Outdoor have different BOLD responses.Time & $
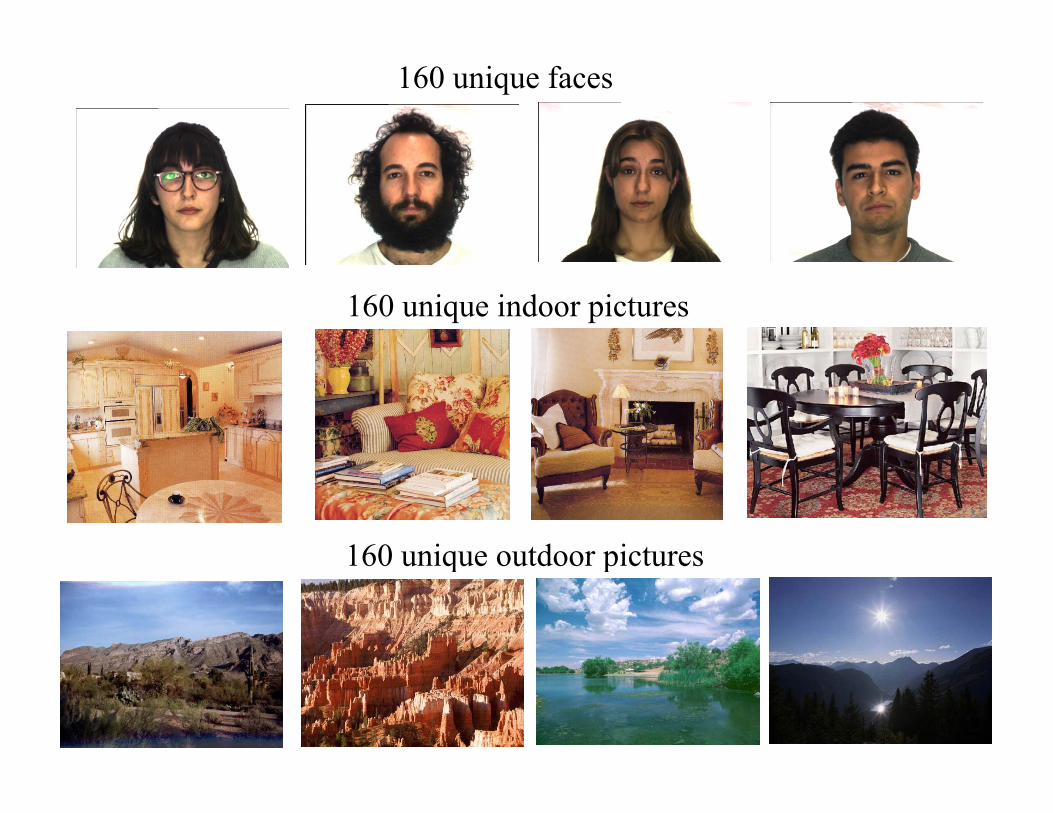
160 unique faces
160 unique indoor pictures
160 unique outdoor pictures160 unique outdoor pictures
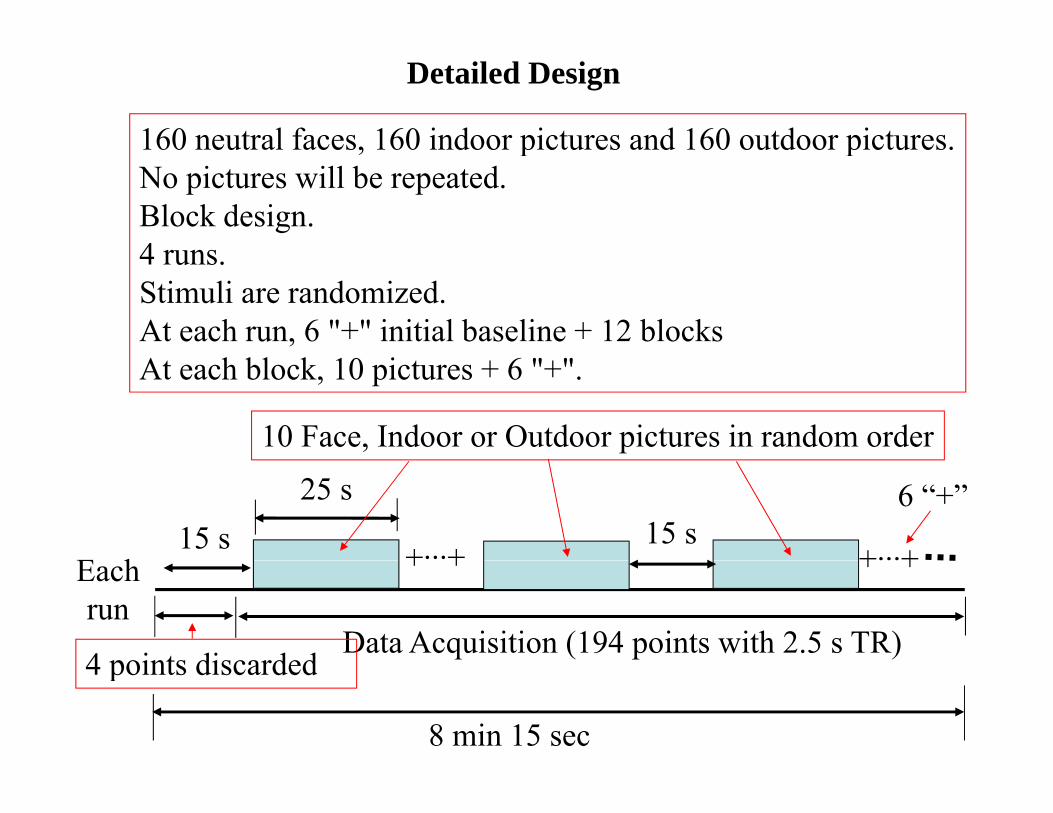
160 neutral faces, 160 indoor pictures and 160 outdoor pictures.
Detailed Design
, p pNo pictures will be repeated.Block design.4 runs4 runs.Stimuli are randomized.At each run, 6 "+" initial baseline + 12 blocksAt each block, 10 pictures + 6 "+".
10 Face, Indoor or Outdoor pictures in random order
E h15 s
25 s15 s +···+ +···+
6 “+”
Each run
Data Acquisition (194 points with 2.5 s TR)4 points discarded
+ + + +
4 points discarded
8 min 15 sec

Why choose 15 sec of baseline?
25 sec ON15 sec OFF
25 sec ON12 sec OFF
25 sec ON10 OFF10 sec OFF
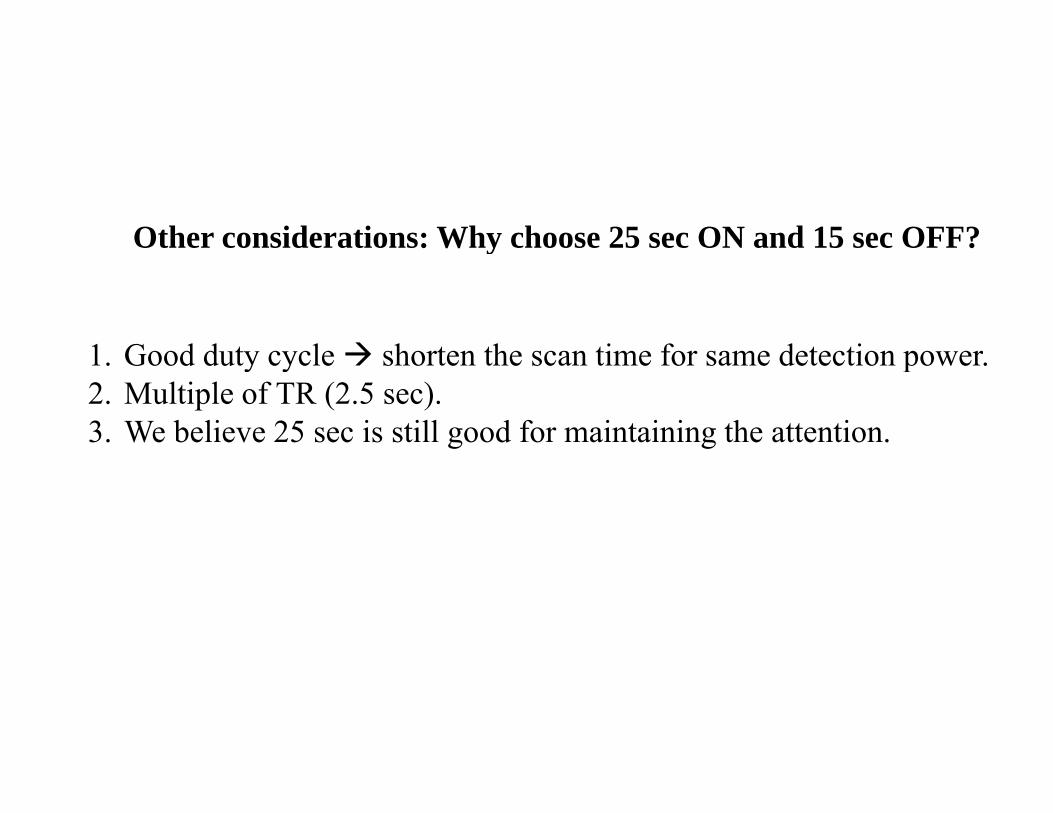
Other considerations: Why choose 25 sec ON and 15 sec OFF?y
1 Good duty cycle shorten the scan time for same detection power1. Good duty cycle shorten the scan time for same detection power.2. Multiple of TR (2.5 sec).3. We believe 25 sec is still good for maintaining the attention.
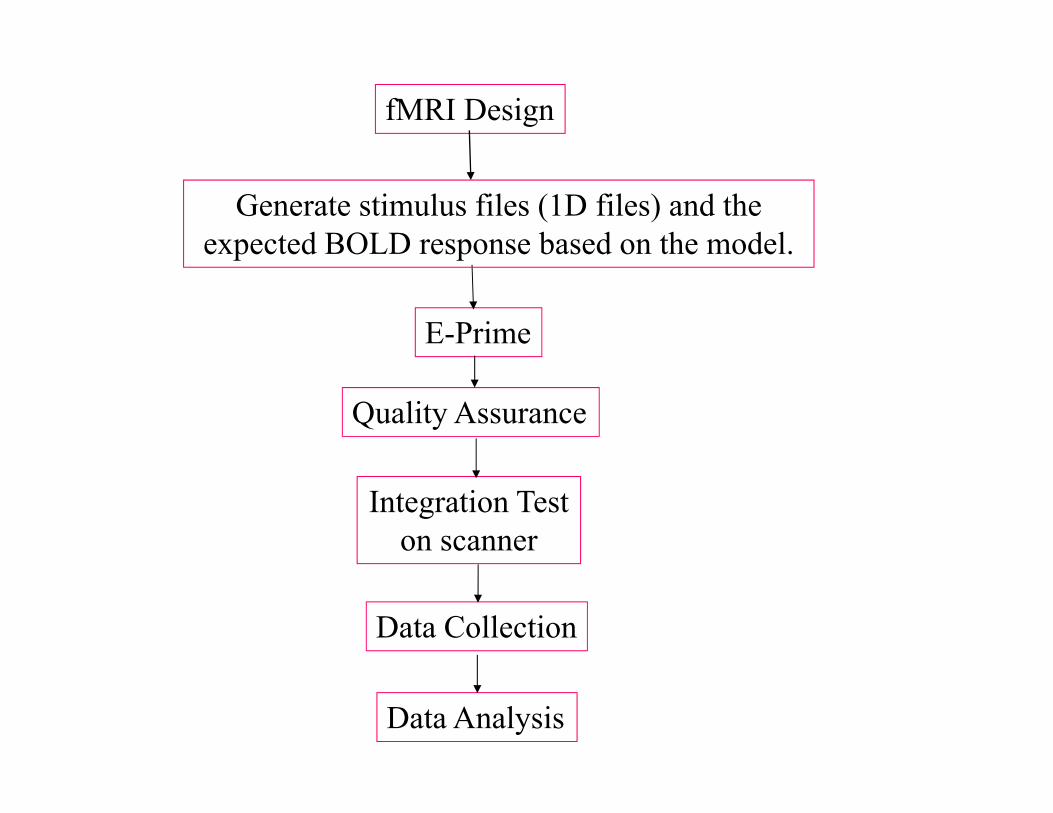
fMRI Design
Generate stimulus files (1D files) and the expected BOLD response based on the model.
E-Prime
expected BOLD response based on the model.
Quality Assurance
Integration Test on scanner
Data Collection
Data Analysis
Generate stimulus files (1D files) and the expected BOLD response based on the modelexpected BOLD response based on the model.

Reading Materials:Chapter 8 and Chapter 10
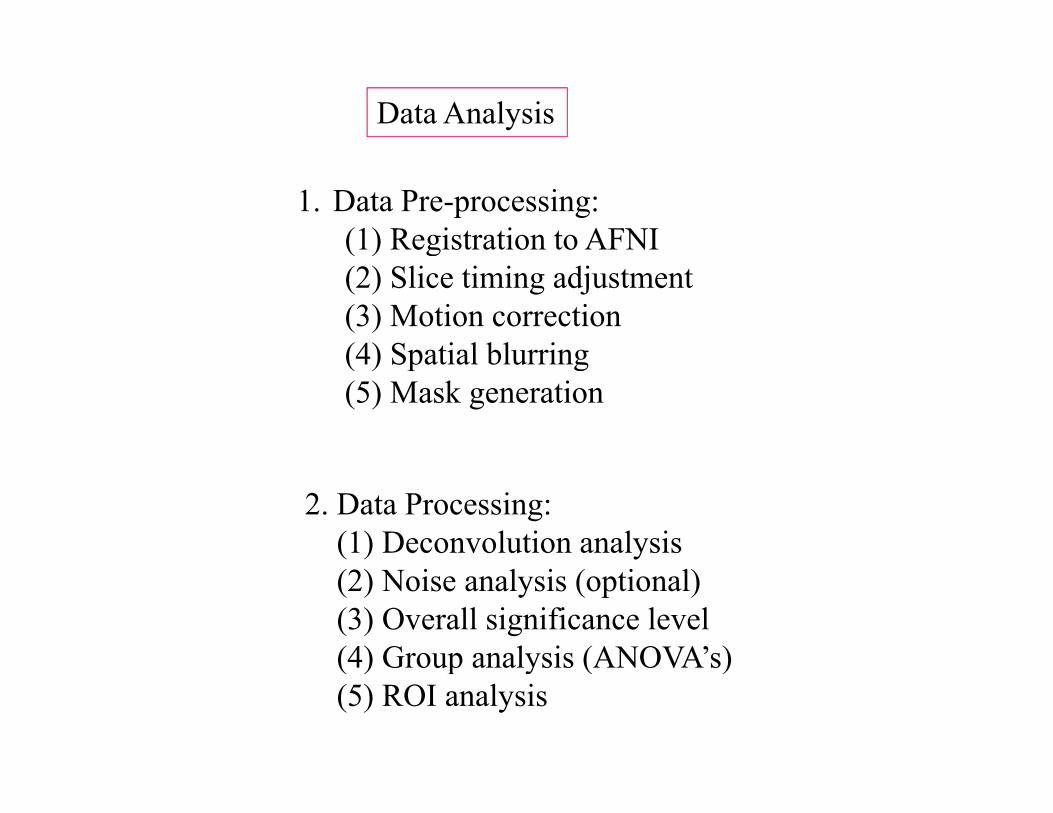
Data Analysis
1. Data Pre-processing:(1) Registration to AFNI( ) g(2) Slice timing adjustment(3) Motion correction(4) Spatial blurring(4) Spatial blurring(5) Mask generation
2. Data Processing:(1) Deconvolution analysis(2) Noise analysis (optional)(3) Overall significance level(4) Group analysis (ANOVA’s)(4) Group analysis (ANOVA s)(5) ROI analysis
Block Design Hand-On
• Scripts to generate a block-design experiment
• Run the script to do the data analysis
E l i h i• Explain the scripts.

Designrandomize.screateWave.s
TS1_analy.1D, TS2_analy .1D, TS3_analy.1D, TS4_analy.1D
indoor_TSall_wave.1Doutdoor_TSall_wave.1D
face TSall wave 1Dface_TSall_wave.1D concat.1D
E-Prime Programming
register s: register many image files to AFNI formatCollect Data register.s: register many image files to AFNI format.3dTshift: slice timing adjustment3dvolreg: motion correction3dTcat: concatenate all fMRI data together3dmerge: spatial blurring
analyze_ts_blur4fwhm_group1.s3dmerge: spatial blurringmask generation: identify brain region with 3dcalc or 3dAutomaskLink design matrix (*_TSall_wave.1D, concat.1D)3dDeconvolve (deconv2.s): Compare fMRI image data with design matrix
decon_Scene_Face_motion (the “bucket”)
PerSigChan.s: calculate % signal change
group_ANOVA2.s: group analysis from all subjects
MonteCarlo moreIterfwhm4 s l (3d l d 3d ) l l iMonteCarlo_moreIterfwhm4.s (AlphaSim)
gen_cluster.s (3dclust and 3dmerge): cluster analysis
Final results