Embed Size (px)
Citation preview

Available online at www.sciencedirect.com
www.elsevier.com/locate/brainres
b r a i n r e s e a r c h 1 5 5 7 ( 2 0 1 4 ) 1 4 1 – 1 5 4
http://dx.doi.org/100006-8993 & 2014 El
nCorresponding aFrauenklinikstrasse
E-mail [email protected]
Research Report
fNIRS derived hemodynamic signalsand electrodermal responses in a sequentialrisk-taking task
Lisa Holpera,b,n, Robert H.W. ten Brinckeb, Martin Wolfa, Ryan O. Murphyb
aBiomedical Optics Research Laboratory (BORL), Division of Neonatology, University Hospital Zürich,Frauenklinikstrasse 10, 8091 Zürich, SwitzerlandbChair of Decision Theory and Behavioral Game Theory, Department of Humanities, Social and Political Sciences,ETH Zurich, Clausiusstrasse 50, 8092 Zürich, Switzerland
a r t i c l e i n f o
Article history:
Accepted 5 February 2014
The study measured cortical hemodynamic signals and peripheral correlates of decision
makers during a dynamic risky task, the Just One More task (JOM), in which the risky decision
Available online 12 February 2014
Keywords:
Dynamic decision-making
Risk-taking
Risk attitude
fNIRS
Electrodermal response
.1016/j.brainres.2014.02.01sevier B.V. All rights rese
uthor at: University Ho10, 8091 Zürich, Switzer
: [email protected](M. Wolf), rmurphy@eth
a b s t r a c t
entails choosing whether to incrementally increase accumulated earnings at the risk of ruin
(going bust ending up with nothing). Twenty subjects participated in multiple instantiations of
this task in which the probability of ruin and size of the stakes varied. Physiological correlates
were simultaneously quantified by functional near-infrared spectroscopy (fNIRS) over dorso-
lateral prefrontal cortex (DLPFC) and electrodermal activity (EDA). First, in the task decision
phase (i.e., when subjects are contemplating options before making a choice) probability of ruin
had a dissociating effect on fNIRS and EDA. fNIRS derived DLPFC hemodynamic signals
reflected a subjective value signal, correlating positively with individual risk attitude. Contrary,
EDA reflected the probability of ruin in terms of a common affective measure, irrespective of
individuals' risk attitude. Second, during the task outcome phase (i.e., the time after subjects
have made a choice and observed the outcomes) fNIRS and EDA revealed opposite patterns.
While fNIRS derived DLPFC hemodynamic signals were larger in response to gains, EDA
signals were larger in response to losses; both patterns were statistically independent of
individual risk attitude. Lastly, fNIRS derived DLPFC hemodynamic signals in the decision
phase correlated positively with the mean round earnings, providing a measure of the quality
of the individual decision-making performance. Together with the positive correlation with
individual risk attitude, our findings indicate that fNIRS signals, but not EDA, could be taken as
a useful method for studying individual risk attitude and task performance in dynamic risky
decision-making.
& 2014 Elsevier B.V. All rights reserved.
3rved.
spital Zurich, Biomedical Optics Research Laboratory (BORL), Division of Neonatology,land. Fax: þ41 44 255 44 42.(L. Holper), [email protected] (R.H.W. ten Brincke),z.ch (R.O. Murphy).

b r a i n r e s e a r c h 1 5 5 7 ( 2 0 1 4 ) 1 4 1 – 1 5 4142
1. Introduction
It is often necessary to make decisions under irreducible risk.In these contexts, decisions are driven by the subjective valueof choice options and their respective probabilities. However,there are substantial individual differences in risk attitudesand these preferences affect the attractiveness of differentchoice options to different individuals. Understanding indi-vidual attitudes towards risk, and the corresponding physio-logical mechanisms, is therefore intimately linked to the aimof understanding decision behavior in risky contexts.
1.1. Just One More task (JOM)
In this study we applied a dynamic risk-taking problem, theJust One More task (JOM), recently introduced by Murphy andten Brincke (2014). The JOM represents an optimal stoppingproblem played against nature. In the decision phase adecision-maker (DM) may draw one ball at a time from arandomized metaphorical urn. The virtual urn contains goodballs and bad balls in a known distribution (the probability ofa bad draw, referred to as the probability of ruin or of going bust,is either 0.1 or 0.2); draws are made with replacement so theprobability of good and bad outcomes is constant throughoutthe round. A good draw adds a point value (the value of a gooddraw is either 1 or 3 and remains constant throughout theround) to the DM's accumulated total points, while a bad drawterminates the round and results in the DM losing all of theaccumulated points for that particular round and thus earn-ing nothing. The DM must choose when to stop makingdraws and bank the accumulated points, thus securing themas real earnings (there is a known exchange rate betweenpoints and pecuniary results, and we presume that the DM ismotivated to earn money, more being better than less).A round is terminated by either a voluntary stop or a baddraw. Each decision phase is followed by an outcome phaseduring which feedback about the round (e.g., realized payoffs)is provided. The core of this problem for the DM is choosingwhen to stop making draws for incremental potentialimprovements and thus “walk away” and in doing so secureearnings. When this task is repeated over multiple rounds,the distribution of good/bad balls, and the number of pointsearned per good draw (or the exchange rate from bankedpoints to real payoffs), can be adjusted to systematicallyexplore the effects of value and risk (as defined here as theprobability of ruin) on choice preferences. The JOM task is auseful tool for studying risk-taking behavior, especially forunderstanding how people make choices where there are lowprobability but high consequence negative events.
The JOM task is similar to other established risk-takingdecision tasks such as the Devil's Task (Slovic, 1966), theBalloon Analog Risk Task (Lejuez et al., 2002), the Angling RiskTask (Pleskac, 2008), and the Columbia Card Task (Figneret al., 2009). In all of these decision tasks, a DMs' risk-takingpreferences are assessed by observing voluntary stoppingpoints in a series of risky choices. However, compared tothese previous dynamic tasks, and other non-dynamic risk-taking tasks as well, such as the Iowa Gambling Task(Bechara et al., 1994), the Cambridge Gambling Task (Rogers
et al., 1999), the Cups Task (Levin and Hart, 2003) or the Gameof Dice Task (Brand et al., 2005), the JOM task has advantagesas a research tool. First, whereas several of the above-mentioned tasks involve incrementally increasingly riskychoices over time (i.e., draws without replacement resultingin changes in probabilities within one round), the JOM has theadvantage that the probability of ruin remains at a constantlevel throughout a round. Thus the task is less cognitivelydemanding than other procedures where both values andprobabilities are changing simultaneously. Second, the JOMfacilitates computing a parameterizable index for the assess-ment of an individual's risk attitude. This is not possible forother common decision tasks that operate under uncertainty(e.g., the Iowa Gambling Task or the Balloon Analog Task)rather than risk. The well-specified structure of the JOM tasktherefore allows researchers to draw more precise conclu-sions about a DM's behavior and preferences than otherdecision tasks that have ambiguous features.
1.2. Measures of cortical hemodynamic and peripheraldecision correlates
Decision-making under risk is theorized to require two gen-eral physiological systems: cortical and peripheral decisionsystems (Bechara and Damasio, 2005; Critchley, 2009). Exist-ing studies employed either neuroimaging methods as ameasure of the brain's hemodynamic correlates or electro-dermal activity (EDA) as a measure of the skin's affectivecorrelates. For isolating the effects of both systems, it hasbeen useful to distinguish between two separate phases of aperson's experience: the decision processes (the activitiesduring the time leading up to the choice behavior) and theoutcome processes (the activities after the choice behaviorwhen outcomes and payoffs are realized).
1.2.1. Neuroimaging as measure of cortical hemodynamicdecision-making correlatesDuring decision processing, neuroimaging methods, such asfunctional magnetic resonance imaging (fMRI), have identifiedthe role of prefrontal areas (such as the dorsolateral, lateral andventromedial prefrontal cortex, orbitofrontal and the anteriorcingulate cortex) and subcortical areas (such as the striatumand the amygdala) in encoding the two main components of asubjective value signal, i.e., its risk probability and expectedvalue (Fukunaga et al., 2012; Li et al., 2010; Lighthall et al., 2012;Rao et al., 2008; Schonberg et al., 2012). Typically, increasingblood-oxygen-level-dependent (BOLD) signals in these areasencode risk with respect to uncertainty, variance, or volatility(Huettel et al., 2006, 2005; Knutson et al., 2005; Preuschoff et al.,2006; Tobler et al., 2007) and encode expected value with respectto magnitude, probability, and their combination (Knutsonet al., 2005; Preuschoff et al., 2006; Tobler et al., 2007).In particular, the lateral prefrontal cortex has been shown tointegrate these two components into one signal that covarieswith individual risk attitude (Tobler et al., 2009). In the absenceof risk, hemodynamic responses in these areas increase withincreasing value. The presence of risky options enhances theseresponses in risk-seeking individuals, but reduces them in risk-averse individuals. The interplay between risk and expectedvalue can therefore be considered to be linked to lateral
b r a i n r e s e a r c h 1 5 5 7 ( 2 0 1 4 ) 1 4 1 – 1 5 4 143
prefrontal cortex activity, which allows an additional means ofassessing individual's risk attitudes.
During outcome processing, clusters located in traditionalreward-related brain areas such as the striatum and thala-mus, along with activation in prefrontal areas, are especiallytargeted during the experience of gains and losses (Breiteret al., 2001; Cazzell et al., 2012; Delgado et al., 2000; Lawrenceet al., 2009; Lin et al., 2008; Rogers et al., 2004). Comparison ofBOLD responses to gains vs. losses revealed that this networktypically responds with greater activity to gains than tolosses. Together, these findings on the decision and outcomeprocessing suggest that cortical hemodynamic responsesprovide a subjective value signal in terms of how humansexperience risky decisions.
1.2.2. Electrodermal activity as a measure of peripheraldecision-making correlatesContrary to the hemodynamic response reflecting a subjectivevalue signal, the physiological system underlying EDA derivedskin conductance responses (SCRs) reflects a more commonaffective signal (Fowles, 1986) with regard to the underlyingaffective response. EDA is a well-establishedmethod in decisionresearch that offers a psychophysiological process-tracing tech-nique of affective reactivity (Boucsein, 1992; Critchley et al.,2000; Figner and Murphy, 2010). Previous studies using EDAevaluating decision processing with respect to expected valueand/or outcome variance showed that SCRs can reflect both ofthese factors. Both increasing expected value (Glöckner et al.,2012; Yen et al., 2012) and increasing variance in outcomes(Bechara et al., 1999; Studer and Clark, 2011; Yen et al., 2012)trigger enhanced SCRs. During outcome processing, results ofthe psychophysiological responses to gains and losses hasfurthermore shown that reward-related SCRs are modulatedby the valence of outcomes (Bechara et al., 1999; Crone et al.,2004; Liao et al., 2009; Starcke et al., 2009; Tchanturia et al., 2007;Wilkes et al., 2010) and the magnitude of outcomes (Crone et al.,2004; Wilkes et al., 2010). However, in contrast to hemodynamicsignals, reward-related SCRs typically show larger responses toincreasing magnitude of losses compared to gains. Theseresults show that EDA can provide both useful and comple-mentary method to neuroimaging techniques in studying riskychoice.
1.3. Aims and hypotheses of the present study
The majority of existing studies has investigated risk-takingbehavior by focusing either on the cortical hemodynamic orthe peripheral decision-making correlates independently.However, simultaneous measures evaluating the interplaybetween the two underlying systems can provide additionallayers of information about reliable and valid ways to quan-tify individual risk attitudes. The present study thereforeexpands previous studies, first, by using a well-structuredrisk-taking context (e.g., the JOM task) to assess individualinformation-use and risk-taking behavior, and second, byassessing both the cortical hemodynamic signals and theperipheral decision-making correlates during and after choicebehavior. For quantification of these decision correlates weapplied functional near-infrared spectroscopy (fNIRS) andEDA. Based on previous findings, we hypothesized that (1)
fNIRS and EDA signal patterns would reflect the corticalhemodynamic and peripheral characteristics of the JOM taskboth in the decision phase (responses to the probability of ruinand to the draw value) and the outcome phase (responses togains and losses of potential earnings) and that (2) fNIRS, butnot EDA, would provide a suitable method for quantifyingindividual risk attitude as previously shown for fMRI. Takentogether, combining this methodological approach, wehypothesized that the cortical hemodynamic and peripheralcorrelates could provide both distinct effects (i.e., based onfNIRS vs. EDA signals) and risk attitude-specific information(i.e., based on fNIRS signals) of the underlying risk-takingbehavior.
2. Results
2.1. Risk attitude analysis
Risk attitudes describe the alternative preferences peoplehave when faced with quantified uncertainty, like risk-averse,risk-seeking or risk-neutral. To express the risk attitude for anindividual subject as a single value, we assumed a utilityfunction for money of the form u(x)¼xα and estimated thebest fitting parameter of risk attitude α. We did so byminimizing the mean squared error between the subject'sactual voluntary stopping points in the JOM task and thestopping points predicted by the utility function given aparticular value α. Because this experimental task yields cen-sored data, we selected only those rounds for the estimationprocedure when subjects stopped voluntarily. For example,consider the instance of a subject going bust after the seconddraw; this observation contains little useful information regard-ing that subject's risk preferences. Observations were thereforecorrected for the probability of reaching a particular number ofdraws. To see why this correction is used, consider a casewhere a subject intends to stop after 5 draws half of all roundsand after 7 draws for the other half of rounds. More results (e.g.,voluntary stops) are likely to remain after 5 draws than after 7draws, simply because the probability of reaching 5 draws islarger than reaching 7 draws, hence the uncorrected estimatedaverage stopping intention would be below 6 instead of theunbiased and proper estimate of 6 draws.
The resulting α served as an index for an individualsubject's risk preference, derived from their choices in theJOM. Subjects with an index value greater than 1 were definedas risk-seeking and those with an index value smaller than 1as risk-averse. Those with a JOM-index α of exactly 1 wouldbe defined as risk-neutral and would make choices thatmaximized expected value. The normative solution for theJOM task (i.e., the number of draws a risk-neutral individualwho maximizes expected payoff would take) corresponds tousing a draws threshold of p/(1�p), where p is the probabilityof a good draw. The normative result is independent of thevalue of a good draw, and generalizes across different valuesof α. In other words, in the JOM, subjects should attend to theprobability of ruin and disregard information about the value ofthe draws when deciding when to stop making draws. This isa notable feature of the JOM task that many other decisionresearch contexts do not share.

Fig. 1 – Just One More task (JOM): the screenshot of the JOM illustrates the end after 40 rounds. Decision phase: shown are thetask status and task information describing the current progress throughout the task in terms of rounds and draws, but alsoprovide key information regarding the task, such as the probabilities (risk) of drawing a Good Draw and a Bad Draw with thegain amount of an individual Good Draw (Draw value (DV)). Outcome phase: Shown are the round results (payoffs) on a 20 unitscale, with either the amount of Good Draws (GAIN¼green) and Bad Draws (BUST¼red).
Fig. 2 – Risk attitude analysis: Illustration of individual risk attitude as represented by the JOM-index α. Based on this index(cut-off point¼1) we identified only risk-averse. (A) Subjects are ordered according to the JOM-index value. (B) Histogram ofthe JOM-index values. (C) Mean round results for each individual JOM-index α, when considering only for voluntary stops.This plot shows a significant positive correlation (r¼0.743, pr0.001) indicating that the more risk-averse subjects were thesmaller their mean round results were on average.
b r a i n r e s e a r c h 1 5 5 7 ( 2 0 1 4 ) 1 4 1 – 1 5 4144
Averaged over all subjects the JOM-index α (risk attitude)was 0.54370.112 (mean7standard deviation). Based on thisindex we observed only risk-averse individuals in our sample(n¼20; 100%) (Fig. 2(A and B)). In addition, Fig. 2(C) shows themean round results for each individual JOM-index α, whenconsidering only voluntary stops. This plot indicates that themore risk-averse subjects were, the smaller their mean roundresults were on average, as indicated by the significantpositive correlation (r¼0.743, pr0.001).
2.2. fNIRS and EDA data
For analysis of fNIRS and EDA, mean total hemoglobinconcentration (Δ[tHb]) and SCR values were calculated persubject as dependent variables. Statistical significance wasassessed using linear regression for the decision phase withthe factors probability of ruin (PR) (LOW PR (0.1) vs. HIGH PR(0.2)) and draw value (DV) (LOW DV (1) vs. HIGH DV (3)) and forthe outcome phase using the factor payoff (BUST vs. GAIN).
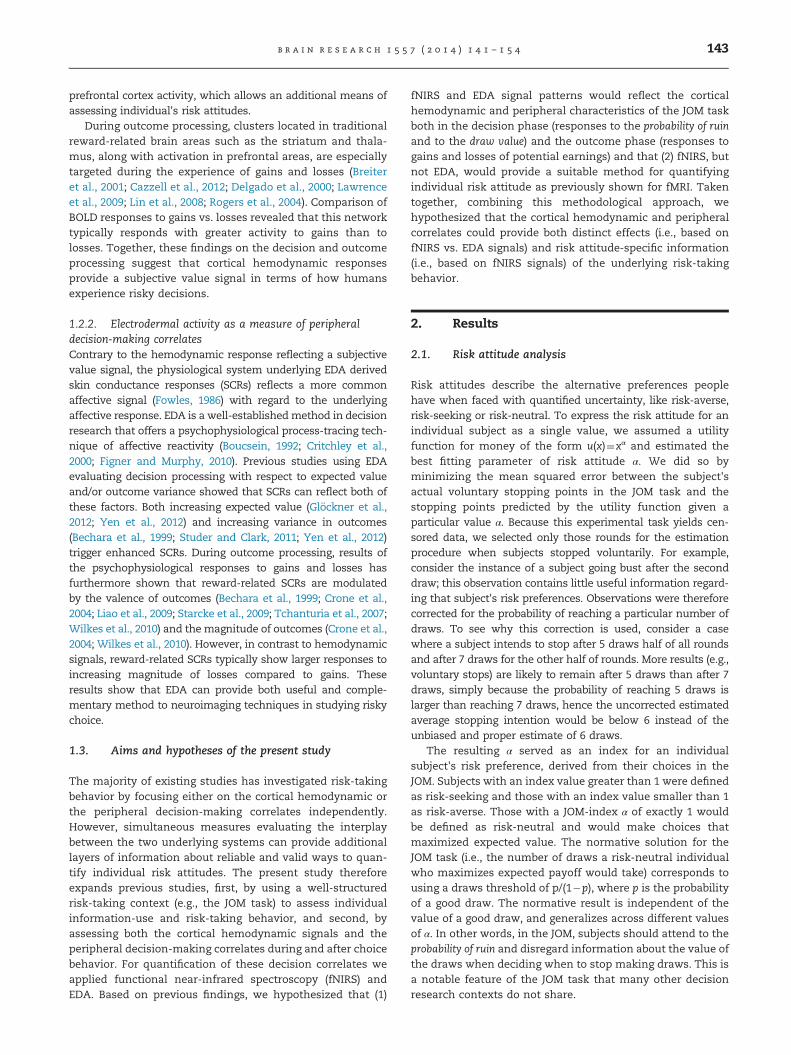
Fig. 3 illustrates the averaged time courses of fNIRS deriveddorsolateral prefrontal cortex (DLPFC) hemodynamic signalsand EDA responses of two sample subjects demonstratingboth the decision and the outcome phases. In particular, the
fNIRS responses show that subjects differed in signal ampli-tude when confronted with risky options. Using linear regres-sion we then performed a comparison of the mean Δ[tHb] andSCRs by considering both the decision and the outcomephases (Fig. 4; Table 1).
2.2.1. Decision phaseWith respect to the factor probability of ruin, fNIRS signalsshowed no significant differences of Δ[tHb] hemodynamicresponses between low probability of ruin vs. high probability ofruin settings. In contrast, EDA data revealed significantlylarger SCRs in response to high probability of ruin settings ascompared low probability of ruin settings. With respect to thefactor draw value, fNIRS data showed no significant differentΔ[tHb] hemodynamic responses in low draw value vs. highdraw value situations. In contrast, EDA data revealed signifi-cantly larger SCRs on average in the high draw value setting.
2.2.2. Outcome phaseSecuring a positive payoff by voluntarily stopping showed asignificant effect on both fNIRS signals and EDA data. fNIRSrevealed significantly smaller Δ[tHb] responses to going bustas compared to gains; in contrast, the opposite pattern was
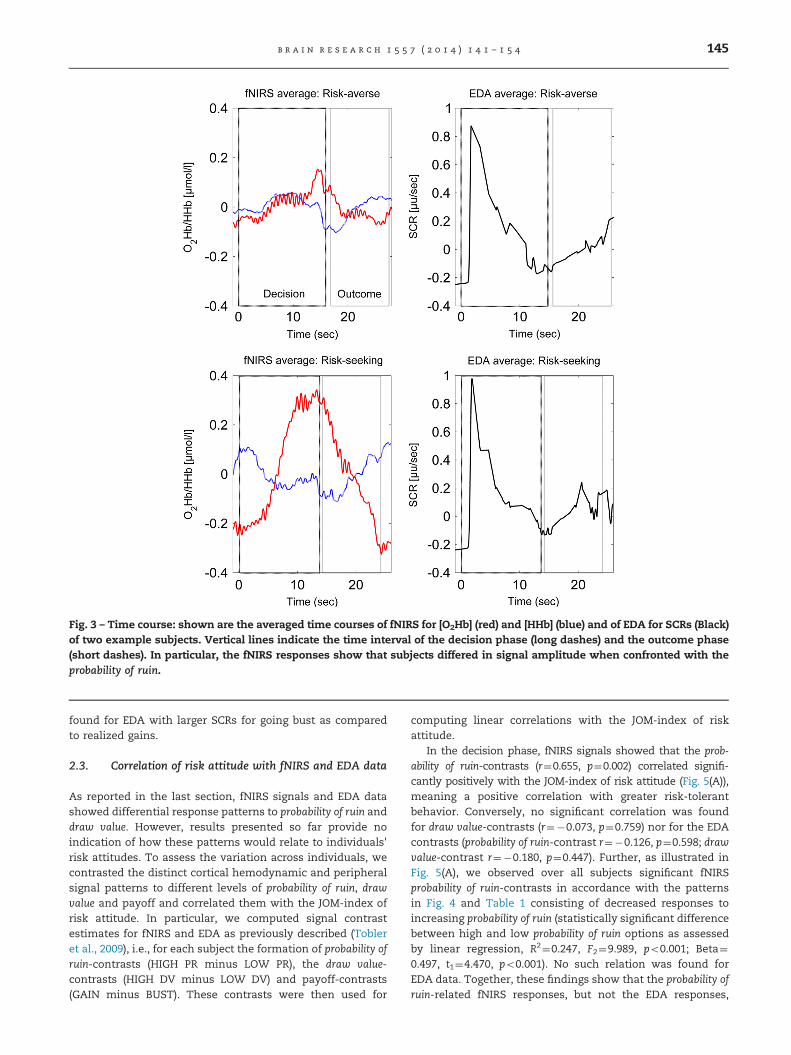
Fig. 3 – Time course: shown are the averaged time courses of fNIRS for [O2Hb] (red) and [HHb] (blue) and of EDA for SCRs (Black)of two example subjects. Vertical lines indicate the time interval of the decision phase (long dashes) and the outcome phase(short dashes). In particular, the fNIRS responses show that subjects differed in signal amplitude when confronted with theprobability of ruin.
b r a i n r e s e a r c h 1 5 5 7 ( 2 0 1 4 ) 1 4 1 – 1 5 4 145
found for EDA with larger SCRs for going bust as comparedto realized gains.
2.3. Correlation of risk attitude with fNIRS and EDA data
As reported in the last section, fNIRS signals and EDA datashowed differential response patterns to probability of ruin anddraw value. However, results presented so far provide noindication of how these patterns would relate to individuals'risk attitudes. To assess the variation across individuals, wecontrasted the distinct cortical hemodynamic and peripheralsignal patterns to different levels of probability of ruin, drawvalue and payoff and correlated them with the JOM-index ofrisk attitude. In particular, we computed signal contrastestimates for fNIRS and EDA as previously described (Tobleret al., 2009), i.e., for each subject the formation of probability ofruin-contrasts (HIGH PR minus LOW PR), the draw value-contrasts (HIGH DV minus LOW DV) and payoff-contrasts(GAIN minus BUST). These contrasts were then used for
computing linear correlations with the JOM-index of riskattitude.
In the decision phase, fNIRS signals showed that the prob-ability of ruin-contrasts (r¼0.655, p¼0.002) correlated signifi-cantly positively with the JOM-index of risk attitude (Fig. 5(A)),meaning a positive correlation with greater risk-tolerantbehavior. Conversely, no significant correlation was foundfor draw value-contrasts (r¼�0.073, p¼0.759) nor for the EDAcontrasts (probability of ruin-contrast r¼�0.126, p¼0.598; drawvalue-contrast r¼�0.180, p¼0.447). Further, as illustrated inFig. 5(A), we observed over all subjects significant fNIRSprobability of ruin-contrasts in accordance with the patternsin Fig. 4 and Table 1 consisting of decreased responses toincreasing probability of ruin (statistically significant differencebetween high and low probability of ruin options as assessedby linear regression, R2¼0.247, F2¼9.989, po0.001; Beta¼0.497, t1¼4.470, po0.001). No such relation was found forEDA data. Together, these findings show that the probability ofruin-related fNIRS responses, but not the EDA responses,
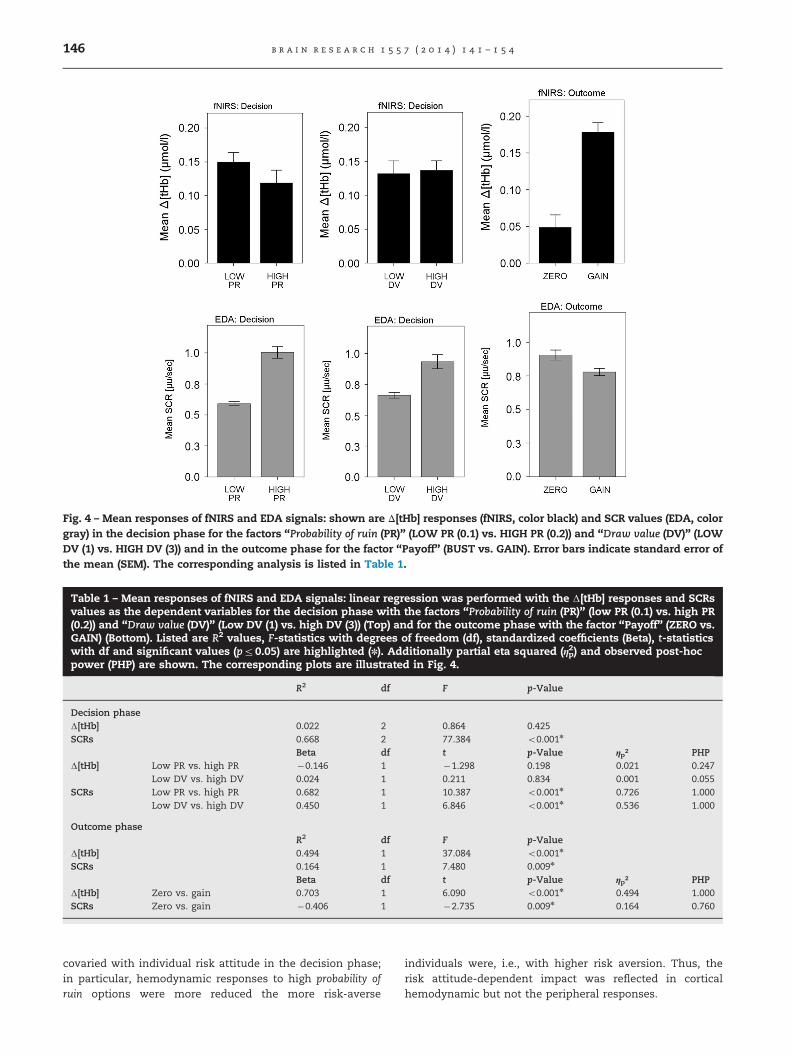
Fig. 4 – Mean responses of fNIRS and EDA signals: shown are Δ[tHb] responses (fNIRS, color black) and SCR values (EDA, colorgray) in the decision phase for the factors “Probability of ruin (PR)” (LOW PR (0.1) vs. HIGH PR (0.2)) and “Draw value (DV)” (LOWDV (1) vs. HIGH DV (3)) and in the outcome phase for the factor “Payoff” (BUST vs. GAIN). Error bars indicate standard error ofthe mean (SEM). The corresponding analysis is listed in Table 1.
Table 1 – Mean responses of fNIRS and EDA signals: linear regression was performed with the Δ[tHb] responses and SCRsvalues as the dependent variables for the decision phase with the factors “Probability of ruin (PR)” (low PR (0.1) vs. high PR(0.2)) and “Draw value (DV)” (Low DV (1) vs. high DV (3)) (Top) and for the outcome phase with the factor “Payoff” (ZERO vs.GAIN) (Bottom). Listed are R2 values, F-statistics with degrees of freedom (df), standardized coefficients (Beta), t-statisticswith df and significant values (pr0.05) are highlighted (n). Additionally partial eta squared (ηp2) and observed post-hocpower (PHP) are shown. The corresponding plots are illustrated in Fig. 4.
R2 df F p-Value
Decision phaseΔ[tHb] 0.022 2 0.864 0.425SCRs 0.668 2 77.384 o0.001n
Beta df t p-Value ηp² PHPΔ[tHb] Low PR vs. high PR �0.146 1 �1.298 0.198 0.021 0.247
Low DV vs. high DV 0.024 1 0.211 0.834 0.001 0.055SCRs Low PR vs. high PR 0.682 1 10.387 o0.001n 0.726 1.000
Low DV vs. high DV 0.450 1 6.846 o0.001n 0.536 1.000
Outcome phaseR2 df F p-Value
Δ[tHb] 0.494 1 37.084 o0.001n
SCRs 0.164 1 7.480 0.009n
Beta df t p-Value ηp² PHPΔ[tHb] Zero vs. gain 0.703 1 6.090 o0.001n 0.494 1.000SCRs Zero vs. gain �0.406 1 �2.735 0.009n 0.164 0.760
b r a i n r e s e a r c h 1 5 5 7 ( 2 0 1 4 ) 1 4 1 – 1 5 4146
covaried with individual risk attitude in the decision phase;in particular, hemodynamic responses to high probability ofruin options were more reduced the more risk-averse
individuals were, i.e., with higher risk aversion. Thus, therisk attitude-dependent impact was reflected in corticalhemodynamic but not the peripheral responses.
Fig. 5 – (A) Correlation with risk attitude (decision phase): plots show the correlation between the JOM-index of individual riskattitude and the signal contrasts for Δ[tHb] and SCRs (probability of ruin (PR)-contrasts (blue squares) and draw value (DV)-contrasts (black circles)). This indicated that increasing probability of ruin reduced fNIRS activity significantly the more risk-averse subjects were; conversely, no such effect emerged for EDA and the processing of draw value was also not affected byrisk attitude. (B) Correlation with risk attitude (outcome phase): no significant correlation with individual risk attitude wasfound for payoff-contrasts (gray circles). (C) Correlation with round results (decision phase): plots show the correlationbetween the individual mean round results and the signal contrasts for Δ[tHb] and SCRs (PR-contrasts (blue squares) and DV-contrasts (black circles)). This indicated that increasing probability of ruin was associated with significantly increased fNIRSactivity the higher the round results were; conversely, no such effect emerged for EDA and the processing of draw value wasnot affected by round results. In all plots significant correlations are highlighted with a square.
b r a i n r e s e a r c h 1 5 5 7 ( 2 0 1 4 ) 1 4 1 – 1 5 4 147
b r a i n r e s e a r c h 1 5 5 7 ( 2 0 1 4 ) 1 4 1 – 1 5 4148
In the outcome phase, no significant correlations werefound for the payoff-contrasts of fNIRS (r¼�0.267, p¼0.255)or EDA (r¼�0.284, p¼0.225). Further, as illustrated in Fig. 5(B),we observed over all subjects significant fNIRS payoff-contrasts (statistical significant difference between gainsand losses as assessed by linear regression, R2¼0.602,F1¼45.439, po0.001; Beta¼0.776, t1¼6.741, po0.001). No suchrelation was found for EDA data.
2.4. Correlation of round results with fNIRS and EDA data
Lastly, in order to investigate the relationship betweenbehavioral performance and the cortical hemodynamic andperipheral data, we calculated the mean earnings of allrounds, when considering only voluntary stops. These para-meters were then applied for computing linear correlationswith the signal contrast estimates for fNIRS and EDA asdescribed above.
In addition to the positive correlation with risk attitude inthe decision phase, fNIRS signals showed that the probability ofruin-contrasts correlated significantly positively with the meanearnings of the rounds results (r¼0.751, pr0.001), when con-sidering only those rounds where subjects stopped voluntarily(Fig. 5(C)). This indicated that fNIRS signals were larger thegreater the round results were. There were no significantcorrelations between the round results and the draw value-contrasts (r¼�0.160, p¼0.500) nor for the EDA contrasts (prob-ability of ruin-contrasts r¼�0.055, p¼0.817; draw value-contrastsr¼�0.054, p¼0.821). Together with the positive correlationobserved for risk attitude this indicated that those subjectswho were more risk-neutral later obtained larger mean earn-ings and this was associated with greater fNIRS signals. Nosignificant correlation was found for EDA data.
3. Discussion
We have presented behavioral, cortical hemodynamic andperipheral affective correlates of a dynamic risk-taking task,the Just One More task (JOM). Our experiment was motivated bythe hypotheses (1) that fNIRS derived DLPFC hemodynamicsignals and EDA would provide a characterization of the corticalhemodynamic and peripheral correlates in both the decisionand outcome phase of the JOM and (2) that fNIRS derived DLPFChemodynamic signals, but not EDA signals, can be used toquantify individuals' risk attitudes. Both hypotheses wereaccepted indicating that, based on the JOM-index as a suitabletool for assessing individual risk attitudes in a dynamic task,fNIRS provides a suitable quantification of the hemodynamiccorrelates of individual risk attitude.
Our results could be of relevance for future develop-ment of physiological measures of decision-making in riskycontexts. fNIRS in conjunction with EDA could potentiallymeasure the quality of the decision-making processes, inparticular in cases where task performance cannot be easilyjudged or determined. Physiological measures could measurewhether risks are taken seriously and whether subjects aresensitive to particular attributes of a given decision problemthat are relevant for good decision-making. In the future,decision quality may therefore be informed by physiological
results that could serve as an approximation of how well aDM is doing or what is sensible behavior in a given context.Such physiological profiles of good decision-making would beespecially useful in applied settings where performancecannot be assessed directly, such as driving behavior(Jonah, 1997; Palamara et al., 2012), health behavior (Cookand Bellis, 2001; Vollrath et al., 1999), or mental illnesses(Cerimele and Katon, 2013).
3.1. Risk attitude analysis
To assess individual risk attitude we computed the JOM-index α, a metric of individual risk preferences. A small indexα, i.e., not risking enough by risk-averse subjects, can result inreduced earnings, whereas a high index, i.e., more risk-takingfrom more risk-tolerant subjects, can lead to going bust quiteoften. Based on this index we observed only risk-averseindividuals (Fig. 2(A)) in this particular context, but thereare clear individual differences in the degree of risk-tolerancewhen the α index is used as a continuous variable. Thedistribution of subjects' preferences is consistent with pre-vious studies that also reported the majority of people arerisk-averse (Christopoulos et al., 2009; Mohr et al., 2010;Tobler et al., 2009).
3.2. fNIRS and EDA data
Regarding our first and second hypotheses, the followingsections discuss the comparisons of the effects of the prob-ability of ruin and draw value in the decision phase, followed bythe effects of payoff in the outcome phase; in each case firstaddressing fNIRS derived Δ[tHb] responses followed by EDAderived SCR signals.
3.2.1. Relation of risk attitude with fNIRS and EDA data3.2.1.1. Effects of probability of ruin. Analysis of the factorprobability of ruin showed that hemodynamic responsesreflected a subjective value signal, represented by reducedresponses to the probability of ruin the more risk-averse subjectswere (Fig. 4, Table 1). This pattern correlated significantlypositively with the JOM-index, indicating that probability ofruin-related fNIRS hemodynamic responses reflect individual'srisk attitude (Fig. 5(A)). The significant positive correlationtherefore relates to the missing main effect of the factorprobability of ruin. In particular, the more risk-averse subjectswere, the smaller was the fNIRS probability of ruin-contrast asillustrated in Fig. 5(A), and vice versa, the more subjects tendedtowards the risk-neutral spectrum of the JOM-index the greaterwas the probability of ruin-contrast. In this sense, we found thatoverall subjects elicited a typical risk-averse response pattern(small fNIRS probability of ruin-contrasts; statistically significantdifference between high and low probability of ruin options).These findings are generally supported by neuroimaging (Ernstet al., 2002; Schonberg et al., 2012) reporting the involvement oflateral prefrontal cortices in risky decision-making behaviors,by brain-stimulation studies (Fecteau et al., 2007; Knoch et al.,2006) reporting that stimulation of lateral prefrontal regionsalters risk attitudes and by studies in primates (Barracloughet al., 2004; Kobayashi et al., 2002; Pan et al., 2008) reporting thatsingle lateral prefrontal neurons use reward information to
b r a i n r e s e a r c h 1 5 5 7 ( 2 0 1 4 ) 1 4 1 – 1 5 4 149
encode reward-based stimulus. More particular, these resultsare in line with a previous fMRI study (Tobler et al., 2009)reporting that BOLD activity in the lateral prefrontal cortexencodes a risk attitude-dependent subjective value signal, withreduced responses to risk in risk-averse but increasedresponses in risk-seeking subjects.From a psychological point of view, interpretation of thehemodynamic response patterns could be based on the typicalcharacteristics distinguishing risk perception between risk-averse vs. risk-seeking individuals. Typically, risk-averse indi-viduals are less comfortable with risks and therefore assignlower subjective value to taking on additional risk (more drawsin the JOM) given the non-zero probability of ruin. Risk-averseindividuals might therefore perceive escalating risk-taking asexposure to increasing possible losses, rather than exposure tothe increasing potential total gain associated with additionaldraws (Schonberg et al., 2012). In contrast, subjects tendingtowards risk-seeking behavior typically see risks as challengesand thus feel excited when dealing with them; they thereforeassign a relatively higher subjective value to high probability ofruin options. During escalating risk-taking they might thereforeperceive the exposure to increasing possible gains as stimulat-ing rather than focus on the potential lost value associated withthe higher risk. Thus, the perception of potential losses vs.gains in risk-averse vs. risk-seeking subjects (which typicallyleads to decreased vs. increased neural activity, see Section3.2.1.3) may therefore have been the primary trigger contribut-ing to the observed decreased vs. increased hemodynamicresponses. Together, the present data demonstrate that thebehavioral analysis of individual risk attitude in relation toindividual probability of ruin-related hemodynamic responsepatterns is not only viable, but can elucidate basic mechanismsof risk-taking behavior.In contrast to the fNIRS responses, the factor probability ofruin elicited a different EDA pattern with SCRs magnitudesbeing larger in response to high- than low-risk options. Thisindicates that EDA reflects levels of risk, but does so irre-spective of individual risk attitude (Fig. 4; Table 1), which issupported by the missing correlation with individual riskattitude (Fig. 5(A)). We therefore suggest that on the periph-eral affective level all subjects of the risk attitude spectrumexperience risk similarly. This is reasonable since, contrary tohemodynamic responses reflecting the subjective value, thephysiological components of SCRs are expressed based on thesame functional origin of the skin's eccrine activity in bothsubject groups, i.e., reflecting a common affective responsesignal (Fowles, 1986). This is in line with the well-establishednotion that SCRs covary with the sympathetic arousal dimen-sion of affect, indexing its affective intensity (Figner andMurphy, 2010). However, the subjective aspects of affect, suchas its valence (e.g., positive vs. negative experience) or whichemotion is present (e.g., risk aversion vs. risk tolerance) arenot reflected in EDA and therefore require other sources, suchas the fNIRS data in the present study.Taken together, we conclude that common affective aspectsof how individuals respond to risk are reflected in EDA, whilethe subjective value regarding negative or positive experiencetowards risk are reflected in the fNIRS hemodynamicresponse. It should be noted that, although risk inducedsimilar degrees of EDA in all subjects, it is still conceivable
that the nature of the affect (i.e., experiencing fear vs.excitement of risk) differed between them. We thereforesuggest that on the peripheral affective level subjects gen-erally reflect (but not necessarily experience) risk similarly,whereas on the hemodynamic level risk-averse and risk-seeking subjects reflect (and experience) risk in distinct ways.
3.2.1.2. Effects of draw value. Analysis of the factor drawvalue showed no effect on the hemodynamic correlates andno correlation with risk attitude (Fig. 4, Table 1). In contrast,draw value had a significant effect on EDA data. In particular,SCRs were found to be significantly larger in response to highvs. low draw value. This SCR pattern was observed withsimilar intensity in all subjects, indicating that draw value isencoded in the SCRs independent of risk attitude, an assump-tion that was further corroborated by the missing correlationwith individual risk attitude (Fig. 5(A)).In summary, these results indicate that different parts of thehuman nervous system, i.e., the central part as representedby the cortical hemodynamic responses vs. the peripheralpart as represented by the electrodermal responses, respondto different aspects of the risky problem. Taken together, ourdata obtained in the decision phase of the JOM task confirmour first hypothesis by demonstrating that the JOM para-meters can be characterized using fNIRS and EDA. Our dataalso confirm our second hypothesis by demonstrating thatrisk-related fNIRS derived hemodynamic responses, but notEDA derived responses, can be used to quantify individualrisk attitude.
3.2.1.3. Effects of payoffs. Our data obtained in the outcomephase showed that subjects elicited larger fNIRS hemodynamicresponses to gains as compared to going bust. The oppositepattern was observed in EDA data with significant larger SCRsin response to going bust as compared to gains (Fig. 4; Table 1).These results are in line with previous literature from variousrisk-taking tasks reporting that both BOLD activity in prefrontalareas (Bechara et al., 1999; Breiter et al., 2001; Delgado et al.,2000; Lawrence et al., 2009; Lin et al., 2008; Rogers et al., 2004)and EDA responses (Bechara et al., 1999; Crone et al., 2004; Liaoet al., 2009; Starcke et al., 2009; Tchanturia et al., 2007; Wilkeset al., 2010) are especially targeted during the experience ofgains and losses, however, with different response patternsconsisting of larger hemodynamic signals for gains but largerSCRs for losses.From a behavioral point of view, it has been suggested (Tomet al., 2007) that this obviously greater sensitivity of the brainto losses (decreased hemodynamic signals in our case inresponse to going bust) compared with gains may be directlytied to the behavioral concept of loss aversion (Kahnemanand Tversky, 1979), which refers to people's tendency tostrongly prefer avoiding losses to acquiring gains of equalobjective value. Based on this aspect, Tom et al. (2007)showed that BOLD responses reflecting individual risk aver-sion could be attributed to enhanced sensitivity to losses.It should be noted that, in contrast to the study by Tom et al.,the JOM task does not include real losses, only losses ofpotential earnings. However, if we assume that subjects“become accustomed” (i.e., establish a reference point) tothe amount of holdings they have after for example three to
b r a i n r e s e a r c h 1 5 5 7 ( 2 0 1 4 ) 1 4 1 – 1 5 4150
five draws, we could then consider a bad draw as a loss ofvalue (in terms of an updated reference point (Davies, 2006)).Moreover, in the context of loss aversion Tom et al. showedthat the above mentioned neural sensitivity to losses isdiminished in risk-neutral or risk-seeking individuals whoare less loss-averse. Although it is difficult to draw conclu-sions based on our small sample size, the correlation analysismay reflect this lower neural sensitivity (Fig. 5(B)). If thispattern would indeed represent a risk attitude-dependence ofneural sensitivity to losses, then we would have alsoexpected to see a positive correlation with the JOM -indexof risk attitude. However, no significant correlation wasfound; to clarify this aspect further studies are requiredincluding individuals who are more risk-tolerant.Taken together, our data obtained in the outcome phase showthat the JOM sufficiently triggers the underlying reward-relatedphysiological cortical hemodynamic and peripheral systems inorder to be detectable using fNIRS and EDA.
3.2.2. Relation of round results with fNIRS and EDA dataIn addition to the positive correlation with risk attitude, weevaluated whether fNIRS derived DLPFC hemodynamic sig-nals and EDA activity in the decision phase could provide aprediction of the round results in the outcome phase on anindividual subject level. Our data showed that, while EDAdata did not reveal a significant correlation with the roundresults, the fNIRS probability of ruin-contrasts correlated sig-nificantly positively with the mean of the rounds results forvoluntary stops (Fig. 5(C)). This indicated that fNIRS signalsduring the decision phase were larger the greater the roundresults were in the outcome phase. Together with the positivecorrelation of fNIRS with risk attitude (i.e., risk-seeking) (Fig. 5(A)),this finding indicated that subjects who were closer to beingrisk-neutral obtained larger round results and this is asso-ciated with larger fNIRS activity (as shown by the probability ofruin-contrast).
An interpretation of these behavioral and physiologicalfindings might be as follows. Our data may indicate thatbetter JOM performance as measured by the round results isassociated with higher fNIRS activity. Consequently theresults indicate that subjects who were closer to risk-neutral performed slightly better than those who were onthe very low end of the risk attitude spectrum, i.e., very risk-averse subjects. In other words, as to be expected, subjects inthe middle of the continuum of the risk attitude spectrum(i.e., risk-neutral) perform better than those at the extremeends of the continuum (i.e., risk-averse or risk-seeking). Thisinterpretation is consistent with our risk attitude analysis(Section 2.1) suggesting that risk-neutral subjects (definedwith an JOM-index of 1) maximize the expected value, whilemore risk-averse or more risk-seeking subjects would eitherleave “money on the table” or take on higher risks of goingbust, respectively. In this interpretation we therefore indeedexpected fNIRS activity to correlate with task performance.Individual risk preferences are an important factor in deci-sion making performance with risk-neutrality providing gen-erally better objective performance and realized outcomes;this performance may come at an effective cost, however, inthat subjective utility is not concordantly optimized withobjective expectations.
Taken together, these results may indicate that fNIRScould not only provide a measure of risk attitude based onthe JOM, but may also serve as a predicative measure ofindividual JOM task performance. fNIRS activity during thedecision phase could thus be taken as a predictive indicatorwhether individual risk behavior would result in lower orlarger round results in the outcome phase. This conclusionshould certainly be taken with care as our data can onlyprovide evidence for the more risk-averse spectrum of therisk attitude continuum and may not generalize to risk-seeking subjects. Further studies with broader samples willbe needed to close this gap.
3.3. Conclusion
Our findings show the potential of the Just One More task (JOM)as a viable diagnostic measure in the assessment of risk-taking behavior. In comparison with other risk-taking tasks,the JOM task provides the advantages of an internal assess-ment of individual risk attitude by means of the JOM-index.Further, our findings show that fNIRS and EDA are able toreflect the cortical hemodynamic and peripheral correlates ofthe JOM, indicating a dissociating effect of risk on the twounderlying physiological systems. Most importantly, our datademonstrate that fNIRS hemodynamic signals, but not EDAsignals, can be applied as a measure of individual riskattitude and individual task performance. Together, the JOMtask in combination with the neuroscientific methods used inthis study could therefore represent a suitable monitoringtool of individual risk-taking behavior.
4. Experimental procedures
4.1. Subjects
Twenty healthy subjects participated voluntarily in the study. Allsubjects (11 females, mean age (7STD) 28.973.9) were right-handed (mean laterality quotient (LQ7STD)¼84.1711.6) accord-ing to the Edinburgh Handedness Inventory (Oldfield, 1971).Exclusion criteria were any history of visual, neurological orpsychiatric disorder or any current medication; all subjects hadnormal or corrected-to-normal vision. All subjects gave writteninformed consent. All experiments were approved by the Institu-tional Ethics Boards and were in accordance with the latestversion of the Declaration of Helsinki.
4.2. Just One More task (JOM)
The JOM consists of a simple dynamic stochastic decisionenvironment (Murphy and ten Brincke, 2014) as illustrated inFig. 1. This is a computer controlled decision-making taskthat uses a virtual urn from which DMs can make draws withwell-defined probabilities and outcome values. The task isstructured such that most of the draws result in small gains,but there exists a constant low probability of a high impactnegative event.
Prior to the experiment, subjects were given instructionsabout the task and the payout procedure and were presentedwith a few practice rounds to become familiar with the

b r a i n r e s e a r c h 1 5 5 7 ( 2 0 1 4 ) 1 4 1 – 1 5 4 151
computer interface. Prior to the task, a baseline recording(120 s) was conducted in which subjects were asked to fixatetheir eyes on a fixation cross on a black screen and to remainmotionless.
4.2.1. Decision phaseThe subject may draw one ball at a time from an urn with aknown distribution of good and bad outcomes. On the screenthe probability of a good draw and that of a bad draw isdisplayed (Fig. 1). A good draw increases current holdings by afixed amount (the draw value), while a bad draw results in theround ending and all of the accumulated earnings disappear-ing (i.e., “going bust”). There is no limit to the number ofdraws that a subject can make. The subject may at any timedecide to choose the safe option and stop making draws,which means that the current holdings are banked (turnedinto real earnings) and the round ends.
One instance of this whole task is called a round, and eachdraw or stop decision is termed a stage. A round ends either bythe subject voluntarily stopping (and banking their points intoreal earnings) or by going bust (and thus earning nothing). Foreach round in this study, the value of a good draw is either 1 or3 and the probability of ruin is either 0.1 or 0.2. The particularvalues are determined randomly prior to each round, butremain the same throughout the stages of that round. Subjectshad to register their choices on the keyboard with their righthand (9¼stop; 0¼draw). After each choice, the current roundnumber, stage number, draws made and current holdings aredisplayed (Fig. 1). Subjects were able to make decisions withoutany time pressure and at their own pace (the average durationof a round (which contains multiple draws or stages) was10.673.1 s, mean7standard deviation). Each subject completed40 rounds. Rounds were independent and earnings did notcarry over between rounds. Subjects knew all of these featuresof the decision context and there was no deception used in thisresearch.
4.2.2. Outcome phaseEach decision phase was followed by an outcome phaseduring which feedback about the round (e.g., realized payoffs)were provided in the form of a graph (Fig. 1), showing avoluntary stop in green and a bust in red, as well as in theform of a table containing numerical results. The timeinterval of the outcome phase was set to a minimum of10 s to allow for proper isolation of the cortical hemodynamicand peripheral correlates.
4.2.3. PaymentTo ensure incentive compatibility, one round was randomlychosen at the end of the experiment for determining a subject'sexperimental earnings. For this selected round, subjectsreceived their corresponding outcome and were paid in cash.
4.3. fNIRS instrumentation and data pre-processing
To quantify the hemodynamic decision correlates we applied aminiaturized, wireless and portable fNIRS device (Muehlemannet al., 2008). The sensor components are mounted onto a four-layer rigid-flexible printed circuit board (PCB) which, in combi-nation with a highly flexible casing made of medical grade
silicone, enables the sensor to be aligned to curved bodysurfaces such as the head. The size of the device is 92�40�22mm3 and it weighs 40 g. The optical system comprises four lightsources at two different wavelengths (760 nm and 870 nm) andfour light detectors (PIN silicon photodiodes), resulting in fourchannels considered for analysis. The power is provided by arechargeable battery, which allows continuous data acquisitionfor 180min at full light emission power. The light intensity issampled at 100 Hz and the resulting data are transmittedwirelessly to a host computer by Bluetooth within an operatingrange of about 5 m.
During fNIRS recording, one sensor was placed over sub-jects' right hemisphere, covering F4-F8 according to theInternational 10–20 System of Electrode Placement (Jaspers,1958). The compact sensor measuring an area of 37.5 mm inlength and 25 mm in width covered the right DLPFC. Hairunder the sensor was carefully brushed away to ensure goodskin contact; the sensor were fixed on subjects' heads usingself-adhesive bandages which allow for a homogeneouscontact pressure over the whole sensor surface (Derma PlastCoFix 40 mm).
For pre-processing of the fNIRS raw light intensity values,a program was written in MATLABs (Version 2008a, Math-works, Natick, Massachusetts, USA). The ambient light inten-sities were subtracted before taking the logarithm and low-pass filtering (7th order Chebyshev with 20 dB attenuation at5 Hz) and the signals were then decimated to a sampling rateof 10 Hz. By applying the modified Beer–Lambert law, theconcentrations of oxy-hemoglobin ([O2Hb]) and deoxy-hemoglobin ([HHb]) over time were computed from themeasured attenuation changes of NIR light after its transmis-sion through tissue. These represent the dominant lightabsorbers for living tissue in the NIR spectral band (Delpyet al., 1988). Differential path length factors (DPF) of 6.75 forthe 760 nm and 6.50 for the 870 nm light sources were applied(Zhao et al., 2002). The resulting [O2Hb] and [HHb] signalswere then filtered by NIRS-SPM, a toolbox for the neuroima-ging suite SPM5 (Jang et al., 2009; Tak et al., 2011, 2010; Yeet al., 2009). We applied the discrete cosine transform baseddetrending algorithm to remove systemic confounds and theprecoloring method to remove temporal correlations using alow-pass filter (Worsley and Friston, 1995).
For statistical analysis with MATLABs (version 2008b, TheMathworks, Natick, MA, USA) and SPSSs (Version 17.0, SPSSInc., Chicago, USA), dependent variables were derived persubject from the [O2Hb] and [HHb] datasets averaged over allfour channels. To calculate statistical significance of the task-related signal amplitudes, the mean of the baseline ([O2Hb]BA-SELINE, [HHb]BASELINE) was subtracted from the mean of thedecision phase ([O2Hb]DECISION, [HHb]DECISION) and the meanof the outcome phase ([O2Hb]OUTCOME, [HHb]OUTCOME), referredto as Δ[O2Hb] and Δ[HHb]. Then, Δ[tHb] was derived as thesum of the averaged Δ[O2Hb] and Δ[HHb]. Δ[tHb] was chosenas primary parameter of interest because it representschanges in blood volume, which are correlated with changesin blood flow (Grubb et al., 1974). Further, Δ[tHb] is thoughtto be far less sensitive to vein contamination and thereforeto provide higher spatial specificity for mapping cerebralactivity compared to Δ[O2Hb] or Δ[HHb] separately (Gagnonet al., 2012).
b r a i n r e s e a r c h 1 5 5 7 ( 2 0 1 4 ) 1 4 1 – 1 5 4152
4.4. EDA instrumentation and decomposition procedure
To quantify the peripheral decision correlates an EDA systemwas used (Mind-Reflection, VERIMs AudioStrobes Molinis,16 bit resolution, range from 10 kΩ to 4.5 MΩ) that allowed forthe acquisition of completely raw, unfiltered EDA datasampled at 100 Hz. Two grounded flat electrodes wereattached to the distal phalange of the index and middlefingers of the left, non-dominant hand prior to recording, inorder to allow EDA levels to stabilize (Fowles et al., 1981).A custom-made MATLABs interface was used to display andevent-mark the psychophysiological data.
EDA data are usually characterized by a sequence ofoverlapping phasic skin conductance responses (SCRs) over-lying a tonic component. For full decomposition of these skinconductance (SC) data we applied the analysis softwareLedalab (V3.x) (Benedek and Kaernbach, 2010) and appliedcontinuous decomposition analysis (CDA), i.e., an extractionof the continuous phasic and tonic activity. The CDA proce-dure involves four steps: estimation of the tonic component,nonnegative deconvolution of phasic SC data, segmentationof driver and remainder, and reconstruction of SC data.
For statistical analysis, we focused on the phasic SCRs(average phasic driver (CDA.SCR [mu/s])). This score is thoughtto represent phasic activity within the response-windowmost accurately. SCRs were baseline corrected and a mini-mum amplitude criterion of 0.05 mS was used (Levinson andEdelberg, 1985).
Disclosure statement
The authors have no conflict of interest.
Acknowledgment
The authors thank all participants for assistance in carryingout this research and the Swiss Foundation for Grants inBiology and Medicine (SFGBM) and the Swiss National ScienceFoundation (SNSF) for financial support.
r e f e r e n c e s
Barraclough, D.J., Conroy, M.L., Lee, D., 2004. Prefrontal cortex anddecision making in a mixed-strategy game. Nat. Neurosci. 7,404–410.
Bechara, A., Damasio, A., 2005. The somatic marker hypothesis: aneural theory of economic decision. Games Econ. Behav. 52,336–372.
Bechara, A., Damasio, A., Damasio, H., Anderson, S., 1994.Insensitivity to future consequences following damage tohuman prefrontal cortex. Cognition 50, 7–15.
Bechara, A., Damasio, H., Damasio, A.R., Lee, G.P., 1999. Differentcontributions of the human amygdala and ventromedialprefrontal cortex to decision-making. J. Neurosci. 19,5473–5481.
Benedek, M., Kaernbach, C., 2010. Decomposition of skinconductance data by means of nonnegative deconvolution.Psychophysiology 47, 647–658.
Boucsein, W., 1992. Electrodermal Activity. Plenum Press, NewYork, NY.
Brand, M., Fujiwara, E., Borsutzky, S., Kalbe, E., Kessler, J.,Markovitsch, H., 2005. Decision-making deficits of Korsakoffpatients in a new gambling task with explicit rules:associations with executive functions. Neuropsychology 19,267–277.
Breiter, H., Aharon, I., Kahneman, D., Dale, A., Shizgai, P., 2001.Functional imaging of neural responses to expectancy andexperience of monetary gains and losses. Neuron 30, 619–639.
Cazzell, M., Li, L., Lin, Z., Patel, S., Liu, H., 2012. Comparison ofneural correlates of risk decision making between genders: anexploratory fNIRS study of the Balloon Analogue Risk Task(BART). NeuroImage 62, 1896–1911.
Cerimele, J.M., Katon, W.J., 2013. Associations between health riskbehaviors and symptoms of schizophrenia and bipolardisorder: a systematic review. Gen. Hosp. Psychiatry 35, 16–22.
Christopoulos, G.I., Tobler, P.N., Bossaerts, P., Dolan, R.J., Schultz,W., 2009. Neural correlates of value, risk, and risk aversioncontributing to decision making under risk. J. Neurosci. 29,12574–12583.
Cook, P., Bellis, M., 2001. Knowing the risk: relationships betweenrisk behaviour and health knowledge. Public Health 115,54–61.
Critchley, H., 2009. Psychophysiology of neural, cognitive andaffective integration: fMRI and autonomic indicants. Int. J.Psychophysiol. 73, 88–94.
Critchley, H.D., Elliott, R., Mathias, C.J., Dolan, R.J., 2000. Neuralactivity relating to generation and representation of galvanicskin conductance responses: a functional magnetic resonanceimaging study. J. Neurosci. 20, 3033–3040.
Crone, E.A., Somsen, R., Van Beek, B., Van Der Molen, M., 2004.Heart rate and skin conductance analysis of antecedents andconsequences of decision-making. Psychophysiology 41,531–540.
Davies, G., 2006. Dynamic Reference Points: Investors asConsumers of Information (Working Paper). University CollegeLondon.
Delgado, M., Nystrom, L., Fissell, C., Noll, D., Fiez, J., 2000.Tracking the hemodynamic responses to reward andpunishment in the striatum. J. Neurophysiol. 84, 3072–3077.
Delpy, D., Cope, M., Zee, P., Arridge, S., Wray, S., Wyatt, J., 1988.Estimation of optical pathlength through tissue from directtime of flight measurement. Phys. Med. Biol. 33, 1433–1442.
Ernst, M., Bolla, K., Mouratidis, M., Contoreggi, C., Matochik, J.,Kurian, V., Cadet, J., Kimes, A., London, E., 2002. Decision-making in a risk-taking task: a PET study.Neuropsychopharmacology 26, 682–691.
Fecteau, S., Pascual-Leone, A., Zald, D.H., Liguori, P., Theoret, H.,Boggio, P.S., Fregni, F., 2007. Activation of prefrontal cortex bytranscranial direct current stimulation reduces appetite forrisk during ambiguous decision making. J. Neurosci. 27,6212–6218.
Figner, B., Mackinlay, R., Wilkening, F., Weber, E., 2009. Affectiveand deliberative processes in risky choice: age differences inrisk taking in the Columbia Card Task. J. Exp. Psychol.: Learn.Mem. Cognit. 35, 709–730.
Figner, B., Murphy, R., 2010. Using skin conductance in judgmentand decision making research. In: Schulte-Mecklenbeck, M.,Kuehberger, A., Ranyard, R. (Eds.). A Handbook of ProcessTracing Methods for Decision Research.
Fowles, D., 1986. The eccrine system and electrodermal activity,Psychophysiology. Guilford Press, New York51–96.
Fowles, D.C., Christie, M.J., Edelberg, R., Grings, W.W., Lykken,D.T., Venables, P.H., 1981. Publication recommendations forelectrodermal measurements. Psychophysiology 18, 232–239.
Fukunaga, R., Brown, J., Bogg, T., 2012. Decision making in theBalloon Analogue Risk Task (BART): Anterior cingulate cortex

b r a i n r e s e a r c h 1 5 5 7 ( 2 0 1 4 ) 1 4 1 – 1 5 4 153
signals loss aversion but not the infrequency of risky choices.Cognit. Affect. Behav. Neurosci. 12, 479–490.
Gagnon, L., Yucel, M.A., Dehaes, M., Cooper, R.J., Perdue, K.L.,Selb, J., Huppert, T.J., Hoge, R.D., Boas, D.A., 2012.Quantification of the cortical contribution to the NIRS signalover the motor cortex using concurrent NIRS-fMRImeasurements. NeuroImage 59, 3933–3940.
Glockner, A., Fiedler, S., Hochman, G., Ayal, S., Hilbig, B., 2012.Processing differences between descriptions and experience:a comparative analysis using eye-tracking and physiologicalmeasures. Front. Psychol. 3, 173.
Grubb, R., Raichle, M., Eichling, J., Ter-Pogossian, M., 1974.The effects of changes in PaCO2 cerebral blood volume, bloodflow, and vascular mean transit time. Stroke 5, 630–639.
Huettel, S., Song, A., McCarthy, G., 2005. Decisions underuncertainty: probabilistic context influences activation ofprefrontal and parietal cortices. J. Neurosci. 25, 3304–3311.
Huettel, S., Stowe, C., Gordon, E., Warner, B., Platt, M., 2006.Neural signatures of economic preferences for risk andambiguity. Neuron 49, 765–775.
Jang, K., Tak, S., Jung, J., Jang, J., Jeong, Y., Ye, J., 2009. Waveletminimum description length detrending for near-infraredspectroscopy. J. Biomed. Opt. 14, 034004.
Jaspers, H., 1958. The ten-twenty electrode system of theInternational Federation. Electroencephalogr. Clin.Neurophysiol. 10, 371–375.
Jonah, B.A., 1997. Sensation seeking and risky driving: a reviewand synthesis of the literature. Accid. Anal. Prev. 29, 651–665.
Kahneman, D., Tversky, A., 1979. Prospect theory: an analysis ofdecision under risk. Econometrica 47, 263–291.
Knoch, D., Gianotti, L.R.R., Pascual-Leone, A., Treyer, V., Regard,M., Hohmann, M., Brugger, P., 2006. Disruption of rightprefrontal cortex by low-frequency repetitive transcranialmagnetic stimulation induces risk-taking behavior.J. Neurosci. 26, 6469–6472.
Knutson, B., Taylor, J., Kaufmann, M., Peterson, R., Glover, G.,2005. Distributed neural representation of expected value.J. Neurosci. 25, 4806–4812.
Kobayashi, S., Lauwereyns, J., Koizumi, M., Sakagami, M.,Hikosaka, O., 2002. Influence of reward expectation onvisuospatial processing in macaque lateral prefrontal cortex.J. Neurophysiol. 87, 1488–1498.
Lawrence, N., Jollant, F., O‘Daly, Q., Zaleya, F., Phillips, M., 2009.Distinct roles of prefrontal cortical subregions in the IowaGambling Task. Cereb. Cortex 19, 1134–1143.
Lejuez, C., Read, J., Kahler, C., Richards, J., Ramsey, S., Stuart, G.,Strong, D., Brown, R., 2002. Evaluation of a behavioral measureof risk taking: The Balloon Analog Risk Task (BART). J. Exp.Psychol.: Appl. 8, 75–84.
Levin, I., Hart, S., 2003. Risk preferences in young children: Earlyevidence of individual differences in reaction to potentialgains and losses. J. Behav. Decision Making 16, 397–413.
Levinson, D.F., Edelberg, R., 1985. Scoring criteria for responselatency and habituation in electrodermal research: a critique.Psychophysiology 22, 417–426.
Li, X., Lu, Z., D’Argembeau, A., Ng, M., Bechara, A., 2010.The Iowa gambling task in fMRI images. Hum. Brain Mapp. 31,410–423.
Liao, P., Uher, R., Lawrence, N., Treasure, J., Schmidt, U., Campbell,I., Collier, D., Tchanturia, K., 2009. An examination of decisionmaking in bulimia nervosa. J. Clin. Exp. Neuropsychol. 31,455–461.
Lighthall, N., Sakaki, M., Vasunilashorn, S., Nga, L., Somayajula,S., Chen, E., Samii, N., Mather, M., 2012. Gender differences inreward-related decision processing under stress. Soc. Cognit.Affect. Neurosci. 7, 476–484.
Lin, C., Chiu, Y., Cheng, C., Hsieh, J., 2008. Brain maps of Iowagambling task. BMC Neurosci. 9, 72.
Mohr, P., Biele, G., Krugel, L., Li, S., Heekeren, H., 2010. Neuralfoundations of risk-return trade-off in investment decisions.NeuroImage 49, 2556–2563.
Muehlemann, T., Haensse, D., Wolf, M., 2008. Wirelessminiaturized in-vivo near infrared imaging. Opt. Express 16,10323–10330.
Murphy, R., ten Brincke, R., 2014. Bonuses bite back: Howcompetitive incentives make everyone worse off. Workingpaper, Chair of Decision Theory and Behavioral Game Theory,ETH Zurich.
Oldfield, R., 1971. The assessment and analysis of handedness:the Edinburgh inventory. Neuropsychologia 9, 97–113.
Palamara, P., Molnar, L., Eby, D., Kopinanthan, C., Langford, J.,Gorman, J., Broughton, M., 2012. Review of Young Driver RiskTaking and its Association with Other Risk Taking Behaviours(No. RR 1). Curtin-Monash Accident Research Centre.
Pan, X., Sawa, K., Tsuda, I., Tsukada, M., Sakagami, M., 2008.Reward prediction based on stimulus categorization inprimate lateral prefrontal cortex. Nat. Neurosci. 11, 703–712.
Pleskac, T., 2008. Decision making and learning while takingsequential risks. J. Exp. Psychol.: Learn. Mem. Cognit. 34,167–185.
Preuschoff, K., Bossaerts, P., Quartz, S., 2006. Neuraldifferentiation of expected reward and risk in humansubcortical structures. Neuron 51, 381–390.
Rao, H., Korcykowski, M., Pluta, J., Hoang, A., Detre, J., 2008.Neural correlates of voluntary and involuntary risk taking inthe human brain: an fMRI study of the Balloon Analog RiskTask (BART). NeuroImage 42, 902–910.
Rogers, R., Owen, A., Middleton, H., Williams, E., Pickard, J.,Sahakian, B., Robbins, T., 1999. Choosing between small, likelyrewards and large, unlikely rewards activates inferior andorbital prefrontal cortex. J. Neurosci. 19, 9029–9038.
Rogers, R., Ramnani, N., Mackay, C., Wilson, J., Jezzard, P., Carter,C., Smith, S., 2004. Distinct portions of anterior cingulatecortex and medial prefrontal cortex are activated by rewardprocessing in separable phases of decision-making cognition.Biol. Psychiatry 55, 594–602.
Schonberg, T., Fox, C., Mumford, J., Congdon, E., Trepel, C.,Poldrack, R., 2012. Decreasing ventromedial prefrontal cortexactivity during sequential risk-taking: an fMRI investigation ofthe balloon analog risk task. Front. Neurosci., 6.
Slovic, P., 1966. Risk-taking in children: age and sex differences.Child Dev. 37, 169–176.
Starcke, K., Tuschen-Caffier, B., Markowitsch, H., Brand, M., 2009.Skin conductance responses during decisions in ambiguousand risky situations in obsessive-compulsive disorder. Cognit.Neuropsychiatry 14, 199–216.
Studer, B., Clark, L., 2011. Place your bets: psychophysiologicalcorrelates of decision-making under risk. Cognit. Affect.Behav. Neurosci. 11, 144–158.
Tak, S., Jang, J., Lee, K., Ye, J., 2010. Quantification of CMRO(2)without hypercapnia using simultaneous near-infraredspectroscopy and fMRI measurements. Phys. Med. Biol. 55,3249–3269.
Tak, S., Yoon, S., Jang, J., Yoo, K., Jeong, Y., Ye, J., 2011. Quantitativeanalysis of hemodynamic and metabolic changes insubcortical vascular dementia using simultaneous near-infrared spectroscopy and fMRI measurements. NeuroImage55, 176–184.
Tchanturia, K., Liao, P., Uher, R., Lawrence, N., Treasure, J.,Campbell, I., 2007. An investigation of decision making inanorexia nervosa using the Iowa Gambling Task and skinconductance measurements. J. Int. Neuropsychol. Soc. 13,635–641.
Tobler, P.N., Christopoulos, G.I., O’Doherty, J.P., Dolan, R.J.,Schultz, W., 2009. Risk-dependent reward value signal inhuman prefrontal cortex. Proc. Natl. Acad. Sci. 106, 7185–7190.

b r a i n r e s e a r c h 1 5 5 7 ( 2 0 1 4 ) 1 4 1 – 1 5 4154
Tobler, P.N., O’Doherty, J.P., Dolan, R.J., Schultz, W., 2007. Rewardvalue coding distinct from risk attitude-related uncertaintycoding in human reward systems. J. Neurophysiol. 97,1621–1632.
Tom, S.M., Fox, C.R., Trepel, C., Poldrack, R.A., 2007. The neuralbasis of loss aversion in decision-making under risk. Science315, 515–518.
Vollrath, M., Knoch, D., Cassano, L., 1999. Personality, risky healthbehaviour, and perceived susceptibility to health risks. Eur. J.Pers. 13, 39–50.
Wilkes, B., Gonsalvez, C., Blaszcynski, A., 2010. Capturing SCL andHR changes to win and loss events during gambling onelectronic machines. Int. J. Psychophysiol. 78, 265–272.
Worsley, K.J., Friston, K., 1995. Analysis of fMRI time-seriesrevisited—again. NeuroImage 2, 173–181.
Ye, J.C., Tak, S., Jang, K.E., Jung, J., Jang, J., 2009. NIRS-SPM:statistical parametric mapping for near-infrared spectroscopy.NeuroImage 44, 428–447.
Yen, N., Chou, I., Chung, H., Chen, K., 2012. The interactionbetween expected values and risk levels in a modified Iowagambling task. Biol. Psychol. 91, 232–237.
Zhao, H., Tanikawa, Y., Gao, F., Onodera, Y., Sassaroli, A., Tanaka,K., Yamada, Y., 2002. Maps of optical differential pathlengthfactor of human adult forehead, somatosensory motor andoccipital regions at multi-wavelengths in NIR. Phys. Med. Biol.47, 2075–2093.
![Functional Near-Infrared Spectroscopy (fNIRS) during Apnoeabiosignalsplux.com/downloads/docs/technical-notes/... · A functional near-infrared spectroscopy (fNIRS) sensor [7] uses](https://img.pdfslide.net/doc/110x75/5fbd4343fe93b80102432136/functional-near-infrared-spectroscopy-fnirs-during-a-functional-near-infrared.jpg)


![Efficient hemodynamic states stimulation using fNIRS data ... · spectroscopy (fNIRS). They rely on an indirect signal, the blood oxygenation level-dependent (BOLD) contrast [1],](https://img.pdfslide.net/doc/110x75/5f07fa417e708231d41fb671/efficient-hemodynamic-states-stimulation-using-fnirs-data-spectroscopy-fnirs.jpg)