Embed Size (px)
Citation preview

2/07
2/07
Fo
cu
s o
n E
ur
op
ea
n E
co
no
mi
c I
nt
eg
ra
ti
on
F o c u s o n
E u r o p e a n E c o n o m i c
I n t e g r a t i o n
c e e c . o e n b . a t
Stab i l i t y and Secur i t y.

2 ceec.oenb.at ◊ Focus 2/07
Contents
Editorial 5
Recent Economic Developments
Developments in Selected Countries 8compiled by Antje Hildebrandt
Studies
On the Determinants of Currency Crises: The Role of Model Uncertainty 54Jesús Crespo Cuaresma, Tomáš SlacJesús Crespo Cuaresma, Tomáš SlacJesús Crespo Cuaresma, Tomáš Slacík ˇík ˇ
Credit Growth in Central and Eastern Europe Revisited 69Peter Backé, Balázs Égert, Zoltan Walko Credit Growth in Central and Eastern Europe Revisited 69Peter Backé, Balázs Égert, Zoltan Walko Credit Growth in Central and Eastern Europe Revisited 69
Exchange Rate Arrangements and Monetary Policy in Southeastern Europe: An Update (2004–2007) 78Stephan Barisitz
Development and Regional Disparities –Testing the Williamson Curve Hypothesis in the European Union 100Béla Szörfi
Highlights
Selected Abstracts 124
Currency and CompetitivenessThe OeNB’s Conference on European Economic Integration 2007 125Compiled by Andreas Breitenfellner
The 60th East Jour Fixe of the Oesterreichische NationalbankCentral and Eastern Europe: Is Economic Convergence on Track? 138Compiled by Thomas Scheiber
Olga Radzyner Award for Scientifi c Work on European Economic Integration 142

Contents
Focus 2/07 ◊ ceec.oenb.at 3
Statistical Annex
Maria Dienst, Angelika Knollmayer and Andreas Nader
Gross Domestic Product 144Industrial Production 144Average Gross Wages 144Unemployment Rate 144Industrial Producer Price Index 145Consumer Price Index 145Trade Balance 145Current Account Balance 145Net FDI Infl ows 146Reserve Assets Excluding Gold 146Gross External Debt 146General Government Balance 146Gross General Government Debt 147Broad Money 147Offi cial Key Interest Rate 147Exchange Rate 147
Notes
Legend, Abbreviations and Defi nitions 150List of Studies and Special Reports Published in Focus on European Economic Integration 154Periodical Publications of the Oesterreichische Nationalbank 155Addresses of the Oesterreichische Nationalbank 158
The views expressed are those of the authors and need not necessarily coincide with the views of the Oesterreichische Nationalbank.


Focus 2/07 ◊ ceec.oenb.at 5
Editorial
Dear reader,
As 2007 is drawing to a close, we may venture to say that most Central, Eastern and Southeastern European (CESEE) countries have experienced another year in which economic performance – in particular output growth – has been buoyant, further promoting income convergence within Europe. At the same time, external imbalances have risen further in some countries, and inflation pressures have gained momentum across the region. These developments were attributable to both global and domestic supply factors, but were also driven by strong aggregate demand growth in the region. While the CESEE region remains a growth pole in Europe, macroeconomic and structural policymaking has certainly become more challenging in a number of CESEE countries. Policymakers must strike a balance between sustaining a continued and smooth path of real convergence while at the same time ensuring macroeconomic stability. It is worth noting on the positive side that, so far, the CESEE economies have on the whole displayed a remarkable degree of resilience amid the recent global financial market turmoil.
These issues are taken up and analyzed more deeply in various contributions to the current issue of Focus on European Economic Integration (FEEI). The Developments in Selected Countries section sheds particular light on infl ation and external positions in ten CESEE countries in a comparative perspective. Against the backdrop of the turbulences on the credit markets of developed economies, this section also examines developments in the key fi nancial market indicators of CESEE countries.
In the studies section, you will fi nd a paper by Jesús Crespo Cuaresma and Tomáš Slacík on the determinants of currency crises that focuses on the role of model uncertainty. The authors use Bayesian model averaging techniques to assess the robustness of the explanatory variables proposed in the recent literature for both static and dynamic currency crisis models. Based on a sample that covers 27 emerging economies, including 9 CESEE economies, from 1994 to 2003, the study fi nds that macroeconomic fundamentals are very fragile determinants of currency crises.
In recent years, most CESEE countries have recorded fast credit growth and, consequently, sizeable increases in credit-to-GDP levels. Not astonishingly, therefore, the assessment and implications of credit expansion have become a key policy issue across the CESEE region. Peter Backé, Balázs Égert and Zoltan therefore, the assessment and implications of credit expansion have become a key policy issue across the CESEE region. Peter Backé, Balázs Égert and Zoltan therefore, the assessment and implications of credit expansion have become a
Walko have updated earlier work on this issue and present new results on the deviations of private sector credit-to-GDP levels from their estimated equilibrium levels in 11 CESEE countries. They show that the levels of private sector credit to GDP continued to catch up with their long-run equilibrium levels during 2005–2006 and that, in a few countries, credit levels have already become fairly elevated relative to the underlying fundamentals. The paper also addresses policy implications: Considering that monetary policy in catching-up economies is often constrained, appropriate fi scal, income and structural policies as well as tight prudential regulations and supervision are key to keeping credit growth and exuberant domestic demand in check.
Another update on an earlier study featuring in this FEEI issue deals with Exchange Rate Arrangements and Monetary Policy in Southeastern Europe (SEE) from 2004 to 2007. This contribution, authored by Stephan Barisitz,

Editorial
6 ceec.oenb.at ◊ Focus 2/07
compares monetary policy and infl ation developments in SEE countries. While individual countries in the region have opted for a range of different monetary policy regimes, the author argues that prudent monetary policies have been upheld. The anti-infl ationary effectiveness of pegs continues to be satisfactory overall, while the initial results of infl ation targeting in some SEE countries have also been broadly encouraging. The most recent pickup of infl ation creates new policy challenges across the region and across different policy regimes.
Development and Regional Disparities in the European Union are at the center of a paper by Béla Szörfi , one of the winners of the 2007 Olga Radzyner Award. In this contribution, the author examines the relationship between within-country regional disparities and the stage of a country’s economic development, using panel data methods. Szörfi fi nds evidence on the Williamson curve hypothesis, which holds that disparities are lower in the early stages of development, peak in middle-income stages, and diminish again as countries become rich. The paper also investigates which factors, apart from income levels, infl uence regional disparities. Among these factors, the date of EU accession is found to play an outstanding role, explaining more than one-half of the differences in regional disparities between EU Member States. This would seem to suggest that EU membership will help to mitigate regional disparities in the “new” EU countries through various channels, e.g. increased policy coordination and surveillance, structural funds and a strengthening of institutions.
Among the other contributions in this FEEI issue, let me single out the summary report on the 2007 Conference on European Economic Integration, which was held in November and which focused on Currency and Competitiveness. Exploring the links between the external value of currencies and structural developments in the real economy, the conference addressed a wide range of issues, e.g. worldwide current account imbalances, the competitiveness of catching-up economies, the challenges of euro adoption, and corporate exchange rate strategies. The prominent speakers of this conference included John Lipsky, First Deputy Managing Director of the International Monetary Fund, Lorenzo Bini-Smaghi, Member of the Executive Board of the ECB, as well as the central bank governors of Malta, Michael C. Bonello, Cyprus, Athanasios Orphanides, and Slovakia, Ivan Šramko.Board of the ECB, as well as the central bank governors of Malta, Michael C. Bonello, Cyprus, Athanasios Orphanides, and Slovakia, Ivan Šramko.Board of the ECB, as well as the central bank governors of Malta, Michael C.
I do hope that a number of these contributions will be of interest to you, either adding to your knowledge of the CESEE region or being of use in your personal research agenda. If you have further comments or wish to exchange ideas, please do not hesitate to contact us at
Oesterreichische NationalbankForeign Research DivisionPO Box 611011 Vienna
You may also fax your comments to (43-1) 404 20-5299 or mail them [email protected], Head of the Foreign Research Division.
Klaus LiebscherGovernor

R e c e n t E c o n o m i c D e v e l o p m e n t s

8 ceec.oenb.at ◊ Focus 2/07
Developments in Selected Countries 1, 2
1 IntroductionEconomic performance remained dynamic in Central, Eastern and Southeastern Europe (CESEE)3 in the first half of 2007. Economic growth generally gained further momentum in the first half of 2007, increasing the growth differential of the group comprising the Czech Republic, Hungary, Poland, Slovakia and Slovenia to the euro area to 3.3 percentage points despite the good growth performance of the single currency area. The European Commission recently even revised upward its forecast for 2007 for most of the above-mentioned EU Member States. In fact, growth may have peaked in the countries covered in this report. Bottlenecks on the supply side, fiscal consolidation intentions and possibly lower FDI inflows are some reasons why economic growth is generally expected to slow down somewhat in the coming years. Overall, the region was not unaffected by the worldwide increase in inflationary pressure in recent months. Apart from unfavorable developments of world market prices for energy and food, dynamic domestic demand and, in some countries, wage pressures pushed up price levels as well. In particular, the EU newcomers Bulgaria and Romania have to cope with high and growing external imbalances. With inflation picking up and external disequilibria increasing, it appears that at least some countries are entering a period of new economic challenges.
The first half of 2007 in the CESEE Member States covered in this report was mostly characterized by dynamic economic performance, with real GDP growth rates ranging between approximately 6% and 9%, far above euro area growth (2.9% year on year). Only Hungary’s growth performance was significantly lower for specific reasons.
As in 2006, domestic demand was in general the main contributor to economic growth in the CESEE Member States in the first half of 2007, whereas the growth of gross fixed capital formation (GFCF) outpaced that of private consumption. Poland, Slovenia, Bulgaria as well as Romania even registered GFCF growth rates of close to or above 20% year on year. Growth in the construction sector, driven by the building-up of new production capacities and by infrastructure projects, was to a considerable extent responsible for these dynamic investment activities.4 As in the last reporting period, domestic demand was again strongly supported by rising real wages, continued robust or even increasing real credit growth, improvements on most labor markets and partly by high FDI inflows. It is noteworthy that stocks in the Czech Republic, Hungary and Romania contributed more than 2 percentage
1 Compiled by Antje Hildebrandt with input from Stephan Barisitz, Johann Elsinger, Sándor Gardó, Silvia Kirova, Thomas Reininger, Josef Schreiner, Tomáš Slacík and Zoltan Walko.
2 Cut-off date: November 9, 2007. This report focuses on data releases and developments from end-April 2007 up to the cut-off date.
3 One set of countries covered in this report – Bulgaria, the Czech Republic, Hungary, Poland, Romania, Slovakia and Slovenia – is made up of Central, Eastern, and Southeastern European (CESEE) EU Member States, and is referred to as CESEE Member States throughout the report. The second set of countries comprises Croatia and Turkey (referred to as candidate countries), as well as Russia.
4 In these countries real growth in the construction sector was around 30% in the first half of 2007.
Robust economic growth across the
region; rising inflationary pressure and striking
external imbalances in some countries
Robust economic growth across the
region; rising inflationary pressure and striking
external imbalances in some countries
The first half of 2007 continues with dynamic
economic expansion
The first half of 2007 continues with dynamic
economic expansion
Domestic demand becomes an even bigger
contributor to growth
Domestic demand becomes an even bigger
contributor to growth

Developments in Selected Countries
Focus 2/07 ◊ ceec.oenb.at 9
points to GDP growth in the first half of 2007. In the two EU candidate countries5 Croatia and Turkey as well as in Russia, domestic demand also remained the main economic driver. However, private consumption declined significantly in Turkey, as did GFCF growth, developments which were related to a restrictive monetary policy.
A large share of the CESEE Member States’ exports of goods and services go to the euro area. Obviously, the weakening of import growth in the euro area in the first half of 2007 compared to 2006 negatively affected the export growth of euro area trading partners: Most of the countries faced a slowdown of their export growth rates.6 Additionally, in most cases the growth of imports decelerated or accelerated less than the growth of exports. These developments resulted in a further increase of the negative contribution of net exports to GDP growth overall.7 In Croatia (almost balanced contribution) and Turkey (positive contribution), the outcome improved compared to 2006 due to higher export growth rates combined with more moderate import growth. In Russia, however, higher import growth rates (above 25% year on year in the first half of 2007) along with lower export growth resulted in a more negative outcome in 2007.
Most CESEE Member States faced stronger inflationary pressure in the second and third quarters of 2007. Over this period, inflation rates only declined in Hungary, admittedly from a high level, and in Slovakia. Especially in September 2007, prices picked up. Bulgaria and Romania saw the strongest increase with rates (year on year) hitting above 10% and 6%, respectively. For comparison, inflation accelerated in the euro area as well, quickening from 1.7% in August 2007 to 2.1% in September 2007 (both year on year). Like in most CESEE Member States, inflation picked up in Croatia and Russia, whereas Turkey’s disinflation process continued.
5 While the Republic of Macedonia is also an EU candidate country, it is not covered in this report. 6 Only Slovenia registered higher export growth rates in the first half of 2007 compared to 2006.7 The contribution of net exports to GDP growth was positive in the first half of 2007 only in Hungary and
Slovakia. In Slovakia, moreover, the contribution grew further compared to 2006.
Weaker import growth in the euro area – weaker export growth in the CEE neighboring countries
Weaker import growth in the euro area – weaker export growth in the CEE neighboring countries
Inflation mostly onthe riseInflation mostly onthe rise
Table 1
Gross Domestic Product (Real)
Annual change in %
2004 2005 2006 Q1 2006 Q2 2006 Q3 2006 Q4 2006 Q1 2007 Q2 2007
Slovenia 4.4 4.0 5.2 5.0 4.7 5.6 5.5 7.2 5.9
Bulgaria 6.6 6.2 6.1 5.5 6.4 6.7 5.7 6.2 6.6Czech Republic 4.6 6.5 6.4 6.6 6.5 6.3 6.1 6.4 6.0Hungary 4.8 4.1 3.9 4.9 3.7 3.9 3.3 2.7 1.2Poland 5.3 3.5 5.8 5.2 5.5 5.8 6.4 6.9 6.8Romania 8.5 4.2 7.7 6.9 7.8 8.3 7.7 6.0 5.6Slovakia 5.4 6.0 8.3 6.7 6.7 9.8 9.6 9.0 9.4
Croatia 4.3 4.3 4.8 6.0 3.6 4.7 4.8 7.0 6.6Turkey 8.9 7.4 6.1 6.7 8.3 4.8 5.2 6.9 3.9
Russia 7.1 6.4 6.7 5.0 7.0 6.8 7.7 7.9 7.8
Source: Eurostat, national statistical off ices, wiiw.

Developments in Selected Countries
10 ceec.oenb.at ◊ Focus 2/07
What were the key factors behind these inflation developments? First, price movements were caused by exogenous factors, more specifically by upward movements of world market prices for energy and food. Second, developments related to the process of income convergence presumably had an impact on inflation (strong domestic demand as a result of dynamic wage growth and strong credit growth). Finally, more country-specific factors (such as tax changes) pushed up prices. By contrast, the nominal appreciation of the exchange rate helped curb price pressure in some countries.8
Apart from increasing prices for energy, higher food prices were the main factor leading to price hikes across the region, especially in the third quarter of 2007, but also in the euro area and other countries. According to the HWWI’s Index of World Market Prices of Commodities, global food prices increased by around 30% year on year (in euro terms) in September 2007. Various arguments are put forward to explain world food prices; the most common one cites increasing world demand for specific food items (such as meat or dairy products).
In addition to worldwide developments, dynamic growth in the economies of the region put further upward pressure on prices. More and more countries are confronted with the phenomenon of bottlenecks on the supply side, in particular on the labor market. Strong economic expansion as well as significant worker emigration gave rise to labor shortages in some sectors and countries, exerting upward pressure on wages.9 In the first half of 2007, nominal wages in the industrial sector increased by between close to 6% (Slovenia) and more than 20% (Romania) year on year. In the CESEE Member States, wage hikes were (partially considerably) higher than in the same period a year earlier (see also below). Among the non-EU countries, Croatia and Turkey registered
8 For a more in-depth analysis of exchange rate movements, see box 1.9 However, the labor market has benefited from both developments. Unemployment rates declined in most countries
of the region. The two countries with the highest unemployment rates, Poland and Slovakia, registeredthe largest improvements. Unemployment rates (ILO definition) fell by almost 5 and 3 percentage points, respectively, in the first half of 2007 compared to the same period of 2006, but Bulgaria’s and Slovenia’s unemployment rates declined substantially as well.
Higher food and energy prices key to rise
in inflation
Higher food and energy prices key to rise
in inflation
Supply-side bottlenecks help labor markets and
put upward pressure on wages
Supply-side bottlenecks help labor markets and
put upward pressure on wages
Table 2
Consumer Price Index (here: HICP)
Annual change in %
2004 2005 2006 Q1 2006 Q2 2006 Q3 2006 Q4 2006 Q1 2007 Q2 2007 Q3 2007
Slovenia 3.7 2.5 2.5 2.3 3.1 2.5 2.3 2.6 3.2 3.7
Bulgaria 6.1 6.0 7.4 8.7 8.6 6.7 5.7 5.3 4.7 9.0Czech Republic 2.6 1.6 2.1 2.4 2.5 2.4 1.1 1.7 2.6 2.7Hungary 6.8 3.5 4.0 2.4 2.7 4.6 6.4 8.8 8.5 7.3Poland 3.6 2.2 1.3 0.9 1.4 1.5 1.3 2.0 2.3 2.4Romania 11.9 9.1 6.6 8.7 7.2 5.9 4.8 3.9 3.9 5.1Slovakia 7.5 2.8 4.3 4.2 4.6 4.8 3.5 2.1 1.7 1.4
Croatia 1 2.1 3.4 3.2 3.5 3.8 3.2 2.2 1.5 2.1 2.9Turkey 10.1 8.1 9.3 7.6 9.2 10.6 9.7 10.3 9.5 7.1
Russia 1 11.0 12.5 9.8 10.8 9.6 9.6 9.2 7.9 8.1 . .
Source: Eurostat, national statistical off ices, wiiw.1 CPI.

Developments in Selected Countries
Focus 2/07 ◊ ceec.oenb.at 11
lower industrial wage dynamics in the first half of 2007 compared to 2006, whereas Russia saw wages in the industrial sector increase by more than 25% year on year.
Bottlenecks on the supply side were also reflected in high and rising levels of industrial capacity utilization. Most CESEE Member States reached capacity utilization levels of more than 80% on average in the first nine months of 2007, with the Czech Republic topping out at 88% and Slovenia and Hungary both registering around 85%. Overall, the level of capacity utilization was higher than in the corresponding period of 2006 in all countries. In Croatia and Turkey, (overly) high capacity utilization in industry did not seem to create problems, whereas Russia has already reached capacity constraints in some sectors, especially the energy sector.
In most countries, stronger private consumption supported by dynamic real growth of credit to the private sector put further pressure on inflation as well. Real growth of credit to the private sector grew especially dynamically in Bulgaria and Romania (on average in the first half of 2007: around 35% and 45% year on year), but was also robust in the rest of the CESEE Member States (around 20% year on year). Only Hungary saw a low real growth rate (first half of 2007: on average 2.5%, year on year). In the remaining countries, Croatia and in particular Russia, real growth of private credit stayed strong in 2007, whereas in Turkey, it declined from around 40% (average of 2006) to an average of 15% in the first half of 2007 (year on year).
Largely on the back of rising inflationary pressure, Ceská národní banka and Narodowy Bank Polski increased their main policy rates several times in the reporting period. Motivated by low inflation rates and the need to curb capital inflows in the first quarter of 2007, Banca Nat,capital inflows in the first quarter of 2007, Banca Nat,capital inflows in the first quarter of 2007, Banca Nationala a României (BNR) decreased its policy rate twice, most recently in June 2007. However, at the end of October 2007, the BNR raised its key policy rate by 50 basis points to counteract inflationary pressure and currency weakening. Furthermore, the Bulgarian National Bank increased reserve requirements to limit credit growth. In contrast, Magyar Nemzeti Bank, Hungary’s central bank, lowered its key interest rate, as inflation pressure in the country eased. Among the non-EU Member States, Turkey lowered its policy rate from a relatively high level, also motivated by the continued disinflation process.
The CESEE Member States show one common characteristic of their external balances: All countries register a deficit in the combined current and capital account balance, though with major differences in levels.10 The deficit (weighted average) of the Czech Republic, Hungary, Poland, Slovakia as well as Slovenia was around 3.4% of GDP. Bulgaria and Romania posted deficits of more than 20% (Bulgaria) and 16% (Romania) of GDP, respectively, in the first half of 2007. The deficit in the first half of 2007 was lower than one year earlier in the Czech Republic, Hungary and especially in Slovakia, whereas it widened considerably in Slovenia (from –1% of GDP to –3.4% of GDP) as
10 Furthermore, the structure of the current account continues to differ substantially. In the Czech Republic, Hungary, Poland, Slovakia as well as in Slovenia, deficits are largely driven by the income balance (as a result of earlier FDI inflows that are now entailing reinvested earnings, profits and dividends). In Bulgaria and Romania, however, the deficits mainly originate from highly negative trade balances, as is the case in Croatia and Turkey.
Rising levels of capital utilization in the industrial sector
Rising levels of capital utilization in the industrial sector
Growth of credit to the private sector puts further pressure on prices
Growth of credit to the private sector puts further pressure on prices
Some countries react to rising inflation pressure with monetary tightening
Some countries react to rising inflation pressure with monetary tightening
Combined current and capital accounts are negative across the region
Combined current and capital accounts are negative across the region

Developments in Selected Countries
12 ceec.oenb.at ◊ Focus 2/07
well as Bulgaria and Romania. Over the period, the current account deficits of Croatia and Turkey remained quite high, but shrank marginally compared to the same period of 2006, easing to below 20% of GDP (Croatia) and 10% of GDP (Turkey), respectively.11 The surplus in Russia, the only country with a positive current account balance, dropped by around 4 percentage points to 8.7% of GDP.
Despite a decline of the coverage ratio in most of the countries, FDI inflows remained an important source of deficit financing. In countries with a high combined current and capital account deficit (Bulgaria, Romania, Croatia and Turkey), financing requirements from other sources than FDI were quite high; this also applied to Hungary and Slovenia, as both countries registered net FDI outflows caused by the drop in FDI inflows combined with ongoing FDI outflows.
As already described, industrial sector wages in the CESEE Member States grew dynamically in the first half of 2007. Only in Slovenia and Slovakia (as well as in Croatia) did productivity growth outpace wage increases. Thus most of the countries faced higher unit labor costs (ULC) in the first half of 2007 compared to the first half of 2006 (both in local currency and in euro terms). The picture differs quite substantially from 2006 developments, when Romania was the only country among the CESEE Member States to post a significant
11 It is noteworthy that in Bulgaria as well as in Croatia developments of the combined current and capital account show strong seasonal patterns.
FDI inflows still important for covering
external deficits
FDI inflows still important for covering
external deficits
Competitive edge narrows in Bulgaria, Romania and Russia;
unit labor costs accelerate strongly
Competitive edge narrows in Bulgaria, Romania and Russia;
unit labor costs accelerate strongly
Table 3
Inflation: Assessment and Key Factors
Assessment Key Factors
Price stability
Inflation level
Inflation targets (end 2007) Change of the key interest rate
Slovenia ú d euro area monetary policyframework
euro area interest rates
Bulgaria ú ● no target . .
Czech Republic ú d inflation target of 3%±1 percentage point (CPI)
increase by 75 basis points in three steps
Hungary ú ■ combined exchange rate (wide band)and inflation target: 3%
±1 percentage point (medium-term)
decrease by 50 basis points in two steps
Poland ú d inflation target of 2.5% ±1 percent-age point (national headline CPI)
increase by 50 basis points in two steps
Romania ú ● inflation target of 4%±1 percentage point
decrease by 50 basis points in two steps followed by an increase of 50 basis points
Slovakia ôö d inflation target of < 2% . .
Croatia ú d no target . .
Turkey õ ■ no explicit target decrease by 75 basis points in two steps
Russia ú ● no explicit target . .
Source: Eurostat, national central banks, OeNB.
Note: The table refers to the review period (end of April 2007 until beginning of November 2007).
õ : improvement. ú : deterioration. ■ : intermediate riskôö : no signif icant change. ôö : no signif icant change. ôö d : moderate risk. ● : high risk

Developments in Selected Countries
Focus 2/07 ◊ ceec.oenb.at 13
Table 4
External Equilbria: Assessment and Key Factors
Assessment Key Factors
Development of the combined current and capital account1
Level of the combined current and capital account
Main source of the deficit/surplus
Coverage of combined current and capital account by net FDI, % of GDP
Gross external debt,% of GDP
2007(first half )
2006(first half )
2007(first half )2
2006(first half )2
Slovenia ú d income account –19.9 –89.2 95.6 78.2
Bulgaria ú ● trade account 72.1 112.1 81.7 75.1Czech Republic õ d income account 313.8 88.1 38.1 48.1Hungary õ d income account –51.3 63.5 98.1 82.1Poland ú d income account 119.5 127.6 48.7 45.5Romania ú ● trade account 39.3 80.5 28.2 31.9Slovakia õ d income account 64.9 95.2 55.6 61.3
Croatia ú d trade account 60.1 37.5 85.9 84.5Turkey ú ● trade account 53.1 45.1 51.0 48.1
Russia ú d trade account –5.7 –20.3 33.8 32.5
Source: Eurostat, national central banks, OeNB.
Note: The table refers to the review period (end of April 2007 until beginning of November 2007).
õ : Improvement. ú : Worsening. ■ : Intermediate risk.ôö :No signif icant change. d : Moderate risk. ● : High risk.1 Comparing the f irst half of 2007 with the f irst half of 2006.2 % of GDP (rolling four-quarter GDP, euro basis), end of period.
Table 5
Wages, Productivity, Unit Labor Costs
Annual change in %
Nominal Wagesin Industry
Productivity in Industry Unit Labor Cost in In-dustry (local currency)
Euro per Local Cur-rency (annual average)
Unit Labor Cost in Industry (euro)
2006 H1 2006
H1 2007
2006 H1 2006
H1 2007
2006 H1 2006
H1 2007
2006 H1 2006
H1 2007
2006 H1 2006
H1 2007
Slovenia 5.5 6.1 5.7 8.8 7.9 7.7 –3.1 –1.7 –1.9 0.0 0.0 0.0 –3.1 –1.6 –1.9
Bulgaria 10.8 9.4 18.6 8.2 9.3 7.5 2.5 0.1 10.3 0.0 0.0 0.0 2.5 0.1 10.3Czech Republic 6.8 6.4 8.8 8.6 10.6 8.3 –1.7 –3.8 0.5 5.1 5.6 1.2 3.3 1.5 1.7Hungary 8.5 8.1 9.2 11.7 12.3 9.2 –2.9 –3.7 0.0 –6.1 –5.1 4.1 –8.9 –8.7 4.2Poland 5.2 4.6 8.4 9.5 10.3 7.3 –4.0 –5.1 1.0 3.2 4.8 1.2 –0.8 –0.6 2.2Romania 15.7 15.4 21.2 11.3 11.3 10.5 4.0 3.7 9.7 2.7 3.5 6.3 6.8 7.2 16.6Slovakia 6.7 5.3 7.1 11.3 10.8 10.7 –4.1 –4.9 –3.2 3.7 2.8 10.3 –0.6 –2.3 6.8
Croatia 7.5 7.2 5.7 5.7 1.8 7.5 1.7 5.3 –1.7 1.1 1.6 –0.6 2.8 6.9 –2.3Turkey 11.5 11.4 8.5 6.7 7.5 2.5 4.5 3.6 5.8 –7.3 0.3 –5.5 –3.1 4.0 –0.1
Russia 21.4 20.4 25.2 8.3 8.5 6.4 12.1 10.9 17.6 3.3 5.8 –1.9 15.8 17.3 15.4
Memorandum item:Euro area 2.5 2.5 2.8 4.6 4.1 3.5 –2.0 –1.5 –0.7 . . . . . . –2.0 –1.5 –0.7
Source: ECB, Eurostat, national statistical off ices, wiiw.

Developments in Selected Countries
14 ceec.oenb.at ◊ Focus 2/07
increase in ULC. One can argue, however, that these ULC increases are not threatening the competitiveness of this country group yet: These countries’ market shares are growing, and the countries are undergoing a process of technological upgrading (see also issue 1/2007 of this publication). Further-more, the terms of trade have improved in most countries, and trade balances are positive or register a more or less moderate deficit. However, the picture differs in the two newest EU Member States, Bulgaria and Romania, where ULC increased at double-digit rates, harming competitiveness. Comparedto the other EU Member States, their trade balances are already deeply inthe red.
In Croatia and Turkey, ULC (in euro terms) declined in the first half of 2007, in Croatia mainly due to high productivity increases combined with moderate wage growth. In Turkey, productivity growth was low, but ULC developments were supported by a depreciation of the currency. Russia posted impressive wage increases, leading to a significant rise of ULC.
According to the 2007 October fiscal notification, budgetary deficit ratios for 2007 in the CESEE Member States are expected to be lower than in 2006 in Slovenia, Hungary, Poland and Slovakia, with the biggest deficit reduction expected to take place in Hungary. The deficit ratio is forecast to increase in the Czech Republic (by 0.5 percentage points) and in Romania (by 1 percentage point). In Bulgaria, the budget surplus will decline somewhat to 2.5% of GDP. Comparing the October 2007 fiscal notifications with the updates of the (2006) convergence programs, all countries now expect a lower fiscal deficit (or higher surplus) for 2007, with the exception of Romania. The revisions mainly stem from stronger than expected economic growth, but also from fiscal reforms or methodological changes. In Bulgaria, the increased surplus can be largely ascribed to efforts to contain imbalances and address external vulnerabilities.
In 2006 fiscal policy was procyclical in Hungary, Slovenia, Slovakia and Romania according to the European Commission’s Autumn 2007 forecast. In the Czech Republic and Poland, fiscal policy was roughly neutral, in Bulgaria tighter.12 For 2007, the forecast of the Commission would imply a loosening in the Czech Republic, Bulgaria and Romania (and to a smaller extent in Slovenia), while the fiscal stance is expected to be tightened substantially in Hungary and to a smaller extent also in Poland and Slovakia.
The state of the excessive deficit procedures (EDP) in October 2007 was marked by a renewed recommendation of the EU Council (following a first recommendation in July 2007) to the Czech Republic to take the necessary measures to bring its budget deficit below the threshold of 3% by the end of 2008. According to the country’s convergence program (submitted in March 2007), a deficit of 4% of GDP was expected for 2007 and of 3.5% of GDP for 2008, but the latest forecast predicts lower deficits as a result of a reform package adopted to accelerate the process of fiscal consolidation (also see the
12 No cyclically adjusted fiscal data are available for Croatia, Turkey or for Russia. The fiscal stance is measured as the arithmetic average of the cyclically adjusted primary balance on the basis of trend GDP and on the basis of potential GDP.
Fiscal balances in 2007 expected to improve
mainly due to good growth performance
and, in Hungary, because of consolidation efforts
Fiscal balances in 2007 expected to improve
mainly due to good growth performance
and, in Hungary, because of consolidation efforts
Excessive deficit procedure ongoing in
the Czech Republic, Hungary, Poland and
Slovakia
Excessive deficit procedure ongoing in
the Czech Republic, Hungary, Poland and
Slovakia

Developments in Selected Countries
Focus 2/07 ◊ ceec.oenb.at 15
country report). As a reminder,13 Hungary, Poland and Slovakia are under an EDP as well. Poland and Slovakia have been given time to reduce their deficits by the end of 2007, Hungary by the end of 2009.14
Following publication of Croatia’s and Turkey’s latest Pre-Accession Economic Programmes in the fourth quarter of 2006, joint conclusions on these programs (and on the program submitted by the Republic of Macedonia) were issued in June 2007 as a result of the ministerial dialogue meeting between the economics and finance ministers of the EU and the EU candi-date countries. The conclusion on Croatia’s third Pre-Accession Economic Programme for 2007 to 2009 is that the country is on track to fully meeting the Copenhagen economic criteria for accession. The policy mix of fiscal restraint and stability-oriented monetary policy is considered to be appropriate. However, an even stronger fiscal adjustment could be needed to address external vulnerabilities which have arisen recently. The conclusion on Turkey’s sixth Pre-Accession Economic Programme for 2007 to 2009 is generally that the program is sound and coherent in view of the medium-term macroeconomic, fiscal and structural reforms. Furthermore, the program provides guidance for meeting the Copenhagen accession criteria. However, fiscal and structural measures as well as their budgetary effects are not always presented sufficiently. The next Pre-Accession Economic Programmes for both countries are expected in late 2007.
In early November 2007, the European Commission published the annual updates of the progress reports on enlargement strategies and the main challenges in the upcoming years for Croatia and Turkey. So far, negotiations in Croatia have been opened on 14 chapters, and 2 chapters were provisionally closed (science and research, education and culture). For Turkey, negotiations on 4 chapters have been opened (science and research, industrial policy, statistics, financial control) but only 1 chapter (science and research) has already been (provisionally) closed. In the progress report on Croatia, the European Commission concludes that accession negotiations are on the right track and that reforms are advancing well. However, some improvements are still required in several areas, such as in the field of administrative and judiciary management. The progress report on Turkey is less positive. The country does not yet sufficiently meet the political criteria for EU membership. Furthermore, the Commission noted some slowing down in implementing reforms.
In Poland’s election in late October, the center-right Civic Platform won against the conservative Law and Justice Party. Markets welcomed the outcome, as the winning party is considered to be more reform- and EU-oriented. On November 9, 2007, president Lech Kaczynski designated Donald Tusk, the leader of the Civic Platform, as Prime Minister. Now, a coalition with the smaller PSL, the Polish Peasant Party, is in the offing, which will have a majority in the parliament. Poland will thus experience a phase of
13 For more details, see issue 1/2007 of this publication.14 In case a country exceeds the reference value (budget deficit of 3% of GDP), the cost of implementing pension
reforms will be considered under certain circumstances when assessing developments of deficit figures relevant for the EDP.
The candidate countries Croatia and Turkey continue to negotiate EU accession
The candidate countries Croatia and Turkey continue to negotiate EU accession
European Commission publishes progress reports on Croatia and Turkey in November 2007
European Commission publishes progress reports on Croatia and Turkey in November 2007
Partial easing of political noise across the regionPartial easing of political noise across the region

Developments in Selected Countries
16 ceec.oenb.at ◊ Focus 2/07
cohabitation between this coalition and the President of the Republic, who is a member of the Law and Justice Party.
In Romania, the attempt by parliament to impeach the country’s popular president failed, but frictions between the government and the president persist. The Bulgarian and Hungarian governments are confronted with low popularity among the general public because they have taken restrictive fiscal policy measures (social spending cuts, restrictive wage policy). The coalition government in the Czech Republic has a very narrow majority only in parliament. In Croatia, parliamentary elections will take place on November 25, 2007. Turkey held parliamentary and presidential elections in the summer of 2007; the conflict with Kurds in Northern Iraq has most recently moved to the top of the political agenda. In Russia, upcoming elections (parliamentary in December 2007, presidential in March 2008) have further reduced economic reform momentum.
Only one country’s long-term foreign-currency rating – that of the Czech Republic – has been changed since the publication of the last report on developments in selected countries. The upgrading by Standard & Poor’s was largely motivated by the country’s implementation of public sector reforms.
Upgrading of the Czech Republic’s rating
Upgrading of the Czech Republic’s rating
Table 6
Ratings of Sovereign Long-Term Foreign Currency-Denominated Debt
Currency Moody’s Standard & Poor’s
Current rating1 Last change(former rating)
Current rating2 Last change(former rating)
Slovenian tolar Aa2 Jul 2006 (Aa3) AA May 2006 (AA–)
Bulgarian lev Baa3 Mar 2006 (Ba1) BBB+ Oct 2006 (BBB)Czech koruna A1 Nov 2002 (Baa1) A Oct 2007 (A–)Hungarian forint A2 Dec 2006 (A1) BBB+ June 2006 (A–)Polish zloty A2 Nov 2002 (Baa1) A– Mar 2007 (BBB+)Romanian leu Baa3 Oct 2006 (Ba1) BBB– Sep 2005 (BB+)Slovak koruna A1 Oct 2006 (A2) A Dec 2005 (A–)
Croatian kuna Baa3 Jan 1997 BBB Dec 2004 (BBB–)Turkish new lira Ba3 Dec 2005 (B1) BB– Aug 2004 (B+)
Russian ruble Baa2 Oct 2005 (Baa3) BBB+ Sep 2006 (BBB)
Source: Bloomberg.1 Aaa (best), Aa, A, Baa, Ba, B, Caa, Ca, and C (worst); each of the categories is further divided into 1, 2, and 3, except for the best and
worst category, with 1 being the best and 3 the worst subcategory.2 AAA (best), AA, A, BBB, BB, B, CCC, CC, C and D (worst); each of the categories is further divided into + and –.

Developments in Selected Countries
Focus 2/07 ◊ ceec.oenb.at 17
Box 1
CESEE Financial Markets only Marginally Affected
by Recent International Turbulences
The CESEE countries covered in this report on recent economic developments have been affected to differing degrees by the international fi nancial market turbulence since mid-July 2007. In general, countries with the largest economic imbalances and/or insuffi cient policy credibility as well as countries which had previously experienced strong capital infl ows coupled with particularly high asset valuation were affected more than others. The adverse international developments impacted different fi nancial market segments to a different extent, though country-specifi c factors (such as exchange rate regimes or market liquidity) imply that the degree of information content in capital market data variesacross countries. In general, CESEE markets tended to follow the negative global investor sentiment, but performed relatively well compared to other emerging markets, especially when simultaneous adverse local factors (such as political uncertainty) were also at work. Asset price losses, if any, and the increase in risk premiums were well contained in the region, which may refl ect investors’ increased differentiation between emerging market economies and an “EU bonus” in investor judgment for several countries of this region. Having said this, the correction of overly large economic imbalances remains imperative in a relatively fragile international environment that is characterized by a more permanent reassessment of risks. This view is supported by the uneven recovery in some market segments in different countries after the turmoil peaked (mid-July 2007 to mid-August 2007).
CESEE currencies were affected by the international financial market turbulence primarily during the period from mid-July to mid-August. The Turkish lira, the Hungarian forint and the Romanian leu suffered most, losing around 6.6%, 5.6% and 3.7% against the euro, respectively, between July 20 and August 16, 2007. Adverse country-specific factors, like political uncertainty or large economic imbalances, made these countries vulnerable to contagion. Moreover, these countries had undergone particularly sizeable nominal appreciation during the year prior to the crisis. The Polish złoty and the Slovak koruna lost around 2%, while the Croatian kuna was practically unaffected. While the Russian ruble gained around 1.4% versus the euro, it lost about 1% against the U.S. dollar, its major reference currency, and thus remained roughly stable against its currency basket. In an international comparison, the exchange rate losses in the CESEE countries were significantly smaller than the losses of selected other emerging market currencies during
International financial market turbulences affected the Hungarian, Romanian and Turkish currencies most
International financial market turbulences affected the Hungarian, Romanian and Turkish currencies most
Chart 1a
107
105
103
101
99
97
95
December 29, 2006 = 100.00December 29, 2006 = 100.00December 29,
Exchange Rate Developments against the Euro in 2007
EUR per 1CZK EUR per 1HUF EUR per 1PLN EUR per 1SKK
Source: Eurostat,Source: Eurostat,Source: OeNB. Eurostat, OeNB. Eurostat,
Jan. Feb. MarMar.Mar April MayMayMa June July Aug. Sep. Oct. Nov.

Developments in Selected Countries
18 ceec.oenb.at ◊ Focus 2/07
the turmoil (e.g. the Brazil real, the Thai baht), but also smaller than those of the New Zealand dollar and the Icelandic króna.
The Czech koruna was a notable exception among the CESEE currencies, as it has gradually appreciated since early July 2007. This is likely to have been the result of its capacity as a funding currency of carry trades and the ensuing unwinding of these trades during the market turbulences. Between mid-August and October 2007, the Polish złoty and the Turkish lira more than recovered the losses suffered. The Hungarian forint and the Slovak koruna also recovered partially, but were trading about 2% and 1%, respectively, weaker against the euro in October 2007 than in mid-July. The Romanian leu continued to weaken until late September, before stabilizing at a level that was nearly 7% weaker than in mid-July.
Money market rate spreads to the euro (three-month rates) trended downward in Hungary, Poland and Slovakia as well as in Croatia and Turkey between mid-July and October. The spreads increased to a limited extent in the Czech Republic and Romania, and more significantly in Bulgaria and Russia. In countries where the spread decreased, this was the result of a rise in money market rates in the euro area, which was not or not fully reflected in local money market rates, with money market rates even declining over this period in Hungary as well as in Croatia and Turkey. In October, three-month money market rates in the Czech Republic and in Slovakia were lower than in the euro area.
Long-term interest rate spreads on CESEE local currency government bonds against the euro area were not strongly affected by the international financial market turbulence. Emerging market bond spreads increased by almost 60 basis points from mid-July tomid-August (on the basis of the J. P. Morgan Emerging Markets Government Bond Index,GBI-EM). By contrast, the spreads in Czech and Slovak local currency-denominated government bonds remained roughly stable (against euro area government bonds) in this period. The increase in the Polish and Russian spreads (around 40 basis points) was also smaller than that of the broad market. Out of the six CESEE countries included in theJ. P. Morgan GBI-EM, only spreads on Turkish (+180 basis points) and Hungarian(+75 basis points) government bonds increased more than the emerging market average. After a second wave of spread widening in early September, followed again by a narrowing, spread levels in October were still around 5 to 10 basis points above the mid-July levels
Developments of money market rate spreads…
Developments of money market rate spreads…
… and of long-term interest rate spreads on
local currency government bonds
… and of long-term interest rate spreads on
local currency government bonds
Chart 1b
113
111
109
107
105
103
101
99
97
95
December 29, 2006 = 100.0December 29, 2006 = 100.0December 29,
EUR per 1RON EUR per 1HRK EUR per 1RUB EUR per 1TRY
Source: Eurostat,Source: Eurostat,Source: OeNB. Eurostat, OeNB. Eurostat,
Jan. Feb. MarMar.Mar April MayMayMa June July Aug. Sep. Oct. Nov.
Exchange Rate Developments against the Euro in 2007

Developments in Selected Countries
Focus 2/07 ◊ ceec.oenb.at 19
in the Czech Republic and Slovakia, around 30 basis points in Hungary and Poland and 40 basis points in Russia. Turkey (where spreads had decreased substantially since mid-September) represented an exception, with spreads some 120 basis points lower in October than in mid-July. In terms of the total return in euro terms, between mid-July and October only Hungarian and Russian government bonds showed losses, with Hungary underperforming the overall emerging market index. By contrast, Czech and Polish as well as Turkish government bonds performed substantially better than the overall index.
Chart 2a
350
300
250
200
150
100
50
0
–50
–100
Czech Republic Hungary Poland Slovakia
Country subindices (J. Py subindices (J. Py subindices (J. P. P Morgan GBI-EM) in basis points for 2007
Source: BloomberSource: BloomberSource: g, Bloomberg, Bloomber OeNB.g, OeNB.g,
Local Currency Government Bond Yield Spreads against the Euro Area
Jan. Feb. MarMar.Mar April MayMayMa June July Aug. Sep. Oct. Nov.
Chart 2b
1,800
1,600
1,400
1,200
1,000
800
600
400
200
0
–200
Country subindices of J. Py subindices of J. Py subindices of J. P. P Morgan GBI-EM for Russia and Turkeyrkeyrkey,ey Eurostat data for Bulgar, Eurostat data for Bulgar, ia and Romania, in basis points for 20ia and Romania, in basis points for 20ia and Romania, 07
Russia
Local Currency Government Bond Yield Spreads against the Euro Area
Turkeyrkeyrk Bulgaria Romania
Local Currency Government Bond Yield Spreads against the Euro Area
Jan. Feb. MarMar.Mar April MayMayMa June July Aug. Sep. Oct. Nov.
Source: BloomberSource: BloomberSource: g, Bloomberg, Bloomber Eurostat,g, Eurostat,g, OeNB. Eurostat, OeNB. Eurostat,

Developments in Selected Countries
20 ceec.oenb.at ◊ Focus 2/07
The increase in the spreads on euro-denominated sovereign eurobonds issued by the Czech Republic, Poland and Slovakia were significantly smaller (10 to 15 basis points) than the increase in the average market spread (26 basis points, Euro EMBI Global) during the period of turbulence from mid-July to mid-August. The spread on Hungarian eurobonds rose somewhat less (20 basis points) than the average market spread, while the increase in Romanian eurobond spreads roughly matched the market average. Only the spreads on Bulgarian, Croatian and Turkish eurobonds widened more than the average emerging market spread (by 45 basis points in Turkey and 30 to 35 basis points in the other two countries). Spreads on Russian U.S. dollar-denominated eurobonds widened by 50 basis points, less than the overall (U.S. dollar) eurobond market (70 basis points, EMBI Global). Between mid-August and October, euro-denominated sovereign eurobond spreads decreased by up to 10 basis points in most CESEE countries covered in this box, by around 20 basis points in Bulgaria and by 25 basis points in Turkey, compared to a decline by10 basis points for the market average, while spreads on U.S. dollar-denominated sovereign eurobonds in Russia declined by 25 basis points compared to 50 basis points for the market average. As a result, in October eurobond spreads were about 15 to 25 basis points higher than in mid-July, except in the Czech Republic and Slovakia (only about5 basis points higher).
Equity price losses in the Czech Republic, Hungary, Poland, and Romania as well as Russia were somewhat larger (11% to 13%) than the losses registered in the U.S.A. or the euro area average (8% to 10%) between mid-July and mid-August 2007. However, the losses in these five countries were comparable to or smaller than those of other emerging markets and to some extent driven by the underperformance of local blue chips in the first half of 2007 (e.g. oil companies). Only Turkish equity prices decreased more substantially (by around 16%), partly as a result of rising political uncertainty ahead of parliamentary and presidential elections, but still in line with the performance of other emerging markets. The equity markets in the other countries of the region (Bulgaria, Slovakia, and Croatia) did significantly better than those in the U.S.A. and the euro area (though these markets are generally regarded as less liquid). Most of those CESEE countries which had registered more pronounced losses recovered between mid-August and October, with Czech, Turkish and Russian stocks having a positive return between mid-July and October.
Overall, and especially during the peak from mid-July to mid-August, CEESE financial markets have weathered relatively well the international financial market turbulencesthat started in mid-July 2007 and were accompanied by a tightening of global liquidity conditions and the repricing of risk. Any asset price losses and increases in risk premiums were well contained. In line with previous expectations, the countries with the largest economic imbalances and/or insufficient policy credibility as well as countries which had previously experienced strong capital inflows coupled with particularly high asset valuations were affected most (Hungary, Romania, Bulgaria, Croatia, Turkey and Russia). However, it should be borne in mind that country-specific factors may compromise the information content of capital market data and conceal underlying market pressure. The performance of some market indicators (e.g. exchange rate in Romania, money market rate spreads in Bulgaria, eurobond spreads in Romania and Croatia) suggests that market participants take into account country-specific signs of vulnerability, which may be an indication that a fresh wave of international market turbulence could exert additional pressure on these countries. Therefore, correcting existing economic imbalances, in particular external imbalances, in the near future remains imperative to prevent a loss of investor confidence in a relatively fragile international environment that is characterized by a more permanent reassessment of risks.
Spreads on euro-denominated
sovereign eurobonds
Spreads on euro-denominated
sovereign eurobonds
Equity price losses in most CESEE countries
slightly higher than U.S. or euro area averages
Equity price losses in most CESEE countries
slightly higher than U.S. or euro area averages
Up to October 2007, CESEE financial markets weathered international
turbulences quite well
Up to October 2007, CESEE financial markets weathered international
turbulences quite well

Developments in Selected Countries
Focus 2/07 ◊ ceec.oenb.at 21
2 Slovenia: Mixed Performance Following Euro AdoptionSlovenia’s GDP growth accelerated further during the first half of 2007 following an already strong expansion in 2006. Year-on-year output growth reached 6.5% during the first half year, up from 5.2% in full-year 2006. Economic growth was driven by domestic demand, in particular by investment growth. Investment activity was particularly strong in transport equipment, nonresidential and residential construction. Investment activity most likely received support from an acceleration of credit growth – in the first half of 2007, credits to the private sector expanded by an average of around 24% year on year – increased FDI inflows, high and rising industrial capacity utilization rates, preparations for Slovenia’s EU presidency during the first half of 2008, and the approaching end of the transitional period of lower VAT rates at the end of 2007 for housebuilding and repairs. The dynamics of consumption eased for several reasons: The growth rate of private consumption remained stable at slightly above 3% year on year in the first half of 2007, even though net real wages increased faster following the tax reform, credit growth accelerated and employment posted gains, and public consumption growth slowed significantly, even declining in the second quarter of 2007. Net real exports made a greater negative contribution to GDP growth, as faster import growth outpaced even faster export growth.
Mirroring the deterioration in net real exports and the slight worsening of the terms of trade, Slovenia’s deficit on the combined current and capital account more than tripled compared to the same period of 2006, rising to 3.4% of GDP in the first half of 2007. Most of the worsening was caused by the performance of the goods and services balance. In addition, the income deficit rose by almost 1 percentage point, mostly on account of rising income payments on FDI and other investment liabilities. Slovenia continued to post minor net FDI outflows during the first half of 2007. Portfolio capital outflows jumped to more than 11% of GDP, primarily because Slovenian banks invested their liquidity from expiring Banka Slovenije bills in foreign securities, but also because the nonbank private sector increased its investments abroad. As a result, Slovenia relied heavily on “other capital” inflows during the first half of 2007 (around 20% of GDP), overwhelmingly through the increase in external liabilities of Banka Slovenije, which refinanced expiring Banka Slovenije bills by taking out debt from the Eurosystem. This development was also reflected in Slovenia’s net foreign debt position, which had risen to 17.5% of GDP by mid-2007, up from 11% at the end of 2006. Within the net foreign debt position, private sector net foreign debt decreased, whereas the public sector’s net foreign position deteriorated noticeably as a result of a eurobond issue by the government and the aforementioned rise in the central bank’s external liabilities. However, it must be borne in mind that both Slovenia’s combined current and capital account deficit and its net external debt are to other euro area countries, and as such do not represent a foreign currency risk.
According to official estimates, the impact of the euro changeover on consumer price inflation amounted to around 0.25 to 0.3 percentage points (see issue 1/2007). Nevertheless, inflation accelerated quite significantly in the first half of 2007 to reach 4.0% in July 2007 before easing back to 3.4% to 3.6% in August and September, respectively (year on year). In October 2007,
GDP growth strengthened further following euro adoption
GDP growth strengthened further following euro adoption
Deficit of the combined current and capital account widened again
Deficit of the combined current and capital account widened again
Inflation on the riseInflation on the rise

Developments in Selected Countries
22 ceec.oenb.at ◊ Focus 2/07
inflation picked up again and came to 5.1% year on year. It is difficult to make out clearly the underlying sources of the pickup in inflation during the first ten months of 2007. On the one hand, according to the European Commission (Autumn Forecast 2007), while euro changeover effects appeared limited initially, some abnormal price increases have been reported since the expiration of the dual display of prices in mid-2007. In addition, anecdotal evidence reports that competition in the retail sector is quite low, as retailing food chains have just started to enter the country. Furthermore, year-on-year industrial producer price (PPI) inflation (domestic sales prices) rose sharply from the beginning of 2007 and was consistently above HICP inflation. However, within the domestic sales prices of industry, upward pressure on consumer goods was modest (at around 2% year on year). While prices under the direct control of the government exhibited a year-on-year inflation rate slightly below the HICP during the first eight months of 2007, they rose substantially more quickly since end-2006 than the overall price index. In addition, the prices of alcoholic beverages and tobacco were adversely influenced by the hike in excise taxes in July 2007. On the other hand,ULC growth in the whole economy remained well-contained during the first half of 2007 despite tightening labor market conditions, and no additional consumption-driven price pressure seems to have emerged over the past few quarters. Meanwhile, the government has pledged to curb inflation by introducing stricter control of regulated prices, particularly utility prices, by adjusting fuel taxes to compensate for the rise in oil prices (as far as minimum taxes allow) and by asking the state competition regulators to investigate prices charged by the main local food retailers. At the beginning of October, Banka Slovenije revised its forecast for annual average inflation (year on year) both in 2007 and 2008 to 3.3% from a previous 2.7% (in both years).
According to most recent data, the 2006 budget deficit was revised down from 1.4% of GDP to 1.2% of GDP. In its 2006 update of the stability program, the government penciled in a deficit of 1.5% for 2007. However, in its fiscal notification of October 2007, the government expects a substantially smaller deficit in 2007 of around 0.6% of GDP. The government explained the improvement mostly as a result of lower than planned expenditures, but also of revenue performance in excess of the original target. Considering the robust performance of the economy, the revision has not come as a surprise. The government has also revised down its deficit target for 2008 to 0.6% of GDP, from a deficit target of 1.6% contained in the 2006 stability program update, while the shortfall is expected to decrease to 0.3% of GDP in 2009.
2007 budget deficit to be significantly smaller
than originally envisaged
2007 budget deficit to be significantly smaller
than originally envisaged

Developments in Selected Countries
Focus 2/07 ◊ ceec.oenb.at 23
Table 7
Main Economic Indicators: Slovenia
2004 2005 2006 Q1 2006 Q2 2006 Q3 2006 Q4 2006 Q1 2007 Q2 2007
Year-on-year change of the period total in %GDP in constant prices 4.4 4.0 5.2 5.0 4.7 5.6 5.5 7.2 5.9Private consumption 2.6 3.4 3.3 3.1 3.4 3.6 3.0 3.0 3.4Public consumption 3.4 2.2 3.8 4.4 3.5 3.0 4.2 1.1 –0.7Gross fixed capital formation 7.9 1.5 11.9 8.6 8.5 14.6 15.2 21.7 21.4Exports of goods and services 12.5 10.5 10.0 14.9 9.4 6.9 9.5 14.3 13.6Imports of goods and services 13.4 7.0 10.4 13.8 9.0 8.4 10.7 14.6 17.0
Contribution to GDP growth in percentage pointsDomestic demand 5.4 1.9 5.8 4.4 4.6 7.0 7.3 7.9 8.9Net exports of goods and services –0.9 2.0 –0.4 0.6 0.2 –1.0 –1.4 –0.2 –2.4Exports of goods and services 7.4 6.8 6.8 9.7 6.4 4.8 6.6 10.2 9.7Imports of goods and services 8.3 4.8 7.2 9.1 6.2 5.9 8.0 10.4 12.1
Year-on-year change of the period average in %Labor productivity of industry (real) 6.4 5.9 7.9 9.6 6.2 8.9 7.0 8.5 6.9Gross average wage of industry (nominal) 7.1 5.8 5.5 6.5 5.8 4.3 5.4 5.6 5.8Unit labor cost of industry (nominal) 0.7 –0.1 –2.3 –2.9 –0.4 –4.3 –1.5 –2.7 –1.1Producer price index (PPI) of industry 4.4 2.8 2.4 1.6 2.4 2.8 2.7 4.5 5.0Consumer price index (here: HICP) 3.7 2.5 2.5 2.3 3.1 2.5 2.3 2.6 3.2EUR per 1 SIT, + = SIT appreciation –2.2 –0.2 0.0 0.1 0.0 –0.1 0.0 –0.1 0.0
Period average levelsUnemployment rate (ILO definition, %, 15–64 years) 6.5 6.7 6.1 7.0 6.0 5.7 5.7 5.8 4.7Employment rate (15–64 years) 65.3 66.0 66.6 65.9 67.1 67.2 66.0 66.0 68.3Key interest rate per annum (%) 4.6 4.0 3.5 3.8 3.5 3.4 3.5 3.5 3.8SIT per 1 EUR 239.1 239.6 239.6 239.5 239.6 239.6 239.6 239.6 239.6
Nominal year-on-year change of the period average stock in %Broad money (including foreign currency deposits)1 5.1 6.6 8.4 8.1 9.5 7.9 8.3 18.4 21.2
Contributions to the year-on-year change of broad money in percentage pointsNet foreign assets of the banking system –8.1 –10.4 –15.6 –14.6 –15.3 –16.2 –16.3 –19.5 –18.0Domestic credit of the banking system 14.0 19.7 24.7 22.6 24.4 24.9 26.7 30.6 33.9
of which: claims on the private sector 11.5 16.6 26.8 23.8 26.3 27.3 29.5 29.9 32.7claims on households 2.7 4.4 7.0 6.3 7.0 7.2 7.5 7.3 7.5claims on enterprises 8.8 12.3 19.8 17.5 19.3 20.1 22.1 22.6 25.2
claims on the public sector (net) 2.4 3.0 –2.1 –1.1 –1.9 –2.3 –2.8 0.7 1.2Other domestic assets (net) of the banking system –0.8 –2.7 –0.6 0.2 0.3 –0.8 –2.1 7.3 5.3
% of GDP, ESA 95General government revenues 44.2 44.5 44.1 . . . . . . . . . . . .General government expenditures 46.5 46.0 45.3 . . . . . . . . . . . .General government balance –2.3 –1.5 –1.2 . . . . . . . . . . . .Primary balance –0.5 0.1 0.2 . . . . . . . . . . . .Gross public debt 27.6 27.4 27.1 . . . . . . . . . . . .
Year-on-year change of the period total (based on EUR) in %Merchandise exports 13.3 12.9 16.7 19.4 13.9 15.9 17.7 18.8 13.2Merchandise imports 16.6 12.1 16.2 19.3 14.1 15.4 16.2 18.1 18.3
% of GDP (based on EUR), period totalTrade balance –3.8 –3.7 –3.8 –3.0 –1.5 –3.4 –7.1 –2.8 –4.3Services balance 2.6 3.1 3.0 3.0 3.3 2.8 2.7 2.8 2.6Income balance (factor services balance) –1.2 –1.0 –1.2 –1.1 –1.0 –1.2 –1.3 –1.9 –1.8Current transfers –0.3 –0.3 –0.6 –1.3 –0.1 –1.0 0.0 –1.0 –0.5Current account balance –2.7 –2.0 –2.5 –2.4 0.7 –2.8 –5.6 –2.9 –4.0Capital account balance –0.4 –0.4 –0.4 –0.1 –0.3 –0.4 –0.7 0.3 –0.1Foreign direct investment (net) 0.9 –0.2 –1.0 –0.9 –0.8 0.1 –2.2 –1.2 –0.2
% of GDP (rolling four-quarter GDP, based on EUR), end of periodGross external debt 58.5 71.0 80.3 75.9 78.2 78.4 80.3 92.6 95.6Gross official reserves (excluding gold) 24.6 24.7 18.0 24.4 22.7 19.9 18.0 2.7 2.7
Months of imports of goods and servicesGross official reserves (excluding gold) 4.8 4.6 3.1 4.4 4.0 3.5 3.1 0.5 0.4
EUR million, period totalGross domestic product in current prices 26,230 27,634 29,742 6,848 7,632 7,590 7,671 7,640 8,389
Source: Bloomberg, European Commission, Eurostat, national statistical off ices, national central banks, wiiw, OeNB.1 The methodology for calculating broad money and its components was changed for data from the beginning of 2005.
Developments in Selected Countries
24 ceec.oenb.at ◊ Focus 2/07
3 Bulgaria: Noticeable Macroeconomic Imbalances Accompany High and Rising Inflation
In the first half of 2007, real GDP growth remained robust at 6.4% year on year, driven by private domestic demand, which was fueled by rapid credit growth (real credit to the private sector increased on average by more than 35% year on year in the first half of 2007). Growth of GFCF soared particularly strongly (+30% year on year in the first half of 2007). Private consumption was buoyant as well, also supported by strong wage growth. In the second quarter of 2007 compared to the first quarter of 2007, however, growth of private consumption and of GFCF slowed down somewhat. One reason seems to be that the construction sector, which is one of the main drivers of investment growth, is possibly reaching capacity constraints. The negative contribution of net exports to GDP growth increased further in the first half of 2007 compared to the first half of 2006 (and to the entire year 2006). However, the negative contribution of net exports to GDP growth was smaller in the second quarter of 2007 than in the first quarter of 2007, above all because exports performed better and import demand was lower.
Strong economic growth helped reduce the unemployment rate (ILO definition) to an average level of 7.5% in the first half of 2007 compared to 9.4% in the same period of 2006. Wage growth in industry was strong in the first half of 2007, outpacing productivity increases by about 10% and thus translating into higher ULC. In contrast to rapid wage growth in the industrial sector, the government has pursued a somewhat more restrictive wage policy with the aim of preserving macroeconomic stability. In July 2007, nominal wages in the public sector were boosted by 10%. Still, this has opened the door to public pay disputes (e.g. schoolteachers went on strike demanding doubling their current pay to keep apace with wages in the private sector). Pension policies were less prudent, as pensions were raised twice by 10% in July and again in October 2007.
After dipping temporarily in 2006, real growth of credit to the private sector resurged in the course of 2007 and reached 50% year on year at the end of July 2007, largely driven by the removal of administrative credit restrictions in early 2007, by a so-called reimport of credit portfolios15 as well as by new lending activities. The abrupt increase of credit growth prompted the Bulgarian National Bank (BNB) to tighten monetary requirements by adjusting the reserve requirement level again. The central bank raised the minimum required reserves from 8% to 12% as of September 2007 with the intention of ensuring good credit quality in the future, but also of dampening domestic demand growth and its impact on the external accounts.
In first half of 2007, the massive and fast widening of the combined current and capital account deficit, which Bulgaria has witnessed for the last few years, continued unabatedly. The combined current and capital account gap reached almost 23% of GDP compared to 16% of GDP in the first half of 2006. This development is largely attributable to a deterioration of the trade balance, in turn reflecting ongoing strong private consumption and exceptionally high
15 Comprising credit portfolios which had been shifted abroad, in particular to parent banks, in response to credit ceilings.
Domestic demand continues to drive
strong economic growth
Domestic demand continues to drive
strong economic growth
Substantial drop in unemployment,
divergent wage dynamics in the public and private
sector
Substantial drop in unemployment,
divergent wage dynamics in the public and private
sector
Abrupt rise in the growth of credit
to the private sector prompts central bank
to raise minimum reserve requirements
Abrupt rise in the growth of credit
to the private sector prompts central bank
to raise minimum reserve requirements
FDI inflows largely cover higher combined current
and capital account deficit
FDI inflows largely cover higher combined current
and capital account deficit

Developments in Selected Countries
Focus 2/07 ◊ ceec.oenb.at 25
Table 8
Main Economic Indicators: Bulgaria
2004 2005 2006 Q1 2006 Q2 2006 Q3 2006 Q4 2006 Q1 2007 Q2 2007
Year-on-year change of the period total in %GDP in constant prices 6.6 6.2 6.1 5.5 6.4 6.7 5.7 6.2 6.6Private consumption 5.9 6.1 7.5 5.2 8.2 9.0 7.5 9.1 6.4Public consumption 3.8 2.3 2.2 4.1 3.1 0.9 1.4 –2.4 –0.3Gross fixed capital formation1 13.5 23.3 17.6 17.1 16.0 11.7 23.8 35.9 24.9Exports of goods and services 12.8 8.6 8.9 12.7 10.0 8.4 5.4 2.2 5.7Imports of goods and services 14.5 13.1 15.1 20.8 12.2 14.7 13.9 13.2 10.7
Contribution to GDP growth in percentage pointsDomestic demand 7.8 13.2 13.1 13.2 9.3 15.3 14.0 14.4 13.7Net exports of goods and services –3.3 –5.1 –7.2 –9.6 –4.2 –6.0 –9.0 –11.3 –6.3Exports of goods and services 7.6 5.4 5.8 8.0 6.9 5.7 3.1 1.5 4.0Imports of goods and services 10.9 10.5 12.9 17.6 11.1 11.7 12.2 12.8 10.3
Year-on-year change of the period average in %Labor productivity of industry (real) 15.2 3.4 8.2 10.1 8.5 9.0 5.0 6.3 8.7Gross average wage of industry (nominal) 6.3 8.1 10.8 9.4 9.4 11.7 12.7 17.6 19.5Unit labor cost of industry (nominal) –7.8 4.6 2.5 –0.6 0.8 2.5 7.3 10.6 9.9Producer price index (PPI) of industry 5.9 7.0 9.4 8.4 10.0 10.7 8.3 7.4 6.8Consumer price index (here: HICP) 6.1 6.0 7.4 8.7 8.6 6.7 5.7 5.3 4.7EUR per 1 BGN, + = BGN appreciation –0.2 –0.1 0.0 0.0 0.0 0.0 0.0 0.0 0.0
Period average levelsUnemployment rate (ILO definition, %,15–64 years) 12.2 10.2 9.0 9.8 9.0 8.9 8.4 8.0 6.9Employment rate (15–64 years) 54.2 55.8 58.6 55.5 59.1 60.3 59.8 59.7 61.6Key interest rate per annum (%) 2.6 2.1 2.6 2.2 2.5 2.7 3.1 3.5 3.7BGN per 1 EUR 2.0 2.0 2.0 2.0 2.0 2.0 2.0 2.0 2.0
Nominal year-on-year change of the period average stock in %Broad money (including foreign currency deposits) 22.3 27.3 21.3 19.2 17.0 22.3 26.1 28.1 28.5
Contributions to the year-on-year change of broad money in percentage pointsNet foreign assets of the banking system 4.4 8.9 14.7 8.3 10.7 16.0 22.6 19.2 11.4Domestic credit of the banking system 21.8 25.8 13.0 18.5 12.7 12.2 9.4 14.4 22.3
of which: claims on the private sector 26.3 27.9 16.4 17.9 12.6 17.3 17.7 22.3 31.3claims on households 10.0 13.0 9.4 11.7 9.2 8.8 8.3 9.2 11.1claims on enterprises 16.3 14.9 7.0 6.2 3.5 8.5 9.4 13.1 20.2
claims on the public sector (net) –4.5 –2.1 –3.4 0.6 0.0 –5.2 –8.3 –7.9 –9.0Other domestic assets (net) of the banking system –3.8 –7.4 –6.4 –7.6 –6.4 –5.9 –5.9 –5.5 –5.3
% of GDP, ESA 95General government revenues 42.0 41.6 40.3 . . . . . . . . . . . .General government expenditures 39.7 39.6 37.1 . . . . . . . . . . . .General government balance 2.3 2.0 3.2 . . . . . . . . . . . .Primary balance 4.0 3.6 4.6 . . . . . . . . . . . .Gross public debt 37.9 29.2 22.8 . . . . . . . . . . . .
Year-on-year change of the period total (based on EUR) in %Merchandise exports 19.7 18.6 26.6 28.4 31.8 32.1 15.6 6.2 8.8Merchandise imports 20.3 26.9 25.2 33.0 21.9 25.8 22.1 18.7 17.5
% of GDP (based on EUR), period totalTrade balance –14.9 –20.2 –21.5 –20.6 –19.3 –18.9 –26.5 –27.0 –24.4Services balance 3.3 3.7 2.9 –3.5 3.5 10.9 –1.1 –2.0 4.8Income balance (factor services balance) 1.2 0.7 0.2 0.3 0.7 –0.3 0.0 0.1 –0.4Current transfers 3.7 3.7 2.6 2.3 2.6 3.2 2.2 1.6 1.3Current account balance –6.6 –12.0 –15.8 –21.4 –12.5 –5.1 –25.4 –27.3 –18.5Capital account balance 0.8 1.0 0.7 0.4 0.8 0.7 0.9 0.1 0.4Foreign direct investment (net) 11.3 14.5 15.9 15.0 20.5 11.6 16.9 14.3 17.7
% of GDP (rolling four-quarter GDP, based on EUR), end of periodGross external debt 63.7 69.0 80.1 72.3 75.1 78.6 80.1 80.1 81.7Gross official reserves (excluding gold) 32.4 31.1 33.1 28.6 31.3 32.5 33.1 32.2 33.7
Months of imports of goods and servicesGross official reserves (excluding gold) 5.7 4.9 4.8 4.3 4.7 4.8 4.8 4.7 4.8
EUR million, period totalGross domestic product in current prices 19,874 21,882 25,100 5,102 5,954 7,026 7,018 5,877 6,637
Source: Bloomberg, European Commission, Eurostat, national statistical off ices, national central banks, wiiw, OeNB.1 National source.

Developments in Selected Countries
26 ceec.oenb.at ◊ Focus 2/07
investment growth. On the financial side, in the first half of the year, net FDI inflows, an important source of financing in Bulgaria, remained strong and covered about 70% of the combined current and capital account gap.
As part of the high current account deficit has been financed by nonequity inflows, Bulgaria’s net external debt has risen further. Also, gross foreign debt has picked up somewhat. While private gross external debt amounted to roughly 70% of GDP in annual terms in the first half of 2007 compared to 58.6% of GDP for the same period in 2006, public sector debt has been decreasing steadily.
In Bulgaria, average HICP inflation increased to 7.4% in 2006 because excise duties and oil prices increased sharply. After the HICP rate had dropped to 4.5% year on year in May, it resurged to above 9% year on year in August and further to 11.0% year on year in September 2007, the highest monthly inflation level since May 2001. This rise reflected strong domestic demand, wage hikes, rising food prices, partly as a result of unfavorable weather conditions, as well as higher oil prices. Food price inflation speeded up notably from 4.2% in May to 25.6% in September (year on year). The BNB has revised its inflation forecast upward significantly and estimates year-end inflation to come to 6.6% in 2007 (up from 4.4% earlier).
Fiscal policy remains the key tool to control domestic demand and to counter external imbalances under the currency board arrangement. In 2006, the budget surplus came in at 3.3% of GDP. According to the fiscal notification published in October 2007, the surplus for 2007 is expected to come in at 2.5% of GDP, noticeably more than originally planned in the convergence program (0.8% of GDP) and in general in accord with, but somewhat lower than what was agreed with the IMF (surplus of 3% of GDP) during the regular annual Article IV consultation in October 2007. Revising the target upward was motivated by signs of overheating and increased external vulnerabilities.
4 Czech Republic: Gradual Deceleration of Growth DynamicsEconomic activity in the Czech Republic remained strong in the first half of 2007 despite some slowdown compared to 2006. While the pace of growth appears to be losing some momentum, its sources have not substantially changed. Like in 2006, the economy again grew predominantly on the backof domestic demand. The increase in domestic demand in the first half of2007 can be ascribed to a large extent to inventory accumulation and, most importantly, to private consumption of almost 7% year on year. The latter was fueled by falling unemployment rates, real wage growth, unprecedentedly high consumer confidence as well as the continued fast real expansion of credit to the private sector (of slightly more than 18% year on year on average in the first half of 2007). In contrast, the growth rate of GFCF almost halved in the first six months of 2007 year on year. The contribution of net exports to GDP growth turned slightly negative in the first half of 2007, as export growth declined more than import growth did.
On the back of long-term robust growth, unemployment fell furtherin the course of 2007 to levels unseen since the mid-1990s. In parallel, however, structural mismatches on the labor market seem to be deepening(as corroborated by persistent long-term unemployment), implying that the
Continued significant increase in private gross
external debt
Continued significant increase in private gross
external debt
HICP inflation resurges to double-digit level in August and September
2007 on the back of rising food prices and
strong wage growth
HICP inflation resurges to double-digit level in August and September
2007 on the back of rising food prices and
strong wage growth
Fiscal surplus target of around 3% of GDP
for 2007 appears to be within reach
Fiscal surplus target of around 3% of GDP
for 2007 appears to be within reach
Domestic demand keeps on driving economic
activity
Domestic demand keeps on driving economic
activity
Deepening labor market mismatches
Deepening labor market mismatches
Developments in Selected Countries
Focus 2/07 ◊ ceec.oenb.at 27
scope for further unemployment reductions might be limited. The mounting anecdotal evidence on shortages of skilled labor is starting to be reflected in accelerating wage growth. In the second quarter of 2007, nominal ULC in industry (in local currency) increased after having fallen for more than four years.
Reflecting improving terms of trade, the surplus of foreign trade in goods and services (as a percentage of GDP) almost doubled in the first half of 2007 compared to the same period of 2006. This result was brought about primarily by the increased surplus in trade with vehicles and machines, particularly owing to production rises in the car industry. At the same time, the appreciation of the Czech koruna against the U.S. dollar and relatively contained oil prices (in the first half of 2007) lowered the import deficit in oil and raw materials. As a result, the combined current and capital account deficit was lower than in 2006 despite the continued high income deficit, which was chiefly ascribable to the repatriation of profits by foreign-owned companies. Since robust net FDI inflows exceeded the total financing need and other capital outflows, the remaining FDI inflows increased foreign reserves by 0.4% of GDP.
In 2006, annual average HICP inflation had risen by a little more than 2%, partly because of the nominal appreciation of the koruna and a significant drop in the oil price toward the end of the year. However, the widening negative interest rate spread between the Czech Republic and the euro area boosted koruna-denominated carry trade. The appreciation trend was thus reversed, and the koruna lost against the euro in the first six months of 2007. Hence, currency depreciation against the euro along with rising food and tobacco prices, adjustments of administered prices as well as inflation pressures emanating from the tightening labor market gradually caused inflation to accelerate. The pickup in inflation, combined with anticipated monetary tightening in the Czech Republic (at least relative to the euro area) and possibly some unwinding of carry trades in the context of global financial market turmoil, triggered a new and fairly strong appreciation trend of the koruna. The currency fully recovered its losses of the first half of the year and reached an all-time high against the euro at the end of October 2007. Despite this strong appreciation, inflation climbed to 2.8% in September 2007. Moreover, the CPI,16 the actual target index of Cstrong appreciation, inflation climbed to 2.8% in September 2007. Moreover,
ˇstrong appreciation, inflation climbed to 2.8% in September 2007. Moreover,
eská národní banka (Cstrong appreciation, inflation climbed to 2.8% in September 2007. Moreover,
ˇstrong appreciation, inflation climbed to 2.8% in September 2007. Moreover,
NB), came to 2.8% in September, close to the midpoint of its target of 3%17 (±1 percentage point). For December 2007, the C2.8% in September, close to the midpoint of its target of 3%
ˇ2.8% in September, close to the midpoint of its target of 3%
NB forecasts inflation of 3.8%. According to the Cpoint). For December 2007, the C
ˇpoint). For December 2007, the C
NB, major country-specific downside risks to this forecast are lower than assumed inflation expectations, whereas upside risks lurk in the strong economic performance. Against this backdrop, the key interest rate was raised in three steps from 2.5% to 3.25% between May and August.
After the general government deficit improved somewhat in 2006 to 2.9% of GDP owing to robust economic growth, a deficit of 3.4% of GDP is expected
16 The CPI has been on average 0.2 to 0.3 percentage points higher than the HICP since 2003. The main reasons for this discrepancy are (1) the use of different weights in the indices, (2) the treatment of purchases of goods by foreigners and (3) the treatment of imputed rents.
17 In January 2010, the current target effective since January 2006 will be replaced by a new target for CPI growth of 2% (±1 percentage point), which is supposed to better reflect the long-term development of the Czech economy.
Combined capital and current account balance improves on the back of a soaring trade surplus
Combined capital and current account balance improves on the back of a soaring trade surplus
Is inflation taking off?Is inflation taking off?
First attempts at fiscal consolidationFirst attempts at fiscal consolidation
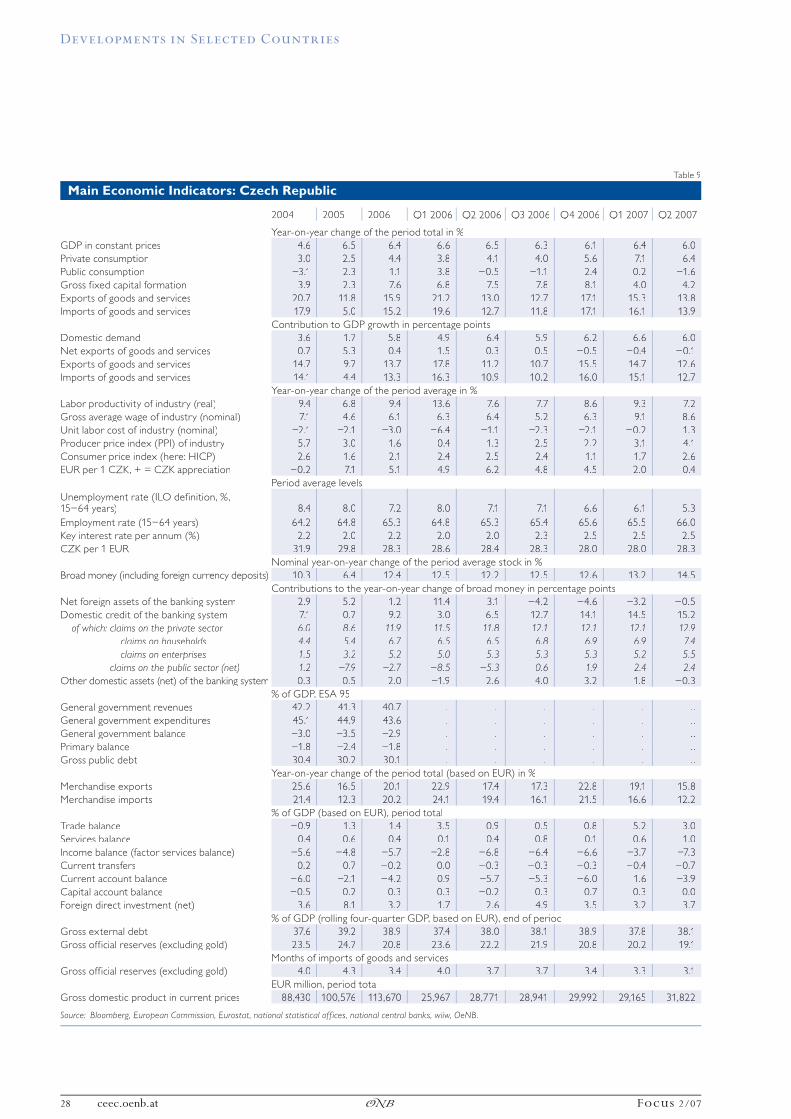
Developments in Selected Countries
28 ceec.oenb.at ◊ Focus 2/07
Table 9
Main Economic Indicators: Czech Republic
2004 2005 2006 Q1 2006 Q2 2006 Q3 2006 Q4 2006 Q1 2007 Q2 2007
Year-on-year change of the period total in %GDP in constant prices 4.6 6.5 6.4 6.6 6.5 6.3 6.1 6.4 6.0Private consumption 3.0 2.5 4.4 3.8 4.1 4.0 5.6 7.1 6.4Public consumption –3.1 2.3 1.1 3.8 –0.5 –1.1 2.4 0.2 –1.6Gross fixed capital formation 3.9 2.3 7.6 6.8 7.5 7.8 8.1 4.0 4.2Exports of goods and services 20.7 11.8 15.9 21.2 13.0 12.7 17.1 15.3 13.8Imports of goods and services 17.9 5.0 15.2 19.6 12.7 11.8 17.1 16.1 13.9
Contribution to GDP growth in percentage pointsDomestic demand 3.6 1.7 5.8 4.9 6.4 5.9 6.2 6.6 6.0Net exports of goods and services 0.7 5.3 0.4 1.5 0.3 0.5 –0.5 –0.4 –0.1Exports of goods and services 14.7 9.7 13.7 17.8 11.2 10.7 15.5 14.7 12.6Imports of goods and services 14.1 4.4 13.3 16.3 10.9 10.2 16.0 15.1 12.7
Year-on-year change of the period average in %Labor productivity of industry (real) 9.4 6.8 9.4 13.6 7.6 7.7 8.6 9.3 7.2Gross average wage of industry (nominal) 7.1 4.6 6.1 6.3 6.4 5.2 6.3 9.1 8.6Unit labor cost of industry (nominal) –2.1 –2.1 –3.0 –6.4 –1.1 –2.3 –2.1 –0.2 1.3Producer price index (PPI) of industry 5.7 3.0 1.6 0.4 1.3 2.5 2.2 3.1 4.1Consumer price index (here: HICP) 2.6 1.6 2.1 2.4 2.5 2.4 1.1 1.7 2.6EUR per 1 CZK, + = CZK appreciation –0.2 7.1 5.1 4.9 6.2 4.8 4.5 2.0 0.4
Period average levelsUnemployment rate (ILO definition, %, 15–64 years) 8.4 8.0 7.2 8.0 7.1 7.1 6.6 6.1 5.3Employment rate (15–64 years) 64.2 64.8 65.3 64.8 65.3 65.4 65.6 65.5 66.0Key interest rate per annum (%) 2.2 2.0 2.2 2.0 2.0 2.3 2.5 2.5 2.5CZK per 1 EUR 31.9 29.8 28.3 28.6 28.4 28.3 28.0 28.0 28.3
Nominal year-on-year change of the period average stock in %Broad money (including foreign currency deposits) 10.3 6.4 12.4 12.5 12.2 12.5 12.6 13.2 14.5
Contributions to the year-on-year change of broad money in percentage pointsNet foreign assets of the banking system 2.9 5.2 1.2 11.4 3.1 –4.2 –4.6 –3.2 –0.5Domestic credit of the banking system 7.1 0.7 9.2 3.0 6.5 12.7 14.1 14.5 15.2
of which: claims on the private sector 6.0 8.6 11.9 11.5 11.8 12.1 12.1 12.1 12.9claims on households 4.4 5.4 6.7 6.5 6.5 6.8 6.9 6.9 7.4claims on enterprises 1.5 3.2 5.2 5.0 5.3 5.3 5.3 5.2 5.5
claims on the public sector (net) 1.2 –7.9 –2.7 –8.5 –5.3 0.6 1.9 2.4 2.4Other domestic assets (net) of the banking system 0.3 0.5 2.0 –1.9 2.6 4.0 3.2 1.8 –0.3
% of GDP, ESA 95General government revenues 42.2 41.3 40.7 . . . . . . . . . . . .General government expenditures 45.1 44.9 43.6 . . . . . . . . . . . .General government balance –3.0 –3.5 –2.9 . . . . . . . . . . . .Primary balance –1.8 –2.4 –1.8 . . . . . . . . . . . .Gross public debt 30.4 30.2 30.1 . . . . . . . . . . . .
Year-on-year change of the period total (based on EUR) in %Merchandise exports 25.6 16.5 20.1 22.9 17.4 17.3 22.8 19.1 15.8Merchandise imports 21.4 12.3 20.2 24.1 19.4 16.1 21.5 16.6 12.2
% of GDP (based on EUR), period totalTrade balance –0.9 1.3 1.4 3.5 0.9 0.5 0.8 5.2 3.0Services balance 0.4 0.6 0.4 0.1 0.4 0.8 0.1 0.6 1.0Income balance (factor services balance) –5.6 –4.8 –5.7 –2.8 –6.8 –6.4 –6.6 –3.7 –7.3Current transfers 0.2 0.7 –0.2 0.0 –0.3 –0.3 –0.3 –0.4 –0.7Current account balance –6.0 –2.1 –4.2 0.9 –5.7 –5.3 –6.0 1.6 –3.9Capital account balance –0.5 0.2 0.3 0.3 –0.2 0.3 0.7 0.3 0.0Foreign direct investment (net) 3.6 8.1 3.2 1.7 2.6 4.9 3.5 3.2 3.7
% of GDP (rolling four-quarter GDP, based on EUR), end of periodGross external debt 37.6 39.2 38.9 37.4 38.0 38.1 38.9 37.8 38.1Gross official reserves (excluding gold) 23.5 24.7 20.8 23.6 22.2 21.9 20.8 20.2 19.1
Months of imports of goods and servicesGross official reserves (excluding gold) 4.0 4.3 3.4 4.0 3.7 3.7 3.4 3.3 3.1
EUR million, period totalGross domestic product in current prices 88,430 100,576 113,670 25,967 28,771 28,941 29,992 29,165 31,822
Source: Bloomberg, European Commission, Eurostat, national statistical off ices, national central banks, wiiw, OeNB.

Developments in Selected Countries
Focus 2/07 ◊ ceec.oenb.at 29
for 2007 according the fiscal notification of October 2007. The higher deficit, which nevertheless remains below the previous forecast of –4% of GDP according to the update of the convergence program released in March 2007, is chiefly due to higher social transfers approved before the 2006 elections. However, the coalition government, which has been in office since the beginning of 2007, was determined to accelerate the process of fiscal consolidation and managed to push through a reform package despite a weak parliamentary majority and despite lengthy internal wrangling over details. The key items of the package are the introduction of some direct payments for health care, lower and flat personal income taxes, corporate income tax cuts, and increases of the preferential VAT rate and of some excise taxes. On the expenditure side, the government envisages some slashing of social and health care benefits. As a result, the Ministry of Finance expects the deficit to fall to 2.9% of GDP in 2008 and further to 2.3% of GDP by 2010, which is considerably below the forecasts according to the update of the convergence program published in March 2007 (2008: –3.5% of GDP, 2009: –3.2% of GDP). A more thorough overhaul of the pension and health care systems is still under discussion, and a proposal is expected in the months to come.
5 Hungary: GDP Growth at 11-Year Low in the First Half of 2007
GDP growth slowed sharply during the first half of 2007 to a meager 1.9% year on year, down from almost 4% in full-year 2006. The slowdown intensified in the course of the period, and the growth rate reached only little more than 1% (year on year) in the second quarter of 2007. While net real exports remained the driving force of growth, the significant decrease in their contribution to GDP growth was one of the reasons for the deceleration of output dynamics. Domestic demand continued to expand only very sluggishly during the first half of 2007. In a breakdown, consumption growth slumped as a result of the fiscal tightening, declining real wages and roughly stable employment, a significant easing of real credit growth (the real growth of credit to the private sector averaged just 2.5% year on year in the first half of 2007), and the ongoing weakness of consumer sentiment. Investment activity improved somewhat compared to 2006, but still remained anemic. In particular, public sector investment activity contracted on a year-on-year basis, whereas manufacturing investment rebounded sharply, inter alia because industrial capacity utilization improved and an FDI-related one-off project was undertaken in the tire industry. Inventory building has gradually intensified since the beginning of 2007 to become the major element of domestic demand in the first six months of 2007.
According to the latest figures, the 2006 general government budget deficit came in at 9.2% of GDP. In the 2006 update of the convergence program,the government penciled in a deficit of 6.8% of GDP for 2007. However, reflecting better than expected revenue performance and lower than expected expenditures (mainly interest expenditures) in the course of the year, the budget deficit for the entire year 2007 was revised down to 6.4% of GDP in the October 2007 fiscal notification. In its draft budget plans for 2008, the government targets a further deficit reduction to 4.1% of GDP in 2008, slightly
Domestic demand continues to expand only little
Domestic demand continues to expand only little
Government finances on a consolidation pathGovernment finances on a consolidation path

Developments in Selected Countries
30 ceec.oenb.at ◊ Focus 2/07
below the 4.3% target that had been set out in the 2006 convergence program update. The government has also made progress in some important structural reforms in the course of 2007, which are seen as necessary to secure the sustainability of fiscal consolidation beyond 2008. In particular, in late September 2007, the government coalition reached a political agreement about a comprehensive reform of the health insurance system, which is to be introduced from January 1, 2008. The government has also decided measures that parliament is expected to adopt in 2008, namely to introduce three-year budgetary planning from 2009 onward, to set targets for the primary budget balance and to introduce limits on the increase in public debt. Furthermore, progress has been made on multiparty negotiations on the reform of fiscal institutions (for example the establishment of an independent budget office), which require a qualified parliamentary majority.
During the first half of 2007, the deficit of the combined current and capital account fell to below 6% of GDP. The improvement stemmed from a sharp widening of the surplus on the goods and services balance. This reflected the weakness of domestic demand, still favorable export conditions and a slight improvement in the terms of trade. By contrast, the surplus on the transfer balance and on the capital account narrowed moderately. The deficit on the income balance, which is the source of the combined current and capital account deficit, widened as a result of increased FDI profit repatriation, of outflows related to portfolio equity income and of interest payments on foreign debt. Large net FDI outflows were registered as a result of a one-off transaction. Therefore, the major financing item was “other investments,” mainly borrowing by the private sector (roughly evenly split between banks and other sectors).
Following the rapid and substantial pickup until early 2007, inflation peaked at almost 9.0% year on year in the first quarter of 2007 and then gradually decreased to 6.4% year on year in September 2007. Inflation excluding energy and unprocessed food prices stagnated at slightly above 7.0% until August before easing back to 5.8% in September. Magyar Nemzeti Bank (MNB) has revised its inflation projection upward for 2007 and 2008 and downward for 2009 and now expects inflation to fall to around 6% by year-end 2007, to 3.7% by end-2008, and to 2.4% in the last quarter of 2009. The negative output gap and weak domestic consumption support disinflation, while adverse energy and food price developments will likely slow the disinflation process in the remainder of 2007 and in 2008. The moderation of wage growth from currently rather high levels will be key, and preventing the expected acceleration of food and energy price inflation from feeding through to inflation expectations and wages remains a challenge. According to the MNB, the risks to the inflation outlook relate mainly to the development of inflation expectations and wages, the magnitude of the disinflationary effect of weak domestic consumption, and the timing and magnitude of the recovery of consumption.
Following a period of a steady policy rate between October 2006 andlate June 2007, the MNB responded to the improvement in inflationary developments by cutting its key policy rate by 25 basis points at the end of June 2007. Given the uncertainties surrounding the inflation outlook and the major shakeup on the global financial markets since mid-July 2007, the MNB took a
Narrowing deficit on combined current and
capital account
Narrowing deficit on combined current and
capital account
Inflation decreases gradually from relatively
high levels
Inflation decreases gradually from relatively
high levels
MNB on a cautious rate cutting cycle
MNB on a cautious rate cutting cycle

Developments in Selected Countries
Focus 2/07 ◊ ceec.oenb.at 31
Table 10
Main Economic Indicators: Hungary
2004 2005 2006 Q1 2006 Q2 2006 Q3 2006 Q4 2006 Q1 2007 Q2 2007
Year-on-year change of the period total in %GDP in constant prices 4.8 4.1 3.9 4.9 3.7 3.9 3.3 2.7 1.2Private consumption 3.1 3.7 1.5 2.6 1.7 1.4 0.3 0.4 –0.9Public consumption 1.8 2.4 2.1 5.4 2.4 –3.2 3.6 –6.4 –8.8Gross fixed capital formation 7.6 5.3 –2.1 9.9 –3.6 –4.4 –4.8 2.0 0.8Exports of goods and services 15.7 11.5 17.9 18.4 15.8 17.2 20.1 17.6 14.6Imports of goods and services 14.1 6.9 12.4 15.5 9.5 10.4 14.5 14.9 14.1
Contribution to GDP growth in percentage pointsDomestic demand 4.4 1.4 0.4 3.0 –0.5 –0.3 –0.2 1.0 0.5Net exports of goods and services 0.4 3.5 4.7 2.3 5.5 5.7 4.8 2.8 1.0Exports of goods and services 11.9 9.7 16.1 16.7 14.3 15.2 18.0 18.0 14.7Imports of goods and services 11.6 6.2 11.4 14.3 8.7 9.6 13.2 15.2 13.7
Year-on-year change of the period average in %Labor productivity of industry (real) 9.7 10.1 11.5 16.1 8.5 11.0 10.5 9.9 8.5Gross average wage of industry (nominal) 10.0 7.2 8.6 8.3 7.8 9.0 9.4 8.9 9.5Unit labor cost of industry (nominal) 0.3 –2.6 –2.6 –6.7 –0.6 –1.9 –1.0 –0.9 1.0Producer price index (PPI) of industry 3.6 2.9 6.7 4.9 6.5 9.7 5.9 3.4 –0.8Consumer price index (here: HICP) 6.8 3.5 4.0 2.4 2.7 4.6 6.4 8.8 8.5EUR per 1 HUF, + = HUF appreciation 0.7 1.5 –6.1 –3.8 –6.4 –10.8 –3.2 0.9 7.5
Period average levelsUnemployment rate (ILO definition, %, 15–64 years) 6.1 7.2 7.5 7.7 7.2 7.5 7.5 7.5 7.0Employment rate (15–64 years) 56.8 56.9 57.3 56.7 57.3 57.6 57.6 56.9 57.6Key interest rate per annum (%) 11.4 7.1 6.8 6.0 6.0 7.0 8.0 8.0 8.0HUF per 1 EUR 251.7 248.0 264.3 254.6 266.8 275.4 260.3 252.3 248.3
Nominal year-on-year change of the period average stock in %Broad money (including foreign currency deposits) 11.8 13.8 16.2 16.6 16.4 17.2 14.6 11.2 8.0
Contributions to the year-on-year change of broad money in percentage pointsNet foreign assets of the banking system –1.9 0.6 –2.2 0.0 –1.5 –4.7 –2.5 –4.6 –4.8Domestic credit of the banking system 17.9 15.3 23.6 19.1 22.1 29.4 23.4 21.1 15.3
of which: claims on the private sector 21.6 16.6 21.7 19.1 21.3 25.8 20.6 15.7 11.6claims on households 9.8 7.3 9.4 8.5 9.4 10.4 9.2 8.8 7.6claims on enterprises 11.8 9.3 12.3 10.6 11.9 15.3 11.3 6.9 4.1
claims on the public sector (net) –3.8 –1.3 1.9 0.0 0.9 3.7 2.8 5.4 3.7Other domestic assets (net) of the banking system –4.2 –2.0 –5.2 –2.5 –4.3 –7.6 –6.4 –5.3 –2.5
% of GDP, ESA 95General government revenues1 42.4 42.1 42.6 . . . . . . . . . . . .General government expenditures1 48.9 49.9 51.9 . . . . . . . . . . . .General government balance1 –6.5 –7.8 –9.2 . . . . . . . . . . . .Primary balance1 –2.1 –3.7 –5.3 . . . . . . . . . . . .Gross public debt1 59.4 61.6 65.6 . . . . . . . . . . . .
Year-on-year change of the period total (based on EUR) in %Merchandise exports 18.1 11.9 17.9 20.7 14.2 15.7 20.9 19.0 16.0Merchandise imports 15.8 9.3 16.3 22.4 12.8 12.5 18.0 14.3 13.5
% of GDP (based on EUR), period totalTrade balance –3.0 –1.7 –1.0 –2.0 –0.6 –1.8 0.1 0.8 0.8Services balance 0.3 1.2 1.4 0.0 1.7 2.2 1.6 0.8 1.6Income balance (factor services balance) –6.0 –6.5 –7.3 –7.0 –8.4 –7.0 –6.8 –7.6 –9.1Current transfers 0.3 0.2 0.4 1.2 0.0 0.5 0.1 0.9 0.1Current account balance –8.4 –6.8 –6.5 –7.8 –7.3 –6.0 –5.1 –5.2 –6.6Capital account balance 0.3 0.8 0.8 0.6 0.2 0.9 1.3 0.2 0.1Foreign direct investment (net) 3.3 4.9 3.1 8.4 1.1 5.7 –1.8 0.7 –6.2
% of GDP (rolling four-quarter GDP, based on EUR), end of periodGross external debt 66.9 74.5 91.4 80.7 82.1 85.6 91.4 93.2 98.1Gross official reserves (excluding gold) 14.2 17.6 18.2 19.8 18.4 18.5 18.2 18.3 17.7
Months of imports of goods and servicesGross official reserves (excluding gold) 2.5 3.1 2.8 3.4 3.1 3.0 2.8 2.8 2.8
EUR million, period totalGross domestic product in current prices 82,441 88,860 89,852 20,204 22,291 22,225 25,133 22,792 25,592
Source: Bloomberg, European Commission, Eurostat, national statistical off ices, national central banks, wiiw, OeNB.1 Including the net costs of the pension reform.

Developments in Selected Countries
32 ceec.oenb.at ◊ Focus 2/07
cautious approach to easing interest rates before implementing a further rate cut of 25 basis points at end-September. However, the forint weathered rather well the global financial market turbulence during April and May as well as since mid-July 2007, probably owing to the improvement in Hungary’s external and internal imbalances and the relatively high, albeit slowly eroding risk premia against the euro. At the end of October 2007, the currency stood at 251.41 HUF per 1 EUR, 1.74% weaker than at the end of April 2007.18
6 Poland: Investment-Driven Growth Reduces Unemployment Rate Significantly
Real GDP growth accelerated to nearly 7% in the first half of 2007. Domestic demand remained strong, with GFCF growth more than doubling to 25% year on year in the first half of 2007 compared to the corresponding period a year before. Apart from the favorable outlook for domestic sales, the high profitability and liquidity of the corporate sector, this buoyancy of investment growth is attributable to the accelerated expansion of credit to both companies and households (the real growth of credits to the private sector was on average above 26% in the first half of 2007 year on year) as well as the growing absorption rate of EU funds. In the first half of 2007, the sharply higher contribution of investment to GDP growth even exceeded that of private consumption, which rose, too, albeit only moderately. Private consumption growth remained below real GDP growth in the first half of 2007, despite strong employment and dynamic wage growth. As a result of stronger domestic demand, real import growth remained nearly unchanged at a high level, although real export growth roughly halved. This led to the largest negative contribution of net exports to GDP growth since 1999, namely about2 percentage points in the first half of 2007.
Annual employment growth in the whole economy accelerated further to more than 5% in the first half of 2007. At the same time, the labor force remained nearly unchanged, contrary to 2006, when it had declined by about 1.5% (see issue 1/2007 of this publication). The combination of a constant participation rate and a sharply higher employment rate implied an annual decline of the unemployment rate (ILO methodology) from above 14% in the second quarter of 2006 to below 10% in the second quarter of 2007. In parallel, nominal average wage growth roughly doubled in the industry sector (to somewhat more than 8%). Up to the first quarter of 2007, annual labor productivity growth in industry (along with a strong increase in employment) was high enough to more than offset accelerating wage growth, so that nominal ULC declined. However, in the second quarter of 2007, production growth slowed considerably, which led to a year-on-year rise in nominal industry ULC (both in national currency and in euro terms).
In the first half of 2007, both the trade deficit and the surplus on services roughly doubled compared to the first half of 2006, implying only a moderate increase in the deficit of the goods and services balance from 1.1% to 1.6% of GDP. At the same time, the negative income balance widened by about the same amount from 4.1% to 4.6% of GDP. As a result of the higher absorption
18 For more details see box 1.
Investment boomInvestment boom
Economic growth boosts employment,
but industry ULC are on the rise
Economic growth boosts employment,
but industry ULC are on the rise
Moderate widening of goods and services
deficit as well as income deficit
Moderate widening of goods and services
deficit as well as income deficit

Developments in Selected Countries
Focus 2/07 ◊ ceec.oenb.at 33
of EU funds, the capital account surplus increased. Thus, the combined capital and current account deficit augmented only by 0.7 percentage points in the first half of 2007 (to 3.4% of GDP) and continued to be outpaced by net FDI inflows.
Both annual national headline CPI inflation and HICP inflation accelerated in the third quarter of 2007 to 2.0% and 2.4% year on year, respectively. While food prices increased by 5% year on year, the rise in consumer energy prices was still below average, as the recent jump of world energy prices had not yet been fully transmitted. Inflation in September (2.3%) is still slightly below the Monetary Policy Council’s (MPC’s) inflation midpoint target of 2.5% (national headline CPI, target range of ±1 percentage point). In view of tighter labor market conditions in particular, the MPC raised its key interest rates by 25 basis points each at the end of April (as already reported in issue 1/2007 of this publication), June and August 2007 to 4.75%, increasing the interest rate differential to the euro area from 25 to 75 basis points. This, in turn, constituted some stimulus for nominal currency appreciation in the course of 2007.19 According to the MPC assessment of end-September, the probability of inflation exceeding the midpoint target in the medium term had decreased to a certain degree due to recent interest rate hikes, but it was still higher than the probability of inflation running below target. At the same time, the MPC added the global economic environment to its list of factors that would help limit inflation in the medium term. Apart from the labor market, the MPC cited the situation of public finances as the most important factor that will affect the shape of monetary policy in 2008.
The revised figure for the general government deficit in 2006 is 3.8% of GDP (against 3.9% in spring 2007). The updated convergence program of November 2006 envisaged a revenue-based reduction of the public deficit in 2007 to 3.4% of GDP, while the expenditure-to-GDP ratio was roughly unchanged despite strong increases in national cofinancing requirements of EU-funded projects. In the fiscal notification of October 2007, the authorities expect the 2007 general government deficit to reach 3.0% of GDP. Before the parliamentary elections held on October 21, 2007, the government decided on an update of the convergence program that envisaged a public deficit of 3% of GDP in 2008. Apart from the indexed hike in social transfers, this figure took into account the impact of election-related decisions of early September 2007, in particular the increase of basic salaries of public health care workers and the rise in the annual parental tax exemption per child. The Civic Platform (PO) party, which won the relative majority in the elections, announced that it would probably introduce budget changes that aim at a lower public deficit.
19 From end-2006 to end-September 2007, the currency strengthened by around 5.6% against the euro.
Inflation accelerates, but still remains below target
Inflation accelerates, but still remains below target
Reduction of the fiscal deficit to 3% of GDP in 2007 expected
Reduction of the fiscal deficit to 3% of GDP in 2007 expected

Developments in Selected Countries
34 ceec.oenb.at ◊ Focus 2/07
Table 11
Main Economic Indicators: Poland
2004 2005 2006 Q1 2006 Q2 2006 Q3 2006 Q4 2006 Q1 2007 Q2 2007
Year-on-year change of the period total in %GDP in constant prices 5.3 3.5 5.8 5.2 5.5 5.8 6.4 6.9 6.8Private consumption (excl. NPISH) 4.3 1.9 5.2 5.2 4.9 5.5 5.1 7.0 5.3Public consumption (incl. NPISH) 3.1 5.3 2.4 4.6 1.5 1.1 2.5 –0.5 0.8Gross fixed capital formation 6.4 6.5 16.7 7.7 14.8 19.8 19.3 28.0 22.1Exports of goods and services 14.0 8.0 15.1 22.0 12.6 14.8 12.2 11.6 7.9Imports of goods and services 15.2 4.7 15.4 20.9 10.7 15.3 15.5 15.0 13.8
Contribution to GDP growth in percentage pointsDomestic demand 6.1 2.4 6.0 4.8 4.8 6.2 7.8 8.3 9.5Net exports of goods and services –0.8 1.1 –0.2 0.4 0.6 –0.3 –1.3 –1.3 –2.5Exports of goods and services 4.7 3.0 5.6 7.6 4.8 5.6 4.4 4.7 3.3Imports of goods and services 5.4 1.8 5.8 7.2 4.2 5.9 5.7 6.0 5.7
Year-on-year change of the period average in %Labor productivity of industry (real) 13.5 2.9 9.5 10.4 10.2 9.9 7.7 9.6 5.1Gross average wage of industry (nominal) 4.5 3.2 5.2 4.3 4.9 6.0 5.5 8.3 8.5Unit labor cost of industry (nominal) –7.9 0.3 –4.0 –5.5 –4.8 –3.5 –2.0 –1.2 3.2Producer price index (PPI) of industry 7.1 0.7 2.2 0.6 2.3 3.4 2.6 3.1 2.0Consumer price index (here: HICP) 3.6 2.2 1.3 0.9 1.4 1.5 1.3 2.0 2.3EUR per 1 PLN, + = PLN appreciation –2.9 12.6 3.2 5.0 4.6 1.6 1.8 –1.3 3.9
Period average levelsUnemployment rate (ILO definition, %, 15–64 years) 19.3 18.0 14.1 16.3 14.3 13.2 12.4 11.4 9.7Employment rate (15–64 years) 51.7 52.8 54.5 52.6 53.9 55.6 55.7 55.4 56.8Key interest rate per annum (%) 5.8 5.3 4.1 4.3 4.0 4.0 4.0 4.0 4.3PLN per 1 EUR 4.5 4.0 3.9 3.8 3.9 4.0 3.8 3.9 3.8
Nominal year-on-year change of the period average stock in %Broad money (including foreign currency deposits) 6.9 11.8 11.9 10.9 10.2 12.8 13.7 18.0 –2.8
Contributions to the year-on-year change of broad money in percentage pointsNet foreign assets of the banking system 4.5 5.5 1.7 6.7 2.7 –0.9 –1.5 –0.9 –5.2Domestic credit of the banking system 3.5 5.2 12.0 7.3 8.4 14.8 17.1 20.7 21.0
of which: claims on the private sector 4.0 5.5 10.9 8.7 8.6 11.7 14.1 17.5 20.0claims on households 4.5 5.6 8.6 7.4 7.3 9.3 10.3 12.3 13.3claims on enterprises –0.6 –0.1 2.3 1.3 1.3 2.4 3.8 5.2 6.7
claims on the public sector (net) –0.5 –0.3 1.2 –1.4 –0.2 3.1 3.0 3.2 1.0Other domestic assets (net) of the banking system –0.5 2.3 –1.1 –1.8 –0.1 –0.9 –1.6 –1.7 0.9
% of GDP, ESA 95General government revenues1 36.9 39.0 40.0 . . . . . . . . . . . .General government expenditures1 42.6 43.3 43.8 . . . . . . . . . . . .General government balance1 –5.7 –4.3 –3.8 . . . . . . . . . . . .Primary balance1 –2.9 –1.5 –1.1 . . . . . . . . . . . .Gross public debt1 45.7 47.1 47.6 . . . . . . . . . . . .
Year-on-year change of the period total (based on EUR) in %Merchandise exports 22.3 16.8 21.5 23.6 21.0 21.1 20.4 14.7 12.3Merchandise imports 19.5 12.6 24.8 26.1 22.9 25.5 24.6 16.8 17.5
% of GDP (based on EUR), period totalTrade balance –2.2 –1.0 –2.0 –1.3 –1.9 –2.4 –2.4 –2.1 –3.5Services balance 0.4 0.6 0.6 0.5 0.5 0.6 0.9 1.2 1.2Income balance (factor services balance) –4.5 –3.5 –4.2 –3.4 –4.8 –4.0 –4.7 –4.2 –5.0Current transfers 2.2 2.2 2.4 1.1 3.0 3.3 2.1 2.1 2.4Current account balance –4.1 –1.6 –3.2 –3.1 –3.2 –2.4 –4.1 –3.1 –4.9Capital account balance 0.4 0.3 0.6 0.6 0.3 0.7 0.8 0.6 0.7Foreign direct investment (net) 4.6 2.2 3.0 5.7 1.2 2.5 2.5 5.5 2.6
% of GDP (rolling four-quarter GDP, based on EUR), end of periodGross external debt 46.2 45.8 46.6 46.0 45.5 46.2 46.6 47.7 48.7Gross official reserves (excluding gold) 12.6 14.1 13.0 13.9 13.7 14.0 13.0 13.2 13.6
Months of imports of goods and servicesGross official reserves (excluding gold) 3.9 4.6 3.7 4.4 4.2 4.1 3.7 3.7 3.8
EUR million, period totalGross domestic product in current prices 205,197 244,775 271,644 63,209 64,314 66,126 77,995 68,723 73,565
Source: Bloomberg, European Commission, Eurostat, national statistical off ices, national central banks, wiiw, OeNB.1 Including the net costs of the pension reform.

Developments in Selected Countries
Focus 2/07 ◊ ceec.oenb.at 35
7 Romania: Booming Domestic Demand and further Widening of the Current Account Deficit Signal Danger of Economic Overheating
At just 5.8% in the first half of 2007, year-on-year real GDP growth was noticeably below the 2006 result. The slowdown was largely the result of a drought-induced deterioration of agricultural output. Domestic demand expanded strongly, like in previous years. Private sector demand was driven by a remarkably high increase of private credits (the real growth of credits to the private sector was on average around 45% year on year in the first half of 2007). Private consumption growth was twice as high as total GDP growth, also driven by rapid wage growth. Compared with 2006, the growth of public consumption picked up in the first half of 2007, as did GFCF growth. Investment activities were also backed by credit growth and focused on the construction sector, which benefited from infrastructure projects and new production plants (also due to FDI inflows). Stock changes added more than 2 percentage points to GDP growth in the first half of 2007. On the external side, the situation worsened further compared to 2006. Export growth declined in the first half of 2007 and was particularly weak in the second quarter, whereas import growth remained strong (above 20% year on year in the first half of 2007). The negative contribution of net exports to GDP growth reached almost 14 percentage points.
On the back of GDP growth developments, the unemployment rate declined in the first half of 2007 compared to the previous year. Improvements on the labor market and first signs of labor shortages went hand in hand with increasing wages in the industrial sector. Furthermore, an expansionary public wage policy led the way to dynamic wage growth in other sectors of the economy. In the first half of 2007, nominal wage growth in industry outpaced productivity increases by around 10 percentage points, leading to a significant acceleration of ULC compared to 2006, both in local currency and, due to currency movements, even more so in euro terms, to more than 16% year on year. This development weakened Romania’s competitive edge.
In the first half of 2007, the trade balance deteriorated further compared to the first half of 2006, largely triggered by a strong import surge. The deficit of the combined current and capital account enlarged by almost 6 percentage points in the first half of 2007 compared to the same period a year earlier. In the first half of 2007, net FDI inflows covered about 40% of the deficit (compared to 80% a year earlier). This is largely due to the fact that in 2006 several large privatization projects were carried out, while no such major projects were on the agenda in the first half of 2007.
With rates of just below 4% year on year, inflation reached record low levels in the first and second quarter of 2007. Thereafter, however, inflation started to pick up again to 5.0% year on year in August 2007 and even to6.1% year on year in September 2007. Apart from strong domestic demand (supported by very dynamic wage and credit growth), higher prices for food because of the drought-related bad harvest in the summer of 2007 and unfavorable food price developments in the world markets accounted for a large extent of the rise in price pressure. In the first half of 2007, the nominal appreciation of the Romanian leu against the euro helped curb price increases,
Some slowing of economic growth, further acceleration of the negative contribution of net exports to GDP growth
Some slowing of economic growth, further acceleration of the negative contribution of net exports to GDP growth
Labor market improves, but competitiveness weakens
Labor market improves, but competitiveness weakens
Combined current and capital account deficit rises further
Combined current and capital account deficit rises further
Inflation rises again from historically low levelsInflation rises again from historically low levels

Developments in Selected Countries
36 ceec.oenb.at ◊ Focus 2/07
Table 12
Main Economic Indicators: Romania
2004 2005 2006 Q1 2006 Q2 2006 Q3 2006 Q4 2006 Q1 2007 Q2 2007
Year-on-year change of the period total in %GDP in constant prices 8.5 4.2 7.7 6.9 7.8 8.3 7.7 6.0 5.6Private consumption 14.6 9.8 13.9 12.0 14.0 15.3 13.8 12.1 11.4Public consumption –4.2 8.5 2.5 3.3 0.7 1.3 4.1 6.4 6.9Gross fixed capital formation 11.1 12.5 16.1 11.3 14.4 17.3 18.0 17.2 19.4Exports of goods and services 13.9 8.1 10.6 12.9 10.5 10.6 8.6 12.9 2.4Imports of goods and services 22.2 16.6 22.8 21.8 19.1 24.4 25.3 23.8 20.8
Contribution to GDP growth in percentage pointsDomestic demand 12.8 8.3 14.4 12.2 14.1 15.5 15.0 14.2 18.9Net exports of goods and services –5.7 –6.0 –9.8 –8.7 –8.9 –10.2 –10.7 –12.1 –15.4Exports of goods and services 5.5 3.3 4.5 6.9 5.0 4.3 3.0 7.2 1.2Imports of goods and services 11.2 9.3 14.3 15.6 13.9 14.5 13.8 19.3 16.6
Year-on-year change of the period average in %Labor productivity of industry (real) 7.1 4.4 11.3 9.0 13.7 11.8 10.7 12.6 8.5Gross average wage of industry (nominal) 23.0 16.8 15.7 16.6 14.3 15.0 16.8 20.7 21.7Unit labor cost of industry (nominal) 14.8 11.9 4.0 7.0 0.5 2.9 5.5 7.2 12.2Producer price index (PPI) of industry 19.1 10.8 11.7 11.2 11.9 12.8 11.1 9.4 7.5Consumer price index (here: HICP) 11.9 9.1 6.6 8.7 7.2 5.9 4.8 3.9 3.9EUR per 1 RON, + = RON appreciation –7.3 11.8 2.7 4.0 2.9 –0.5 4.6 5.4 7.3
Period average levelsUnemployment rate (ILO definition, %, 15–64 years) 8.5 7.5 7.6 8.1 7.4 7.4 7.5 7.4 6.8Employment rate (15–64 years) 57.7 57.6 58.8 57.2 59.6 60.9 57.4 57.2 59.6Key interest rate per annum (%) 20.0 11.7 8.5 8.0 8.5 8.8 8.8 8.4 7.6RON per 1 EUR 4.1 3.6 3.5 3.6 3.5 3.5 3.5 3.4 3.3
Nominal year-on-year change of the period average stock in %Money plus quasi-money 1 31.4 41.3 28.2 34.7 28.8 26.5 24.1 26.8 25.8
Contributions to the year-on-year change of broad money in percentage pointsNet foreign assets of the banking system 12.7 17.4 1.2 9.2 1.7 –3.0 –1.6 –2.8 –3.4Domestic credit of the banking system 28.9 9.9 31.1 30.7 31.7 34.6 27.9 33.2 34.4
of which: claims on the private sector 32.0 25.6 36.1 32.0 34.7 38.0 38.7 39.1 39.4claims on households 13.1 13.2 19.0 16.2 17.9 20.3 20.8 21.5 21.1claims on enterprises 18.9 12.4 17.1 15.8 16.8 17.7 17.8 17.6 18.3
claims on the public sector (net) –3.1 –15.7 –4.9 –1.3 –3.0 –3.4 –10.8 –5.9 –5.0Other domestic assets (net) of the banking system –10.2 13.9 –4.2 –5.2 –4.5 –5.0 –2.2 –3.6 –5.1
% of GDP, ESA 95General government revenues 31.2 32.4 33.2 . . . . . . . . . . . .General government expenditures 32.7 33.8 35.0 . . . . . . . . . . . .General government balance –1.5 –1.4 –1.9 . . . . . . . . . . . .Primary balance –0.1 –0.3 –1.0 . . . . . . . . . . . .Gross public debt 18.8 15.8 12.4 . . . . . . . . . . . .
Year-on-year change of the period total (based on EUR) in %Merchandise exports 21.3 17.6 16.4 21.4 18.6 9.5 17.1 14.4 8.2Merchandise imports 24.0 24.0 25.5 27.9 23.1 22.8 28.3 30.9 26.1
% of GDP (based on EUR), period totalTrade balance –8.7 –9.8 –12.1 –9.9 –12.6 –11.2 –13.8 –16.0 –17.4Services balance –0.3 –0.4 0.0 0.5 0.6 –0.1 –0.6 1.1 –0.1Income balance (factor services balance) –4.2 –2.9 –3.2 –4.1 –4.2 –2.9 –2.2 –5.7 –4.8Current transfers 4.9 4.5 4.9 5.5 5.0 4.3 5.1 5.2 4.5Current account balance –8.4 –8.6 –10.4 –7.9 –11.1 –9.8 –11.6 –15.3 –17.8Capital account balance 0.8 0.7 0.0 0.7 –2.4 0.3 0.9 0.4 0.7Foreign direct investment (net) 8.4 6.6 9.4 11.3 6.5 7.1 12.1 7.7 5.3
% of GDP (rolling four-quarter GDP, based on EUR), end of periodGross external debt3 29.7 30.7 28.2 29.8 31.9 27.9 28.2 27.9 28.2Gross official reserves (excluding gold) 17.8 21.1 21.9 21.9 20.9 20.6 21.9 21.4 20.9
Months of imports of goods and servicesGross official reserves (excluding gold) 4.8 5.8 5.9 6.0 5.7 5.5 5.9 5.6 5.4
EUR million, period totalGross domestic product in current prices 60,917 79,704 97,297 17,113 21,599 26,257 32,329 20,259 26,456
Source: Bloomberg, European Commission, Eurostat, IMF, national statistical off ices, national central banks, wiiw, OeNB.1 Until 11/2004 national def inition.2 Until 11/2004 general government gross.3 Only medium- and long-term debt.

Developments in Selected Countries
Focus 2/07 ◊ ceec.oenb.at 37
but the currency started to weaken in July and August 200720 in the wake of the global subprime mortgage crisis combined with unfavorable developments of the country’s external position (i.e. the further widening of the trade balance).
Motivated by these developments, Banca Nat by these developments, Banca Nat, by these developments, Banca Nationala a României (BNR) decided at the end of October to raise the benchmark interest rate by 50 basis points to 7.5% after cutting the key policy rate by a total of 50 basis points in two steps (May and June 2007). The BNR has set an inflation target of 4%±1 percentage point for 2007, but signaled that inflation is likely to exceedthe upper band at the end of the year. In the November 2007 inflation report, the BNR expects inflation to reach 5.7% at the end of the year and 4.3% atthe end of 2008 (according to the previous inflation report: end-2007: 3.9% year on year, end-2008: 3.7% year on year). The revisions are above all the result of unfavorable developments of food prices, currency movements and the loosening of fiscal policy. According to the BNR, the main risks to these forecasts are higher public spending in the forefront of the upcoming elections, pension hikes, dynamic wage growth and uncertainties about the behavior of investors in the face of risks in emerging markets.
In 2006, the fiscal deficit stood at slightly below 2% of GDP. For 2007, the Romanian government forecasts a budget deficit of 2.9% of GDP (accordingto the October 2007 fiscal notification), which is marginally higher than indicated in its first convergence program of December 2006. In the latest announcements, however, the Ministry of Finance expects the deficit to be around 1.5 percentage points lower. From January to September 2007, the general fiscal budget registered a slight surplus, but rising public infra-structure spending toward the end of the year is expected to result in deficit. In the setting of booming (substantially credit-financed) domestic demand, a widening of the combined current and capital account and accelerating inflationary pressure, all of which are signs of an overheating economy, fiscal policy and (public) wage policy should be tighter than it has recently been in order to help stabilize the economy.
8 Slovakia: Dynamically Expanding Economy, Broadly Balanced Growth
Real GDP growth in the first half of 2007 accelerated to more than 9% year on year, putting Slovakia at the forefront of its Central European peers. Growth is well balanced between domestic and external demand. The pickup of economic activity since mid-2006, however, has to be attributed to the very solid performance of net exports. Production capacities have been built up on a large scale in export-oriented industries (e.g. automobiles, electronics), often financed by FDI inflows. This contributed to a robust industrial performance as well as to a rapid expansion of exports. Private consumption remained the second pillar of growth and profited from higher real wages, improved labor
20 The currency gained more than 6% against the euro on average in the first months of 2007 compared to the same period of 2006 and traded at 3.12 RON per 1 EUR at the end of June 2007. Affected by the international financial market turbulence, the Romanian leu started to weaken against the euro and stood at 3.41 RON per 1 EUR in late September. The currency strengthened somewhat again to 3.33 RON per 1 EUR the end of October 2007. For more details see box 1.
Turning point in monetary policy: Interest rate hike at the end of October 2007
Turning point in monetary policy: Interest rate hike at the end of October 2007
Renewed fiscal loosening in the last months of the year?
Renewed fiscal loosening in the last months of the year?
Swift GDP growth continues in the first half of 2007
Swift GDP growth continues in the first half of 2007

Developments in Selected Countries
38 ceec.oenb.at ◊ Focus 2/07
market conditions and the swift growth of credits to the private sector (real growth of credits to the private sector averaged around 18% year on year in the first half of 2007). The expansion of GFCF moderated somewhat from the same period of last year, while being characterized by buoyant investment activity in machinery and transport equipment.
Strong GDP growth helped bring about a further remarkable improvement of labor market conditions, as exemplified by falling unemployment and rising employment rates as well as increasing vacancies throughout the last few quarters (especially in industry and construction). With inflation declining (see below), real wage increases in the first half of 2007 picked up. The share of long-term unemployment in total unemployment is high (close to 75%) and is decreasing only at a very slow pace. Thus, a further rise in labor demand in the future will pose a challenge to policymakers.
With industrial output expanding rapidly, industrial productivity hasbeen posting double-digit growth since the beginning of 2006, which, in combination with reasonable wage increases, led to a noticeable decrease in industry ULC in the first two quarters. In euro terms, given the nominal exchange rate appreciation in the second half of 2006 and early 2007, industry ULC have been broadly stable in the last two years. After falling moderately, ULC picked up slightly most recently (second quarter of 2007). Nominal appreciation came to a halt after the revaluation of the central parity of the currency in ERM II in March (see issue 1/2007 of this publication). Since then, the Slovak koruna has broadly stabilized and has traded at levels of about 4% to 6% above the new central parity. ULC developments in the recent past have thus been consistent with ensuring Slovakia’s competitive position. Competitiveness is further supported by the improvement of the terms of trade and especially by the positive development of the trade balance.
The deficit of the combined current and capital account decreased substantially in the first half of 2007 compared to the first half of 2006. This development has to be traced back to the solid performance of the trade balance. Despite an appreciation of the koruna, exports of goods accelerated markedly in the first two quarters of 2007 while import growth lost some speed. External trade disaggregated by product groups reveals that exports increased most strongly in the category consumption goods (including cars) while imports of capital goods decelerated markedly. This development mirrors the industrial development of Slovakia. The buildup of production capacities up to the second half of 2006 stimulated imports of capital goods. As these capacities went onstream, exports of consumer goods were bolstered. As profit repatriation acted as a drag on the income balance, the current account deficit did not decrease to the same extent as the trade deficit did. FDI coverage remained broadly stable at around 75% in the first two quarters of 2007.
After the HICP inflation peak of 5% year on year in August 2006, price level growth decelerated markedly to a historical low of 1.2% year on year in July as well as in August 2007. The process of disinflation can be explained, to a considerable extent, by lower energy prices, which were mainly due to the lower world energy prices until the summer of 2007, but to some extent also to nominal appreciation. In addition, disinflation in service prices has helped overall disinflation. Disinflation of industrial goods can be attributed partly to
Labor market improves, first signs of tightening
in some sectors
Labor market improves, first signs of tightening
in some sectors
Sound productivity developments support
international competitiveness
Sound productivity developments support
international competitiveness
Trade in goods fuels improvement of the
combined current and capital account
Trade in goods fuels improvement of the
combined current and capital account
Energy and service prices support
disinflation
Energy and service prices support
disinflation

Developments in Selected Countries
Focus 2/07 ◊ ceec.oenb.at 39
Table 13
Main Economic Indicators: Slovakia
2004 2005 2006 Q1 2006 Q2 2006 Q3 2006 Q4 2006 Q1 2007 Q2 2007
Year-on-year change of the period total in %GDP in constant prices 5.4 6.0 8.3 6.7 6.7 9.8 9.6 9.0 9.4Private consumption 4.2 7.0 6.1 6.5 5.7 6.3 6.0 6.5 7.1Public consumption 2.0 –0.6 4.1 7.8 6.6 1.2 2.3 2.4 1.1Gross fixed capital formation 5.0 17.5 7.3 13.8 3.6 6.7 7.0 7.7 6.3Exports of goods and services 7.9 13.8 20.7 17.7 18.1 23.8 22.6 24.1 18.0Imports of goods and services 8.8 16.6 17.8 19.6 14.0 22.9 15.3 17.7 14.1
Contribution to GDP growth in percentage pointsDomestic demand 6.3 8.8 6.7 8.2 4.7 9.5 4.5 4.0 6.2Net exports of goods and services –0.9 –2.8 1.7 –1.9 2.9 0.3 5.2 5.6 3.4Exports of goods and services 6.4 11.5 18.5 15.3 15.9 21.0 21.4 23.0 17.4Imports of goods and services 7.3 14.2 16.8 17.2 13.0 20.7 16.2 17.5 14.0
Year-on-year change of the period average in %Labor productivity of industry (real) 3.9 0.6 11.3 10.6 10.9 12.7 11.0 9.9 11.5Gross average wage of industry (nominal) 10.1 7.3 6.7 2.4 8.2 7.4 8.5 8.1 6.2Unit labor cost of industry (nominal) 6.0 6.6 –4.1 –7.4 –2.4 –4.7 –2.2 –1.6 –4.8Producer price index (PPI) of industry 3.4 4.7 8.4 9.5 9.6 8.5 6.1 3.4 1.6Consumer price index (here: HICP) 7.5 2.8 4.3 4.2 4.6 4.8 3.5 2.1 1.7EUR per 1 SKK, + = SKK appreciation 3.6 3.7 3.7 2.2 3.3 2.2 7.1 9.1 11.7
Period average levelsUnemployment rate (ILO definition, %, 15–64 years) 18.3 16.3 13.4 15.0 13.6 12.9 12.1 11.7 11.2Employment rate (15–64 years) 57.0 57.7 59.4 58.3 59.3 59.9 60.2 60.1 60.4Key interest rate per annum (%) 4.9 3.2 4.0 3.1 3.8 4.5 4.8 4.7 4.3SKK per 1 EUR 40.0 38.6 37.2 37.5 37.7 37.8 35.9 34.3 33.8
Nominal year-on-year change of the period average stock in %Broad money (including foreign currency deposits) 4.0 5.0 5.5 2.2 4.5 6.7 8.6 15.1 16.7
Contributions to the year-on-year change of broad money in percentage pointsNet foreign assets of the banking system –2.6 –5.8 15.9 8.1 16.6 20.8 18.2 1.1 –3.7Domestic credit of the banking system 10.2 12.0 3.9 3.9 4.4 4.0 3.5 11.6 13.9
of which: claims on the private sector 4.0 8.0 16.0 15.2 16.6 15.8 16.5 15.1 13.9claims on households 4.0 5.3 8.7 8.0 8.9 9.0 9.0 7.6 7.1claims on enterprises 0.0 2.8 7.3 7.2 7.8 6.8 7.5 7.5 6.8
claims on the public sector (net) 6.1 4.0 –12.1 –11.3 –12.2 –11.9 –13.0 –3.5 0.0Other domestic assets (net) of the banking system –3.6 –1.3 –14.3 –9.7 –16.5 –18.1 –13.0 2.4 6.5
% of GDP, ESA 95General government revenues1 35.4 35.3 33.5 . . . . . . . . . . . .General government expenditures1 37.8 38.1 37.2 . . . . . . . . . . . .General government balance1 –2.4 –2.8 –3.7 . . . . . . . . . . . .Primary balance1 –0.2 –1.1 –2.2 . . . . . . . . . . . .Gross public debt1 41.4 34.2 30.4 . . . . . . . . . . . .
Year-on-year change of the period total (based on EUR) in %Merchandise exports 14.9 15.6 29.6 27.9 25.3 29.7 34.5 37.5 30.8Merchandise imports 17.9 17.9 29.3 30.7 25.6 33.7 27.7 27.4 25.8
% of GDP (based on EUR), period totalTrade balance –3.7 –5.2 –5.6 –6.2 –5.6 –4.7 –6.0 –0.4 –2.7Services balance 0.6 0.7 1.2 1.2 0.9 1.3 1.4 0.3 1.3Income balance (factor services balance) –5.2 –4.2 –3.8 –1.2 –6.0 –5.9 –1.9 0.3 –6.0Current transfers 0.4 0.0 –0.1 –0.1 1.1 –1.1 –0.3 –1.0 –0.7Current account balance –7.9 –8.7 –8.3 –6.3 –9.6 –10.3 –6.9 –0.9 –8.1Capital account balance 0.3 0.0 –0.1 –0.1 0.0 –0.1 –0.1 1.0 0.3Foreign direct investment (net) 7.3 4.1 6.9 4.9 10.2 8.0 4.4 –0.8 5.8
% of GDP (rolling four-quarter GDP. based on EUR), end of periodGross external debt 51.5 60.2 55.6 60.3 61.3 55.2 55.6 57.2 55.6Gross official reserves (excluding gold) 31.3 33.0 21.9 33.6 30.5 23.5 21.9 25.7 25.8
Months of imports of goods and servicesGross official reserves (excluding gold) 4.8 4.9 2.9 4.8 4.2 3.2 2.9 3.4 3.4
EUR million. period totalGross domestic product in current prices 33,878 38,115 44,000 9,847 10,713 11,228 12,212 12,071 13,337
Source: Bloomberg, European Commission, Eurostat, national statistical off ices, national central banks, wiiw, OeNB.1 Including the net costs of the pension reform.

Developments in Selected Countries
40 ceec.oenb.at ◊ Focus 2/07
cars, pharmaceuticals (due to a reduction in the VAT rate) and electronics. In September 2007, inflation accelerated slightly to 1.7% year on year on the back of higher energy and food prices. Národná banka Slovenska (NBS) has left its key interest rate unchanged since the end of April 25, 2007. According to the 2007 October forecast, the NBS expects 1.6% inflation in December 2007, which is marginally higher than the July forecast because price increases for food and energy are higher than expected. According to the NBS, demand-pull inflationary pressures seem low, but the risk of higher wage increasesstill persists. Overall, the inflation target of an HICP inflation rate of below 2% in December 2007 should be reached. For 2008, the NBS projects a moderate increase of inflation to 2.3%, while most observers expect inflation to range between 2% (IMF) and 2.5% (European Commission).
The general government deficit for 2006 had to be revised upward to 3.7% of GDP from 3.4%, the figure reported in a previous release. The increase was mainly caused by a downward correction of interest revenues and the inclusion of the Slovak state television and radio in general government. Both measures added a combined 0.3 percentage points to the 2006 deficit. The revision was lower than originally expected, as Eurostat did not recommend a reclassifi-cation of the national highway company (NDS) in general government. However, the final decision is still forthcoming. The above-mentioned changes will only marginally affect the budgetary outcome for 2007. Due to better than expected economic developments, the October 2007 fiscal notification envisages a deficit of only 2.5% of GDP for 2007 (2.7% if NDS is included).21
This is 0.4 percentage points lower than the original target of 2.9% of GDP (according to the update of the convergence program of 2006).
9 Croatia: Buoyant Economic Growth Based on Booming Domestic Demand
In line with regional trends, the Croatian economy made a strong start into the year 2007, with economic growth reaching 6.8% year on year in the first half of 2007. Private consumption growth picked up substantially, based on strong wage and credit growth (the real growth of credit to the privatesector was on average almost 30% year on year in the first half of 2007) and considerably improving labor market conditions. Similarly, public consumption accelerated further, ahead of parliamentary elections on November 25, 2007. Although GFCF growth decelerated somewhat, it was also fueled by strong credit growth and remained an important pillar of economic growth. At the same time, exports of goods and services increased by more than 6% year on year thanks to a good start into the tourist season, as compared to import growth of slightly more than 5% year on year. Consequently, although the contribution of net exports to growth remained negative, it improved noticeably compared to the first half of 2006.
Partly due to base effects, inflation (CPI) in the first half of 2007 remained moderate at an average of below 2% year on year. Against the background of a pickup in the prices for food (representing a weight of some 28% in the basket of goods) and energy in the third quarter of 2007, however, some inflationary
21 Including pension reform costs of 1.2% of GDP.
Lower budget deficit in 2007 alongside tightened
fiscal accounting standards
Lower budget deficit in 2007 alongside tightened
fiscal accounting standards
Robust economic growth draws on
powerful domestic demand
Robust economic growth draws on
powerful domestic demand
Increasing inflationary pressures
Increasing inflationary pressures

Developments in Selected Countries
Focus 2/07 ◊ ceec.oenb.at 41
pressures became visible, with consumer price inflation reaching almost4% year on year in September 2007. Excluding these two items, inflation hovered between 3% and 3.5% in the first three quarters, even falling to3% in September thanks to a stable exchange rate and despite booming domestic demand. According to a statement of Hrvatska narodna bank (HNB), inflation is expected to lie between 2.5% and 3% year on year on averagein 2007. Developments of prices for energy and food are the main risks tothis forecast.
Against the background of brisk domestic demand, the combined current and capital account deficit continued to widen in absolute terms in the first half of 2007, but decreased slightly relative to GDP compared to the first half of 2006. This decrease came in spite of a further widening of the already high trade deficit, which was, however, to a large extent counterbalanced by a higher surplus in the services balance as a result of higher than expected tourism revenues. At the same time, a lower deficit in the income balance fully made up for the lower surplus of current transfers. Net FDI inflows reached around 12% of GDP in the first half of 2007 and were up substantially compared to the same period of 2006. Thanks to huge capital increases in the banking sector, 75% of total FDI inflows were equity investments (including reinvested earnings), which covered around one-half of the combined current and capital account deficit. Given continued debt financing needs, Croatia’s foreign debt increased to 86% of rolling four-quarter GDP at end-June 2007, against 84.5% at the end of the first half of 2006. Much as in 2006, the share of “other sectors” (primarily nonfinancial corporations) in total external debt increased sharply, while at the same time the banking sector’s share decreased at about the same rate, to a large extent implying a shift to direct cross-border borrowing by the corporate sector (borrowing by domestic banks which refinanced themselves by taking out foreign debt).
In light of the unabated strong momentum of credit growth and the central bank’s determination to curb loan growth funded by foreign liabilities, the HNB continued to tighten credit policy on several occasions in the first nine months of 2007. In particular, it fine-tuned the administrative measures which came into force at the beginning of 2007 (see issue 1/2007 of this publication). One set of amendments came into force on June 20, 2007, and includes the splitting of the calculation base for purchasing compulsory HNB bills into two separate parts, i.e. household and corporate placements on the one hand and off-balance sheet items on the other hand. In a second step, in July 2007 the HNB reduced banks’ maximum allowable placement growth (i.e. without triggering the compulsory purchase of low-yielding HNB bills) to a monthly 0.5% for the second half of the year. Finally, as of October 1, 2007, the calculation base for the subscription of compulsory HNB bills was broadened by also including lending by legal persons controlled by Croatian banks.
The Croatian currency moved around a fairly stable 7.35 HRK per 1 EUR in the first months of 2007, but in light of the strong tourism season and after the sale of a 32.5% stake in Hrvatski Telekom via an IPO in September 2007, appreciation pressures aggravated. In an attempt to halt the appreciation ofthe Croatian kuna, the HNB intervened three times on the foreign exchange market in 2007 with a total of some EUR 500 million. At the same time,
External imbalances prevailExternal imbalances prevail
Further tightening of credit policyFurther tightening of credit policy
HNB interventions counteract kuna appreciation
HNB interventions counteract kuna appreciation

Developments in Selected Countries
42 ceec.oenb.at ◊ Focus 2/07
Table 14
Main Economic Indicators: Croatia
2004 2005 2006 Q1 2006 Q2 2006 Q3 2006 Q4 2006 Q1 2007 Q2 2007
Year-on-year change of the period total in %GDP in constant prices 4.3 4.3 4.8 6.0 3.6 4.7 4.8 7.0 6.6Private consumption 4.8 3.4 3.5 4.0 2.1 3.9 4.1 7.1 6.5Public consumption –0.3 0.8 2.2 1.0 1.8 1.5 4.4 2.8 2.7Gross fixed capital formation 5.0 4.9 10.9 18.1 8.4 9.3 9.2 11.2 5.8Exports of goods and services 5.7 4.6 6.9 14.0 5.2 2.2 11.1 3.0 8.9Imports of goods and services 4.6 3.5 7.3 16.1 4.2 5.5 5.0 3.7 6.4
Contribution to GDP growth in percentage pointsDomestic demand 4.4 4.2 5.9 10.2 4.0 6.4 3.3 8.2 6.7Net exports of goods and services –0.1 0.1 –1.1 –4.2 –0.4 –1.8 1.6 –1.2 –0.1Exports of goods and services 2.8 2.2 3.4 5.2 2.4 1.5 4.8 1.2 4.1Imports of goods and services 2.9 2.2 4.5 9.4 2.7 3.2 3.2 2.4 4.2
Year-on-year change of the period average in %Labor productivity of industry (real) 4.0 6.2 2.7 5.6 –1.9 3.7 3.5 7.7 7.3Gross average wage of industry (nominal) 5.5 5.3 7.5 7.2 7.2 6.1 9.4 6.3 5.2Unit labor cost of industry (nominal) 1.5 –0.8 4.7 1.5 9.3 2.4 5.7 –1.3 –2.0Producer price index (PPI) of industry 3.6 3.1 2.9 3.5 3.7 2.7 1.7 2.0 2.5Consumer price index (here: CPI) 2.1 3.4 3.2 3.5 3.8 3.2 2.2 1.5 2.1EUR per 1 HRK, + = HRK appreciation 1.0 1.3 1.1 2.3 0.9 0.8 0.2 –0.3 –1.0
Period average levelsUnemployment rate (ILO definition, %, 15–64 years) 14.1 13.0 11.5 .. 12.1 .. 10.9 .. ..Employment rate (15–64 years) 54.7 55.0 55.6 .. 54.5 .. 56.8 .. ..Key interest rate per annum (%) 4.5 4.5 4.5 4.5 4.5 4.5 4.5 4.5 4.5HRK per 1 EUR 7.5 7.4 7.3 7.3 7.3 7.3 7.4 7.4 7.4
Nominal year-on-year change of the period average stock in %Broad money (including foreign currency deposits) 8.3 9.5 14.0 9.9 12.6 15.9 17.3 20.0 20.1
Contributions to the year-on-year change of broad money in percentage pointsNet foreign assets of the banking system –0.5 –5.0 –3.0 –6.8 –6.4 –1.8 2.2 6.2 11.5Domestic credit of the banking system 9.4 17.3 20.8 19.6 21.9 21.6 20.2 20.6 18.0
of which: claims on the private sector 10.1 13.2 20.2 17.6 21.3 21.1 20.9 22.3 22.2claims on households 7.5 9.0 11.1 10.2 11.5 11.3 11.2 11.9 11.9claims on enterprises 2.6 4.1 9.2 7.4 9.8 9.8 9.7 10.5 10.3
claims on the public sector (net) –0.7 4.1 0.6 2.0 0.6 0.5 –0.7 –1.7 –4.2Other domestic assets (net) of the banking system –0.7 –2.7 –3.8 –3.0 –2.9 –3.9 –5.1 –6.8 –9.4
% of GDP, ESA 95General government revenues 41.2 39.6 39.2 . . . . . . . . . . . .General government expenditures 45.3 43.4 41.5 . . . . . . . . . . . .General government balance –4.1 –3.8 –2.2 . . . . . . . . . . . .Primary balance –2.0 –1.6 –0.1 . . . . . . . . . . . .Gross public debt 43.2 43.7 40.7 . . . . . . . . . . . .
Year-on-year change of the period total (based on EUR) in %Merchandise exports 16.1 14.0 17.2 32.8 5.2 13.6 20.1 1.9 16.1Merchandise imports 8.7 11.6 14.0 25.0 8.7 13.9 11.0 8.8 11.8
% of GDP (based on EUR), period totalTrade balance –24.0 –24.0 –24.4 –24.0 –27.6 –22.6 –23.5 –25.4 –27.2Services balance 16.5 17.0 16.7 –0.6 15.2 43.7 3.8 1.3 16.3Income balance (factor services balance) –2.3 –3.1 –3.3 –4.5 –6.5 –1.8 –0.6 –2.6 –6.4Current transfers 4.1 3.8 3.2 3.8 3.5 2.9 2.9 2.9 2.8Current account balance –5.8 –6.4 –7.7 –25.3 –15.3 22.2 –17.5 –23.8 –14.5Capital account balance 0.1 0.2 –0.4 –2.1 0.0 0.1 0.2 0.1 0.1Foreign direct investment (net) 4.2 4.1 7.5 6.6 9.1 3.9 10.5 14.4 8.5
% of GDP (rolling four-quarter GDP, based on EUR), end of periodGross external debt 79.9 82.3 85.4 82.9 84.5 81.5 85.4 85.6 85.9Gross official reserves (excluding gold) 22.4 23.8 25.5 25.2 26.7 24.2 25.5 27.2 25.6
Months of imports of goods and servicesGross official reserves (excluding gold) 4.8 5.1 5.3 5.3 5.6 5.1 5.3 5.7 5.4
EUR million, period totalGross domestic product in current prices 28,693 31,272 34,214 7,725 8,504 9,451 8,534 8,494 9,314
Source: Bloomberg, European Commission, Eurostat, national statistical off ices, national central banks, wiiw, OeNB.

Developments in Selected Countries
Focus 2/07 ◊ ceec.oenb.at 43
despite lower volumes of marginal reserve requirements as a result of banks’ decreasing foreign liabilities, Croatia’s foreign exchange reserves increasedby about EUR 500 million to EUR 9.2 billion in the first half of 2007, corresponding to an import cover of some 5.5 months.
Revenue overperformance (mainly VAT, corporate and personal income tax, property tax) considerably improved Croatia’s fiscal accounts in the first half of 2007. Against this background, parliament adopted a revised 2007 budget in July, cutting the consolidated general government deficit target to 2.6% of GDP from the previous 2.8%.22 However, only a small fraction of extra revenue is being used for budget consolidation, with the lion’s share being spent on health care, education and agriculture. Based on these developments, the European Commission forecasts an ESA 95 budget deficit of 2.2% of GDP for 2007 (unchanged compared to 2006, despite the improved cyclical position of the economy).
10 Turkey: More Balanced but Somewhat Weaker Economic Growth
In the first half of 2007, real economic growth stood at 5.3% year on year, a bit below GDP growth in the previous year. Growth was substantially weaker in the second quarter than in the first quarter of 2007, largely because private consumption growth turned negative. In the first half of 2007, the composition of growth changed somewhat from 2006, as the neutral contribution of net exports turned positive (the acceleration of export growth outpaced the increase of import growth). The weakening of private consumption in the first half of 2007 was caused partly by the tighter monetary stance and the contraction of lending growth in an environment of high interest rates. Real growth rates of credits to the private sector declined from an average of around 40% year on year in 2006 to about 15% year on year on average in the first half of 2007. Consequently, GFCF growth was rather moderate in the first half of 2007.
The unemployment rate remained high at around 10% (ILO definition), as in the last few years. The employment rate stayed rather stable, with notable increases in the service sector and decreases in the agricultural sector. In the first half of 2007, previously high labor productivity growth lost substantial momentum in the manufacturing sector, whereas nominal wage growth remained robust, leading to increasing ULC (in local currency). However, due to currency movements, ULC in manufacturing declined marginally in euro terms.
In the first half of 2007, the combined current and capital account deficit declined compared to the first half of 2006, sinking by almost 2 percentage points to below 10% of GDP. This development was largely attributable to an improvement of the trade balance. FDI inflows were fairly buoyant, reflecting the payoff of reform efforts that have fostered a more open, investment-friendly business climate. Net FDI inflows, largely driven by the privatization process, covered more than one-half of the combined current and capital account gap in the first half of 2007. In addition, the abundance of global liquidity provided
22 Cash flow data based on national methodology. Not directly comparable with ESA 95 figures.
2007 budget revised2007 budget revised
Growth again mainly driven by domestic demand but also supported by exports
Growth again mainly driven by domestic demand but also supported by exports
Still no improvement on the labor marketStill no improvement on the labor market
Continued high deficit of the combined current and capital account
Continued high deficit of the combined current and capital account

Developments in Selected Countries
44 ceec.oenb.at ◊ Focus 2/07
ample financing, and portfolio inflows financed nearly one-third of the deficit. The partial debt financing of the still high deficit of the combined current and capital account pushed net external debt to slightly above 50% of GDP at end-June 2007 (31% private, 20% public debt).
Domestic demand developments supported the disinflation process. Furthermore, lower price increases for durable goods and services as well as a cut in VAT on some processed foods helped curb inflation. Notwithstanding high oil prices and elevated food prices, annual inflation fell further in the third quarter of 2007, also supported by a strong lira. In October 2007, inflation picked up again (largely as a result of higher food prices) and reached 7.7% year on year. Overall, inflation remains above the official inflation target23 of 4% (±2 percentage points) for end-year 2007. The central bank, Türkiye Cumhuriyet Merkez Bankası (TCMB), cut the benchmark rate by25 basis points in mid-September and by 50 basis points in mid-October, bringing the rate to 16.75%. In the accompanying announcement, the TCMB noted that the lagged effect of monetary tightening is helping to driveinflation lower, and that the likelihood of hitting the 4% medium-term target remains high. On the back of factors not under the control of the TCMB(such as tax adjustments, increasing food, energy and administered prices), the TCMB revised its inflation forecast for end-2007 upward to between 6.7% and 7.9%.
The Turkish lira recovered after the sharp depreciation in May and June 2006. There was only a slight and short episode of exchange rate weakening in August 2007 as a consequence of the turbulences on the U.S. subprime market (see box 1). As the lira started to appreciate again once the risk appetite in global markets had begun to recover, the TCMB announced the increase of the size of its discretionary interventions in the first half of October to ease appreciation pressures on the lira. With this measure, the lira started to weaken against the euro, further supported by the mentioned interest rate cut as well as concerns that the conflict with Kurdish rebels could escalate, so that the lira traded at around 1.7 TRY per 1 EUR at the end of October 2007 (around 8% stronger against the euro than at the end of April 2007).24
The primary surplus outturn in 2007 is expected to be around 4.25% of GNP (IMF definition), which is more than 2 percentage points below an earlier target due to higher than expected expenditures and also below the 2006 outcome (primary surplus of 5.8% of GNP). As agreed with the IMF during the 7th review of the Stand-By Arrangement in October 2007, the intended primary surplus target of 6.5% of GNP can be reduced by 1 percentage point to 5.5%, which would still be consistent with reducing the debt ratio to safer levels. For 2008, the IMF urged the Turkish government to reach a primary surplus of at least 5.5% of GNP. In ESA 95 terms, according to the European Commission (2007 Autumn Forecast), the general government deficit for 2007 is expected to be –0.7% of GDP (compared to a surplus of 0.4% achieved in 2006).
23 In January 2006, the Turkish central bank changed from explicit to implicit inflation targeting.24 However, the currency was weaker in first three quarters of 2007 (on average) compared to the same period a
year earlier due to the strong depreciation in May and June 2006.
Inflation comes down but remains above
target
Inflation comes down but remains above
target
Appreciation of the Turkish lira
Appreciation of the Turkish lira
Fiscal performance deteriorated but
remains a cornerstone in the reform process
Fiscal performance deteriorated but
remains a cornerstone in the reform process

Developments in Selected Countries
Focus 2/07 ◊ ceec.oenb.at 45
Table 15
Main Economic Indicators: Turkey
2004 2005 2006 Q1 2006 Q2 2006 Q3 2006 Q4 2006 Q1 2007 Q2 2007
Year-on-year change of the period total in %GDP in constant prices 8.9 7.4 6.1 6.7 8.3 4.8 5.2 6.9 3.9Private consumption 10.6 9.1 5.0 8.0 11.2 1.8 0.1 1.8 –0.7Public consumption 0.5 2.4 9.6 10.1 18.3 14.8 0.7 9.0 7.3Gross fixed capital formation 32.4 24.0 14.0 32.1 14.0 11.3 4.4 3.0 10.0Exports of goods and services 12.5 8.5 8.5 6.8 9.1 11.5 6.2 14.7 12.7Imports of goods and services 24.7 11.5 7.1 10.0 13.7 3.6 1.0 4.3 8.4
Contribution to GDP growth in percentage pointsDomestic demand 13.9 9.1 5.8 9.0 11.9 1.6 2.8 8.6 5.3Net exports of goods and services –4.2 –1.6 0.0 –2.0 –3.1 2.3 1.8 3.2 0.3Exports of goods and services 3.9 2.8 2.8 2.4 3.0 3.3 2.2 5.2 4.3Imports of goods and services 8.2 4.4 2.8 4.4 6.1 1.1 0.4 2.0 3.9
Year-on-year change of the period average in %Labor productivity in manufacturing (real) 7.5 6.0 6.7 5.1 9.9 6.5 5.2 4.8 0.3Gross average wage in manufacturing (nominal) 13.4 12.2 11.5 11.3 11.5 11.1 12.1 8.1 8.9Unit labor cost in manufacturing (nominal) 5.5 5.9 4.5 6.0 1.4 4.4 6.5 3.2 8.5Producer price index (PPI) of industry 14.6 6.0 9.3 4.9 8.4 12.6 11.4 10.1 6.6Consumer price index (here: HICP) 10.1 8.1 9.3 7.6 9.2 10.6 9.7 10.3 9.5EUR per 1 TRY, + = TRY appreciation –4.5 5.9 –7.3 8.6 –6.9 –14.4 –14.1 –13.3 2.5
Period average levelsUnemployment rate (ILO definition, %, 15–64 years) 10.3 10.2 9.9 11.9 8.8 9.1 9.6 11.4 8.9Employment rate (15–64 years) 43.6 43.5 43.2 40.1 44.3 45.0 43.5 41.0 44.5Key interest rate per annum (%) 21.9 14.8 15.6 13.5 14.0 17.4 17.5 17.5 17.5TRY per 1 EUR 1.8 1.7 1.8 1.6 1.8 1.9 1.9 1.8 1.8
Nominal year-on-year change of the period average stock in %Broad money (including foreign currency deposits) 24.1 21.1 41.3 41.8 46.7 42.2 35.6 23.3 17.0
Contributions to the year-on-year change of broad money in percentage pointsNet foreign assets of the banking system 2.1 6.1 10.0 9.7 10.1 9.3 10.8 10.7 11.6Domestic credit of the banking system 28.9 21.6 39.3 41.5 44.2 40.2 32.5 17.3 11.0
of which: claims on the private sector 19.2 19.3 31.7 30.7 33.8 33.5 29.0 19.8 15.2claims on households 7.9 8.7 11.0 10.9 12.0 11.6 9.6 7.5 5.6claims on enterprises 11.2 10.6 20.7 19.8 21.8 21.9 19.4 12.3 9.6
claims on the public sector (net) 9.7 2.2 7.6 10.8 10.4 6.7 3.5 –2.5 –4.2Other domestic assets (net) of the banking system –6.9 –6.7 –8.0 –9.5 –7.6 –7.2 –7.7 –4.7 –5.6
% of GDP, ESA 95General government revenues 15.9 27.0 27.1 . . . . . . . . . . . .General government expenditures 21.6 27.4 26.7 . . . . . . . . . . . .General government balance –5.8 –0.3 0.4 . . . . . . . . . . . .Primary balance 5.9 8.8 8.0 . . . . . . . . . . . .Gross public debt 76.9 69.6 60.7 . . . . . . . . . . . .
Year-on-year change of the period total (based on EUR) in %Merchandise exports 19.3 15.0 17.8 18.9 19.4 19.2 14.4 14.4 15.3Merchandise imports 27.2 21.9 18.9 27.1 27.2 16.1 8.2 8.5 6.2
% of GDP (based on EUR), period totalTrade balance –8.0 –9.3 –10.4 –10.8 –13.7 –9.3 –8.5 –9.8 –10.8Services balance 4.3 4.2 3.3 1.4 3.1 6.1 1.9 1.4 2.6Income balance (factor services balance) –1.9 –1.6 –1.7 –1.8 –1.8 –1.4 –1.7 –2.1 –1.3Current transfers 0.4 0.4 0.4 0.4 0.4 0.4 0.5 0.3 0.3Current account balance –5.1 –6.2 –8.3 –10.8 –12.0 –4.2 –7.7 –10.1 –9.3Capital account balance 0.0 0.0 0.0 0.0 0.0 0.0 0.0 0.0 0.0Foreign direct investment (net) 0.7 2.5 4.7 1.7 8.5 3.0 5.8 8.7 2.2
% of GDP (rolling four-quarter GDP, based on EUR), end of periodGross external debt 49.0 49.0 49.9 49.9 48.1 49.2 49.9 50.5 51.0Gross official reserves (excluding gold) 11.0 14.7 14.6 15.8 14.2 14.7 14.6 15.9 15.4
Months of imports of goods and servicesGross official reserves (excluding gold) 3.9 5.2 4.8 5.6 4.9 4.9 4.8 5.2 5.1
EUR million, period totalGross domestic product in current prices 241,185 292,121 316,247 67,246 72,425 93,057 83,519 70,077 82,091
Source: Bloomberg, European Commission, Eurostat, national statistical off ices, national central banks, wiiw, OeNB.

Developments in Selected Countries
46 ceec.oenb.at ◊ Focus 2/07
11 Russia: Overheating with Triple Surpluses?Real GDP expanded by almost 8% year on year in the first half of 2007, which is an acceleration compared to the entire year of 2006. The driving force of this acceleration was a near-doubling of the growth rate of GFCF to above 20% year on year. Private consumption growth, already strong, also gained some further momentum. Domestic demand continued to be fueled by rapid credit expansion (the growth of real credit to the private sector amounted on average to more than 40% year on year in the first half of 2007). However, an expanding share of domestic demand is being drained by surging imports, which rose by more than a quarter in real terms in the first six months of 2007. Real export growth continued to weaken, producing an increasingly negative contribution of net exports to GDP growth.
The unemployment rate (ILO definition) declined in recent months to below 6% in September 2007, a historically low level since the early stagesof transition. Some economic sectors, above all resource extraction and transportation, appear to have reached capacity constraints, and the energy sector continues to struggle with a challenging business climate. The continuing credit boom, surging imports, falling joblessness, emerging capacity con-straints, rising inflationary pressures (see below), and the fact that GDP growth has been persistently overshooting trend growth in recent years, would all suggest the Russian economy is at risk of overheating. On the other hand, the most recent acceleration of investment may weaken such a conclusion.
The import surge, also fueled by the continuing real appreciation of the Russian ruble and by rapidly growing real wages, as well as sluggish export growth against the backdrop of the temporary stabilization of the (high) Urals oil price contributed to the shrinkage of the combined current and capital account surplus to 7% of GDP in the first half of 2007 (as against 12.7% of GDP in the first six months of 2006). Moreover, Russia witnessed a strong expansion of the financial account surplus, facilitated by the full liberalization of capital flows from mid-2006. Driven by some large IPOs (particularly those of the leading state-owned banks Sberbank and Vneshtorgbank) as well as by expectations of further nominal exchange rate appreciation and by rising confidence, total net private capital inflows into Russia rose to 6.5% of GDP in the first three quarters of 2007 (as against 3.7% in the corresponding period of the previous year). Foreign borrowing by banks and companies witnessed high growth rates.
However, these data conceal the fact that following a steep expansion in the first two quarters, net private capital inflows dried up and even temporarily reversed in the third quarter. This was triggered by the repercussions of the U.S. subprime crisis on Russia.25 The sudden interruption of capital inflows in August tightened refinancing conditions, particularly for medium-sized and smaller banks, and pushed up interest rates on the interbank loan market. The Central Bank of the Russian Federation (CBR) intervened by supplying liquidity, which it did through repo operations, through cutting reserve requirements and through broadening the list of securities that credit institutions can use as collateral when borrowing from the central bank. Net
25 For more details see box 1.
GDP growth accelerates to almost 8% in the first half of 2007 on the back
of newly buoyant investment growth …
GDP growth accelerates to almost 8% in the first half of 2007 on the back
of newly buoyant investment growth …
… despite some signs that the economy might be at risk of overheating
… despite some signs that the economy might be at risk of overheating
Shrinking combined current and capital
account surplus alongside increasing
capital inflows …
Shrinking combined current and capital
account surplus alongside increasing
capital inflows …
… but interruption of liquidity to banks during
the international financial turmoil of
August 2007
… but interruption of liquidity to banks during
the international financial turmoil of
August 2007

Developments in Selected Countries
Focus 2/07 ◊ ceec.oenb.at 47
capital inflows appear to have resumed in October 2007, but the situation remains fragile.
The strong capital inflows of the first half of 2007, the above-mentioned overheating pressures, utility price adjustments, seasonal factors (bad weather conditions triggering bad harvests in Russia as well as food price increaseson world markets more generally) plus the most recent liquidity infusion contributed to pushing CPI inflation (year on year) from 7.4% in March to 9.3% in September 2007. Therefore, it now looks highly unlikely that the CBR will reach its informal inflation goal of 7% to 8% (for end-2007). The CBR recently excluded the use of nominal appreciation to curb inflation. President Putin and some members of the government indicated that inflation should be addressed through administrative measures. However, these statements have to be viewed in the context of the immediate preelection situation.26
During the peak of the turmoil in late August 2007, the CBR intervened on the forex market to defend the ruble – for the first time since 2002. Foreign exchange reserves dipped marginally, but since then have touched newrecord levels again (mid-October: EUR 304 billion, which corresponds to about 20 months of goods and services imports). The country’s Stabilization Fund (which holds part of the reserves) almost doubled within a year to reach EUR 99.5 billion at end-September 2007. Strongly expanding private sector foreign liabilities that overcompensated falling government external debt led to an increase of total Russian gross external debt to EUR 283 billion, or around one-third of GDP in mid-2007. With overall structural and institutional reforms continuing at a sluggish pace against the backdrop of the upcoming polls, no new reform impulses will be forthcoming until 2008.
Federal budget revenues were buoyed by high energy prices and swift economic growth, while expenditures were held back due to the lack of administrative rules in connection with the new budget law and new state procurement regulations. Therefore, in the first nine months of 2007, the federal budget produced a surplus of 7.1% of GDP, which is considerably higher than the planned surplus of 4.8% for the entire year according to the budget law. However, once the legal bottleneck has been overcome and given the upcoming elections, budget spending is expected to take off and to produce an outcome approximating the planned one. (In 2006, the surplus had come to 7.5% of GDP.) In any case, for the time being, Russia can boast of “triple surpluses” (current account, financial account and fiscal), providing a measure of security against macroeconomic or financial risks.
26 Duma elections are due in December 2007; presidential elections will follow in March 2008.
Ample liquidity as well as seasonal factors have fueled inflation …
Ample liquidity as well as seasonal factors have fueled inflation …
… while pushing foreign currency reserves and the Stabilization Fund to new record heights
… while pushing foreign currency reserves and the Stabilization Fund to new record heights
Fiscal policy has remained prudentFiscal policy has remained prudent

Developments in Selected Countries
48 ceec.oenb.at ◊ Focus 2/07
Table 16
Main Economic Indicators: Russia
2004 2005 2006 Q1 2006 Q2 2006 Q3 2006 Q4 2006 Q1 2007 Q2 2007
Year-on-year change of the period total in %GDP in constant prices 7.1 6.4 6.7 5.0 7.0 6.8 7.7 7.9 7.8Private consumption 11.6 12.2 10.9 9.2 10.4 11.4 12.4 11.8 12.0Public consumption 2.1 2.2 4.2 3.2 5.5 4.7 3.4 4.4 4.5Gross fixed capital formation 12.6 8.3 13.9 5.6 14.7 13.7 17.4 19.9 22.9Exports of goods and services 11.8 6.4 7.2 8.9 6.4 6.1 7.4 3.4 5.2Imports of goods and services 23.3 17.0 21.7 22.9 21.7 19.1 23.2 25.5 25.8
Contribution to GDP growth in percentage pointsDomestic demand 8.8 8.4 9.7 6.4 10.0 9.5 12.2 13.2 12.8Net exports of goods and services –1.4 –2.3 –3.9 –2.9 –3.9 –3.6 –5.0 –6.8 –6.6Exports of goods and services 4.1 2.3 2.6 3.4 2.4 2.0 2.9 1.3 1.9Imports of goods and services 5.5 4.7 6.5 6.3 6.3 5.6 7.9 8.2 8.5
Year-on-year change of the period average in %Labor productivity of industry (real)1 14.0 7.3 8.3 6.9 10.2 8.8 7.4 7.3 5.6Gross average wage of industry (nominal)1 5.2 21.1 21.4 20.1 20.6 22.6 22.0 25.9 24.5Unit labor cost of industry (nominal)1 –7.7 12.8 12.1 12.4 9.5 12.7 13.6 17.3 17.9Producer price index (PPI) of industry 24.0 20.7 12.4 14.8 12.7 13.8 8.7 8.6 13.1Consumer price index (here: CPI) 11.0 12.5 9.8 10.8 9.6 9.6 9.2 7.9 8.1EUR per 1 RUB, + = RUB appreciation –3.1 1.7 3.3 7.9 3.6 1.8 0.0 –1.8 –2.0
Period average levelsUnemployment rate (ILO definition) 8.2 7.6 7.2 7.8 7.4 6.7 6.8 7.0 6.1Employment rate . . . . . . . . . . . . . . . . . .Key interest rate per annum (%) 13.5 13.0 11.6 12.0 12.0 11.5 11.1 10.6 10.4RUB per 1 EUR 35.8 35.2 34.1 33.8 34.2 34.2 34.1 34.5 34.9
Nominal year-on-year change of the period average stock in %Broad money (including foreign currency deposits) 35.5 33.9 37.0 35.0 36.1 37.4 39.1 42.3 48.5
Contributions to the year-on-year change of broad money in percentage pointsNet foreign assets of the banking system 22.4 34.0 30.9 29.2 32.1 31.8 30.2 29.9 34.7Domestic credit of the banking system 17.6 0.4 11.7 9.3 10.9 11.6 14.4 19.3 23.2
of which: claims on the private sector 30.8 30.0 36.4 32.1 34.7 38.3 39.4 41.4 44.2claims on households 6.9 8.8 12.0 10.8 11.6 12.4 12.8 12.8 12.9claims on enterprises 23.9 21.2 24.4 21.3 23.0 25.9 26.6 28.6 31.3
claims on the public sector (net) –13.2 –29.6 –24.6 –22.8 –23.7 –26.6 –25.0 –22.1 –21.0Other domestic assets (net) of the banking system –4.5 –0.2 –5.8 –4.2 –7.6 –6.0 –5.5 –6.9 –9.4
% of GDPGeneral government revenues 36.6 39.7 39.7 . . . . . . . . . . . .General government expenditures 31.7 31.6 31.3 . . . . . . . . . . . .General government balance 4.9 8.2 8.4 . . . . . . . . . . . .Primary balance 6.1 9.1 9.2 . . . . . . . . . . . .Gross public debt, general government 21.7 14.9 9.0 . . . . . . . . . . . .
Year-on-year change of the period total (based on EUR) in %Merchandise exports 22.6 33.7 22.9 46.4 28.6 18.0 7.1 –1.8 2.7Merchandise imports 16.6 29.6 28.9 31.7 32.1 26.3 27.1 27.5 26.0
% of GDP (based on EUR), period totalTrade balance 14.5 15.5 14.1 18.1 16.2 13.7 9.8 11.6 10.8Services balance –2.3 –2.0 –1.5 –1.3 –1.4 –1.8 –1.5 –1.3 –1.6Income balance (factor services balance) –2.2 –2.5 –2.9 –1.6 –4.4 –3.0 –2.5 –1.0 –3.6Current transfers –0.1 –0.1 –0.1 0.0 0.1 –0.3 –0.3 –0.2 –0.1Current account balance 9.9 10.9 9.6 15.2 10.5 8.7 5.6 9.2 5.5Capital account balance –0.3 –1.7 0.0 0.0 0.0 0.0 0.0 –0.4 0.1Foreign direct investment (net) 0.3 0.2 1.1 1.2 3.8 0.8 –0.9 4.7 –3.3
% of GDP (rolling four-quarter GDP, based on EUR), end of periodGross external debt 33.4 36.0 30.4 34.2 32.5 28.6 30.4 31.7 33.8Gross official reserves (excluding gold) 18.6 24.0 31.1 24.9 27.7 27.4 31.1 30.6 35.1
Months of imports of goods and servicesGross official reserves (excluding gold) 10.1 13.3 17.6 14.0 15.6 15.6 17.6 17.0 19.2
EUR million, period totalGross domestic product in current prices 475,479 616,014 785,586 167,314 185,145 212,106 221,020 190,564 219,384
Source: Bloomberg, European Commission, Eurostat, national statistical off ices, national central banks, wiiw, IMF, OeNB.1 Due to breaks in the time series data are only indicative.

Developments in Selected Countries
Focus 2/07 ◊ ceec.oenb.at 49
Box 2
Economic Outlook for Central and Eastern European Countries
The OeNB compiles semiannual forecasts of economic developments in the Czech Republic, Hungary and Poland as well as Russia. Taken together, the 3 CEE Member States already account for more than 60% of the 12 CESEE EU Member States’ overall GDP and are thus representative of trends in this region of the EU.27 Among the CEE Member States, economic growth is expected to decelerate in the Czech Republic and in Hungary in 2007 compared to 2006, whereas growth will pick up in Poland. In 2008, economic growth will be stronger only in Hungary; the Czech Republic and Poland are expected to register weaker growth rates.
In the Czech Republic, the growth rates of private consumption are expected to pick up in 2007, driven by a sizeable increase in gross disposable income. Considering the slowdown of GFCF in the first half of this year, GFCF growth in 2007 is expected to be below that of 2006. Export and import growth rates will decline slightly in 2007 compared to 2006. The contribution of net exports to GDP growth is expected to be about neutral. For 2008, private consumption growth is expected to slow down in the wake of a recently accorded reform package which includes, inter alia, higher VAT and excise taxes and lower social transfers. The negative effects on private consumption will be mitigated by employment increases. Due to the reform package, public consumption growth will be slightly negative. GFCF growth is expected to pick up. On the external side, a slowdown both of import and export growth is expected. The contribution of net exports to GDP will again be about neutral.
In Hungary, both private and public consumption will contract in 2007. This can largely be explained with the fiscal consolidation program, which includes, inter alia, an employment cut and a wage freeze in the public sector, an increase in health care contributions and the elimination of some tax exemptions. Real net disposable income is expected to decrease, even if no significant moderation of gross nominal wages in the private sector is assumed. The dynamics of public consumption in the first half of 2007 are considerably below previous expectations, due to a particularly strong decline of social transfers in kind. After declining in 2006, GFCF growth is expected to recover marginally in 2007. The deceleration of export growth will be accompanied by a slowdown of import dynamics, especially as domestic demand continues to contract. The contribution of net exports is expected to remain positive, but significantly smaller than in 2006. For 2008,
27 These forecasts are based on preliminary global growth projections and technical assumptions about oil prices and USD/EUR exchange rates, which are prepared by the ECB for the Eurosystem in broad macroeconomic projection exercises. These assumptions are central to the current outlook for two reasons: f irst, the sizeable export links of these three EU countries with the euro area, and second, the fact that Russia is one of the world’s largest oil-producing nations and that energy sources account for some 60% of the country’s total exports. (In the case of Russia, the forecast is established in collaboration with Suomen Pankki, Finland’s central bank.)
Table 1
GDP Growth in Three Central and Eastern European EU Member States and Russia:Forecast of October 2007
year on year change at constant prices
2004 2005 2006 20071 20081
Czech Republic 4.6 6.5 6.4 5.4 5.1Hungary 4.8 4.1 3.9 2.0 2.5Poland 5.3 3.5 5.8 6.5 5.7
Russia 7.1 6.4 6.7 7.0 6.2
Source: Eurostat, national statistical off ices, OeNB, Suomen Pankki.1 Forecast.

Developments in Selected Countries
50 ceec.oenb.at ◊ Focus 2/07
economic growth in Hungary is expected to pick up moderately. Private consumption will grow marginally as a result of a modest recovery of employment and a stabilization (or minor increase) of real wages. GFCF growth is expected to augment. On the external side, export growth will moderate slightly, and import dynamics are expected to remain roughly stable as a result of deceleration in export growth coupled with a gradual recovery of domestic demand. The contribution of net exports will erode further, but will remain positive.
In Poland, the domestic demand boom is expected to continue in 2007, driven by private consumption and GFCF. Private consumption is rising on the back of high employment growth combined with robust real wage growth and the high growth of credit to households. On the back of buoyant demand, (still) high profitability, robust credit growth and a further increase in the absorption of structural funds, GFCF growth is expected to accelerate further. Export growth is anticipated to decline, while import growth will moderate less strongly. Thus, the contribution of net exports will become more negative. For 2008, GDP growth will moderate somewhat, as domestic demand growth is expected to decline. With real wage growth forecast to slow, private consumption growth will diminish. The deceleration of private consumption growth will be moderated mainly by social reforms (for more details see the country report on Poland). GFCF growth is expected to decelerate from very high levels in 2007, as profitability will come down, creditgrowth will be dampened and the increase of the absorption of structural funds will slow. Export growth will weaken slightly, while import growth will slow moderately. Overall, the contribution of net exports will stay negative.
Regarding possible sources of risk to these forecasts, deviations from the underlying assumptions for external factors, like import growth of the main trading partners and oil price developments, constitute one source of risk. Additionally, some uncertainty remains about the emergence of bottlenecks on the labor market (in particular in the Czech Republic and in Poland), which could lead to an acceleration of real wages, higher inflation and, finally, to tighter than expected monetary policy. In Poland, reforms were adopted before elections took place; thus, there remains some uncertainty about whether they will be changed again. Furthermore, the region depends largely on foreign capital inflows. The recent developments on the financial markets could have a deeper impact on the region than they had up until now (see box 1). In Hungary, public expenditures represent a source of some uncertainty: With elections coming up in 2010, it is unclear how long restraint in public sector investment and wages will last.
In Russia, the economic situation and prospects for 2007 and 2008 are quite good. Annual real growth of private consumption has remained high in recent years and is forecast to continue at a slightly weaker, but still robust rate, due the confluence of buoyant (preelection) rises in real income and the somewhat weaker expansion of lending. Credit growth may be curbed somewhat in late 2007 and in 2008 by a tighter liquidity situation in the banking sector stemming from repercussions of the most recent financial turbulences.
There is pressure to loosen fiscal policy in Russia, given the upcoming elections. Thus, government consumption is expected to speed up somewhat in 2007 and in 2008. GFCF is predicted to continue growing at a robust pace in 2007 and 2008, driven by huge projects in the energy sector and increased public investment. Rapid economic growth and the further real appreciation of the Russian ruble will sustain high import growth which, however, is expected to decline somewhat. Import demand growth is expected to ease because the upward pressure on the ruble will presumably weaken somewhat once the strong rise of oil prices experienced in recent years levels off as expected and becausethe economic expansion will lose some momentum. Rapidly rising imports are not yet considered to pose a threat to Russia’s external balances.
Given the persisting dependence of the Russian economy on the extraction and export of raw materials, the oil price remains a key risk factor for Russian growth. If the oil price

Developments in Selected Countries
Focus 2/07 ◊ ceec.oenb.at 51
were to drop sharply, Russia’s current account balance could run into the red in one or two years from now and economic growth could suffer. However, there are now some buffers that can cushion the decline. Furthermore, the stability of the capital inflows is not guaranteed. Another risk factor consists of a possible excessively quick appreciation of the real exchange rate, triggered by accelerating inflows of energy proceeds and/or capital inflows. The rapid expansion of domestic lending, which has been going on for some years now, will also trigger risks if the number of problem loans swells further. Recently, nonperforming household credits have been proliferating swiftly, albeit from a low point of departure. Another risk could be a stronger curbing of credit growth. Finally, the political uncertainty brought on by the presidential elections in the spring of 2008 could alsospill over into economic risks to growth expected toward the end of the forecast period.


S t u d i e s

54 ceec.oenb.at ◊ Focus 2/07
On the Determinants of Currency Crises: The Role of Model Uncertainty
1 Introduction12The vast majority of the empirical literature uses limited dependent variable – logit or probit – models to assess the effect various potential determinants have on the probability of a currency crisis. The discrete crisis variable (crisis versus non-crisis observation) is regressed on a set of fundamental indicators, e.g. current account and government balances, exchange rate overvaluation or liquidity ratios. The choice of regressors is typically inspired by the three generations of theoretical models on balance of payment crises. In one of the most recent contributions on this topic, Bussière (2007) overhauls the usually static specification, in which, moreover, all regressors tend to enter at the same lag. He extends the usual set of explanatory variables by including several lags of the regressors as well as of the dependent binary crisis variable. He finds that there are several variables that significantly affect the probability of a crisis in a dynamic logit model. However, the impact of the indicators ranges between the short run (4–6 months, e.g. for liquidity measures) and the very long run (2 years, e.g. in case of an overappreciation of the exchange rate). In addition, his results indicate that past crisis episodes increase the probability of a new attack, particularly in the short run.
Notwithstanding substantial variations in the literature on early warning systems for currency crises with respect to methodology, data as well as results, there is one general caveat which applies to all existing binary choice models. Given that there is no unique theoretical framework that links the potential set of determinants with the actual occurrence of currency crises, the issue of model uncertainty surrounding both the choice of variables and the estimates obtained deserves to be treated seriously. Model uncertainty can be explicitly taken into account by means of Bayesian statistical techniques, in particular the Bayesian model averaging (BMA) methodology. It proposes averaging the parameter values over all (relevant) alternative models, using posterior model probabilities as the respective weights to evaluate the relative importance of different variables (see Raftery, 1995, for a general discussion and Sala-i-Martin, Doppelhofer and Miller, 2004, Fernández, Ley and Steel, 2001, or Crespo Cuaresma and Doppelhofer, 2007, for applications to economic growth regressions).
1 Department of Economics, University of Innsbruck, [email protected] Oesterreichische Nationalbank, Foreign Research Division, [email protected]. We would like to thank
Peter Backé, Bálazs Égert, Doris Ritzberger-Grünwald and two anonymous referees for very helpful comments Oesterreichische Nationalbank, Foreign Research Division, [email protected]. We would like to thank Peter Backé, Bálazs Égert, Doris Ritzberger-Grünwald and two anonymous referees for very helpful comments Oesterreichische Nationalbank, Foreign Research Division, [email protected]. We would like to thank
and Matthieu Bussière and Marcel Fratzscher (both ECB) for sharing their datasets with us. The views expressed in this paper are those of the authors and do not necessarily represent the position of the Oesterreichische Nationalbank.
In this contribution, we tackle explicitly the issue of model uncertainty in the framework of binary variable models of currency crises. Using Bayesian model averaging techniques, we assess the robustness of the explanatory variables proposed in the recent literature for both static and dynamic models. Our results indicate that the variables belonging to the set of macroeconomic fundamentals proposed by the literature are very fragile determinants of the occurrence of currency crises.
Jesús Crespo Cuaresma1
Tomáš Slacík2
Jesús Crespo Cuaresma1
Tomáš Slacík2

On the Determinants of Currency Crises: The Role of Model Uncertainty
Focus 2/07 ◊ ceec.oenb.at 55
Given that different theoretical settings are used to explain different crisis episodes, the various authors employ alternative sets of potential explanatory variables (with intersections that are not necessarily empty) to assess the probability of a crisis occurring. The first-generation models (e.g. Krugman, 1979, Flood and Garber, 1984) concentrate on bad economic policy leading to unsustainable developments of some fundamental macroeconomic variables. The fixed exchange rate regime is then abandoned as the central bank’s foreign reserves are eventually exhausted. The second generation of currency crisis models (e.g. Obstfeld, 1994) explains crises as the consequence of self-fulfilling expectations in theoretical settings with multiple equilibria. By contrast, the third generation of models (e.g. Krugman, 1998) assumes that the outbreak of a currency run is a symptom of accumulated problems in the banking and financial sectors. In the theoretical setting, government guarantees aimed at attracting foreign investment lead to a bubble on the asset market that eventually bursts and creates the crisis. Obviously, given the differences in the theories regarding the ultimate cause of the currency crises in the different model generations, the potential empirical determinants to be included in econometric studies vary strongly depending on the theory used to select covariates.
The objective of the present paper is to revisit binary variable modelsfor currency crises based on macroeconomic fundamental data by explicitly taking into account model uncertainty. In particular, we want to work out to what extent model uncertainty undermines the robustness of the explana-tory variables of the logit models championed in the literature (e.g. Bussière and Fratzscher, 2006, or Bussière, 2007). Our results indicate that the macroeconomic variables usually used in empirical studies of currency crises are very fragile determinants of the occurrence of such episodes.
The remainder of the paper is structured as follows: Section 2 sketches the Bayesian model averaging procedure. In section 3, we describe the data and define the variables. Section 4 presents the results on the extent to which model uncertainty matters, while section 5 concludes.
2 Dealing with Model Uncertainty:Bayesian Model Averaging
The binary variable we are interested in modeling takes value 1 if a currency crisis occurs in period t ( 1=iy ) and 0 if no currency crisis is observed( 0=iy ). A stereotypical regression aimed at assessing the effect of a set of variables K
jj 1=}{x on the probability of a currency crisis occurring is given by
P( = 1 | { } ) = ( ),=1y Fi j jK
K'x X β (1)
where )(zF will typically be a logistic function (F z ez( ) = (1 ) 1+ − (for thelogit model) or the distribution function of a normal random variable
)(=)( zzF Φ (for the probit model)), 'KK xx )...(= 1X , which is a subset of
'KK xx )...(= 1X , contains all possible regressors (K of them), and
'K )...(= 1 βββ . In principle, many candidate variables can be proposed as
potential covariates in (1).So far, the literature has tended to concentrate on an arguably tiny subset
of this model space. We will use model averaging techniques (i.e. average over

On the Determinants of Currency Crises: The Role of Model Uncertainty
56 ceec.oenb.at ◊ Focus 2/07
all these alternative models) using Bayes factors so as to evaluate the relative importance of the different variables as determinants of a currency crisis. In a setting with M competing models, },,{ 1 MMM K , which are definedby the choice of independent variables, so that KM 2= , Bayesian inference about a single parameter of interest, iβ , is based on its posterior distribution (that is, the distribution given the data, }{= KyXY ),
P P P( | ) = ( | , ) ( | ),
=1β βi
m
M
i m mM MY Y Y∑ (2)
where the posterior probabilities )|(P YkM are given by
.)(P)|(P
)(P)|(P=)|(P
1=mm
M
m
kkk
MM
MMMY
YY∑
(3)
The posterior model probabilities can thus be obtained as the normalized product of the integrated likelihood for each model ( )|(P kMY ) and the prior probability of the model ( )(P kM ). Note that for the simple case 2=m the posterior odds for one model against the other can be readily written asthe product of the Bayes factor and the prior odds. Further assumingequal priors across models, the posterior odds are equal to the Bayes factor(P P( | ) / ( | )2 1Y YM M ). The Bayes factor, in turn, can be accurately approximated (see Leamer, 1978, and Schwarz, 1978) as
PP
( | )( | )
= 2 ,2
1
2
1
1 2YY
MM
NLikLik
k k( )/−
(4)
where N is the number of observations, jk and jLik are, respectively, the number of parameters and the likelihood of model j. This simple approximation allows us to compute (3) and the corresponding statistics based on (3).
This implies that for a given prior on the model space, the posterior distribution of β can be obtained as a weighted average of the model-specific estimates weighted by the posterior probability of the respective models. If the cardinality of the model space is computationally tractable, (3) can be obtained directly and (2) can be computed. In particular, the expected values of βand its variance, )|(E Yβ and )|(var Yβ , respectively, can be computed as follows:
E E P
var
( | ) = ( | , ) ( | ),
( | ) =
=1
=
β β
β
im
M
i m m
im
M MY Y Y
Y
∑
11
2( | , ) ( | , ) ] ( | ) ( |M
i m i m m iM M M∑ + −[var E P Eβ β βY Y Y YY) .2(5)
The posterior mean and variance can be used to make inference about the quantitative effect that changes in the covariates have on the probability of a currency crisis, while model uncertainty is explicitly taken into account. Several methods have been proposed for approximating the expression in (3) when the cardinality of the model space makes the problem intractable. The leaps and bounds algorithm, the Markov chain and Monte Carlo Model Composite (MC3) or Occam’s window are possible methods of limiting the
On the Determinants of Currency Crises: The Role of Model Uncertainty
Focus 2/07 ◊ ceec.oenb.at 57
number of models to be evaluated when computing (3) (see Raftery, 1995, for an excellent description of these methods).
In our empirical application we will use a simple MC3 algorithm to evaluate the posterior distribution based on the work of Madigan and York (1995), which was also used recently by Fernández, Ley and Steel (2001) in the framework of cross-country growth regressions.3 This Markov chain Monte Carlo method implements the random walk chain Metropolis-Hastings algorithm in the model space as follows. In a given replication 1−r of the algorithm, a candidate model rM is proposed, which is randomly drawn from the group of models composed by the model active in that replication ( 1−rM ), the same model with an extra variable added to the specification and the same model with a variable removed. The proposed model is accepted with a probability given by
α( , ) = ( | ) ( )
( | ) ( ),1
1 1M M M MM M
s ss s
s s−
− −min P PP P
YY
11 ,
(6)
which is just the Bayes factor comparing 1−sM and sM if equal prior probability is assumed across models, so that )(P 1−sM and )(P sM cancel out in the expression above. This algorithm is repeated a large number of times, and the sums defined above are computed for the group of models replicated, which will tend to cover model subspaces with the highest posterior probability.
In the same fashion, posterior inclusion probabilities for the different variables can be obtained by summing the posterior probability of models containing each variable. This measure thus captures the relative importance of the different covariates as determinants of a currency crisis and can be interpreted as the probability that a given variable belongs to the true specification.
3 Data and Variable DescriptionsThe early warning system for currency crises we present in this paper is derived from a binary variable model based on macroeconomic fundamental data, in the spirit of the classical contributions by e.g. Frankel and Rose (1996). Since currency crises are rare events, it is necessary in this type of model to pool country/time data in order to increase the number of observations and obtain sufficient degrees of freedom. Naturally, this procedure implicitly imposesthe assumption of parameter homogeneity across countries and in the time dimension. The resulting first requirement on our sample thus was that the crisis episodes considered be sufficiently homogeneous, that is, characterized by a similar development of fundamentals. In addition, however, it was also desirable in this context to employ the same data source as a recent benchmark study that uses a “standard” binary variable approach (that is, without explicitly dealing with model uncertainty) so as to determine the value added by model averaging.
For these reasons, we decided to use as a yardstick for comparison the dataset of one of the most recent papers on this issue by Bussière (2007), who exercised great care in constructing a sample that is sufficiently homogeneous
3 Koop (2003) also describes this method thoroughly.

On the Determinants of Currency Crises: The Role of Model Uncertainty
58 ceec.oenb.at ◊ Focus 2/07
to ensure that a common development of fundamentals driving the crises may be expected. Against this backdrop, the overall sample consists of a pool of observations on 27 countries recorded from January 1994 to March 2003 and contains approximately 1,400 observations.4 Observations prior to 1994 are taken out of the sample to avoid biases emanating from hyperinflationary experiences in Latin American countries and the early years of transition toward a market economy in Central and Eastern European economies.5
The dependent binary variable is defined to equal 1 if a crisis occurs and 0 otherwise. Although in the common understanding a currency crisis might be associated predominantly with a dramatic devaluation of the exchange rate, the literature on early warning mechanisms usually tends to employ a broader definition of currency distress, using the concept of exchange market pressure. The latter is not uniformly defined in the literature, but it is usually the weighted average of some combination of changes in the real or nominal exchange rate, the country’s foreign reserves and the real interest rate. The dependent variable is thus computed in two steps. First, the exchange market pressure index ( tiEMPI , ) for country i at time t is defined as
EMPIRER
RERri t RER
i t
i t
r i t,,
, 1
,= ω ω∆
∆−
+ (( ) −
−
ωresi t
i t
resres∆ ,
, 1
,
where RER stands for the real effective exchange rate, r is the short-term real interest rate and res the level of international reserves. In the next step, this continuous variable is transformed into a binary index which equals 1 whenever
tiEMPI , exceeds the threshold of the country-specific mean ( iEMPI ) plus twice its standard deviation
iEMPIσ :
CIifEMPI EMPI
otherwisei t
i ti
EMPIi,
,= {1 > 2 ,
0 .
+ σ
The choice of the explanatory right-hand side variables in (1) is motivated by the theoretical literature on currency crises on the one hand, and by the results of the existing empirical early warning models on the other. Table 1 lists the complete final set of variables, of which different combinations and transformations are used in the estimations below. Further details on the construction of the variables and the intuition behind their choice can be found in Bussière (2007).
The exchange rate variable is supposed to capture any excessive real overvaluation of the currency, which would be expected to increase the risk of devaluation. It is defined as the deviation of the real exchange rate from a
4 The countries included in the sample are Argentina, Brazil, Chile, Colombia, Ecuador, Mexico, Peru, Venezuela, China, Hong Kong, India, Indonesia, Korea, Malaysia, Philippines, Singapore, Thailand, Czech Republic, Estonia, Hungary, Latvia, Lithuania, Poland, Russia, Slovakia, Slovenia, Turkey.
5 Bussière and Fratzscher (2006) tested for slope homogeneity in a very similar dataset by comparing out-of-sample forecasts based on the parameter homogeneity assumption. From the good forecasting performance they conclude that the same parameter vector is suitable for different countries and episodes. In contrast, the sample used by Peltonen (2006), which contains also data on crises from the 1980s, suggests significant differences between Latin America and Asia.

On the Determinants of Currency Crises: The Role of Model Uncertainty
Focus 2/07 ◊ ceec.oenb.at 59
linear trend. Since data on nonperforming loans are barely available because of underreporting, the lending boom indicator is meant to serve as a proxy. It is defined as the deviation of credit to the private sector ( i
tCPS ) from a one-year average with a two-year lag. The ratio of short-term debt to reserves (and analogously the total debt indicator) reflects the Greenspan-Guidotti rule, which states that reserves should cover entirely the amount of external debt that investors can sell in the short term in case of an attack. A rise of this indicator, which reflects either a rise in debt or a fall of reserves, should render a crisis more likely. The total debt indicator is defined analogously for two different definitions: the locational (lc) and the consolidated concept (cc).6
The set of explanatory variables further contains the current account and government surpluses, both normalized with the respective country’s GDP. The sign of these two indicators is expected to be negative – the higher the surplus (the lower the deficit), the lower should be the probability of an attack. Bussière and Fratzscher (2006) show that contagion across countries is only significant via the financial and not via the trade channel, so only the former was taken into account in Bussière (2007). Financial interlinkages of a country i with all other countries in the sample are modeled as the average of the other
6 The locational banking statistics gather data on international financial claims and liabilities of bank offices resident in the reporting countries on a gross (unconsolidated) basis, including those vis-à-vis own affiliates. In contrast, the consolidated concept covers claims reported by domestic bank head offices, including the exposures of their foreign affiliates, and are collected on a worldwide consolidated basis with inter-office positions being netted out. For details see Bank for International Settlements (2003).
Table 1
Definition of Basic Variables
Variable name Definition Details
Exchange rate, deviation from trendREERDEV
REER TrendTrendi t
i t i t
i t,
, ,
,
*=−
100Trend defined as a simple linear trend
Lending boom
LBCPSGDP
CPSGDPi t
i t
i t
i t
i t,
,
,
,
,
= −
−
−
24
24
**100CPSGDP
CPSGDP
i t
i t
i t k
i t
,
,
,
,
−
−
− −
− −
=24
24
24
24
112 kk
k=∑ 0
11 100*
CPSi t, = credit to the private sector
Short-term debt/reservesSTDR
STDRESi t
i t
i t,
,
,
*= 100STDi t, = short-term debt
RESi t, = international reserves
Total debt/reserves Analogous to short-term debt/reserves Locational or consolidated definitionCurrent account balance CA
GDPi t
i t
,
,
Government balance GBGDP
i t
i t
,
,
Financial contagion CONT EMPI Correli t i t i jj
N, , ,*=
=
−∑ 1
1 Correli j, = correlation of equity market returns
Datastream index, total market 12-month percentage change Broad index Datastream index, banks 12-month percentage change SubindexDatastream index, financial institutions 12-month percentage change SubindexGDP growth rate Annual growth rate of GDP
Source: Authors’ compilation based on Bussière (2007).
On the Determinants of Currency Crises: The Role of Model Uncertainty
60 ceec.oenb.at ◊ Focus 2/07
countries’ jtEMPI ( 1=j to 1−N , ij ≠ ) weighted by the correlation of equity
market returns in country i and country j. Intuitively, the parameter attached to this variable should show up positive in the estimation results. The three subsequent Datastream indices (a broad market index and two subindices on banks and financial institutions) account for the predictive power of financial markets. They are defined as a 12-month percentage change of each stock index and are expected to enter with a negative coefficient. Finally, year-on-year GDP growth is included, as higher economic growth should reduce the government’s temptation to devalue its currency, e.g. in order to gain competitiveness.
4 Empirical Results: How Much Does Model Uncertainty Matter?
Following Bussière (2007), we will present results based on three types of specification. First, we deal with a purely static model, where lags of the dependent variable do not appear as extra regressors in the model, although all explanatory variables are evaluated with a one-month lag with respect to the crisis variable. We then address dynamic models, which on top of the exogenous set of variables employed in the static model also includes up to 6 lags of the crisis index as explanatory variables. Finally, the most general specification includes up to 24 lags of 6 selected variables
( REERDEV LB STDR CAGDP
CONT GROWTH, , , , , ).7
In table 2 we report the results of the BMA exercise for the static case, where all specifications in the model space have been evaluated in order to compute posterior inclusion probabilities and posterior expected values of the parameters.8 We also deal explicitly with the issue of potential multicollinearity among the regressors. The second and third columns of the table present the posterior expected parameter values for each variable (second column) and the posterior inclusion probabilities (third column) for the BMA exercise, using all variables listed in table 1. The results of the BMA exercise are presented under “Static uncorrelated,” after taking out variables whose correlation with some other explanatory variable was equal to or greater than 0.5 (both total debt indicators and one of the Datastream indices).
The posterior expected values of the parameters can be compared with the results obtained by Bussière (2007), which are reported in the sixth column for the simple static model and in the seventh column for the static model with fixed effects. Since Bussière alternates the set of included variables to avoid multicollinearity we report here the range in which his (significant) estimates fall ( ..sn stands for nonsignificant, if no estimate on at least the 10% level was available). Two facts are especially noteworthy when considering the results in
7 Bussière (2007) also estimates models with fixed effects. He reports that the hypothesis that all country-fixed effects are equal to 0 can be rejected, but admits that the p-value of the test is close to 10%. He also estimated conditional logit models for both the static and the dynamic models. The results are very close to those obtained with the model where no fixed effects were used.
8 In order to keep the table readable, we do not report the posterior variances of the parameters, which are available from the authors upon request.

On the Determinants of Currency Crises: The Role of Model Uncertainty
Focus 2/07 ◊ ceec.oenb.at 61
table 2. First, the posterior expected parameter values have mostly the expected sign. The probability of a crisis thus tends to increase with the lending boom, mounting debt relative to reserves, the contagion indicator and the deviation of the exchange rate from its trend. In contrast, robust growth, rising market indices and current account surpluses reduce the risk of a currency attack. The only somewhat counterintuitive result, which is consistently confirmed in all estimations, is the positive sign of the government balance variable.9
However, the lack of robustness of the relationships under study becomes evident when we consider the posterior inclusion probabilities reported in table 2. Since we assign equal prior probability to all models when computing the posterior model averaged objects, our prior on the inclusion probability of each variable is 0.5.10 A look at the data shows that the probabilities of including each variable decreases strongly with respect to the prior, with none of the posterior probabilities being higher than 10%. To put it differently, the model with the greatest posterior probability (in fact one that is very close to 1) implies a constant crisis probability that is not country or time specific (i.e., the model including only a constant).
Table 3 is constructed in the same manner as table 2 for the dynamic model and includes lags of the dependent variable. With the exception of the government balance variable, all variables turn out to have the expected signs again, which – if significant – coincide with those obtained in the benchmark study. However, except for the market indices, this time our coefficients appear to be substantially smaller in magnitude than Bussière’s (2007). The
9 However, it should be borne in mind that the sample for all estimations starts in 1994, and it is a well-known fact that first generation models generally fail to explain crises in the 1990s. This somewhat surprising result might actually support second and third generation models (see for example Krugman, 1996, and Bussière, 2007).
10 There are 2 1−K models including a given variable and 2K total models, so the prior inclusion probability of a given variable is 2 1−K /2 K = 0.5.
Table 2
BMA Results – Static Model
Variable Static Static uncorrelated Bussière (2007) static
E Yiβ( ) Inclusion prob. E Yiβ( ) Inclusion prob. Simple static Fixed effects
Exchange rate, deviation from trend 0.022487 0.001550 0.021211 0.001445 [0.025;0.042] [0.032;0.045]Lending boom 0.008857 0.002301 0.008854 0.002312 [0.006] [0.005;006]Short-term debt/reserves 0.000974 0.001280 0.000976 0.001278 [0.003;0.004] [0.007;0.009]Total debt/reserves (lc) 0.000542 0.001221 [0.002] [0.004]Total debt/reserves (cc) 0.000692 0.001581 [0.003] [0.006]Current account balance –0.032851 0.001479 –0.032725 0.001473 n.s. [–0.141;–0.077]Government balance 0.048337 0.000942 0.048560 0.000945 [0.082] n.s.Financial contagion 0.051736 0.009448 0.051947 0.009797 [0.043] [–0.015;0.043]Datastream index, total market –0.012897 0.031533 –0.012907 0.033148 n.s. [–0.008]Datastream index, banks –0.010366 0.050357 n.s. [–0.014]Datastream index, financial institutions –0.011919 0.090347 –0.011913 0.095018 n.s. [–0.015]Growth rate –0.012887 0.000834 –0.014045 0.000838 [–0.052] n.s.
Source: Authors’ calculations.
Note: n.s. means nonsignif icant.

On the Determinants of Currency Crises: The Role of Model Uncertainty
62 ceec.oenb.at ◊ Focus 2/07
posterior inclusion probabilities are once more well below the 0.5 threshold. In other words, including six de facto new variables does not improve the explanatory power of macroeconomic fundamentals. Bussière finds that the dependent variable is significant only at lags 5 and 6 in both models, with and without fixed effects. His interpretation of this result is that crises sometimes hit in two waves such that the first attack is often followed by a second bout within a short time interval. In this context, it is also interesting to note that all the coefficients of the lagged crisis index in our and Bussière’s regressions enter with a positive sign. Hence, past crises tend to increase the likelihood of repeated attacks, a result which is not quite obvious ex ante. On the one hand, a country that experienced a crisis may be deemed more vulnerable by investors, which would increase the likelihood of a positive sign. On the other hand, however, there are two arguments why crises in the past might reduce the probability of an attack in the future. In the short run, there is not much speculative capital left to be withdrawn after a currency run. In the longer run, one can argue that a country that was already hit by a crisis will have improved its vigilance and supervision mechanisms, which should render another crisis less likely.
In order to account for a general dynamic structure in the model, Bussière (2007) regresses in a standard logit model (without fixed effects) the dependent variable on six chosen explanatory variables
(REERDEV LB STDR CAGDP
CONT GROWTH, , , , , ) which are all lagged by
1 to 24 months. This series of regressions thus provides him with 24 different models and 144 different coefficients from which the author draws the conclusion that “some variables have a very short-term impact, such as the
Table 3
BMA Results – Dynamic Model
Variable Dynamic Dynamic uncorrelated Bussière (2007) dynamic
E Yiβ( ) Inclusion prob. E Yiβ( ) Inclusion prob. Simple dynamic Fixed effects
Crisis index, lag 1 0.582846 0.003311 0.584356 0.003343 n.s. n.s.Crisis index, lag 2 0.034475 0.000722 0.037394 0.000722 n.s. n.s.Crisis index, lag 3 0.032963 0.000723 0.036480 0.000723 n.s. n.s.Crisis index, lag 4 0.357034 0.001151 0.359204 0.001157 n.s. n.s.Crisis index, lag 5 0.776955 0.015559 0.778136 0.015779 [1.636;1.909] [1.298;1.615]Crisis index, lag 6 0.760693 0.014288 0.761846 0.014475 [1.344;2.036] [1.229;2.057]Exchange rate, deviation from trend 0.007840 0.001315 0.007729 0.001296 [0.037;0.056] [0.042;0.599]Lending boom 0.004101 0.002564 0.004100 0.002567 n.s. n.s.Short-term debt/reserves 0.000455 0.001331 0.000457 0.001329 [0.003;0.004] [0.009;0.011]Total debt/reserves (lc) 0.000252 0.001263 [0.0017] [0.005]Total debt/reserves (cc) 0.000332 0.001694 [0.003] [0.007]Current account balance –0.013013 0.001436 –0.013017 0.001437 n.s. [–0.082]Government balance 0.020321 0.000945 0.020402 0.000947 n.s. n.s.Financial contagion 0.023864 0.011573 0.023900 0.011740 n.s. [–0.056;0.052]Datastream index, total market –0.002978 0.007926 –0.002984 0.008090 n.s. n.s.Datastream index, banks –0.003200 0.022722 [–0.011] [–0.013]Datastream index, financial institutions –0.003408 0.028988 –0.003407 0.029626 [–0.011] [–0.016]Growth rate –0.007056 0.000843 –0.007230 0.000846 n.s. n.s.
Source: Authors’ calculations.
Note: n.s. means nonsignif icant.
On the Determinants of Currency Crises: The Role of Model Uncertainty
Focus 2/07 ◊ ceec.oenb.at 63
short-term debt to reserve ratio, some have both a very short-term and a longer-term impact (such as the contagion variable), some have a short- to medium-term impact (such as the lending boom), some always seem to have an impact (such as the exchange rate), while for growth and the current account, no impact can be detected” (Bussière, 2007, page 26). We conducted a different exercise at this point and constructed the BMA exercise, using as explanatory variables 6 lags of the crisis variable and 24 lags of all 12 variables listed in table 1, all at the same time. Hence, this setting contains 294 potential explanatory variables, which implies 2942 (more than 3 1088× ) different models over which we have to average. Given the fact that, with the current technology, this does not appear possible in a lifetime,11 we used the MC3 approach described above to evaluate the posterior objects.
In table 4 we confine ourselves to reporting only the results for the lags of each variable with the highest posterior inclusion probability.12 Focusing on the coefficients in the second column, one can note that some of the signs now have changed into an unexpected direction. The government surplus, which used to carry a counterintuitive positive coeffcient now has got the “right” negative sign, while more robust growth, higher current account surpluses and lower lending suddenly and counterintuitively increase the probabiliy of a crisis – at least for the lags with the highest inclusion probability. As if this was not puzzling enough, the sign of the coefficients is not uniform for all lags but rather alternates from positive to negative for all variables. Interestingly enough, the fluctuation pattern looks in many ways very similar to the one derived by Bussière (2007), as can be seen in charts 1–4, which present the parameters estimated by BMA against Bussière’s results. In his estimations, e.g. growth only has the expected negative sign for lags 1 to 8 and 16 to 19. Similarly, current account surpluses lagged by more than 11 months increase the probability of a crisis. The latter is also more likely the lower the lending boom was 18 months or more ago. It has to be added, however, that growth, the current account and the lending boom from lag 13 on are not significant.
Among the remaining variables which carry the same sign as in the previous calculations (for the lag with the highest posterior inclusion probability at least), it strikes that the effect of the lagged crisis binary variable is again the most robust at lag 5. In addition, the effect of the exchange rate deviation from trend is now almost 20 times bigger than in tables 2 and 3. This is because the coefficient of the exchange rate variable shows a strong bell-shaped form, rising strongly between lags 4 and 10 and decreasing sharply after that. This contradicts somewhat Bussière’s results according to which the exchange rate effect seems much more homogeneous and significant for all lags. It may also be pointed out that all market signals seem to be most symptomatic of tension on the exchange rate market two years before a crisis, which is not quite easy to interpret either.
11 If it took only 0.001 seconds to estimate one model, the whole calculation would last 1.009x1078 years. Although the reasoning put forward above could also imply that interactions between long- and short-term variables play an important role in unwinding currency crises, due to the extra computational burden imposed by the use of cross-products, we do not embark on this type of exercise in the present study.
12 The complete set of results is available from the authors upon request.

On the Determinants of Currency Crises: The Role of Model Uncertainty
64 ceec.oenb.at ◊ Focus 2/07
As can be seen in the fourth column of table 4, which displays the lag with the maximum posterior inclusion probability for each variable, all values but one are far too small. Only the deviation of the exchange rate from trend atlag 10 shows a posterior inclusion probability above the prior of 0.5. Although the importance of the variable is clear, by no stretch of the imagination can we think of any plausible explanation for the fact that only lag 10 appears robust, and even less so if we consider the fact that the second-highest inclusion probability for this variable (at lag 9) is more than ten times smaller. We thus suggest that it is just a matter of coincidence and that also in this exercise fundamentals have proven to have no systematic and robust explanatory power for currency crises.
Table 4
BMA Results: Dynamic Model with Lagged Explanatory Variables
Variable E Yiβ( ) Max. inclusion probability At lag
Crisis index 0.47073 2.08*10–5 5Current account balance 0.023066 3.18*10–5 24Government balance –0.017251 1.30*10–5 18Growth rate 0.008615 1.69*10–5 5Lending boom –0.000927 1.02*10–5 13Financial contagion 0.035614 9.55*10–5 5Datastream index, banks –0.005556 4.22*10–5 24Datastream index, financial institutions –0.005589 6.07*10–5 24Datastream index, total market –0.010482 0.000154 24Exchange rate, deviation from trend 0.129465 0.894149 10Short-term debt/reserves 0.00066 1.98*10–5 7Total debt/reserves (cc) 0.000435 3.53*10–5 23Total debt/reserves (lc) 0.000183 1.93*10–5 22
Source: Authors’ calculations.
Chart 1
GDP Growth – Estimated Parameters at Lag Lengths 1 to 24 Estimated
Parameter values
Source: Authors’ calculations and Bussière (2007).
Crespo Cuaresma and Slacík (2007) Bussière (2007)
0.04
0.03
0.02
0.01
0.00
–0.01
–0.02
–0.03
–0.041 2 3 4 5 6 7 8 9 10 11 12 13 14 15 16 17 18 19 20 21 22 23 24

On the Determinants of Currency Crises: The Role of Model Uncertainty
Focus 2/07 ◊ ceec.oenb.at 65
5 ConclusionsThe dominant majority of early warning mechanisms for currency crises employs some version of fundamental-based binary choice models. To our knowledge, none of the papers on the subject tackles explicitly the issue of model uncertainty in currency crisis models. In the present paper, we do take into account model uncertainty in the framework of a binary choice model. By means of Bayesian model averaging we estimate the coefficients for each variable as weighted averages over the alternative models from the model space, where the weights correspond to the posterior probability of each model. In order to determine the value added by this approach as opposed to
Chart 2
Current Account Surplus/GDP – Estimated Parameters at Lag Lengths 1 to 24
Parameter values
0.025
0.020
0.015
0.010
0.005
0.000
–0.005
–0.010
–0.015
Source: Authors’ calculations and Bussière (2007).
Crespo Cuaresma and Slacík (2007) Bussière (2007)
1 2 3 4 5 6 7 8 9 10 11 12 13 14 15 16 17 18 19 20 21 22 23 24
Chart 3
Lending Boom – Estimated Parameters at Lag Lengths 1 to 24s 1 to 24
Parameter values
Source: Authors’ calculations and Bussière (2007).
Crespo Cuaresma and Slacík (2007) Bussière (2007)
0.007
0.006
0.005
0.004
0.003
0.002
0.001
0.000
–0.001
–0.002
–0.0031 2 3 4 5 6 7 8 9 10 11 12 13 14 15 16 17 18 19 20 21 22 23 24

On the Determinants of Currency Crises: The Role of Model Uncertainty
66 ceec.oenb.at ◊ Focus 2/07
“standard” logit regressions we used the same data set as Bussière (2007), one of the most recent studies on the subject.
If the discrete dependent variable is constructed so as to predict the exact month in which a crisis may happen, our conclusions are twofold. On the one hand, we found that coefficients mostly have the expected signs that also coincide with those of the benchmark study. On the other hand, however, our principal quality gauge – the posterior inclusion probability (i.e. the sum of posterior probabilities of all models containing a particular variable) – unveils a lack of robustness in the relationships between regressors and the dependent variable. These results imply that at least in this setting, the best model to explain a currency crisis is a mere time- and country-unspecific constant. Our results, therefore, indicate that none of the usual macroeconomic fundamental variables is a robust determinant of currency crises for the definition and sample used.
Since our sample starts in 1994, it could well be that the episodes of currency distress included in the sample are crises of the second and third generation type. In this case it would not be surprising that the explanatory power of fundamental data is only limited. To turn the argument around, fundamentals should play a much more significant role in a sample covering the first-generation type of crises. Exactly along these paths we are planning to conduct our future research.
Another way of testing the different theoretical frameworks proposed by the three generations of currency crisis models would be to group variables by theory and compute the joint inclusion probability of these groups of variables. Constructing groups of variables by theory could be handled in the BMA framework by using the proposal by Brock, Durlauf and West (2003), who use a hierarchical prior in order to sort variables into theories or thematic indicators (see also the recent contribution by Doppelhofer and Weeks (2007) for the concept of jointness of determinants in the BMA framework). Although
Chart 4
Deviations of the Real Exchange Rate from Trend –
Estimated Parameters at Lag Lengths 1 to 24
Parameter values
Source: Authors’ calculations and Bussière (2007).
Crespo Cuaresma and Slacík (2007) Bussière (2007)
0.14
0.12
0.10
0.08
0.06
0.04
0.02
0.00
–0.021 2 3 4 5 6 7 8 9 10 11 12 13 14 15 16 17 18 19 20 21 22 23 24

On the Determinants of Currency Crises: The Role of Model Uncertainty
Focus 2/07 ◊ ceec.oenb.at 67
we did not follow their approach in this paper, we propose it as a potentially fruitful research path.
An interesting issue that has not been tackled directly in this contribution and deserves further scrutiny is the possibility of nonlinear effects in the form of interactions among the potential determinants of crises. Developments in some relevant variables may play a role in preparing the ground for imbalances that lead to a currency crisis when triggered by an unsound development in an additional variable. Interaction terms in a BMA setting could be used to assess the importance of this type of effects.
ReferencesBank for International Settlements. 2003. BIS Papers No. 16: Guide to the international
banking statistics, Bank for International Settlements, Basel, April 2003.Brock, W. A., S. N. Durlauf and K. D. West. 2003. Policy Evaluation in Uncertain
Economic Environments. In: Brookings Papers on Economic Activity 1. 235–322.Bussière, M. 2007. Balance of Payment Crises in Emerging Markets – How Early Were the
“Early” Warning Signals? European Central Bank Working Paper 713.Bussière, M. and M. Fratzscher. 2006. Towards a New Early Warning System of Financial
Crises. In: Journal of International Money and Finance 25. 953–973.Crespo Cuaresma, J. and G. Doppelhofer. 2007. Nonlinearities in Cross-Country
Growth Regressions: A Bayesian Averaging of Thresholds (BAT) Approach. In: Journal of Macroeconomics 29. 541–554.
Doppelhofer, G. and M. Weeks. 2007. Jointness of Growth Determinants. In: Journal of Applied Econometrics. Forthcoming.
Fernández, C., E. Ley and M. F. Steel. 2001. Model Uncertainty in Cross-Country Growth Regressions. In: Journal of Applied Econometrics 16. 563–576.
Flood, R. and P. Garber. 1984. Collapsing Exchange Rate Regimes: Some Linear Examples. In: Journal of International Economics 17. 1–13.
Frankel, J. A. and A. K. Rose. 1996. Currency Crashes in Emerging Markets: an Empirical Treatment. In: Journal of International Economics 41. 351–366.
Koop, G. 2003. Bayesian Econometrics. Chichester, John Wiley & Sons.Krugman, P. 1979. A Model of Balance-of-Payment Crisis. In: Journal of Money, Credit and
Banking 11. 311–325.Krugman, P. 1996. Are Currency Crises Self-Fulfilling? In: NBER Macroeconomics Annual
1996. 347–407.Krugman, P. 1998. What Happened to Asia? Massachussets Institute of Technology.
Mimeo. Leamer, E. E. 1978. Specification Searches. New York, John Wiley & Sons.Madigan, D. and J. York. 1995. Bayesian Graphical Models for Discrete Data.
In: International Statistical Review 63. 215–232.Obstfeld, M. 1994. The Logic of Currency Crises. In: Cahiers Economiques et Monetaires
43. 189–213.Peltonen, T. A. 2006. Are Emerging Market Currency Crises Predictable? – A Test.
European Central Bank Working Paper 571.Raftery, A. E. 1995. Bayesian Model Selection in Social Research. In: Sociological
Methodology 25. 111–196.

On the Determinants of Currency Crises: The Role of Model Uncertainty
68 ceec.oenb.at ◊ Focus 2/07
Sala-i-Martin, X., G. Doppelhofer and R. Miller. 2004. Determinants of Long-Term Growth: A Bayesian Averaging of Classical Estimates (BACE) Approach. In: American Economic Review 94. 813–835.
Schwarz, G. 1978. Estimating the Dimension of a Model. In: Annals of Statistics 6.461–464.

Focus 2/07 ◊ ceec.oenb.at 69
Credit Growth in Central andEastern Europe Revisited
1 Introduction and Previous Analytical Work1
Most Central, Eastern and Southeastern European (CESEE) countries have recorded high private sector lending growth in recent years, and the expansion of credit to this sector has become one of the key topics of the economic policy debate in the emerging economies of Europe. A comprehensive account of these issues can be found in Enoch and Ötker-Robe (2007). policy debate in the emerging economies of Europe. A comprehensive account of these issues can be found in Enoch and Ötker-Robe (2007). policy debate in the emerging economies of Europe. A comprehensive account
Given the continued fast growth of private sector lending, one of the focal questions that has increasingly moved center stage is whether credit expansion has become, or is about to become, excessive in the CESEE countries. A number of papers have addressed this question over the last few years (including Cottarelli, Dell’Ariccia and Vladkova-Hollar, 2005; Égert, Backé and Zumer, number of papers have addressed this question over the last few years (including Cottarelli, Dell’Ariccia and Vladkova-Hollar, 2005; Égert, Backé and Zumer, number of papers have addressed this question over the last few years (including
2006, which also contains a concise literature overview; Boissay, Calvo-Gonzalez and Kozluk, 2007; Kiss, Nagy and Vonnák, 2006).
Building on the paper by Égert, Backé and Zumer (2006), whose time Gonzalez and Kozluk, 2007; Kiss, Nagy and Vonnák, 2006).
Building on the paper by Égert, Backé and Zumer (2006), whose time Gonzalez and Kozluk, 2007; Kiss, Nagy and Vonnák, 2006).
horizon ends in 2004, this short study essentially presents updated results. It uses new data on lending developments and its determinants until end-2006, and then addresses some implications for policymaking in European emerging economies.
Égert, Backé and Zumer (2006) use a panel cointegration framework in which private sector credit-to-GDP levels are regressed on a range of fundamentals for 43 transition and nontransition countries that are grouped into various panels and subpanels. The preferred specification contains five explanatory variables (“fundamentals”) to determine the ratios of private sector credit to GDP, namely (1) per-capita GDP in purchasing power parities, (2) public sector credit levels, (3) nominal interest rates (lending rates), (4) producer price inflation, and (5) the spread between lending and deposit rates (as a proxy for financial sector liberalization). Égert, Backé and Zumer use the producer price inflation, and (5) the spread between lending and deposit rates (as a proxy for financial sector liberalization). Égert, Backé and Zumer use the producer price inflation, and (5) the spread between lending and deposit rates
coefficients derived from the estimations for a panel comprising small developed OECD countries to perform an out-of-sample analysis, assuming
1 Oesterreichische Nationalbank, Foreign Research Division, [email protected], [email protected] (at the time of writing; now: [email protected]), [email protected]. The standard disclaimer applies.
This short study builds on earlier work by Égert, Backé and Zumer that analyzes data up to the end of 2004 and presents updated results on the deviations of private sector credit-to-GDP levels from their estimated equilibrium levels in the ten new Central, Eastern and Southeastern European EU Member States and in Croatia. The study uses new data on lending and its determinants until end-2006, which show that the levels of private sector credit to GDP continued to catch up with their long-run equilibrium levels in 2005 and 2006. Moreover, in a few countries, credit levels have already become fairly elevated relative to the underlying fundamentals. The paper discusses implications for policymaking in European emerging economies on the basis of these developments, focusing on the contributions the most important policy domains can make to managing dynamic financial sector deepening and its implications for macroeconomic develop-ments.
Peter Backé,Balázs Égertand Zoltan Walko1
Peter Backé,Balázs Égertand Zoltan Walko1

Credit Growth in Central and Eastern Europe Revisited
70 ceec.oenb.at ◊ Focus 2/07
long-term parameter homogeneity. The purpose of the out-of-sample analysis is to examine whether the levels of private sector credit to GDP in the CESEE countries covered in this study (i.e. the ten new EU Member States from Central, Eastern and Southeastern Europe as well as Croatia) are in line with their fundamentals.2
Notwithstanding some degree of uncertainty (see annex), Égert, Backé and Zumer (2006) conclude that private sector credit-to-GDP levels have tended to approach their equilibrium levels in many (though not all) CESEE countries, in particular since the beginning of the current decade. In 2004,i.e. at the end of the period analyzed by Égert, Backé and Zumer, these levels countries, in particular since the beginning of the current decade. In 2004,i.e. at the end of the period analyzed by Égert, Backé and Zumer, these levels countries, in particular since the beginning of the current decade. In 2004,
were (still) below equilibrium in the Czech Republic, Poland and Romania, while they were within the estimated equilibrium range in Bulgaria, Croatia, Estonia, Hungary, Latvia, Lithuania, Slovakia and Slovenia – with continuing strong upward dynamics in Bulgaria, Croatia, Estonia, and Latvia.
The remainder of this paper is organized as follows. Section 2 summarizes developments in private sector lending in the CESEE countries since the end of 2004 and reports updated results on the deviation between equilibrium levels of private sector credit estimated for, and actually recorded in, these countries. Section 3 discusses policy implications and concludes.
2 Recent Developments and Updated ResultsDuring 2005 and 2006, the expansion of domestic credit to the private sector continued to persist in CESEE. To be more specific, growth picked up in the countries in which it had been subdued before (the Czech Republic, Poland and Slovakia) while remaining buoyant in the other countries. Only Bulgaria saw some moderation of domestic credit growth in 2005 and early 2006, albeit from very high rates, which was followed by a renewed pick-up after mid-2006. At the end of 2006, the annual growth rates of credit to the private sector ranged from 17% to 64% in the countries covered in this study. The Central European countries, Croatia and Bulgaria – the latter due to the aforementioned temporary dip in credit growth – were near the lower end of this range, and Estonia, Latvia and Romania at the upper end, while Lithuania took an intermediate position. In most countries, mortgage lending has continued to account for a large share of credit expansion, and real estate markets have been vibrant (for a more detailed account of private sector credit developments in CESEE, see OeNB, 2007a and 2007b, as well as Backé and Wójcik, 2007; for developments in real estate markets, see Égert and Mihaljek, developments in CESEE, see OeNB, 2007a and 2007b, as well as Backé and Wójcik, 2007; for developments in real estate markets, see Égert and Mihaljek, developments in CESEE, see OeNB, 2007a and 2007b, as well as Backé and
2007). Moreover, most recently, there seem to be some indications that the rapid expansion of credit to the private sector has been decelerating somewhat in the Baltic countries (see Sutt, 2007).3 Whether this is a transient dip or a more sustained development remains to be seen.
2 For a more detailed account of the estimation strategy, see Backé, Égert and Zumer (2006).3 In Lithuania and Latvia, year-on-year growth of credit to the private sector measured in real terms (i.e. adjusted
by consumer price inflation) eased during the first half of 2007.
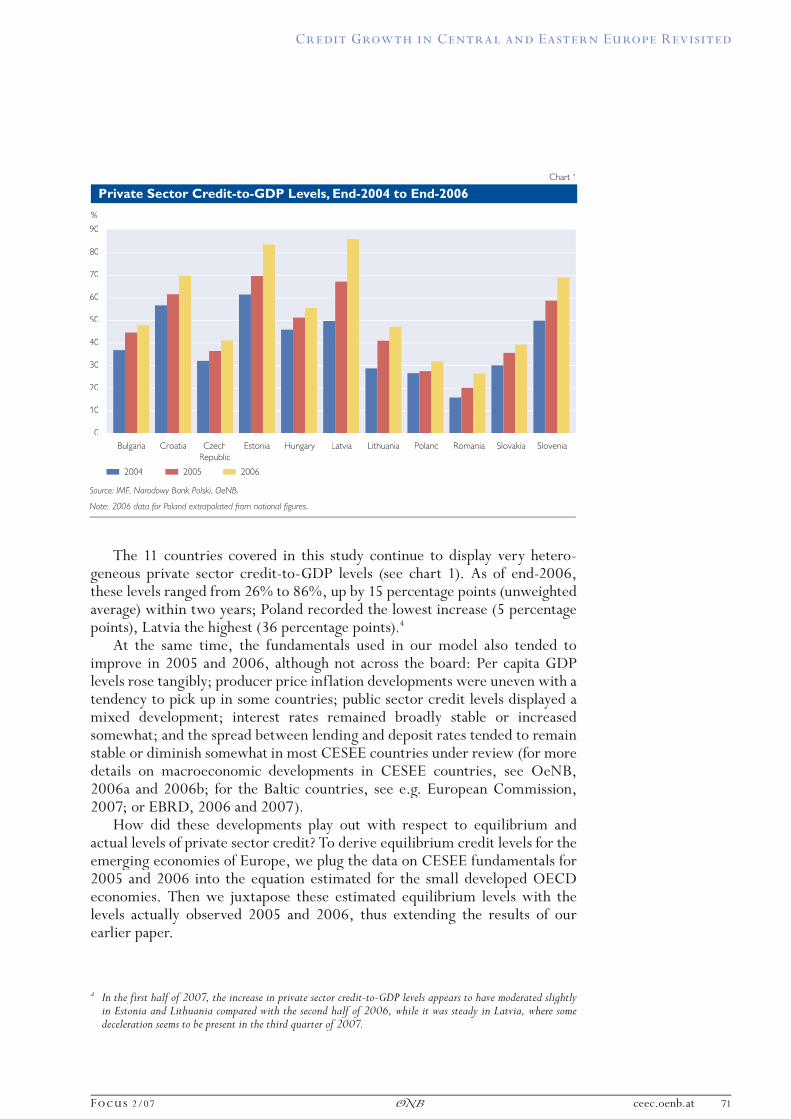
Credit Growth in Central and Eastern Europe Revisited
Focus 2/07 ◊ ceec.oenb.at 71
The 11 countries covered in this study continue to display very hetero-geneous private sector credit-to-GDP levels (see chart 1). As of end-2006, these levels ranged from 26% to 86%, up by 15 percentage points (unweighted average) within two years; Poland recorded the lowest increase (5 percentage points), Latvia the highest (36 percentage points).4
At the same time, the fundamentals used in our model also tended to improve in 2005 and 2006, although not across the board: Per capita GDP levels rose tangibly; producer price inflation developments were uneven with a tendency to pick up in some countries; public sector credit levels displayed a mixed development; interest rates remained broadly stable or increased somewhat; and the spread between lending and deposit rates tended to remain stable or diminish somewhat in most CESEE countries under review (for more details on macroeconomic developments in CESEE countries, see OeNB, 2006a and 2006b; for the Baltic countries, see e.g. European Commission, 2007; or EBRD, 2006 and 2007).
How did these developments play out with respect to equilibrium and actual levels of private sector credit? To derive equilibrium credit levels for the emerging economies of Europe, we plug the data on CESEE fundamentals for 2005 and 2006 into the equation estimated for the small developed OECD economies. Then we juxtapose these estimated equilibrium levels with the levels actually observed 2005 and 2006, thus extending the results of our earlier paper.
4 In the first half of 2007, the increase in private sector credit-to-GDP levels appears to have moderated slightly in Estonia and Lithuania compared with the second half of 2006, while it was steady in Latvia, where some deceleration seems to be present in the third quarter of 2007.
Chart 1
Private Sector Credit-to-GDP Levels, End-2004 to End-2006
90
80
70
60
50
40
30
20
10
0
%
Source: IMF, Narodowy Bank Polski, OeNB.
2004 2005
Note: 2006 data for Poland extrapolated from national figures.
Bulgaria CzechRepublic
Croatia HungaryEstonia Latvia Lithuania Poland Romania Slovakia Slovenia
2006

Credit Growth in Central and Eastern Europe Revisited
72 ceec.oenb.at ◊ Focus 2/07
Chart 2
Deviations from Long-Run Equilibrium Private Sector Credit-to-GDP, 1990 to 2006Kapitals in
Source: OeNB calculations.
Note: Negative (positive) values indicate that the observed private credit-to-GDP ratio is lower (higher) than what the fundamentals of a particular country would predict. 2006 data forPoland, extrapolated from national figures.
–100
–80–60
–40–20
0
2040
6080
100
Estonia Latvia Lithuania
Czech Republic Hungary Poland
SlovakiaSlovakiaSlo SlovSlovSlo enia
Bulgaria Croatia Romania
1990
1991
1991
1991
1992
1993
1994
1995
1996
1997
1998
1999
2000
2001
2002
2003
2004
2005
2006
1990
1991
1992
1993
1994
1995
1996
1997
1998
1999
2000
2001
2002
2003
2004
2005
2006
1990
1991
1992
1993
1994
1995
1996
1997
1998
1999
2000
2001
2002
2003
2004
2005
2006
1990
1991
1992
1993
1994
1995
1996
1997
1998
1999
2000
2001
2002
2003
2004
2005
2006
1990
1991
1992
1993
1994
1995
1996
1997
1998
1999
2000
2001
2002
2003
2004
2005
2006
1990
1991
1992
1993
1994
1995
1996
1997
1998
1999
2000
2001
2002
2003
2004
2005
2006
1990
1991
1992
1993
1994
1995
1996
1997
1998
1999
2000
2001
2002
2003
2004
2005
2006
1990
1991
1992
1993
1994
1995
1996
1997
1998
1999
2000
2001
2002
2003
2004
2005
2006
1990
1991
1992
1993
1994
1995
1996
1997
1998
1999
2000
2001
2002
2003
2004
2005
2006
1990
1991
1992
1993
1994
1995
1996
1997
1998
1999
2000
2001
2002
2003
2004
2005
2006
1990
1991
1992
1993
1994
1995
1996
1997
1998
1999
2000
2001
2002
2003
2004
2005
2006
–100
–80–60
–40–20
0
2040
6080
100
–100
–80–60
–40–20
0
2040
6080
100
–100
–80–60
–40–20
0
2040
6080
100
–100
–80–60
–40–20
0
2040
6080
100
–100
–80–60
–40–20
0
2040
6080
100
–100
–80–60
–40–20
0
2040
6080
100
–100
–80–60
–40–20
0
2040
6080
100
–100
–80–60
–40–20
0
2040
6080
100
–100
–80–60
–40–20
0
2040
6080
100
–100
–80–60
–40–20
0
2040
6080
100
Baltic countries
Central and Eastern European countries
Southeastern European countries

Credit Growth in Central and Eastern Europe Revisited
Focus 2/07 ◊ ceec.oenb.at 73
This exercise yields the following results (see chart 2): In the Baltic countries, Bulgaria, Croatia and Slovenia, the levels of actual private sector credit to GDP picked up further relative to their long-run equilibrium levels during 2005 and 2006. This increase was most pronounced in Latvia. In addition, a more moderate rise was also observable in Hungary. In the remaining countries under review, actual private sector credit-to-GDP levels by and large moved in tandem with the estimated equilibrium levels.
In 2005 and 2006, improvements in the set of fundamentals that feature in our model helped to lift the estimated equilibrium levels of credit to the private sector in all countries covered in this study, although to different extents. It is noteworthy that the impact of movements in these fundamentals was least pronounced in Bulgaria, Croatia, and Hungary. In the other countries, these movements had a larger upward impact on the equilibrium levels of private sector credit. However, the sizeable increase in actual credit-to-GDP levels in some countries more than offset the impact of improved fundamentals, so that private sector credit-to-GDP levels continued to inch up relative to their equilibrium levels during 2005 and 2006.
As a consequence of these developments, private sector credit-to-GDP levels in 2006 were still below equilibrium in Poland and Romania, and marginally below equilibrium also in the Czech Republic. In the other countries under review, they were within the estimated equilibrium range, though with considerable differences across countries. In Slovakia and Lithuania, private sector credit-to-GDP levels were (still) close to the lower bound of the estimated equilibrium ranges, while they were more elevated in Bulgaria, Estonia, Hungary and Slovenia. In Croatia and Latvia, private sector credit levels in 2006 were even higher, namely above the midpoints of the estimated equilibrium ranges, and were actually moving quite swiftly toward the upper bound of the estimated equilibrium ranges in the case of Latvia.
3 Policy Implications and ConclusionNotwithstanding the caveats presented in the annex, our results for Croatia and Latvia may be interpreted as pointing to a risk of overshooting private sector credit levels, in particular if our findings were corroborated by empirical evidence derived from other models and frameworks. This may raise macroeconomic and financial stability concerns. In both countries, currency substitution is high, which adds to potential vulnerabilities while at the same time complicating the design of an appropriate policy response. A moderation of credit growth thus appears to be advisable with a view to preserving and underpinning stability. Developments would seem to require close monitoring in those CESEE countries in which private sector credit levels are elevated but still well within the equilibrium range.
Experience shows that a multipronged policy response is typically the most promising approach for dealing with lending booms that are considered to be, or that may become, too buoyant (see Hilbers, Ötker-Robe and Pazarbasioglu, promising approach for dealing with lending booms that are considered to be, or that may become, too buoyant (see Hilbers, Ötker-Robe and Pazarbasioglu, promising approach for dealing with lending booms that are considered to be,
2007). At the same time, administrative measures to curb credit growth often show little effect beyond a short time horizon, as circumvention takes hold over time. In a context of high capital mobility, administrative measures could presumably only be effective for a (somewhat) longer time span, if they

Credit Growth in Central and Eastern Europe Revisited
74 ceec.oenb.at ◊ Focus 2/07
encompassed banks and nonbank financial intermediaries as well as domestic and cross-border lending (which would, in turn, effectively require a concerted action of home and host supervisors, given the high degree of foreign ownership of banks and other financial intermediaries in CESEE). However, apart from feasibility considerations and possibly legal aspects (free capital mobility), such a comprehensive approach would imply distortions which could hamper the efficient functioning of markets.5
There may be some room left to stiffen prudential regulations in CESEE countries – especially limitations focusing on the borrower side (debt service-to-income ratios, debt-to-equity ratios, etc.) and on currency mismatches (loan classification and provisioning, capital adequacy requirements). However, prudential regulations cannot be tightened much beyond international best practices and standards, both for legal reasons (e.g. harmonization of regula-tions across countries, partly owing to Basel II) and for reasons related to establishing a level playing field (including regulatory arbitrage).
Thus, standard macroeconomic instruments will have to play an important role in taming credit growth and, more generally, exuberant domestic demand. These instruments include fiscal policy (no further tax cuts; no spending of windfall revenue gains; removal of distortions in the tax and subsidy systems that encourage credit growth;6 the introduction of taxes on credit or interest payments), income policy (restraint in public sector and minimum wage increases) as well as structural policies (in particular, strengthened incentives to work7to work7to work ).
Monetary policy can make a meaningful contribution to taming credit growth (or moderating its effect on the economy) in countries with flexible exchange rate arrangements and a limited degree of currency substitution in financial assets and liabilities. In turn, in countries with fixed exchange rate regimes and/or a high degree of currency substitution, monetary policy (possibly apart from mandatory reserve requirements) does not seem to be the most obvious option for dealing with credit booms. Expanding monetary flexibility and thus making room for monetary tightening may help to contain credit growth, but presumably only to a limited extent. In particular, increased monetary autonomy would be of limited effectiveness, given the major role of foreign currencies in financing the domestic nonbank private sector (foreign currency lending by domestic banks plus cross-border borrowing), and monetary tightening may lead to even more currency substitution.
5 Moreover, it could be argued that such an approach would raise questions about its underlying assumption (namely, that a whole set of domestic and foreign economic agents are acting without appropriate care, while supervisors have superior information on what should be done) and also about the freedom of the financial sector to design and implement business strategies.
6 While the first two measures would, ceteris paribus, moderate total domestic credit growth, the third would directly affect private sector credit developments.
7 Again, such measures would indirectly affect private sector credit developments, either by moderating its effects on the economy or by helping underpin its sustainability. Wage moderation would dampen aggregate demand ( fueled inter alia by credit growth) and possibly also affect the creditworthiness of borrowers, while structural reform measures would improve the supply side of the economy and thereby moderate gaps between aggregate demand and supply, which may have resulted to some extent from the demand-feeding effects of credit expansion.

Credit Growth in Central and Eastern Europe Revisited
Focus 2/07 ◊ ceec.oenb.at 75
At the same time, allowing for more exchange rate flexibility in countries with hard pegs and/or a high degree of currency substitution carries substantial risks. First, increased exchange rate variability may lead to depreciation pressure: Given the large external imbalances in many CESEE countries (in particular those with pegged exchange rates), there seems to be a substantial risk of an adverse initial financial market response to changes in the monetary regime. A major depreciation of the currencies may fuel inflation (from already elevated levels) and could have severe implications for financial stability, given the large unhedged foreign exchange exposure of households and small and medium-sized enterprises.
Second, alternatively, an interest rate hike may stabilize the currency but would presumably be relatively ineffective in cooling the economy (compare e.g. ECB, 2006). Moreover, in a setting of high capital mobility, capital inflows could easily thwart the rise of short-term interest rates.
Third, nominal exchange rate appreciation, in turn, facilitated by an increase in the domestic interest rate level, could have some dampening effect on aggregate demand. However, by putting the burden on the export sector, such a policy may do little to cool domestic demand (instead, it may fuel imports). Moreover, in the context of already high currency substitution, appreciation would lead to positive balance-sheet and wealth effects, which would further fuel domestic demand, at least in the short term.
Furthermore, monetary autonomy is in itself no guarantee against rapid credit growth, as several cases of CESEE countries with flexible exchange rate regimes demonstrate (e.g. Albania, Romania, Serbia). Finally, recent history provides no precedent of a country with a currency board arrangement, a particular hard-peg arrangement enshrined in law, exiting such a regime voluntarily. Allowing more exchange rate flexibility in these countries, subject to prior parliamentary approval, would thus imply a move into unknown territory.
Therefore, countries with hard pegs will find it expedient to put a high premium on taking timely and appropriate policy measures in fiscal, income and structural policies. In the event that these policies are not sufficiently supportive of the existing exchange rate commitments, hard pegs will eventually prove to be unsustainable. Moreover, policy consistency is key to containing vulnerabilities emanating from rapid credit growth and to ensuring the smooth continuation of the catching-up process.
To conclude, managing financial sector dynamics during a catching-up process is a complex task. Thus, analyzing, evaluating and, if need be, responding to private sector credit developments remains high on the political agenda in most, if not all, CESEE countriess and is certain to do so for some time to come.
Editorial close: October 15, 2007.

Credit Growth in Central and Eastern Europe Revisited
76 ceec.oenb.at ◊ Focus 2/07
ReferencesArcalean, C., O. Calvo-Gonzalez, C. More, A. van Rixtel, A. Winkler and T.
Zumer. 2007. The causes and nature of rapid banking sector credit expansion with particular emphasis on Central, Eastern and South-eastern European Countries. In: Enoch, C. and I. Ötker-Robe (eds.). Rapid credit growth in Central and Eastern Europe: Endless Boom or Early Warning? 13–46.
Backé, P. and C. Wójcik. 2008. Credit Booms, Monetary Integration and the New Neoclassical Synthesis. In: Journal of Banking & Finance. Forthcoming.
Boissay, F., O. Calvo-Gonzalez and T. Kozluk. 2007. Using fundamentals to identify episodes of “excessive” credit growth in Central and Eastern Europe. In: Enoch, C. and I. Ötker-Robe (eds.). Rapid credit growth in Central and Eastern Europe: Endless Boom or Early Warning? 47–66.
Cottarelli, C., G. Dell’Ariccia and I. Vladkova-Hollar, 2005. Early Birds, Late Risers and Sleeping Beauties: Bank Credit Growth to the Private Sector in Central and Eastern Europe and in the Balkans. In: Journal of Banking & Finance 29(1). 83–104.
Égert, B., P. Backé and T. Zumer. 2006. Private Credit in Central and Eastern Europe: New (Over)Shooting Stars? ECB Working Paper 687.
Égert, B. and D. Mihaljek. 2007. Determinants of House Price Dynamics in Central and Eastern Europe. In: Focus on European Economic Integration 1/07. Vienna: Oester-reichische Nationalbank. 52–76.
Enoch, C. and I. Ötker-Robe (IMF; eds.). 2007. Rapid credit growth in Central and Eastern Europe: Endless Boom or Early Warning? Houndmills and New York: Palgrave Macmillan.
EBRD. 2006. Transition Report 2006. London.EBRD. 2007. Transition Report Update 2007. London.ECB International Relations Committee, Task Force Enlargement. 2006. Macro-
economic and financial stability challenges for accession and candidate countries. Occasional Paper 48.
European Commission. 2007. Economic Forecast Spring 2007. Brussels. May. Hilbers, P., I. Ötker-Robe and C. Pazarbasioglu. 2007. Analysis of and policy responses
to rapid credit growth. In: Enoch, C. and I. Ötker-Robe (eds.). Rapid credit growth in Central and Eastern Europe: Endless Boom or Early Warning? 84–136.
Kiss, G., M. Nagy and B. Vonnák. 2006. Credit Growth in Central and Eastern Europe: Trend, Cycle or Boom? Paper presented at the conference “Finance and Consumption Workshop: Consumption and Credit in Countries with Developing Credit Markets” in Florence. June 16–17.
Maeso-Fernandez, F., C. Osbat and B. Schnatz. 2005. Pitfalls in estimating equilibrium exchange rates for transition economies. Economic Systems 29(2). 130–143.
OeNB 2006a. Developments in Selected Countries. In: Focus on European Economic Integration 1/06. Vienna: Oesterreichische Nationalbank. 8–41.
OeNB 2006b. Developments in Selected Countries. In: Focus on European Economic Integration 2/06. Vienna: Oesterreichische Nationalbank. 8–46.
OeNB 2007a. Financial Stability Report 13. Vienna. June.OeNB 2007b. Financial Stability Report 14. Vienna. December.Sutt, A. 2007. Credit growth in the Baltics: What’s next? Presentation at the East Capital
Summit. Tallinn. May 30.

Credit Growth in Central and Eastern Europe Revisited
Focus 2/07 ◊ ceec.oenb.at 77
AnnexEconomic and Econometric CaveatsTo put our results into proper perspective, we would like to draw attention to some economic and econometric caveats.
Our model setting, in which the credit-to-GDP ratio is regressed on both supply-side and demand-side variables, implicitly assumes that the credit market is in continuous equilibrium.
In our model the dependent variable is the domestic private sector credit-to-GDP ratio. Direct borrowing from abroad by nonfinancial corporations and households (which is an important source of financing in particular for companies in CESEE) is thus not captured. However, our model does take into account the foreign funds that are intermediated to domestic nonfinancial corporations and households through domestic financial intermediaries.
Domestic credit incorporates equity holdings of banks. Such holdings are low in CESEE, relative to other country groups.
We do not disaggregate into credit to households and credit to nonfinancial corporations. Credit may be in equilibrium at the aggregate level but not necessarily in its segments.
Employing local currency interest rates as an explanatory variable may not fully capture effective interest rates in countries where the private sector holds large liabilities denominated in foreign currencies.
Using the spread between lending and deposit rates to capture financial liberalization is not fully ideal (as changes in the spread may also be caused by other factors), but this is still the most suitable proxy that is available for all countries covered in Égert, Backé and Zumer (2006). other factors), but this is still the most suitable proxy that is available for all countries covered in Égert, Backé and Zumer (2006). other factors), but this is still the most suitable proxy that is available for all
Furthermore, expectations of future incomes which may affect the extent of borrowing against the future are not directly captured in the model.
The behavioral definition of equilibrium we use does not allow analyzing, within the model, the connection between credit levels and external sustainability or financial stability aspects or issues related to the currency or sectoral composition of credit.
The out-of-sample estimation method is a suitable approach to examine the deviation of credit levels from equilibrium for countries that come from a transition context (compare Maeso-Fernandez, Osbath and Schnatz, 2005, who first made this point in the context of equilibrium exchange rate analysis). However, this method does not yield country-specific constant terms for deriving the equilibrium credit levels for the CESEE economies. We deal with this issue by using the largest and the smallest constant terms obtained on the basis of the small developed OECD economies panel. This gives us a range of estimated values for private sector credit. Since the constant terms display a fairly wide variety, the ranges for the equilibrium credit levels also tend to be relatively large. This indicates a noticeable amount of uncertainty.
Finally, the equilibrium ranges should be interpreted as long-run ranges to which the CESEE countries converge. Given the ongoing structural con-vergence of CESEE countries with the benchmark sample of small developed OECD countries, the assumption of long-run parameter homogeneity seems to be a reasonable one.

78 ceec.oenb.at ◊ Focus 2/07
Exchange Rate Arrangements and Monetary Policy in Southeastern Europe:
An Update (2004–2007)
1 IntroductionThe main purpose of this paper is to summarize, analyze and compare the evolution of exchange rate regimes and monetary policy developments in ten Southeastern European countries 2 – Albania, Bosnia and Herzegovina, Bulgaria, Croatia, Kosovo, the Republic of Macedonia,3 Montenegro, Romania, Serbia, and Turkey – from 2004 to 2007. The article, an update of a study published in 2004 (Barisitz, 2004), is structured as follows: Section 2 presents a descriptive outline of the monetary policy frameworks in the region over the observation period. Section 3 deals with the individual countries’ economic performance as well as their monetary and exchange rate aims, policies, instruments, issues and outcomes. Section 4 summarizes and compares the main results of the preceding sections and draws some overall conclusions.
2 Exchange Rate Regimes and Monetary Policy Frameworks in the Region: A Concise Overview of Developments from 2004 to 2007De jure and/or de facto, the euro has continued to play an important role for the economies and economic policies of Southeastern European countries. Six of the ten countries under review use the euro as an external anchor for
1 Oesterreichische Nationalbank, Foreign Research Division, [email protected]. The standard disclai mer applies. The author is indebted to Doris Ritzberger-Grünwald, Peter Backé, Balázs Égert and Sándor Gardó Oesterreichische Nationalbank, Foreign Research Division, [email protected]. The standard disclai mer applies. The author is indebted to Doris Ritzberger-Grünwald, Peter Backé, Balázs Égert and Sándor Gardó Oesterreichische Nationalbank, Foreign Research Division, [email protected]. The standard disclai mer
(all OeNB) for their valuable comments and suggestions.2 Not all of them are independent countries at present, but they are all separately administered currency areas.
Thus, for the sake of simplicity, the author chooses to call Kosovo (Kosova in Albanian) a “country” in this contribution. He is, of course, aware that Kosovo is a UN-administered province of Serbia, and therefore a nonsovereign territory according to international law.
3 The former Yugoslav Republic of Macedonia (FYROM) will be referred to as Republic of Macedonia in this contribution.
This contribution updates a study published in 2004. Four of the ten countries analyzed (Bosnia and Herzegovina, Bulgaria, Croatia and the Republic of Macedonia) continue to feature hard pegs and nominal exchange rate anchors to the euro, while four others (Albania, Romania, Serbia and Turkey) conduct loosely managed floats, and – with the exception of Albania – introduced inflation targeting in 2005 or 2006. One country (Montenegro) and one nonsovereign territory (Kosovo) remain unilaterally euroized. Although all countries have upheld prudent monetary policies supported by strengthened fiscal positions, disinflation has slowed down in recent years. Recent upticks of inflation have been triggered by rising wage pressures, accelerating credit booms, food price spikes caused by extreme weather conditions, and increases in oil prices, utility tariffs and indirect taxes (with some of the latter being one-off factors). While the anti-inflationary effectiveness of pegs continues to be satisfactory overall, the comparatively brief experience with inflation targeting has already delivered good results in some cases. In other cases it may yet be too early to judge. The impact of capital flows on monetary policy has been on the rise, creating new challenges, and triggering repercussions (in both ways) for inflation rates.
Stephan Barisitz1Stephan Barisitz1

Exchange Rate Arrangements and Monetary Policy in Southeastern Europe: An Update (2004–2007)
Focus 2/07 ◊ ceec.oenb.at 79
monetary policy (see table 1). Two of these six countries (Bosnia and Herzegovina, Bulgaria) run currency boards; two others (Montenegro, Kosovo) have adopted the euro as their legal tender; one (the Republic of Macedonia) has pegged its currency to the euro; and one (Croatia) conducts a tightly managed float using the euro as reference currency.
The four other countries (Albania, Romania, Serbia, Turkey) have practiced managed or loosely managed floats coupled with money growth targeting; most recently (in 2005 and 2006) all of them except Albania opted for inflation targeting frameworks (see table 1). In early 2005, Romania chose to use the euro as the sole reference currency, replacing a reference basket in which the euro had the largest weight. In August 2005, it opted for inflation targeting and loosened its managed float. Serbia – which had abandoned its tightly managed float and introduced a euro-oriented “real exchange rate anchor” in 2003 – further loosened its float in February 2006 in preparation for implementing informal inflation targeting through “inflation objectives” in September 2006. Turkey also adopted an inflation targeting regime in January 2006. Albania continued to stick to money growth targets coupled with informal inflation goals, but it plans to move to formal inflation targeting soon.
Table 1
Southeastern European Countries’ Monetary Characteristics (since 2004)
Country Currency Exchange Rate Regime (since); previous
Monetary Policy Frame-work (since); previous
Albania Albanian lek (ALL) Loosely managed float Informal inflation targeting through money growth targeting
Bosnia and Herzegovina Konvertibilna marka (BAM)
Currency board, peg to EUR
Nominal exchange rate anchor EUR
Bulgaria Bulgarian lev (BGN) Currency board, peg to EUR
Nominal exchange rate anchor EUR
Croatia Croatian kuna (HRK) Tightly managed float, reference currency: EUR
Nominal exchange rate anchor
Kosovo (Kosova) All foreign currencies legalized for transactions, EUR predominant, RSD used regionally
EUR = legal tender
Republic of Macedonia Macedonian denar (MKD) De facto peg to EUR Nominal exchange rate anchor EUR
Montenegro Unilaterally euroized/EUR EUR = legal tender
Romania Romanian leu (RON, redenominated in July 2005)
Loosely managed float (August 2005); managed float. Reference currency EUR (early 2005), previ-ously: reference basket: EUR (75%), USD (25%) (early 2004)
Inflation targeting (August 2005); money growth targeting
Serbia (without Kosovo) Serbian dinar (RSD);previously called Yugoslav dinar (YUM)
Loosely managed float (February 2006); managed float
Informal inflation targeting through “inflation objec-tives” (September 2006); real exchange rate anchor (January 2003)
Turkey Turkish lira (TRY, redenominated in January 2005)
Loosely managed float Inflation targeting (January 2006); money growth targeting, informal inflation targeting
Source: author’s own compilation.

Exchange Rate Arrangements and Monetary Policy in Southeastern Europe: An Update (2004–2007)
80 ceec.oenb.at ◊ Focus 2/07
3 Economic Developments from 2004 to 2007 and Current Monetary Policy Issues by Country3.1 AlbaniaMacrostructural BackgroundIn the period from 2004 to 2007, economic growth remained robust at 5% to 6% per annum on average. At the same time, the economy remains highly dependent on remittances (which contributed over 15% to GDP in 2006). Despite some progress in reducing administrative barriers to investment and enterprise creation, the business climate continues to be feeble, and governance and the rule of law are still insufficient. The economy is plagued by harmful power cuts and other infrastructure shortcomings, which are pushing up imports and containing growth. While the country’s current account deficits remain relatively high, budgetary policies have been tightened somewhat in recent years. Net FDI inflows have lately covered more than one-half of the external disequilibria (see table 2)4 and promise to be buoyed in 2007 by the sale of Albtelekom.
Monetary Policy
Banka e Shqipërisë (BS, Bank of Albania) has pursued a cautious monetary policy in recent years, using informal inflation targeting based on money growth targeting. This strategy continued to be remarkably successful (compared with Albania’s regional peers) in keeping inflation at low one-digit levels. By controlling M3 money supply (intermediate objective), the BS committed to keeping year-end inflation measured by the CPI within a
4 However, not all of foreign direct investment is equity-based, or non-debt-creating. According to expert estimates, on the average about one-quarter of FDI in Southeastern European countries consists of credits and other debt-creating instruments, which therefore add to external liabilities. Yet data clearly separating debt- and non-debt-creating FDI are not always easy to procure. Moreover, FDI – of whichever type – is generally assumed to go to productive uses, which should enhance the future competitiveness of a country’s economy and its capacity to earn foreign exchange. Therefore, comparing total FDI inflows with current account deficits, in the author’s opinion, still makes sense.
Table 2
Albania: Key Macroeconomic and Monetary Policy Indicators
2004 2005 2006 2007 1
GDP growth (real, %) 6.2 5.6 5.0 6.0General government budget balance (incl. grants, % of GDP) –5.1 –3.6 –3.2 –3.9Current account balance (incl. official transfers, % of GDP) –3.9 –6.5 –5.9 –7.4Net FDI inflows (% of GDP) 4.6 3.3 3.6 4.0Gross foreign debt (year-end, % of GDP) 20.4 20.5 19.9 19.8Gross reserves of central bank (incl. gold, year-end, % of GDP) 17.1 18.1 18.7 19.2Repo rate (end-year, %) 5.3 5.0 5.5 . .Broad money growth (year-end, %) 13.5 13.9 16.3 16.3Private credit growth (year-end, %) 36.9 73.6 57.2 43.4CPI inflation (year-end, %) 2.2 2.0 2.5 2.9Exchange rate ALL/EUR (annual average) 127.7 124.2 123.1 . .Exchange rate ALL/USD (annual average) 102.8 99.9 98.1 . .1 Forecasts or projections.
Source: National statistics, Banka e Shqipërisë, IMF, wiiw, EBRD, European Commission.

Exchange Rate Arrangements and Monetary Policy in Southeastern Europe: An Update (2004–2007)
Focus 2/07 ◊ ceec.oenb.at 81
fluctuation band of ±1% around 3% in 2003. Recently, price increases have tended to be nearer to, or at, the lower end of this band (end-2006: 2.5%, July 2007: 2.1%, see also table 2). Most recently though – in August 2007 – inflation exceeded the upper band limit for the first time with a sharp one-off uptick to 4.2% (year-end). Repo5 and reverse repo rates remain the main operative policy instrument. In response to the inflationary pressures that emerged in 2006 and have lasted to date (triggered by a gathering credit boom, rising oil and electricity prices, excise tax adjustments and drought-induced food price spikes, which were particularly strong in the summer of 2007), the monetary authorities raised the key interest rate on four occasions by 25 basis points each time (July and November 2006, June and September 2007). In mid-October 2007, the repo rate stood at 6%. Thus, the interest rate differential with the ECB, which had been declining, was restored.
Furthermore, in an effort to keep the credit boom under control, prudential regulations and banking supervision were strengthened in December 2006 and January 2007. In particular, capital requirements were raised for credit institutions with rapidly rising loan volumes. Banka e Shqipërisë has maintained a loosely managed float for the Albanian lek, which appreciated in 2004 and 2005 and has since remained largely stable against the euro in nominal terms. To the extent that the inflation goal is reached, preserving the competitiveness of the country’s exports is a secondary goal of the monetary authority. The BS intends to gradually adjust its strategy toward a formal inflation targeting regime with the aim of enhancing the transparency and credibility of its monetary policies.
3.2 Bosnia and HerzegovinaMacrostructural BackgroundNotwithstanding substantial post-war reconstruction assistance, the country has made only limited progress in building viable and competitive export-oriented capacities. The economy continues to be based largely on raw materials, mining and related manufacturing. Even though external assistance has been reduced gradually, economic growth has remained robust at around 6% in recent years (see table 3). This may be attributable to the strong rise in metal and other resource prices. Foreign direct investment still falls far short of offsetting the huge and persistent current account deficit, but the privatization of Telekom Srpska and more greenfield investment are expected to narrow the financing gap in 2007. Corporate governance is poor, even compared with neighboring countries. The persisting fragility and fragmentation of state authority further complicate structural reform efforts.
Monetary Policy
Fiscal as well as monetary policies have been prudent in recent years; in particular the currency board regime (euro peg) has become a stabilizing anchor for price developments and the economy. Foreign exchange reserves
5 A repo (repurchase agreement) is an instrument that central banks use to temporarily reduce banking system liquidity by selling treasury bills or other debt securities of high credibility and repurchasing them shortly thereafter. In a reverse repo, the transaction is carried out in the reverse order with the aim of temporarily increasing liquidity (Bank of Albania 2007, p. 11).

Exchange Rate Arrangements and Monetary Policy in Southeastern Europe: An Update (2004–2007)
82 ceec.oenb.at ◊ Focus 2/07
have been on the rise, reaching a value that corresponds to around five months of goods and services imports at end-2006. Managing banks’ reserve requirements is the only important monetary policy tool currently at the disposal of Centralna banka Bosne i Hercegovine (CBBH, Central Bank of Bosnia and Herzegovina).
While inflation remained subdued through 2004, continued brisk loan growth as well as the surge in oil and administered prices appear to have made an impact on inflation from 2005 onward. The total credit volume attained a level of 46% of GDP at end-2006, which is second only to Croatia in the entire region. To stem the pace of credit expansion and inflationary pressures, the CBBH raised banks’ reserve requirements several times during the observation period, namely in September 2004 from 5% to 7.5%, in December 2004 to 10%, and in December 2005 to 15% of liabilities. At end-2005, RPI inflation came to 4.4% in the Muslim-Croat Federation and to 4.1% in the Republika Srpska. In 2006, the average RPI almost doubled following the introduction of a 17% value-added tax (VAT) at the beginning of the year, with the end-2006 inflation figures climbing to 6.6% in the Federation and to 4.7% in the Republika (table 3). In the first months of 2007, as the VAT effects wore off, the two figures declined sharply, coming to 1.6% (year on year) in August in both entities. This underlines the tendency of price changes to converge across Bosnia and Herzegovina, notwithstanding considerable differences between regional economic structures.
3.3 BulgariaMacrostructural BackgroundThe Bulgarian economy has witnessed overall favorable macroeconomic developments in recent years. GDP has expanded on average by around 6%, and may now (mid-October 2007) be showing signs of overheating. The persistently high current account deficit widened sharply in 2005 and 2006 (into double digits). Net FDI inflows have also been substantial and have so far kept up with the current account shortfalls, to which they have largely
Table 3
Bosnia and Herzegovina: Key Macroeconomic andMonetary Policy Indicators
2004 2005 2006 2007 1
GDP growth (real, %) 6.0 5.5 6.2 6.2
General government budget balance (% of GDP) –0.6 2.4 3.0 1.2
Current account balance (% of GDP) –19.2 –21.3 –11.4 –12.5Net FDI inflows (% of GDP) 6.5 6.6 6.3 9.0Gross foreign debt (year-end, % of GDP) 54.8 55.4 54.0 . .Gross reserves of central bank (excl. gold, year-end, % of GDP) 23.5 26.6 30.1 32.4Broad money growth (year-end, %) 24.3 18.2 24.7 21.0Domestic credit growth (year-end, %) 18.0 27.6 20.6 22.0RPI inflation (year-end, %): Federation of BiH –0.3 4.4 6.6 . .RPI inflation (year-end, %): Republika Srpska 1.9 4.1 4.7 . .Exchange rate: BAM/EUR (annual average) 1.96 1.96 1.96 1.96Exchange rate: BAM/USD (annual average) 1.58 1.57 1.56 . .1 Forecasts or projections.
Source: National statistics, Centralna banka Bosne i Herzegovine, IMF, wiiw, EBRD, European Commission.

Exchange Rate Arrangements and Monetary Policy in Southeastern Europe: An Update (2004–2007)
Focus 2/07 ◊ ceec.oenb.at 83
contributed. However, this expansion has reached dimensions that may not be sustainable. After having contracted or stagnated in recent years, foreign debt expanded again markedly in 2006; shrinking public debt has been more than offset by rising private liabilities. Foreign currency reserves cover the equivalent of four to five months of goods and services imports.
Monetary Policy
In the last five years, CPI inflation has remained stubbornly at an average level of about 5% and in 2005 and 2006 exceeded 6% at year-end (see table 4). From June to August 2007, CPI inflation doubled to 12% (year on year), which gives rise to concern, even if it partly reflects an unfortunate temporary supply shock. The speed of overall price rises in recent years is linked to the persistent confluence of a number of factors, giving rise to occasional spikes. These factors include repeated food price increases in the wake of adverse weather conditions, recurrent energy price hikes, excise tax adjustments as well as demand pressures, namely the strong credit expansion, particularly to households. The Bulgarian credit boom of recent years attained some of the highest growth rates among transition economies. The boom has sucked in imports and contributed to the deterioration of the current account. Given that the monetary policy regime (currency board anchored to the euro) largely circumscribes instruments for macroeconomic management, fiscal policy is the main tool for controlling aggregate demand and containing external imbalances. While benefiting from robust growth, fiscal policy has also become very cautious in recent years; since 2003 the general government budget has recorded no more deficits, the 2006 surplus exceeded 3% of GDP, and the 2007 surplus is expected to reach around 4% of GDP.
To help check the credit boom and its repercussions on monetary stability and external balances, the Bulgarian National Bank (BNB) launched a containment strategy in 2003 and implemented a series of monetary, prudential and administrative tightening measures: the BNB repeatedly increased its base interest rate and reserve requirements, strengthened capital adequacy and risk exposure regulations, and has applied credit controls or ceilings for quarterly and annual loan growth (since early 2005). While prudential indicators did
Table 4
Bulgaria: Key Macroeconomic and Monetary Policy Indicators
2004 2005 2006 2007 1
GDP growth (real, %) 6.6 6.2 6.1 6.2General government budget balance (% of GDP) 1.8 3.2 3.7 4.0Current account balance (% of GDP) –5.8 –12.0 –15.8 –18.8Net FDI inflows (% of GDP) 7.9 14.4 15.9 16.9Gross foreign debt (year-end, % of GDP) 63.8 69.0 78.4 . .Gross reserves of central bank (excl. gold, year-end, % of GDP) 32.5 31.2 33.2 . .Base rate (year-end, %) 2.4 2.1 3.3 . .Broad money growth (year-end, %) 23.3 24.4 26.8 . .Domestic credit growth (year-end, %) 33.3 35.1 17.1 . .CPI inflation (year-end, %) 4.0 6.6 6.5 7.5Exchange rate: BGN/EUR (annual average) 1.96 1.96 1.96 1.96Exchange rate: BGN/USD (annual average) 1.58 1.57 1.56 . .1 Forecasts or projections.
Source: National statistics, B a lgarska narodna banka, IMF, wiiw, EBRD.

Exchange Rate Arrangements and Monetary Policy in Southeastern Europe: An Update (2004–2007)
84 ceec.oenb.at ◊ Focus 2/07
not show signs of serious deterioration, bank lending eventually slowed down in late 2005 and in 2006 (see table 4).
This slowdown was, however, partly circumvented by the migration of credit activities abroad and by recourse to nonbank financial intermediation (e.g. leasing companies, retailers), which contributed to the increase of private foreign debt. At the beginning of 2006, the monetary authorities therefore extended supervision to the nonbank financial sector, and in the second half of the year, they started to gradually abolish administrative restrictions while maintaining a stringent supervisory framework. In early 2007, domestic bank loan growth regained momentum, buoyed by the country’s EU accession in January of that year. Credit expansion reached 38% in real terms in January–August 2007 (year on year). This reacceleration, the strong wage hike of early 2007 and emerging labor shortages as well as soaring energy prices and exceptionally bad weather (droughts followed by floods) may have been particular causes for the skyrocketing of consumer prices in the summer of 2007. The BNB reacted to the renewed credit boom by hiking the required reserve rate for banks from 8% to 12% on September 1, 2007. The authorities are still planning on ERM II entry at an early date (as far as this is feasible), while retaining the currency board as a unilateral commitment.
3.4 Croatia Macrostructural BackgroundThe Croatian economy has steadily grown (at 4% to 5% per annum) since the turn of the millennium. While still recording twin deficits (budget and current account), the country has gradually improved its fiscal performance in recent years. Net FDI inflows have been high, but were not always sufficient to cover the substantial current account gaps. Concern remains focused on the country’s large gross foreign liabilities, which have been steadily increasing and reached a level of almost 85% of GDP at end-2006 (see table 5). The largest part of the recent debt expansion stems from credit institutions borrowing from parent banks and from corporations directly taking up funds abroad.
Table 5
Croatia: Key Macroeconomic and Monetary Policy Indicators
2004 2005 2006 2007 1
GDP growth (real, %) 4.3 4.3 4.8 5.2
Consolidated general government budget balance (% of GDP) –4.8 –4.1 –3.0 –2.8
Current account balance (% of GDP) –4.9 –6.3 –7.6 –7.8Net FDI inflows (% of GDP) 2.5 3.9 7.8 6.2Gross foreign debt (year-end, % of GDP) 79.4 81.7 84.7 85.0Gross reserves of central bank (excl. gold, year-end, % of GDP) 22.5 23.6 25.3 . .Discount rate (year-end, %) 4.5 4.5 4.5 . .Broad money growth (year-end, %) 9.3 10.5 18.0 10.4Domestic credit growth (year-end, %) 11.8 19.2 18.9 . .CPI inflation (year-end, %) 2.7 3.6 2.0 2.9Exchange rate: HRK/EUR (annual average) 7.50 7.40 7.32 7.38Exchange rate: HRK/USD (annual average) 6.04 5.95 5.84 5.491 Estimates or forecasts.
Source: National statistics, Hrvatska narodna banka, IMF, wiiw, EBRD, European Commission.

Exchange Rate Arrangements and Monetary Policy in Southeastern Europe: An Update (2004–2007)
Focus 2/07 ◊ ceec.oenb.at 85
Monetary PolicyThe Croatian kuna’s long-standing tightly managed float has been upheld in recent years. Actually, since 2002, a de facto corridor of about ±4% around a hypothetical central rate of 7.5 to the euro has been observed. Notwithstanding the country’s sustained low inflation track record (CPI inflation was 2.6% in August 2007), about two-thirds of loans as well as deposits continue to be denominated in, or indexed to, a foreign currency (persistently high level of euroization). The unfolding of a credit boom has added to macroeconomic tensions (weighing on external imbalances) and inflationary pressures in recent years. At end-2006, Croatia’s ratio of credit to GDP reached 76%, the highest of the region and one of the highest of all transition countries.
After implementing some temporary restrictions on credit growth in 2003, Hrvatska narodna banka (HNB, Croatian National Bank) introduced and progressively tightened marginal and special reserve requirements from 2004 to 2006. In addition, prudential regulations were strengthened in 2005 and 2006. These steps could, however, not prevent lending from reaccelerating in 2005 and 2006 (the credit volume grew by about one-fifth each year, see table 5) and from contributing to the further rise of foreign debt. In December 2006, the HNB resorted to a new administrative intervention: It imposed a credit growth limit of 12% on banks for 2007. Moreover, the HNB issued new guidelines to banks on managing household and currency-induced credit risk. While the new measures appear to have helped somewhat rein in bank credit expansion in the first months of 2007, it remains to be seen whether they will keep on being effective for a longer period.
3.5 Kosovo Macrostructural BackgroundKosovo’s economy remains almost totally driven by foreign financial aid and by remittances from the Kosovar diaspora. After external donor assistance had declined sharply and the post-conflict reconstruction boom had come to an end, GDP growth ground to a halt in 2002 and all but stagnated until 2006, which saw some revival of economic activity. The current account deficit after grants deteriorated from 3% of GDP in 2001 to 19% in 2006 (see table 6). Some fiscal loosening in 2004 and 2005 could not compensate for the drain of resources triggered by the downsizing of the international community’s presence in Kosovo. In 2006 fiscal policy was tightened again and the tighter stance was upheld in 2007. Given a weak business climate, foreign investors have remained largely reticent so far. On a more positive note, significant increases in the number of new firms have been registered. Despite partly still unclear property rights, the privatization of socially-owned enterprises made marked progress in 2005 and 2006, and a rise in capital formation, including FDI inflows, has been recorded.

Exchange Rate Arrangements and Monetary Policy in Southeastern Europe: An Update (2004–2007)
86 ceec.oenb.at ◊ Focus 2/07
Monetary Regime and Performance
Kosovo, under unilateral de jure euroization since late 1999, has boasted low single-digit euro CPI inflation since 2002. The Serbian dinar continues to be legal tender in some areas of the province, though. Having contributed to boosting prices in the early years of the United Nations Interim Administration Mission in Kosovo, the international community subsequently scaled down its activities and investments, which was also reflected in modest euro deflation in 2004 and 2005 (see table 6), despite the upward pressure of oil prices and utility tariffs in these years. In the first quarter of 2007, the price level was 1.6% higher than a year earlier. However, repercussions of extreme weather conditions in the summer of 2007 and of international food price developments triggered the strongest increases of consumer prices recorded in the province for half a decade. Accordingly, the CPI rose by 4.7% in July and by 6.6% in August 2007 (year on year). In August 2006, the Banking and Payments Authority of Kosovo (BPK) was redesignated as the Central Banking Authority of Kosovo (CBAK). The CBAK uses liquidity ratios and reserve requirements as the main tools of prudential intervention. Banking and credit activity have been expanding strongly, if from a tiny base. 75% of sector assets have already passed into foreign hands.
3.6 Republic of Macedonia Macrostructural BackgroundWhile the Republic of Macedonia had witnessed only a hesitant recovery in the wake of the economic destabilization triggered by the 2001 ethnic and security crisis, growth seems to have gathered some momentum since 2004, helped by strong external demand for basic metals (the major export staple). Robust growth and increasing fiscal rigor helped bring about a near-balanced budget, which was accompanied by a substantial narrowing of the current account gap in recent years. Apart from occasional spikes, like in 2006, FDI has so far not been impressive, though (see table 7). Continued political risk, weak governance, a feeble judiciary and the modest quality of transport connections have been the main obstacles for strategic foreign investment.
Table 6
Kosovo (Kosova): Key Macroeconomic and Monetary Policy Indicators
2004 2005 2006 1
GDP growth (real, %) 2.1 0.6 3.8Consolidated budget balance (after grants, % of GDP) –5.8 –2.6 3.4Remittances (% of GDP) 15.0 17.2 18.7Current account balance (after grants, % of GDP) –11.3 –15.0 –19.1Net FDI inflows (% of GDP) 0.9 2.6 9.8Interest rate (nonfinancial firms, three to twelve month loans, %) 15.7 15.6 15.5Growth of credit volume (year-end, %) 60.5 37.5 24.0CPI inflation (annual average, %) –1.1 –1.5 0.7Exchange rate (EUR/USD) (annual average) 1.24 1.24 1.261 Preliminary data.
Source: Central Banking Authority of Kosovo, IMF, European Commission.

Exchange Rate Arrangements and Monetary Policy in Southeastern Europe: An Update (2004–2007)
Focus 2/07 ◊ ceec.oenb.at 87
Monetary Policy
Budgetary consolidation has been flanked by successful perseverance with a tight monetary stance. Narodna banka na Republika Makedonija (NBRM, National Bank of the Republic of Macedonia) has retained its de facto peg of the Macedonian denar to the euro, keeping inflation under control. In 2006, CPI inflation rose to about 3% (see table 7), influenced by a combination of higher energy prices, excise tax adjustments and declining food prices as a result of import liberalization due to the country’s WTO accession. With the impact of the excise tax adjustment waning, the overall price level increase declined to 1.3% in July 2007, before a seasonally (drought-)driven surge in food prices lifted inflation to just over 2% in the following month (year on year). Given the mixed performance of external accounts, the exchange rate of the Macedonian denar remained intermittently under pressure. The NBRM countered this pressure by intervening on the foreign currency market and upholding policy rates. Liquidity was also withdrawn through auctions of both central bank and treasury bills.
The improvement in the external accounts since 2005 – largely on the back of staple price rises, expanding remittances and the privatization of a big power distribution company – has reduced macroeconomic tensions. The capital inflows enabled the central bank to replenish its foreign currency reserves, to repay in advance its remaining Paris Club and IMF liabilities and to ease its monetary reins to some degree. From October 2005 to May 2007, interest rates on NBRM bills declined by a total of 5 percentage points. A number of important structural reforms have been adopted recently (among them steps to increase labor market flexibility, improve banking regulation and upgrade infrastructure), which may also attract more FDI in the future and thereby strengthen competitiveness and confidence in the monetary regime. Commercial banks’ deposits and loans are expanding steadily (albeit not quite as fast as in neighboring countries), which points to growing reintermediation and confidence in the financial system.
Table 7
Republic of Macedonia: Key Macroeconomic and Monetary Policy Indicators
2004 2005 2006 2007 1
GDP growth (real, %) 4.1 3.8 3.1 5.0General government budget balance (% of GDP) 0.0 0.3 –0.6 –1.1Current account balance (% of GDP) –7.7 –1.4 –0.4 –1.5Net FDI inflows (% of GDP) 2.9 1.7 5.8 2.5Gross foreign debt (year-end, % of GDP) 39.2 39.8 40.4 . .Gross reserves of central bank (excl. gold, year-end, % of GDP) 15.3 22.3 26.9 . .
Basic rate of NBRM (year-end, %) 6.5 6.5 6.5 . .Broad money growth (year-end, %) 16.1 15.2 24.6 25.1CPI inflation (year-end, %) –1.9 1.2 2.9 2.5Exchange rate: MKD/EUR (annual average) 61.34 61.30 61.19 62.0Exchange rate: MKD/USD (annual average) 49.41 49.29 48.79 . .1 Estimates or forecasts.
Source: National statistics, Narodna banka na Republika Makedonija (NBRM), IMF, wiiw, EBRD, European Commission.

Exchange Rate Arrangements and Monetary Policy in Southeastern Europe: An Update (2004–2007)
88 ceec.oenb.at ◊ Focus 2/07
3.7 MontenegroMacrostructural BackgroundWhile Montenegro’s recovery following the Kosovo war of 1999 was rather feeble initially, growth picked up in 2004 and almost doubled to around 8% in 2006, when the country became independent. Whereas fiscal reforms (including an overhaul of the tax system and the adoption of a centralized treasury) contributed to reining in deficits and even achieving surpluses, current account disequilibria have remained high. Despite growing tourism revenues and workers’ remittances, current account shortfalls have expanded dramatically, reaching 29% of GDP in 2006 and about the same level in the first half of 2007 (see table 8). However, like in some other countries of the region, rising FDI inflows have been the principal drivers of this expansion. These inflows included the privatization sales of the republic’s main generator of exports and GDP, the Kombinat Aluminjiuma Podgorica (KAP), as well as the privatization of large parts of the banking sector, entailing significant restructuring efforts. Moreover, investment in real estate and the tourism sector has started to boom. It appears that Montenegro’s independence (obtained in June 2006) has reduced uncertainty for investors and other economic actors.
Monetary Regime and Performance
Montenegro’s unilateral de jure euroization in 1999–2000 seems to have succeeded in breaking the very high inflation of the past. Annual consumer price increases (euro-based) have declined steadily to about 2% to 3% since 2004 (see table 8) and came to 2.3% in May 2007. However, August 2007 witnessed a spike of 4.6% (year on year) on account of drought-induced food price rises, international food price hikes and utility price increases. Centralna banka Crne Gore (CBCG, Central Bank of Montenegro) uses the regulation of commercial banks’ mandatory reserves as its main policy instrument; furthermore, it has the possibility to indirectly influence interest rates by issuing central bank bills.
Table 8
Montenegro: Key Macroeconomic and Monetary Policy Indicators
2004 2005 2006 2007 1
GDP growth (real, %) 4.2 4.0 8,3 6.5General government budget balance (% of GDP) –2.4 –2.7 1.1 2.0Current account balance (% of GDP) –7.6 –8.9 –29.1 –26.0Net FDI inflows (% of GDP) 3.2 22.0 24.2 22.0Gross foreign debt (year-end, % of GDP) 38,4 39.3 38.4 . .Gross reserves of monetary authority (excl. gold, year-end, % of GDP) 3.9 10.5 11.1 . .Broad money growth (year-end, %) 16.3 49.6 87.4 . .Domestic credit growth (year-end, %) 42.4 10.6 135.9 . .CPI inflation (year-end, %) 1.6 2.5 2.8 3.0Exchange rate (EUR/USD) (annual average) 1.24 1.24 1.26 . .1 Forecasts or projections.
Source: National statistics, Centralna banka Crne Gore, IMF, wiiw, EBRD, European Commission.
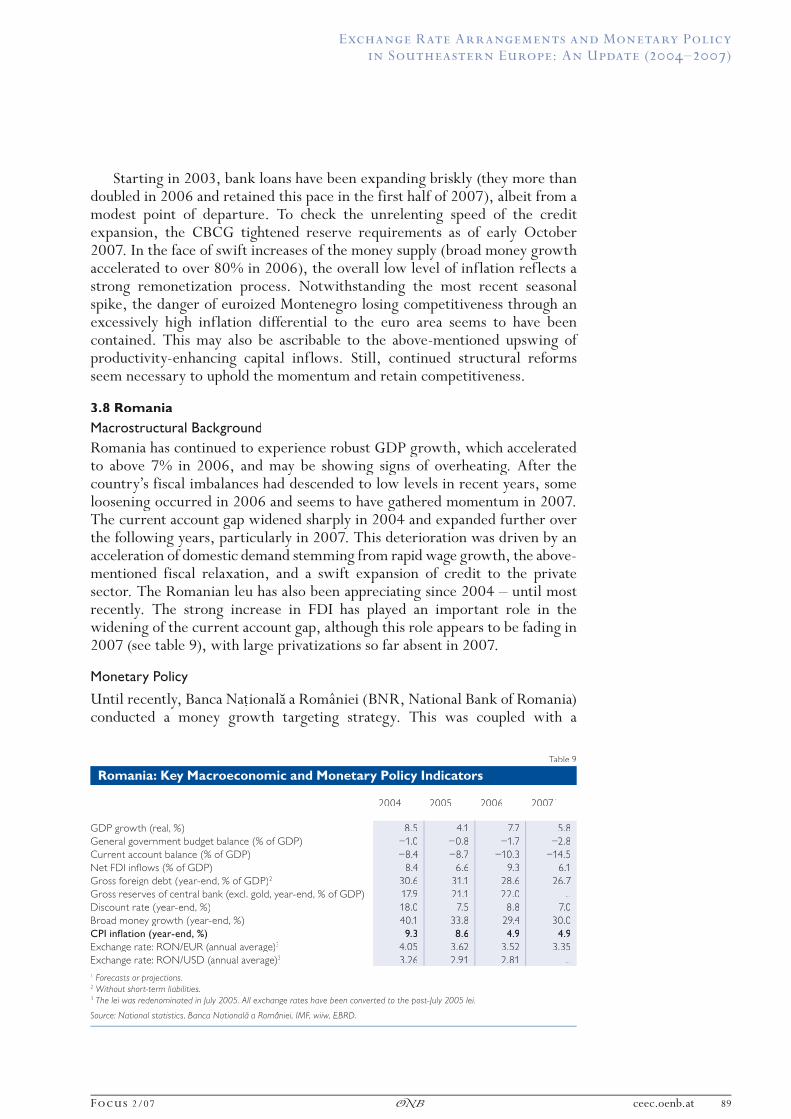
Exchange Rate Arrangements and Monetary Policy in Southeastern Europe: An Update (2004–2007)
Focus 2/07 ◊ ceec.oenb.at 89
Starting in 2003, bank loans have been expanding briskly (they more than doubled in 2006 and retained this pace in the first half of 2007), albeit from a modest point of departure. To check the unrelenting speed of the credit expansion, the CBCG tightened reserve requirements as of early October 2007. In the face of swift increases of the money supply (broad money growth accelerated to over 80% in 2006), the overall low level of inflation reflects a strong remonetization process. Notwithstanding the most recent seasonal spike, the danger of euroized Montenegro losing competitiveness through an excessively high inflation differential to the euro area seems to have been contained. This may also be ascribable to the above-mentioned upswing of productivity-enhancing capital inflows. Still, continued structural reforms seem necessary to uphold the momentum and retain competitiveness.
3.8 RomaniaMacrostructural BackgroundRomania has continued to experience robust GDP growth, which accelerated to above 7% in 2006, and may be showing signs of overheating. After the country’s fiscal imbalances had descended to low levels in recent years, some loosening occurred in 2006 and seems to have gathered momentum in 2007. The current account gap widened sharply in 2004 and expanded further over the following years, particularly in 2007. This deterioration was driven by an acceleration of domestic demand stemming from rapid wage growth, the above- mentioned fiscal relaxation, and a swift expansion of credit to the private sector. The Romanian leu has also been appreciating since 2004 – until most recently. The strong increase in FDI has played an important role in the widening of the current account gap, although this role appears to be fading in 2007 (see table 9), with large privatizations so far absent in 2007.
Monetary Policy
Until recently, Banca NatUntil recently, Banca Nat,Until recently, Banca Nationala a României (BNR, National Bank of Romania) conducted a money growth targeting strategy. This was coupled with a
Table 9
Romania: Key Macroeconomic and Monetary Policy Indicators
2004 2005 2006 2007 1
GDP growth (real, %) 8.5 4.1 7.7 5.8General government budget balance (% of GDP) –1.0 –0.8 –1.7 –2.8Current account balance (% of GDP) –8.4 –8.7 –10.3 –14.5Net FDI inflows (% of GDP) 8.4 6.6 9.3 6.1Gross foreign debt (year-end, % of GDP)2 30.6 31.1 28.6 26.7Gross reserves of central bank (excl. gold, year-end, % of GDP) 17.9 21.1 22.0 . .Discount rate (year-end, %) 18.0 7.5 8.8 7.0Broad money growth (year-end, %) 40.1 33.8 29.4 30.0CPI inflation (year-end, %) 9.3 8.6 4.9 4.9Exchange rate: RON/EUR (annual average)3 4.05 3.62 3.52 3.35Exchange rate: RON/USD (annual average)3 3.26 2.91 2.81 . .1 Forecasts or projections. 2 Without short-term liabilities.3 The lei was redenominated in July 2005. All exchange rates have been converted to the post-July 2005 lei.
Source: National statistics, Banca Nat,Source: National statistics, Banca Nat,Source: National statistics, Banca Nationala a României, IMF, wiiw, EBRD.

Exchange Rate Arrangements and Monetary Policy in Southeastern Europe: An Update (2004–2007)
90 ceec.oenb.at ◊ Focus 2/07
managed float driving a nominal depreciation of the Romanian leu, which, on the whole, resulted in a fairly stable real effective exchange rate. The IMF (2004, p. 767) characterized this regime as an implicit crawling band. From early 2002 to early 2005, a EUR/USD currency basket was the reference unit for the managed float; since early 2005, the euro has been the sole reference currency. Since the early years of the new millennium, the Romanian currency has been under overall appreciation pressure, which was punctuated from time to time by reversals and (short) intervals of weakness. Appreciation pressures have been partially countered by the build-up of foreign exchange reserves and sterilizing interventions. This stance, supported by a coherent policy mix, led inflation to decline from 41% in 2000 to 9% at end-2004 (see table 9). In response to the downward trend of inflation, the central bank lowered its interest rates substantially.
Favored by the improved macroeconomic situation, a credit boom soon emerged. This reflected a long-deferred structural catching-up process in consumption and capital formation. However, this process has worsened external balances and rendered disinflation more difficult. The BNR responded by tightening its reserve requirements, temporarily hiking its reference rate, strengthening banking supervisory procedures and regulations, as well as imposing credit restrictions per borrower in February 2004. But the latter measure only proved effective in temporarily preventing loan growth from accelerating. A further liberalization of the capital account in April 2005 opened the way for larger capital inflows, thus heightening the upward pressure on the Romanian leu.
In August 2005, the BNR shifted to inflation targeting, which it expects to be a more effective monetary policy strategy in an environment of macro-economic growth tensions and of ubiquitous and volatile capital flows. The introduction of inflation targeting went hand in hand with a loosening of the exchange rate regime. This loosening of the managed float was followed by increased nominal (and real) appreciation of the Romanian leu, which rendered foreign currency loans even more attractive, triggering a tightening of prudential regulations on foreign currency lending in September 2005.6
With inflation coming to 8.6% at end-2005, the monetary authorities slightly overshot their target for that year (7.5% ±1%).
Therefore, after interest rates had declined again, the reference rate was readjusted upward in the first half of 2006. Moreover, several factors contributed to driving inflation down further to 4.9% in 2006 (table 9), which was in line with that year’s target of 5% ±1%: a faster liquidity drain through open market operations, a further nominal appreciation of the Romanian leu (triggered by capital inflows), as well as a pause in the increases of administered prices and the temporary dip in the oil price in the fall of the year. Afterwards, interest rates were allowed to recede again. In June 2007, inflation bottomed out at 3.8%, before it rose again to 5.0% in August. Reasons for the uptick in the summer of 2007 were the reacceleration of credit expansion after removal
6 Effective as of the beginning of September 2005, a 30% reserve ratio on all forex-denominated liabilities with maturities longer than two years was implemented (Barisitz et al., 2005, p. 48). In the course of 2006, that requirement was further increased in two steps to 40%.

Exchange Rate Arrangements and Monetary Policy in Southeastern Europe: An Update (2004–2007)
Focus 2/07 ◊ ceec.oenb.at 91
of some controls at the beginning of the year, a reversal of the appreciation tendency of the leu under the impact of the international financial turbulences and of concerns about Romania’s external vulnerabilities, as well as drought-induced sharp food price increases. The 2007 target is set at 4% ±1%. While the (still) relatively low level of inflation is certainly a major achievement, the possible further acceleration of price increases and continuing depreciation against the backdrop of fiscal relaxation might soon trigger a reversal of the BNR’s monetary policy stance.
An EU member since the beginning of 2007, Romania plans to join ERM II around 2012 and to be ready to enter the euro area two years later. The authorities take the view that the country needs some years to entrench macrostability to lower inflation and to carry on with structural reforms to fulfill the Maastricht criteria in a sustainable manner.
3.9 Serbia (without Kosovo)Macrostructural BackgroundFollowing particularly strong GDP growth in 2004, Serbia’s economic expansion has since remained robust at annual growth rates of around 6%. This brisk growth, (first) successes of macrostabilization, and fiscal reforms have improved the country’s budgetary performance, leading to budget surpluses from 2004 through 2006. However, some fiscal loosening emerged in 2007. Previously weak foreign direct investment gathered momentum in 2003 and strongly expanded in 2006 (see table 10), driven by a few large successful privatizations. Following a period of decisive banking sector restructuring in 2002, foreign strategic investors moved in and acquired the majority of sector assets, and credit activity gathered momentum and turned into a boom. While current account disequilibria have remained high (about 11% of GDP in 2006), about three-quarters of the shortfalls have been covered by FDI on average in recent years, even if these inflows have been quite volatile. FDI and privatization proceeds have allowed the central bank to steadily increase its reserves to a comfortable level (over one-third of GDP) and have permitted the authorities to prepay some of their foreign debt.
Table 10
Serbia: Key Macroeconomic and Monetary Policy Indicators
2004 2005 2006 2007 1
GDP growth (real, %) 8.4 6.2 5.7 6.2General government budget balance (% of GDP) 0.9 1.9 1.6 0.5Current account balance (% of GDP) –11.7 –8.5 –11.4 –13.5Net FDI inflows (% of GDP) 3.9 5.9 13.7 . .Gross foreign debt (year-end, % of GDP) 52.5 61.9 58.5 . .Gross reserves of central bank (excl. gold, year-end, % of GDP) 15.2 22.6 34.7 . .Two-week repo rate (year-end, %) 17.4 19.2 14.0 . .Broad money growth (year-end, %) 17.1 31.4 47.3 30.2RPI inflation (year-end, %) 13.7 17.5 6.6 6.8Exchange rate: RSD/EUR (annual average) 72.57 82.91 84.06 82.00Exchange rate: RSD/USD (annual average) 58.38 66.71 66.82 . .1 Forecasts or projections.
Source: National statistics, Narodna banka Srbije, IMF, wiiw, EBRD, European Commission.

Exchange Rate Arrangements and Monetary Policy in Southeastern Europe: An Update (2004–2007)
92 ceec.oenb.at ◊ Focus 2/07
Monetary PolicyIn order to better protect the Serbian economy’s fragile external accounts and overcome the strong real appreciation tendency that had emerged after the launching of the dinar’s tightly managed float in 2000 (anchor currency: DEM/EUR), Narodna banka Srbije (NBS, National Bank of Serbia) chose to loosen somewhat the dinar’s float at the beginning of 2003. During the three years until the end of 2005, the Serbian currency nominally depreciated by a cumulative 40% against the euro (and by some percentage points against the U.S. dollar), but the dinar’s real effective exchange rate remained broadly unchanged. The NBS thus pursued a “real exchange rate anchor” policy (not unlike the Romanian strategy until 2005). However, after it had fallen to around 8% at end-2003, inflation strongly increased again to 17.5% in 2005 (see table 10). The deterioration of the situation had been triggered by repeated adjustments of administered prices, rising costs of oil and other fuel imports, and the one-off effect of VAT introduction in 2005. Moreover, despite some progress in privatization, Serbia’s backlog in still-to-be-tackled restructuring efforts (compared with other countries of the region) implied that strong domestic demand met with still relatively unresponsive supply and weak competition. Furthermore, continuing dinar depreciation and the widespread exchange rate indexation of prices (entrenching high pass-through rates) played a major role.
The NBS reacted to the inflation spike of end-2005 by readjusting its strategy. It further loosened the exchange rate regime by withdrawing from foreign exchange interventions in early 2006. This discontinued the managed nominal depreciation tendency. As a result of persisting large capital inflows, the Serbian currency appreciated by 8% in nominal terms vis-à-vis the euro and by 15% vis-à-vis the U.S. dollar during 2006. In September 2006, Narodna banka Srbije adopted a new monetary policy framework that focused on achieving price stability through numeric inflation objectives, which can be viewed as a kind of informal inflation targeting. These objectives are initially defined in terms of core inflation (excluding i.a. administered prices and food prices, end-2006 target corridor: 8% ±1%) and are to be achieved primarily by adjusting the NBS’s key policy rate, the interest rate on its two-week repo operations. With efforts underway to strengthen its research capacity, the central bank envisages adopting a formal inflation targeting regime by 2008.
Disinflation success was impressive in 2006. By December, retail prices had declined to 6.6% (see table 10) and core inflation came in at 5.9%. This overfulfillment of the year’s inflation objective was attributable to a combination of several factors: a sharp nominal appreciation of the dinar, the NBS’s substantial interest rate hike, its tightening of reserve requirements and the government’s (temporary) freezing of controlled prices. As a result of the marked deceleration of inflation and in order to check further dinar appreciation, which threatened to put Serbian export industries under renewed pressure, the NBS cut its policy rate in a number of steps in late 2006 and the first half of 2007 to 9.5%. After continuing to decline in the first months of 2007, inflation rose again somewhat in the second and third quarters and came to 6.3% in August; core inflation, however, remained stable at 3.0% that month. Given renewed inflationary pressures (adjustment of regulated prices,

Exchange Rate Arrangements and Monetary Policy in Southeastern Europe: An Update (2004–2007)
Focus 2/07 ◊ ceec.oenb.at 93
fiscal weakening, strong wage growth, drought-triggered food price spikes), the NBS put an end to its loosening cycle in August 2007 and raised its key rate by 25 basis points. That same month, the government resorted to direct market intervention: It decreed a 90-day grain export ban and one-year price controls on bread and cooking oil. Notwithstanding these surprising and distorting measures, the core target band for end-2007 (6% ±2%) looks well within reach or may be undershot again.
3.10 TurkeyMacrostructural BackgroundThe core of Turkey’s 2001 stabilization program was the floating of the Turkish lira and the reintroduction of money growth targeting (pertaining to restrictive base money goals), accompanied by ambitious fiscal, structural and institutional reforms. The ensuing economic recovery has been quite impressive: Growth exceeded 7% per annum on average in the period from 2002 to 2006. The implementation of the fiscal reform component has contributed to spectacular results. After its crisis-driven peak in 2001, the fiscal imbalance steadily receded to 9% of GDP in 2003 and to around 1% of GDP in 2005 and 2006 (table 11). This performance was of course assisted by the unexpectedly strong and sustained economic expansion. At the same time, robust growth has partly been responsible for the sharp widening of the current account shortfall in recent years (8% of GDP in 2006). Having increased strongly in 2005 and 2006, FDI may have been a key factor in driving the widening of the current account gap most recently.
The expansion of foreign direct investment embodies a long awaited and important ingredient of structural adjustment and productivity growth. The change in strategic investors’ stance was apparently triggered by the launch of EU accession negotiations in 2005. FDI has also made inroads in the Turkish banking sector, lifting the share of foreign ownership in total sector assets from less than 5% at end-2004 to over 25% in mid-2007. Credit expansion has
Table 11
Turkey: Key Macroeconomic and Monetary Policy Indicators
2004 2005 2006 2007 1
GDP growth (real, %) 8.9 7.6 6.1 5.3
Consolidated fiscal balance (% of GDP)2 –4.6 –1.3 –0.8 –1.4
Current account balance (% of GDP) –5.2 –6.3 –8.2 –7.8Net FDI inflows (% of GDP) 0.7 2.4 4.8 5.0Gross foreign debt (year-end, % of GDP) 50.1 46.7 50.6 52.8Gross reserves of central bank (excl. gold, year-end, % of GDP) 11.0 14.8 15.0 . .Discount rate (year-end, %) 22.0 17.5 22.5 ..Broad money growth (year-end, %) 22.1 24.5 24.1 14.9Credit growth to the private sector (year-end, %) 42.0 41.3 35.6 . .CPI inflation (year-end, %) 9.4 7.7 9.7 6.5Exchange rate: YTL/EUR (annual average)3 1.78 1.68 1.81 1.80Exchange rate: YTL/USD (annual average)3 1.43 1.35 1.44 1.351 Forecasts or projections.2 Public sector.3 The lira was redenominated in January 2005. All exchange rates are based on the post-January 2005 lira.
Source: National statistics, Türkiye Cumhuriyet Merkez Bankası, IMF, wiiw, European Commission.

Exchange Rate Arrangements and Monetary Policy in Southeastern Europe: An Update (2004–2007)
94 ceec.oenb.at ◊ Focus 2/07
gained momentum in recent years; banks and enterprises have been attracted by low foreign currency interest rates and have taken recourse to foreign loans, which can be regarded as the second major driving force behind the recent swelling of the external disequilibrium.
Monetary Policy
The commendable adjustment of inflation and the reestablishment of trust in the Turkish lira were among the salient factors that contributed to the swift stabilization and the restoration of confidence after the crisis of 2001. CPI inflation descended steadily over the years to below 8% at end-2005 (table 11), a level unseen since the early 1970s. After rising sharply in late 2001, interest rates came down again. Given the encouraging inflation environment, Türkiye Cumhuriyet Merkez Bankası (TCMB, Central Bank of the Republic of Turkey) repeatedly cut its intervention rate (overnight deposit rate) in a number of steps down to 13.5% in April 2006. The decline in interest rates and payments helped reduce budgetary pressures and fiscal deficits, which in turn reduced pressure on interest rates (virtuous circle). But inflation might not have come down as much as it did had the Turkish lira not appreciated substantially in nominal-effective terms. This was caused by rising capital inflows and happened despite the monetary authorities’ recurrent interventions to stem appreciation pressures and build up foreign currency reserves.
In this situation, the TCMB adopted formal inflation targeting at the beginning of 2006. The end-2006 inflation target was set at 5% ±2%, the 2007 target at 4% ±2% (uncertainty bands). The nominal appreciation of the Turkish lira (on top of a still sizeable inflation differential) started to raise concerns about the country’s competitiveness against the above-mentioned backdrop of fragile external accounts. In the spring of 2006, the global financial markets witnessed a widespread decline in risk appetite for emerging market exposures, with tangible but transient consequences for Turkey. Capital flows temporarily reversed. In May and June 2006, the Turkish lira’s exchange rate against the euro fell by about 25%, but in the following months recovered again partially. The exchange rate shock pushed inflation up to 11.7% in July, before it declined again to 9.7% in December 2006 (table 11).
The monetary crisis was quickly overcome by the energetic response of the TCMB, which intervened on the foreign exchange market to defend the Turkish currency, withdrew liquidity through open market transactions, reversed its policy of interest rate cuts and ratcheted its key rate back up by 4 percentage points in the summer of 2006. (Thus the interest rate level reverted back to where it had been in early 2005 and stayed there until early September 2007.) Inflation was brought back under control, even if the 2006 target was missed by a considerable margin. The monetary tightening may have contributed to the weakening of economic growth in 2006, though. By July 2007, inflation had receded to 6.9% (year on year), a new record low. Like practically all other countries of Southeastern Europe, Turkey experienced an uptick of inflation in the late summer of 2007, triggered by drought-induced food price rises. In August, the overall price level increase came to 7.4%. The U.S. subprime crisis also had repercussions in Turkey, but these largely pertained to heightened volatility – not weakness – of the exchange rate,

Exchange Rate Arrangements and Monetary Policy in Southeastern Europe: An Update (2004–2007)
Focus 2/07 ◊ ceec.oenb.at 95
revealing nervousness on the part of financial markets. Notwithstanding the inflationary uptick, which was apparently judged to be a one-off event, the TCMB decided to cut its key rate by 25 basis points in early September, in order to support economic activity.
4 Comparative Overview and ConclusionsHaving typically faced many similar economic challenges and having produced comparable economic performances, the Southeastern European countries all appear to be on more or less robust catching-up routes. Yet they continue to employ a wide array of monetary and exchange rate regimes and instruments. This may suggest that various paths can lead to success or progress. The majority of countries in the region (including the smallest ones, though) have opted for the euro as an external anchor: Croatia (with its tightly managed float), the Republic of Macedonia (de facto peg), Bosnia and Herzegovina as well as Bulgaria (currency boards) and Kosovo and Montenegro (euro as legal tender). The four other countries (among them the largest in the region) have introduced or retained loosely managed floats, while conceding primary weight to the euro as reference currency, and they have moved toward inflation targeting: Romania made the transition in August 2005, Turkey in January 2006, Serbia in two steps in the course of 2006, while Albania is planning to move to formal inflation targeting soon.
Taking a closer comparative look at the evolution of macrostructural environments of monetary policies and regimes, and at policymakers’ reactions and their endeavors to shape developments and achieve monetary stability, we may note that economic expansion has remained strong and even accelerated in the period from 2004 to 2007, resulting in average GDP growth of 6% per annum in most countries under review. GDP growth has been less dynamic, but accelerated as well, to 4% per annum in the Republic of Macedonia and to 2% per annum in Kosovo.
Given generally buoyant and accelerating private domestic demand, practically the entire region (with the notable exception of the Republic of Macedonia) remains saddled with high or very high current account shortfalls, which have even been on the rise most recently. Kosovo has been particularly dependent on foreign grants and financial assistance to help cover exorbitantly high external gaps. But this support is dwindling, which is one reason why international attention still focuses on whether the Kosovar economy will be viable in the long run. Foreign financial assistance to Bosnia and Herzegovina as well as to Albania has already declined to low levels. Bosnia and Herzegovina’s growth has meanwhile benefited from high staple prices, masking continued serious structural weaknesses. In contrast to external disequilibria, fiscal deficits have narrowed substantially or vanished altogether across the region in recent years. This development is ascribable to the strengthening of economic growth, to tax and budget reforms and to fiscal tightening measures. Fiscal policies have generally become cautious (even producing surpluses in 2005 and/or 2006 in Bosnia and Herzegovina, Bulgaria, Kosovo, Macedonia, Montenegro and Serbia), which has considerably reduced the burden on monetary policy. More recently, however, some weakening and slippage occurred in a number of countries.

Exchange Rate Arrangements and Monetary Policy in Southeastern Europe: An Update (2004–2007)
96 ceec.oenb.at ◊ Focus 2/07
FDI used to be weak across the region, but has expanded dynamically in recent years (in some cases multiplying from a basis of almost zero), and has obviously been pushing external imbalances to some degree. In 2005 and 2006, net FDI inflows covered current account deficits almost or fully in Bulgaria, the Republic of Macedonia (although both indicators remain modest in this country), Montenegro and Romania. Important progress has also been achieved in Croatia, Serbia and Turkey, whereas FDI is still remarkably feeble in Albania, Bosnia and Herzegovina, and Kosovo. In 2007, Romania seems to have witnessed a weakening of FDI inflows, which consequently covered a lower amount of the external deficit. Gross foreign indebtedness is not generally high in Southeastern Europe and seems to be stagnating or slowly declining (as a percentage of GDP) in most countries. This is being driven by prudent fiscal policies and contracting public liabilities, while corporate and bank debt have been rising. The two striking exceptions to the overall trend are Croatia and Bulgaria, where the increase in private foreign debt has been more than offsetting the decline of public debt and where national liabilities have attained very high levels, although this does not appear to have perturbed markets so far. In the two countries – as in the entire region – foreign exchange reserves have been on the rise.
During the observation period (from 2004 to 2007), average annual (year-end) CPI inflation rates were low (below 3%) in Albania, Croatia, Kosovo, the Republic of Macedonia and Montenegro; they were at a medium level (between 3% and 6%) in Bosnia and Herzegovina; and they were relatively high (above 6%) in Bulgaria, Romania, Serbia and Turkey. In this context, it appears striking that the three countries that have recently reverted to explicit inflation targeting with loosely managed floats (the latter three) have witnessed relatively high price increases – yet the two countries with long-standing currency boards anchored to the euro (Bosnia and Herzegovina, Bulgaria) cannot boast of low inflation, either. In any case, the two very small countries that are unilaterally euroized (Kosovo and Montenegro) feature among the best performers on the inflation front.
In 2005–2006, and then again in the summer of 2007, inflationary upticks could be observed in many countries. There are various reasons for these upticks: the ubiquitous credit booms, oil price rises, wage hikes, utility tariff increases, excise tax adjustments, bad weather conditions impacting on food prices, sharp depreciation triggered by financial turbulences (Turkey). In early 2007, inflation tended to ease somewhat. This easing pertained to several factors: monetary policy reactions including key interest rate hikes (following trend declines in previous years), the raising of minimum reserve requirements, tightening of prudential regulations and the supervision of credit institutions, controlled currency appreciation in some countries, and a temporary freezing of administered prices in others. However, inflation reaccelerated again in the summer of 2007, driven by near-pervasive drought-induced food price spikes coupled with world market agricultural and energy price rises, and, in some countries, a further acceleration of credit expansion.
Despite the apparent entrenchment of inflation in recent years (including the seasonal or one-off uptick in the summer of 2007) after a long period of decline since the late 1990s, there can be little doubt that persistent monetary

Exchange Rate Arrangements and Monetary Policy in Southeastern Europe: An Update (2004–2007)
Focus 2/07 ◊ ceec.oenb.at 97
policy stringency has served the Southeastern European countries well in improving their inflation track records. Such was the stabilizing influence of the exchange rate as an external nominal anchor that all countries with hard pegs – except Bulgaria – have registered low single-digits lately. Bulgaria was hit by a confluence of factors fueling inflation in recent years, the most important of which may have been the unrelenting credit boom, which the authorities so far do not seem to have gotten under full control.
Countries with loosely managed floats – except for Albania – are for various reasons still struggling with somewhat higher inflation levels, which, however, continue to be on a long-term downward trend. In Serbia, the transformation of the nominal exchange rate anchor into a “real exchange rate anchor” in 2003 contributed to interrupting the tendency of declining price increases in 2004 and 2005. The loosening of the exchange rate regime in early 2006 in the context of the transition to inflation targeting triggered a swift appreciation in an environment of rising FDI, portfolio capital and credit inflows. Disinflation resumed. In Romania, a comparable environ-ment and a similar transitional strategy had corresponding effects in 2005 through the first half of 2007. The latter two inflation performances may represent a particular degree of dependence on – partly volatile – capital flows. Repercussions of such dependence have also recently affected by Turkey, which introduced inflation targeting in early 2006. However, Turkey can point to a (so far) very successful path of breaking decades of inertia and bringing down stubbornly high price increases. Finally, Albania, a country which has conducted a loosely managed float for around 15 years now, has boasted an extended performance of commendably low inflation.
Notwithstanding prioritizations inherent in monetary policy choices, most of the inflation targeters have had to live up to recurrent conflicts of aims: cutting inflation (monetary stability objective) versus limiting currency appreciation or depreciation (external equilibrium objective). Policy rates have therefore repeatedly zigzagged, reflecting switching priorities, and finding themselves increasingly at the mercy of capital flows. Perhaps the most illustrative examples of such developments is what has been going on in Serbia’s and Turkey’s monetary policies in the period between 2005 and today.
Summing up, the confidence and stability-enhancing effect of hard pegs appears to have borne out success in most of the countries analyzed; but this does not preclude other monetary strategies – notably inflation targeting and a loose float – from being effective as well. Overall monetary and economic policy soundness, credibility and perseverance remain the key to success here. In particular, prudent fiscal policies and general policy discipline, possibly favored by peer pressure within the Southeastern European region, IMF surveillance and EU membership aspirations (now already fulfilled in the cases of Bulgaria and Romania), have assisted the central banks in pursuing their goals.
Editorial close: October 15, 2007.

Exchange Rate Arrangements and Monetary Policy in Southeastern Europe: An Update (2004–2007)
98 ceec.oenb.at ◊ Focus 2/07
ReferencesBacké, P. and Z. Walko. 2006. Bank Intermediation in Southeastern Europe: Depth and
Structure. In: OeNB Focus on European Economic Integration 2. 48–68.Bank of Albania. Monetary Policy Document for 2007. January 8. (http://www.
bankofalbania.org/include_php/previewdoc.php?content_id=3154&lng=Lng2&thisMode=) (retrieved in July 2007).
Bank Austria Creditanstalt. 2007. CEE Quarterly 3.Barisitz, S. 2004. Exchange Rate Arrangements and Monetary Policy in Southeastern
Europe and Turkey: Some Stylized Facts. In: OeNB Focus on European Economic Integration 2. 95–118.
Barisitz, S. et al. 2005. Developments in Selected Countries. In: OeNB Focus on European Economic Integration 2. 10–56.
Business Monitor International. 2007. Emerging Europe Monitor – South East Europe 14/9 (September) and 14/10 (October).
Central Banking Authority of Kosovo. 2007. CBAK Annual Report 2006. Pristina. May.
Central Banking Authority of Kosovo. 2007. Monthly Statistics Bulletin 69/VII. Pristina. May.
EBRD. 2004. Transition Report 2004 – Infrastructure. London.EBRD. 2005. Transition Report 2005 – Business in transition. London.EBRD. 2006. Transition report 2006 – Finance in transition. London.European Commission. 2007. Candidate and Potential Candidate Countries.
(http://ec.europa.eu/enlargement/countries/index_en.htm) (retrieved in March 2007).European Commission, DG ECFIN. 2006. CCEQ Candidate and Pre-Accession
Countries’ Economics Quarterly. April 6.European Commission, DG ECFIN. 2007. CCEQ – Candidate and Pre-Accession
Countries’ Economies Quarterly. January 15.European Commission, DG ECFIN. 2007. CCEQ Candidate and Pre-Accession
Countries’ Economics Quarterly. July 6.European Commission, DG ECFIN. 2007. CCEQ Candidate and Pre-Accession
Countries’ Economics Quarterly. October 5.European Commission, DG ECFIN. 2006. Progress toward meeting the economic
criteria for accession: the assessments of the 2006 Progress Reports. In: European Economy – Enlargement Papers 29. December.
Gligorov, V. L. Podkaminer et al. 2006. Broader-based Growth Resilient to Global Uncertainties. wiiw Research Reports 328. July.
IMF. 2007. Albania: Third Review Under the Three-Year Arrangement Under the Poverty Reduction and Growth Facility. June 21.
IMF. 2004, 2005, 2006. Annual Report on Exchange Arrangements and Exchange Restrictions. Washington D.C.
IMF. 2006. Bosnia and Herzegovina: Staff Report for the 2006 Article IV Consultation. September 27.
IMF. 2007. Bulgaria: Fourth Review Under the Stand-By Arrangement. March 1.IMF. 2006. Former Yugoslav Republic of Macedonia: Staff Report for the 2006 Article IV
Consultation. July 13.IMF. 2007. Republic of Croatia: Staff Report for the 2006 Article IV Consultation. January 19.IMF. 2006. Republic of Serbia: Staff Report for the 2006 Article IV Consultation and Post-
Program Monitoring Discussions. August 10.

Exchange Rate Arrangements and Monetary Policy in Southeastern Europe: An Update (2004–2007)
Focus 2/07 ◊ ceec.oenb.at 99
IMF. 2007. Romania: Staff Report for the 2007 Article IV Consultation. May 2.IMF. 2006. Serbia and Montenegro: 2006 Article IV Consultation and Post-Program
Monitoring, Montenegro: Concluding Statement of the Mission. June 22.IMF. 2006. Turkey – Fifth Review and Inflation Consultation Under the Stand-By
Arrangement. November 27.Moalla-Fetini, R. et al. 2005. Kosovo – Gearing Policies toward Growth and Develop-
ment. IMF. Washington D.C.National Bank of Greece S.A. 2006. South Eastern Europe & Mediterranean Emerging
Market Economies Bulletin 7(1), January/May – Economic-Banking-Financial Market Developments and Prospects.
National Bank of Greece S.A. 2007. South Eastern Europe & Mediterranean Emerging Market Economies Bulletin 8(1), January/May – Economic-Banking-Financial Market Developments and Prospects.
Neue Zürcher Zeitung. 2007. Das Ende der türkischen Hochzinspolitik – Tiefe Teuerung und nachlassende Konjunkturdynamik als Grund. September 16.
Ritzberger-Grünwald, D. and H. Stix. 2007. Are Euro Cash Holdings in Central and Eastern Europe Driven by Experience or Anticipation? Results from an OeNB Survey. In: OeNB Focus on European Economic Integration 1. 77–100.
Slacik, T. and Z. Walko. 2006. Developments in Selected Countries. In: OeNB Focus on European Economic Integration 2. 8–46.
Sokic, Alexandre. 2006. L’euroisation au Monténégro – Une expérience inédite. Le courrier des pays de l’Est 1057. September-October. 58–68.

100 ceec.oenb.at ◊ Focus 2/07
Development and Regional Disparities –Testing the Williamson Curve Hypothesis
in the European Union
1 IntroductionAccording to the European Commission, in every fourth region of the enlarged EU, GDP per capita is below 75% of the EU average, which makes these regions eligible for the Convergence objective of the EU Structural Funds (European Commission, 2006). These “Convergence regions” are characterized by low levels of GDP and employment; their share in the EU’s total GDP is only 12.5%, compared with a 35% share in the EU’s total population. The same can be observed within certain EU countries. In some regions, economic welfare is lower than on average in the country. This applies especially to the “new” EU Member States. In Hungary, the GDP-per-capita level in the central region is slightly above the EU average, while in the poorest regions, it is only slightly more than 40% of the EU average. Similar effects can be observed in the Czech Republic, while in Slovakia, the Bratislava region is three times as rich as the poorest one. Bulgaria (currently the poorest EU member) faces lower regional differences, though, and we also have the impression that the Western European countries are more equal in this sense.
While there is a vast number of research papers on the convergence of individual EU countries, the regional dimension often seems to have been neglected. The aspect of convergence most frequently emphasized is that poorer EU countries must somehow catch up with the more developed ones. As data availability has improved, researchers have recently also started to focus on the convergence of regions, i.e. whether poorer regions as a group will be able to converge to the richer ones. However, little attention has been paid to within-country disparities and their development. Taking a look at these data, many questions arise. Are these regional disparities a characteristic of countries that have been poor anyway, or is it a common phenomenon in the EU? Is this difference related purely to the countries’ income differences, or is
1 Kopint-Tárki Economic Research Institute, Budapest, Hungary. E-mail: [email protected]. The author would like to thank István Kónya and Gábor Oblath for their reflections and advice. This paper received the Olga Radzyner Award of the Oesterreichische Nationalbank in 2007. The views expressed are those of the author and do not necessarily reflect the official view of Kopint-Tárki and the Oesterreichische Nationalbank.
In this paper I examine the relationship between within-country regional disparities and the development of nations in the enlarged European Union. Using panel data methods, I f ind evidence on the Williamson curve hypothesis, which says that disparities are lower in the early stages of development, peak in middle-income stages, but diminish again as a country becomes rich. More importantly, however, I point out that several factors have a greater influence on disparities than national income. Among these country-specific factors, the date of EU accession plays an outstanding role, being responsible for more than one-half of the differences in regional disparities between the Member States. Four other factors connected to EU membership are also possible reasons for the disparities: the economic transition process in the new Member States, Economic and Monetary Union, the funds made available by the EU Structural and Cohesion Funds as well as effective institutions.
Béla Szörfi1Béla Szörfi1

Development and Regional Disparities –Testing the Williamson Curve Hypothesis in the European Union
Focus 2/07 ◊ ceec.oenb.at 101
there also a difference between “old” and “new” EU Member States? If the poorer countries are intent on speeding up the convergence process, will this not influence their regional disparities?
The aim and thus the contribution of my paper is to examine the hitherto neglected relationship between within-country regional disparities and development. I study whether the differences in a country’s development level can explain the differences in regional disparities, or whether something else causes these inequalities. As regional GDP data are more reliable and more easily available now, it is possible to carry out the research for the whole EU, including not only those countries that joined the EU in 2004, but also Romania and Bulgaria. Previous research was not able to examine such a vide variation in the data, and thus had a limited use only. Besides, I do not only make a simple cross-country analysis, contributing to the studies that examine disparities, but I use panel data for the period between 1995 and 2004. This way I extend the research in two directions. On the one hand, I observe how disparities in a certain country evolve in line with its development, which means I am not limited to generalizing the results of a pure cross-country analysis. On the other hand, I examine also the relationship between the speed of development and of disparities, which is not possible if one looks at only one point in time.
The remaining part of the paper is structured as follows. Section 2 provides a review of the relevant theoretical and empirical literature. Section 3 compares two simulations of the evolution of regional disparities within a country group. Section 4 provides descriptive statistics of regional differences and their change for the examined EU countries. Section 5 estimates different panel data models in order to detect the relationship between a country’s development and within-country regional inequalities as well as the relationship between the speed of a country’s growth and the (speed of changes in) inequalities. Section 6 discusses the results, suggesting possible driving forces behind the findings of the previous sections, and section 7 concludes.
2 Literature ReviewBased on Solow (1956), neoclassical economists thought that regional disparities diminish with growth simply because of diminishing returns to capital. In a competitive environment, regional labor and capital mobility leads to factor price convergence and thus also to the convergence of regions within a country. However, Myrdal (1957) and other post-Keynesians maintain that growth is a spatially cumulative process, which is likely to increase regional inequalities.
Williamson (1965) took up Kuznets’ hypothesis, which describes the relationship between income inequalities among households and the development level of the country examined.2 Similar to Kuznets, Williamson claims that national development creates increasing regional disparities in the
2 In particular, the Kuznets curve says that income inequality tends to increase with income at low income levels and to decrease at higher levels of income. One possible reason is that in the early stages of development, when investment in physical capital is the main engine of economic growth, inequality stimulates growth by directing resources toward those who save and invest the most. By contrast, in more developed economies, human capital accumulation takes the place of physical capital accumulation as the main growth driver, and inequality impedes growth because poor people cannot finance their education in imperfect credit markets.

Development and Regional Disparities –Testing the Williamson Curve Hypothesis in the European Union
102 ceec.oenb.at ◊ Focus 2/07
early stages of development, while later on, development leads to regional con-vergence. This results in an inverted U-shaped curve as depicted in chart 1.
The main argument behind William-son’s finding is that in a catching-up country there are a few growth pole regions in which capital and skilled workers are concentrated. As a con-sequence of a faster rise in productivity, growth accelerates in these regions, which leads to increasing regional dis-parities. At later stages, as higher factor
costs or diseconomies of agglomeration emerge in the growth pole regions, capital is likely to move to other regions with lower capital per worker. This, together with knowledge spillover effects, may enhance the reallocation of productive factors across sectors and regions, which leads to spatial con-vergence.
As mentioned before, only little empirical research has been devoted to this issue and applied to the EU. Among the few papers are Davies and Hallet (2002), who examine two groups of countries in the period from 1980 to 1999: the four cohesion countries Greece, Portugal, Spain and Ireland3 as less developed countries, and Germany, the UK and Italy as more developed countries. They find some evidence of the ascending side of the Williamson curve, as the catching-up process is driven by a few growth poles while the other regions lag behind, which leads to increasing inequality. However, they obtain only a weak relationship between development and regional disparities on the descending side of the Williamson curve. Davies and Hallet find that institutional aspects, e.g. the degree of emphasis placed on proactive regional policy, are determinants of the reduction of disparities in the later stages of development.
Petrakos, Rodríguez-Pose and Rovolis (2003) include eight EU countries in their study (France, UK, Italy, Portugal, Spain, Belgium, Greece, Netherlands) and examine the period between 1981 and 1997 using spatial econometric analysis. Their results show that, ceteris paribus, faster GDP growth results in a higher increase in regional inequalities. Besides, higher GDP levels go together with lower levels of disparities. They also find that regional disparities at national and EU level are procyclical in the short run, increasing in periods of expansion and decreasing in periods of slow growth. Meanwhile, long-term development processes tend to favor a more equal allocation of activities and resources.
A different approach is used by Dall’erba and Le Gallo (2003), who extend their study to 12 countries (the EU-15 minus Austria, France, and the UK), covering the period between 1989 and 1999 and using spatial econometrics. They focus on within-EU disparities, dividing the EU into core and periphery
3 Ireland was also considered a cohesion country before its economic boom, as it was entitled to receive grants from the EU’s cohesion funds.
Chart 1
The Williamson Curve
Source: WSource: WSource: illiamson (1965). Williamson (1965). W
Disparities
Income
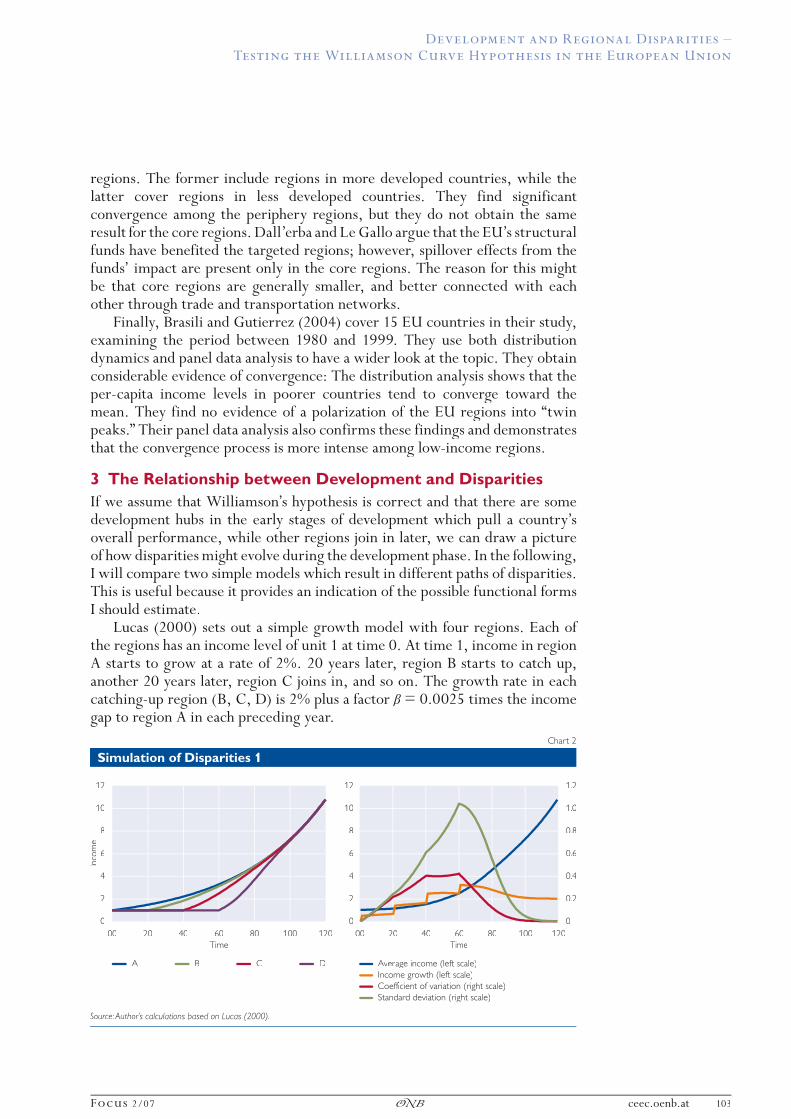
Development and Regional Disparities –Testing the Williamson Curve Hypothesis in the European Union
Focus 2/07 ◊ ceec.oenb.at 103
regions. The former include regions in more developed countries, while the latter cover regions in less developed countries. They find significant convergence among the periphery regions, but they do not obtain the same result for the core regions. Dall’erba and Le Gallo argue that the EU’s structural funds have benefited the targeted regions; however, spillover effects from the funds’ impact are present only in the core regions. The reason for this might be that core regions are generally smaller, and better connected with each other through trade and transportation networks.
Finally, Brasili and Gutierrez (2004) cover 15 EU countries in their study, examining the period between 1980 and 1999. They use both distribution dynamics and panel data analysis to have a wider look at the topic. They obtain considerable evidence of convergence: The distribution analysis shows that the per-capita income levels in poorer countries tend to converge toward the mean. They find no evidence of a polarization of the EU regions into “twin peaks.” Their panel data analysis also confirms these findings and demonstrates that the convergence process is more intense among low-income regions.
3 The Relationship between Development and DisparitiesIf we assume that Williamson’s hypothesis is correct and that there are some development hubs in the early stages of development which pull a country’s overall performance, while other regions join in later, we can draw a picture of how disparities might evolve during the development phase. In the following, I will compare two simple models which result in different paths of disparities. This is useful because it provides an indication of the possible functional forms I should estimate.
Lucas (2000) sets out a simple growth model with four regions. Each of the regions has an income level of unit 1 at time 0. At time 1, income in region A starts to grow at a rate of 2%. 20 years later, region B starts to catch up, another 20 years later, region C joins in, and so on. The growth rate in each catching-up region (B, C, D) is 2% plus a factor β = 0.0025 times the income gap to region A in each preceding year.
Chart 2
Simulation of Disparities 1
12
10
8
6
4
2
0
Source: Author’s calculations based on Lucas (2000).Author’s calculations based on Lucas (2000).Author’
00
Inco
me
20 40 60 80 100 120
A B C D
Time
1.2
1.0
0.8
0.6
0.4
0.2
0
12
10
8
6
4
2
000 20 40 60 80 100 120
Average income (left scale)
Time
Income growth (left scale)Coefficient of varCoefficient of varCoeff iation (right scale)Standard deviation (right scale)

Development and Regional Disparities –Testing the Williamson Curve Hypothesis in the European Union
104 ceec.oenb.at ◊ Focus 2/07
As chart 2 demonstrates, at time 120, each catching-up region will have reached the income level of region A (actually, the gap is almost 0 already at time 100). If we take either the coefficient of variation or the standard deviation of per-capita GDP as a measure of regional inequality, the right panel of chart 2 shows that disparities start to increase fast as the privileged region begins to grow. Inequalities will diminish slightly only after the country’s average income level has reached about 2.5 (this happens at year 60), and after the growth rate in the whole country has reached its maximum, which is 3%. Thus, the relationship between the development level and regional disparities is very similar to that examined by Williamson. It is easy to imagine that an analogous process is typical also of the EU. More developed countries indeed grow at a slower pace and we have the intuition that they are characterized by lower disparities.
A different approach is to follow Quah (1993). He divides the countries of the world into five groups depending on their relative development level. Then he estimates a transition matrix; a cell represents the probability of a country moving from one particular group to another in a given year. He finds that 97% of the rich countries remain rich and 99% of the poor remain poor, while some countries move from the middle toward either end. It can be shown that this results in “twin peaks,” i.e. there will be more rich and poor countries and fewer middle-income countries. If we take 100 equally developed countries at time 0, in 100 years the distribution of income will look like in chart 3.
From this empirical result, we can deduce the evolution of disparities. In order to obtain a curve that is similar to chart 2, I took over the average income growth rates from Lucas’ simulation, so that average income and income growth (right panel, blue and orange lines) are the same as before. The reason is that Quah’s original paper is an empirical investigation of cross-country income levels, in which he did not include growth rates. If Quah’s hypothesis prevails, the standard deviation of incomes will grow continuously in the second simulation, while the path of the coefficient of variation will show a
Chart 3
Simulation of Disparities 2
35
30
25
20
15
10
5
0
Source: Author’s calculations based on Quah (1993).Author’s calculations based on Quah (1993).Author’
0–25%
0.6
0.5
0.4
0.3
0.2
0.1
0
12
10
8
6
4
2
00 20 40 60 80 100 120
Average income (left scale)
Time
Income growth (left scale)
Coefficient of varCoefficient of varCoeff iation (right scale)Standard deviation (left scale)
25–50% 50–100% 100–200% 200%–Relative income, world aveld aveld a rage =100%

Development and Regional Disparities –Testing the Williamson Curve Hypothesis in the European Union
Focus 2/07 ◊ ceec.oenb.at 105
logarithmic pattern, first increasing fast in line with development, but then stabilizing and remaining high even at a high development level. This level of inequality is also higher than the peak of disparities in Lucas’ simulation.
Summarizing the results of the two simulations, the Lucas model suggests that convergence of regions indeed occurs. Regional disparities, after increasing in the early stages of development, will diminish as other regions also start to develop; this second group of regions will develop faster than the ones developing early. However, the model based on Quah initially assumes the existence of “twin peaks” with one permanently poor and one permanently rich group of regions, and from this it follows that disparities remain permanently high. From Lucas’ model, the estimation of a quadratic regression follows, but from Quah’s model, a search for a logarithmic relationship might be more fruitful. I will estimate both functional forms in section 6; however, I will pay more attention to the quadratic form for two reasons. First, it is more flexible than the monotonic logarithmic functional form, and second, the log function assumes the existence of twin peaks – which is, however, not evident in my sample.
4 Data AnalysisIn this section I present the descriptive statistics regarding the regions examined. I use data on only 19 out of the 27 EU Member States.4 The reason is that EU regions classified as NUTS 2 regions5 are used as the inequality measure, and the other 8 EU countries themselves are classified NUTS 2. Thus, no regional differences can be observed at this level. Data on per-capita GDP at NUTS 2 level are currently available from Eurostat (the Statistical Office of the European Communities) for the period from 1995 to 2004. I also use data for some of the “new” Member States (including Bulgaria and Romania), which were, however, not EU members between 1995 and 2003: The Czech Republic, Hungary, Slovakia and Poland joined the EU in May 2004, Bulgaria and Romania did so in January 2007. Before that, Austria, Finland and Sweden became EU members in January 1995. I assume that EU membership has an effect both on a country’s development and on regional inequalities. For the “old” EU members, the EU’s regional policy tools (cohesion and structural funds) have been available even before the period under review, while the “new” Member States have just started to benefit from preaccession and cohesion funds.
4.1 Disparities within the EU
In 1995, GDP per capita (measured in purchasing power parities) in the observed 267 regions ranged from EUR 3,860 to EUR 37,600 with an average of EUR 14,400. By 2004, the average income level had gone up to EUR 20,800, while the range expanded, covering a minimum of EUR 5,070 and a maximum of EUR 65,100. Data for Romania are available only from 2000,
4 The countries are: Belgium, Bulgaria, Czech Republic, Germany, Greece, Spain, France, Ireland, Italy, Hungary, Netherlands, Austria, Poland, Portugal, Romania, Slovakia, Finland, Sweden, United Kingdom.
5 For details about the classification of EU regions, seehttp://ec.europa.eu/comm/eurostat/ramon/nuts/introduction_regions_en.html

Development and Regional Disparities –Testing the Williamson Curve Hypothesis in the European Union
106 ceec.oenb.at ◊ Focus 2/07
which means that the latter observation is valid for 276 regions with the somewhat downward-distorting effect of the Romanian regions. The standard deviation has also grown continuously during this period, which suggests the divergence of regions in terms of σ-convergence6. However, estimating the standard nonlinear equation for absolute β-convergence7 results in β = 1.3% per year. This means poorer regions managed to catch up to the richer ones. This seems somewhat contradictory; however, it is not necessary that β- and σ-convergence work in the same direction. According to Sala-i-Martin (1990), β-convergence is a necessary condition of σ-convergence, and usually the former will tend to generate the latter, but it is possible for initially poor countries or regions to grow faster than initially rich ones without the cross-sectional dispersion falling over time.8
It is also interesting to take a look at how the distribution of income has evolved over time (table 1, rows 6 to 8). Taking all the regions, the distribution is non-normal and has a long right tail, which means there are some regions with very high incomes, while most of the regions have middle incomes. Between 1995 and 2004, the distribution became more “peaky” (i.e. the kurtosis increased) and the right tail became longer (i.e. the skewness also increased). This suggests that average-income regions have managed to gain more wealth, while some middle-income regions have joined the high-income ones, which have also developed fast. The left tail of the distribution representing the low-income regions has not changed significantly.
The long left tail indicates that incomes might concentrate in the region in which the country’s capital is located. When I exclude these regions, the distribution becomes normal (highly supported by the Jarque-Bera test). Toward 2004, normality is slightly less observable as the skewness value (now
6 σ-convergence occurs when the standard deviation of income levels of a group of countries/regions decreases over time.
7 The absolute β-convergence hypothesis says that less developed countries/regions grow faster only because they are poorer.
8 For the exact correspondence between the two concept of convergence, see e.g. Sala-i-Martin (1990) or Barro and Sala-i-Martin (1995).
Table 1
Descriptive Statistics of Incomes following EU Accession
1995 2004
Wholesample
“Old” members
“New” members
Whole sample
“Old” members
“New” members
Mean 14,447 16,049 6,978 20,797 23,290 11,007Median 15,180 15,846 6,198 21,534 22,714 9,811Maximum 37,617 37,617 17,866 65,138 65,138 33,784Minimum 3,858 7,836 3,858 5,070 11,714 5,070St.Dev. 5,375 4,389 2,749 7,832 6,354 5,165
Skewness 0.51 1.41 1.88 0.79 2.04 2.28Kurtosis 4.82 7.64 7.39 6.79 12.80 9.88Jarque-Bera 48.52 266.34 63.96 193.41 1,018.56 156.15(probability) (0.000) (0.000) (0.000) (0.000) (0.000) (0.000)
Number of observations 267 217 46 276 217 55
Source: Eurostat, author’s calculations.

Development and Regional Disparities –Testing the Williamson Curve Hypothesis in the European Union
Focus 2/07 ◊ ceec.oenb.at 107
negative) decreases further while the kurtosis value falls below 3. The fact that the “capital regions” are the most developed and income is distributed normally in the other regions does not depend on EU membership. Splitting the sample into two groups (EU members and others) results in the same differences in distributions. Of course, there are large income differences between the two groups: An average “old” EU region is more than twice as rich as an average “new” EU region; however, the difference has decreased somewhat over the period under review. It is worth to take a look at the distribution graphs in chart 4 in which the capital regions are excluded. In 1995, some evidence seems to point to twin peaks – i.e. regions being divided into “old” and “new” EU regions – which have disappeared by 2004. This suggests that the assumption of the log function might not be fulfilled.
It can also be seen from the data that differences between the capital region and the other regions in the country are larger in the new EU Member States than in the others.
Between 1995 and 2004, GDP per capita (again measured in purchasing power parities) has increased continuously in almost all of the 19 countries examined. The fastest average annual growth was registered in Ireland (7.9%), while it came to more than 6% in the new EU Member States Romania, Hungary, Slovakia and Poland, to 4.6% in Bulgaria and to 4.8% in the Czech Republic. The less developed “old” members, Greece and Spain, also experienced an above-average expansion; Portugal’s performance was, however, rather sluggish. From among the more developed members, the UK’s high average growth (5.2%) might be surprising, while the other countries performed below average, with France, Germany and Italy being the slowest-developing countries.
4.2 Disparities within Countries
In the rest of the paper, I use the coefficient of variation as a measure of inequality, which is here the weighted standard deviation of GDP per capita levels within a country, divided by the country’s GDP per capita level:
2
1
1 ( )n
it rt it itr
ineq inc inc incN =
= −
∑ , (1)
Chart 4
Density Functions of Income Distribution
0.00010
0.00008
0.00006
0.00004
0.00002
0.00000
Source: Author’s calculations based on Eurostat.Author’s calculations based on Eurostat.Author’
5,0001995
10,000 15,000 20,000 25,000 30,000
0.00007
0.00006
0.00005
0.00004
0.00003
0.00002
0.00001
0.00000
200410,000 20,000 30,000 40,000

Development and Regional Disparities –Testing the Williamson Curve Hypothesis in the European Union
108 ceec.oenb.at ◊ Focus 2/07
where incrt denotes GDP per capita in region rt denotes GDP per capita in region rt r of country r of country r i. This equation is sort of a population-weighted coefficient of variation and standard deviation, since I take the squares of the deviations of the individual regional GDP per capita levels from the country’s GDP per capita level, instead of using the mean of the regional GDP per capita, rtinc . The idea behind using this type of measure is that in countries where a relatively larger share of the population lives in the main region or in other hubs, the production process might be enormously concentrated there (also for historical reasons). This might have a significant negative effect on the other regions, and inequalities will be even higher. Compared to the “normal” coefficient of variation, the above measure produces higher disparity values when the main region is significantly larger in terms of population than the others. This is the case in France: One-third of the French population lives in Île-de-France and Bassin parisien. The results terms of population than the others. This is the case in France: One-third of the French population lives in Île-de-France and Bassin parisien. The results terms of population than the others. This is the case in France: One-third of
remain largely the same for countries with more than one large hub (most noticeably U.K.: London, Manchester, Leeds; or Germany: Stuttgart, Munich, Düsseldorf, etc.). Finally, measure (1) gives smaller values when the main region is only slightly larger than the others or the regions are rather equal in size.
Taking the most recent data available (2004), within-country regional inequalities are outstandingly high in Slovakia and are above average in the Czech Republic, Belgium, Romania, Hungary, and the U.K. Disparities are about average in Bulgaria, lower in the remaining countries and lowest in Sweden (see Appendix, table A.2).
The above data are presented in chart 5, together with incomes and within-country regional disparities in 1995 and in 2004. In most of the countries, regional disparities increased or remained at the same level, the only (slightly noticeable) exceptions being Austria and Italy. What does not seem to be very convincing in chart 5 is that the rise in inequalities was higher in the least developed countries. Instead, the change (and even the level) was higher in those countries which are said to have developed faster – the new EU Member States.
Chart 5
Incomes and Disparities in 1995 and in 2004
30,000
25,000
20,000
15,000
10,000
5,000
0
Source: Eurostat, author’Eurostat, author’Eurostat, s calculations author’s calculations author’ .Note: Blue barNote: Blue barNote: s represent Blue bars represent Blue bar “old” EU membe“old” EU membe“old” rs, yellow and red barrs, yellow and red barrs, s stand for the yellow and red bars stand for the yellow and red bar “new” membew” membew” rs.
SE
0.7
0.6
0.5
0.4
0.3
0.2
0.1
0FR ES NL AT FI PL PT IE DE GR IT BG UK HU RO BE CZ SK
Income 1995 Income 2004 Disparities 1995 Disparities 2004

Development and Regional Disparities –Testing the Williamson Curve Hypothesis in the European Union
Focus 2/07 ◊ ceec.oenb.at 109
This observation raises the following question: Is it perhaps faster growth or convergence that drives the rise in regional disparities, rather than a country’s development level? Or is it EU membership? I will answer these questions in the next section.
5 Methodology and ResultsIn this section I will introduce the methodology used and estimate the relationship between disparities and the level of income, as well as the relationship between disparities and income growth.
5.1 Methodology
Williamson originally applied his examination to the development path of only one country, but many empirical studies and Williamson himself draw conclusions from making cross-sectional comparisons. This has the advantage that one can compare different countries at different stages of development with different levels of regional disparities. However, it has the drawback, for example, that a cross-sectional analysis might disregard that regional inequalities expand or shrink during the economic cycle. If these cycles are not in sync in the countries under review, a comparison at an arbitrarily chosen point in time would result in biased estimates. Thus it seems logical to combine time- and cross-sectional analysis and use panel data.
Hence, I use a panel data regression model with unobserved effects of the general form:
y x ait it i it= + +β ε , (2)
where i denotes the country observation and t stands for time, while t stands for time, while t ai (also called heterogeneity effect) contains observable or unobservable (but so far unobserved) country-specific, but time-invariant factors that have an effect on the disparities. itε represents the idiosyncratic error, i.e. unobserved factors that change over time and affect yit. Depending on what we think about the correlation between the unobserved effect and each of the explanatory variables, fixed or random effects estimation can be used. If the unobserved effect is independent of the explanatory variables, random effects estimation will be more efficient, because its estimators have much smaller variances than the fixed effect estimators. However, if we believe that the unobserved effect is correlated with any explanatory variable, only the fixed effect estimators are consistent (Wooldridge, 2002). In order to decide which method is appropriate, I use the random effect method, and then I carry out the Hausman test. Since the test rejects the null that the random effect model is consistent, I present the results using fixed effect estimation. This method practically estimates the ai values for each country. It is also useful because one can see whether the chosen right-hand side variables or the country-specific effects have a bigger power in explaining regional disparities.
I apply the fixed effect model to the EU and to the Williamson curve, so equation (2) can be modified as: ineq inc inc ait it it i it= + + + +β β β ε0 1 2
2 , (3)

Development and Regional Disparities –Testing the Williamson Curve Hypothesis in the European Union
110 ceec.oenb.at ◊ Focus 2/07
where ineqit is the measure of regional inequalities in country it is the measure of regional inequalities in country it i in year t as t as tdefined by equation (1), incit is GDP per capita in purchasing power standards it is GDP per capita in purchasing power standards itin country i in year t. It is likely that there are factors affecting regional disparities which are specific for individual countries but do not change over time, at least not over the period examined. These factors are represented by ai. If the Williamson curve hypothesis holds, β2β2β is smaller than 0, which indicates a reverse U-shaped curve. I also expect β0 and β1 β1 β to be strictly greater than 0. The first expectation implies that there is an initial level of inequality: A very poor country will also be characterized by some regional disparities. The second one implies that I will be able to observe not only the descending part of the curve.
By the same logic, it can be assumed that there are factors which have an impact on regional disparities; these change over time, but they have an equal effect on each country. Globalization is the most likely such factor. Thus I will also experiment with using period fixed effects, which modifies equation (3) as ineq inc inc a bit it it i t it= + + + + +β β β ε0 1 2
2 , (4)where bt represents the vector of the period dummies.9
As mentioned in many relevant studies (see e.g. Petrakos, Rodríguez-Pose and Rovolis, 2003), it is very likely that the idiosyncratic error itε exhibits serial correlation and follows an autoregressive (AR) process so that
ε ρ ε υit is t s
s
w
it= +−=
∑1
, (5)
where υit is uncorrelated across observations. After estimating equation (3), it is uncorrelated across observations. After estimating equation (3), itthe correlogram of the residuals shows high autocorrelation. In the estimation of equation (5), the residuals exhibit a first order autoregressive process, AR(1). However, based on different unit root tests, we cannot decide on the presence of unit root.10 Thus I use White period standard errors and covariance, which are robust for serial correlation.
As outlined in section 4, a logarithmic relationship between the disparities and a country’s development might also be detected, it is, however, more rigid than the quadratic form. In order to further examine the relevance of the estimation of a log relationship, I removed country-specific effects from the data on regional disparities by regressing disparities only on country dummies, and plotted the residuals of this estimation against the income levels. Accordingly, chart 6 shows only that part of the inequalities that cannot be connected to country-specific factors. It seems that from an income level of some EUR 20,000 to EUR 24,000 upward, inequalities indeed start to decrease. However, as an alternative of the Williamson hypothesis, I estimate the logarithmic relationship of the form
ineq inc ait it i it= + + +β β ε0 1 log , (6)
9 Given that I used unbalanced panel data (observations are missing in some years), using fixed cross-sectional and random period effects at the same time is not feasible.
10 The Levin, Lin and Chu test, the Im, Pesaran and Shin test as well as the ADF-Fisher test are unable to reject the null of the presence of unit root, while the Breitung t-stat and PP-Fisher tests do reject it. The Hadri test cannot reject the null that there is no unit root. The specification of these tests is described in EViews (2004).

Development and Regional Disparities –Testing the Williamson Curve Hypothesis in the European Union
Focus 2/07 ◊ ceec.oenb.at 111
where the new variable is logincit, which is the natural logarithm of the GDP per capita level of country i at time t.
Finally, as chart 5 suggests, it might be the case that countries posting faster growth experience larger or faster increasing inequalities. This is also what the two simulations in section 3 seem to suggest. In the Lucas-type simulation, disparities rise to the same point as income growth accelerates. The simple correlation between the two series is 0.29. In the Quah-type simulation, disparities grow faster during the period in which income accelerates, while the graph of inequalities becomes flatter when income growth decelerates. Here the simple correlation is 0.87. For that reason I also estimate the relationship between income growth and both the change in and the level of disparities, using the following regressions:level of disparities, using the following regressions:level of
ineq inc ait it i it= + + +β β ε0 1 d log( ) , (7)
d log( ) d log( )ineq inc ait it i it= + + +β β ε0 1 , (8)
where dlog(ineqit)it)it and dlog(incit)it)it stand for the change in the logarithm of the corresponding variable, assuming that d log( ) log log log( / ) log(x x x x x gt t t t t= − = = +− −1 1 1 rrowth x growth xt t( )) ( )≈ .In two other regressions, I also include time dummies (bt)t)t .
5.2 Income and Disparities
First, I estimate equation (4); the results are presented in table 2, model (I). Using cross-section dummies, both the coefficient on income and its square are highly significant. The coefficient on income is positive, while its square is negative, indicating an inverse U-shaped relationship between disparities and development.
The results show that regional inequalities within a country grow until the country reaches an income level of about EUR 22,800 per capita,11 and then
11 This comes from finding the maximum of the estimated function by solving
∂∂
=∂ + +
∂=
covinc
inc incinc
( )β β β0 1 22
0
Chart 6
Non-country-specific Disparities
0.8
0.4
0
–0.4
–0.8
–1.2
Source: Author’s calculationsAuthor’s calculationsAuthor’ , Eurostat., Eurostat.,
4,000
Non
-cou
ntry
-spe
cific
disp
ary-
spec
ific
disp
ary-
spec
ifiti
es
8,000 12,000 16,000 20,000 24,000 28,000 32,000
Income

Development and Regional Disparities –Testing the Williamson Curve Hypothesis in the European Union
112 ceec.oenb.at ◊ Focus 2/07
they start to diminish. This level corresponds to the EU-25 average (the whole EU excluding Romania and Bulgaria) or Italy’s development level of 2004. The estimated maximum of disparities is 0.305, which equals the disparities in the U.K. in 2004.
The F-statistics for redundant fixed effects shows that cross-section dummies and the explanatory variables are jointly significant, so that it is appropriate to use cross-section fixed effects. The R2 of the regression is very high, but this is due to the use of the fixed effects method: cross-section dummy variables explain 88% of the variance in the data, while income and its square explain only 8%.
Model (II) also uses period fixed effects. The results change only slightly: The coefficients remain significant, but are a bit lower. From this, a lower turning point of disparities follows – EUR 20,500. The R2 does not change, meaning that using time dummies does not improve the fit of the model. The F-statistics for redundant fixed effects show that period fixed effects in themselves would be redundant; however, together with the cross-section dummies, they are jointly significant. Thus, using period fixed effects does not have an outstanding value.
The log regression using cross-country dummies (model (III)) gives significant results as well. If the income level increases by 1%, regional disparities rise by 0.0082 in the former case. In country A with a per-capita income level that is 50% higher than that of country B, regional disparities are expected to be about 0.4 higher than in country B. (The mean of disparities in the examined 19 countries is 0.26 over the entire period.) Given the logarithmic feature of the estimation, the change in disparities slows down in the more
Table 2
Income and Disparities
Quadratic form Log form
Model (I) Model (II) Model (III) Model (IV)
Dependent variable cov
Cross-sectiondummies
Cross-section andtime dummies
Cross-sectiondummies
Cross-section andtime dummies
constant 0.011 0.081 –0.534 –0.935(0.808) (0.316) (0.011) (0.157)
inc 2.58*10–5 2.02*10–5
(0.000) (0.002)inc2 –5.67*10–10 –4.94*10–10
(0.000) (0.000)log(inc) 0.082 0.124
(0.000) (0.071)
R2 0.967 0.968 0.959 0.961Adjusted R2 0.963 0.962 0.955 0.954
Cross-section F-stat 243.96(0.000)
226.72(0.000)
235.04(0.000)
192.02(0.000)
Period F-stat 0.967(0.470)
0.816(0.000)
Cross-section and period F-stat
162.68(0.000)
134.17(0.000)
Number ofobservations 187 187 187 187
Source: Author’s calculations.
Note: Marginal signif icance level (p-value) using White period standard errors in parenthesis.

Development and Regional Disparities –Testing the Williamson Curve Hypothesis in the European Union
Focus 2/07 ◊ ceec.oenb.at 113
developed countries. Again, cross-country dummy variables explain most of the variation in disparities (90% out of 96% explained by the whole regression). Model (IV) uses period fixed effects again, and the result is significant only at 10% and the fit does not improve. For models (III) and (IV), the redundant fixed effects test produces the same results as before: Cross-section fixed effects are useful and have a strong explanatory power, while period fixed effects are not necessary.
The fact that the fit of the log regression is as good as the fit of the squared regression indicates that the more flexible squared regression catches rather the upward part of the Williamson curve, where the two functional forms do not deviate to a large extent. The deviation between the two starts increasing as income per capita rises above EUR 22,000 and becomes substantial above EUR 30,000 (the outstanding Irish level at the end of the period examined).
It is also interesting to observe the estimated cross-section dummies (table A.2): They are all positive for the new EU Member States (and Belgium), while they are negative for the other EU countries. This result strengthens my previous impression that disparities in the new Member States are higher, even when controlled for income levels. In order to further examine this issue, I create a dummy variable nms, which takes the value 1 for Romania, Bulgaria, Slovakia, the Czech Republic, Hungary and Poland and 0 otherwise. Slovakia, the Czech Republic, Hungary and Poland joined the EU in May 2004, and they have been eligible for the EU’s Structural Funds from January 2004 on. Still, they have considerably less experience in using the EU funds than the old members. Then I regress the estimated coefficients of the cross-section dummies on the nms variable for all my previous models (I) to (IV):
0 1M Mi i icountry nmsλ λ ξ= + + (9)
where the superscript M simply denotes the model’s coefficients used. M simply denotes the model’s coefficients used. MTable 3 presents the results of the above estimations. In all equations, the
nms dummy is significant at 1%. The constant represents the average disparities in the old members after controlling for income differences, and it is significant at 5%. These estimations verify that even when controlling for income differences between the countries, the new Member States face larger
Table 3
Income and Disparities
Dependent variable:
Quadratic form Log form
country dummies Model (I) Model (II) Model (III) Model (IV)
constant 0.149(0.017)
0.121(0.048)
0.128(0.037)
0.155(0.014)
nms 0.213(0.002)
0.173(0.009)
0.183(0.006)
0.221(0.001)
R2 0.578 0.474 0.503 0.595Adjusted R2 0.554 0.443 0.474 0.570
Number of observations 19 19 19 19
Source: Author’s calculations.
Note: Marginal signif icance level (p-value) using White heteroskedastic robust standard errors in parenthesis.

Development and Regional Disparities –Testing the Williamson Curve Hypothesis in the European Union
114 ceec.oenb.at ◊ Focus 2/07
disparities than the old members. The R2 values tell that the date of EU accession explains more than 50% of the variations in disparities after control-ling for income levels.
It is also visible in chart 6 that if we take model (I) as a baseline model, and decompose the variance in disparities according to the previous estimations, more
than one-half of the total variation is captured by EU membership. Another significant part can be explained by some other country-specific factors. The income level, which is the main (and only) factor in the original Williamson framework, only explains 8% of the total variation. Other, unobserved factors have only negligible effects.
5.3 Growth and Disparities
I estimated four additional models on the basis of equations (7) and (8). Models (V) and (VII) use cross-country dummies only and models (VI) and (VIII) use both cross-country and time dummies. The results of these four estimations are summarized in table 4.
With the only exception of model (VI), in none of the estimated models was the coefficient on income growth (dloginc) significant. The signs of the cross-country dummies in all models became tedious. Models (VII) and (VIII) are completely misspecified, proven by both the (adjusted) R2 values and the F-statistics.
Chart 7
Decomposition of the Variance in Disparities
Source: Author’s calculationsAuthor’s calculationsAuthor’ .
8%3%3%
52%37%
Income Other country-specific factory-specific factory-specif sEU membership Unobserved factors
Table 4
Growth and Disparities
Dependent variable: cov Dependent variable: dlog(cov)
Model (V) Model (VI) Model (VII) Model (VIII)
Constant 0.258(0.000)
0.253(0.000)
0.010(0.412)
0.025(0.052)
dlog(inc)inc)inc 0.100(0.167)
0.204(0.003)
0.110(0.589)
–0.199(0.386)
R2 0.957 0.967 0.079 0.158Adjusted R2 0.952 0.961 –0.040 –0.004
Cross-section F-stat 179.78(0.000)
219.92(0.000)
0.624(0.877)
0.785(0.715)
Period F-stat 5.496(0.000)
1.651(0.116)
Cross-section and period F-stat
156.40(0.000)
0.955(0.532)
Number of observations 168 168 168 168
Source: Author’s calculations.
Note: Marginal signif icance level (p-value) using White period standard errors in parenthesis.

Development and Regional Disparities –Testing the Williamson Curve Hypothesis in the European Union
Focus 2/07 ◊ ceec.oenb.at 115
Even though the coefficient on growth in model (VI) is significant, we have to handle this result cautiously. If I estimate equation (7) first, the coefficient on growth is not significant, and R2 is below 0.03. Then I include period fixed effects, which again results in an insignificant estimator on growth, and the adjusted R2 decreases below 0. Period dummies are not redundant though, according to the test statistics. When including cross-section dummies, both fixed effects are jointly significant. This suggests that it is time- and country-specific factors that explain disparities rather than the speed of growth. The coefficients in model (VI) are also economically quite unreasonable. The constant means that a country with zero growth has a disparity level of 0.253 – which is about the mean of disparities in the sample. If growth is by 1 percentage point higher, disparities increase by 0.2, which means that in a country with growth at 2%, disparities come to above 0.6 – disregarding country- and period-specific effects. This is far above the observable values in the EU, which indicates that the coefficient in model (VI) is biased upward. What we can say is that the speed of growth might play only a very minor role in explaining within-country regional disparities.
6 DiscussionAs the results of the previous sections show, it is rather the ascending side of the Williamson curve which is supported in the case of the EU, while the link between growth and disparities is very weak. New and old EU members can be distinguished in two ways: (1) The new Member States can be placed on the earlier part of the ascending curve, while the old members are on the part where the curve becomes flat, and (2) the new members are characterized by a higher level of disparities, even when accounting for differences in the development levels. The evidence on the ascending side of the Williamson curve is in line with Davies and Hallet (2002).
Earlier studies focused on the differences between two or more groups of regions e.g. on the basis of core and periphery regions, but they did not take into account the differences between the former EU-15 and the former accession countries. The results of my study show, however, that it is the date of EU accession that matters. The new EU members were not yet members during the period under review. Now that they are all members, the EU must face the fact that these countries experience a higher level of regional disparities, and has to think about what factors might cause these differences between the old and new members. I emphasize four possibilities here.
(1) The Transition Process
The new EU Member States examined here are all post-communist countries that went through an economic transition process in the 1990s. This factor alone must have resulted in a considerable jump in disparities. On the one hand, in most of the countries the economic situation of significant heavy industry hubs deteriorated (e.g. in the Northern Hungary region) and as a result, unemployment increased dramatically, while income declined. On the other hand, with the breakup of the Soviet Union and the collapse of the Council for Mutual Economic Assistance, these countries lost their external markets. Looking at the consequences of both factors, the recovery was easier
Development and Regional Disparities –Testing the Williamson Curve Hypothesis in the European Union
116 ceec.oenb.at ◊ Focus 2/07
for the capital region as well as for the regions close to the Western markets. When the liberalization and privatization process started, foreign direct investments preferred those areas in which the production and transportation infrastructure was in a better shape (capital region) or areas which were close to the Western markets. As a result, the capital regions developed fast and the eastern regions mostly lagged behind.
(2) Economic and Monetary Union
The European Commission often argues that, in order to reach and maintain higher growth rates in lagging regions, it is important to ally macroeconomic policies which also ensure financial stability. The common currency helps in achieving such stability. The Commission maintains that in the 1990s, while preparing for monetary unification, inflation was reduced considerably in the cohesion countries, especially in Greece and Portugal. At the same time, GDP growth was above average in all the cohesion countries (including Ireland) in the second half of the 1990s. Thus, nominal convergence was accompanied by real convergence (European Commission, 2002). However, within-country disparities increased in these countries in the 1990s, and started to decrease only from 2000, after the introduction of the euro. One reason of this is that, because of the constraints imposed by the Maastricht criteria, the poorest EU members (Spain, Portugal and Greece) could not implement domestically financed measures to support regional development. The Maastricht criteria required these countries to reduce their high public debt and budget deficit levels, thus cutting their capacity to develop further public investment programs; direct national financial support to private investment was mitigated (Getimis and Economou, 1996).
However, after meeting the Maastricht criteria and becoming euro area members, the countries could benefit from the favorable effects of the single currency and the single market. The single currency should increase competition and market efficiency. By reducing transaction costs and interest rate differentials, it should also lower the price of capital and increase its availability in lagging regions. Regional variations in labor costs are expected to become more transparent, which should help to focus attention on underlying differences in productivity, which are a major cause of differences in regional competitiveness (European Commission, 2002).
(3) The Role of the EU’s Structural and Cohesion Funds
There is no doubt that the EU’s Structural and Cohesion Funds provide an opportunity for the indigent regions to catch up. These resources have been available for the old Member States for quite a long period now. According to the European Commission’s report (2002), the difference in income per capita between Objective 1 regions (those which are eligible for resources from the Cohesion Funds) and the EU average narrowed by one-sixth between 1988 and 1998. A number of regions, in particular Irish and Eastern German regions as well as the Lisbon region, performed better than the average. As to the other regions eligible for resources from the Structural Funds, the levels of employment and unemployment also moved in a more favorable direction than in the rest of the EU. Over the period from 1989 to 1999, structural

Development and Regional Disparities –Testing the Williamson Curve Hypothesis in the European Union
Focus 2/07 ◊ ceec.oenb.at 117
intervention had a significant effect in Greece and Portugal; the effect was smaller in Ireland and Spain, where money from the Structural and Cohesion Funds accounted for a smaller proportion of GDP. The European Commission (2002) notes that the funds also increase competitiveness and productivity in the lagging regions and thus help to expand income over the long term. Structural intervention addresses the roots of regional imbalances and is aimed at strengthening the factors which provide the basis for sustained growth, such as systems of transport, small and medium-sized enterprises, research and development, innovative capacity, education systems. The old EU Member States apparently have an advantage in that they know better how to use these funds successfully; however, the funds are now available for the new members as well. It is up to them how fast the learning process will be.
(4) Institutional Framework for Successful Regional Policy
Successful regional policy is not only a matter of the economic resources available – efficient institutions, the administrative background and a decentralized decision-making procedure also play a significant role (Getimis, 2003; Davies and Hallet, 2002). As many studies point out, the new EU Member States (former accession countries) are characterized by weak institution building and limited administrative capacity despite the implementation of concrete steps toward decentralization, compared to the old members. In the latter, efficient institutional structures at all levels of governance (European, national, regional, local) can help using the Structural Funds effectively (Bailey and De Propris, 2002; Marcou, 2002). In the new Member States, the process of institutional restructuring has not been finished yet, and it is contradic-tory. Top-down, command-and-control decision-making processes and the emergence of a new bureaucracy encumber the establishment of a decentralized, accountable multi-level system of governance.
Heinelt (1996) and Benz and Eberlein (1999), among others, study the relationship between the existence of decentralized, multi-level governance and the use of Structural Funds resources. They show that there are differences with regard to the political influence the state government and the lower levels of government exert in the programming, implementation, monitoring and evaluation of European regional policy. In unitary states such as Greece, Ireland and France, the national government dominated the whole procedure in the 1990s: from negotiating with the European Commission to programming and implementing regional development plans and operational programs. The subnational authorities had only limited political influence, but they gradually gained important benefits in institution building and learning at the regional level. In these three countries, regional disparities were not lower at the end of the period examined, compared to the mid-1990s (however, inequalities diminished in Ireland over the past few years). Contrary to unitary and centralist states, in federal states (e.g. Germany, Austria) or regionalized countries (e.g. Spain) subnational institutions had a very substantial role in the planning and implementation process. In these three countries, disparities are lower now than they were in the mid-1990s. Austria managed to decrease inequalities the most among the EU countries. The case of Italy, where disparities have also continuously diminished, is also interesting: The central

Development and Regional Disparities –Testing the Williamson Curve Hypothesis in the European Union
118 ceec.oenb.at ◊ Focus 2/07
government plays an important role in both the planning and implementation of regional programs, but some regions – especially those experienced in making innovative regional development plans, have succeeded in influencing these processes.
7 ConclusionsIn this paper I examined the relationship between within-country regional disparities and the development of nations in the enlarged EU. I found evidence on the Williamson curve hypothesis, which says that disparities are lower in the early stages of development, peak in the middle-income stages, but diminish again as a country becomes wealthy. What is more important, however, I point out that some factors have a considerably stronger influence on disparities than national income. Among these country-specific factors, the date of EU accession plays an outstanding role, being responsible for more than one-half of the differences in regional disparities between the EU Member States. I argue that four main factors connected to EU membership are possible driving forces behind the disparities. The transition process in the new Member States completely changed their economic structure, and some regions recovered faster than others. Economic and Monetary Union was established in the old Member States in the end-1990s, making them observe fiscal prudence, making the markets more transparent and increasing competition, not only among the states, but also among the regions. In the old Member States, the substantial resources of the EU’s Structural and Cohesion Funds have been available since the 1980s. What is more important, they have learned how to use these funds efficiently and how to build effective institutions which might also allow for more decentralized regional planning.
For the new EU Member States, the above implies that disparities will not decrease just because a country is catching up to the more developed EU countries. Development policies must not focus extensively on the country as a whole, but have to take into account the preferences and possibilities of their peripheral regions as well. Also it is not enough to make resources available to these regions; they must be taught how to communicate with the planning and decision-making bodies and how to use these funds efficiently.

Development and Regional Disparities –Testing the Williamson Curve Hypothesis in the European Union
Focus 2/07 ◊ ceec.oenb.at 119
ReferencesBailey, D. and L. De Propris. 2002. EU Structural Funds, Regional Capabilities and
Enlargement. Paper presented at the RSA International Conference “Evaluation and EU Regional Policy: New Questions and New Challenges.” Aix-en-Provence.
Barro, R. Jr. and X. Sala-i-Martin. 1995. Economic Growth. Chicago: The MIT Press.Benz, A. and B. Eberlein. 1999. The Europeanization of Regional Policies: Patterns of
Multi-level Governance. Journal of European Public Policy 6(2). June. 322–348.Brasili, C. and L. Gutierrez. 2004. Regional Convergence Across European Union.
EconWPA, Development and Comp. Systems 0402002.Dall’erba, S. and J. Le Gallo. 2003. Regional Convergence and the Impact of the
European Structural Funds Over 1989–1999: A Spatial Econometric Analysis. REAL Discussion Papers.
Davies, S. and M. Hallet. 2002. Interactions between national and regional development. Hamburgisches Welt-Wirtschafts-Archiv (HWWA) Discussion Paper 207.
De la Fuente, A. 1998. What kind of regional convergence? Instituto de Análisis Ecónomico (CSIC).
European Commission. 2002. Commission Communication. First progress report on economic and social cohesion. Commission of the European Communities.
EViews. 2004. EViews User’s Guide.Feldkircher, M. 2006. Regional Convergence within the EU-25: A Spatial Econometric
Analysis. OeNB Workshop Series 9.Getimis, P. and D. Economou. 1996. Greece. In: Policy Networks and European
Structural Funds. Heinelt, H. and R. Smith (eds.). Aldershot, Avebury.Getimis, P. 2003. Improving European Union Regional Policy by Learning from the Past in
View of Enlargement. European Planning Studies 11(1).Heinelt, H. 1996. Multilevel Governance in the European Union and the Structural Funds.
In: Policy Networks and European Structural Funds. Heinelt, H. and R. Smith (eds.). Aldershot, Avebury.
Lucas, R. Jr. 2000. Some macroeconomics for the 21st century. Journal of Economic Perspectives 14. 159–168.
Marcou, G. 2002. Regionalization for Development and Accession to EU: A Comparative Perspective. Budapest: Local Government and Public Reform Initiative.
Myrdal, G. 1957. Economic Theory and Underdeveloped Regions. Methuen, London.Petrakos, G., A. Rodríguez-Pose and A. Rovolis. 2003. Growth, Integration and
Regional Inequality in Europe. ERSA Conference Papers ersa03p46.Quah, D. 1995. Regional Convergence Clusters Across Europe. Centre for Economic
Performance Discussion Paper 274.Sala-i-Martin, X. 1990. The Classical Approach to Convergence Analysis. The Economic
Journal 106(437). July 1996. 1019–1036.Sala-i-Martin, X. 1995. Regional Cohesion: Evidence and Theories of Regional Growth
and Convergence. CEPR Discussion Paper 1075.Solow, R. 1956. A Contribution to the Theory of Economic Growth. Quarterly Journal of
Economics 70. 65–94.Williamson, J. G. 1965. Regional inequality and the process of national development: a
description of the patters. Economic and Cultural Change 13. 1–84.Wooldridge, J. M. 2004. Analysis of Cross Section and Panel Data. Chicago: The MIT
Press.

Development and Regional Disparities –Testing the Williamson Curve Hypothesis in the European Union
120 ceec.oenb.at ◊ Focus 2/07
Appendix
Table A.1
Correlations between the Examined Variables
Disparities Income Growth NMS
Disparities 1.000 –0.316 0.163 0.500Income –0.316 1.000 –0.247 –0.824Growth 0.163 –0.247 1.000 0.212NMS 0.500 –0.824 0.212 1.000Source: Author’s calculations.
Table A.2
Estimated Cross-sectional Dummies
Model (I) Model (II) Model (III) Model (IV)
Austria –0.089 –0.069 –0.084 –0.102Belgium 0.068 0.085 0.076 0.061Bulgaria 0.075 0.032 0.035 0.079Czech Republic 0.106 0.095 0.108 0.116Germany –0.063 –0.047 –0.050 –0.064Spain –0.081 –0.077 –0.067 –0.072Finland –0.085 –0.071 –0.074 –0.086France –0.115 –0.100 –0.102 –0.115Greece –0.055 –0.061 –0.048 –0.044Hungary 0.088 0.067 0.077 0.094Ireland –0.063 –0.045 –0.066 –0.083Italy –0.052 –0.037 –0.038 –0.051Netherlands –0.105 –0.086 –0.102 –0.119Poland 0.006 –0.021 –0.015 0.010Portugal –0.048 –0.053 –0.039 –0.036Romania 0.212 0.167 0.173 0.219Sweden –0.140 –0.124 –0.130 –0.144Slovakia 0.410 0.385 0.392 0.414U.K. –0.006 0.009 0.004 –0.009
Source: Author’s calculations.

Development and Regional Disparities –Testing the Williamson Curve Hypothesis in the European Union
Focus 2/07 ◊ ceec.oenb.at 121
Table A.3
GDP per Capita in Purchasing Power Parities
1995 1996 1997 1998 1999 2000 2001 2002 2003 2004
Austria 19,320 20,362 21,000 21,882 23,225 24,959 25,158 25,545 26,535 27,666Belgium 18,478 19,006 19,837 20,626 21,424 23,167 24,158 25,025 25,581 26,759Bulgaria 4,694 4,411 4,313 4,609 4,837 5,261 5,773 6,020 6,657 7,134Czech Republic 10,474 11,428 11,676 11,835 12,252 12,875 13,571 14,411 15,202 16,171Germany 18,325 19,018 19,645 20,319 21,087 22,210 22,666 23,107 24,188 24,903Spain 13,315 14,006 14,757 15,773 17,113 18,322 19,214 20,261 20,800 21,658Finland 15,930 16,733 18,470 19,947 20,899 22,674 23,810 24,416 23,367 24,834France 17,420 18,168 19,259 20,265 21,076 22,535 23,466 23,838 23,155 24,146Greece 10,790 11,239 11,966 12,518 13,137 14,458 15,095 16,428 17,257 18,245Hungary 7,454 7,806 8,401 9,022 9,608 10,713 11,722 12,576 13,067 13,751Ireland 15,006 16,468 18,953 20,704 22,644 25,071 26,481 28,165 28,909 30,414Italy 17,852 18,613 19,339 20,398 21,136 22,494 23,076 23,426 22,796 23,095Netherlands 18,167 19,189 20,574 21,626 22,795 24,665 26,182 26,673 26,630 27,946Poland 6,194 6,784 7,456 7,994 8,522 9,283 9,495 9,862 10,080 10,908Portugal 11,520 12,051 12,919 13,854 14,935 15,969 16,458 16,916 15,693 16,086Romania 4,656 4,702 4,948 5,397 5,988 6,434 7,301Sweden 17,867 18,633 19,448 20,215 21,880 23,620 23,744 24,195 24,821 25,865Slovakia 6,808 7,516 7,989 8,444 8,716 9,419 10,031 10,866 11,362 12,196U.K. 16,527 17,563 18,887 19,815 20,716 22,230 23,306 24,705 24,974 26,456
EU-27 14,581 15,310 16,127 16,874 17,696 18,944 19,668 20,353 20,596 21,503
Source: Author’s calculations.
Table A.4
The Calculated Regional Inequalities
1995 1996 1997 1998 1999 2000 2001 2002 2003 2004 Average
Austria 0.222 0.225 0.217 0.214 0.212 0.207 0.208 0.207 0.202 0.196 0.211Belgium 0.367 0.372 0.364 0.362 0.368 0.369 0.371 0.372 0.365 0.362 0.367Bulgaria 0.191 0.189 0.192 0.176 0.211 0.179 0.204 0.237 0.238 0.258 0.207Czech Republic 0.267 0.266 0.295 0.336 0.360 0.377 0.403 0.414 0.414 0.410 0.354Germany 0.240 0.235 0.237 0.240 0.239 0.242 0.246 0.239 0.233 0.231 0.238Spain 0.201 0.200 0.204 0.203 0.203 0.215 0.211 0.204 0.197 0.193 0.203Finland 0.184 0.202 0.194 0.221 0.243 0.207 0.242 0.224 0.209 0.196 0.212France 0.183 0.187 0.186 0.182 0.184 0.188 0.185 0.186 0.188 0.182 0.185Greece 0.191 0.200 0.185 0.176 0.163 0.217 0.217 0.227 0.230 0.234 0.204Hungary 0.246 0.264 0.279 0.282 0.303 0.322 0.323 0.347 0.336 0.329 0.303Ireland 0.214 0.220 0.224 0.231 0.237 0.232 0.233 0.232 0.218 0.220 0.226Italy 0.263 0.265 0.254 0.257 0.249 0.246 0.239 0.237 0.238 0.242 0.249Netherlands 0.147 0.204 0.197 0.195 0.196 0.199 0.199 0.199 0.194 0.196 0.193Poland 0.154 0.173 0.179 0.192 0.211 0.206 0.217 0.213 0.215 0.211 0.197Portugal 0.215 0.212 0.223 0.230 0.205 0.219 0.216 0.217 0.214 0.220 0.217Romania 0.247 0.253 0.404 0.421 0.411 0.361 0.351 0.350Sweden 0.124 0.140 0.158 0.164 0.174 0.175 0.167 0.170 0.162 0.165 0.160Slovakia 0.591 0.568 0.592 0.594 0.585 0.605 0.619 0.648 0.644 0.659 0.611U.K. 0.263 0.267 0.280 0.289 0.293 0.308 0.300 0.305 0.305 0.304 0.292
Average 0.237 0.244 0.248 0.252 0.257 0.269 0.275 0.278 0.272 0.271 0.261
Source: Author’s calculations.


H i g h l i g h t s

124 ceec.oenb.at ◊ Focus 2/07
The selected abstracts below alert readers to studies on CEE topics in other OeNB publications. You may fi nd the full-length contributions at www.oenb.at.
Banking in Belarus – On a Trajectory of its Own?This study analyzes the functions and development of the Belarusian banking system in recent years, with a special focus on the current situation, which is characterized by a sharp deterioration of the country’s terms of trade in early 2007. Since the mid-1990s, the “Belarussian economic model” has consisted of a mixture of market elements with rigorous state interventionism and outright remnants of the centrally planned economy. About three-quartersof the country’s economy and four-fi fths of its banking sector remain state owned. Thanks to a surprisingly favorable industrial legacy and to very advantageous terms of trade including outside subsidies in recent years, the “model” has delivered impressive growth and has slashed poverty. Credit institutions – particularly the largest ones – serve as instruments to carry out directed lending to fi nance fi xed investment projects in various areas targeted by the state. From time to time, the authorities step in and bail out the most troubled players. The only major foreign acquisition in the sector to date was the purchase of Priorbank (the fourth-largest credit institution) by Raiffeisen Zentralbank (of Austria) in 2002. Most recently (since 2004) Belarusian banks appear to have joined, to some degree, the credit boom reigning in all of the country’s neighbors. The external shock of early 2007 (Russia’s sharp increase of energy prices) threatens to erode the quality of credits and to put pressure on the Belarusian ruble, thereby undermining the stability of the sector. The authorities have so far reacted by soliciting external fi nancial assistance and by trying to attract FDI by selling some key enterprises – including some medium-sized banks – to foreigners, mostly Russians.
Published in Financial Stability Report 14.
Determinants of Bank Interest Margins of CEE BanksBanks’ interest margins are among the most important indicators of the cost of fi nancial intermediation. This paper investigates the determinants of banks’ interest margins in Central and Eastern Europe (CEE). Given the run-up to EU entry and EU membership itself, dynamics in the banking sector in CEE have developed rather differently than in other emerging market economies. We document that, in contrast to the literature, foreign ownership has a positive effect on interest margins, whereas state ownership proves to be irrelevant. Banks’ pricing of loans and deposits, however, is risk-adjusted in CEE – we detect positive risk premia for both interest and credit risk. However, our data provide some evidence for moral hazard behavior. Moreover, the decreasing interest margins in the region during the fi rst half of the current decade seem to be caused by a decrease in operating costs as well as an increase of effi ciency levels and rapid fi nancial deepening.
Published in Financial Stability Report 14.
Stephan BarisitzStephan Barisitz
Markus Schwaiger,David Liebeg
Markus Schwaiger,David Liebeg
Selected Abstracts
Focus 2/07 ◊ ceec.oenb.at 125
Currency and CompetitivenessThe OeNB’s Conference on
European Economic Integration 2007
Summary12The Conference on European Economic Integration (CEEI) 2007 of the Oester-reichische Nationalbank (OeNB) took place on November 19 and 20 in Vienna. Under the heading “Currency and Competitiveness,” the CEEI explored the links between the external value of currencies and structural developments in the real economy, focusing specifi cally on the integration process in Central, Eastern and Southeastern Europe (CESEE).
In his opening remarks, Governor Klaus Liebscher drew attention to the success of the euro in a worldwide competitive environment. The securing of price stability and the simultaneous creation of approximately 15 million jobs since the establishment of Economic and Monetary Union (EMU) confi rm the euro’s success. Speaking on exchange rate issues, Liebscher described excessive exchange rate volatility as being unwelcome; however, he also recognized the “strong euro” as a cushion against recent crude oil price shocks. Other high-ranking speakers on the fi rst day included John Lipsky, First Deputy Managing Director of the International Monetary Fund, and the central bank governors of Cyprus, Athanasios Orphanides, Malta, Michael C. Bonello, and Slovakia, Ivan Šramko. Cyprus, Athanasios Orphanides, Malta, Michael C. Bonello, and Slovakia, Ivan Šramko. Cyprus, Athanasios Orphanides, Malta, Michael C. Bonello, and Slovakia,
On the second day, OeNB Director Josef Christl stressed that while exchange rates were signifi cant for the competitive position of a country, they are certainly not the only important factor. After all, the new EU Member States exhibited a strong economic performance despite substantial real appreciation. He also stated that competitive problems of individual Member States can only be solved by structural reforms. The prominent speakers on the second day include Lorenzo Bini-Smaghi, Member of the Executive Board of the ECB, Jean Pisani-Ferry, Director of the Brussels-based think tank BRUEGEL and Wolfgang Reithofer, CEO of Wienerberger AG.
The conference addressed a wide range of issues, e.g. the worldwide current account imbalances, international currency competition, the role, objectives and challenges of regional monetary unions, the competitiveness of catching-up countries and related challenges for monetary policy. The discussion on euro area enlargement shed some light on the successful convergence process of Cyprus and Malta, which at the time were on the verge of adopting the euro, as well as on future challenges for potential euro area candidates. Finally, market participants were given the opportunity to share their views, which provided valuable insights into the corporate experience with exchange rate adjustments.
1 The conference proceedings will be published by Edward Elgar Publishing Ltd. in the course of the year 2008. Presentations and papers as well as information about speakers and the program are available at www.oenb.at under Services and Events.
2 On the basis of notes taken by Andreas Breitenfellner, Stephan Barisitz, Sándor Gardó, Antje Hildebrandt, Thomas Reininger, Thomas Scheiber, Josef Schreiner, Tomas Slacik and Zoltan Walko.
Compiled byAndreas Breitenfellner2
Compiled byAndreas Breitenfellner2

Currency and CompetitivenessThe OeNB’s Conference on European Economic Integration 2007
126 ceec.oenb.at ◊ Focus 2/07
The Contribution of the Euro to Global StabilityIn his opening remarks, OeNB Governor Klaus Liebscher explained that the Klaus Liebscher explained that the Klaus LiebscherEurosystem had the primary objective to maintain price stability in the medium term rather than an exchange rate target. However, exchange rates are taken into consideration to the extent that they infl uence risks to price stability. “In this respect, excessive exchange rate volatility is not welcome,” stressed Liebscher. Only with diffi culty can the external value of a currency be attributed to individual factors of infl uence. Determining the effects of a currency appreciation is by no means easier, particularly because cheaper imported goods lower consumer prices. “In this sense, the ‘strong euro’ has cushioned our economies from recent crude oil price shocks,” noted Liebscher. Certainly, the considerable current account defi cits of the U.S.A. and the corresponding surpluses of Asian and oil exporting countries exert pressure on currencies, with the euro area carrying the major burden in this adjustment process. Liebscher maintained that all regions involved have to assume their respective responsibility for ensuring that their external and internal balances are sustainable. He recognized the improvement of the euro area’s competitive position, which is refl ected by sustainable economic growth and shrinking unemployment, in turn attributable to the stability-oriented framework of EMU and structural reforms. At the same time, he advocated further reforms to improve competitiveness as well as ambitious fi scal policy. Finally, Governor Liebscher congratulated the central bank governors of Cyprus and Malta on the introduction of the euro at the beginning of 2008. Both countries set a positive example for other EU Member States that have not joined the euro area yet.
The Multilateral Approach to Global Imbalances In the fi rst keynote speech, John Lipsky, First Deputy Managing Director of the International Monetary Fund (IMF), addressed the problem of global imbalances – net defi cits or surpluses in trade and investment among large countries – against the backdrop of near-term risks to growth and stability. Among those risks, he emphasized a further increase of oil prices, continued housing market turbulences not only in the U.S.A., but also in Europe, and fi nally a second phase of fi nancial market strains with a severe tightening of credit standards. Turning to the imbalances, more than a third of the U.S. current account defi cit was fi nanced by the increase of foreign holdings of asset-backed securities. Importantly, several recent exchange rate adjustments (appreciation in Brazil, Canada, Australia and the euro area; depreciation in China and Saudi Arabia) have not refl ected the respective countries’ current account positions. In his view, a three-part strategy could preserve growth while reducing imbalances: a rise in U.S. savings coupled with faster domestic demand growth in the rest of the world, and more exchange rate fl exibility in surplus countries. In the framework of the IMF’s multilateral consultation, fi ve major global players have presented policy plans on their contribution to reducing global imbalances in an orderly fashion. In particular, the euro area and Japan plan to strengthen domestic demand and productivity growth as well as competition in key sectors by structural reforms; China envisages fi nancial sector reforms and an increase in exchange rate fl exibility as well as a
Currency and CompetitivenessThe OeNB’s Conference on European Economic Integration 2007
Focus 2/07 ◊ ceec.oenb.at 127
rebalancing of growth; Saudi Arabia plans to raise spending in the hydrocarbon sector as well as in needed infrastructure and social projects; and the United States plans to raise its public and private saving. The longer-term gain in global economic growth implied by the combination of these policy measures would outweigh the short-term loss.
The second keynote speech was held by John Williamson, Senior Fellow at the Peterson Institute. He stressed that the most controversial issue was neither the size of the imbalances, nor how to remedy them, but whether they constitute a policy problem that demands action. He characterized the do-nothing view as the view that the market will automatically induce a gradual adjustment in its own good time. Williamson admitted that such a benign scenario was possible. The rest of the world might gradually desire additional resources and thus reduce saved dollar assets, as globalization slows and societies age, and this would lead to a fall in the U.S. defi cit. However, alternatively, a dollar crisis, with sharp dollar depreciation and a collapse in confi dence that reduced U.S. consumption and investment, was also possible. In this case, the expenditure reduction in the U.S.A. would eventually be outweighed by the expenditure-switching effect of dollar depreciation, while these two effects would be mutually reinforcing in the rest of the world and would threaten to trigger a world recession. Thus, prudence suggests an active program of adjustment that would reduce the risk of disaster. The speaker appreciated the “multilateral consultations” designed by the IMF as exactly the right instrument, containing the right members in the right context with the right topic. However, he argued that there was a lack of U.S. commitment to change (fi scal) policy as part of a package. If and as soon as the U.S.A. show its willingness to engage in genuine negotiations, the IMF should convene a second round of multilateral consultations to negotiate a joint and simultaneous policy change. In his view, successful negotiations should comprise both demand (fi scal policy) and exchange rate adjustments aimed at keeping the effective rates of the non-East Asian currencies broadly unchanged; this approach had the merit of using intervention policy more actively as a subject for negotiation. In the ensuing discussion, Lipsky stressed that in multilateral consultations each of the players acknowledged their voluntary plan as being in their own national interest and in the interest of all the others. Moreover, their plans did not leave out any important adjustment measure. Thus, the crucial question is whether these multilaterally consistent plans will be implemented, in which case the euro area would gain a lot. While Williamson maintained that the proposed fi scal consolidation plans by the U.S.A. were not ambitious enough, Lipsky replied with the rhetorical question of whether the U.S.A. should really take the risk of implementing a procyclical fi scal policy at present.
Understanding Exchange Rates: Economic Fundamentals versus Market MicrostructureThe fi rst session, chaired by Peter Mooslechner, Director of the Economics Department of the Oesterreichische Nationalbank, was an introduction into the academic debate on exchange rates determinants.
Ronald MacDonald, University of Glasgow, referred to the apparently widespread perception in economics that exchange rate behavior is disconnected

Currency and CompetitivenessThe OeNB’s Conference on European Economic Integration 2007
128 ceec.oenb.at ◊ Focus 2/07
from macroeconomic fundamentals, at least in the short and medium term. This disconnection leads to a three-part puzzle regarding exchange rate levels, exchange rate volatility and purchasing power parity (PPP). However, he argued, to abandon macrofundamentals would be to throw the baby outwith the bath water. There are clear reasons why many researchers have not been able to produce good forecasting results: a failure to properly capturethe underlying data generation dynamics, parsimony and error correction. MacDonald provided evidence that a forecast produced by a properly specifi ed vector error correction model outperforms all benchmarks. The volatility puzzle is not as clear-cut as many economists believe, and there is empirical evidence and theoretical work which suggests that macrofundamentals can explain the volatility of exchange rates both inter- and intra-regime. The PPP puzzle suggests that PPP is not a good way of defi ning an equilibrium exchange rate. But empirical work suggests that meaningful equilibrium relationships do exist for real exchange rates in terms of macroeconomic fundamentals. Various approaches have exploited this information to produce measures of equilibrium and misalignment. MacDonald concluded that the future of exchange rate economics is bright and macrofundamentals will be on board.
Martin Evans, Georgetown University, emphasized that even in a microstructure approach, there is a role for macrofundamentals. According to his research, transaction fl ows in foreign exchange (FOREX) markets may convey fundamental information on the future evolution of macroeconomic variables – information that is not available from other sources (e.g. asset prices, interest rates or survey data). Market participants’ information is heterogeneous and incomplete, and it takes time to spread it. FOREX order fl ows aggregate dispersed microinformation about the macroeconomy and convey it to market participants. Therefore, order fl ows account for much of the variation of spot exchange rates. While collecting transaction data is becoming easier, interpreting the data from limit order markets requires care. Evans concluded that the current challenge is to combine order fl ow and macrodata so that real-time macroinformation can be effi ciently extracted. The ensuing discussion concentrated on the possible use of FOREX order fl ows for forecasting. In response to a question, Evans pointed out that the Lucas critique, which holds that a forecast could break down if too many policymakers exploit it – is, to some degree, justifi ed: Once knowledge of order fl ows becomes public property instead of being disseminated slowly, forecasting ability becomes blunted.
László Halpern, Deputy Director of the Hungarian Academy of Sciences, drew the audience’s attention to the purchasing power parity puzzle and its possible explanations. Given that there is a lack of strong evidence even for long-run determination of the exchange rate by using the purchasing power parity (PPP), he concluded that PPP concepts needed to be redesigned using nonlinear and panel techniques and taking into account sectoral heterogeneity in adjustment. Moreover, a theoretical confl ict arises in a new open economy macroeconomics framework (NOEM), since with imperfect substitution and nominal rigidities a violation of PPP is a necessary condition. Halpern went on to conclude that the new challenge from trade theory is the diffi culty of reconciling empirical facts about the Balassa-Samuelson effect with NOEM.

Currency and CompetitivenessThe OeNB’s Conference on European Economic Integration 2007
Focus 2/07 ◊ ceec.oenb.at 129
Furthermore, this effect is theoretically a short- or medium-term catching-up phenomenon, but appears to be staying quite long. As a promising path for future research, Halpern outlined the extension of NOEM by new trade theories.
Catching Up and Exchange Rate AppreciationSession 2 focused on the drivers of exchange rate appreciation in catching-up economies. Balázs Égert,Session 2 focused on the drivers of exchange rate appreciation in catching-up
Balázs Égert,Session 2 focused on the drivers of exchange rate appreciation in catching-up
OECD (and formerly OeNB), spoke about the determinants of infl ation rates in Europe. He started by addressing the Balassa-Samuelson puzzle, i.e. the fact that the size of the Balassa-Samuelson effect reported in the literature is small despite the large productivity gains observed in the tradable sector. Égert pointed out four reasons for explaining the puzzle: reported in the literature is small despite the large productivity gains observed in the tradable sector. Égert pointed out four reasons for explaining the puzzle: reported in the literature is small despite the large productivity gains observed
(1) the large dispersion of productivity gains within the manufacturing sector, (2) incomplete wage equalization between the tradable and nontradable sectors, (3) substantial productivity gains in the nontradable sector, and (4) the low share of market nontradables in the CPI basket. Using yearly panel data for a set of 11 euro area countries and 10 CEE countries for the period from 1996 (1999) to 2005, Égert shows that the Balassa-Samuelson effect does not have set of 11 euro area countries and 10 CEE countries for the period from 1996 (1999) to 2005, Égert shows that the Balassa-Samuelson effect does not have set of 11 euro area countries and 10 CEE countries for the period from 1996
an impact on the infl ation rate. At the same time, there was evidence in favor of other structural factors. Most importantly, Égert found that cyclical and an impact on the infl ation rate. At the same time, there was evidence in favor of other structural factors. Most importantly, Égert found that cyclical and an impact on the infl ation rate. At the same time, there was evidence in favor
external factors are important drivers of infl ation rates in Europe.Jirí Podpiera,ˇí Podpiera,ˇ Ceská národní banka, presented the results of a joint paper
with Jan Bruha on the role of investments into product quality. Podpiera also referred to the Balassa-Samuelson puzzle in the context of the appreciation of the real exchange rate on the basis of tradable goods prices. Podpiera maintained that improvements of product quality, leading to price increases, can serve as a plausible explanation of this puzzle. This view is supported also by a shift to high-tech products and massive FDI infl ows, as well as know-how transfers observed in CESEE over the past decade. Picking up on recent empirical fi ndings, Podpiera also emphasized the role of an extension of product variety (for a given product quality) for price increases. Implementing a general equilibrium model, extended for this quality effect, the authors forecast a continued real exchange rate appreciation for various CESEE Member States. Furthermore, the authors conclude that quality improvements will likely complicate the fulfi llment of the Maastricht infl ation criterion under stable exchange rates.
The third speaker, Enrique Alberola, Banco de España, provided an assessment of the sustainability of external positions in CESEE Member States and the role of the exchange rate in sustainability. Alberola pointed out the puzzling positive relationship between net foreign liabilities and real appreciation in the these new Member States over the past decade. He attributed this positive relationship to the productivity-enhancing effect of debt infl ows, which generated real appreciation without endangering competitiveness, the favorable valuation effects of appreciation on the net foreign position in some countries, and the fact that the cost of debt hasbeen lower than the return from debt in most CESEE Member States. Notwithstanding this benign assessment, Alberola alluded to the trend of several of those countries’ current account balances to deteriorate as a result of

Currency and CompetitivenessThe OeNB’s Conference on European Economic Integration 2007
130 ceec.oenb.at ◊ Focus 2/07
excessive domestic demand and the increasing burden on net foreign positions. Against this background, he underlined the importance of maintaining fi nancing fl ows, which in turn hinges on the success of sustainable real and nominal convergence. In this process, exchange rate appreciation may help relieve demand pressures and infl ationary pressures.
In concluding the session, György Szapáry, former deputy governor of Magyar Nemzeti Bank, stressed the role of rapid domestic credit extension to the private sector for the creation of domestic demand pressures, which may then translate into external and internal imbalances. Moreover, he cautioned that part of this credit had not been used for productive purposes.
Preparing for the Euro: Lessons Learned andChallenges AheadPanel discussion 1, chaired by Sir Samuel Brittan, Financial Times, focused on selected countries’ experience with euro adoption. Two of the countries represented (Cyprus, Malta) intended to adopt the euro on January 1, 2008, whereas Slovakia’s entry to the euro area was planned for 2009.
Athanasios Orphanides, Governor of the Central Bank of Cyprus, fi rst gave a short overview of recent economic developments in Cyprus, stressing the crucial role of the country’s credible fi xed exchange rate regime in achieving and maintaining price stability. At the same time, he identifi ed the close monitoring of monetary aggregates (mainly credit to the private sector) and the current account defi cit as the main pillars of successful monetary policy in Cyprus. As past key challenges on the road to the euro, he cited the implementation of EU accession-related reforms, the abolition of interest rate ceilings, the reform of monetary policy instruments and the gradual liberalization of capital movements, inducing signifi cant capital infl ows that brought the exchange rate under pressure. As the main challenges ahead, Orphanides named the easing of monetary conditions resulting from the convergence of interest rates and reserve requirements upon euro adoption, as well as infl ationary expectations, i.e. concerns about euro-related price increases.
Michael C. Bonello, Governor of the Central Bank of Malta, outlined Malta’s recent economic development, pinpointing the large public sector, capital controls, lack of central bank independence and structural rigidities (mainly labor market) as the major defi ciencies of the Maltese economy in the late 1990s. Additionally, the country had been severely hit by two external shocks in tourism and the electronics sector at the beginning of the millennium. Not only did this lead to an economic slowdown, but it also adversely infl uenced preparations for EU membership. Thus, enhancing economic growth, strengthening external competitiveness, fi scal consolidation and structural reforms were on the top of the agenda. The central bank has committed itself to pursue a fi xed exchange rate policy and to promote further reforms in the fi nancial sector (alignment with EU norms, sequenced capital account liberalization). In the meantime, the government has adopted a fi scal consolidation program aimed at reducing the budget defi cit to below 3% of GDP by 2006 and has implemented structural reforms (e.g. pension reform, downsizing of the public sector) to enhance competition, effi ciency and

Currency and CompetitivenessThe OeNB’s Conference on European Economic Integration 2007
Focus 2/07 ◊ ceec.oenb.at 131
fl exibility. According to Bonello, the main lessons from the Maltese experience are the importance of a shared vision between the government and the central bank on policy objectives, a credible commitment to joining the European Exchange Rate Mechanism (ERM II) and a clear target date for euro adoption.
Ivan Šramko,adoption.
Ivan Šramko,adoption.
Governor of the National Bank of Slovakia, presented Slovakia’s euro adoption strategy, which was approved back in 2003. In 2004, the government set the year 2009 as the target date for euro area entry, and the national euro changeover plan was adopted in 2005 (updated in 2007). Three in-depth impact analyses were carried out in 2006, confi rming that the benefi ts of euro adoption for the Slovak economy, population and business sector will outstrip the estimated costs (e.g. technical costs of currency changeover, banking sector losses, likelihood of moderately higher infl ation). Šramko noted outstrip the estimated costs (e.g. technical costs of currency changeover, banking sector losses, likelihood of moderately higher infl ation). Šramko noted outstrip the estimated costs (e.g. technical costs of currency changeover,
that Slovakia currently fulfi lled all Maastricht criteria except the public defi cit benchmark. He predicted, however, that the general government budget defi cit would fall below the reference value by year-end 2007 – even including the full costs of pension reform – and mapped ongoing fi scal consolidation for the years 2008 and 2009. He also stressed the sustainability of low infl ation in Slovakia for at least the upcoming two years and underscored that no artifi cial measures (e.g. decrease in indirect taxes, regulated price freezes) were being taken to keep infl ation at low levels in the run-up to euro adoption. While drawing attention to exchange rate developments (pronounced nominal appreciation based on strong fundamentals), Šramko stressed that Slovakia’s drawing attention to exchange rate developments (pronounced nominal appreciation based on strong fundamentals), Šramko stressed that Slovakia’s drawing attention to exchange rate developments (pronounced nominal
euro adoption served as a precedent, since Slovakia will be the fi rst CESEE Member State to adopt the euro after having operated a freely fl oating exchange rate regime for many years. For Slovakia, Šramko sees the main challenges for Member State to adopt the euro after having operated a freely fl oating exchange rate regime for many years. For Slovakia, Šramko sees the main challenges for Member State to adopt the euro after having operated a freely fl oating exchange
euro adoption in the problem of the impossible trinity, the shooting a moving target problem and the Balassa-Samuelson effect.
The fi nal panelist, Servaas Deroose, European Commission, discussed euro introduction in the CESEE Member States, underscoring that the Treaty on European Union represents a rule-based framework, but offers leeway for the CESEE Member States in calibrating their convergence path. In this context, he added that there is no one-size-fi ts-all policy framework for euro adoption, given the differences in initial monetary and exchange rate regimes of fixers(EE, LV, LT, and BG) and floaters (CZ, PL, HU, RO); Slovakia in ERM II represents an intermediate group. The challenges for convergence – especially for the fi xers – include high infl ation, rising external imbalances and rapid credit growth. Accordingly, the fi xers should urgently address the emerging overheating pressures by mobilizing all available domestic instruments under the constraints of a fi xed exchange rate regime, while the fl oaters should step up fi scal consolidation and structural reforms, and should address emerging fi nancial imbalances.
Exchange Rates and Central Bank Policy in East AsiaIn his dinner speech, Hans Genberg, Executive Director (Research) of the Hong Kong Monetary Authority, referred to the issue of global imbalances from an Asian perspective. According to his fi rst proposition, the focus on exchange rates should be deemphasized in multilateral policy surveillance in favor of

Currency and CompetitivenessThe OeNB’s Conference on European Economic Integration 2007
132 ceec.oenb.at ◊ Focus 2/07
fundamental monetary and fi scal policies. Focusing on the exchange rate does not help rebalance current accounts for three reasons: First, exchange rate changes have weak effects on current accounts. Second, exchange rates are not policy instruments. Direct infl uence on intertemporal decisions such as saving and investment, which are refl ected in the current account, are more effective. Third, exchange rates should be determined by market forces. This would support Genberg’s second proposition, which holds that policy strategies in East Asia are increasingly centered on domestic issues. Infl ation targeting is taking hold, and exchange rate coordination is losing ground. The only areas where Genberg sees a need for regional cooperation is in achieving more liquid markets and fi nancial liberalization.
Exchange Rates Are not Decisive for CompetitivenessThe second day started with the opening statement of Josef Christl, OeNB Executive Director. While acknowledging that exchange rates are an important indicator in evaluating a country’s competitive position, Christl highlighted the importance of other factors for competitiveness, like unit labor costs, sectoral and regional trade structures, quality and technological upgrading of production and location factors, such as tax systems. He presented the CESEE Member States as evidence of his statement, pointing out their experience with real appreciation coupled with substantial gains in international market shares. Referring to the recently observed appreciation of the euro, Christl refused proposals to explicitly include exchange rate considerations in the monetary strategy of the ECB. According to Christl, the strong euro dampens infl ationary pressure and thereby increases real income. It also acts as an incentive for export-oriented industries to increase their productivity. Thus, a strong currency can have positive effects in the short as well as in the long run.
The Euro and the Real Economy: A Policy Issue?The session started with Lorenzo Bini Smaghi, ECB Executive Board member, discussing the issue of real and nominal convergence in the European Union with a special focus on the CESEE Member States. He posed the questions of whether nominal and real convergence can take place at the same time, of what the challenges in this respect are and of how monetary, fi scal and structural policies can best tackle them. Real convergence of a catching-up economy may entail a higher return on capital for some time and a substantial appreciation of the real exchange rate. Within a monetary union or with a fi xed exchange rate system, the appreciation of the real exchange rate may take place through a higher infl ation rate. This may fuel infl ationary spirals, entailing overshooting of infl ation and boom-and-bust cycles. In a context like this, nominal convergence is not consistent with the continuation of real convergence. Such a development, however, can be avoided by increasing wage and price fl exibility, by fostering structural adjustment and by further investment in human capital. He concluded that by pursuing a prudent and well targeted macroeconomic policy, nominal and real convergence can go hand in hand.
Jean Pisany-Ferry, director of the Brussels-based think tank BRUEGEL, in his presentation focused on the growth effects of the euro. So far, he stated,

Currency and CompetitivenessThe OeNB’s Conference on European Economic Integration 2007
Focus 2/07 ◊ ceec.oenb.at 133
there is evidence that the introduction of the euro has had positive effects on trade, FDI and fi nancial integration. The evidence of the impact on growth, however, is mixed. Basically, the euro may contribute to growth by enhancing the quality of macroeconomic policies, providing incentives for reforms and mitigating divergences within Monetary Union. EMU increases macro-economic stability by providing a reliable, well-targeted monetary policy. A stable economic environment in turn is known to support growth. However, the loss of the exchange rate as a policy instrument may entail some costs. Concerning the incentives for reforms, Pisany-Ferry argued that the effects of the euro are likely to be uneven. The fi scal constraints imposed by the Stability and Growth Pact may induce structural reforms. The rewards of such measures, however, are only likely to occur in the medium to long run. This may prevent governments with a short time horizon from taking appropriate action, as it is usually associated with political costs. Pisany-Ferry made several proposals to strengthen the incentives for reforms. For instance, he advocated the introduction of peer pressure measures to foster policy learning (independent assessment and benchmarking, surveillance) or to highlight the tradeoffs between structural reforms, budgetary adjustment and monetary conditions. Finally, EMU seems to have helped moderate the dispersion of growth rates within the euro area. However, no fi nal scientifi c agreement has been reached about what the sources of this development are.
International Competitiveness:Are Exchange Rates still Signifi cant?Session 4 was chaired by Doris Ritzberger-Grünwald, Head of the Foreign Research Division of the OeNB. The session tried to shed light on the question of whether exchange rates are still a decisive feature in evaluating a country’s competitive position.
Julia Wörz, The Vienna Institute for International Economic Studies (wiiw), elaborated on structural aspects of competitiveness in different country groups. After defi ning the concept of competitiveness, she gave an overview of different indicators of competitiveness and their evolution. She fi rst showed that the new EU Member States and the fi rst and second tier of Asian tigers are especially open economies and that their export structure is very much characterized by trade in goods, as opposed to more advanced economies, which seem to export relatively more services. Wörz then went on to demonstrate that emerging market economies are lagging behind in terms of locational features, like the ease of doing business or governance indicators. However, this lag does not have an impact on these countries’ export performance. Apparently, the competitiveness of these regions is determined mainly by structural features, like industry and the product composition of exports. She further showed that the determinants of competitiveness are different for trade in goods and trade in services. Cost factors (unit labor costs and labor productivity) play a stronger role for goods, while soft factors appear to be more important for services. Also, the general export orientation matters strongly.
The dynamics of product quality were addressed in the second presentation, delivered by Deniz Igan, IMF, who focused on the question of why international

Currency and CompetitivenessThe OeNB’s Conference on European Economic Integration 2007
134 ceec.oenb.at ◊ Focus 2/07
market shares of CESEE Member States increased in the past decade during a period of real appreciation. The explanation for this puzzle lies in technological and quality upgrading. As these countries moved from low- to high-tech products and increased in quality as measured by unit value ratios, they were able to sell their products at higher prices and still remain competitive. The increases in market shares partly also refl ected favorable initial conditions, such as low international market penetration, skilled human capital and locational advantages due to the proximity of rich European markets. Igan’s analysis further showed that catching-up countries tend to benefi t more from increases in unit value ratios of exports than developed nations do. However, it also became clear that real appreciation has a comparatively stronger impact on catching-up nations. As quality upgrading shows decreasing returns, in the future it will become increasingly diffi cult for CEECs to maintain and improve their competitive position, Igan concluded.
The discussant Michael Peneder, Austrian Institute for Economic Research (WIFO), noted that both presentations shared a focus on trade while overlooking productivity. However, according to Peneder, an exhaustive analysis of competitiveness should always elaborate on both of these factors. Referring to the second presentation, he also noted that technological and quality advances should not be seen as separate, as the two largely go hand in hand. In the ensuing discussion, questions related to perceptions of quality and to whether an increase in unit value ratios indicates a general improvement in quality rather than clever branding and marketing strategies. Further issues were the extent to which export-oriented companies in Eastern Europe can decide on the quality and technological composition of their production, as they are largely foreign owned and as such decisions are usually taken at headquarters.
How Do Central Banks and Foreign ExchangeTraders Interact?Session 5 was chaired by István Pal Székely, European Commission. The fi rst presentation on communication and exchange rate policy by Marcel Fratzscher,ECB, focused on two issues. Fratzscher pointed out that fi rst, a regime change in monetary strategy and instruments took place in the 1990s. The U.S.A. and the euro area have moved away from an actual intervention policy and have shifted to oral intervention policies to communicate the policy stance on the exchange rate. Second, from a backward-looking perspective, the effectiveness of exchange policy (actual and oral communication) was assessed. It was concluded that both forms of intervention (actual and oral) are generally effective. Furthermore, interventions are even more effective if there is e.g. some policy coordination across and within countries and if the exchange rate and monetary policy move in the same direction.
In the second presentation, Áron Gerebenand monetary policy move in the same direction.
Áron Gerebenand monetary policy move in the same direction.
of Magyar Nemzeti Bank (MNB) elaborated on the use of the microstructure approach to foreign exchange markets in a central bank. He emphasized that learning about the exchange rate is highly important for the MNB against the background of Hungary’s status as an emerging market and a small open economy with a mixed monetary regime and plans to enter ERM II in the foreseeable future. Putting the focus

Currency and CompetitivenessThe OeNB’s Conference on European Economic Integration 2007
Focus 2/07 ◊ ceec.oenb.at 135
on microstructural data was motivated by the observation of some comovements of fi nancial fl ows with the exchange rate, leading to the empirical analysis of the relationship between customer order fl ow and the Hungarian forint exchange rate. The analysis showed that customer order fl ow was able to explain a signifi cant part of the fl uctuation of the exchange rate of the Hungarian forint to the euro. Furthermore, foreign clients and the central bank appear to have the role of push customers (positive correlation of order fl ow with the exchange rate), whereas domestic clients are the pull customers (negative correlation of order fl ow with the exchange rate).
Discussant Antonio Scalia, Banca d’Italia, commended the data sets used by the presenters but also raised some open issues. In the case of the fi rst paper, he argued that the environment (and therefore the effectiveness of intervention) had changed, considering the growth of FOREX market turnover, the higher international diversifi cation by asset managers or the role of hedge funds. Referring to the second paper, Scalia questioned the forecasting power of order fl ow.
Presentation of the Olga Radzyner andFranz Weninger AwardsThe afternoon on the second day was opened by OeNB Executive Director Josef Christl, who presented the winners of two awards, the Olga RadzynerAward and the Award and the Award Franz Weninger Award, which the Oesterreichische Nationalbankbestows each year on young researchers in the fi eld of economics. From among the numerous submissions from seven CESEE countries, the jury decided to confer the Olga Radzyner Award on Béla Szörfi , Kopint-Tárki Economic Research Institute, Budapest, for his master’s thesis on “Development and Regional Disparities,” to Jan Bruha and Jirí Podpiera, Ceská národní banka, for their joint paper on “Transition Economy Convergence in a Two Country Model: Implications for Monetary Integration,” to Anna Lipinska, a Polish economist at the Bank of England, for her research paper on “The Maastricht Convergence Criteria and Optimal Monetary Policy for the EMU Accession Countries” and fi nally to Rosen Stoyanov Marinov, a Bulgarian expert from the IMF offi ce in Geneva, for his work on “Competitive Pressure in Transition: A Role for Trade and Competition Policies?” The Franz Weninger Award, which is granted for outstanding master’s and doctoral theses at Austrian universities in the fi eld of monetary theory and monetary policy, went to Robert Hierländer, University of Vienna, for his master’s thesis on “Monetary Theory and Policy in Closed and Open Economies: A New Keynesian Approach” and to Karin Lang, Innsbruck University, for her master’s thesis “Analyse von Arbitragegelegenheiten im Bereich der Kapitalstruktur eines Unternehmens.”
Financial Integration and Exchange Rate ArrangementsGraciela L. Kaminsky, George Washington University, delivered the third keynote lecture. She introduced her speech by pointing out that the U.S. subprime mortgage crisis has refocused public attention on the threats of fi nancial integration, particularly in emerging markets, and has revived old discussions on the role of the exchange rate regime. Subsequently, she provided evidence that in the wake of fi nancial integration, also a large number of

Currency and CompetitivenessThe OeNB’s Conference on European Economic Integration 2007
136 ceec.oenb.at ◊ Focus 2/07
developing countries had deregulated their fi nancial markets and had opened up to procyclical capital fl ows. While in developed countries procyclical fi nancial fl ows only lead to larger booms, in developing countries they exacerbate both booms and busts. Moreover, the problem appears to be compounded in countries with fi xed exchange rate arrangements, as many such countries resort to sterilization to prevent infl ation and thus trigger even larger capital infl ows. In addition, empirical evidence suggests that fi xed exchange rate regimes may also fuel dollarization and portfolio imbalances. Kaminsky formulated the hypothesis that fi xed exchange rate regimes may be self-destructive in the sense that governments peg to minimize the impact of liability dollarization, but that fi xing triggers even more liability dollarization and overall fi nancial fragility. The implication of these stylized facts is that countries have increasingly moved toward more fl exible exchange rate regimes, which, however, have to be accompanied by a new anchor, such as infl ation targeting, to establish credibility. Alternatively, monetary unifi cation similar to EMU might be an option for some regions. However, Kaminsky emphasized that a monetary union was certainly not a remedy that would fi x problems immediately and that it required more than mere exchange rate fi xing. The ensuing discussion centered on the recently improved fi scal performance in Latin America and the shift toward U.S. dollar-denominated loans.
Do Exchange Rates Matter in Corporate Decision Making?The closing panel discussion was chaired by Reinhard Göweil, business editor at the Austrian newspaper Kurier. The panel was formed of selected representatives from the industry and fi nance sectors. Wolfgang Reithofer, CEO of Wienerberger AG (a global market leader in brick production), pointed out that company strategy should not be predominantly determined by exchange rate risks. In the case of Wienerberger AG, currency risks are considered in the valuation process of potential acquisitions, its fi nancing and the intragroup dividend policy. In addition, the money transaction risk is limited due to local nature of the brick business and low volume of cross-border deliveries. The more important accounting risk, which arises because individual fi nancial statements of local companies are drawn up in local currency, should be controlled by a concept of balancing foreign currency assets and liabilities and thereby reducing equity fl uctuation. Reithofer concluded that the impact of currency risk should be monitored; however, the strategy and investment options taken should be determined by industrial factors.
Peter Kuchner, a former CEO and troubleshooter in the machinery business, claimed that competitiveness was only marginally infl uenced by exchange rates. According to Kuchner, an innovative product, good quality and excellent service are the most important factors to compete successfully. Therefore, he emphasized the need for highly skilled labor. He cited the excellent products offered by Austrian banks as ways to cover exchange rate risks. Although these risks represent a chance to make profi ts, the development of core trade was more important, noted Kuchner. Hence, profi ts from foreign exchange speculation should be strictly separated from profi ts made on core business. Finally, Kuchner noted that a stable home currency, secured not least by the

Currency and CompetitivenessThe OeNB’s Conference on European Economic Integration 2007
Focus 2/07 ◊ ceec.oenb.at 137
Oesterreichische Nationalbank, was a crucial condition for small and medium-sized enterprises (SMEs).
Veronika Lammer, Head of Group Research at Erste Bank, focused on hedging exchange rate risks. She considered liabilities, receivables, the cross-correlation between currencies, the timing of cash fl ows with different currencies as well as the price sensitivity of goods to exchange rate fl uctuations as potential risk factors. Additionally, she pointed out the importance of net currency risk and that the infl uence of these fl uctuations on profi ts, not on sales, should be considered. Not only do defi ned rules for hedging, especially if it is only occasionally or partly, help to reduce the currency risk, a different fi nancing strategy can also diminish that risk. Lammer fi nished her presentation by introducing different hedging products, their preferred application area as well as their pros and cons.
The last panelist, Holger Schmiedling, chief economist for Europe at the Bank of America, affi rmed that exchange rates matter in corporate decision-making. The rising degree of openness in global business, as well as the globalization of production and demand, are major trends he identifi ed in relation to currency threats. Furthermore, an environment of low, stable infl ation reduces the risk of currency crisis and helps emerging markets to catch up. He also remarked that exchange rates matter more to countries than to global companies that establish hedges by sourcing their production in different countries. Therefore, these companies worry less about short-term fl uctuations and align their strategies to fundamental values and implied long term impacts. The following discussion focused on the impact of euro introduction on the Austrian business environment. The panelists agreed that competition had increased due to better comparability, but admitted that the benefi ts of the euro outweighed its drawbacks.
Concluding RemarksIn his concluding remarks, OeNB Executive Director Josef Christl expressed Josef Christl expressed Josef Christlhis appreciation for the interesting and stimulating lectures and presentations held during the two days of the conference and for the fruitful exchange of ideas. Summarizing the highlights, Christl pointed out that a wide range of global and regional issues dealing with the external value of currencies had been covered. He drew special attention to the development of the catching-up CESEE economies and the further convergence challenges each of them have to tackle. Finally, he also acknowledged the achievements of Cyprus and Malta, which at the time were about to join the euro area (January 1, 2008). At the same time, he identifi ed future tasks for potential candidates. In addition to the ground covered on the relevance of exchange rates in corporate decision making, the established fi ndings and new questions raised during the conference may serve as a source for future research, concluded Christl.

138 ceec.oenb.at ◊ Focus 2/07
The “East Jour Fixe”of the Oesterreichische Nationalbank
60th East Jour Fixe
Central and Eastern Europe:Is Economic Convergence on Track?The East Jour Fixe of the Oesterreichische Nationalbank (OeNB) was initiated in 1991 as a forum in which central bankers, government offi cials, members of academia and other experts on Central and Eastern Europe meet to discuss specifi c transition issues. On June 22, 2007, the OeNB hosted the 60th East Jour Fixe in this series on the topic of “Central and Eastern Europe: Is Economic Convergence on Track?” The jour fi xe was organized as a joint event with this year’s SUERF Annual Lecture given by Paul De Grauwe and entitled “Problems and Prospects for Enlargement of the Eurozone.”
In the introduction, Peter Mooslechner, Director of the OeNB’s Economic Analysis and Research Department, stated that economic convergence was key to spreading prosperity across countries and societies. Convergence has, moreover, gained added prominence in the European debate in the context of monetary integration, as according to the Treaty establishing the European Community euro area entry presupposes a high degree of sustainable convergence.
Peter Mooslechner recalled that the concept of convergence had a number of well-known – but not always precisely defi ned – dimensions. Real con-vergence is often understood as per capita income convergence, which is one of the most common measures of living standards around the world. Structural convergence is usually associated with a congruence of the broad economic structures of countries and some degree of business cycle synchronization. It is also closely related to competitiveness, as a country’s resources are shifted to their most productive uses in the process of convergence. Accordingly, total structural convergence is neither feasible nor desirable. In contrast, nominal convergence tends to be understood – especially in the European debate – as the fulfi lment of the Maastricht convergence criteria on prices, interest rates, exchange rates and public fi nances. Finally, institutional and legal convergence should be mentioned as further dimensions of convergence, as they are also prerequisites for joining the European Union and subsequently the single currency area.
In concluding, Peter Mooslechner pointed out that the EU had been a “convergence club” for income convergence progress in the EU’s youngest Member States since the mid-1990s, especially following their accession to the EU; and more recently also for progress in Southeastern European candidate and potential candidate countries. However, some differences between Member States remain, mostly because of persisting differences in economic structures and in fi scal policies.
The topic of “Real Convergence in Central and Eastern Europe” was presented by Gábor Oblath, Member of the Monetary Council of Magyar Nemzeti Bank and Professor at Budapest’s Corvinus University. Reviewing various interpretations of real convergence, Oblath indicated that the Central and Eastern European countries (CEECs) had shown absolute convergence to the real GDP per capita level of the EU-15 since the mid-1990s. However, the
Focus 2/07 ◊ ceec.oenb.at 139
question whether developing countries are indeed catching up with more advanced economies depends on the method of measurement employed. Using the measures of “GDP per total hours worked” or “GDP per person employed” rather than “GDP per capita” (at PPS) makes it possible to take account of the differences in labor intensity and utilization, which appear to be signifi cant. Furthermore, Oblath proposes to use real gross domestic income (RGDI), which corrects output for the impact of changes in the terms of trade (implicit income transfers to/from the rest of the world). Differences between RGDI and GDP growth have been observed especially in the case of Romania, Bulgaria, the Czech Republic, and Lithuania – in other words, the GDP measure underestimates the extent of the convergence progress especially in their case.
Oblath summed up the convergence process of Central and Eastern Europe as follows: After a decline of performance between 1989 and 1994 (trans for-mation recession), the second half of the decade brought clear progress in catching up especially for small countries, thanks to well-timed stabilization and liberalization measures, which in turn fostered FDI and export-led growth.
However, as Gábor Oblath argued, there is no unique real convergence path for CEECs. As developments have so far shown, countries can be successful in catching up despite differences in macroeconomic or structural policies and/or a different behavior in the private sector. In respect to macroeconomic policies, Poland experienced excessive monetary tightening, while Hungary witnessed excessive fi scal loosening in the fi rst decade of the new millennium. Both developments harmed real convergence. In the Baltic countries, con-tinuously high credit growth increased vulnerability. Regarding reforms, Slovakia implemented signifi cant tax cuts (in the context of introducing a fl at tax regime) combined with substantial structural reforms in other areas, while Slovenia kept high taxes and undertook only piecemeal and gradual reforms. Concerning wages and prices, Slovakia, unlike Slovenia, had a very low relative price and wage level, but both countries’ recent performance and their outlooks are sound. Oblath concluded by calling for further examinations of “stylized facts” in order to better understand recent developments in real convergence.
The second lecture was held by Michael Landesmann, Director of Research at the Vienna Institute for International Economic Studies (wiiw) and Professor at the University of Linz, on the topic of “Competitiveness and the Structural Convergence in Central and Eastern Europe.” The aggregate picture for the EU-27 he sketched shows a progressive development toward absolute conver-gence, implying productivity level convergence (supply side) and convergence of demand structures. However, the analysis of real convergence inevitably directs the attention to the structural features of catching up, e.g. to changes in output and employment structures. A U-shaped curve of employment shows that during the catching-up process, the employment rate seemed to decline, due to the strong presence of sectors with declining output shares and strong productivity catching up. But over time this trend was reversed through the increasing weight of sectors with strong output growth and lower catching up in productivity. Indeed, it is noticeable that employment in the agricultural sector progressively declined between 1995 and 2005, while the service sector
The “East Jour Fixe”of the Oesterreichische Nationalbank

The “East Jour Fixe”of the Oesterreichische Nationalbank
140 ceec.oenb.at ◊ Focus 2/07
substantially gained in employment. Convergence is also observable through increased wage productivity dynamics and hence changing patterns of inter-national specialization along comparative advantage patterns. The dynamic of productivity growth is uneven across industries, whereas wages grow much more uniformly across industries.
To a large extent, structural changes are also the result of FDI infl ows, which have raised the prominence of CEECs in international trade. Employment also shifted from low-skill sectors to medium-high- and high-skill sectors, which in turn puts pressure on catching-up economies to upgrade skills. Demand for high-skill labor thus rises, resulting in labor supply adjustments in terms of educational choices, and international and national migration fl ows. The risk for the EU-15 is that education and skill levels stagnate, thus exposing “old” Member States increasingly to competition from new Member States.
Landesmann concluded that regional homogeneity and thus full structural convergence could not be expected in the future.
Andrzej Slawinski, Member of the Monetary Policy Council (MPC) of Narodowy Bank Polski (NBP) and Professor at the Warsaw School of Economics, provided an analysis of nominal convergence, focusing on the case of Poland from the angle of monetary policymaking.
As seen by Andrzej Slawinski, monetary policy is essentially about central banks meeting their own commitments. Between 1990 and 1991, the NBP made the commitment to achieve a stable exchange rate; from 1992–1998 it used a crawling peg and then a crawling band; in 1999, it shifted toward infl ation targeting; and in 2000, it eventually fl oated the złoty. The sustainability of the initial exchange rate-based monetary policy strategy was undermined by fi nancial market developments (the emergence of a derivatives market). Soon after the move toward a looser exchange rate regime the economy faced negative supply shocks (a sharp rise in oil and food prices), so monetary policy was tightened in order to preserve the central bank’s credibility. The rise in interest rates triggered a sharp appreciation of the złoty, though, which in turn exacerbated the economic slowdown that had already set in. Yet the fl oating rate confi rmed its reputation of being a shock provider rather than a shock absorber. In the years following the introduction of a fl oating currency, infl ation was reduced through the economic slowdown and positive supply shocks. In 2003, the NBP introduced a permanent infl ation target. In 2004, a sharp rise in oil prices and EU accession caused the CPI to bounce back, forcing the MPC to raise interest rates in order to prevent second round effects – despite a signifi cant level of unemployment. Between 1999 and 2004 the złoty fl uctuated strongly and was largely disconnected from fundamentals. The volatility of the złoty’s exchange rate to the euro to a considerable extent refl ected movements in USD/EUR exchange rates before foreign exchange dealers started using the euro instead of U.S. dollars as the transaction currency. When they switched to the euro, the złoty’s volatility against the euro moderated signifi cantly. The moderation was also the result of nominal convergence, i.e. shrinking interest rate differentials, which reduced incentives for short-term capital infl ows. After 2004, the złoty moderately appreciated in line with the Balassa-Samuelson effect, because of the reduced country risk

The “East Jour Fixe”of the Oesterreichische Nationalbank
Focus 2/07 ◊ ceec.oenb.at 141
thanks to EU membership and due to the increased demand for Polish exports. This moderate appreciation, in turn, helped control infl ation.
Slawinski concluded that the disinfl ation process in Poland was over, thanks to a committed central bank and thanks to the damping effects of globalization. In his opinion, nominal convergence should not be challenging for the Czech Republic, Hungary and Poland; furthermore he argued that the Baltic states should have been allowed to join the euro area since they had disinfl ated their economies and fulfi lled the fi scal criteria. Moreover, as Slawinski argued, hard peg regimes had turned out to be a “long and risky shortcut” to the euro area, due to the Balassa-Samuelson effect but also due to the procyclical properties of such exchange rate regimes. The threats to preserving nominal convergence are credit booms and expansive fi scal policies, while the task to fulfi l the Maastricht long-term interest rate criterion has effectively been “outsourced” to the bond markets.
In the following SUERF Annual Lecture, Professor Paul De Grauwe, Katholieke Universiteit Leuven, spoke about “Problems and Prospects for Enlargement of the Eurozone.” Building upon arguments from the theory of Optimal Currency Areas (OCA), De Grauwe argued that in terms of trade integration, many of the new Member States fi tted better into the euro area than some of the existing euro area countries; by contrast, they were subject to more asymmetric shocks. Since the EU-27 does currently not form an OCA, widening the euro area to 27 member countries would amplify already existing economic divergence within the euro area and thus create tensions within the euro area which cannot be solved by the ECB’s single monetary policy. Already among the present group of euro area countries, there are persistent economic imbalances, which, according to De Grauwe, call for monetary union eventually to be supplemented with political union. At the same time, the larger the EU, the more diffi cult political union will be to achieve. In the vivid ensuing discussion, this rather bleak view was challenged by some, pointing out, for instance, that Germany’s current recovery showed that adjustment of the real exchange rate through wages and prices, while being slow, could work effectively over the medium run. Contrary to De Grauwe, Executive Director Josef Christl from the OeNB argued that the Maastricht convergence criteria were a suitable proxy for assessing a country’s readiness to join the euro area.

142 ceec.oenb.at ◊ Focus 2/07
Olga Radzyner Award for Scientific Workon European Economic Integration
The Oesterreichische Nationalbank has established an award to commemorate Olga Radzyner, former Head of the Foreign Research Division, who died in a tragic accident in August 1999. The award is bestowed on young economists for excellent research focused on topics of European economic integration and is conferred annually. In 2008, four applicants are eligible to receive a single payment of EUR 3,000 each from an annual total of EUR 12,000.
The submitted work shall be in the form of a master’s or doctoral thesis, a working paper or a scientifi c article, and shall be in English or in German. Authors shall submit the work before their 35th birthday and shall be citizens of any of the following countries: Albania, Bosnia and Herzegovina, Bulgaria, Croatia, the Czech Republic, Estonia, the FYR of Macedonia, Hungary, Latvia, Lithuania, Poland, Romania, Serbia and Montenegro, Slovakia or Slovenia.
To identify their work as a submission, applicants shall mark the envelope with the reference “Olga Radzyner Award” and send it to the Oesterreichische Nationalbank, Foreign Research Division, Otto-Wagner-Platz 3, PO Box 61, 1011 Vienna, Austria. The Oesterreichische Nationalbank shall receive the work submitted for the award in 2008 by October 8, 2008, at the latest.
For detailed information, please visit our website at http://ceec.oenb.at or contact Ms. Eva Gehringer-Wasserbauer in the Foreign Research Division of the Oesterreichische Nationalbank either by e-mail ([email protected]) or by phone (+43-1-40420-5205).

S t a t i s t i c a l A n n e x

144 ceec.oenb.at ◊ Focus 2/07
Statistical Annex
Table A1
Gross Domestic Product
Annual real change in %
2000 2001 2002 2003 2004 2005 2006
Albania 6.7 7.9 4.2 5.8 5.7 5.8 4.9Bosnia and Herzegovina 5.5 4.5 5.5 3.0 6.3 4.3 6.2Republic of Macedonia 4.5 –4.5 0.9 2.8 4.1 4.1 3.1Serbia 4.5 4.8 4.2 2.5 8.4 6.2 5.7Montenegro x –0.2 1.7 2.4 4.2 4.0 6.5Ukraine 5.9 9.2 5.2 9.6 12.1 2.7 7.1
Source: wiiw.
Table A2
Industrial Production
Annual real change in %
2000 2001 2002 2003 2004 2005 2006
Albania 1.3 6.1 –5.1 29.0 14.1 2.5 0.3Bosnia and Herzegovina 7.9 4.9 5.7 5.1 12.1 10.8 11.5Republic of Macedonia 3.0 –2.9 –4.8 4.1 –2.2 7.1 2.5Serbia 11.4 0.1 1.8 –3.0 7.1 0.8 4.7Montenegro 4.2 –0.7 0.6 2.4 13.8 –1.9 1.0Ukraine 13.2 14.3 7.0 15.8 12.5 3.1 6.2
Source: wiiw.
Table A3
Average Gross Wages
Annual change in %
2000 2001 2002 2003 2004 2005 2006
Albania 17.7 15.1 14.2 8.5 14.4 9.9 7.5Bosnia and Herzegovina1 7.9 4.9 5.7 5.1 12.1 10.8 11.5Republic of Macedonia x -0.4 6.4 4.9 4.1 2.7 8.0Serbia 90.7 128.8 52.6 25.3 23.7 24.1 24.4Montenegro x 16.8 42.6 7.8 11.7 7.8 15.6Ukraine 29.6 35.2 21.0 22.8 27.6 36.7 29.2
Source: wiiw.1 Net wages.
Table A4
Unemployment Rate
End of period, %
2000 2001 2002 2003 2004 2005 2006
Albania1 16.8 16.4 15.8 15.0 14.4 14.1 13.6Bosnia and Herzegovina1 39.7 40.3 40.9 42.0 43.2 44.2 44.8Republic of Macedonia2 32.3 30.5 31.9 36.7 37.2 37.3 36.0Serbia2 12.1 12.2 13.3 14.6 18.5 20.8 20.9Montenegro2 19.3 23.7 20.7 22.7 27.7 30.3 29.6Ukraine2 11.6 10.9 9.6 9.1 8.6 7.2 6.8
Source: wiiw.1 Registered, end of period.2 Labor force survey, period average.
í

Statistical Annex
Focus 2/07 ◊ ceec.oenb.at 145
Table A5
Industrial Producer Price Index
Period average, annual change in %
2000 2001 2002 2003 2004 2005 2006
Albania1 6.5 –7.2 5.1 1.8 12.2 4.9 0.7Bosnia and Herzegovina2 –0.1 3.9 –0.3 –0.1 2.3 –0.6 3.4Republic of Macedonia 10.7 2.0 –0.9 –0.3 0.9 3.2 4.5Serbia 102.6 87.7 8.8 4.6 9.1 14.2 13.3Montenegro x x 14.5 4.5 5.8 2.1 3.6Ukraine 20.8 8.7 3.0 7.6 20.5 16.7 9.6
Source: wiiw, national sources.1 Manufacturing industry.2 Federation of Bosnia and Herzegovina.
Table A6
Consumer Price Index
Period average, annual change in %
2000 2001 2002 2003 2004 2005 2006
Albania 0.1 3.1 5.2 2.2 3.0 2.4 2.4Bosnia and Herzegovina 4.9 3.2 1.3 1.1 0.8 3.0 7.2Republic of Macedonia 5.8 5.5 1.8 1.2 –0.4 0.5 3.2Serbia 79.6 93.3 16.6 9.9 11.4 16.2 11.6Montenegro 20.2 21.8 16.0 6.7 2.4 2.3 3.0Ukraine 28.2 12.0 0.8 5.2 9.0 13.5 9.1
Source: wiiw.
Table A7
Trade Balance
% of annual GDP
2000 2001 2002 2003 2004 2005 2006
Albania –22.7 –25.3 –25.9 –23.3 –21.7 –22.4 –23.0Bosnia and Herzegovina –53.8 –93.7 –54.5 –53.9 –49.1 –49.7 –37.2Republic Macedonia –19.2 –15.3 –21.3 –18.3 –20.7 –18.2 –20.7Serbia –6.5 –19.5 –20.4 –19.8 –26.4 –20.2 –19.6Montenegro x –39.2 –32.6 –25.8 –25.2 –28.8 –46.9Ukraine 2.5 0.5 1.7 1.0 5.8 –1.3 –4.9
Source: National central banks, wiiw.
Table A8
Current Account Balance
% of annual GDP
2000 2001 2002 2003 2004 2005 2006
Albania –4.7 –7.0 –9.0 –6.6 –4.9 –7.5 –7.3Bosnia and Herzegovina –7.8 –14.1 –19.1 –20.9 –17.9 –19.8 –10.7Republic of Macedonia –2.0 –7.1 –9.5 –3.2 –7.7 –1.4 –0.4Serbia –0.6 –2.4 –7.9 –7.0 –11.7 –8.5 –11.5Montenegro x –15.7 –12.6 –7.3 –7.2 –8.6 –29.4Ukraine 4.7 3.7 7.5 5.8 10.6 2.9 –1.5
Source: wiiw.

Statistical Annex
146 ceec.oenb.at ◊ Focus 2/07
Table A9
Net FDI Infl ows
% of annual GDP
2000 2001 2002 2003 2004 2005 2006
Albania 4.0 5.1 3.0 3.1 4.5 3.4 3.4Bosnia and Herzegovina 2.9 2.2 4.3 4.9 6.6 4.8 3.5Republic of Macedonia 4.9 12.8 2.1 2.1 2.9 1.7 5.6Serbia 0.2 1.4 3.0 6.7 3.9 5.9 13.8Montenegro x 0.9 6.9 2.8 3.1 21.4 24.2Ukraine 1.9 2.0 1.6 2.8 2.6 8.7 5.0
Source: wiiw.
Table A10
Reserve Assets Excluding Gold
End of period, % of annual GDP
2000 2001 2002 2003 2004 2005 2006
Albania 16.7 18.1 18.8 18.0 18.5 17.1 18.5Bosnia and Herzegovina 10.5 24.4 23.6 25.3 28.1 27.0 33.9Republic of Macedonia 12.0 21.7 19.0 19.4 16.9 21.9 28.8Serbia 7.0 9.5 14.2 17.3 18.3 25.0 36.1Montenegro x x x x x x xUkraine 4.3 7.8 9.9 13.3 14.6 22.0 20.5
Source: wiiw, IMF.
Table A11
Gross External Debt
End of period, % of annual GDP
2000 2001 2002 2003 2004 2005 2006
Albania 32.1 28.9 25.3 22.0 20.8 20.9 19.8Bosnia and Herzegovina1 37.9 38.1 33.4 29.9 25.5 25.6 21.3Republic of Macedonia 42.7 44.2 39.3 35.9 35.3 41.2 36.9Serbia 44.1 95.6 64.0 60.3 52.5 61.9 58.9Montenegro x x 68.7 33.2 29.6 28.8 26.1Ukraine 37.7 32.5 27.3 42.9 43.1 48.5 48.8
Source: wiiw.1 Gross external public debt.
Table A12
General Government Balance
% of GDP
2000 2001 2002 2003 2004 2005 2006
Albania –7.5 –6.9 –6.0 –4.9 –5.1 –3.4 –3.2Bosnia and Herzegovina –6.5 –3.3 –0.1 0.8 1.6 2.4 2.9Republic of Macedonia 2.3 –6.3 –5.0 –1.1 0.0 0.3 –0.6Serbia x –1.5 –3.3 –4.0 –1.4 1.4 –0.6Montenegro –6.0 –3.1 –2.8 –3.1 –2.0 –1.7 1.8Ukraine 0.6 –0.3 0.7 –0.2 –3.2 –1.8 –0.7
Source: wiiw.

Statistical Annex
Focus 2/07 ◊ ceec.oenb.at 147
Table A13
Gross General Government Debt
% of annual GDP
2000 2001 2002 2003 2004 2005 2006
Albania 71.1 66.6 65.3 61.7 56.6 56.7 55.7Bosnia and Herzegovina 37.9 38.1 33.4 27.7 25.5 25.6 21.3Republic of Macedonia 53.2 51.6 48.7 45.0 43.8 48.5 41.5Serbia x x 80.6 70.9 56.7 52.9 34.9Montenegro x x 88.3 51.1 44.9 40.4 35.6Ukraine 45.9 36.9 33.5 29.3 36.4 19.7 16.5
Source: EBRD, European Commission.
Table A14
Broad Money
End of period, annual nominal change in %
2000 2001 2002 2003 2004 2005 2006
Albania (M2) 12.0 13.1 12.2 7.6 8.2 11.7 7.6Bosnia and Herzegovina (M2) 14.0 31.4 66.7 4.8 21.0 17.6 21.6Republic of Macedonia 24.5 64.0 –9.3 18.0 17.0 15.9 24.6Serbia (M3) 58.5 67.6 73.4 29.1 31.2 39.1 37.9Montenegro (M21) x x x -0.3 10.6 58.7 82.9Ukraine 46.1 41.9 41.8 46.5 32.4 54.3 34.5
Source: European Commission, wiiw.
Tabke A15
Offi cial Key Interest Rate
End of period, %
2000 2001 2002 2003 2004 2005 2006
Albania (refi nancing base rate) 10.8 7.0 8.5 6.5 5.3 5.0 5.5Bosnia and Herzegovina1 x x x x x x xRepublic of Macedonia (discount rate) 7.90 10.70 10.70 6.50 6.50 6.50 6.50Serbia (discount rate) 26.34 16.43 9.50 9.00 8.50 8.50 8.50Montenegro2 x x x x x x xUkraine (refi nancing rate)3 29.00 12.50 7.00 7.00 9.00 9.50 8.50
Source: Eurostat, Bloomberg, wiiw, IMF.1 Currency board.2 Unilateral euroization.3 Average.
Table A16
Exchange Rate
Period average, national currency per EUR
2000 2001 2002 2003 2004 2005 2006
Albania 132.58 128.47 132.36 137.51 127.67 124.19 123.08Bosnia and Herzegovina 1.96 1.96 1.96 1.96 1.96 1.96 1.96Republic of Macedonia 60.73 60.91 60.98 61.26 61.34 61.30 61.19Serbia 15.04 59.46 60.68 65.05 72.57 82.91 84.06Montenegro x x x x x x xUkraine 5.03 4.81 5.03 6.02 6.61 6.39 6.34
Source: wiiw, national sources, Thomson Financial.


N o t e s

150 ceec.oenb.at ◊ Focus 2/07
Legend, Abbreviationsand Definitions
Legendx = No data can be indicated for technical reasons. . = Data not available at the reporting date– = The numerical value is zero or smaller than half of the unit indicated
Discrepancies may arise from rounding.
AbbreviationsATS Austrian schillingBGN Bulgarian levBIS Bank for International SettlementsBNB Bulgarian National BankBNR Banca Nat ionala a României (National Bank of Romania)BS Banka Slovenije (Bank of Slovenia)CAR capital adequacy ratioCBBH Centralna banka Bosne e Hercegovine (Central Bank of Bosnia and Herzegovina)CBCG Centralna banka Crne Gore (Central Bank of Montenegro)CBR Central Bank of the Russian FederationCEE Central and Eastern Europe(an)CEECs Central and Eastern European countriesCEEI Conference on European Economic Integration (OeNB)CESEE Central, Eastern and Southeastern Europe(an)CIS Commonwealth of Independent StatesCCIS Commonwealth of Independent StatesˇCIS Commonwealth of Independent States
NB CCIS Commonwealth of Independent States
ˇCIS Commonwealth of Independent States
eska národní banka (Czech National Bank)CPI consumer price indexCZK Czech korunaDEM German markDG ECFIN Directorate-General for Economic and Financial AffairsDOLS dynamic ordinary least squaresEBRD European Bank for Reconstruction and DevelopmentECB European Central BankEcofin Council of Economic and Finance MinistersEDP excessive deficit procedureEIB European Investment BankEME emerging market economiesEMU Economic and Monetary UnionERM (II) exchange rate mechanism (II)ESA European System of AccountsESCB European System of Central BanksEU European UnionEUR euroFDI foreign direct investment

Legend, Abbreviations and Definitions
Focus 2/07 ◊ ceec.oenb.at 151
GDP gross domestic productGFCF gross fixed capital formationGFS government finance statisticsHICP Harmonised Index of Consumer PricesHNB Hrvatska narodna banka (Croatian National Bank)HRK Croatian kunaHUF Hungarian forintHWWI Hamburgisches WeltWirtschaftsInstitutIAS International Accounting StandardsICTY International Criminal Tribunal for the Former YugoslaviaIFS international financial statistics (IMF)ILO International Labor OrganizationIMF International Monetary FundIPO initial public offeringKLR Kaminsky, Lizondo and Reinhart approach (to predicting curreny crises)LFS Labor Force SurveyMNB Magyar Nemzeti Bank (Hungary’s central bank)MPI Market Pressure IndexNBB Nationale Bank van België (Banque Nationale de Belgique)NBER National Bureau of Economic ResearchNBP Narodowy Bank Polski (National Bank of Poland)NBRM Narodna banka na Republika Makedonija (National Bank of the Republic of Macedonia)NBS Národná banka Slovenska (National Bank of Slovakia)NBS Narodna banka Srbije (National Bank of Serbia)NBU National Bank of UkraineNCB national central bankNMS new Member State(s) (EU)NPL nonperforming loanOECD Organisation for Economic Co-operation and DevelopmentOeNB Oesterreichische NationalbankOLS ordinary least squaresOSCE Organization for Security and Co-operation in EuropePLN Polish złotyPPI producer price indexPPP purchasing power parityROE return on equityRPI retail price inflationRON Romanian leuRSD Serbian dinarRUB Russian rubleSAA Stabilisation and Association Agreement SDR Special Drawing RightSEE Southeastern Europe(an)SEEMHN South East Europe Monetary History NetworkSFR Swiss francSGP Stability and Growth Pact

Legend, Abbreviations and Definitions
152 ceec.oenb.at ◊ Focus 2/07
SIT Slovenian tolarSKK Slovak korunaSME small and medium-sized enterpriseSMOPEC small open economySUERF Société Universitaire Européenne de Recherches FinancièresTCMB Türkiye Cumhuriyet Merkez Bankası (Central Bank of the Republic of Turkey)TRY Turkish liraUIP uncovered interest parityULC unit labor costsUN United NationsUSD U.S. dollarVAR vector autoregressionVAT value-added taxWIFO Österreichisches Institut für Wirtschaftsforschung –
Austrian Institute of Economic Researchwiiw Wiener Institut für internationale Wirtschaftsvergleiche –
The Vienna Institute for International Economic StudiesWTO World Trade Organization
Country CodesAL Albania AT Austria BA Bosina and HerzegovinaBE Belgium BG Bulgaria BY Belarus CY Cyprus CZ Czech Republic DE Germany DK Denmark EE Estonia ES Spain FI Finland FR France GR Greece HR Croatia HU Hungary IE Ireland IT ItalyKZ Kazakhstan LT Lithuania
LU Luxembourg LV Latvia MD Republic of MoldovaME MontenegroMK (Former Yugoslav) Republic of MacedoniaMT Malta NL Netherlands NO Norway PL Poland PT Portugal RO Romania RS Serbia RU Russian Federation SE Sweden SI Slovenia SK Slovakia TR Turkey UA Ukraine U.K. United Kingdom US U.S.A.

Legend, Abbreviations and Definitions
Focus 2/07 ◊ ceec.oenb.at 153
DefinitionsCroatia, the Republic of Macedonia and Turkey are candidate countries within
the EU enlargement process. Candidate countries are countries which have formally applied to the European Union for membership and have been offi cially recognized by the European Council as a candidate for membership. Accession negotiations with Croatia and Turkey were opened in October 2005. No date has been set yet for the opening of accession negotiations with the Republic of Macedonia.
Albania, Bosnia and Herzegovina, Montenegro and Serbia are potential EU candidate countries, i. e. countries that will become an integral part of the EU once they meet the established criteria. Western Balkan countries involved in the Stabilisation and Accession process are recognized as potential candidate countries.
154 ceec.oenb.at ◊ Focus 2/07
List of Studies and Special Reports Published inFocus on European Economic Integration1
For further details see www.oenb.at.
Issue 1/07Determinants of House Price Dynamics in Central and Eastern EuropeBalázs Égert, Dubravko MihaljekDeterminants of House Price Dynamics in Central and Eastern EuropeBalázs Égert, Dubravko MihaljekDeterminants of House Price Dynamics in Central and Eastern Europe
Are Euro Cash Holdings in Central and Eastern European Countries Driven by Experience or Anticipation? Results from an OeNB SurveyDoris Ritzberger-Grünwald, Helmut Stix
Central Bank Independence in Southeastern Europe with a View to EU Integration – RevisitedSandra Dvorsky
Are the Exchange Rates of EMU Candidate Countries Anchored by their Expected Euro Locking Rates?Anna Naszódi
Predicting Currency Crises Using the Term Structure of Relative Interest Rates: Case Studies of the Czech Republic and RussiaJesús Crespo Cuaresma, Tomáš Slacíkcíkc
The Russian Non-Fuel Sector: Signs of Dutch Disease? Evidence from EU-25 Import CompetitionStephan Barisitz, Simon-Eric Ollus
The Russian Oil Fund as a Tool of Stabilization and SterilizationVasily Astrov
1 Focus on Transition was published up to issue 2/2003 and has been replaced by Focus on European Economic Integration since issue 1/04.

Focus 2/07 ◊ ceec.oenb.at 155
Periodical Publicationsof the Oesterreichische Nationalbank
For further details see www.oenb.at
Monetary Policy & the Economy quarterly
This quarterly publication, issued both in German and English, offers analyses of current cyclical developments, medium-term macroeconomic forecasts and studies on central banking and economic policy topics. It also summarizesthe findings of macroeconomic workshops and conferences organized by the OeNB.
Statistiken – Daten & Analysen quarterly
This publication contains brief reports and analyses focusing on Austrianfinancial institutions, cross-border transactions and positions as well as financial flows. The contributions are in German, with executive summaries of the analyses in English. The statistical part covers tables and explanatory notes on a wide range of macroeconomic, financial and monetary indicators. The tables and additional information and data are also available on the OeNB’s website in both German and English. This series also includes special issues on selected statistics topics published at irregular intervals.
econ.newsletter quarterly
The quarterly English-language newsletter is published only on the Internet and informs an international readership about selected findings, research topics and activities of the OeNB’s Economic Analysis and Research Department. This publication addresses colleagues from other central banks or internationalinstitutions, economic policy researchers, decision makers and anyone with an interest in macroeconomics. Furthermore, the newsletter offers information on publications, studies or working papers as well as events (conferences, lectures and workshops).
For further details see www.oenb.at/econ.newsletter
Financial Stability Report semiannual
Issued both in German and English, the Financial Stability Report contains first, a regular analysis of Austrian and international developments with animpact on financial stability and second, studies designed to provide in-depth insights into specific topics related to financial market stability.

Periodical Publicationsof the Oesterreichische Nationalbank
156 ceec.oenb.at ◊ Focus 2/07
Focus on European Economic Integration semiannual
The English-language publication Focus on European Economic Integration is the successor publication to Focus on Transition (published up to issue 2/2003). Reflecting a strategic regional research priority of the OeNB, this publication is a channel for communicating our ongoing research on Central, Eastern and Southeastern European (CESEE) countries ranging from economic country studies to studies on central banking issues and related topics. One of the purposes of publishing theoretical and empirical studies in the Focus on European Economic Integration, which are subject to an external refereeing process, is to stimulate comments and suggestions prior to possible publication in academic journals.
Workshops – Proceedings of OeNB Workshops three to four issues a year
The Proceedings of OeNB Workshops were introduced in 2004 and typicallycomprise papers presented at OeNB workshops at which national and inter -national experts, including economists, researchers, politicians and journalists, discuss monetary and economic policy issues. Workshop proceedings are generally available in English only.
Working Papers about ten papers a year
The OeNB’s Working Paper series is designed to disseminate, and provide a Working Paper series is designed to disseminate, and provide a Working Paperplatform for discussing, findings of OeNB economists or outside contributors on topics which are of special interest to the OeNB. To ensure the high quality of their content, the contributions are subjected to an international refereeing process.
Economics Conference (Conference Proceedings) annual
The Economics Conference hosted by the OeNB represents an importantinternational platform for exchanging views and information on monetary and economic policy as well as financial market issues. It convenes central bank representatives, economic policymakers, financial market players, academics and researchers. The conference proceedings comprise all papers presented at the conference, most of them in English.
Conference on European Economic Integration(Conference Proceedings) annual
This series, published in English by a renowned international publishing house, reflects presentations made at the OeNB’s annual conference on Central,Eastern and Southeastern European issues and the ongoing EU enlargement process (formerly East-West Conference).
For further details see ceec.oenb.at

Periodical Publicationsof the Oesterreichische Nationalbank
Focus 2/07 ◊ ceec.oenb.at 157
Annual Report annual
The Annual Report of the OeNB provides a broad review of Austrian monetary policy, economic conditions, new developments in the financial markets in general and in financial market supervision in particular as well as of the OeNB’s changing responsibilities and its role as an international partner incooperation and dialogue. It also contains the OeNB’s financial statements.
Intellectual Capital Report annual
The Intellectual Capital Report is a review of the OeNB’s intellectual capital and its use in the OeNB’s business processes and services. The report clarifies the relationships between different types of human, relational, structural and innovation capital and describes various determinants that influence the OeNB’s intellectual capital. The report provides an integrated view of the OeNB and serves to assess the consistency of the OeNB’s intellectual capital with its knowledge-based strategic orientation.

158 ceec.oenb.at ◊ Focus 2/07
Addressesof the Oesterreichische Nationalbank
Postal address Telephone Telex
Head OfficeOtto-Wagner-Platz 3 PO Box 61 (+43-1) 404 20-6666 (1) 114669 natbk1090 Vienna, Austria 1011 Vienna, Austria Fax: (+43-1) 404 20-2398 (1) 114778 natbkInternet: www.oenb.atE-Mail: [email protected]
Branch OfficesWestern Austria Branch OfficeInnsbruck Innsbruck InnsbruckAdamgasse 2 Adamgasse 2 (+43-512) 594 73-06020 Innsbruck, Austria 6020 Innsbruck, Austria Fax: (+43-512) 594 73-99
Southern Austria Branch OfficeGrazBrockmanngasse 84 PO Box 8 (+43-316) 81 81 81-08018 Graz, Austria 8018 Graz, Austria Fax: (+43-316) 81 81 81-99
Klagenfurt10.-Oktober-Straße 13 10.-Oktober-Straße 13 (+43-463) 576 88-09020 Klagenfurt, Austria 9020 Klagenfurt, Austria Fax: (+43-463) 576 88-99
Northern Austria Branch OfficeLinz Coulinstraße 28 PO Box 346 (+43-732) 65 26 11-04021 Linz, Austria 4021 Linz, Austria Fax: (+43-732) 65 26 11-99
SalzburgFranz-Josef-Straße 18 Franz-Josef-Straße 18 (+43-662) 87 12 01-05027 Salzburg, Austria 5027 Salzburg, Austria Fax: (+43-662) 87 12 01-99
Representative OfficesOesterreichische Nationalbank (+44-20) 7623-6446London Representative Office Fax: (+44-20) 7623-6447Gracechurch Street 48, 5th floorEC3V 0EJ LondonUnited Kingdom
Oesterreichische Nationalbank (+1-212) 888-2334 (212) 422509 natb nyNew York Representative Office (+1-212) 888-2335745 Fifth Avenue, Suite 2005 Fax: (+1-212) 888-251510151 New York, U.S.A.
Permanent Representation of Austria to the EU (+32-2) 285 48-41, -42, -43Avenue de Cortenbergh 30 Fax: (+32-2) 285 48-481040 Brussels, Belgium
Permanent Representation of Austria to the OECD (+33-1) 53 92 23-39Rue Albéric-Magnard 3 (+33-1) 53 92 23-4475116 Paris, France Fax: (+33-1) 45 24 42-49

The English-language publication Focus on European Economic Integration is the successor publication to Focus on Transition (published up to issue 2/2003). Reflecting a strategic regional research priority of the OeNB, this publication is a channel for communicating our ongoing research on Central, Eastern and Southeastern European (CESEE) countries ranging from economic country studies to studies on central banking issues and related topics. One of the purposes of publishing theoretical and empirical studies in the Focus on European Economic Integration, which are subject to an external refereeing process, is to stimulate comments and suggestions prior to possible publication in academic journals.
Editors in chief Peter Mooslechner, Doris Ritzberger-Grünwald
General coordinator Peter Backé
Scientific coordinator Tomáš Slac ík
Manuscript editing and editorial processing Alexandra Majer, Rena Mühldorf, Irene Popenberger, Ingeborg Schuch, Susanne Steinacher
Technical production Peter Buchegger (design) Walter Grosser, Erika Gruber, Franz Pertschi, Susanne Sapik (layout, typsetting) OeNB Printing Office (printing and production)
Inquiries Oesterreichische Nationalbank, Communications Division Postal address: PO Box 61, 1011 Vienna, Austria Phone: (+43-1) 404 20-6666 Fax: (+43-1) 404 20-6698 E-mail: [email protected]
Orders/address management Oesterreichische Nationalbank, Documentation Management and Communications Services Postal address: PO Box 61, 1011 Vienna, Austria Phone: (+43-1) 404 20-2345 Fax: (+43-1) 404 20-2398 E-mail: [email protected]
Imprint Publisher and editor: Oesterreichische Nationalbank Otto-Wagner-Platz 3, 1090 Vienna, Austria Günther Thonabauer, Communications Division Internet: www.oenb.at Printed by: Oesterreichische Nationalbank, 1090 Vienna, Austria © Oesterreichische Nationalbank, 2007 All rights reserved. May be reproduced for noncommercial and educational purposes with appropriate credit.
DVR 0031577
Vienna, 2007REG.NO. AT- 000311