Embed Size (px)
Citation preview
Bankwest Future of Business:Focus on Hospitality
2018

Contents
4
5
6
7
8
9
10
11
11
12
Key insights
Focus on Hospitality
Industry overview
What's driving industry growth?
Spotlight on Australia
Spotlight on Western Australia
What does the future hold?
What challenges does the industry face?
Where do the opportunities lie?
Forecasted industry growth
3 3
Key insights
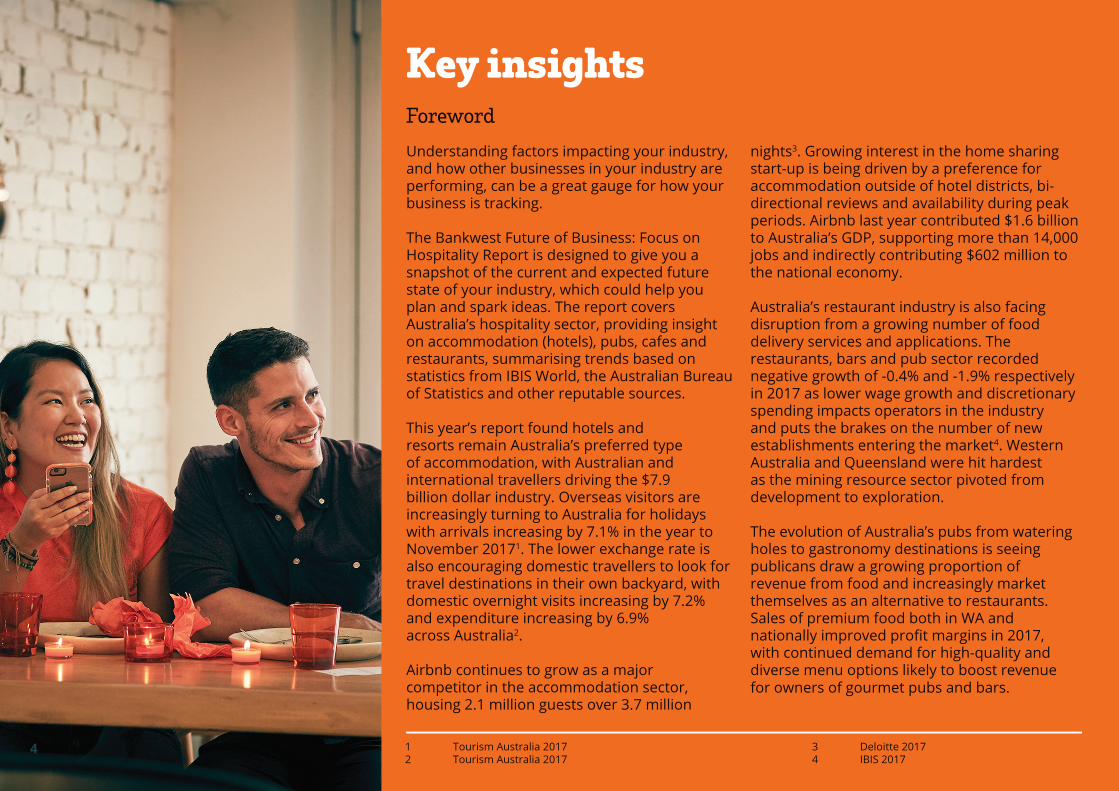
Understanding factors impacting your industry, and how other businesses in your industry are performing, can be a great gauge for how your business is tracking.
The Bankwest Future of Business: Focus on Hospitality Report is designed to give you a snapshot of the current and expected future state of your industry, which could help you plan and spark ideas. The report covers Australia’s hospitality sector, providing insight on accommodation (hotels), pubs, cafes and restaurants, summarising trends based on statistics from IBIS World, the Australian Bureau of Statistics and other reputable sources.
This year’s report found hotels and resorts remain Australia’s preferred type of accommodation, with Australian and international travellers driving the $7.9 billion dollar industry. Overseas visitors are increasingly turning to Australia for holidays with arrivals increasing by 7.1% in the year to November 20171. The lower exchange rate is also encouraging domestic travellers to look for travel destinations in their own backyard, with domestic overnight visits increasing by 7.2% and expenditure increasing by 6.9% across Australia2.
Airbnb continues to grow as a major competitor in the accommodation sector, housing 2.1 million guests over 3.7 million
nights3. Growing interest in the home sharing start-up is being driven by a preference for accommodation outside of hotel districts, bi-directional reviews and availability during peak periods. Airbnb last year contributed $1.6 billion to Australia’s GDP, supporting more than 14,000 jobs and indirectly contributing $602 million to the national economy.
Australia’s restaurant industry is also facing disruption from a growing number of food delivery services and applications. The restaurants, bars and pub sector recorded negative growth of -0.4% and -1.9% respectively in 2017 as lower wage growth and discretionary spending impacts operators in the industry and puts the brakes on the number of new establishments entering the market4. Western Australia and Queensland were hit hardest as the mining resource sector pivoted from development to exploration.
The evolution of Australia’s pubs from watering holes to gastronomy destinations is seeing publicans draw a growing proportion of revenue from food and increasingly market themselves as an alternative to restaurants. Sales of premium food both in WA and nationally improved profit margins in 2017, with continued demand for high-quality and diverse menu options likely to boost revenue for owners of gourmet pubs and bars.
Foreword
4 1 Tourism Australia 20172 Tourism Australia 2017
3 Deloitte 20174 IBIS 2017
Focus on Hospitality
90,284 889,400
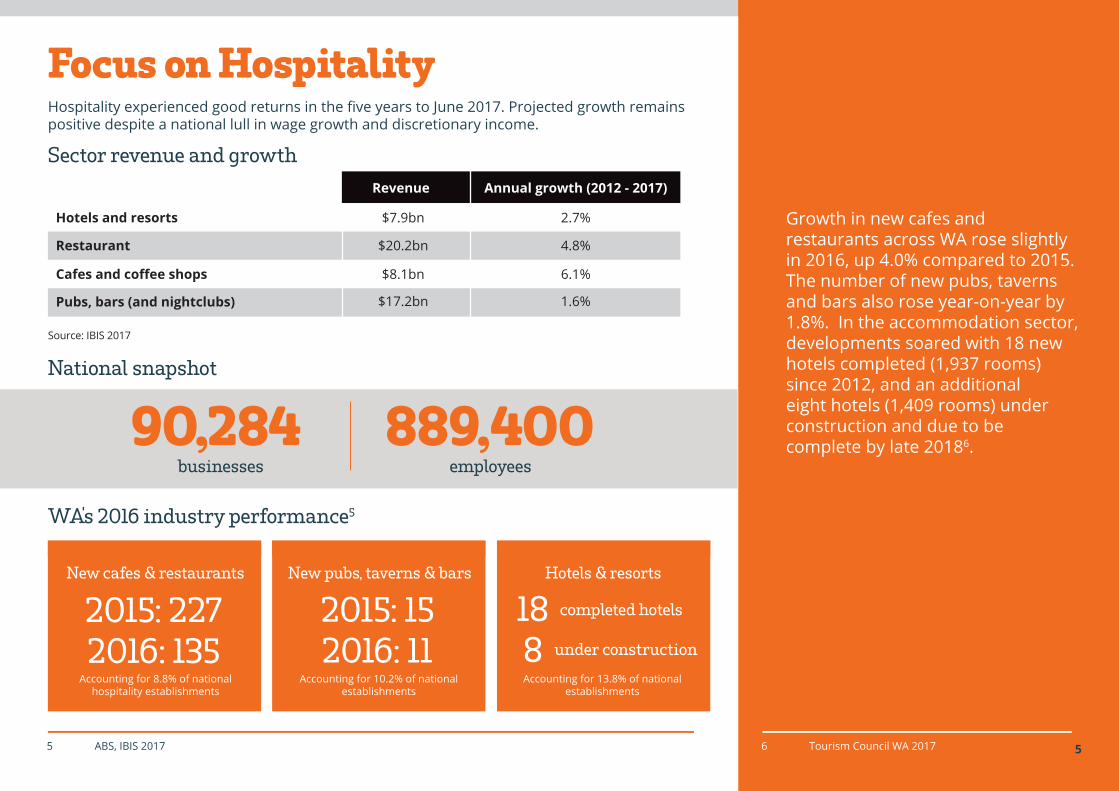
Hospitality experienced good returns in the five years to June 2017. Projected growth remains positive despite a national lull in wage growth and discretionary income.
Sector revenue and growth
National snapshot
businesses employees
WA's 2016 industry performance5
Growth in new cafes and restaurants across WA rose slightly in 2016, up 4.0% compared to 2015. The number of new pubs, taverns and bars also rose year-on-year by 1.8%. In the accommodation sector, developments soared with 18 new hotels completed (1,937 rooms) since 2012, and an additional eight hotels (1,409 rooms) under construction and due to be complete by late 20186.
Revenue Annual growth (2012 - 2017)
Hotels and resorts
Restaurant
Cafes and coffee shops
Pubs, bars (and nightclubs)
$7.9bn 2.7%
$20.2bn 4.8%
$8.1bn 6.1%
$17.2bn 1.6%
Accounting for 8.8% of national hospitality establishments
Accounting for 10.2% of national establishments
Accounting for 13.8% of national establishments
2015: 2272016: 135
2015: 152016: 11
188
New cafes & restaurants New pubs, taverns & bars Hotels & resorts
5
completed hotels
under construction
5 ABS, IBIS 2017 6 Tourism Council WA 2017
Source: IBIS 2017
6
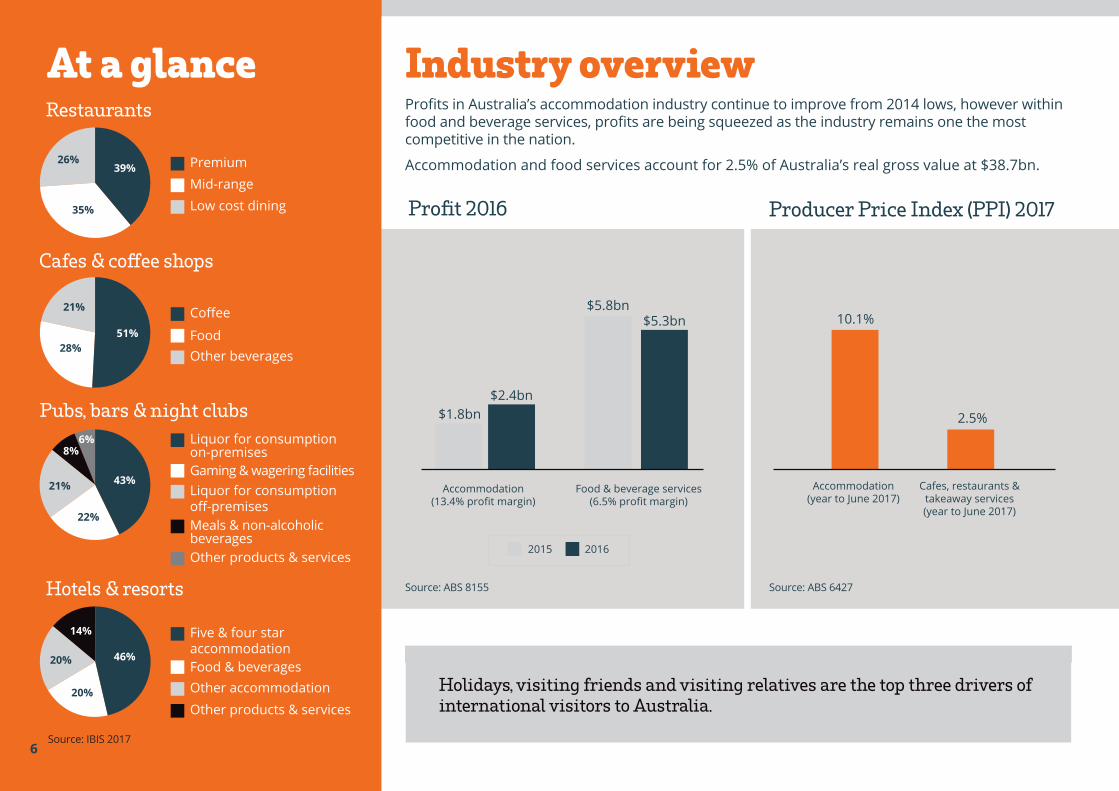
At a glance Industry overviewProfits in Australia’s accommodation industry continue to improve from 2014 lows, however within food and beverage services, profits are being squeezed as the industry remains one the most competitive in the nation.
Accommodation and food services account for 2.5% of Australia’s real gross value at $38.7bn.
Holidays, visiting friends and visiting relatives are the top three drivers of international visitors to Australia.
Producer Price Index (PPI) 2017
10.1%
2.5%
Restaurants
Premium39%26%
35%
Mid-rangeLow cost dining
51%
21%
28%
Cafes & coffee shops
Coffee
FoodOther beverages
Hotels & resorts
Five & four star accommodationFood & beveragesOther accommodationOther products & services
Profit 2016
$2.4bn
$5.8bn $5.3bn
$1.8bn
6
Accommodation(13.4% profit margin)
Accommodation(year to June 2017)
Cafes, restaurants & takeaway services(year to June 2017)
Food & beverage services(6.5% profit margin)
2015 2016
46% 20%
14%
Pubs, bars & night clubs
Liquor for consumption on-premisesGaming & wagering facilitiesLiquor for consumption off-premisesMeals & non-alcoholic beveragesOther products & services
43%
6%8%
21%
22%
20%
Source: ABS 6427Source: ABS 8155
Source: IBIS 2017
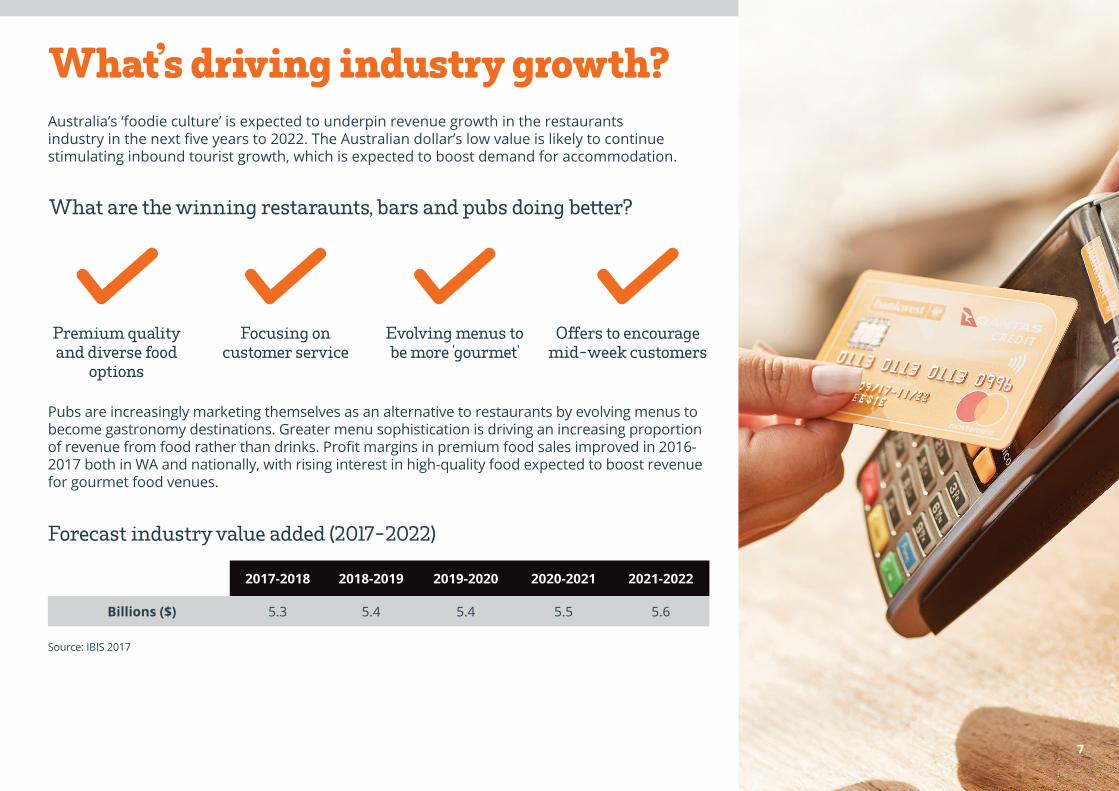
What’s driving industry growth?
Forecast industry value added (2017-2022)
7
What are the winning restaraunts, bars and pubs doing better?
Pubs are increasingly marketing themselves as an alternative to restaurants by evolving menus to become gastronomy destinations. Greater menu sophistication is driving an increasing proportion of revenue from food rather than drinks. Profit margins in premium food sales improved in 2016-2017 both in WA and nationally, with rising interest in high-quality food expected to boost revenue for gourmet food venues.
Premium quality and diverse food
options
Offers to encourage mid-week customers
Focusing on customer service
Evolving menus to be more 'gourmet'
2017-2018 2018-2019 2019-2020 2020-2021 2021-2022
Billions ($) 5.3 5.4 5.4 5.5 5.6
Australia’s ‘foodie culture’ is expected to underpin revenue growth in the restaurants industry in the next five years to 2022. The Australian dollar’s low value is likely to continue stimulating inbound tourist growth, which is expected to boost demand for accommodation.
Source: IBIS 2017
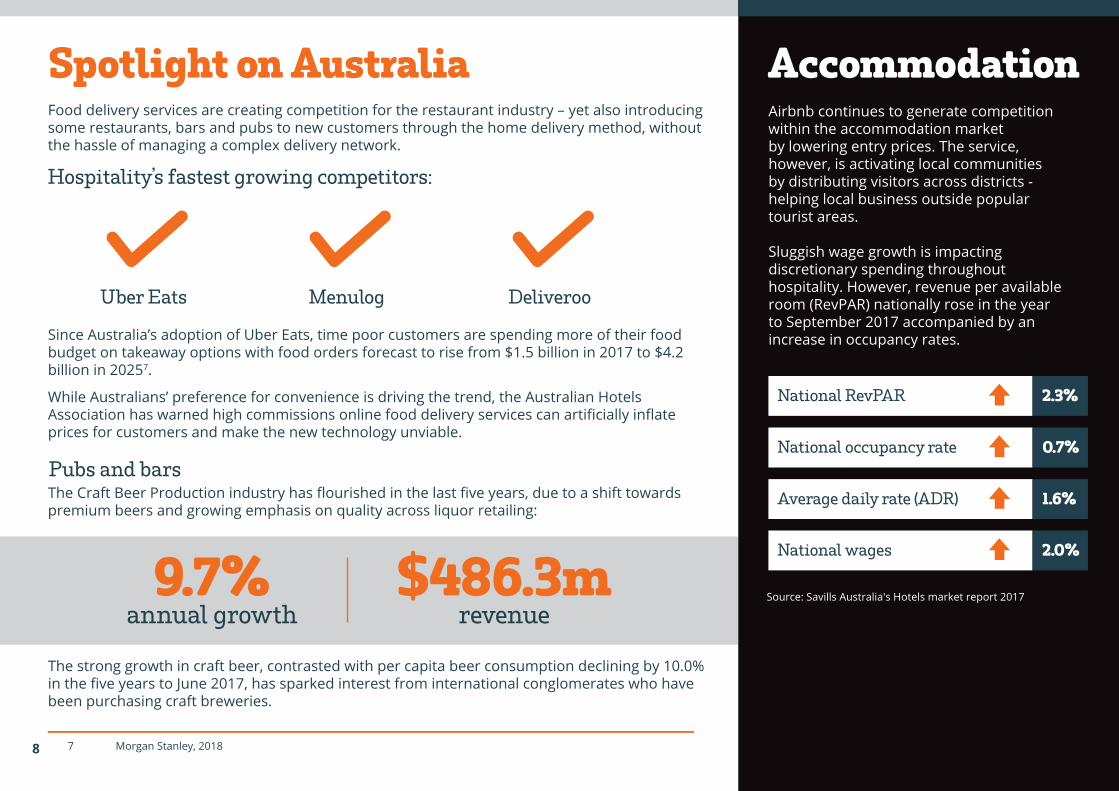
The Craft Beer Production industry has flourished in the last five years, due to a shift towards premium beers and growing emphasis on quality across liquor retailing:
The strong growth in craft beer, contrasted with per capita beer consumption declining by 10.0% in the five years to June 2017, has sparked interest from international conglomerates who have been purchasing craft breweries.
Spotlight on Australia
9.7%annual growth
$486.3mrevenue
Pubs and bars
Food delivery services are creating competition for the restaurant industry – yet also introducing some restaurants, bars and pubs to new customers through the home delivery method, without the hassle of managing a complex delivery network.
Hospitality’s fastest growing competitors:
Since Australia’s adoption of Uber Eats, time poor customers are spending more of their food budget on takeaway options with food orders forecast to rise from $1.5 billion in 2017 to $4.2 billion in 20257.
While Australians’ preference for convenience is driving the trend, the Australian Hotels Association has warned high commissions online food delivery services can artificially inflate prices for customers and make the new technology unviable.
Airbnb continues to generate competition within the accommodation market by lowering entry prices. The service, however, is activating local communities by distributing visitors across districts - helping local business outside popular tourist areas.
Sluggish wage growth is impacting discretionary spending throughout hospitality. However, revenue per available room (RevPAR) nationally rose in the year to September 2017 accompanied by an increase in occupancy rates.
Accommodation
National RevPAR
National occupancy rate
Average daily rate (ADR)
National wages
2.3%
0.7%
1.6%
2.0%
8
Uber Eats Menulog Deliveroo
7 Morgan Stanley, 2018
Source: Savills Australia's Hotels market report 2017
9
Spotlight on Western AustraliaOvernight visitors and spend by WA tourism area, 2017
Pubs, bars and restaurants
While the number of both international and domestic visitors to WA is down 0.7%, consumer expenditure is up 2.9% in the year to September 2017.
4.3%
10.9%
Visitor nights
Visits for purpose of business
The WA State Government allocated $2m in the State Budget to help fill empty rooms in Perth. The WA hotel industry mounted a campaign against Airbnb after it was found the application now
accounts for an estimated 25% of WA’s room capacity.
The economic downturn is prompting innovation and collaboration among restaurant and bar operators in Perth.
“Thursday like it’s Friday”, a $400,000 marketing campaign launched by prominent restaurant and bar operators to reinvigorate the CBD.
Many Perth hot spots have undergone refurbishments to compete with the rise of the small bar.
The State Government’s 2017 liquor licencing reform has helped facilitate the development of new small bars throughout Perth.
9
2017 spend ($m) Yearly spend increase % International % Domestic
Australia's Coral Coast 737 -8.7% 8.1% 91.9%
Experience Perth 4,163 9.1% 19.8% 80.2%
Australia's South West 1,663 4.5% 5.5% 94.5%
Australia's Golden Outback 468 -3.7% 4.8% 95.2%
Australia's North West 844 -32.6% 5.2% 94.8%
Accommodation
Source: Tourism WA
Source: Tourism WA
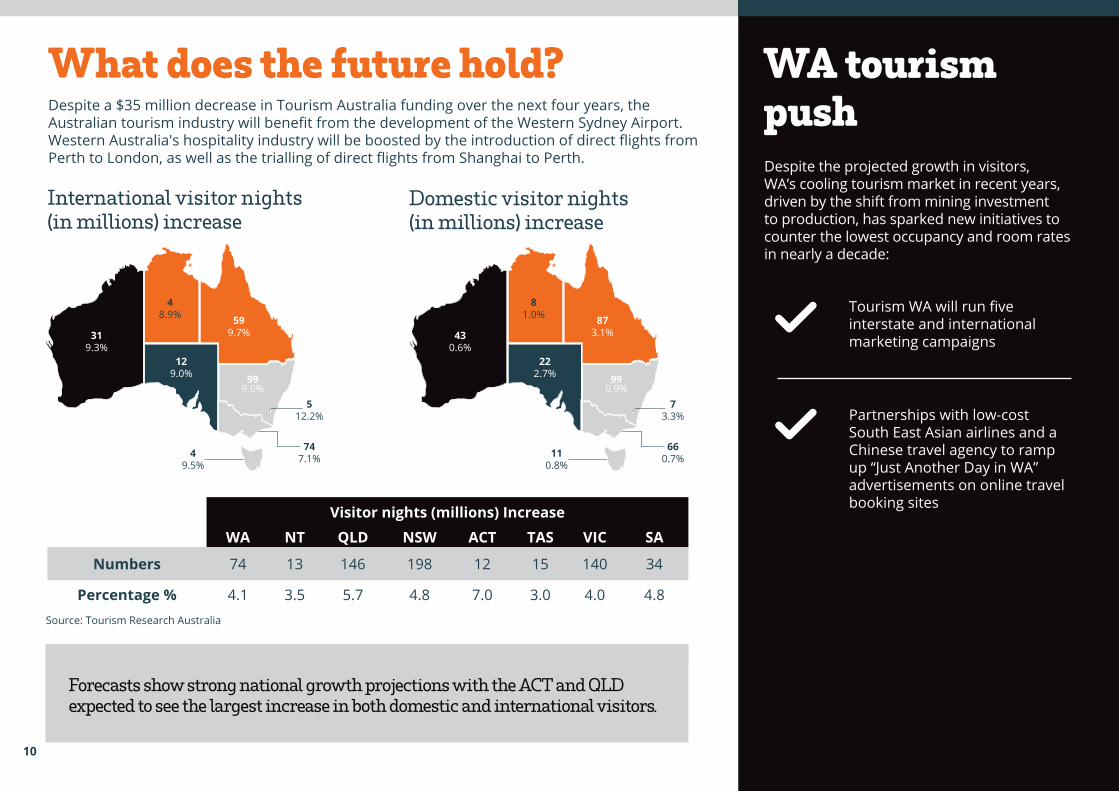
What does the future hold?
Forecasts show strong national growth projections with the ACT and QLD expected to see the largest increase in both domestic and international visitors.
Domestic visitor nights (in millions) increase
International visitor nights (in millions) increase
999.0%
990.9%
48.9%
81.0%
129.0%
222.7%
319.3%
430.6%
747.1%
660.7%
512.2%
73.3%
49.5%
110.8%
10
Despite the projected growth in visitors, WA’s cooling tourism market in recent years, driven by the shift from mining investment to production, has sparked new initiatives to counter the lowest occupancy and room rates in nearly a decade:
WA tourism push
Tourism WA will run five interstate and international marketing campaigns
Partnerships with low-cost South East Asian airlines and a Chinese travel agency to ramp up “Just Another Day in WA” advertisements on online travel booking sitesVisitor nights (millions) Increase
WA NT QLD NSW ACT TAS VIC SA
Numbers 74 13 146 198 12 15 140 34
Percentage % 4.1 3.5 5.7 4.8 7.0 3.0 4.0 4.8
Despite a $35 million decrease in Tourism Australia funding over the next four years, the Australian tourism industry will benefit from the development of the Western Sydney Airport. Western Australia's hospitality industry will be boosted by the introduction of direct flights from Perth to London, as well as the trialling of direct flights from Shanghai to Perth.
599.7%
873.1%
Source: Tourism Research Australia
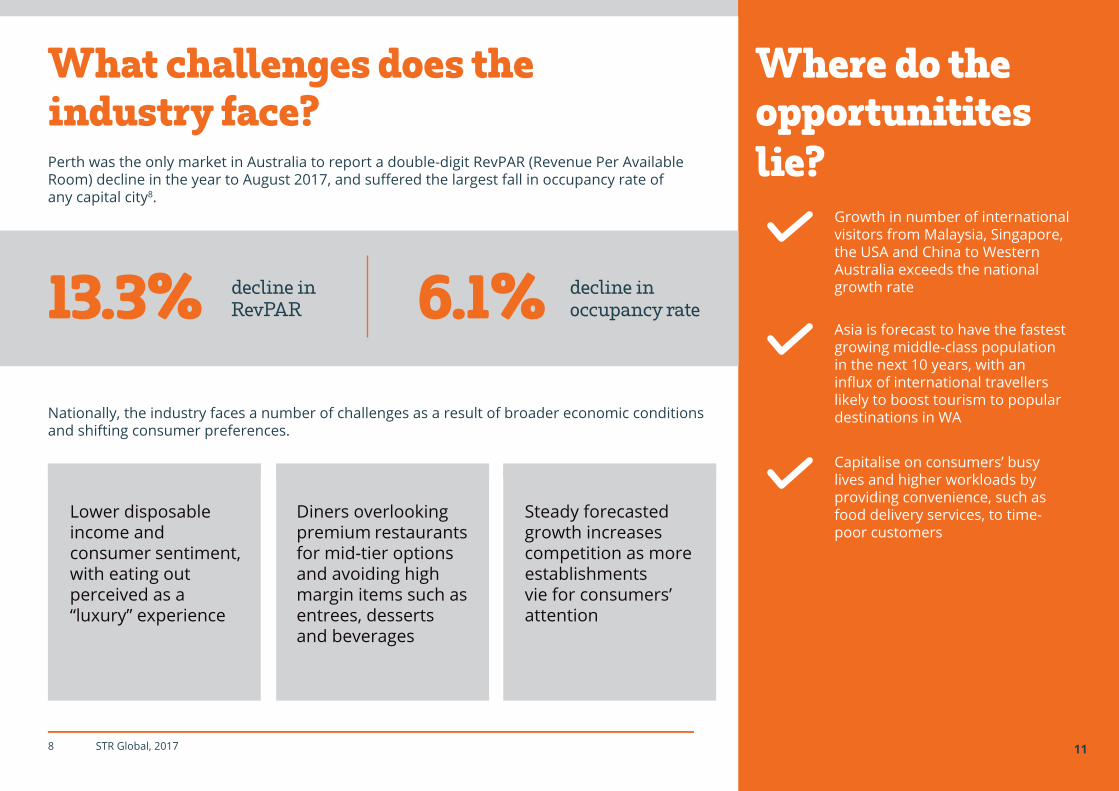
What challenges does the industry face?
Where do the opportunitites lie?Perth was the only market in Australia to report a double-digit RevPAR (Revenue Per Available
Room) decline in the year to August 2017, and suffered the largest fall in occupancy rate of any capital city8.
Nationally, the industry faces a number of challenges as a result of broader economic conditions and shifting consumer preferences.
Lower disposable income and consumer sentiment, with eating out perceived as a “luxury” experience
Diners overlooking premium restaurants for mid-tier options and avoiding high margin items such as entrees, desserts and beverages
Steady forecasted growth increases competition as more establishments vie for consumers’ attention
Growth in number of international visitors from Malaysia, Singapore, the USA and China to Western Australia exceeds the national growth rate
Asia is forecast to have the fastest growing middle-class population in the next 10 years, with an influx of international travellers likely to boost tourism to popular destinations in WA
Capitalise on consumers’ busy lives and higher workloads by providing convenience, such as food delivery services, to time-poor customers
11
13.3% 6.1% decline in occupancy rate
decline in RevPAR
8 STR Global, 2017
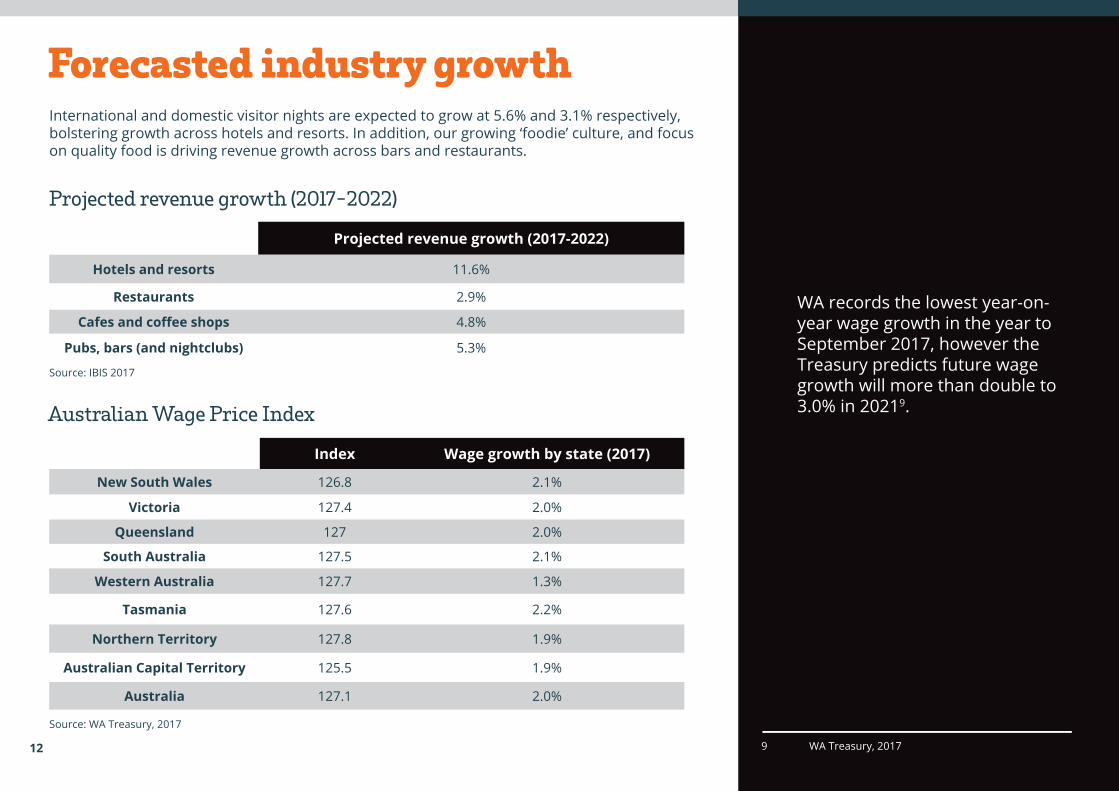
Forecasted industry growthInternational and domestic visitor nights are expected to grow at 5.6% and 3.1% respectively, bolstering growth across hotels and resorts. In addition, our growing ‘foodie’ culture, and focus on quality food is driving revenue growth across bars and restaurants.
Australian Wage Price Index
Projected revenue growth (2017-2022)
Hotels and resorts 11.6%
Restaurants 2.9%
Cafes and coffee shops 4.8%
Pubs, bars (and nightclubs) 5.3%
Index Wage growth by state (2017)
New South Wales 126.8 2.1%
Victoria 127.4 2.0%
Queensland 127 2.0%
South Australia 127.5 2.1%
Western Australia 127.7 1.3%
Tasmania 127.6 2.2%
Northern Territory 127.8 1.9%
Australian Capital Territory 125.5 1.9%
Australia 127.1 2.0%
12
Projected revenue growth (2017-2022)
WA records the lowest year-on-year wage growth in the year to September 2017, however the Treasury predicts future wage growth will more than double to 3.0% in 20219.
12
Source: IBIS 2017
Source: WA Treasury, 2017
9 WA Treasury, 2017

13
SourcesAustralian Bureau of Statistics 8155.0 (May 2017), Australian Industry, 2015-16, Mining operations, available at: http://www.abs.gov.au/AUSSTATS/[email protected]/DetailsPage/8155.02015-16 Australian Bureau of Statistics (October 2017), Producer Price Index Australia, Sep 2017, Table 20, available at:http://www.abs.gov.au/AUSSTATS/[email protected]/DetailsPage/6427.0Sep%202017
Australian Bureau of Statistics (February 2017) Counts of Australian Businesses including Entries and Exits Jun 2012- Jun 2016, Table 1, available at: http://www.abs.gov.au/AUSSTATS/[email protected]/DetailsPage/8165.0Jun%202012%20to%20Jun%202016
Australian Government- Australian Trade and Investment Commission, Why Australia Benchmark Report 2017, 2017
Australian Government Austrade, Tourism Research Australia, International Tourism Statistics, Canberra, 2017
Australian Bureau of Statistics 6345.0 (November 2017), Wage Price Index Australia, Sep 2017, available at: http://www.abs.gov.au/AUSSTATS/[email protected]/DetailsPage/6345.0Sep%202017
Angus, C. Slow wage growth, Parliament NSW, August 2017
Bankwest Curtin Economics Centre, The Impact of Airbnb on WA’s tourism industry, October 2017
Craft Beer Production in Australia, IBISWorld, September 2017
Cloutman, N. Hotels and resorts in Australia, IBISWorld, February 2017
Economic effects of Airbnb in Australia, Airbnb Australia, Deloitte, 2017
McGregor, W. Pubs, Bars and Nightclubs in Australia, IBISWorld, July 2017
Savills release Australia’s Hotels market report March 2017, The Hotel Conversation, March 2017
Tourism Council, Perth Hotel Development Report 2017 as at April 2017, 2017
Vuong, B. Restaurants in Australia, IBISWorld, October 2017
Vuong, B. Cafes and Coffee Shops in Australia, IBISWorld, October 2017
Wilkinson, J. Perth hotels get urgent marketing funds as occupancy rates dive to 67 per cent, Hotel Management, August 2017
14

15
At Bankwest, we know that Business Banking is about more than just financial solutions.
Speak to one of our Business Banking Specialists today. Call us on 13 7000.
We provide banking solutions to many of Australia’s leading businesses, including those in hospitality. Whether you require straightforward banking or a more customised solution, our team of experienced banking specialists can help.
15
16
The information contained in this report is of a general nature and is not intended to be nor should be considered as professional advice. You should not act on the basis of anything contained in this report without first obtaining specific professional advice. To the extent permitted by law, Bankwest, a division of Commonwealth Bank of Australia ABN 48 123 123 124 AFSL/Australian credit licence 234945, its related bodies corporate, employees and contractors accepts no liability or responsibility to any persons for any loss which may be incurred or suffered as a result of acting on or refraining from acting as a result of anything contained in this report.