Embed Size (px)
Citation preview
Focused Energy Report
Year - 2017
Edition - IV
Monthly Report – April 2017
Energy Desk
GAIL (India) Ltd.
1
Table of Contents
I. Energy Prices 3
II. Under-Recoveries on Petroleum Products 3
III. Country Analysis – Saudi Arabia 4
A. Energy Mix ...................................................................................................................................................... 4
B. SWOT Analysis ............................................................................................................................................... 4
C. Oil and Gas Reserves ................................................................................................................................... 5
D. Oil and Gas Infrastructure ......................................................................................................................... 6
IV. Company Analysis – Kuwait Petroleum Corporation (KPC) 7
A. Organisational Structure ............................................................................................................................ 7
B. SWOT ................................................................................................................................................................ 7
C. Operations ...................................................................................................................................................... 7
D. Strategy ............................................................................................................................................................ 8
E. Market Position ............................................................................................................................................. 9
V. LNG Industry Review 2016 10
A. Key Facts 2016 ............................................................................................................................................. 10
B. China, India and Emerging Importers Driving Demand Growth ............................................... 10
C. Spot & Short Term ..................................................................................................................................... 11
D. LNG Shipping ............................................................................................................................................... 11
E. Liquefaction Plants ..................................................................................................................................... 11
F. Regasification Terminals .......................................................................................................................... 12
VI. LNG Trade Outlook In Australia, US & Mexico 13
A. Australian LNG Export ............................................................................................................................... 13
B. MEXICO: US LNG DESTINATION ........................................................................................................... 13
2
Executive Summary
The Focused Energy Report for the month of April 2017 reviews the Energy Prices taking in consideration the
comparison with last month. There’s decrease of around 6.3 % in the WTI oil prices, the prices of natural
gas Henry Hub have increased by 15 % and crude oil prices of Brent decreased by around 5%.
The next discussion in the report is about “Saudi Arabia”. Saudi Arabia has 16% of the world's proved oil
reserves, is the largest exporter of total petroleum liquids in the world, and maintains the world's largest
crude oil production capacity. Saudi Arabia is the world's second largest holder of crude oil proved
reserves and was among the largest exporter of total petroleum liquids. In 2015, Saudi Arabia was the world's
second-largest petroleum liquids producer behind the United States and was the world's second-largest
crude oil producer behind Russia. Saudi Aramco does not operate any major functioning international
pipelines.
The analysis covers Energy Mix, SWOT Analysis, Oil and Gas Reserves and Oil and Gas Infrastructure.
In the next section “Company Analysis – Kuwait Petroleum Corporation (KPC)” is analysed. Kuwait
Petroleum Corporation (KPC) was formed in January 1980. KPC is a wholly state-owned organisation
responsible for Kuwait's oil and gas businesses. The shares of KOC, KNPC, PIC and KOTC were transferred
to the new Corporation. KPC successfully took all the oil companies under its umbrella and formed one
integrated oil industry in Kuwait. International downstream assets now comprise around 250,000b/d of
refining capacity in Europe, which includes the 75,500b/d Europort facility in Rotterdam and half of the
capacity of Eni's 300,000b/d Milazzo refinery
It covers Energy Productivity, Energy and electricity consumption, Electricity generation mix, Electric
generating, Renewable energy, Greenhouse gas emissions and Retail and wholesale power prices (2016
$/MWh)
In this section there is a discussion about “LNG Industry Review 2016”. In 2016, global LNG trade recorded a
growth rate of around 7.5% compared to 2015, returning to a robust pace experienced before 2011.
Primarily driven by new Australian volumes, additional supply was not as abundant as expected due to
production delays, slower ramp-ups and lower exports from historical suppliers. Sluggish oil prices have
continued to exert downward pressure on LNG contract prices. In the Pacific Basin, a combination of more
than adequate supply and of slow demand growth also pushed spot prices to a seven-year low. This situation
and the looming supply overhang are causing a slow-down in investment with several FIDs being cancelled or
deferred. Key Facts 2016:
• 263.6 million tons imported or a 7.5% increase vs. 2015
• 74.6 million tons traded on a spot or short term basis or 28% of total trade
• 4 New Importing Countries 11 New LNG Regasification Terminals, 39 Importing Countries
• 830 MTPA Total Regasification Capacity, 340 MTPA Total Nameplate Liquefaction Capacity
The analysis covers Key Facts 2016, China, India and Emerging Importers Driving Demand Growth, Spot &
Short Term, LNG Shipping, Liquefaction Plants and Regasification Terminals.
In the last section an analysis on “LNG Trade Outlook In Australia, US & Mexico “is covered. Despite
temporary outages at the first two trains, Train 3 of Australia’s Gorgon LNG project progressed well,
enabling an early start date. Chevron has announced that Train 3 will begin operations before the end of
March. The MANZANILLO terminal on Mexico’s Pacific Coast has become an eager customer for LNG from
the Sabine Pass plant in the United States. Moreover, trade relations are expected to deepen over the coming
months as the US continues to provide cheap and abundant LNG to the terminal. Manzanillo is importing
more and more cargoes, even though the prospects for LNG in Mexico as a whole are bleak.
The analysis covers Australian LNG Export and MEXICO: US LNG destination.
3
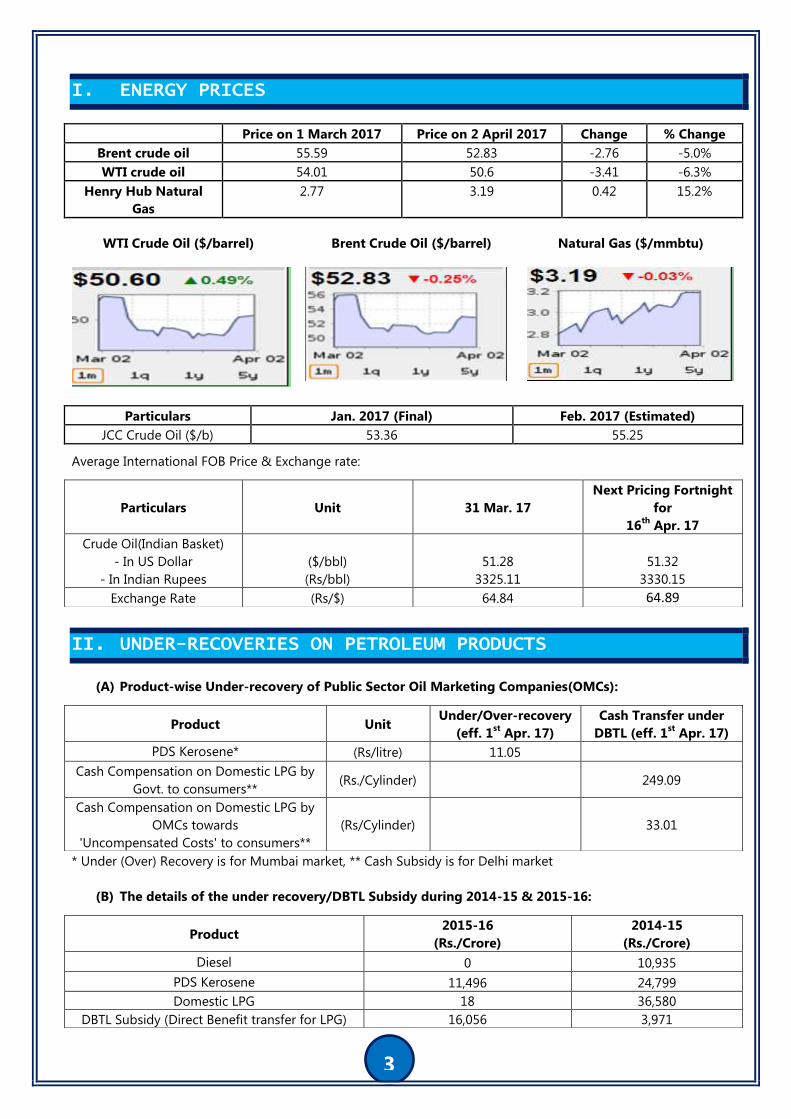
ENERGY PRICES I.
Price on 1 March 2017 Price on 2 April 2017 Change % Change
Brent crude oil 55.59 52.83 -2.76 -5.0%
WTI crude oil 54.01 50.6 -3.41 -6.3%
Henry Hub Natural
Gas
2.77 3.19 0.42 15.2%
WTI Crude Oil ($/barrel) Brent Crude Oil ($/barrel) Natural Gas ($/mmbtu)
Particulars Jan. 2017 (Final) Feb. 2017 (Estimated)
JCC Crude Oil ($/b) 53.36 55.25
Average International FOB Price & Exchange rate:
UNDER-RECOVERIES ON PETROLEUM PRODUCTS II.
(A) Product-wise Under-recovery of Public Sector Oil Marketing Companies(OMCs):
* Under (Over) Recovery is for Mumbai market, ** Cash Subsidy is for Delhi market
(B) The details of the under recovery/DBTL Subsidy during 2014-15 & 2015-16:
Particulars Unit 31 Mar. 17
Next Pricing Fortnight
for
16th
Apr. 17
Crude Oil(Indian Basket)
- In US Dollar
- In Indian Rupees
($/bbl)
(Rs/bbl)
51.28
3325.11
51.32
3330.15
Exchange Rate (Rs/$) 64.84 64.89
Product Unit Under/Over-recovery
(eff. 1st Apr. 17)
Cash Transfer under
DBTL (eff. 1st Apr. 17)
PDS Kerosene* (Rs/litre) 11.05
Cash Compensation on Domestic LPG by
Govt. to consumers** (Rs./Cylinder)
249.09
Cash Compensation on Domestic LPG by
OMCs towards
'Uncompensated Costs' to consumers**
(Rs/Cylinder) 33.01
Product 2015-16
(Rs./Crore)
2014-15
(Rs./Crore)
Diesel 0 10,935
PDS Kerosene 11,496 24,799
Domestic LPG 18 36,580
DBTL Subsidy (Direct Benefit transfer for LPG) 16,056 3,971
4
Oil 64%
Natural Gas 36%
Energy Mix 2015: Saudi Arabia
COUNTRY ANALYSIS – SAUDI ARABIA III.
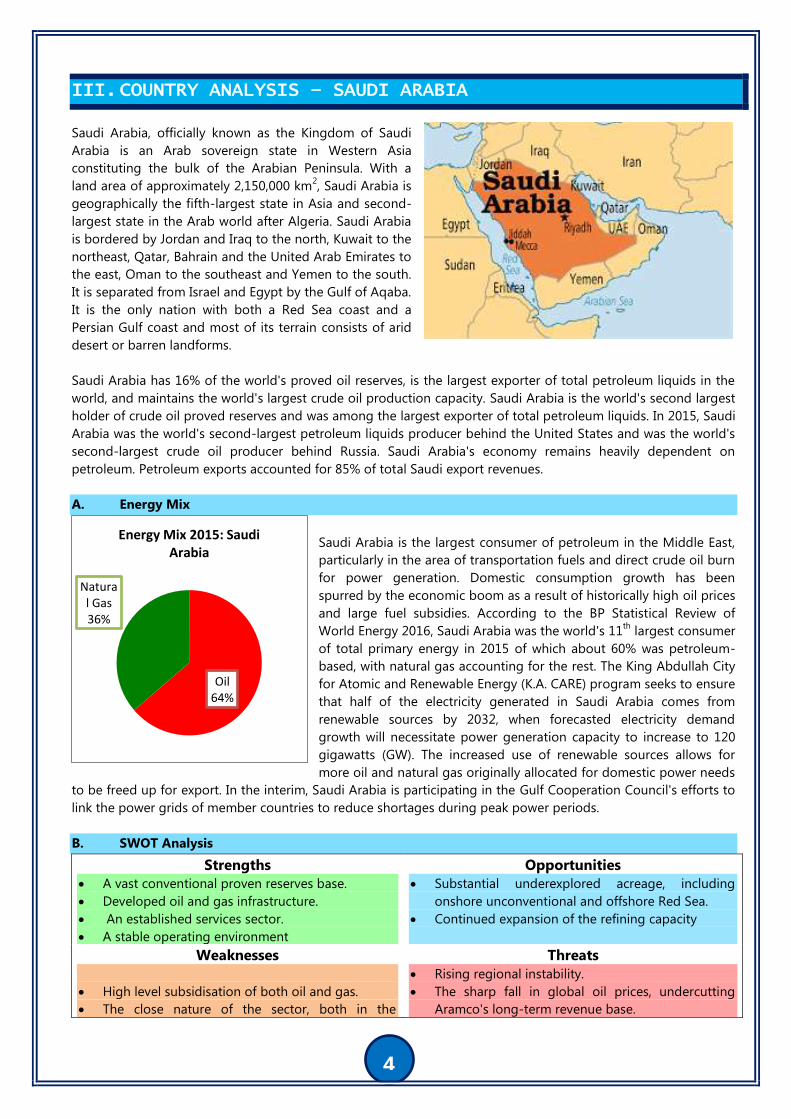
Saudi Arabia, officially known as the Kingdom of Saudi
Arabia is an Arab sovereign state in Western Asia
constituting the bulk of the Arabian Peninsula. With a
land area of approximately 2,150,000 km2, Saudi Arabia is
geographically the fifth-largest state in Asia and second-
largest state in the Arab world after Algeria. Saudi Arabia
is bordered by Jordan and Iraq to the north, Kuwait to the
northeast, Qatar, Bahrain and the United Arab Emirates to
the east, Oman to the southeast and Yemen to the south.
It is separated from Israel and Egypt by the Gulf of Aqaba.
It is the only nation with both a Red Sea coast and a
Persian Gulf coast and most of its terrain consists of arid
desert or barren landforms.
Saudi Arabia has 16% of the world's proved oil reserves, is the largest exporter of total petroleum liquids in the
world, and maintains the world's largest crude oil production capacity. Saudi Arabia is the world's second largest
holder of crude oil proved reserves and was among the largest exporter of total petroleum liquids. In 2015, Saudi
Arabia was the world's second-largest petroleum liquids producer behind the United States and was the world's
second-largest crude oil producer behind Russia. Saudi Arabia's economy remains heavily dependent on
petroleum. Petroleum exports accounted for 85% of total Saudi export revenues.
A. Energy Mix
Saudi Arabia is the largest consumer of petroleum in the Middle East,
particularly in the area of transportation fuels and direct crude oil burn
for power generation. Domestic consumption growth has been
spurred by the economic boom as a result of historically high oil prices
and large fuel subsidies. According to the BP Statistical Review of
World Energy 2016, Saudi Arabia was the world's 11th
largest consumer
of total primary energy in 2015 of which about 60% was petroleum-
based, with natural gas accounting for the rest. The King Abdullah City
for Atomic and Renewable Energy (K.A. CARE) program seeks to ensure
that half of the electricity generated in Saudi Arabia comes from
renewable sources by 2032, when forecasted electricity demand
growth will necessitate power generation capacity to increase to 120
gigawatts (GW). The increased use of renewable sources allows for
more oil and natural gas originally allocated for domestic power needs
to be freed up for export. In the interim, Saudi Arabia is participating in the Gulf Cooperation Council's efforts to
link the power grids of member countries to reduce shortages during peak power periods.
B. SWOT Analysis
Strengths
A vast conventional proven reserves base.
Developed oil and gas infrastructure.
An established services sector.
A stable operating environment
Opportunities
Substantial underexplored acreage, including
onshore unconventional and offshore Red Sea.
Continued expansion of the refining capacity
Weaknesses
High level subsidisation of both oil and gas.
The close nature of the sector, both in the
Threats
Rising regional instability.
The sharp fall in global oil prices, undercutting
Aramco's long-term revenue base.
5
upstream and downstream segments.
Cumbersome bureaucracy.
Source: BMI
C. Oil and Gas Reserves
1. Oil Reserves
According to the Oil & Gas Journal (OGJ), Saudi Arabia had approximately 266 billion barrels of proved oil
reserves (in addition to 2.5 billion barrels in the Saudi-Kuwaiti shared Neutral Zone, half of the total reserves in
the Neutral Zone) as of January 1, 2014, amounting to 16% of proved world oil reserves. Although Saudi Arabia
has about 100 major oil and gas fields, more than half of its oil reserves are contained in eight fields in the
northeast portion of the country. The giant Ghawar field is the world's largest oil field in terms of production and
total remaining reserves. The Ghawar field has estimated remaining proved oil reserves of 75 billion barrels,5
more than all but seven other countries.
2. Natural gas
Saudi Arabia has the world's fifth-largest natural gas reserves, but natural gas production remains limited. Saudi
Arabia (including the Neutral Zone) had proved natural gas reserves of 291 trillion cubic feet (Tcf)26 as of January
1, 2014, fifth largest in the world behind Russia, Iran, Qatar, and the United States, according to OGJ. The majority
of natural gas fields in Saudi Arabia are associated with petroleum deposits, or are found in the same wells as the
crude oil, and production increases of this type of gas remain linked to an increase in oil production.
6
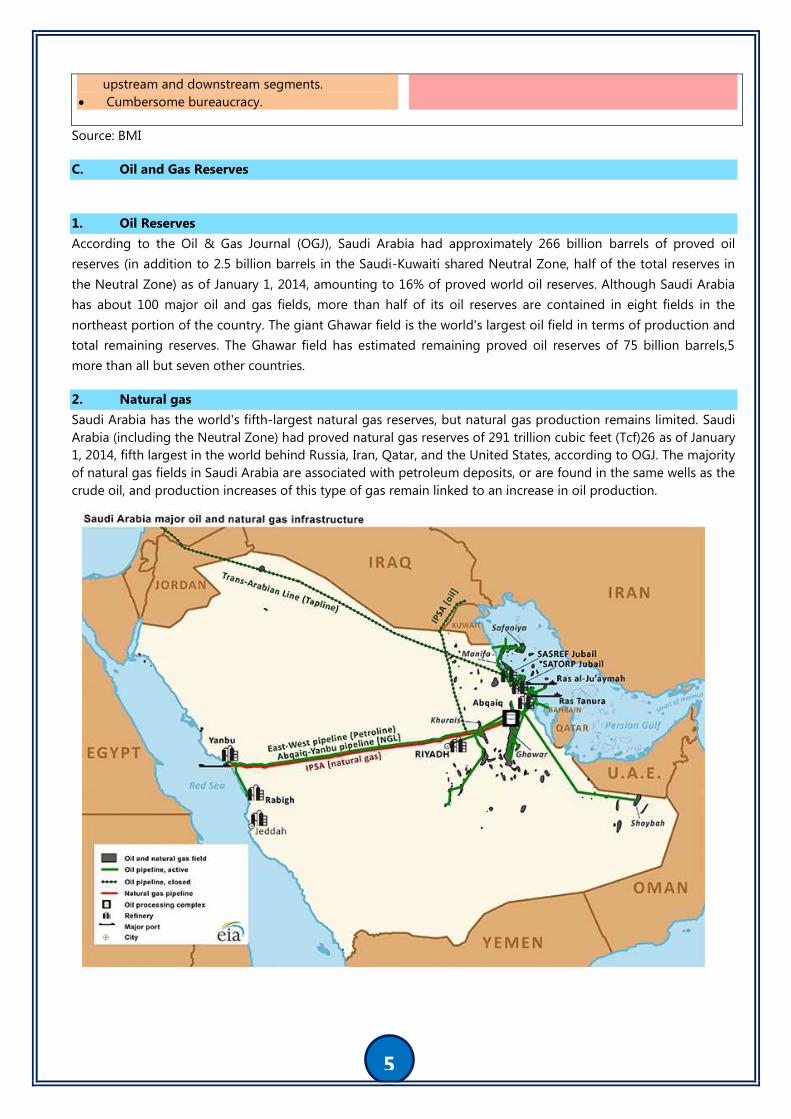
D. Oil and Gas Infrastructure
1. Major ports
Saudi Arabia has three primary oil export terminals:
The port of Ras Tanura on the Persian Gulf has an average handling capacity of 3.4 million bbl/d, and it
handles most of Saudi Arabia's exports.
The Ras al-Ju'aymah facility on the Persian Gulf has an average handling capacity of about 3 million bbl/d
and because of the availability of various Single Point Mooring buoys, the largest oil tankers can be
accommodated for crude loadings.
The Yanbu terminal on the Red Sea, from which most of the remaining volumes are exported, has an average
handling capacity of 1.3 million bbl/d. In addition to these primary export terminals, Saudi Arabia has other
smaller ports including Ras al-Khafji, Jubail, and Jeddah.
2. Major domestic petroleum pipelines
Saudi Aramco operates more than 12,000 miles of crude and petroleum product pipelines throughout the
country, including two major pipelines:
Saudi Arabia has the 746-mile-long East-West Pipeline, also known as Petroline, which runs across Saudi
Arabia from its Abqaiq complex to the Red Sea. The Petroline system consists of two pipelines with a total
nameplate capacity of about 4.8 million bbl/d. The 56-inch pipeline has a nameplate capacity of 3 million
bbl/d, and its current throughput is about 2 million bbl/d. In recent years, the 48-inch pipeline had been
operating as a natural gas pipeline, but Saudi Arabia moved to convert it back to an oil pipeline. The switch
could increase Saudi Arabia's spare oil pipeline capacity to bypass the Strait of Hormuz from 1 million bbl/d
to 2.8 million bbl/d, which is only attainable if the system is able to operate at its full nameplate capacity.
Running parallel to the Petroline is the 290,000-bbl/d Abqaiq-Yanbu NGL pipeline, which serves
petrochemical plants in Yanbu.
A 236-mile multi-products line between Dhahran in the Eastern Province and Riyadh and a smaller 220-mile
multi-products line between Riyadh and Qassim to the north were also built in the 1980s.
3. International petroleum pipelines
Saudi Aramco does not operate any major functioning international pipelines.
The Trans-Arabian Pipeline (Tapline), built in 1947 to transport crude oil from Qaisumah through Jordon to
Sidon, Lebanon, has been closed, in part, since 1984. The portion of the pipeline that runs to Jordan was
closed in 1990.
The Iraqi Pipeline in Saudi Arabia (IPSA) has a capacity of 1.65 million bbl/d and runs from Iraq, through
Saudi Arabia parallel to the East-West Pipeline, and ends at the port of Mu'ajjiz, south of Yanbu. The pipeline
was built in 1989 but was closed in 1990 during the Persian Gulf War. Saudi Arabia then seized IPSA in 2001.
The portion of the pipeline that runs parallel to the East-West Pipeline was converted to transport natural
gas to power plants, while the portion of the pipeline that goes north into Iraq remains a closed, inactive oil
pipeline.
Saudi Arabia's only functioning international crude pipeline system is a 60-year old complex of four small
underwater pipelines carrying Arabian Light crude from Saudi Arabia's Abu Safah field to Bahrain.20 This
aging pipeline system is expected to be decommissioned after the construction of a new pipeline with a
capacity of 350,000 running between Abqaiq and Bahrain's refinery at Sitra. The new pipeline is expected to
be completed in the third quarter of 2016.
7
COMPANY ANALYSIS – KUWAIT PETROLEUM CORPORATION (KPC) IV.
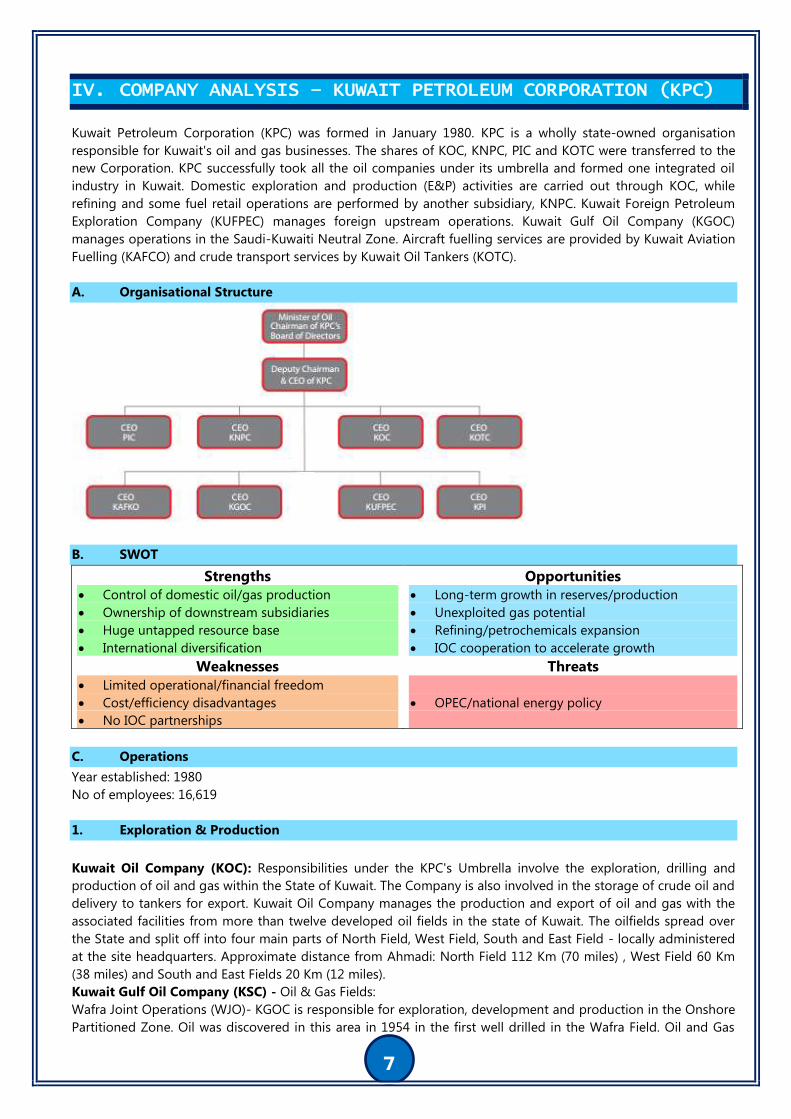
Kuwait Petroleum Corporation (KPC) was formed in January 1980. KPC is a wholly state-owned organisation
responsible for Kuwait's oil and gas businesses. The shares of KOC, KNPC, PIC and KOTC were transferred to the
new Corporation. KPC successfully took all the oil companies under its umbrella and formed one integrated oil
industry in Kuwait. Domestic exploration and production (E&P) activities are carried out through KOC, while
refining and some fuel retail operations are performed by another subsidiary, KNPC. Kuwait Foreign Petroleum
Exploration Company (KUFPEC) manages foreign upstream operations. Kuwait Gulf Oil Company (KGOC)
manages operations in the Saudi-Kuwaiti Neutral Zone. Aircraft fuelling services are provided by Kuwait Aviation
Fuelling (KAFCO) and crude transport services by Kuwait Oil Tankers (KOTC).
A. Organisational Structure
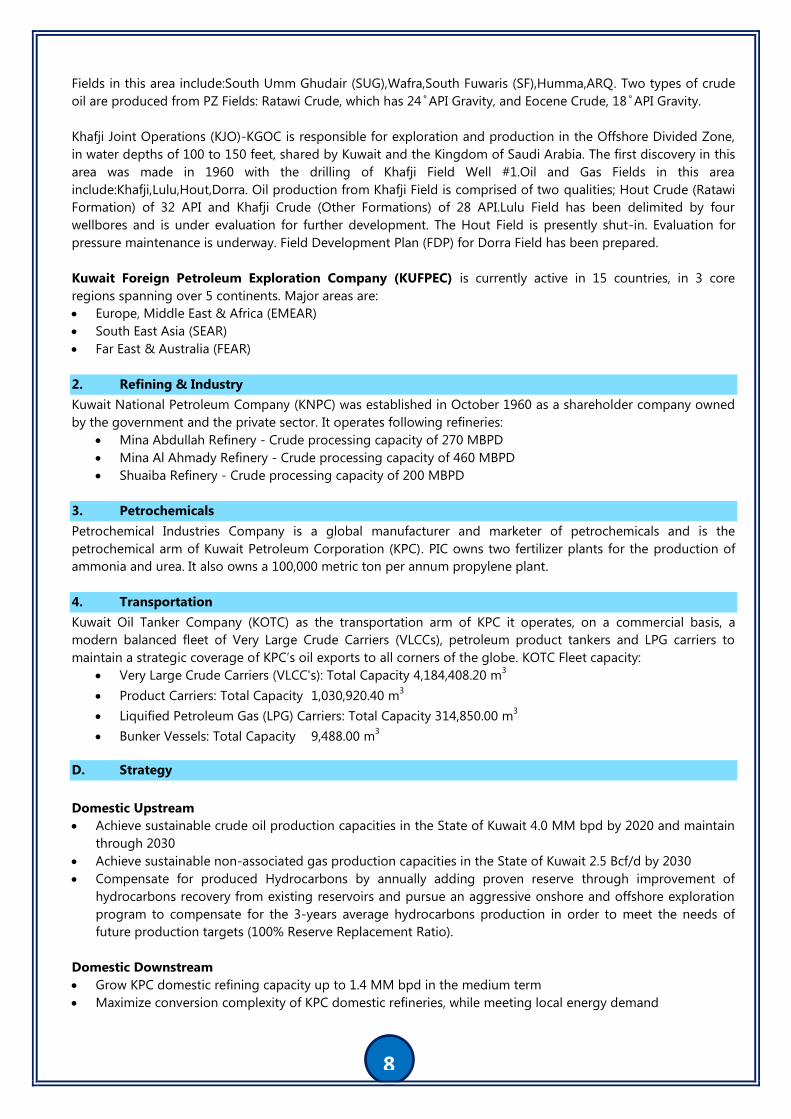
B. SWOT
Strengths
Control of domestic oil/gas production
Ownership of downstream subsidiaries
Huge untapped resource base
International diversification
Opportunities
Long-term growth in reserves/production
Unexploited gas potential
Refining/petrochemicals expansion
IOC cooperation to accelerate growth
Weaknesses
Limited operational/financial freedom
Cost/efficiency disadvantages
No IOC partnerships
Threats
OPEC/national energy policy
C. Operations
Year established: 1980
No of employees: 16,619
1. Exploration & Production
Kuwait Oil Company (KOC): Responsibilities under the KPC's Umbrella involve the exploration, drilling and
production of oil and gas within the State of Kuwait. The Company is also involved in the storage of crude oil and
delivery to tankers for export. Kuwait Oil Company manages the production and export of oil and gas with the
associated facilities from more than twelve developed oil fields in the state of Kuwait. The oilfields spread over
the State and split off into four main parts of North Field, West Field, South and East Field - locally administered
at the site headquarters. Approximate distance from Ahmadi: North Field 112 Km (70 miles) , West Field 60 Km
(38 miles) and South and East Fields 20 Km (12 miles).
Kuwait Gulf Oil Company (KSC) - Oil & Gas Fields:
Wafra Joint Operations (WJO)- KGOC is responsible for exploration, development and production in the Onshore
Partitioned Zone. Oil was discovered in this area in 1954 in the first well drilled in the Wafra Field. Oil and Gas
8
Fields in this area include:South Umm Ghudair (SUG),Wafra,South Fuwaris (SF),Humma,ARQ. Two types of crude
oil are produced from PZ Fields: Ratawi Crude, which has 24 ̊ API Gravity, and Eocene Crude, 18 ̊ API Gravity.
Khafji Joint Operations (KJO)-KGOC is responsible for exploration and production in the Offshore Divided Zone,
in water depths of 100 to 150 feet, shared by Kuwait and the Kingdom of Saudi Arabia. The first discovery in this
area was made in 1960 with the drilling of Khafji Field Well #1.Oil and Gas Fields in this area
include:Khafji,Lulu,Hout,Dorra. Oil production from Khafji Field is comprised of two qualities; Hout Crude (Ratawi
Formation) of 32 API and Khafji Crude (Other Formations) of 28 API.Lulu Field has been delimited by four
wellbores and is under evaluation for further development. The Hout Field is presently shut-in. Evaluation for
pressure maintenance is underway. Field Development Plan (FDP) for Dorra Field has been prepared.
Kuwait Foreign Petroleum Exploration Company (KUFPEC) is currently active in 15 countries, in 3 core
regions spanning over 5 continents. Major areas are:
Europe, Middle East & Africa (EMEAR)
South East Asia (SEAR)
Far East & Australia (FEAR)
2. Refining & Industry
Kuwait National Petroleum Company (KNPC) was established in October 1960 as a shareholder company owned
by the government and the private sector. It operates following refineries:
Mina Abdullah Refinery - Crude processing capacity of 270 MBPD
Mina Al Ahmady Refinery - Crude processing capacity of 460 MBPD
Shuaiba Refinery - Crude processing capacity of 200 MBPD
3. Petrochemicals
Petrochemical Industries Company is a global manufacturer and marketer of petrochemicals and is the
petrochemical arm of Kuwait Petroleum Corporation (KPC). PIC owns two fertilizer plants for the production of
ammonia and urea. It also owns a 100,000 metric ton per annum propylene plant.
4. Transportation
Kuwait Oil Tanker Company (KOTC) as the transportation arm of KPC it operates, on a commercial basis, a
modern balanced fleet of Very Large Crude Carriers (VLCCs), petroleum product tankers and LPG carriers to
maintain a strategic coverage of KPC’s oil exports to all corners of the globe. KOTC Fleet capacity:
Very Large Crude Carriers (VLCC's): Total Capacity 4,184,408.20 m3
Product Carriers: Total Capacity 1,030,920.40 m3
Liquified Petroleum Gas (LPG) Carriers: Total Capacity 314,850.00 m3
Bunker Vessels: Total Capacity 9,488.00 m3
D. Strategy
Domestic Upstream
Achieve sustainable crude oil production capacities in the State of Kuwait 4.0 MM bpd by 2020 and maintain
through 2030
Achieve sustainable non-associated gas production capacities in the State of Kuwait 2.5 Bcf/d by 2030
Compensate for produced Hydrocarbons by annually adding proven reserve through improvement of
hydrocarbons recovery from existing reservoirs and pursue an aggressive onshore and offshore exploration
program to compensate for the 3-years average hydrocarbons production in order to meet the needs of
future production targets (100% Reserve Replacement Ratio).
Domestic Downstream
Grow KPC domestic refining capacity up to 1.4 MM bpd in the medium term
Maximize conversion complexity of KPC domestic refineries, while meeting local energy demand
9
Provide petroleum products that meet domestic energy requirements and international market needs in
terms of quantity and quality
International Upstream
Achieve crude oil and gas production outside Kuwait of 200 MBOEPD by 2020 and maintain through 2030
and reserves of 650 MMBOE by 2020 and maintain through 2030
Give preference for investments which facilitate technology and capability transfer between domestic and
international upstream businesses
Become operator of international upstream assets by reaching 20% operatorship by 2030
International Downstream
Grow KPC international refining capacity while ensuring secure outlet for 800 mbpd by 2020 of Kuwaiti
hydrocarbon
Enter into economically viable investment opportunities through partnership with an international partner or
alliance with oil company, focusing on high growth market, specifically Asia
Divest unprofitable investments that do not provide acceptable returns in the short term in Europe and
merge current operations with competitors operations through JV(s)/partnership(s) to improve performance
Petrochemicals
Pursue growth in petrochemical core business inside and outside the State of Kuwait by new builds or
acquisitions to maintain leading position in the high growth Olefins and Aromatics products through
partnerships, with a focus on Asia and other emerging markets
Maximize value-added integration between petrochemicals and KPC’s operations inside and outside the
State of Kuwait
Transportation
Maintain the size and the configuration of the fleet that meet long-term strategic cover and KPC marketing
requirements for crude oil, petroleum products and LPG in-line with targeted domestic production
Midstream
Maximize the value of Kuwaiti hydrocarbons in secure, long-term, and diverse outlets
Improve the value chain optimization of KPC’s operations
E. Market Position
International downstream assets now comprise around 250,000b/d of refining capacity in Europe, which includes
the 75,500b/d Europort facility in Rotterdam and half of the capacity of Eni's 300,000b/d Milazzo refinery. KPC
also operates a network of around 5,000 service stations in Italy, Germany, the UK, Sweden, Denmark, the
Netherlands, Belgium, Luxembourg and Thailand under the Q8 brand. Q8-branded lubricants are marketed
directly in the Benelux countries, Denmark, France, Germany, Italy, Spain and the UK, and exported to more than
75 countries. Airport refuelling operations are offered throughout Western Europe and in Hong Kong. Assets in
Indonesia and Pakistan contribute the bulk of output. E&P assets are located in Algeria, Egypt, Sudan, Tunisia,
Qatar, Yemen, Australia, Indonesia, Malaysia, China, Vietnam and Pakistan. KUFPEC in December 2012 agreed to
acquire an additional 34.3% interest in the Yacheng gas field in the South China Sea from BP. The Yacheng 13-1
field was discovered in 1983 and is the largest offshore natural gas producing field in China. KUFPEC has been a
participant in Yacheng 13-1 since 1990. Following completion, the Yacheng partnership will consist of KUFPEC
(49%) and CNOOC (51%).
10
LNG INDUSTRY REVIEW 2016 V.
In 2016, global LNG trade recorded a growth rate of around 7.5% compared to 2015, returning to a robust pace
experienced before 2011. Primarily driven by new Australian volumes, additional supply was not as abundant as
expected due to production delays, slower ramp-ups and lower exports from historical suppliers. Sluggish oil
prices have continued to exert downward pressure on LNG contract prices. In the Pacific Basin, a combination of
more than adequate supply and of slow demand growth also pushed spot prices to a seven-year low. This
situation and the looming supply overhang are causing a slow-down in investment with several FIDs being
cancelled or deferred.
In order to respond to market changes and cope with the uncertainty of future supply and demand, LNG
contracting strategies have grown in importance. In this respect, most buyers pay particular attention to flexibility
–in terms of destination as well as off-take obligations– and price competitiveness. In a well supplied market and
given the significant quantities under long-term contracts which are due to expire in the medium-term –
particularly in Japan– the share of spot and short-term volumes (which remained stable at around 28% of total
trade) could increase further in the coming years.
A. Key Facts 2016
263.6 million tons imported or a 7.5% increase vs. 2015
74.6 million tons traded on a spot or short term basis or 28% of total trade
73% of global LNG demand in Asia
30% of global LNG volumes supplied from Qatar
45% of global LNG volumes supplied from the Pacific Basin
4 New Importing Countries 11 New LNG Regasification Terminals
39 Importing Countries
830 MTPA Total Regasification Capacity
19 Exporting Countries
340 MTPA Total Nameplate Liquefaction Capacity
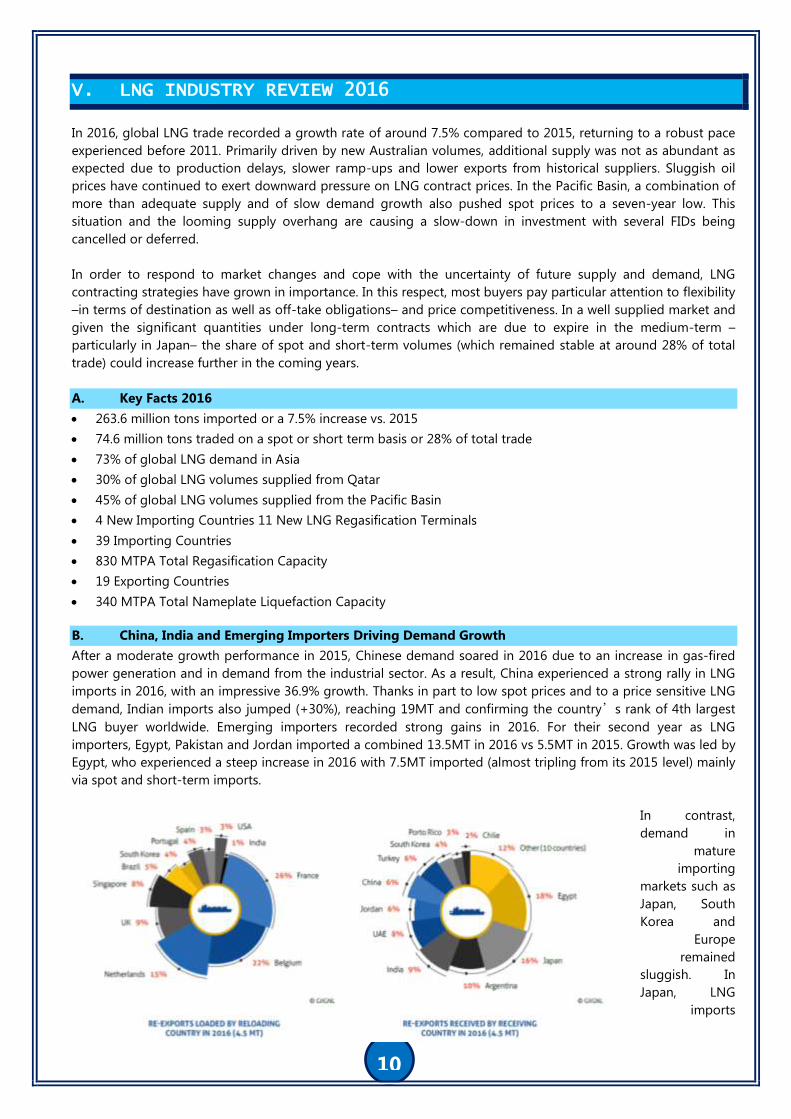
B. China, India and Emerging Importers Driving Demand Growth
After a moderate growth performance in 2015, Chinese demand soared in 2016 due to an increase in gas-fired
power generation and in demand from the industrial sector. As a result, China experienced a strong rally in LNG
imports in 2016, with an impressive 36.9% growth. Thanks in part to low spot prices and to a price sensitive LNG
demand, Indian imports also jumped (+30%), reaching 19MT and confirming the country’s rank of 4th largest
LNG buyer worldwide. Emerging importers recorded strong gains in 2016. For their second year as LNG
importers, Egypt, Pakistan and Jordan imported a combined 13.5MT in 2016 vs 5.5MT in 2015. Growth was led by
Egypt, who experienced a steep increase in 2016 with 7.5MT imported (almost tripling from its 2015 level) mainly
via spot and short-term imports.
In contrast,
demand in
mature
importing
markets such as
Japan, South
Korea and
Europe
remained
sluggish. In
Japan, LNG
imports
11
declined for the second year in a row to 83.3 MT (-1.7 MT) due to the restart of several nuclear units, to energy
conservation efforts and to the uptake in renewable power generation. Against expectations, Europe did not
function as a sink for the production increase in 2016. The UK recorded the largest decline in imports year-on-
year (-2.6MT or -26%), due to higher supply of pipeline gas and domestic production. Belgium and the
Netherlands also recorded declines of respectively –58% and – 42%. France showed an opposite trend (+1.2MT
or +28%, net of re-exports).
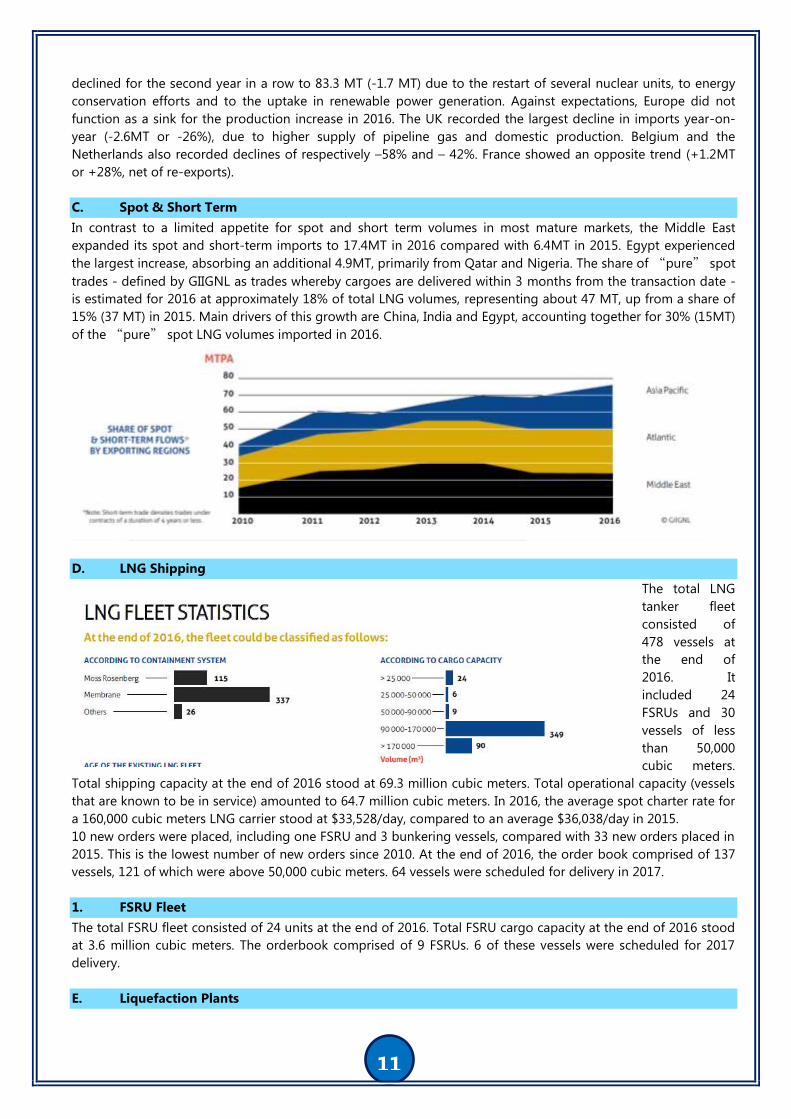
C. Spot & Short Term
In contrast to a limited appetite for spot and short term volumes in most mature markets, the Middle East
expanded its spot and short-term imports to 17.4MT in 2016 compared with 6.4MT in 2015. Egypt experienced
the largest increase, absorbing an additional 4.9MT, primarily from Qatar and Nigeria. The share of “pure” spot
trades - defined by GIIGNL as trades whereby cargoes are delivered within 3 months from the transaction date -
is estimated for 2016 at approximately 18% of total LNG volumes, representing about 47 MT, up from a share of
15% (37 MT) in 2015. Main drivers of this growth are China, India and Egypt, accounting together for 30% (15MT)
of the “pure” spot LNG volumes imported in 2016.
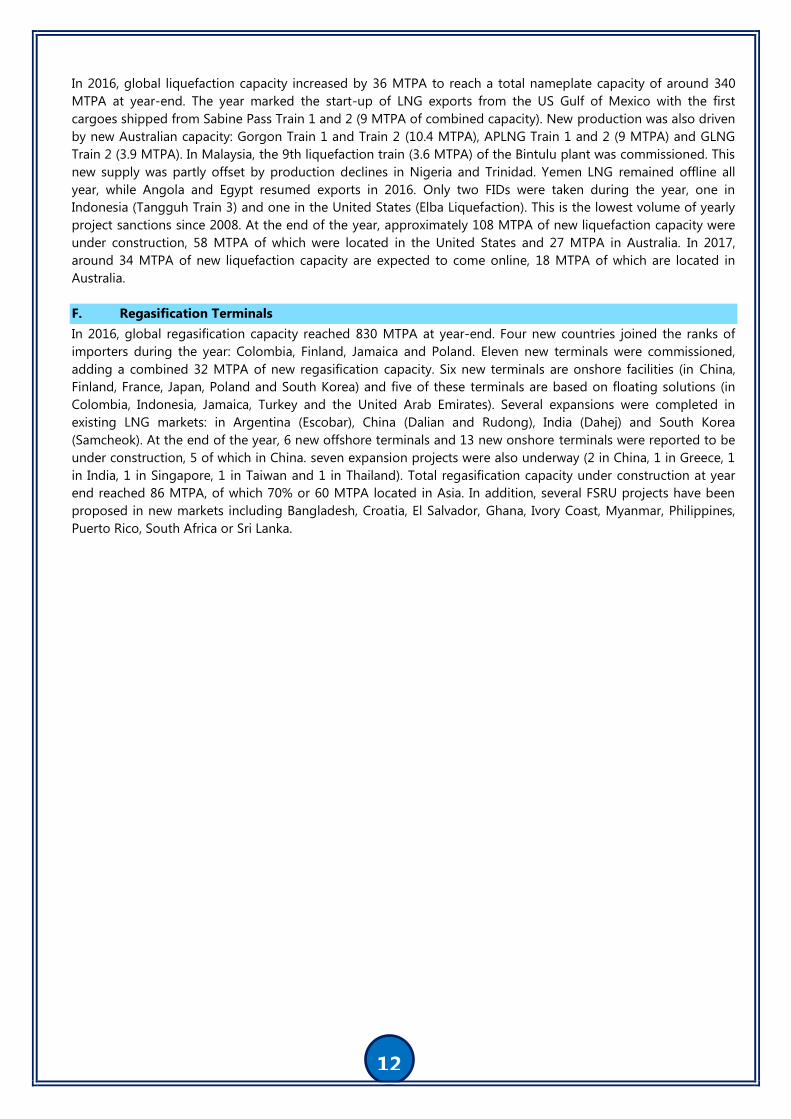
D. LNG Shipping
The total LNG
tanker fleet
consisted of
478 vessels at
the end of
2016. It
included 24
FSRUs and 30
vessels of less
than 50,000
cubic meters.
Total shipping capacity at the end of 2016 stood at 69.3 million cubic meters. Total operational capacity (vessels
that are known to be in service) amounted to 64.7 million cubic meters. In 2016, the average spot charter rate for
a 160,000 cubic meters LNG carrier stood at $33,528/day, compared to an average $36,038/day in 2015.
10 new orders were placed, including one FSRU and 3 bunkering vessels, compared with 33 new orders placed in
2015. This is the lowest number of new orders since 2010. At the end of 2016, the order book comprised of 137
vessels, 121 of which were above 50,000 cubic meters. 64 vessels were scheduled for delivery in 2017.
1. FSRU Fleet
The total FSRU fleet consisted of 24 units at the end of 2016. Total FSRU cargo capacity at the end of 2016 stood
at 3.6 million cubic meters. The orderbook comprised of 9 FSRUs. 6 of these vessels were scheduled for 2017
delivery.
E. Liquefaction Plants
12
In 2016, global liquefaction capacity increased by 36 MTPA to reach a total nameplate capacity of around 340
MTPA at year-end. The year marked the start-up of LNG exports from the US Gulf of Mexico with the first
cargoes shipped from Sabine Pass Train 1 and 2 (9 MTPA of combined capacity). New production was also driven
by new Australian capacity: Gorgon Train 1 and Train 2 (10.4 MTPA), APLNG Train 1 and 2 (9 MTPA) and GLNG
Train 2 (3.9 MTPA). In Malaysia, the 9th liquefaction train (3.6 MTPA) of the Bintulu plant was commissioned. This
new supply was partly offset by production declines in Nigeria and Trinidad. Yemen LNG remained offline all
year, while Angola and Egypt resumed exports in 2016. Only two FIDs were taken during the year, one in
Indonesia (Tangguh Train 3) and one in the United States (Elba Liquefaction). This is the lowest volume of yearly
project sanctions since 2008. At the end of the year, approximately 108 MTPA of new liquefaction capacity were
under construction, 58 MTPA of which were located in the United States and 27 MTPA in Australia. In 2017,
around 34 MTPA of new liquefaction capacity are expected to come online, 18 MTPA of which are located in
Australia.
F. Regasification Terminals
In 2016, global regasification capacity reached 830 MTPA at year-end. Four new countries joined the ranks of
importers during the year: Colombia, Finland, Jamaica and Poland. Eleven new terminals were commissioned,
adding a combined 32 MTPA of new regasification capacity. Six new terminals are onshore facilities (in China,
Finland, France, Japan, Poland and South Korea) and five of these terminals are based on floating solutions (in
Colombia, Indonesia, Jamaica, Turkey and the United Arab Emirates). Several expansions were completed in
existing LNG markets: in Argentina (Escobar), China (Dalian and Rudong), India (Dahej) and South Korea
(Samcheok). At the end of the year, 6 new offshore terminals and 13 new onshore terminals were reported to be
under construction, 5 of which in China. seven expansion projects were also underway (2 in China, 1 in Greece, 1
in India, 1 in Singapore, 1 in Taiwan and 1 in Thailand). Total regasification capacity under construction at year
end reached 86 MTPA, of which 70% or 60 MTPA located in Asia. In addition, several FSRU projects have been
proposed in new markets including Bangladesh, Croatia, El Salvador, Ghana, Ivory Coast, Myanmar, Philippines,
Puerto Rico, South Africa or Sri Lanka.
13
LNG TRADE OUTLOOK IN AUSTRALIA, US & MEXICO VI.
A. Australian LNG Export
Despite temporary outages at the first two trains, Train 3 of Australia’s Gorgon LNG project progressed well,
enabling an early start date. Chevron has announced that Train 3 will begin operations before the end of March.
Although this will not add absolute volumes to the market above those already anticipated, it will bring ramp-up
cargoes to the spot market earlier than previously expected. With the early commissioning cargoes set to be
available during a period of weak demand, there could be further pressure on spot prices in the short term.
Gorgon’s third train will bring Australia’s export capacity up to around 66 mtpa when it is fully operational.
Gorgon will have an overall capacity of 15.6 mtpa when all three trains are fully ramped up.
Spot LNG prices in Asia have come under sustained pressure in recent weeks, with the spot price for March and
April deliveries down to around $6.5-7.0/MMBtu – a significant drop from the highs of $9.5/MMBtu seen during
the peak of winter.
Although China saw a significant jump in spot LNG imports in December and is expected to remain active on the
spot market over the coming months, requirements for spot cargoes will likely remain weak elsewhere in
Northeast Asia before the peak summer demand period.
Train 1 at Chevron’s Wheatstone LNG project is scheduled to start operations by the middle of this year and
looks likely to be commissioned before the end of Q3, 2017. This would add another 4.5 mpta of capacity to
Australia’s LNG exports.
Ichthys LNG and Prelude FLNG are also scheduled to start up within the next 12 months, but delays to the
commissioning schedules are a risk.
1. Australia LNG Export Projects – Existing and Planned
Project Capacity, mtpa Status
North West Shelf 16.3 Operational
Darwin 3.7 Operational
Pluto 4.9 Operational
Queensland Curtis 8.5 Operational
Australia Pacific 9 Operational
Gladstone 7.8 Operational
Gorgon Trains 1 & 2 10.4 Operational
Gorgon Train 3 5.2 Operational by March 2017
Wheatstone 8.9 Planned 2017/2018
Prelude FLNG 3.6 Planned 2017/2018
Ichthys 8.9 Planned 2017/2018
Total 87.2 –
Source: GIIGNL, IGU, GGA
B. MEXICO: US LNG DESTINATION
The MANZANILLO terminal on Mexico’s Pacific Coast has become an eager customer for LNG from the Sabine
Pass plant in the United States. Moreover, trade relations are expected to deepen over the coming months as the
14
US continues to provide cheap and abundant LNG to the terminal. Manzanillo is importing more and more
cargoes, even though the prospects for LNG in Mexico as a whole are bleak.
The startup of the third train at Sabine Pass has seen a sharp rise in the volume of US LNG arriving at Manzanillo,
and this trend is expected to continue for the rest of 2017. Train 3 exported its first commissioning cargo in
January and is expected to reach substantial completion by the end of March.
South Korea’s Kogas has a 20-year sales-and-purchase agreement to take 3.5 mtpa of LNG from Train 3. The
company also has a stake in Manzanillo, enabling it to supply the fuel to Mexico from Sabine Pass. In addition,
Manzanillo received LNG from Sabine Pass last year via Shell’s portfolio position at trains 1 and 2.
Australia is increasing its dominance over the Asian LNG market, making it increasingly difficult for South Korea
to import US volumes despite the long term Kogas contract with Sabine Pass. Consequently, Kogas is
increasingly acting as a portfolio player and is looking to market volumes sourced from the US in regions other
than Asia. Manzanillo’s healthy demand for LNG gives Kogas a golden opportunity to market US LNG there,
helped by its stake at the terminal.
Manzanillo imported 10 LNG cargoes between January and February this year, all of which were sourced from
Sabine Pass. Two more shipments, also from Sabine Pass, have arrived at the terminal so far in March.
Kogas has supplied most of Manzanillo’s LNG so far this year via its portfolio position at Sabine Pass’s third train.
In contrast, Manzanillo received no LNG from the US between January and February 2016 but instead took in
cargoes from Peru, Trinidad & Tobago and Australia. However, non-US suppliers have lost their advantage now
Train 3 is online.
Manzanillo imported 500,000 tons of LNG in the first two months of 2017, much more than the 370,000 tons it
imported during the same period in 2016.
1. Mexico’s declining LNG demand
Mexico’s overall LNG imports are under pressure, despite the healthy demand at Manzanillo, because of the
increasing popularity of pipeline gas from the US. Consequently, the country’s other two LNG terminals –
Altamira and Costa Azul – have been severely underutilized so far in 2017 and are expected to remain so for the
rest of the year.
Altamira has received no LNG since September 2016, whereas Costa Azul imported a single cargo from Indonesia
in February 2017 – its first import since June 2016. Mexico’s LNG imports declined by 16.8% on an annual basis in
2016, to 4.11 mt.
The low cost of US pipeline gas is reinforcing its popularity in Mexico. US pipeline gas exports to Mexico cost
$2.64/MMBtu on average in 2016 while the average landed price for LNG in Mexico was $5.73/MMBtu.
Consequently, Mexico imported 38.41 billion cubic metres of pipeline gas from the US in 2016, an increase of
almost 29% on an annual basis.
Manzanillo’s thirst for LNG is not guaranteed in the medium to- long term as the popularity of US pipeline gas
grows. Mexico’s pipeline infrastructure is not sufficiently developed to carry gas from the US to southwest
Mexico, which will continue to depend on supplies from Manzanillo for the time being. However, Mexico is
improving its infrastructure, and this will weigh on the terminal’s imports in the longer term.
Note:
The data and information in the report is sourced from websites and documents available in public
domain and doesn’t purport to be official view of government or any organization. Sincere efforts have
been made to present correct data; however, errors and omissions, if any, are regretted and the same may
please be brought to the notice of Energy Desk for necessary corrective action.


![FOCUSED ENERGY REPORT - gailcorintra.gail.co.in...Monthly Report-December Energy Desk . December 1, 2012 [FOCUSED ENERGY REPORT] E N E R G Y D e s k Page 1 Table of Content ... A recent](https://img.pdfslide.net/doc/110x75/5ea9763e9d133867c471f81b/focused-energy-report-monthly-report-december-energy-desk-december-1-2012.jpg)


![High Intensity Focused Ultrasound Facial Skin Lifting · HIFU Mechanism HIFU [High Intensity Focused Ultra-sound] • Non-invasive treatment with thermal energy that focused ultrasound](https://img.pdfslide.net/doc/110x75/5fd8347ce1f6a6277a18bb54/high-intensity-focused-ultrasound-facial-skin-hifu-mechanism-hifu-high-intensity.jpg)

![FOCUSED ENERGY REPORT - gailcorintra.gail.co.in · November 9, 2012 [FOCUSED ENERGY REPORT] ... WTI crude oil 92.29 85.26 -7.03 -7.61% ... Hassi Messaoud basin, located in the eastern](https://img.pdfslide.net/doc/110x75/5f5be53420dbde111b489dc3/focused-energy-report-november-9-2012-focused-energy-report-wti-crude-oil.jpg)