Embed Size (px)
Citation preview
Focused Policy Assessment of the Learning and Development Unit
Department of Agriculture, Food and the Marine
Economics and Planning Division
July 2016

1 Overview
This Focused Policy Assessment (FPA) has been conducted on the Learning and Development Unit (LDU), and training and development function generally in the Department of Agriculture, Food and the Marine. The assessment was carried out by the Economics and Planning Division.
The key evaluation questions underlying the evaluation are: What are the inputs into the LDU, specifically in terms of staffing and funding? What are the outputs from the LDU, in terms of training delivered? What are the outcomes from training, in the form of increased effectiveness?
The third of these questions is the most difficult to answer.
The structure of this document is as follows: Section 2: Provides an overview of the LDU Section 3: Displays trends in training provision and uptake between 2008 and 2015, with a
particular focus on 2015 figures Section 4: Looks at the expenditure of the LDU Section 5: Outlines how the LDU determine the training needs in the Department Section 6: Outlines the Refund of Fees scheme Section 7: Provides the results of a survey completed by 40 Heads of Divisions on their
experience of the LDU Section 8: Outlines some of the other activities carried out by the LDU Section 9: Reports the results of evaluations of various courses carried out internally by LDU Section 10: Looks at the progress in other public bodies in relation to the evaluation of their
learning and development strategies Section 11: Concludes and provides recommendations.
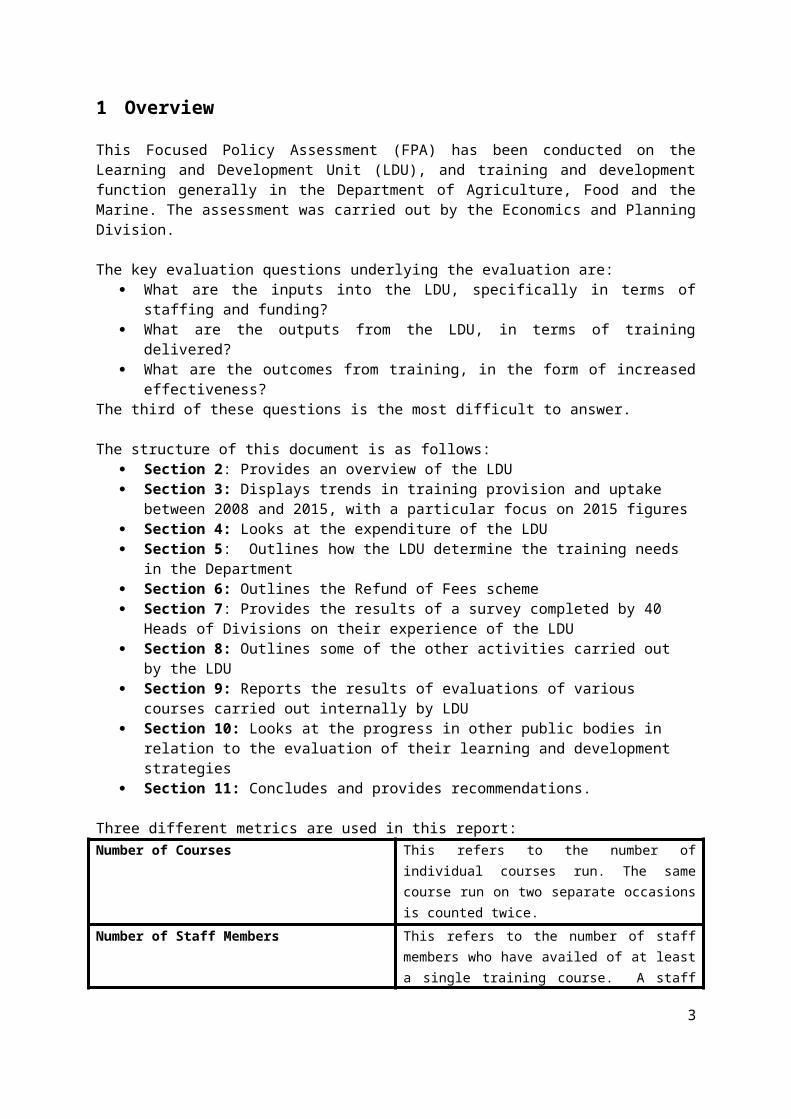
Three different metrics are used in this report:Number of Courses This refers to the number of individual courses run.
The same course run on two separate occasions is counted twice.
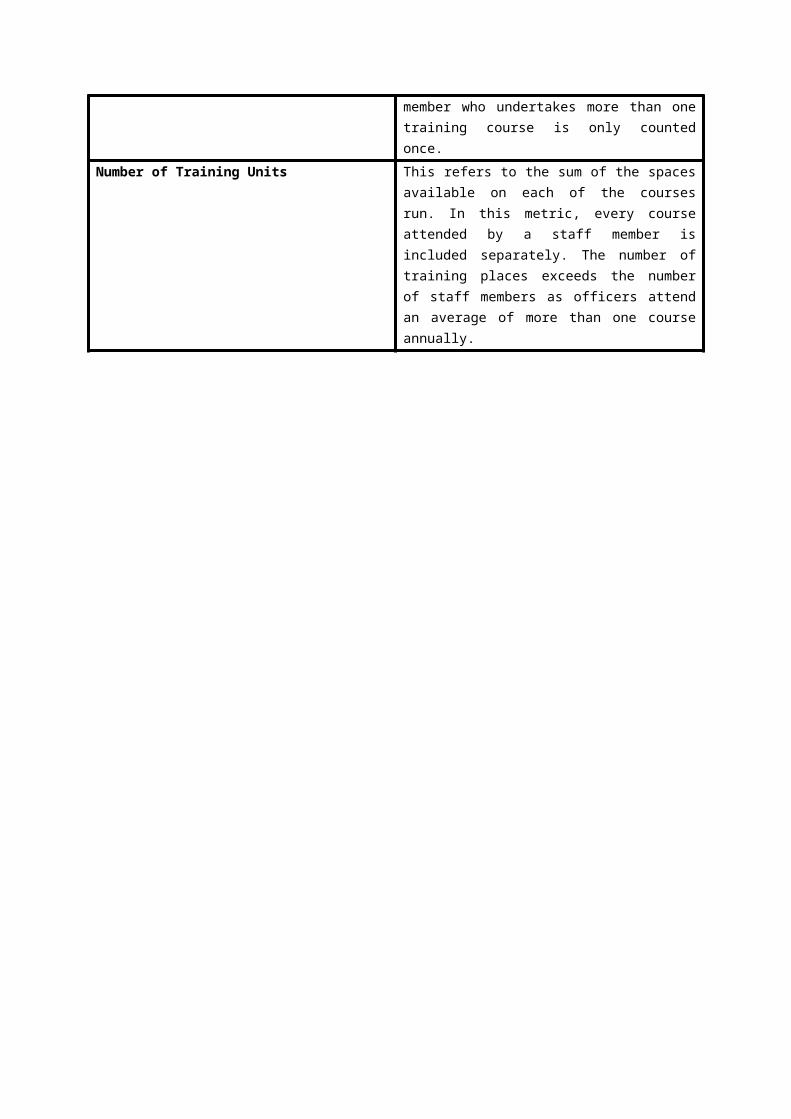
Number of Staff Members This refers to the number of staff members who have availed of at least a single training course. A staff member who undertakes more than one training course is only counted once.
Number of Training Units This refers to the sum of the spaces available on each of the courses run. In this metric, every course attended by a staff member is included separately. The number of training places exceeds the number of staff members as officers attend an average of more than one course annually.
2
2 The Learning and Development Unit
The stated objective of the LDU is:“To provide, design and implement training and development programmes to support and enhance skills and competencies relevant to the Department's business needs, objectives and strategies.”
As of September 2015, DAFM had 3,138 staff across 82 grades. The LDU is responsible for providing training to geographically disparate staff and facilitating the wide range of training needs, from general soft skills to highly technical laboratory procedures. The Unit provides most of the Department’s formal training programmes, with a small number of courses run by Health and Safety and IT. The Learning and Development Unit is part of the HR Division, which is currently finalising a new HR Strategy. As of February 2016, the LDU comprises a total of 15.773 staff located in Dublin and Portlaoise.
Table 1: Staff in the Learning and Development Unit
Grade Dublin Portlaoise Total
AP 1 0 1HEO 1 2.3 3.3EO 2* 3.4** 5.4CO 1.6 3.723 5.323AI 0.75 0 0.75
Total Staff 6.35 9.423 15.773
Note: *1 EO on secondment to DPER**0.8 EO on long term sick leave
There was previously a full time AS and 0.5 SVI assigned to the Unit. Both have retired and neither has been replaced.
The Department has training rooms that are used for general training courses as well as computer applications training. These are situated at the following locations:
Agriculture House (1 Computer and 1 General) Cavan (Accounts Computer Training Room) Galway (Dual Purpose Training Room) Johnstown Castle (1 Computer and 1 General) Limerick (Dual Purpose Training Room) Portlaoise (Computer Training Room) Roscommon (Computer Training Room)
In addition, the Information Systems Division possesses dedicated computer training rooms located in St Stephen's Green House and Maynooth. Learning Centres are now set up in Dublin, Nenagh, Mullingar and Wexford. These rooms which are equipped with PCs for internal training, E-Learning, short training courses, (the Training Unit, AHCS, Travel, SAP, CCS, CMMS etc.). They may also be used for study by staff pursuing second or third level courses.
3 Trends in Training
3.1 Trends in Training, 2008 – 2015A total of 2,908 training courses were run between 1st January 2008 and 31st December 2015. These comprised 34,575 training units which were availed of by 4,739 individual staff members.
Both take up and provision of courses has fallen in recent years. The number of courses run fell from 440 in 2008 to 253 in 2015, a drop of 42% (see Figure 1). Over the same period, the number of staff availing of training fell by 24% (see Figure 2). Figure 3 shows the number of training slots availed of over this period. This metric incorporates the fact that many staff members completed more than one course. Under this measure, every course an individual staff member availed of is counted separately.
Figure 1: Number of Training Courses Provided, 2008 to 2015
2008 2009 2010 2011 2012 2013 2014 20150
100
200
300
400
500
600
440
515 499
419
310
243 228253
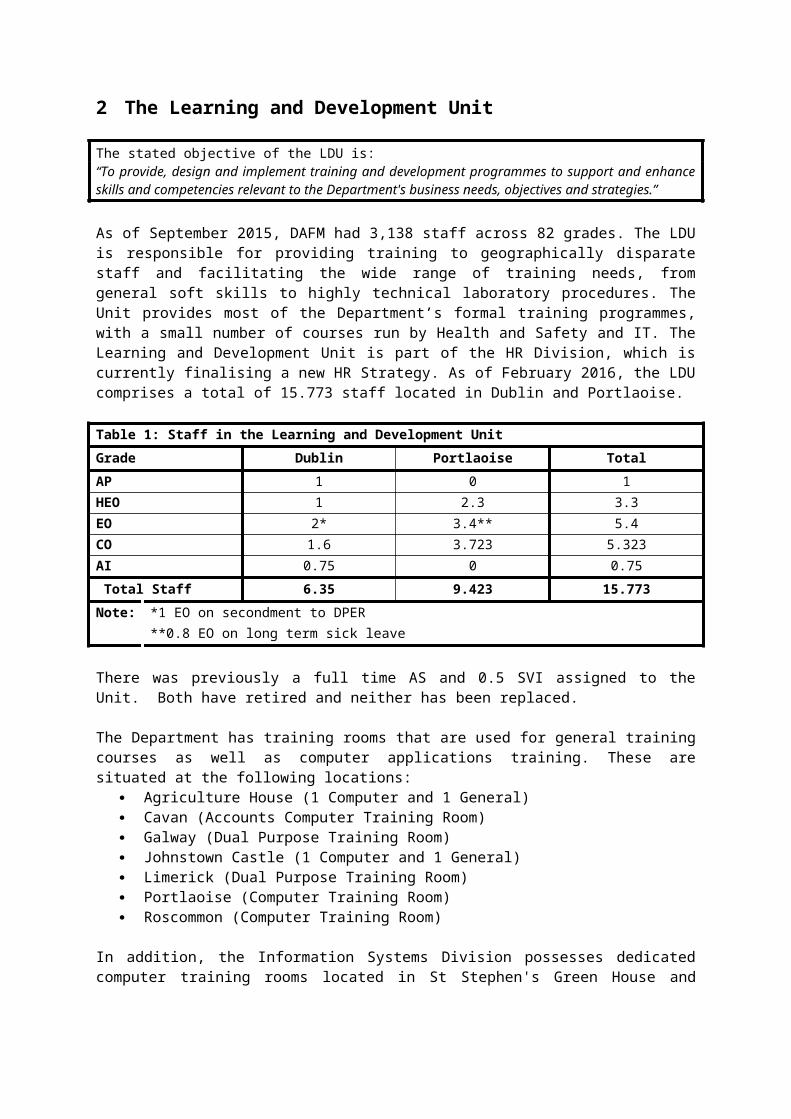
Figure 2: Number of Officers Undertaking Training, 2008 to 2015
2008 2009 2010 2011 2012 2013 2014 20150
500
1,000
1,500
2,000
2,500
3,000
2,357
1,994 1,995
2,464
1,734 1,808
1,508
1,785
Figure 3: Number of Training Slots Utilised, 2008-2015
2008 2009 2010 2011 2012 2013 2014 20150
1,000
2,000
3,000
4,000
5,000
6,000
7,000
5,161
4,170 4,222
5,922
4,1013,875
3,175
3,949
Note: Each course a staff member undertook in a given year is counted separately.
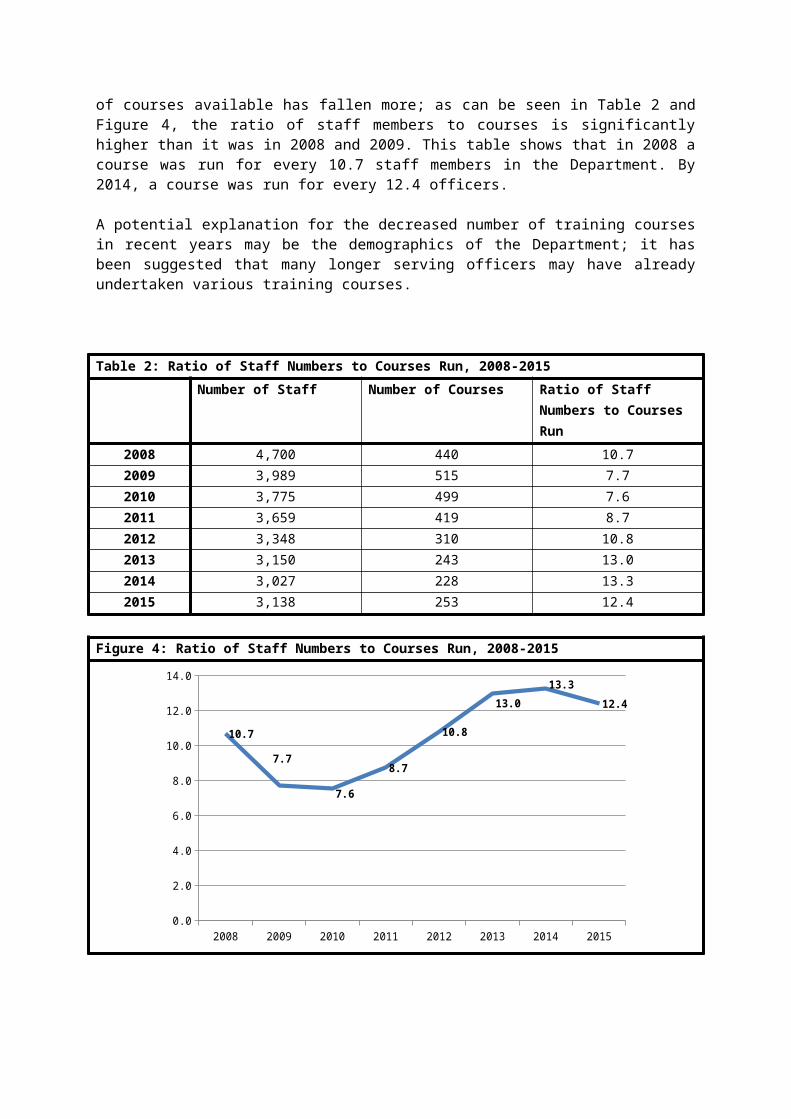
The number of staff in the Department also declined significantly over this period, falling by 37% between 2008 and 2015. The number of courses available has fallen more; as can be seen in Table 2 and Figure 4, the ratio of staff members to courses is significantly higher than it was in 2008 and 2009. This table shows that in 2008 a course was run for every 10.7 staff members in the Department. By 2014, a course was run for every 12.4 officers.
A potential explanation for the decreased number of training courses in recent years may be the demographics of the Department; it has been suggested that many longer serving officers may have already undertaken various training courses.

Table 2: Ratio of Staff Numbers to Courses Run, 2008-2015
Number of Staff Number of Courses Ratio of Staff Numbers to Courses Run
2008 4,700 440 10.72009 3,989 515 7.72010 3,775 499 7.62011 3,659 419 8.72012 3,348 310 10.82013 3,150 243 13.02014 3,027 228 13.32015 3,138 253 12.4
Figure 4: Ratio of Staff Numbers to Courses Run, 2008-2015
2008 2009 2010 2011 2012 2013 2014 20150.0
2.0
4.0
6.0
8.0
10.0
12.0
14.0
10.7
7.7
7.6
8.7
10.8
13.0
13.3
12.4
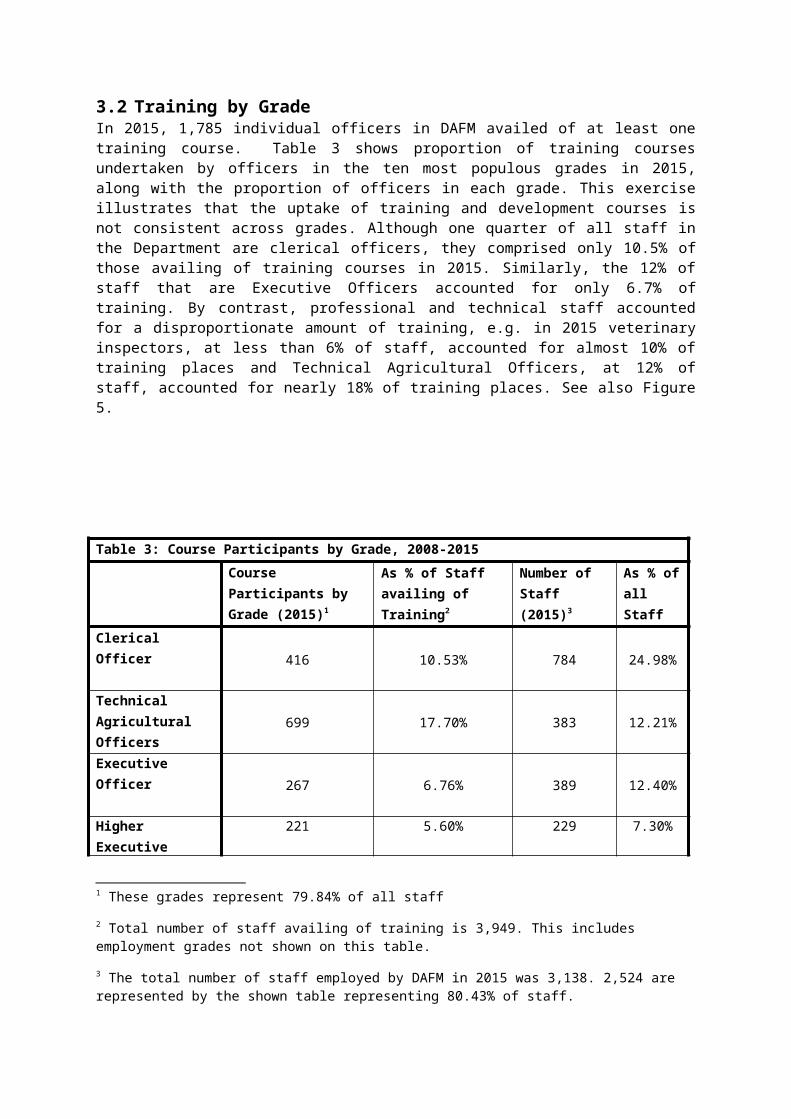
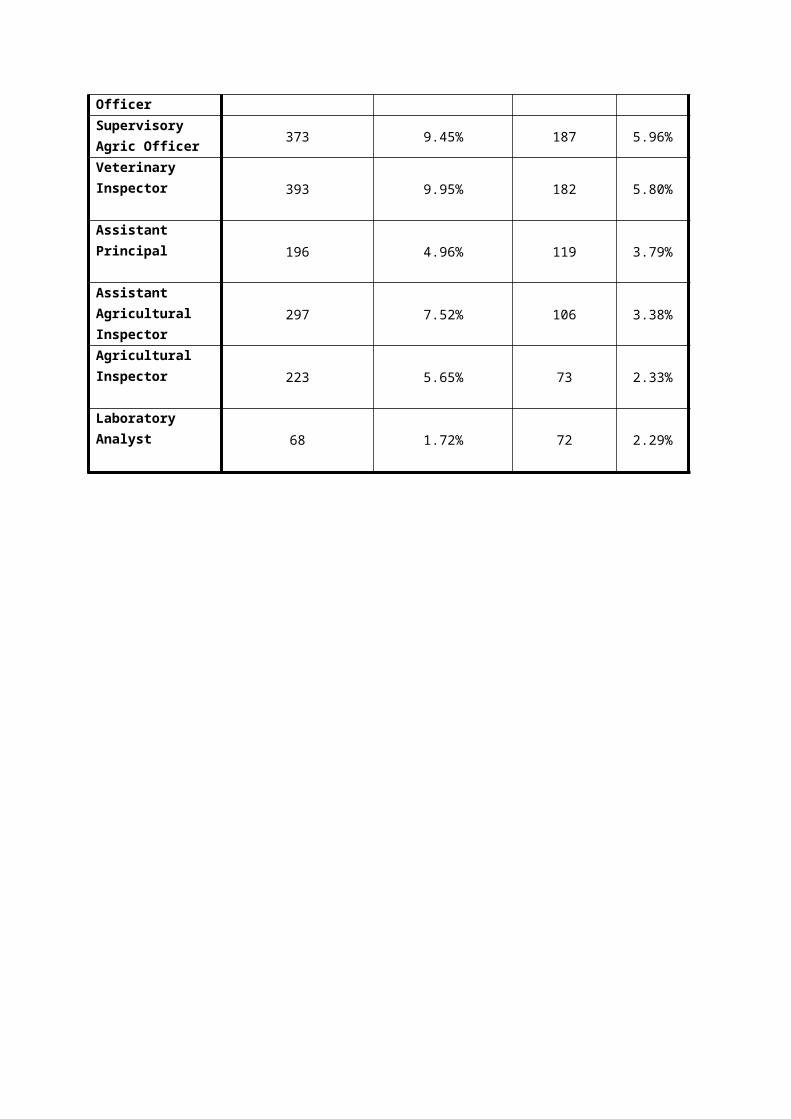
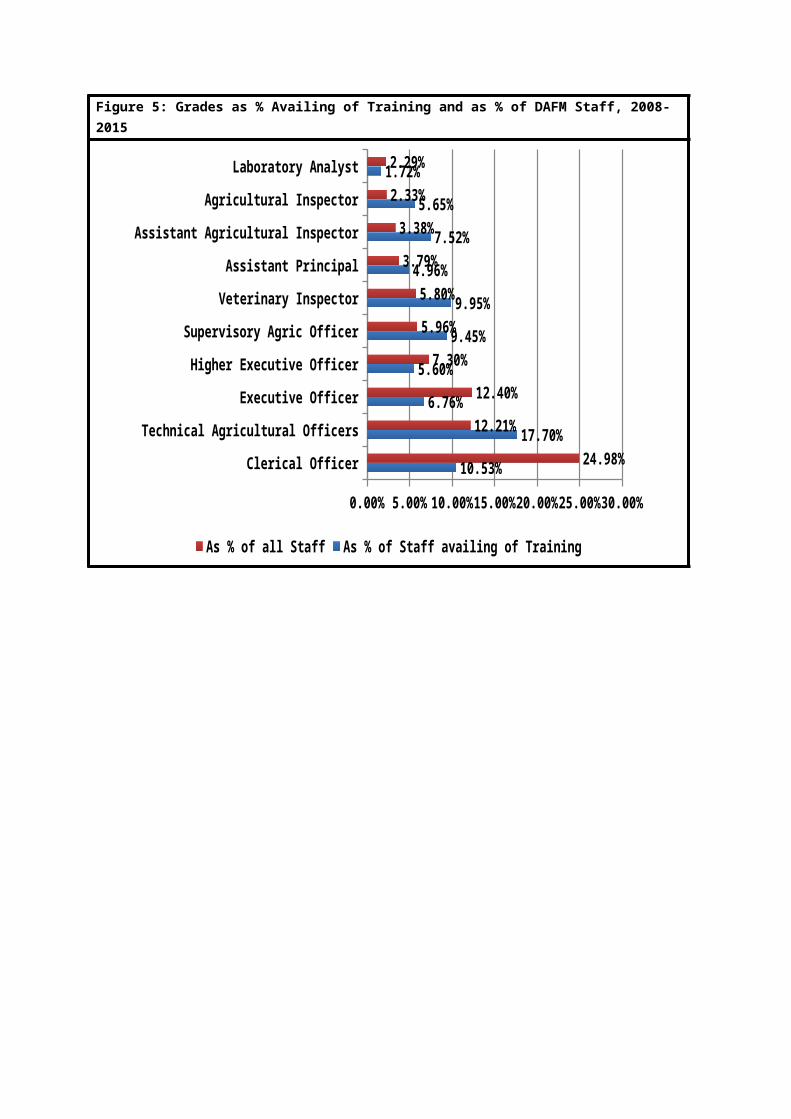
3.2 Training by GradeIn 2015, 1,785 individual officers in DAFM availed of at least one training course. Table 3 shows proportion of training courses undertaken by officers in the ten most populous grades in 2015, along with the proportion of officers in each grade. This exercise illustrates that the uptake of training and development courses is not consistent across grades. Although one quarter of all staff in the Department are clerical officers, they comprised only 10.5% of those availing of training courses in 2015. Similarly, the 12% of staff that are Executive Officers accounted for only 6.7% of training. By contrast, professional and technical staff accounted for a disproportionate amount of training, e.g. in 2015 veterinary inspectors, at less than 6% of staff, accounted for almost 10% of training places and Technical Agricultural Officers, at 12% of staff, accounted for nearly 18% of training places. See also Figure 5.
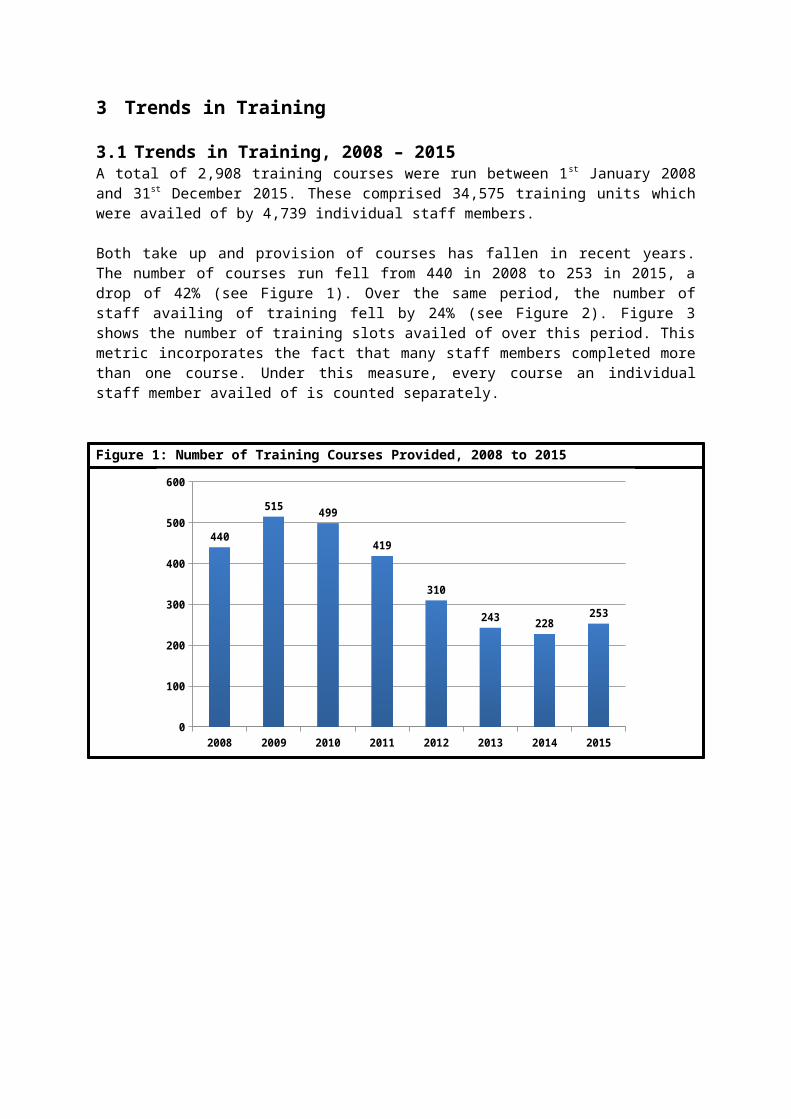
Table 3: Course Participants by Grade, 2008-2015
Course Participants by Grade (2015)1
As % of Staff availing of Training2
Number of Staff (2015)3
As % of all Staff
Clerical Officer416 10.53% 784 24.98%
Technical Agricultural Officers 699 17.70% 383 12.21%
Executive Officer267 6.76% 389 12.40%
Higher Executive Officer 221 5.60% 229 7.30%
Supervisory Agric Officer 373 9.45% 187 5.96%
Veterinary Inspector393 9.95% 182 5.80%
Assistant Principal196 4.96% 119 3.79%
Assistant Agricultural Inspector 297 7.52% 106 3.38%
Agricultural Inspector 223 5.65% 73 2.33%
Laboratory Analyst68 1.72% 72 2.29%
1 These grades represent 79.84% of all staff
2 Total number of staff availing of training is 3,949. This includes employment grades not shown on this table.
3 The total number of staff employed by DAFM in 2015 was 3,138. 2,524 are represented by the shown table representing 80.43% of staff.
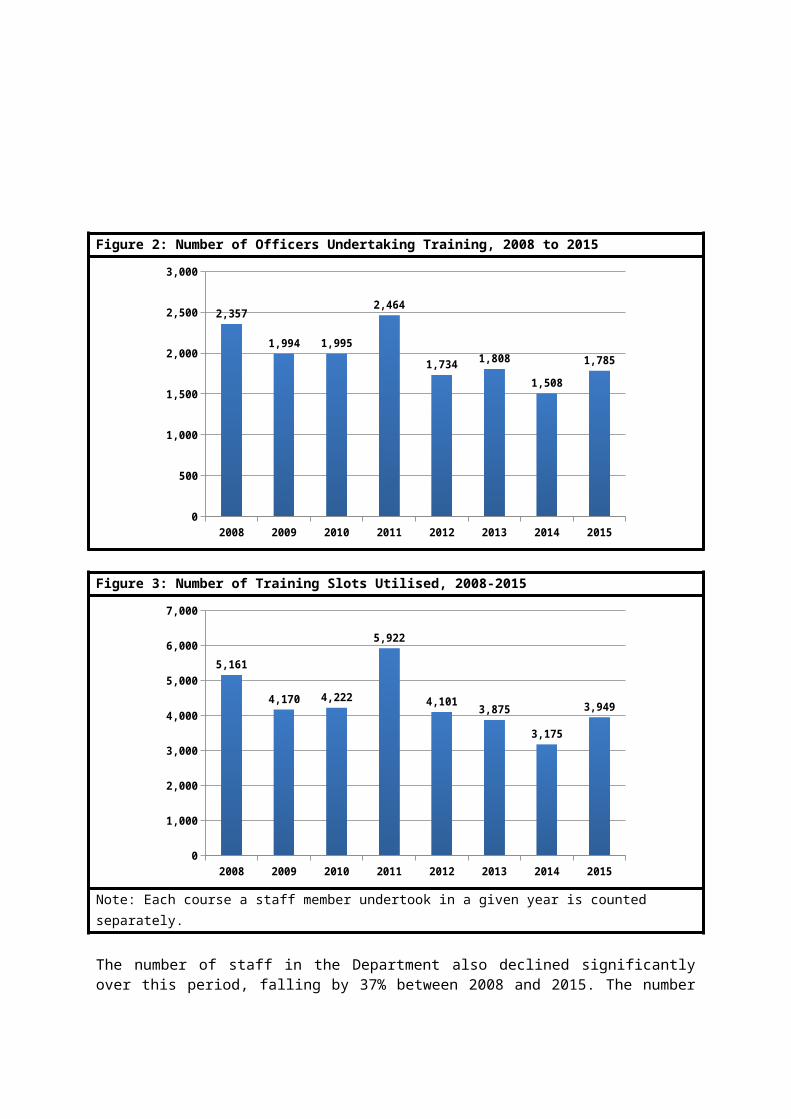
Figure 5: Grades as % Availing of Training and as % of DAFM Staff, 2008-2015
Clerical Officer
Technical Agricultural Officers
Executive Officer
Higher Executive Officer
Supervisory Agric Officer
Veterinary Inspector
Assistant Principal
Assistant Agricultural Inspector
Agricultural Inspector
Laboratory Analyst
0.00% 5.00% 10.00% 15.00% 20.00% 25.00% 30.00%
10.53%
17.70%
6.76%
5.60%
9.45%
9.95%
4.96%
7.52%
5.65%
1.72%
24.98%
12.21%
12.40%
7.30%
5.96%
5.80%
3.79%
3.38%
2.33%
2.29%
As % of all Staff As % of Staff availing of Training
3.3 Training by GenderFigure 6 shows the proportion of male and female employees who availed of a training course each year between 2008 and 2015. It is evident that male employees are more likely to attend training than female colleagues; in 2015, 65% of male employees undertook training compared to 47% female officers.
Figure 6: % of Male Staff and % of Female Staff who availed of training, 2008-2015
2008 2009 2010 2011 2012 2013 2014 20150%
10%
20%
30%
40%
50%
60%
70%
80%
40% 38% 37%
55%
31%
43%
35%
47%
55% 55%62%
72%
65% 65%
57%
65%
Female Male
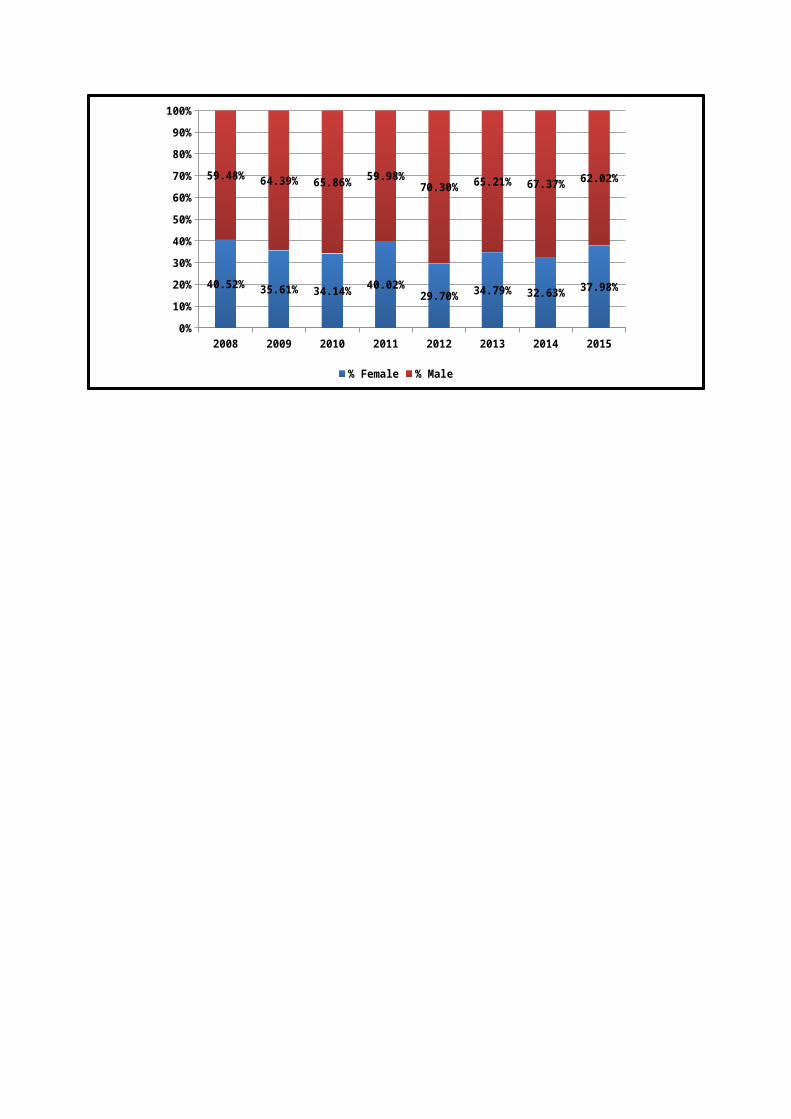
This result are supported by Figure 7 which shows the gender composition of those attending training.
Figure 7: % of those vailing of training, by Gender 2008-2015
2008 2009 2010 2011 2012 2013 2014 20150%
10%
20%
30%
40%
50%
60%
70%
80%
90%
100%
40.52% 35.61% 34.14% 40.02%29.70% 34.79% 32.63% 37.98%
59.48% 64.39% 65.86% 59.98%70.30% 65.21% 67.37% 62.02%
% Female % Male
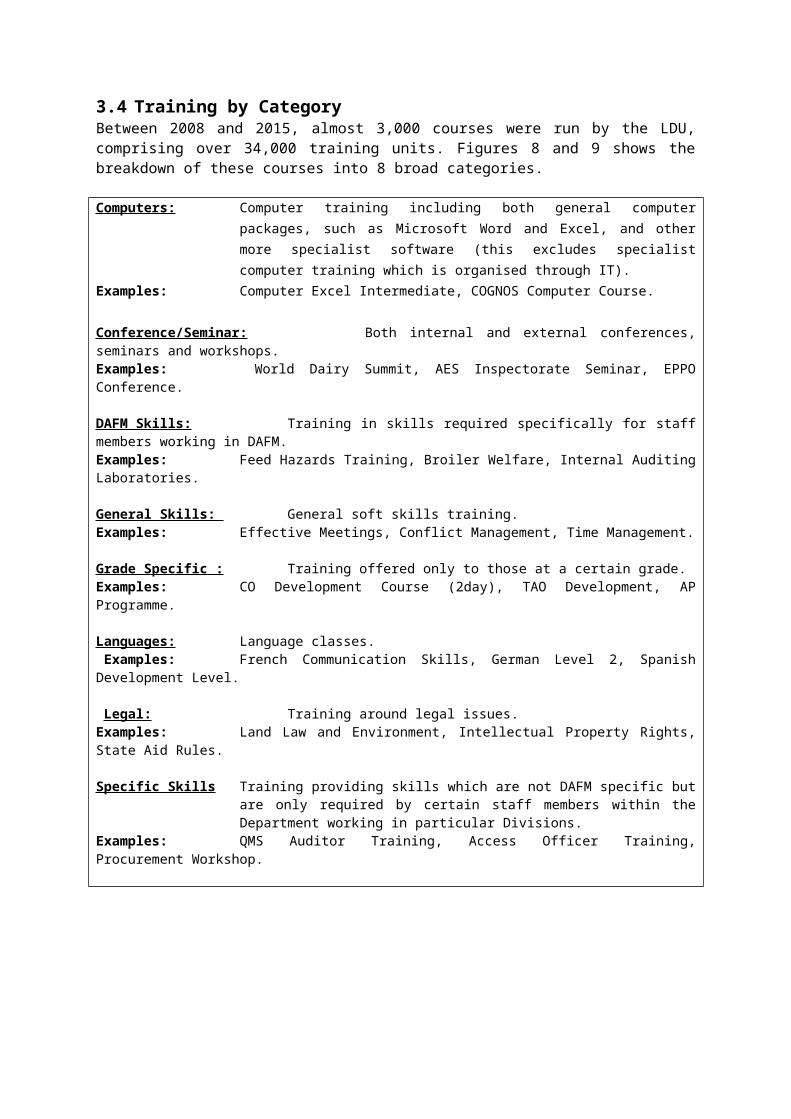
3.4 Training by CategoryBetween 2008 and 2015, almost 3,000 courses were run by the LDU, comprising over 34,000 training units. Figures 8 and 9 shows the breakdown of these courses into 8 broad categories.
Computers: Computer training including both general computer packages, such as Microsoft Word and Excel, and other more specialist software (this excludes specialist computer training which is organised through IT).
Examples: Computer Excel Intermediate, COGNOS Computer Course.
Conference/Seminar: Both internal and external conferences, seminars and workshops. Examples: World Dairy Summit, AES Inspectorate Seminar, EPPO Conference.
DAFM Skills: Training in skills required specifically for staff members working in DAFM.Examples: Feed Hazards Training, Broiler Welfare, Internal Auditing Laboratories.
General Skills: General soft skills training.Examples: Effective Meetings, Conflict Management, Time Management.
Grade Specific : Training offered only to those at a certain grade.Examples: CO Development Course (2day), TAO Development, AP Programme.
Languages: Language classes. Examples: French Communication Skills, German Level 2, Spanish Development Level.
Legal: Training around legal issues.Examples: Land Law and Environment, Intellectual Property Rights, State Aid Rules.
Specific Skills Training providing skills which are not DAFM specific but are only required by certain staff members within the Department working in particular Divisions.
Examples: QMS Auditor Training, Access Officer Training, Procurement Workshop.
The largest categories are “General Skills” and “DAFM Skills”.Figure 8: Categorisation of Courses by Number of Participants, 2008-2015
28%
28%
17%
10%
8%
4%3% 2%
DAFM SkillsGeneral SkillsConference/SeminarGrade SpecificComputersLegalSpecific SkillsLanguage
Total: 34,575 participants
Figure 9: Categorisation of Courses by Number of Courses, 2008-2015
16%
24%
14%6%
12%
6%
4%
17%
DAFM SkillsGeneral SkillsConference/SeminarGrade SpecificComputersLegalSpecific SkillsLanguage
Total: 2,908 courses
3.5 Training by Internal or External ProvisionWhere the LDU cannot meet formal training needs, it may consider funding an externally provided training programme. If approved, the LDU will cover the registration cost, but all other costs associated with travel and subsistence must be paid for by the Officer’s own cost centre.
On average just over one third of courses were provided internally between 2008 and 2015; this figure has ranged from 23% in 2009 to 44% in 2015. Just one of the 492 language courses provided
over this period was provided internally. By contrast, DAFM Skills and Grade Specific courses are generally provided internally.
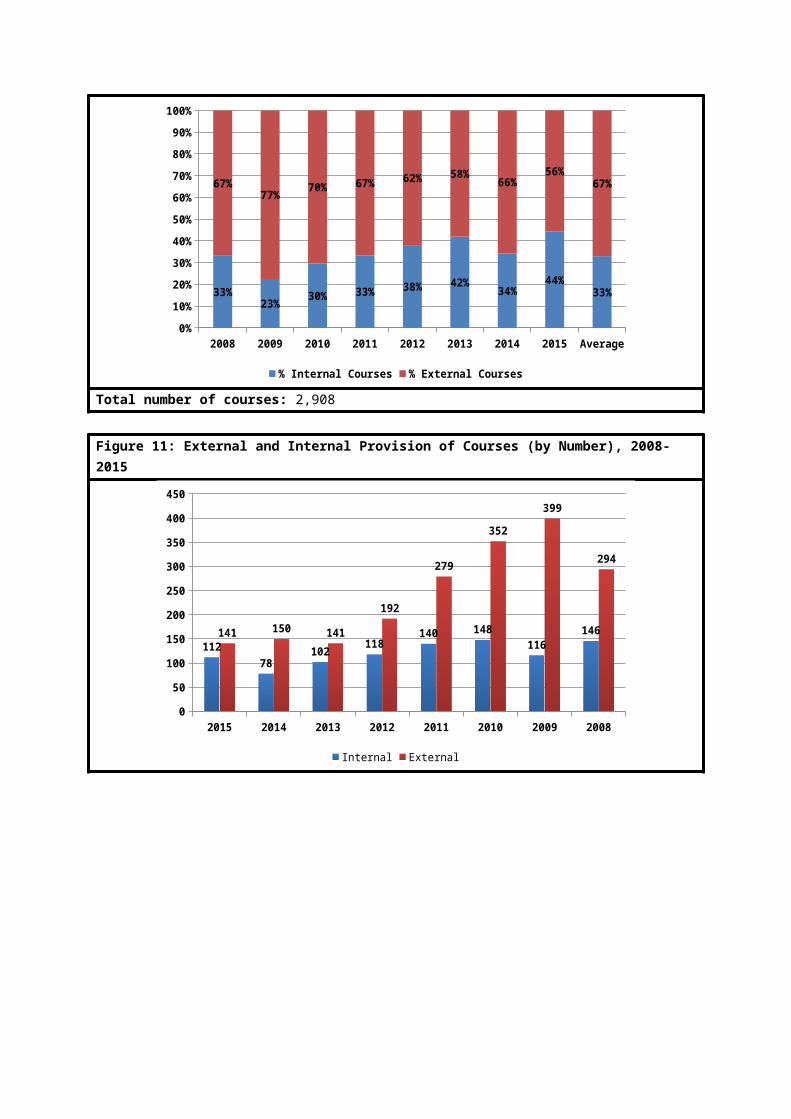
Figure 10: External and Internal Provision of Courses (%), 2008-2015
2008 2009 2010 2011 2012 2013 2014 2015 Average0%
10%
20%
30%
40%
50%
60%
70%
80%
90%
100%
33%23%
30% 33% 38% 42%34%
44%33%
67%77%
70% 67% 62% 58%66%
56%67%
% Internal Courses % External Courses
Total number of courses: 2,908
Figure 11: External and Internal Provision of Courses (by Number), 2008-2015
2015 2014 2013 2012 2011 2010 2009 20080
50
100
150
200
250
300
350
400
450
11278
102118
140 148116
146141 150 141
192
279
352
399
294
Internal External
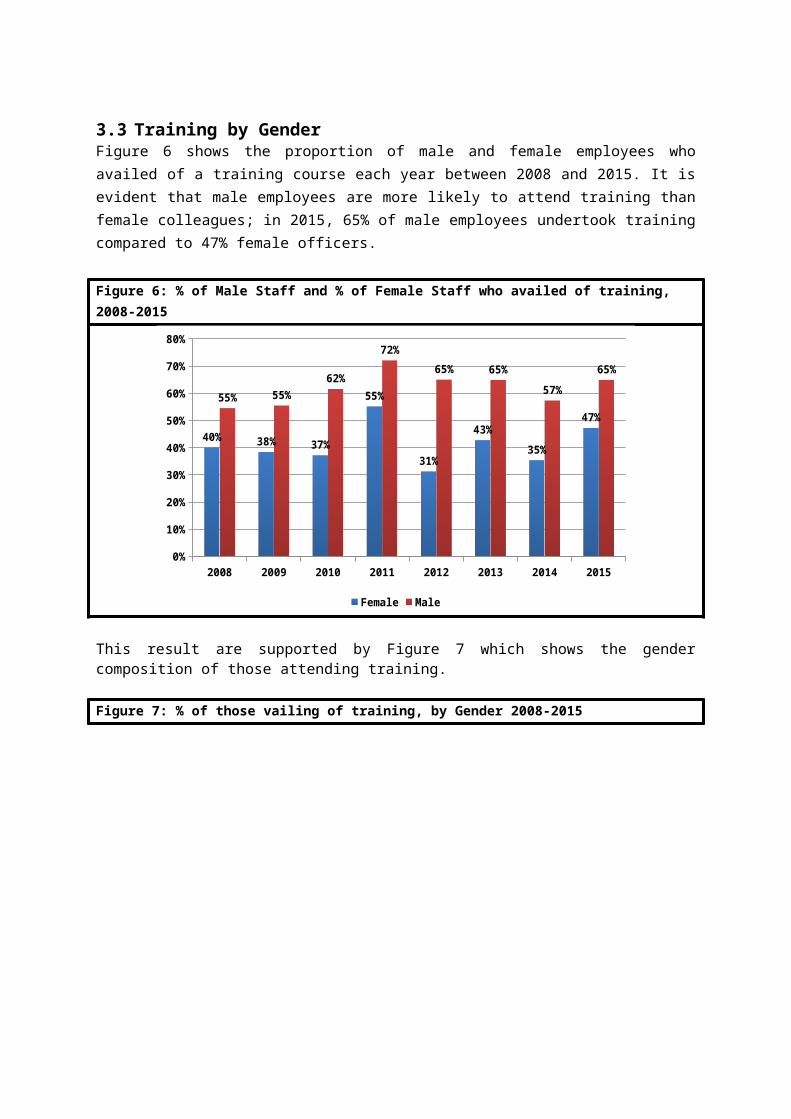
Figure 12: External and Internal Provision of Courses, 2008 to 2015
Computers
Conference/Seminar
DAFM Sk
ills
General Sk
ills
Grade Sp
ecific
Langu
age Legal
Specific S
kills
0
100
200
300
400
500
600
245
345
190
411
51
491
1259095
67
289 291
121
159 37
External(number) Internal(Number)
Total Number of Courses: 2,908
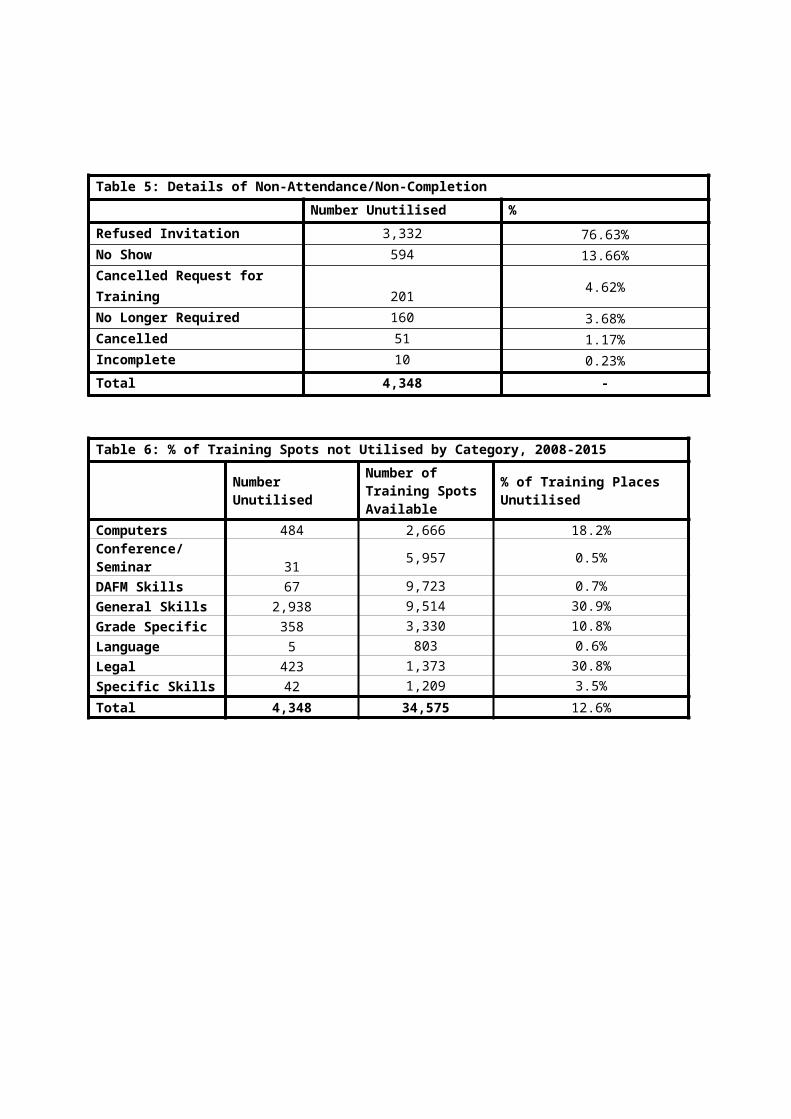
3.6 Non-Attendance at TrainingLDU report that officers requesting training and then cancelling their request or simply not attending can be a significant challenge. In the eight year period from 2008 and 2015, there were 4,348 cases of training Units not being filled, including 594 “no shows”. The details are in the tables below.
Table 4: Training Units not UtilisedNumber %
2015 281 6.6%2014 201 6.0%
2013 366 8.6%
2012 609 12.9%
2011 1,037 14.9%
2010 953 18.4%
2009 459 9.9%
2008 442 7.9%Average 2008-2015 543.5 -
Total 4,348 -
Table 5: Details of Non-Attendance/Non-Completion
Number Unutilised %
Refused Invitation 3,332 76.63%No Show 594 13.66%Cancelled Request for Training 201 4.62%No Longer Required 160 3.68%Cancelled 51 1.17%Incomplete 10 0.23%Total 4,348 -
Table 6: % of Training Spots not Utilised by Category, 2008-2015
Number Unutilised Number of Training Spots Available % of Training Places Unutilised
Computers 484 2,666 18.2%Conference/Seminar 31 5,957 0.5%
DAFM Skills 67 9,723 0.7%
General Skills 2,938 9,514 30.9%
Grade Specific 358 3,330 10.8%
Language 5 803 0.6%
Legal 423 1,373 30.8%
Specific Skills 42 1,209 3.5%
Total 4,348 34,575 12.6%
4 Budget
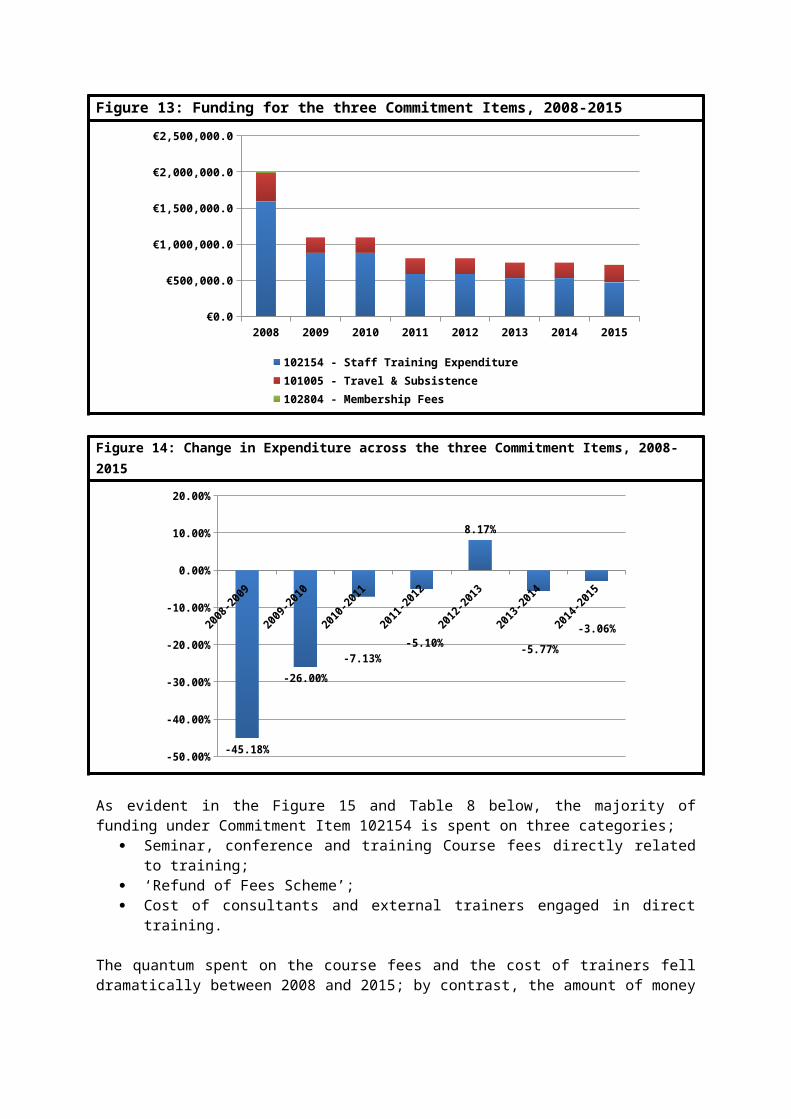
Funding for the LDU comes from three commitment items; 102154 (Staff Training Expenses), 101005 (Travel and Subsistence) and 102804 (Membership Fees). Membership Fees are paid for officers who are members of professional bodies.
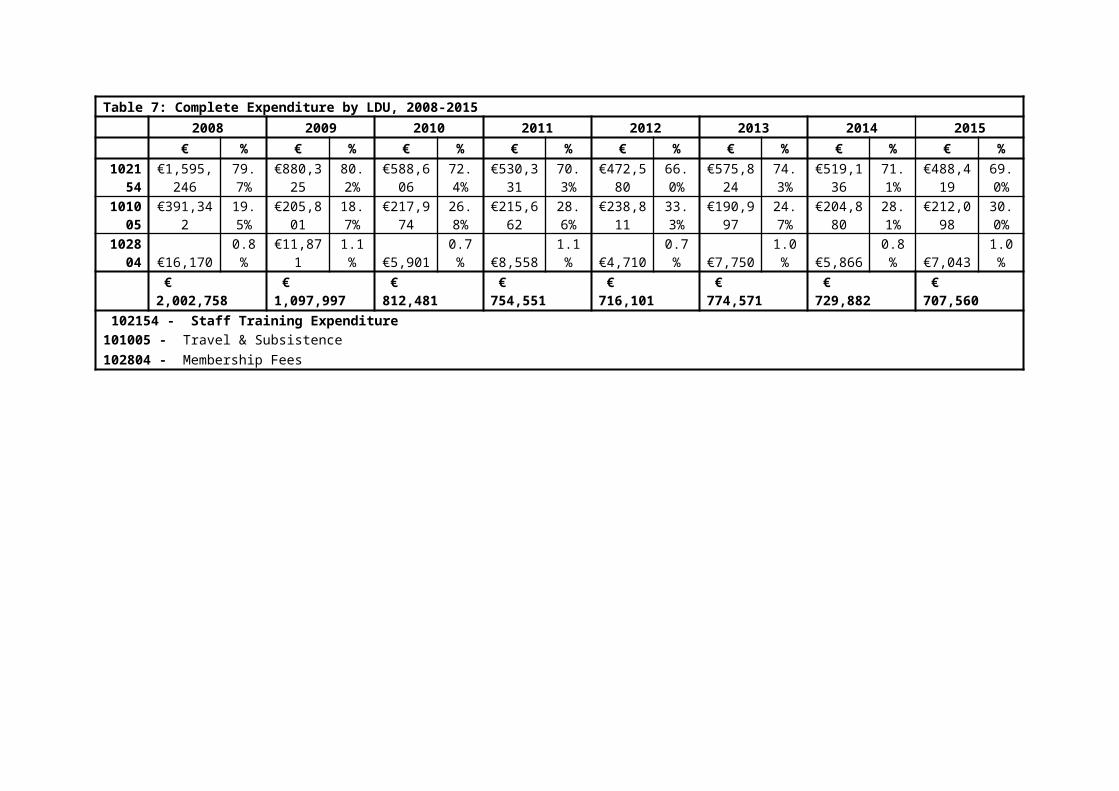
In 2015, expenditure totalled €707,560. However, Figures 13 and 14 show expenditure on training and development has declined significantly over recent years, falling 64.7% between 2008 and 2015. Note that this expenditure is only the costs of providing the training and does not include the costs of the staff and the resources used by the Unit (accommodation costs, IT equipment etc).
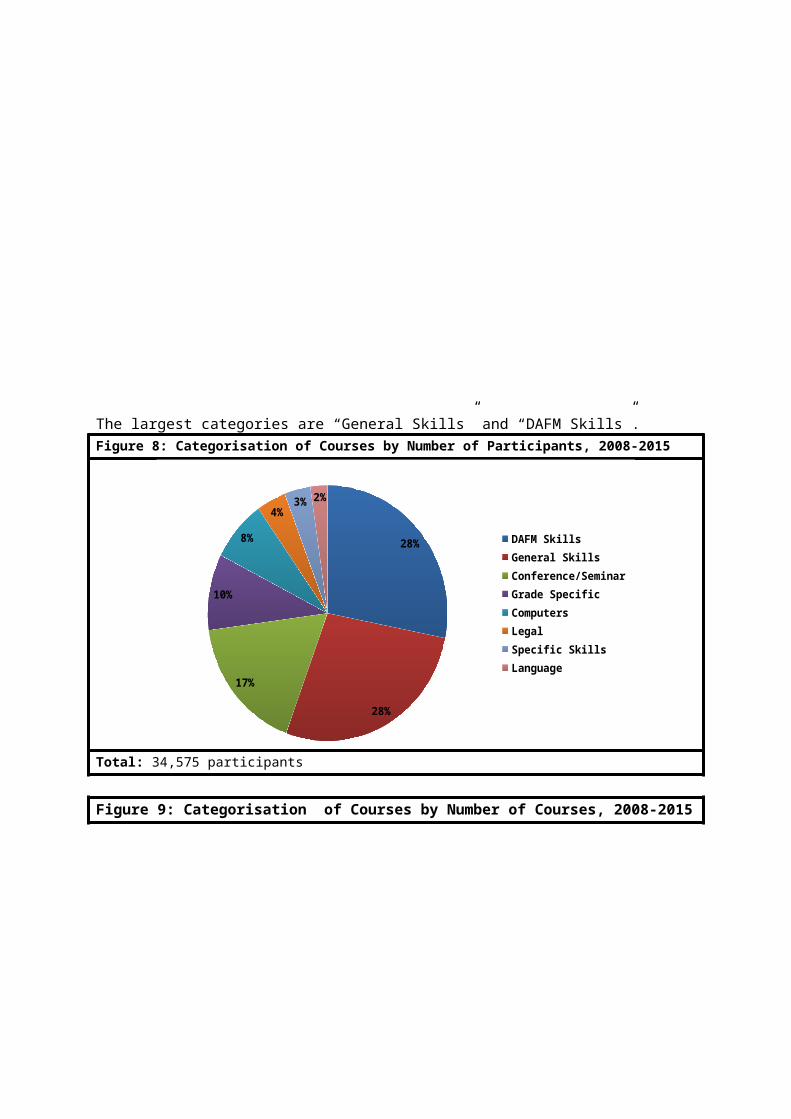
Table 7: Complete Expenditure by LDU, 2008-2015 2008 2009 2010 2011 2012 2013 2014 2015 € % € % € % € % € % € % € % € %10215
4€1,595,24
679.7
%€880,32
580.2
%€588,60
672.4
%€530,33
170.3
%€472,58
066.0
%€575,82
474.3
%€519,13
671.1
%€488,41
969.0
%10100
5 €391,34219.5
%€205,80
118.7
%€217,97
426.8
%€215,66
228.6
%€238,81
133.3
%€190,99
724.7
%€204,88
028.1
%€212,09
830.0
%10280
4 €16,170 0.8% €11,871 1.1% €5,901 0.7% €8,558 1.1% €4,710 0.7% €7,750 1.0% €5,866 0.8% €7,043 1.0% € 2,002,758 € 1,097,997 € 812,481 € 754,551 € 716,101 € 774,571 € 729,882 € 707,560 102154 - Staff Training Expenditure 101005 - Travel & Subsistence102804 - Membership Fees
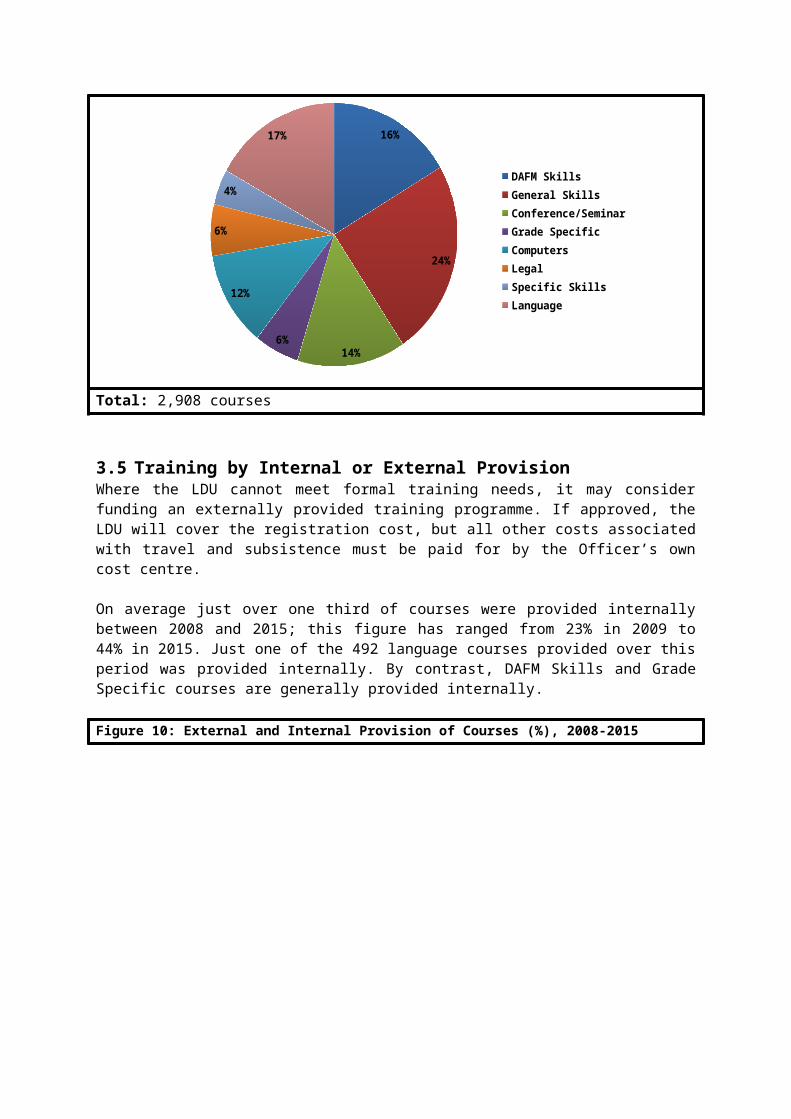
Figure 13: Funding for the three Commitment Items, 2008-2015
2008 2009 2010 2011 2012 2013 2014 2015€0.0
€500,000.0
€1,000,000.0
€1,500,000.0
€2,000,000.0
€2,500,000.0
102154 - Staff Training Expenditure 101005 - Travel & Subsistence102804 - Membership Fees
Figure 14: Change in Expenditure across the three Commitment Items, 2008-2015
2008-2009
2009-2010
2010-2011
2011-2012
2012-2013
2013-2014
2014-2015
-50.00%
-40.00%
-30.00%
-20.00%
-10.00%
0.00%
10.00%
20.00%
-45.18%
-26.00%
-7.13%-5.10%
8.17%
-5.77%
-3.06%
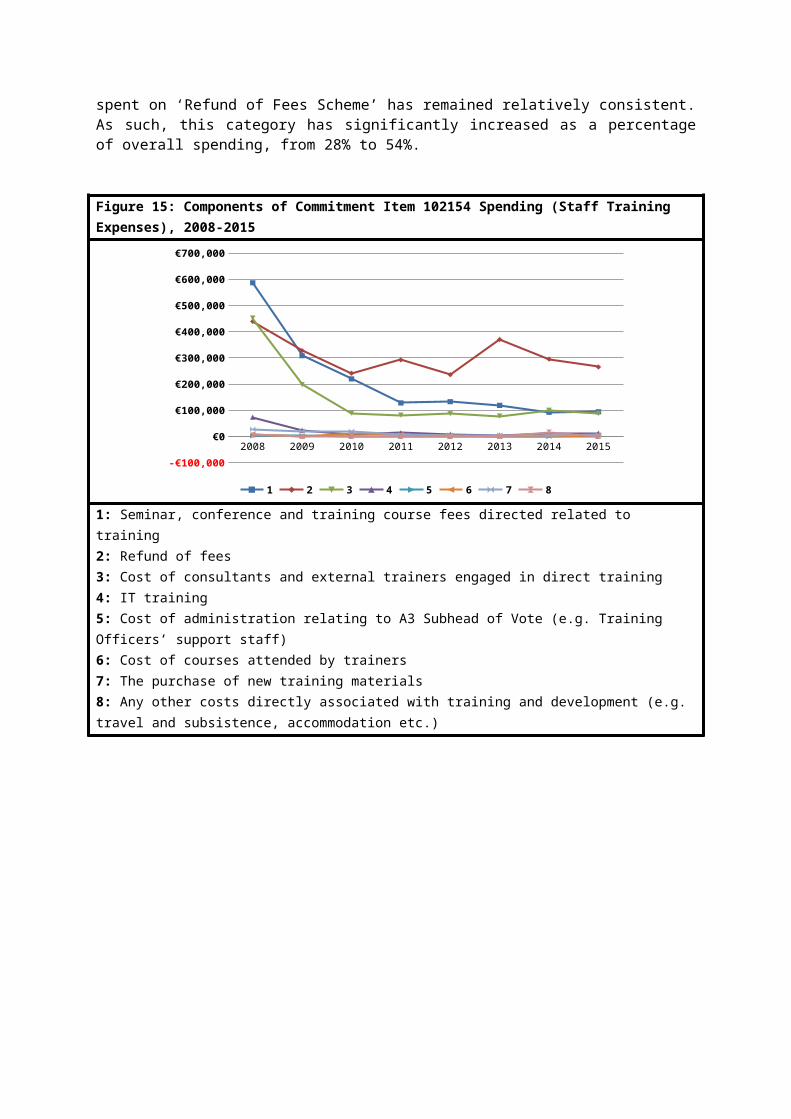
As evident in the Figure 15 and Table 8 below, the majority of funding under Commitment Item 102154 is spent on three categories;
Seminar, conference and training Course fees directly related to training; ‘Refund of Fees Scheme’; Cost of consultants and external trainers engaged in direct training.
The quantum spent on the course fees and the cost of trainers fell dramatically between 2008 and 2015; by contrast, the amount of money spent on ‘Refund of Fees Scheme’ has remained relatively consistent. As such, this category has significantly increased as a percentage of overall spending, from 28% to 54%.
Figure 15: Components of Commitment Item 102154 Spending (Staff Training Expenses), 2008-2015
2008 2009 2010 2011 2012 2013 2014 2015
-€100,000
€0
€100,000
€200,000
€300,000
€400,000
€500,000
€600,000
€700,000
1 2 3 4 5 6 7 8
1: Seminar, conference and training course fees directed related to training 2: Refund of fees3: Cost of consultants and external trainers engaged in direct training4: IT training5: Cost of administration relating to A3 Subhead of Vote (e.g. Training Officers’ support staff)6: Cost of courses attended by trainers7: The purchase of new training materials8: Any other costs directly associated with training and development (e.g. travel and subsistence, accommodation etc.)
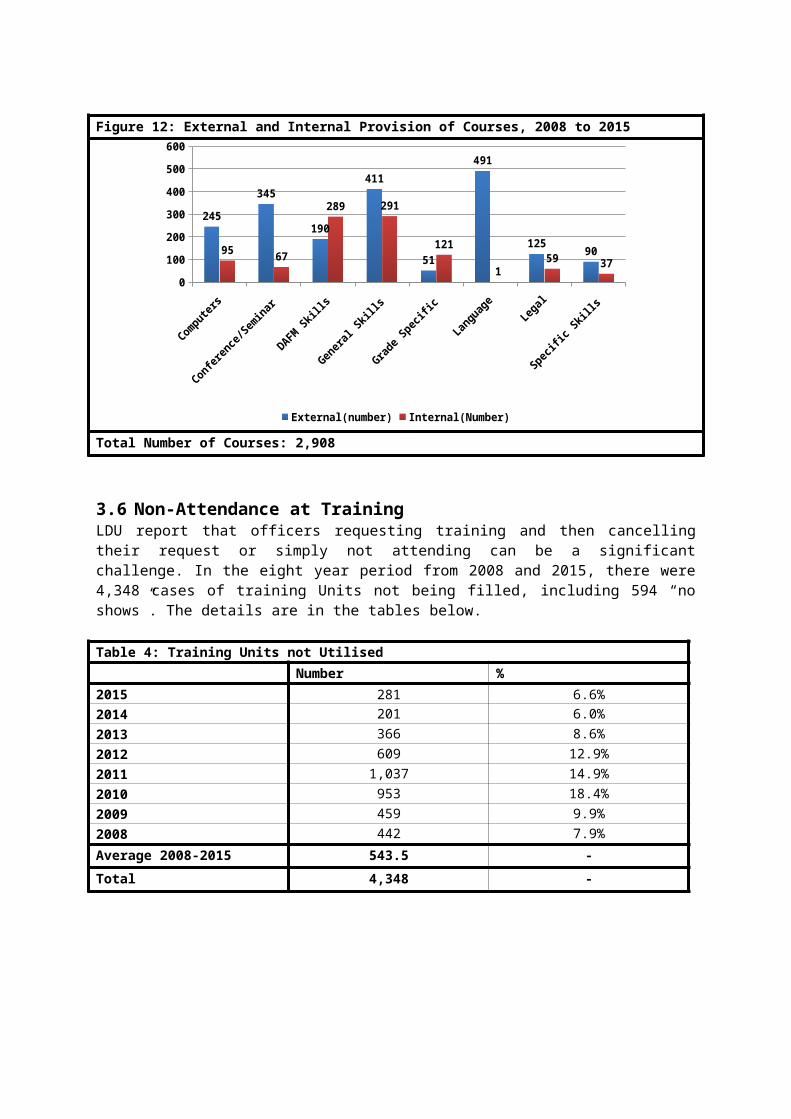
Table 8: Components of Commitment Item 102154 Spending (Staff Training Expenses), 2008-2015
2008 2009 2010 2011 2012 2013 2014 2015
€ % € % € % € % € % € % € % € %
1 €586,499 36.8% €308,437 35.0% €219,737 37.33% €128,019 24.1% €132,770 28.1% €118,507 20.6% €92,054 17.73% €94,272 19.30%2 €438,971 27.5% €327,495 37.2% €241,071 41.0% €292,184 55.1% €235,700 49.9% €369,941 64.2% €295,188 56.9% €265,137 54.28%3 €451,910 28.3% €198,049 22.5% €89,121 15.1% €81,554 15.4% €87,068 18.4% €78,023 13.5% €100,032 19.3% €87,710 17.96%4 €73,571 4.6% €23,429 2.7% €7,438 1.3% €13,551 2.6% €8,482 1.8% €4,239 0.7% €11,811 2.3% €12,400 2.54%5 €2,734 0.2% €1,898 0.2% €849 0.1% €461 0.1% -€124 0.0% €156 0.0% - 0.0% - 0.00%6 €8,648 0.5% - 0.0% €10,949 1.9% €7,575 1.4% €3,528 0.7% €275 0.0% €1,220 0.2% €5,327 1.09%7 €27,281 1.7% €20,638 2.3% €19,283 3.3% €6,864 1.3% €5,156 1.1% €4,403 0.8% €2,452 0.5% €5,573 1.14%8 €5,632 0.4% €380 0.0% €157 0.0% €122 0.0% - 0.0% €280 0.0% €16,380 3.2% - 0.00%
Other - - - - - - - - - - - - - - €18,000 3.69%
Total 1,595,246 100.0% 880,325 100.0% 588,606 100.0% 530,331 100.0%
472,580 100.0% 575,824 100.0%
519,136 100.0% €488,419 100.0%
1: Seminar, conference and training course fees directed related to training2: Refund of fees3: Cost of consultants and external trainers engaged in direct training4: IT training
5: Cost of administration relating to A3 Subhead of Vote6: Cost of courses attended by trainers7: The purchase of new training materials8: Any other costs directly associated with training and development
4.1 Average Cost of Training per Course and per Participant The average cost to deliver a course in 2015 was €1,931, with an average cost of €124 per participant. This is a significant decrease since 2008 when the average cost was €310 per participant.
Table 9: Average Cost per Course, 2008-2015
Courses run per year
Costs Incurred(Commitment Item 102154)
Average Cost per Course
% Change on Previous Year
2008 440 €1,595,246.37 €3,625.56 -2009 515 €880,324.69 €1,709.37 -52.9%2010 499 €588,605.6 €1,179.57 -31.0%2011 419 €530,330.61 €1,265.71 7.3%2012 310 €472,580.31 €1,524.45 20.4%2013 243 €575,823.97 €2,369.65 55.4%2014 228 €519,136.47 €2,276.91 -3.9%2015 253 €488,419.32 €1,930.51 -15.2%
Table 10: Average Cost per Participant, 2008-2015
Participants per year
Costs Incurred(Commitment Item 102154)
Average Cost per Participant
% Change on Previous Year
2008 5,161 €1,595,246.37 €309.10 -2009 4,170 €880,324.69 €211.11 -31.7%2010 4,222 €588,605.6 €139.41 -34.0%2011 5,922 €530,330.61 €89.55 -35.8%2012 4,101 €472,580.31 €115.24 28.7%2013 3,875 €575,823.97 €148.60 29.0%2014 3,175 €519,136.47 €163.51 10.0%2015 3,949 €488,419.32 €123.68 -24.4%

5 Identification of Needs
PMDS is the framework within which individual work performance and development needs are actively managed, both by the individual line manager and the organisation as a whole. Training needs are generally identified by staff in conjunction with their managers through the PMDS system. Staff can officially apply for up to three courses annually, with training requests made electronically through the ePMDS system. However, LDU are having difficulties extracting information in a suitable format from the ePMDS reports. As such, staff were asked in 2014 and 2015 to complete a ‘Formal Training Course Application Form’ if they required formal training, irrespective of whether or not they had made a Learning and Development request on the ePMDS system. The LDU report, however, that they have not received all training requests in hard copy.
Specialist needs of technical, scientific veterinary, forestry and engineering staff are identified through annual discussions between the LDU and senior management.
In 2012, all Heads of Division were asked to nominate an officer to be trained in Training Needs Analysis. Approximately half of the nominated staff were trained (some Divisions failed to nominate an officer; others did not attend the training). The trained staffs were asked to carry out a Training Needs Analysis of their divisions with their 2013 Business Plan. Despite reminders, this was only completed in five Divisions.
6 Refund of Fees
6.1 OverviewThe Refund of Fees Scheme is a Civil Service-wide scheme implemented by each Government Department/Office in line with Department of Finance Circular 23/07. The Department of Agriculture, Food and the Marine has developed its own policy document based on it, which outlines the specific criteria for implementing the scheme in this Department. The scheme is open to all staff members in the Department of Agriculture, Food and the Marine who wish to pursue 2nd or 3rd level courses of education. The proposed course must meet the following criteria:
It must be deemed by the Head of the Department to be relevant to the Civil Service employment of the officer(s) attending it
It must lead to a second or third level educational, professional or vocational qualification It must be provided by a recognized educational institution or professional body It must be pursued primarily in the officer's own time It must meet the conditions outlined in the Department’s Funding of Fees Policy Document.
Those availing of refund of fees are required to:(1) Share the knowledge and skills acquired through the course of study with colleagues as requested.(2) Complete one year's service (i.e. a period of 12 months) for each academic year of the course funded. The Department will require repayment of monies where this condition is not met. The academic years or course periods themselves do not reckon as service in this context.(3) Repaying fees paid to educational institutions by the Department in full, following failure of the applicant to complete a course year. However, it is not necessary for the officer to pass exams. In relation to the level of funding the following limits apply-
1. The maximum amount payable for any one academic year in respect of an undergraduate course is €5,000.
2. The maximum amount payable for any one academic year in respect of a postgraduate course is €6,000.
3. The maximum payable in respect of any total course duration is €20,000. Payment may be made only once in respect of any academic year or course period – i.e. fees will not be paid to repeat a year. Funding relates to the cost of tuition and exam fees only. Ancillary costs associated with participation in a course (books, copying, binding, travel, subsistence etc) are not funded under the scheme.
The Department pays academic fees for approved courses directly to the academic institution. The officer is not required to pass the exams or assessment, but must sit all examinations and complete the course year. It was felt that requiring participants to pass examinations would act as a disincentive to participation for those officers who lack confidence in their academic ability.
Prior to the 2013/14 academic year, funding was paid on a refund basis. The Department currently operates a policy of advance payment. This is intended to make the scheme more accessible to all staff, especially staff on lower pay. Since the introduction of advanced funding two staff members have been unable to complete their courses. Refunds to the Department have been made in both cases.
In the interests of affording the maximum number of staff an opportunity to pursue a third level programme in a relevant discipline, the following limitations apply:
Having completed an Undergraduate course, a period of 2 years must elapse from the date of completion before approval can be granted for further study under this scheme.
In the case of PHDs, a period of 3 years must have elapsed from the date of completion before approval can be granted for further study under this scheme.
In specific cases, however, further study may be pursued in consecutive years, provided the study is within the same discipline and forms an integral part of the same qualification.
6.2 Refund of Fees Scheme, 2014-15In the 2014-15 academic year, DAFM paid fees for 85 courses. A total of €266,276.57 was expended, resulting in an average fee per officer of €3,132, ranging from €120 to €12,600. The distribution of fees is quite skewed, with a large number of courses charging relatively low fees and a small number charging quite high amounts; only 28.2% of fees refunded are above the average.
Table 11: Amount Paid by DAFM: Summary Statistics
Observations 85Average/Mean €3,132.67Minimum €120Maximum €12,600Number above Mean 24 (28.2%)Number below Mean 61 (71.8%)
A scatterplot of fees refunded is shown below.Figure 16: Scatterplot of Fees
Total: 85
Approximately two thirds of the courses undertaken by officers are postgraduate courses. The level of the courses undertaken is indicated in the table and figure below.
Table 12: Levels of Courses Undertaken, 2014-2015
Diploma (Level 6) 9 10.6%Higher Certificate (Level 6) 4 4.7%Ordinary Bachelor Degree (Level 7) 18 21.2%Higher Diploma (Level 8) 2 2.4%Honours Bachelor Degree (Level 8) 25 29.4%Masters Degree (Level 9) 19 22.4%Post Graduate Diploma (Level 9) 3 3.5%Doctoral Degree (Level 10) 4 4.7%Professional Qualification 1 1.2%
Total 85 100%
Figure 17: Levels of Courses Undertaken 2014-2015
10.6%
4.7%
21.2%
2.4%29.4%
22.4%
3.5%4.7%
1.2%
Diploma (Level 6)Higher Certificate (Level 6)Ordinary Bachelor Degree (Level 7)Higher Diploma (Level 8)Honours Bachelor Degree (Level 8)Masters Degree (Level 9)Post Graduate Diploma (Level 9)Doctoral Degree (Level 10)Professional Qualification
Total: 85
Almost half of all courses taken were at the Institute of Public Administration (IPA). Table 13: Institutions at which DAFM Officers Study
Institution Number Percent
IPA 42 49.4%Cork Institute of Technology 6 7.1%The Open University 5 5.9%UCD 3 3.5%Dublin Business School 2 2.4%The Honourable Society of King's Inn 2 2.4%University College Cork 2 2.4%Carlow IT 1 1.2%Centre de Europeen de Recherches 1 1.2%Communications and Management Inst 1 1.2%DIT 1 1.2%Dublin Institute of Technology 1 1.2%Dublin Tutorial Centre 1 1.2%Griffith College 1 1.2%IBC Academy 1 1.2%Independent College 1 1.2%Letterkenny Institute of Technology 1 1.2%NUI Galway 1 1.2%Queens University Belfast 1 1.2%SOAS, University of London 1 1.2%Scottish Rural University College 1 1.2%Trinity College 1 1.2%UCC 1 1.2%UCD Michael Smurfit Graduate Business.. 1 1.2%UCD/Smurfit Business School 1 1.2%University Limerick 1 1.2%University of Bristol 1 1.2%University of London 1 1.2%Wexford Campus IT Carlow 1 1.2%CMIT 1 1.2%
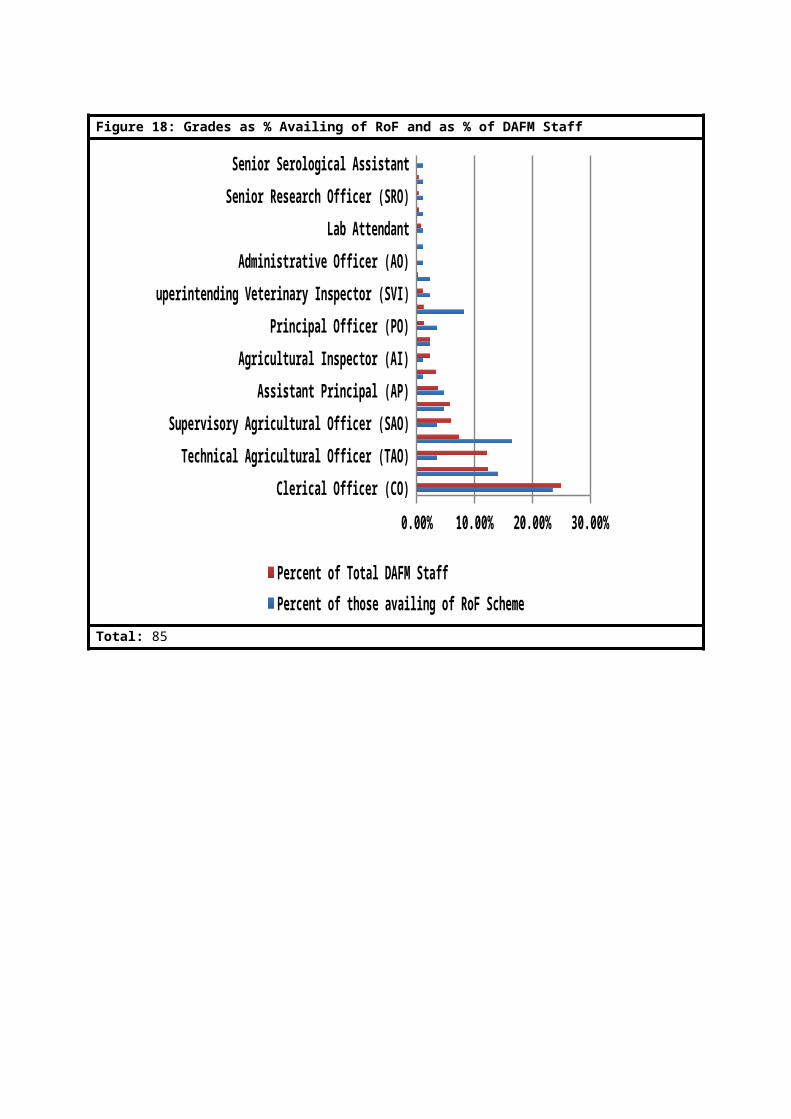
The table and figures below show the top ten most populous grades as a proportion of those availing of the ‘Refund of Fees Scheme’, and as a percentage of overall DAFM staff. COs comprise the largest single grade within the Department and also make up the highest proportion availing of the scheme, making up 23% of all staff members and 23% of all participants on the scheme. The proportion of HEOs and Serological Assistants availing of scheme is significantly higher than the percentage of these grades within the Department. By contrast, TAOs and SAOs make up a smaller than expected proportion of those reclaiming fees.
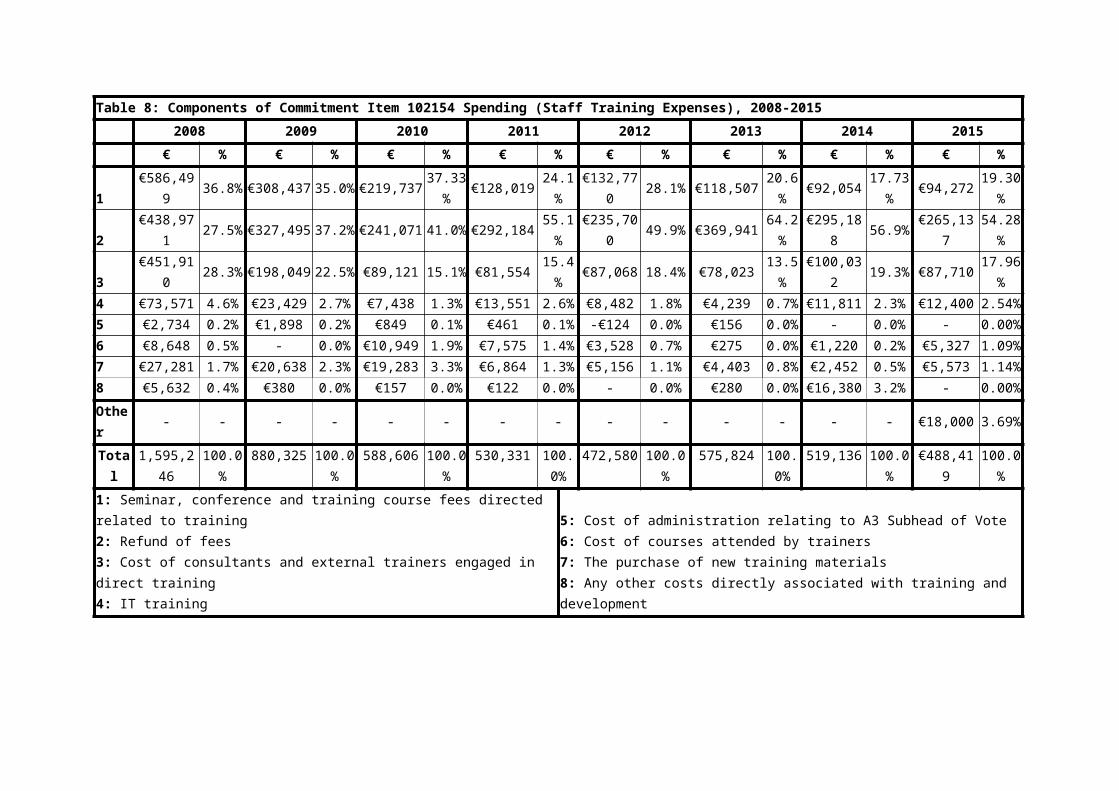
Table 14: Grades as % Availing of Refund of Fees and as % of DAFM Staff
Freq.
Percent of those availing of RoF
Scheme
Percent of Total DAFM Staff
Clerical Officer (CO) 20 23.50% 25.0%Executive Officer (EO) 12 14.10% 12.4%Technical Agricultural Officer (TAO) 3 3.50% 12.2%Higher Executive Officer (HEO) 14 16.50% 7.3%Supervisory Agricultural Officer (SAO) 3 2.40% 6.0%Veterinary Inspector (VI) 4 4.70% 5.8%Assistant Principal (AP) 4 4.70% 3.8%Assistant Agricultural Inspector (AAI) 1 1.20% 3.4%Agricultural Inspector (AI) 1 1.20% 2.3%Lab Analyst 2 2.40% 2.3%Principal Officer (PO) 3 3.50% 1.2%Serological Assistant 7 7.10% 1.2%Superintending Veterinary Inspector (SVI) 2 2.40% 1.1%Supervising Serological Assistant 2 2.40% 0.3%Administrative Officer (AO) 1 1.20% 0.1%Engineer G1 1 1.20% 0.1%Lab Attendant 1 1.20% 0.8%Research Officer (RO) 1 1.20% 0.5%Senior Research Officer (SRO) 1 1.20% 0.4%Seed Analyst 1 1.20% 0.4%Senior Serological Assistant 1 1.20% 0.0%
Total 85
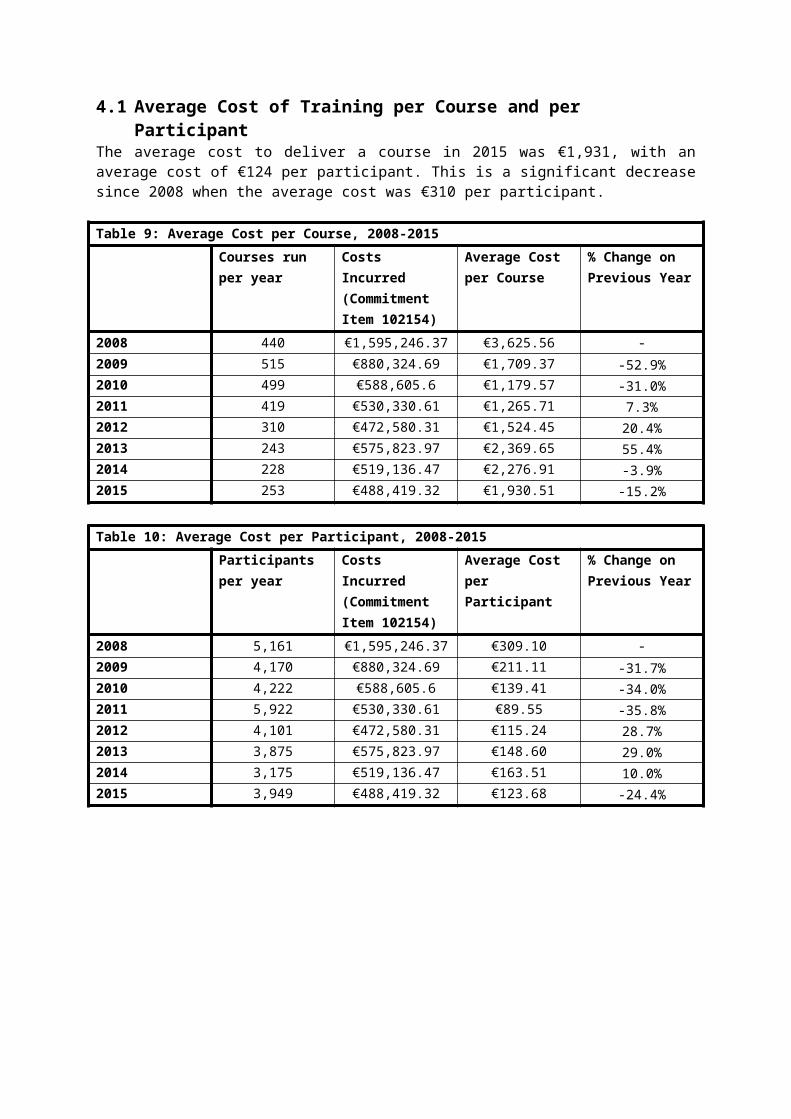
Figure 18: Grades as % Availing of RoF and as % of DAFM Staff
Clerical Officer (CO)
Technical Agricultural Officer (TAO)
Supervisory Agricultural Officer (SAO)
Assistant Principal (AP)
Agricultural Inspector (AI)
Principal Officer (PO)
Superintending Veterinary Inspector (SVI)
Administrative Officer (AO)
Lab Attendant
Senior Research Officer (SRO)
Senior Serological Assistant
0.00% 5.00% 10.00% 15.00% 20.00% 25.00% 30.00%
Percent of Total DAFM Staff Percent of those availing of RoF SchemeTotal: 85

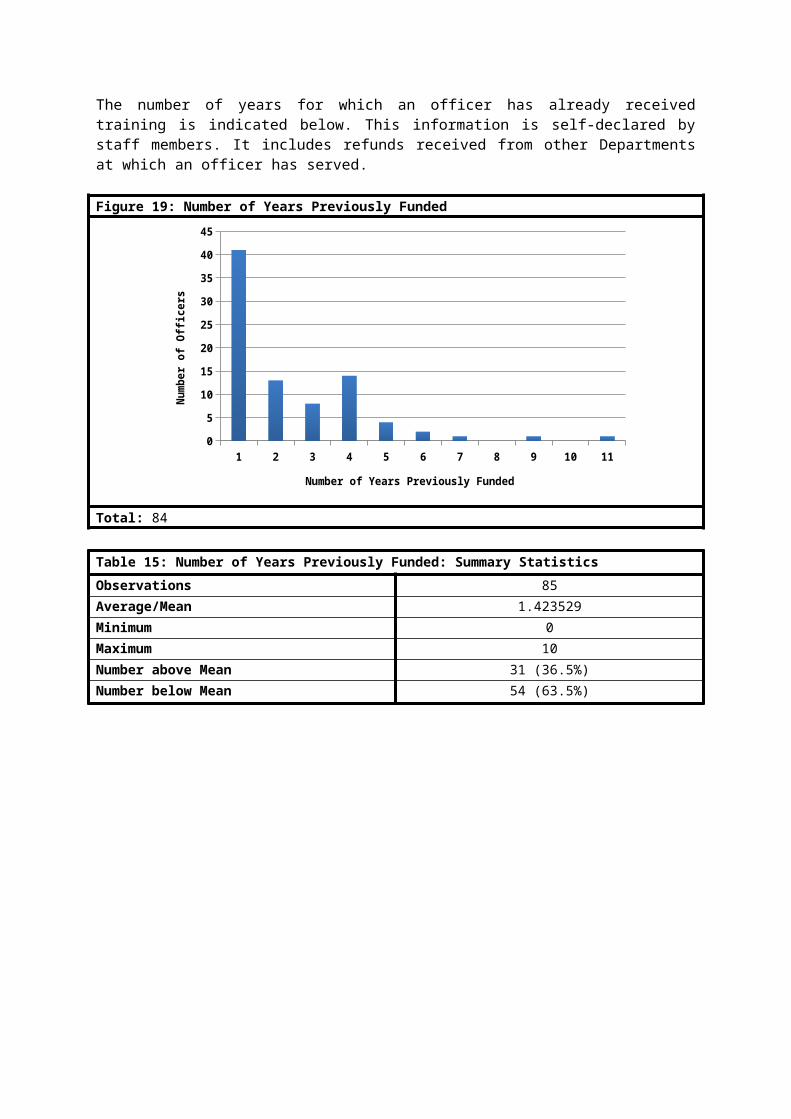
The number of years for which an officer has already received training is indicated below. This information is self-declared by staff members. It includes refunds received from other Departments at which an officer has served.
Figure 19: Number of Years Previously Funded
1 2 3 4 5 6 7 8 9 10 110
5
10
15
20
25
30
35
40
45
Number of Years Previously Funded
Num
ber o
f Offi
cers
Total: 84
Table 15: Number of Years Previously Funded: Summary Statistics
Observations 85Average/Mean 1.423529Minimum 0Maximum 10Number above Mean 31 (36.5%)Number below Mean 54 (63.5%)
7 Survey of Heads of Divisions
A survey was created using the SurveyMonkey website and circulated via email to 64 Heads of Divisions (HoDs) and acting HoDs. It was available for completion between 26 th November 2015 and 18th December 2015, with a reminder email sent on 4th December.
A total of 40 HoDs completed the survey, a response rate of 62.5%. The average size of the division headed by the HoDs who answered the survey was 44.3, ranging from four to 160. In order to encourage honest feedback, the answers were anonymised.
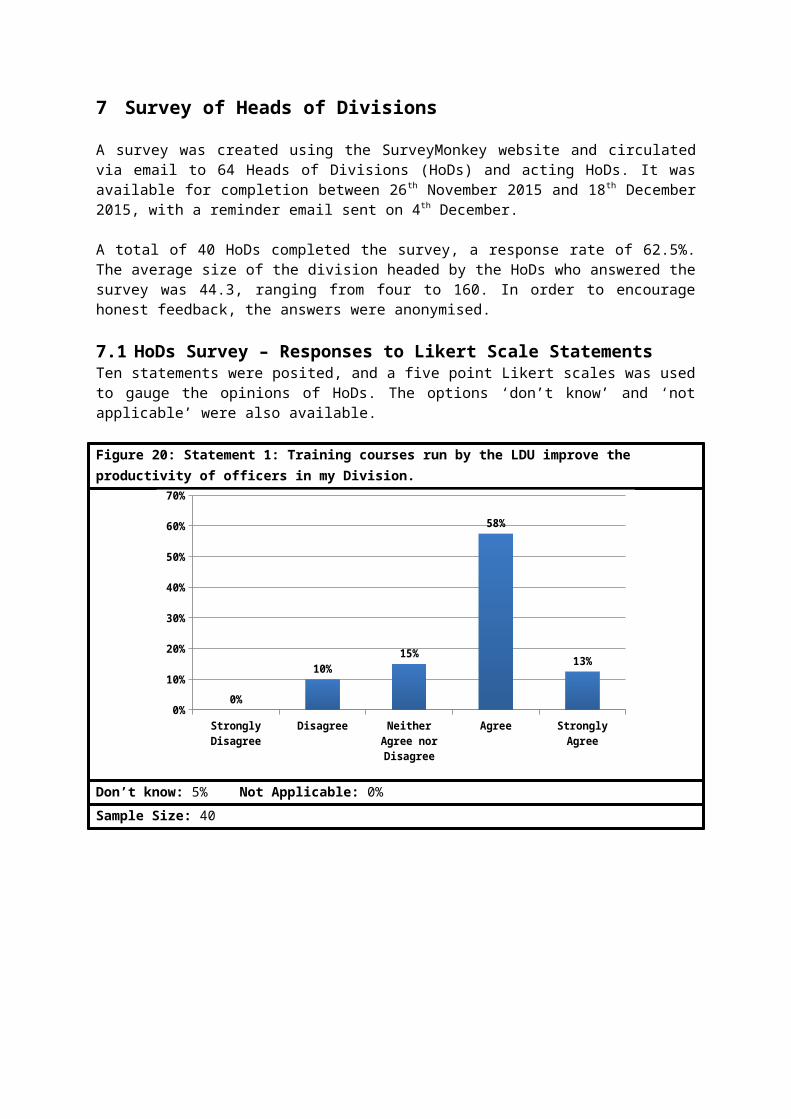
7.1 HoDs Survey – Responses to Likert Scale StatementsTen statements were posited, and a five point Likert scales was used to gauge the opinions of HoDs. The options ‘don’t know’ and ‘not applicable’ were also available.
Figure 20: Statement 1: Training courses run by the LDU improve the productivity of officers in my Division.
Strongly Disagree Disagree Neither Agree nor Disagree
Agree Strongly Agree0%
10%
20%
30%
40%
50%
60%
70%
0%
10%15%
58%
13%
Don’t know: 5% Not Applicable: 0%
Sample Size: 40

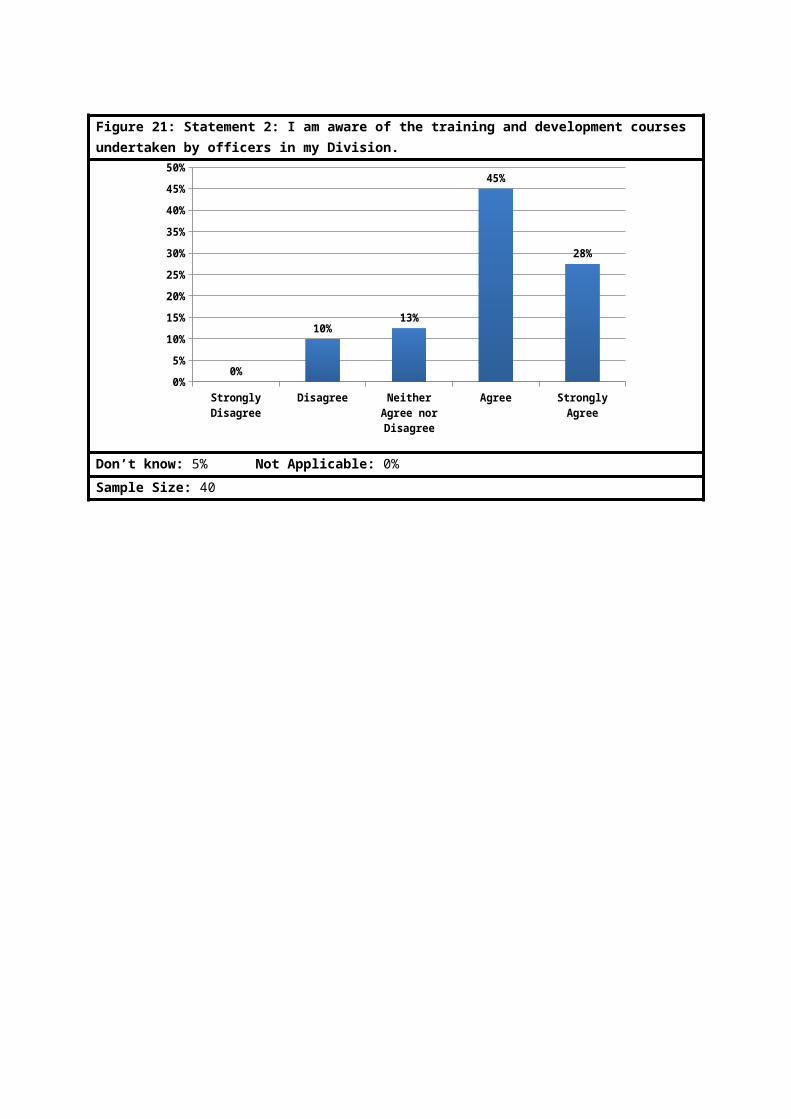
Figure 21: Statement 2: I am aware of the training and development courses undertaken by officers in my Division.
Strongly Disagree Disagree Neither Agree nor Disagree
Agree Strongly Agree0%
5%
10%
15%
20%
25%
30%
35%
40%
45%
50%
0%
10%13%
45%
28%
Don’t know: 5% Not Applicable: 0%
Sample Size: 40
Figure 22: Statement 3: The refund of fees scheme improves the productivity of officers in my Division.
Strongly Disagree Disagree Neither Agree nor Disagree
Agree Strongly Agree0%
5%
10%
15%
20%
25%
30%
35%
0%
10%
33%
25%
20%
Don’t know: 2.5% Not Applicable: 10%
Sample Size: 40
Figure 23: Statement 4: The PMDS system adequately captures training and development needs of officers in my Division.
Strongly Disagree Disagree Neither Agree nor Disagree
Agree Strongly Agree0%
5%
10%
15%
20%
25%
30%
35%
40%
5%
25% 25%
38%
8%
Don’t know: 0% Not Applicable: 0%
Sample Size: 40
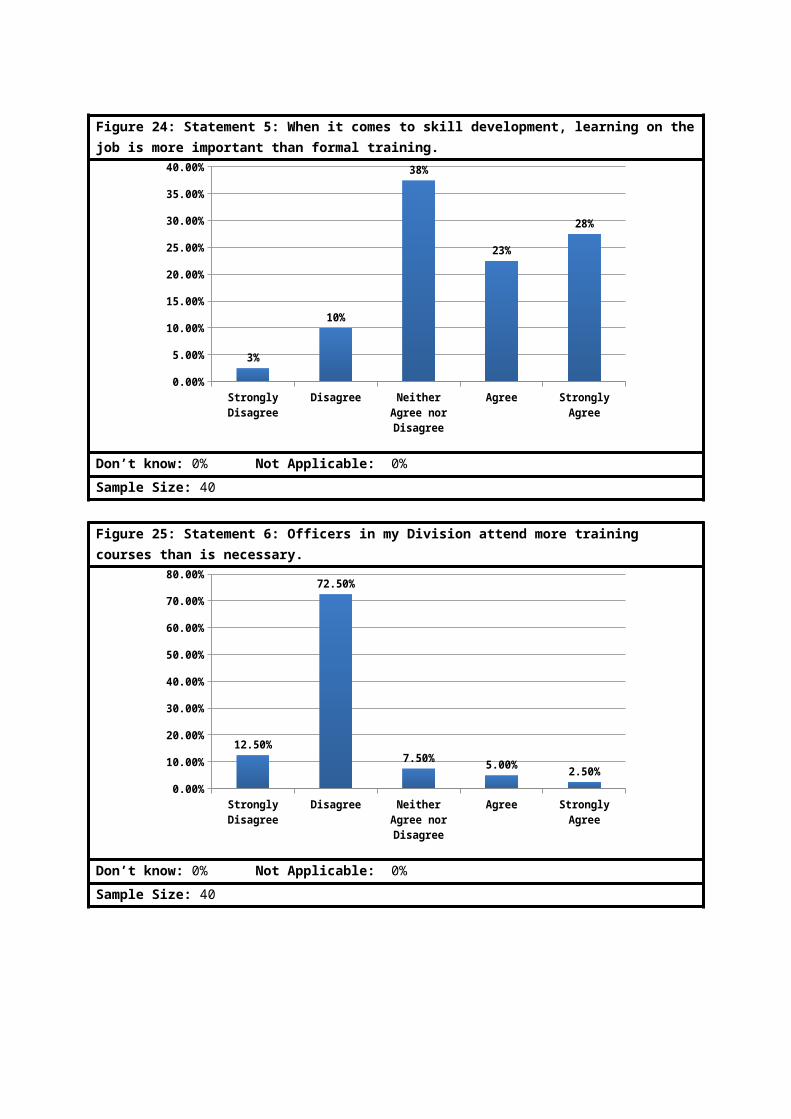
Figure 24: Statement 5: When it comes to skill development, learning on the job is more important than formal training.
Strongly Disagree Disagree Neither Agree nor Disagree
Agree Strongly Agree0.00%
5.00%
10.00%
15.00%
20.00%
25.00%
30.00%
35.00%
40.00%
3%
10%
38%
23%
28%
Don’t know: 0% Not Applicable: 0%
Sample Size: 40
Figure 25: Statement 6: Officers in my Division attend more training courses than is necessary.
Strongly Disagree Disagree Neither Agree nor Disagree
Agree Strongly Agree0.00%
10.00%
20.00%
30.00%
40.00%
50.00%
60.00%
70.00%
80.00%
12.50%
72.50%
7.50%5.00%
2.50%
Don’t know: 0% Not Applicable: 0%
Sample Size: 40
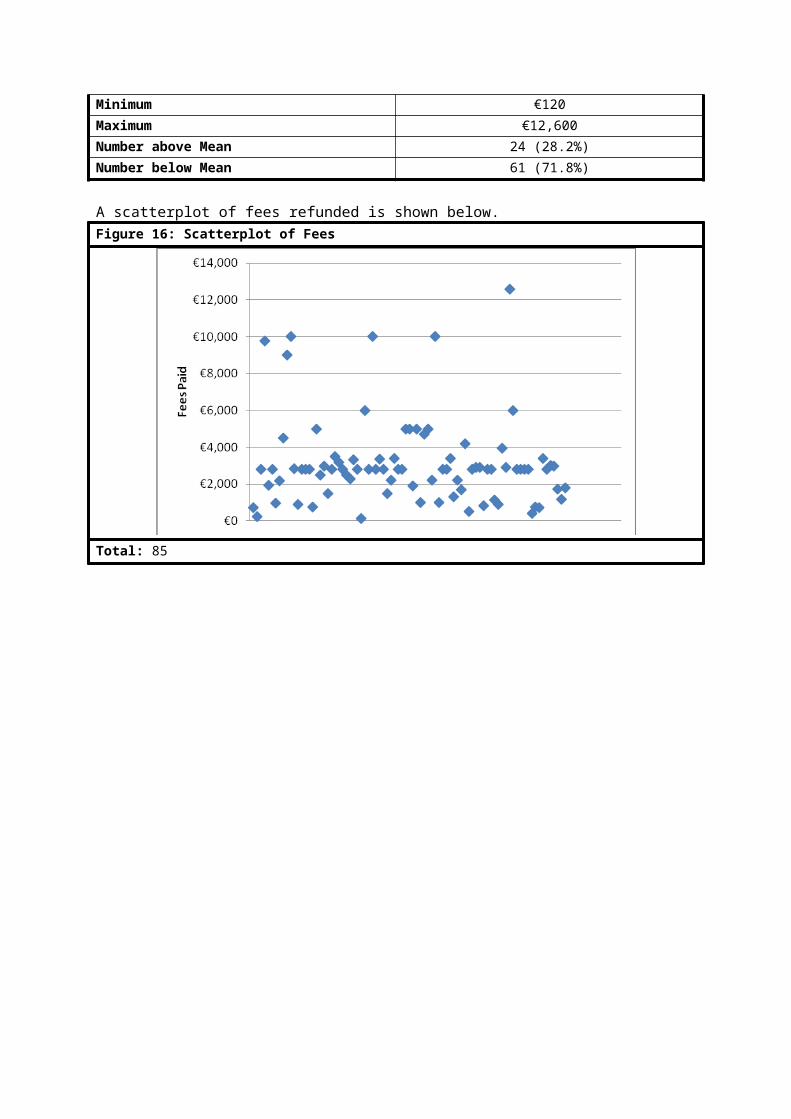
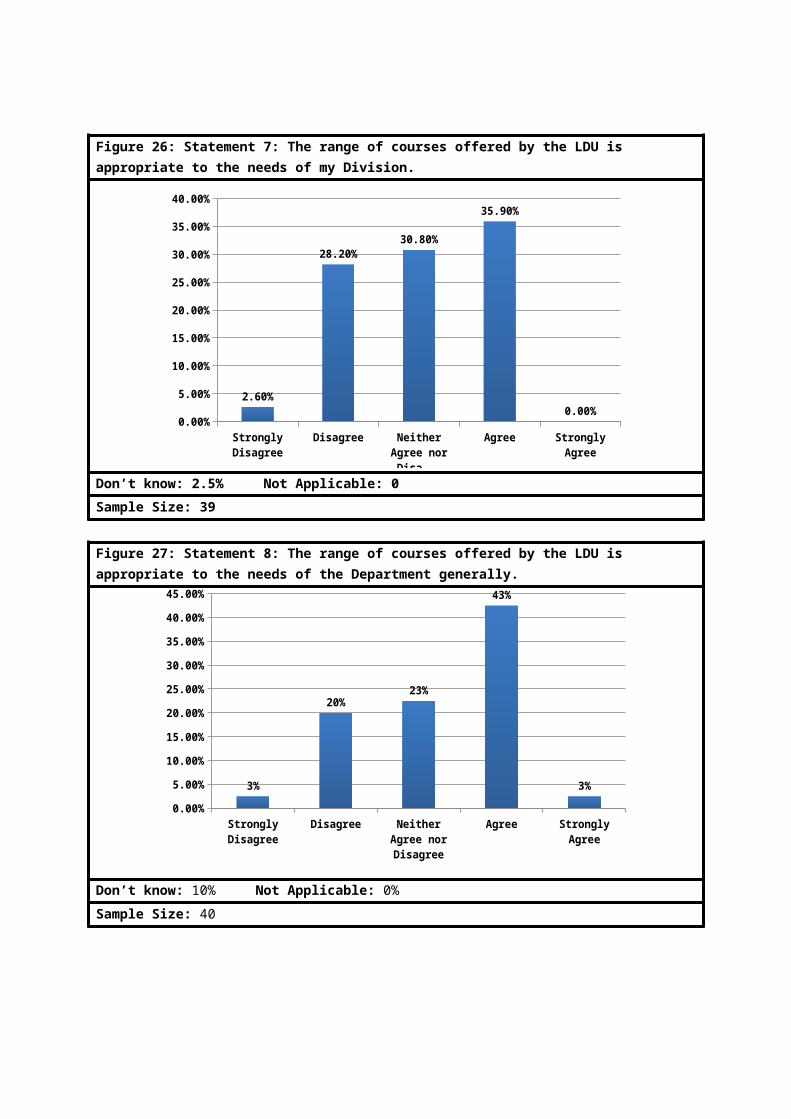
Figure 26: Statement 7: The range of courses offered by the LDU is appropriate to the needs of my Division.
Strongly Disagree Disagree Neither Agree nor Disagree
Agree Strongly Agree0.00%
5.00%
10.00%
15.00%
20.00%
25.00%
30.00%
35.00%
40.00%
2.60%
28.20%30.80%
35.90%
0.00%
Don’t know: 2.5% Not Applicable: 0
Sample Size: 39
Figure 27: Statement 8: The range of courses offered by the LDU is appropriate to the needs of the Department generally.
Strongly Disagree Disagree Neither Agree nor Disagree
Agree Strongly Agree0.00%
5.00%
10.00%
15.00%
20.00%
25.00%
30.00%
35.00%
40.00%
45.00%
3%
20%23%
43%
3%
Don’t know: 10% Not Applicable: 0%
Sample Size: 40
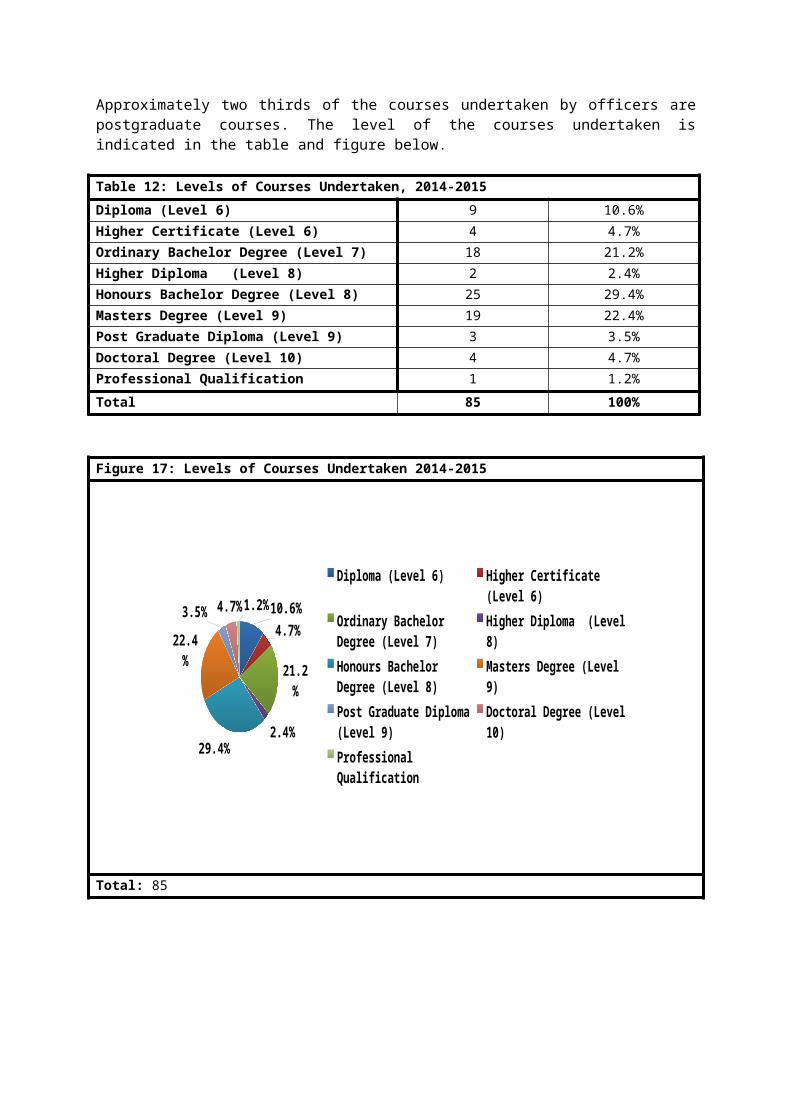
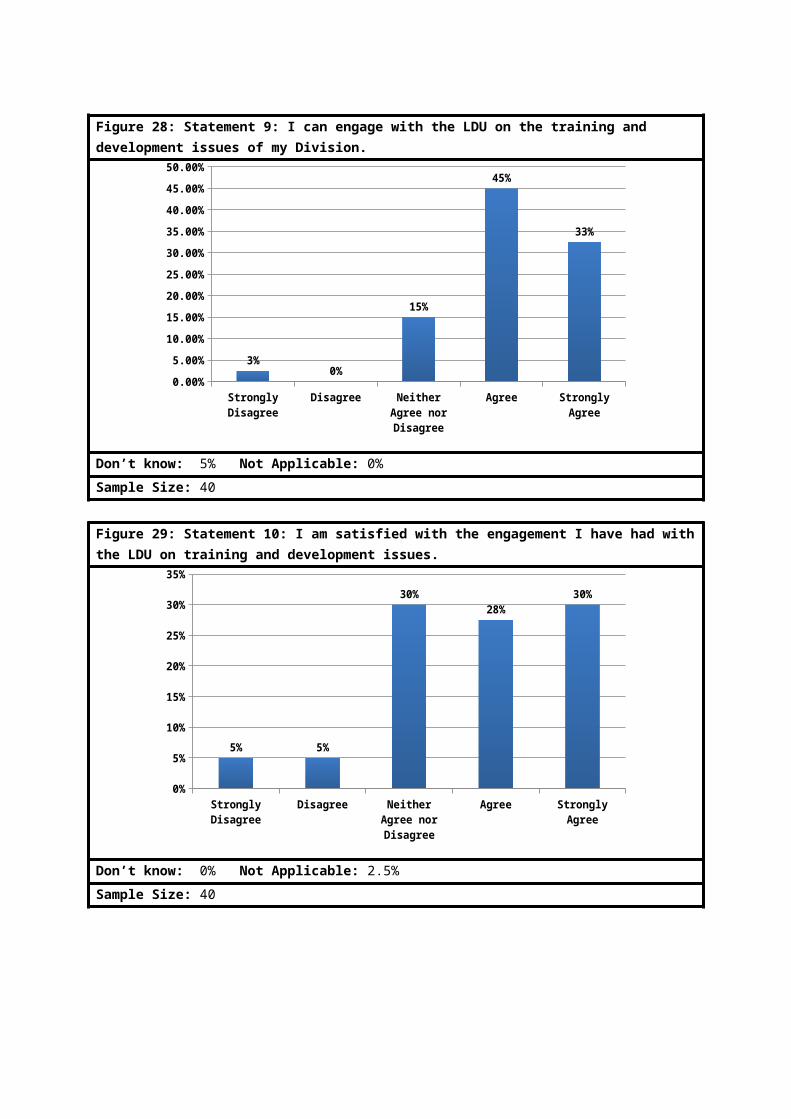
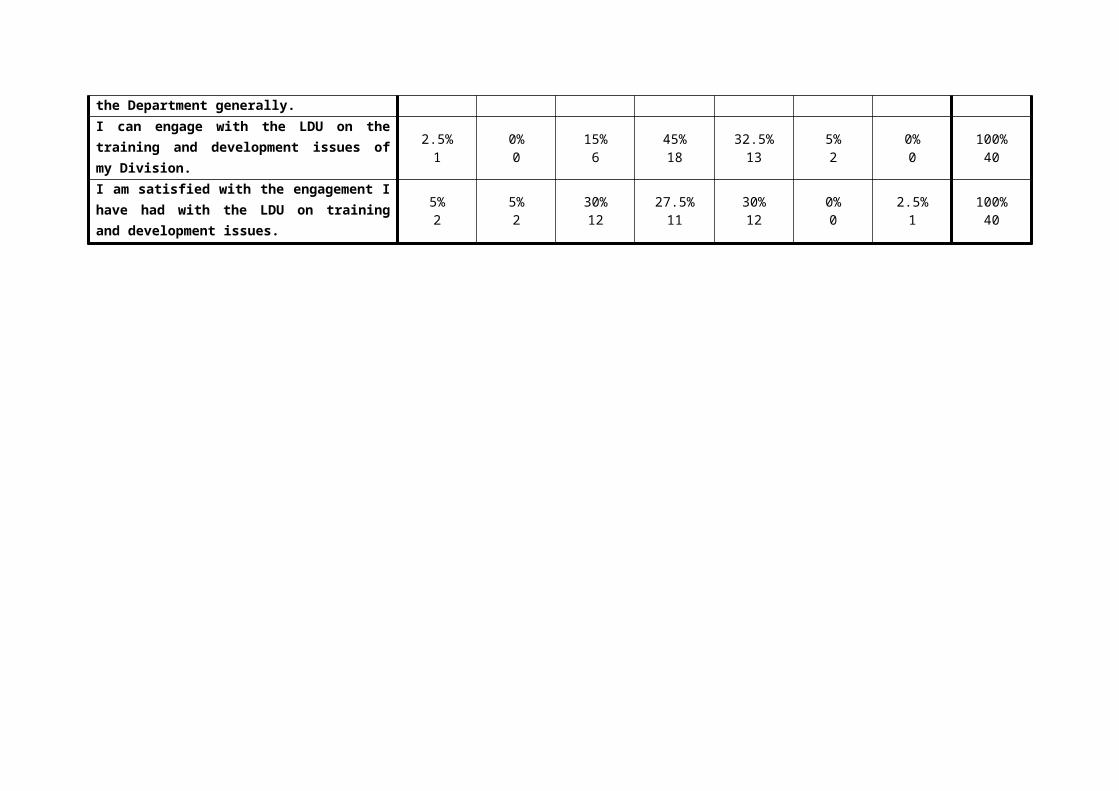
Figure 28: Statement 9: I can engage with the LDU on the training and development issues of my Division.
Strongly Disagree Disagree Neither Agree nor Disagree
Agree Strongly Agree0.00%
5.00%
10.00%
15.00%
20.00%
25.00%
30.00%
35.00%
40.00%
45.00%
50.00%
3%0%
15%
45%
33%
Don’t know: 5% Not Applicable: 0%
Sample Size: 40
Figure 29: Statement 10: I am satisfied with the engagement I have had with the LDU on training and development issues.
Strongly Disagree Disagree Neither Agree nor Disagree
Agree Strongly Agree0%
5%
10%
15%
20%
25%
30%
35%
5% 5%
30%28%
30%
Don’t know: 0% Not Applicable: 2.5%
Sample Size: 40
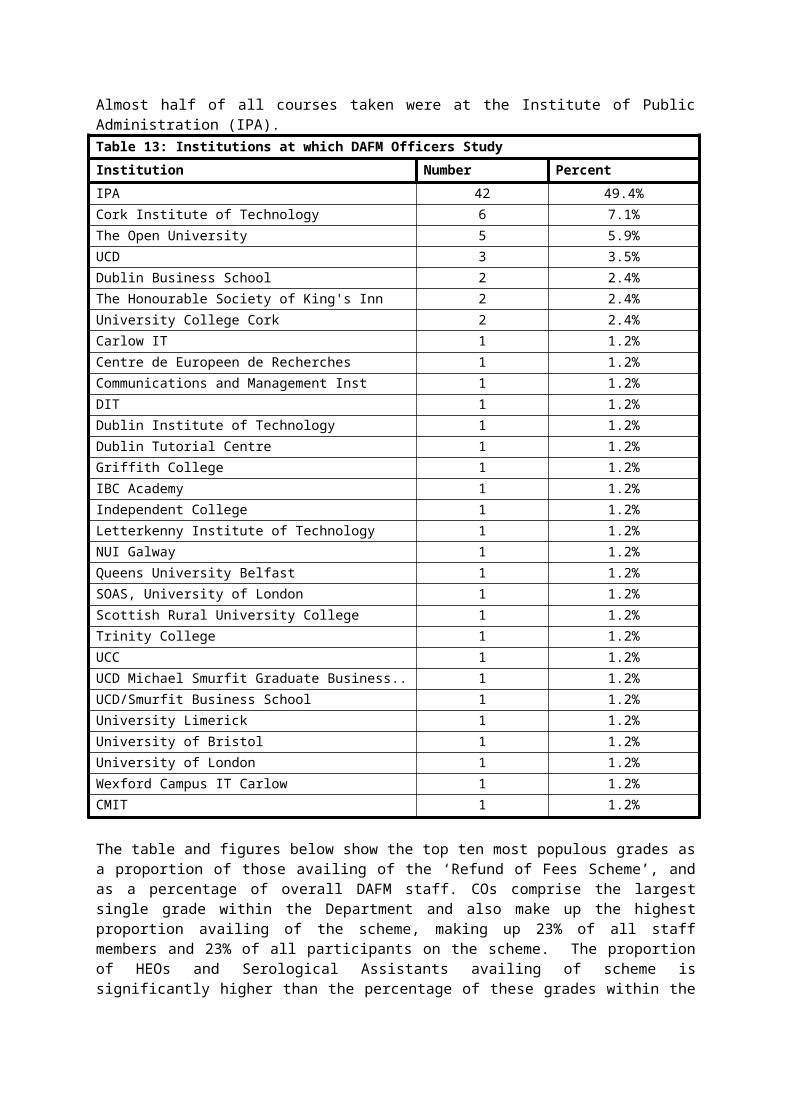
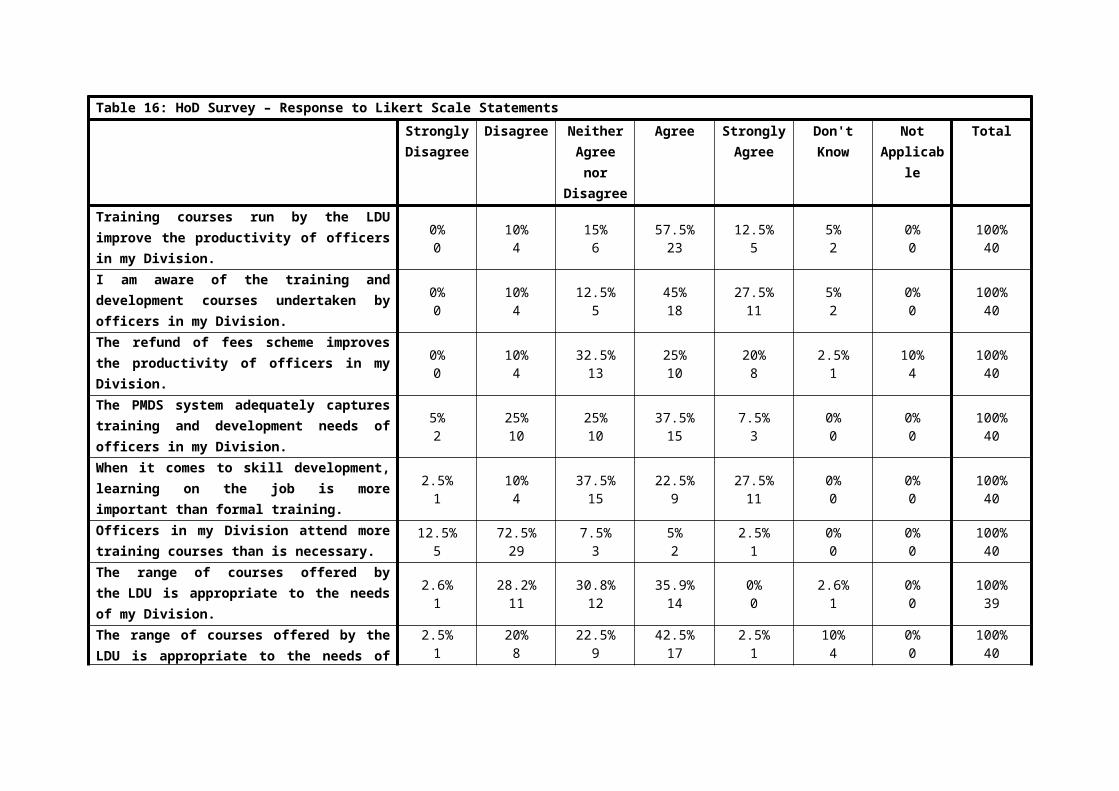
Table 16: HoD Survey – Response to Likert Scale Statements
Strongly Disagree
Disagree Neither Agree nor Disagree
Agree Strongly Agree
Don't Know Not Applicable
Total
Training courses run by the LDU improve the productivity of officers in my Division.
0%0
10%4
15%6
57.5%23
12.5%5
5%2
0%0
100%40
I am aware of the training and development courses undertaken by officers in my Division.
0%0
10%4
12.5%5
45%18
27.5%11
5%2
0%0
100%40
The refund of fees scheme improves the productivity of officers in my Division.
0%0
10%4
32.5%13
25%10
20%8
2.5%1
10%4
100%40
The PMDS system adequately captures training and development needs of officers in my Division.
5%2
25%10
25%10
37.5%15
7.5%3
0%0
0%0
100%40
When it comes to skill development, learning on the job is more important than formal training.
2.5%1
10%4
37.5%15
22.5%9
27.5%11
0%0
0%0
100%40
Officers in my Division attend more training courses than is necessary.
12.5%5
72.5%29
7.5%3
5%2
2.5%1
0%0
0%0
100%40
The range of courses offered by the LDU is appropriate to the needs of my Division.
2.6%1
28.2%11
30.8%12
35.9%14
0%0
2.6%1
0%0
100%39
The range of courses offered by the LDU is appropriate to the needs of the Department generally.
2.5%1
20%8
22.5%9
42.5%17
2.5%1
10%4
0%0
100%40
I can engage with the LDU on the training and development issues of my Division.
2.5%1
0%0
15%6
45%18
32.5%13
5%2
0%0
100%40
I am satisfied with the engagement I have had with the LDU on training and development issues.
5%2
5%2
30%12
27.5%11
30%12
0%0
2.5%1
100%40

In order to determine if the experience of the LDU varies across division size, the qualitative responses from the Likert Scale (“Strongly Disagree”, “Disagree” etc.) were converted into a numerical format as follows. The responses ‘Don’t know’ and ‘Not applicable’ were excluded from this analysis.
Strongly Disagree 1Disagree 2Neither Agree not Disagree 3Agree 4Strongly Agree 5
The average response from HoDs in small divisions (15 or fewer staff members) was compared to that of those in very large divisions (50 or more officers). The table below indicates no significant differences between the two populations, except in relation to the refund of fees. To the statement ‘The refund of fees scheme improves the productivity of officers in my Division’ HoDs from smaller divisions neither agreed nor disagreed, while HoDs from bigger divisions agreed on average. This result may be a consequence of the different functions of the bigger and smaller divisions.
Table 17: HoD Survey – Comparison of Feedback from Small and Large Divisions0 to 15 >50
Training courses run by the LDU improve the productivity of officers in my Division. 3.7 4.0I am aware of the training and development courses undertaken by officers in my Division. 3.9 3.9The refund of fees scheme improves the productivity of officers in my Division. 3.0 3.8The PMDS system adequately captures training and development needs of officers in my Division. 3.3 3.4
When it comes to skill development, learning on the job is more important than formal training. 3.4 3.7
Officers in my Division attend more training courses than is necessary. 2.4 2.0The range of courses offered by the LDU is appropriate to the needs of my Division. 3.0 2.8The range of courses offered by the LDU is appropriate to the needs of the Department generally. 3.8 3.2
I can engage with the LDU on the training and development issues of my Division. 4.3 3.9I am satisfied with the engagement I have had with the LDU on training and development issues. 3.8 3.8
7.2 HoDs Survey – CommentsHoDs were asked to indicate training programmes they felt should be prioritised within the Department. The 20 comments, exactly as received, can be found in the table below. The proposed courses can be categorised into four distinct groupings; writing skills courses, management courses, general skills courses and job specific skills courses. There were also a number of general comments. When a comment could fit into more than one category, it is included in both.
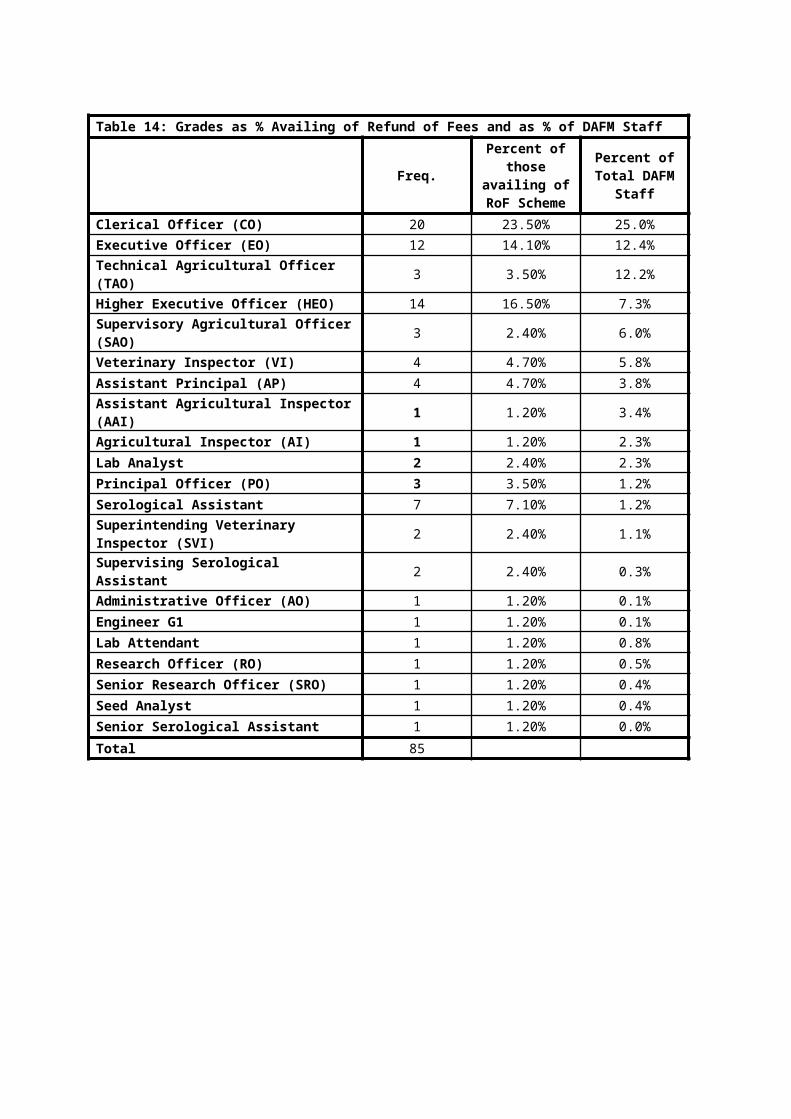
Table 18: HoD Survey – Are there any specific training courses you feel should be prioritised within DAFM?Writing Skills
Report writing Writing for EOs and HEOs. Access and Excel courses are very important to the work of my division. I think the Department needs
to prioritise writing skills courses and ensure we have the best that is available. I suggest a course in Analysis and Decision making would be valuable for newly appointed or promoted staff at EO/ AO level
Communications Development at all levels. Writing skills particularly for EOs and HEOs. Refresher general CO and EO courses to make them more appropriate to current day requirements.
Effective writing of briefs, etc; communications; induction training; time and organisational management; strategic thinking.
Management Yes, I think there is a need to prioritise leadership development and training for staff that have been
newly promoted to the level of PO or PO equivalents As we are laboratory based the courses tend to be specialised, people management can be a big issue
for newly promoted staff. Management training and project training. Managing under performance
General Courses Access and Excel courses are very important to the work of my division. I think the Department needs
to prioritise writing skills courses and ensure we have the best that is available. I suggest a course in Analysis and Decision making would be valuable for newly appointed or promoted staff at EO/ AO level
Standard HEO course and refresher course Project Management Communications Development at all levels. Writing skills particularly for EO and HEOs Refresher
general CO and EO courses to make them more appropriate to current day requirements. Effective writing of briefs, etc; communications; induction training; time and organisational
management; strategic thinking. Management training and project training. Training Course on dealing with PQs and press queries
Job Specific Courses Some basic audit and accounting courses for staff dealing with payment issues and accountability
processes with particular emphasis on EU funded schemes and subsequent follow up audits. media training for identified officials Basic legal training on administrative law and need to follow set procedures would be useful.
Induction courses on promotion particularly in the case of cross stream movement. Contingency Planning in relation to food borne outbreaks
General Comments Important to ensure that specialised training requirements are adequately resourced in the future. training courses arise according to need however in general the large expenditure by DAFM on
research does not feed back to real skill transfer to DAFM and should be as important as other factors in decisions on funding research
I think there needs to be a more proactive approach taken by Divisions to identify their own requirements. More bespoke training.
None in particular, but it would be useful for LDU to bring their suite of courses to the attention of all
staff- possible at the beginning of the year when staff are completing their PMDS. It would help alert both staff and their supervisors of the range of courses available and in turn encourage staff to attend relevant courses, as part of their professional development.
The Project Management course was the best course I ever did inside or outside the Dept (Unfortunately I don't always apply it - and have paid a price when I don't). Should be essential for managers or anyone involved with projects. Preparation for managing people and finance should be mandatory for technical people (like me) promoted to management roles. Most don't realise they need it till it is too late.
The questionnaire also asked for comments about the LDU and training and development generally. The 19 comments received are in the table below.
Table 19: HoD Survey – Please include below any comments you have about the Learning and Development Unit or training and development generallyGeneral Comments
Training in subjects applicable across the CS is best done combined with other Departments/Agencies. Specialist courses are best designed & delivered in-house and customised to the needs of particular Divisions.
HODs should be provided with a list of the training courses/needs requested by individual staff in the Division. This should be possible if information is stored electronically
Division Specific Comments XX are a small Professional/Tech unit and are our L&D needs can be different to that generally
required in the Department. We identify our specialist needs and liaise directly with LDU to have them implemented.
We are aiming to do an internal analysis of our divisions specific training requirements at a specialist level (above and beyond what is in the suite of courses on the intranet) in the coming weeks, and will engage with SLDU at that point.
Concerns I feel that the so called bottom up approach to training is not the right approach. DAFM at MAC level
should identify key training needs and the LDU should then provide them. The current scatter gun approach lacks focus and direction
UNDER RESOURCED. Needs to reflect what is happening in other large depts. like Revenue and social welfare.
Union reps can be critical of speed at which training deployed. It is important that DAFM continues to adequately provide for specialised training when training is
centralised. My most recent engagement with LDU has been depressing and demoralising. While accepting fully
the need to ensure procurement rules, value for money etc must be respected, my experience was so negative that I wonder why would anyone bother taking the initiative to research, pilot test and then propose a training course for staff- when the hoops one then has to go through appear to be so onerous and time consuming that the easiest thing is just to give up and forget about it. I am all in favour of making sure taxpayers money is well spent, but there has to be some trust that when HODs propose something specific that they have looked into that their bone fides are good. Some flexibility and trust please or we will all be turned off and say why bother
Some staff apply for courses of interest rather than specifically to improve the services of DAFM. Ideally staff should specify courses required in PMDS.
Feel they could be more proactive in identifying specific training vacuums and officers requiring skills.
Positive Comments about LDU Find the LDU very approachable. Just haven't had enough time to focus on strategic issues like
training in last year because of the staff reductions in my division generally very helpful and professional and open to solutions on training needs I find my engagement with LDU to be very positive. Very satisfied with all my dealings with LDU. They always display an openness for new ideas which is
encouraging. I have found the Unit, and especially XX, to be extremely forward-thinking, thorough and constructive,
willing to think outside the box, but not a push-over for resources (which is fair enough). The staff in the unit are very professional and a pleasure to deal with. Unit provides a good service.
8 Other Activities by the LDU
8.1 e-LearningThe Unit has made recent progress in terms of e-Learning, producing or helping to produce a number of video presentations (HR Strategy, Health and Wellbeing and Recruitment) and recordings of lunchtime talks on gender balance, health and wellbeing. They have also made interviewee preparation and mentoring training videos, which have also been made available through the internet and an e-learning induction training course has been developed and piloted. LDU staff have been trained in the use of editing and presentation software. The Unit has also delivered multi-site training in mentoring, PMDS and interviewee preparation.
The moodle installation is now almost ready for use as the Department’s Learning Management system, which will enable the LDU to monitor access and usage of the various e-learning interventions.
8.2 Lunchtime SessionsThe LDU have provided a number of lunchtime seminars involving a guest speaker. There are plans to continue to provide such sessions, and to extend them to include sessions from Heads of Divisions. A session on mental health awareness was run in October 2014, and there are plans to run staff health promotion talks in conjunction with Health and Safety. Three lunch time talks and one half day talk were held in 2015. These events were streamed simultaneously to staff in Agriculture House, Backweston, Cavan, Clonakilty, Portlaoise and Wexford. The figures below indicate the total number of attendees for all venues.
Table 20: Lunch Time Talks and International Women’s Day EventDate Speaker AttendedLunch Time Talks3/2/2015 Dr. Pamela Byrne 906/5/2015 Ms. Caroline Keeling 7110/6/2015 Mr. Frank Daly 56International Women’s Day Event
6/3/2015Aidan O’DriscollMargaret E WardNiamh O’Donoghue
163
8.3 Mentoring ProgrammeThe LDU runs a Mentoring Programme. The Mentor is usually a person at a higher level in the Department who is willing to share their skills, knowledge and experience with their Mentee in order to assist in the Mentee’s professional development. The scheme is open to officers at all grades. There are 78 pairs of staff involved in the 2015/16 mentoring scheme
9 Evaluation of Courses RunFor each training course, the Learning and Development Unit requests that officers complete an evaluation. Reports were compiled on a number of courses and these are summarised on the following page.
In 2009, a Return on Investment (RoI) analysis was carried out on a ‘Microsoft Office Excel Intermediate’ course. The return on investment was found to be 216%.
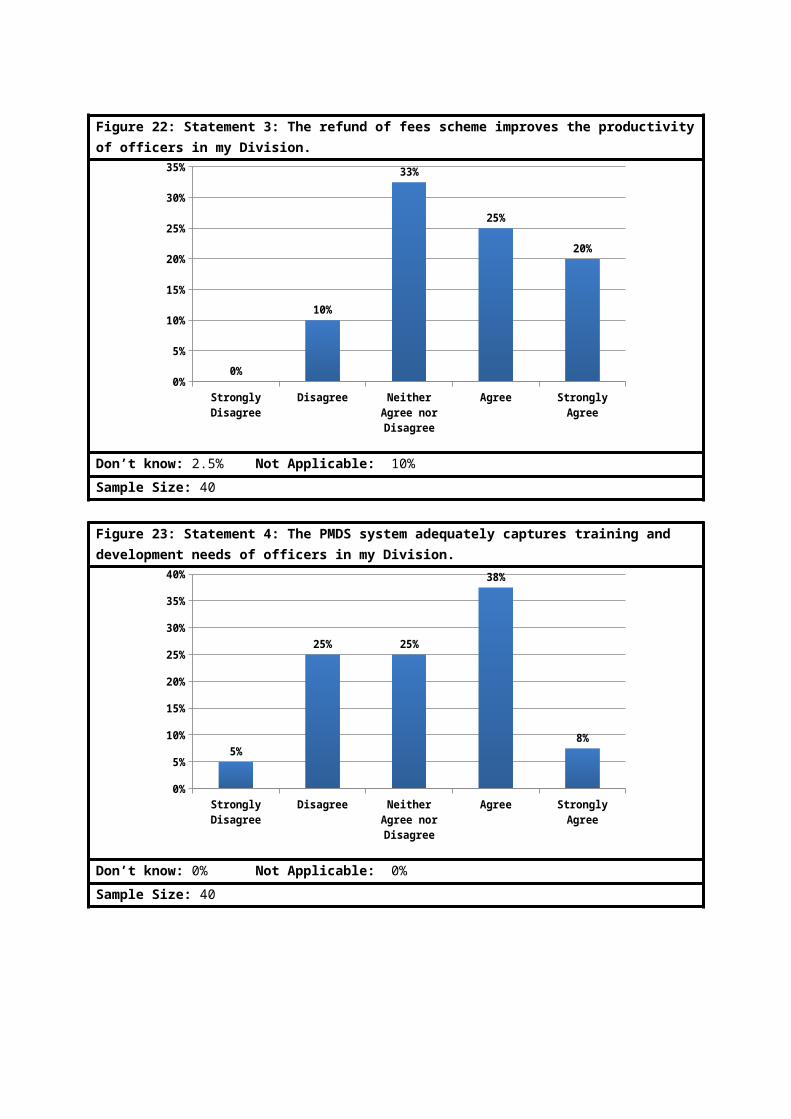
Table 21: Evaluations of Courses
Course Title Format of Course Date No. Staff RoI Conclusion
Microsoft Office Excel Intermediate
One dayTutor led, classroom basedAvailability of a “help desk” for six months
27th May 2009
8 216% “The evaluation process and ROI calculations indicate that the Excel Intermediate course is meeting its objectives. Increased confidence in the use of Excel and the resulting increased efficiency and effectiveness is a notable result of the training intervention”
Freedom of Information
One dayTutor led
16th Oct 2012
8 “The overall results from the three levels of evaluation would indicate that Participants reacted favourably to the course Participants knowledge increased as a result of attending the course Participants transferred that knowledge to the workplace.The above findings indicate that the Freedom of Information Course is meeting its objectives and it is proposed to continue in its current format.”
Land Law and Probate
Half dayTutor led
4th May 2012
8 “The overall results from the three levels of evaluation would indicate that Participants and supervisors reacted favourably to the course Participants knowledge increased as a result of attending the course Participants transferred that knowledge to the workplace.The above findings indicate that the Land Law and Probate Course is meeting its objectives and it is proposed to continue in its current format.”
Quality Customer Service
One dayFacilitated course
17th Apr 2012
10 “The overall results from the three levels of evaluation would indicate that participants and supervisors both reacted favourably to the course as per responses above .the new techniques resulted in better communication skills within the workplace. The results indicate that Participants and supervisors reacted favourably to the course Participants knowledge increased as a result of attending the course Participants transferred that knowledge to the workplace.The above findings indicate that the Quality Customer Services Course is meeting its objectives and it is proposed to continue in its current format.”
Time One day 15th May 9 “The overall results from the three levels of evaluation would indicate that
Management Tutor led 2012 Participants reacted favourably to the course Participants knowledge increased as a result of attending the course Participants transferred that knowledge to the workplace This course indicates that there is less stress as a result of the course All participants would recommend course
The above findings indicate that the Time Management Course is meetings its objectives and it is proposed to continue in its current format”
CO Development
Two dayTutor led
24th and 25th April
2012
10 “The overall results from the three levels of evaluation would indicate that: Participants reacted favourably to the course Participants’ knowledge increased as a result of attending the course Participants transferred knowledge to the workplace
The above findings indicate that the CO Development Course is meeting its objectives and it is proposed to continue in its current format”
Microsoft Office Excel Introduction Course
One dayTutor led, classroom basedAvailability of a “help desk” facility for six months
1st Feb 2012
7 “The overall results from the three levels of evaluation would indicate that participants and supervisors both reacted favourably to the course as per responses above. The new techniques resulted in a more efficient, informative and professional workplace. The results indicate that
Participants and supervisors reacted favourably to the course Participants knowledge increased as a result of attending the course Participants and supervisors agreed that new skills and techniques were
transferred to the workplace.The above findings indicate that the Microsoft Office Excel Introduction Course is meeting its objectives and it is proposed to continue in its current format”
10 Conclusions and RecommendationsThe key evaluation questions as set out at the beginning of the evaluation were:
1. What are the inputs into the LDU, specifically in terms of staffing and funding?This has been examined comprehensively in sections 3, 4 and 6. Training expenditure (excluding the Unit’s salary costs) has fallen from a high of €2,002,758 in 2008 to €707,560 in 2015. Despite this reduction, and in the context of the decrease in Department staff numbers over the period, it is still a significant resource allocation.
2. What are the outputs from the LDU, in terms of training delivered?Again this has been examined comprehensively in sections 3, 4 and 6. Outputs, in terms of training courses, have fallen from a high of 515 in 2009 to 253 in 2015. The number of staff members availing of training peaked at 2,464 in 2011 and fell to 1,785 in 2015. Again in the context of the decrease in staff numbers over the period, this is a significant delivery by the Learning and Development Unit of courses and participants.
3. What are the outcomes from training, in the form of increased effectiveness?As stated at the outset, this is the most difficult to measure successfully, but is considered in sections 5, 7 and 9.
The conclusions (in italics) and recommendations (numbered) of this analysis are set out below, which if implemented, will improve the Department’s management of training and development in terms of the first two questions but crucially, will allow for better consideration of the third in the future.
Training and Development StrategyThe Department has produced a new Human Resources Strategy, ‘EveryOne - One Vision, One Department, Every One’, an objective of which is “To enhance performance and output”. In the new HR Strategy, under the heading ‘Training and Development’, it states,
“Training and development forms an essential element in supporting us in our career paths and in developing our skill sets, in order to successfully plan for our future. In supporting colleagues training and development needs, HR Division aims to:
Improve performance. Improve consistency. Help address weaknesses, and build on strengths. Increase productivity. Increase satisfaction in performance.
Supporting training and development needs plays a significant role in the successful implementation of the HR Strategy in that it encourages self-development and talent management, enables us to implement knowledge management strategies for effective succession planning and motivates us all within our roles in the Department”.

The Strategy outlines a holistic approach to developing staff and recognises that formal training and development is one element of that development.
Recommendations1. The Department should proceed to develop a specific training and development strategy
that will support the HR Strategy; it states that “A new learning and development policy will follow this Strategy and will support us all in our self development. This policy will be published by Quarter 3 2016”.
2. The Strategy should outline current training and development priorities, and how future priorities will be identified and delivered. This should be supplemented by annual planning of training and development activities.
Linkages to individual & Department training and development needs The linkages between current training and development activity and the needs of individuals and the organisation are not always apparent.
Recommendations3. All staff should be made aware of the training and development opportunities available to
them.
4. All managers should be made aware of the training and development tools available to them to support their work, including those tools that will help to address underperformance.
5. The Learning and Development Unit should plan its activities based on individual needs as identified through the PMDS process. Recognising that resources are limited, individual needs that meet the needs of the organisation should be prioritised.
6. The needs of the organisation should be identified in consultation with senior management. The current system of needs analysis needs to be reviewed and an effective system of consultation should be developed, i.e. through workshops involving related functions, one-to-one meetings, surveys etc. For example, the response to the survey here indicates that many HoDs have opinions about the LDU and about the training needs of their staff. A more detailed set of surveys, tailored to various management grades, may yield valuable feedback although it is likely that one-to-one meetings would be the best method in this regard.
Application of training and development in the WorkplaceIt is not clear that the training and development activity within the Department is linked to HR decisions.
Recommendations7. A comprehensive, up to date inventory of skills within the Department should be
maintained. This inventory should be available for use in making HR decisions, both by the HR Division but also by managers across the Department.
8. The inventory of skills should be used to match people with skills with appropriate positions. While staff should be consulted in this regard, where officers have obtained training or qualifications through the Department, there is an expectation that they will be deployed to appropriate positions.
9. There are issues around data and how it is stored and used and these should be identified and progressed.
Monitoring the Department’s training and developmentThere are a number of different strands to training in the Department and within strands there are a number of different expenditures. There are disparate procedures for recording and monitoring these.
Recommendations10. A solution to the problem of extracting the training and development information from the
ePMDS system should be a priority. As the framework within which individual work performance and development needs are actively managed, by both the individual line manager and the organisation as a whole, it is crucial that setting training and development goals is part of the PMDS process. While introducing the separate written process to solve this problem was understandable, it is not desirable from a HR management or administrative perspective.
11. The management and oversight of training should be centralised and a central database of training and associated expenditure should be maintained. All staff members, especially new entrants, should receive full training on the functionality of the system to ensure that it is being used accurately and efficiently.
12. The database system should be upgraded to a format which would allow information to be easily tracked and extracted for a range of query types – by individual, course type, content, date class undertaken etc.
13. Information on individual staff members should be recorded using either personnel numbers or PPS numbers for both confidentiality and to ensure that information is not lost due to spelling errors or an individual changing their surname. All historical data should be imported onto this new system so that information is available on all staff members for the duration of their tenure in the Department.
14. With better information, trends in training should be monitored and analysed. For example, some of the issues identified in this analysis should be further investigated, i.e. the imbalances between grades participating in training (section 3.2) and the gender imbalance (section 3.3).
15. The Learning and Development Unit needs to proactively manage and monitor expenditure according to overall and annual priorities. Rather than being totally demand led, this may involve setting annual limits on categories, e.g. Refund of Fees should not exceed xx%.
16. Efficiency yardsticks should be considered and applied to expenditure. The difference between the average cost per participant in 2008 (€319) is strikingly different to 2015 (€124), although 2008 does seem to be an outlier in terms of the costs 2009 to 2015.
Measuring effectivenessThe Learning and Development Unit should continue to seek ways to measure effectiveness according to best practice in this area.
Recommendations17. All courses should be evaluated (e.g. using techniques such as the Kirkpatrick Three Level
evaluation model). Various mechanisms could be investigated to ensure participation in evaluation by participants (e.g. the completion of the post course evaluation could be a condition of future course participation).
18. Officers who have undertaken educational qualifications should be asked to complete an evaluation of the course and the institution indicating if it was relevant to their needs. They could also be asked to speak with officers considering undertaking these courses.
19. Managers and Heads of Division should also evaluate training, especially specialised courses. Recommendation 6 above is also relevant in this regard.
CommunicationBetter communication is required for training and development and HR issues generally and this is recognised by the new HR Strategy. This is especially important when dealing with an issue such as ‘linkages to individual & Department training and development needs’.
Recommendations (in addition to those under ‘Linkages to individual & Department training and development needs’)
20. A better online presence should be established including: a full list of courses and descriptions available, an approximation of waiting times for courses, and a facility where one can sign up to courses on particular dates. Courses and their outcomes should be specifically linked to competencies and skills.
AttendanceNon-attendance at training courses is an issue. Although some level of non-attendance is unavoidable and understandable in recent years with decreased staffing resources, most training is sought by staff and approved by managers.
Recommendations21. The resource consequences of non-attendance at training needs to be made known to
management and staff. Sanctions for non-attendance should also be considered (e.g. being excluded from training opportunities for a specified period; being de-prioritised for training for a specific period; repeat offenders, either staff or management, being highlighted to senior management on regular basis).
OutlookIt is evident from the feedback to the survey that there is generally a high level of satisfaction with the Learning and Development Unit. The Unit has had to deal with reduced resources in recent years but has maintained valuable level of service for the Department. It has also evolved in recent years, for example it has incorporated e-learning and facilitated the mentoring programme and lunchtime seminars. However it is also evident that there is scope for improving the delivery of relevant, appropriate training and development. This is not down to the LDU alone and can only be achieved by senior management, individual Divisions, line managers and individuals engaging with training and development goals and an agreed strategy.
The HR function within the Department and Civil Service is continually evolving and there have been some structural changes in the last few years. The new HR Strategy is a step towards better integration of the HR processes within the Department. While this may be the best way forward, the future of formal training and development may be in collaboration with other Departments through shared services; Action 9 of the ‘The Civil Service Renewal Plan’ states, ‘Establish a new shared model for delivering learning and development’. The Civil Service Renewal Plan Second Progress Report (July 2016) stated that:
A shared L&D model to improve capability through enhanced procurement and shared delivery of training across the Civil Service was agreed in Q2 2015.
Independent economic appraisal to assess the risks, costs, implications and benefits of the new shared model has been completed.
A new core common suite of L&D programmes is nearing completion and the design of a new skills matrix has commenced.
While the methods of delivery may change, it has to be acknowledged that the Department of Agriculture Food and the Marine will always have specialised training and development needs.