Embed Size (px)
Citation preview

Focusing on Students At-Risk
School Planning Activity 2/2
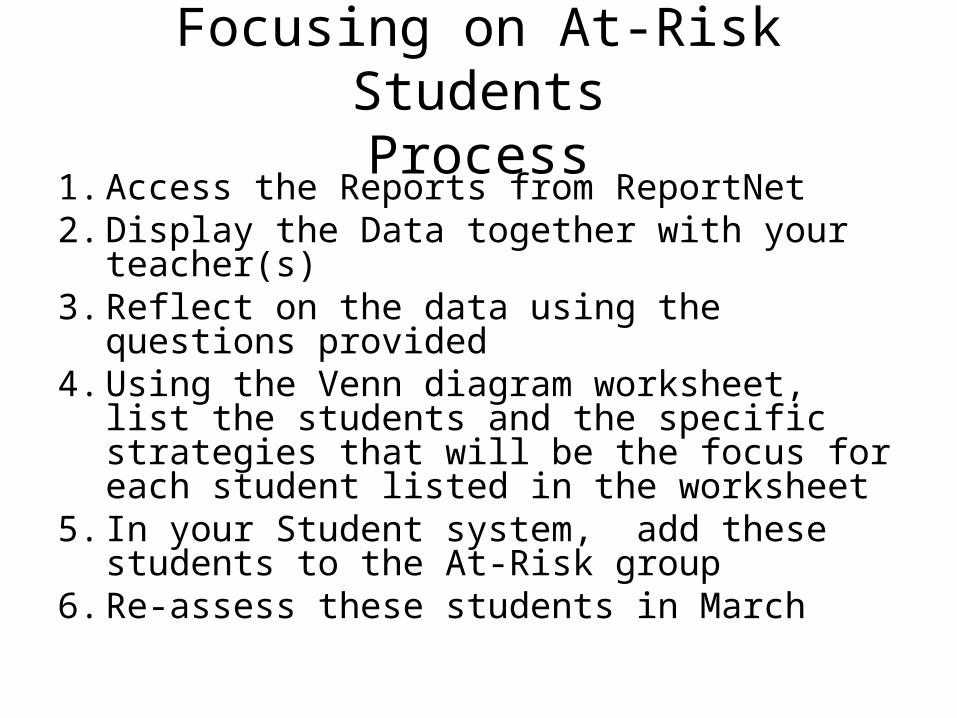
Focusing on At-Risk StudentsProcess
1. Access the Reports from ReportNet2. Display the Data together with your teacher(s)3. Reflect on the data using the questions provided4. Using the Venn diagram worksheet, list the
students and the specific strategies that will be the focus for each student listed in the worksheet
5. In your Student system, add these students to the At-Risk group
6. Re-assess these students in March
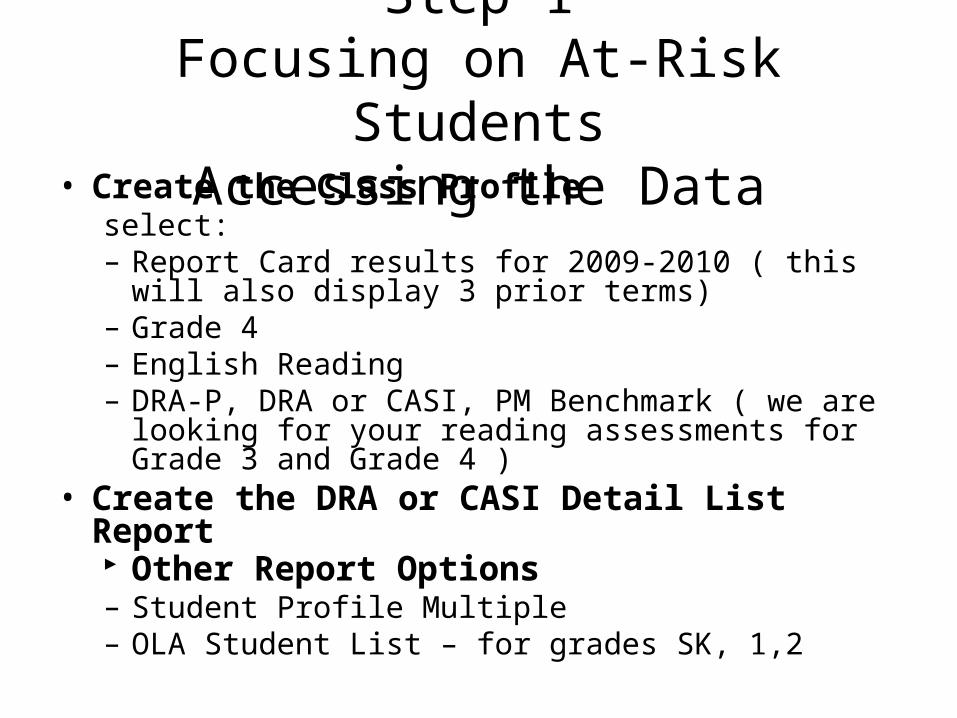
• Create the Class Profile select:– Report Card results for 2009-2010 ( this will also display 3
prior terms)– Grade 4– English Reading– DRA-P, DRA or CASI, PM Benchmark ( we are looking for
your reading assessments for Grade 3 and Grade 4 ) • Create the DRA or CASI Detail List Report
Other Report Options– Student Profile Multiple– OLA Student List – for grades SK, 1,2
Step 1Focusing on At-Risk Students
Accessing the Data

Step 2Display Data – Class Profile
Grade 4, 2009-2010, Reading, assessment DRA/DRA-P, CASI, PM Benchmark

Display Data – DRA/CASI Detail Summary Report
2009-2010, term 1, DRA Grades SK,1,2,3

DRA Junior/CASI – Grade 4,5,6,7,8
• Consider the EQAO data from Spring , 2009.• What is the relationship between the June
report card data and the EQAO data for those students.
• On the basis of this comparison, at what level are these students currently achieving?
EQAO Considerations

1. What data catches your eye?2. Is there anything in the data that you do not
understand?3. If so, what would you like clarified?4. Is there anything about the data that you find
surprising?5. What patterns of strengths and needs are evident?6. What concerns you most about the data?7. As a result of your examination of the data, at what
level is each student currently functioning? 8. What target will you set for each student between
now and March?9. Enter each student on the following VENN for the class
Step 3Analyze the Data

CURRENT Level of Student Achievement at the Classroom Level
ALL students in the school are included
Teachers will enter each student in the VennFor combined grades, the names of students in the top grade are placed at the top of the Venn and the bottom grade at the bottom of the Venn (i.e. in a 1/2 combined class, the 1’s are at the top and the 2’s are at the bottom)
NOTE: For exceptional students, each student’s achievement is in relation to the grade appropriate subject expectations with or without accommodations as reflected in the IEP. Place each student on the Venn circle relative to the achievement of grade appropriate levels not those that have been modified as set out in the IEP. Students with Alternative Expectations are placed to the left of the level 1 Venn circle
Level 1 Level 2 Level 3 Level 4
Students atHigh Level 1, Low Level 2
Students atHigh Level 2, Low Level 3
Students atHigh Level 3, Low Level 4
AlternateExpectations

ABC Public School 2009-2010
Level 1 Level 2 Level 3 Level 4
Reading Teacher ___________
Grade _____________
Hillary
Justin
Lorne
Kyle
Shilo
Mitchell
Jessica
Shelby
James
Samantha
Justin
Kaitlyn
Colton
Amanda
Gage
Justin W
Dawson
Logan
Ana
Dustin
Jaden
AustinLow 2
High 1
Liz
Emily
Paul
RobHigh 2
High 2
High 2
Low 3
Kira
Taylor
Chris
High 3
Low 4
Low 4
Strategies List• Special Education Support – E.A., CYW, Literacy Booster Groups (Primary), Case Management• •
Strategies List •
•
•
•
Strategies List• Intentional Instruction - Balanced Literacy Implementation for Reading and Writing – School Plan Focus, Specific Instructional Strategies • •

Level 1 Level 2 Level 3 Level 4
Reading Grade _____________
Hillary
Justin
Lorne
Kyle
Shilo
Mitchell
Jessica
Shelby
James
Samantha
Justin
Kaitlyn
Colton
Amanda
Gage
Justin W
Dawson
Logan
Ana
Dustin
Jaden
AustinLow 2
High 1
Liz
Emily
Paul
RobHigh 2
High 2
High 2
Low 3
Kira
Taylor
Chris
High 3
Low 4
Low 4
Setting Targets for Improvement
Highlight the names of students who are targeted to move by March.The number of students who will move is the target for the grade.Calculate the new number of students at each level of achievement. This is the number that is inserted into the template at the end of the PowerPoint.
Step 4Using the Venn Diagram
• List the Students on the Venn Diagram template
• List the specific strategies for improvement on the template
• Based on the students identified, this is your target for improvement
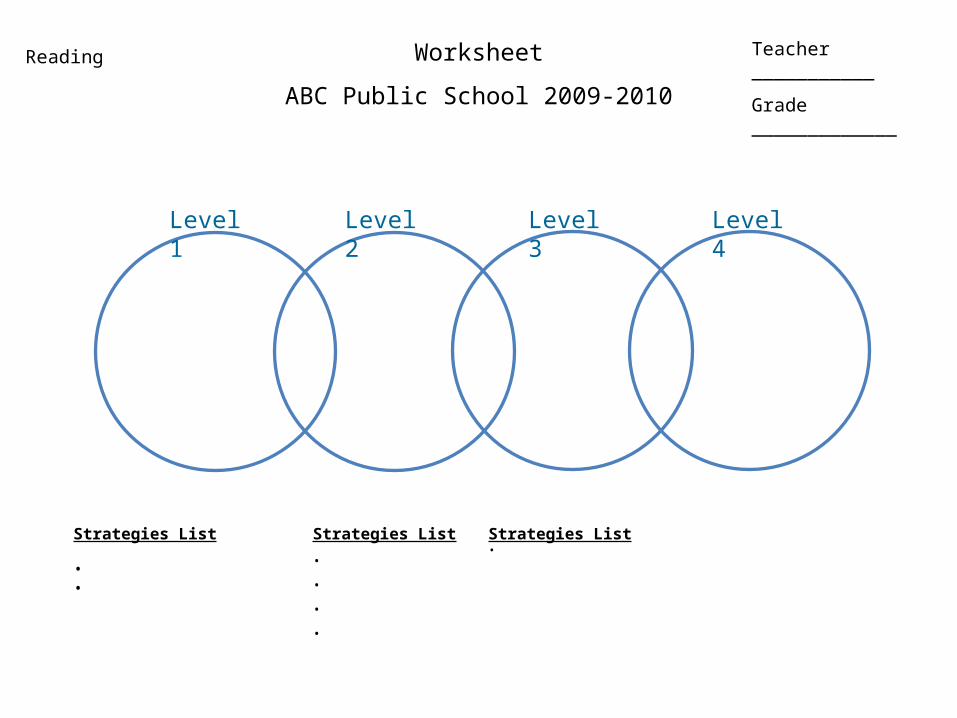
Worksheet
ABC Public School 2009-2010
Level 1 Level 2 Level 3 Level 4
Reading Teacher ___________
Grade _____________
Strategies List
• •
Strategies List •
•
•
•
Strategies List•

Monitoring these students using the reports
1. Enter the students into the at-risk group in Trillium2. These are the students that will be monitored regularly
using the ‘At-Risk’ flag in the reports3. Repeat this process for the next reporting period
• Link to access the instructions to enter At-Risk Students in Trillium
http://www.compassforsuccess.ca/mod/resource/view.php?id=108
Step 5Track These Students
• Reflect on the classroom strategies previously used to support the at-risk students.
• Which ones do we think had the most impact? • Which strategies were tried but did not
appear to move the students?
Step 6What strategies worked?