Embed Size (px)
Citation preview

NBSIR 75-644 (R)
Focusing the Fresnel Lens Optical
Landing System
W. F. Mullis, I. Nimeroff, and E. L. Walters
Illuminating Engineering Group
Optical Radiation Section
Heat Division
Institute for Basic Standards
April 1975
Prepared for
Department of the Navy
Naval Air Engineering Center
Philadelphia, Pa. 19112

NBSIR 75-644
FOCUSING THE FRESNEL LENS OPTICAL
LANDING SYSTEM
W. F. Mullis, I. Nimeroff. and E. L. Walters
Illuminating Engineering Group
Optical Radiation Section
Heat Division
Institute for Basic Standards
April 1975
Prepared for
Department of the Navy
Naval Air Engineering Center
Philadelphia, Pa. 19112
'"•f.u of*
U S. DEPARTMENT OF COMMERCE. Rogers C B. Morton. Secretary
NATIONAL BUREAU OF STANDARDS. R. chard W. Roberts. Director

U.S. DEPARTMENT OF COMMERCENational Bureau of StandardsWashington, D.C. 20234
May 21, 1975
CommanderNaval Air Systems Command
Washington, D. C. 20360
Attn: AIR 53722
Dear Sir:
Enclosed are four copies of National Bureau of Standards ReportNo, 75-644 entitled "Focusing the Fresnel Lens Optical Landing System".
Copies of this report are being sent to the agencies listed below.
Sincerely
,
A. T. HattenburgIlluminating Engineering GroupOptical Radiation SectionHeat DivisionInstitute for Basic Standards
Encl osures
cc:
NAEC (NE-716) (2)NAVFAC-04124NATC
NATF
NAFEC NA-523 (2)NAFEC NA-550NAFEC LibraryFAA ARD 300
FAA ARD 323 (2)
FAA ARD-324FAA AFI-200FAA ARD-450FAA AFS-460FAA AAS-50FAA AAS-580FAA AHQ-630ASD (ENCTE)
AFOCE-KC
AFXOPYAENGEUUSCG (G-DET-2
)
USCG (Res.S Dev.)Inst, of Trans. &
Traffic Eng.
ICAO
Gates Associates
PREFACE
At the request of the Naval Air Engineering Center of the
U. S. Department of the Navy, the National Bureau of Standardsconducted a study of various methods of focusing the FresnelLens Optical Landing System (FLOLS) . This work involves bothvisual and instrumental procedures by which the correct focusposition of the light source relative to the lens may be determined.The opinions, findings, and conclusions in this report are thoseof the authors and are not necessarily those of the Naval AirEngineering Center. Certain commercially available equipment,instruments, or materials are identified in this report to
specify adequately the experimental procedures used. In no caseshould such identification be inferred as recommendation orendorsement by the National Bureau of Standards, nor does theidentification imply that the materials or equipment are thebest available for the purpose.
CONTENTS
Page
1. Introduction 1
2. Description of FLOLS Unit and Cells 1
3. Fundamentals for Focusing 1
4. Methods of Focusing . .. 8
5. Description of Focusing Methods 9
5.1 Photometric 9
5.1.1 Photometer with Graphic Recorder 9
5.1.2 Photometer with Meter Readout . 13
5.2 Peep Sight 18
5.3 Parallax 22
5.4 Auxiliary Image- forming lens 22
5.4.1 Observing Face of Cell 22
5.4.2 Observing Beam Pattern Projected on WhiteCard 26
5.5 Pattern Matching i28
6. Results 31
6.1 Photometric Procedures 31
6.2 Other Procedures for Focusing 38
7. Uncertainty 38
8. Discussion 43
9. Recommendation . .. 43
Appendix 46
A-l Other Factors 46
A-2 Operational Features 4^
A-2.1 Effect of Lenticular Lens on Beam Spread .... 4 ^A Q
A-2. 2 Effect of Lens Temperature on Beam Spread ...
A-2. 3 Effect of Slit-Width on Beam Spread 48
A-2. 4 Effect of Slit Alignment on Beam Distribution 48
A-2. 5 Effect of Lamp Dimming and Source Color onFocusing 51
A-3 Mechanical Design Features 53
A-3.1 Lamp Mount Assembly 53
A- 3. 2 Fresnel Lens Mounting 56
A-3. 3 Lens Temperature 56
FIGURES
Figure No. Caption Page
1 Fresnel lens optical landing system 2
2 Image formation by a thin lens
3 Ideal formation of beam distribution4 Virtual image distance v.s. source distance5 Focusing by measuring width of light beam 1°
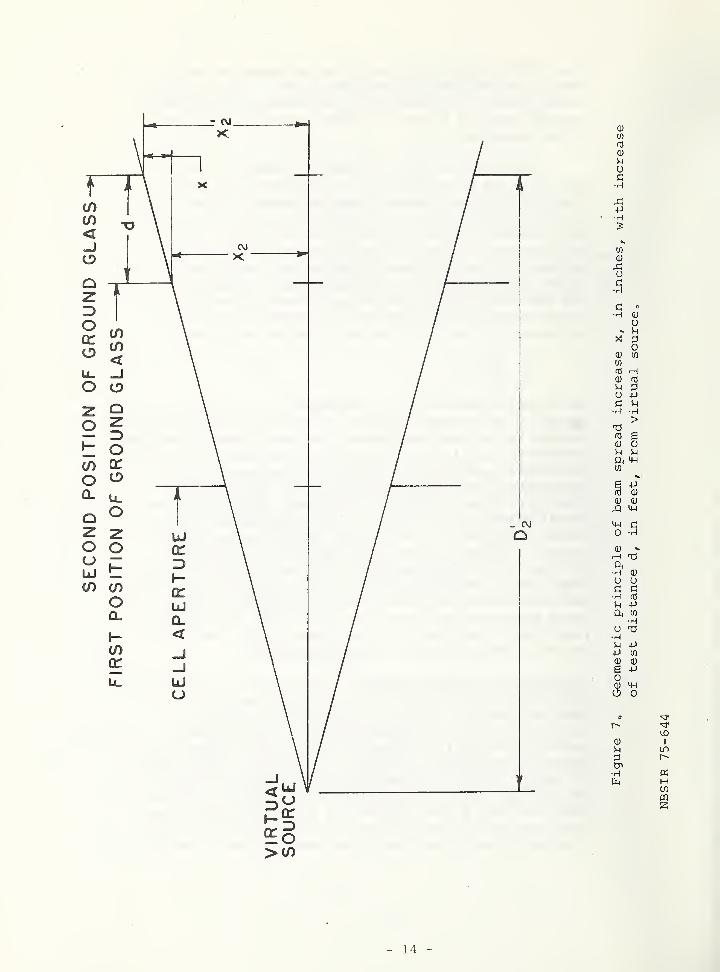
6 Geometric principle of beam spread7 Geometric principle of beam spread increase
with increase of test distance 14
8 Photograph of equipment for photometric methodwith meter readout (front view) I"
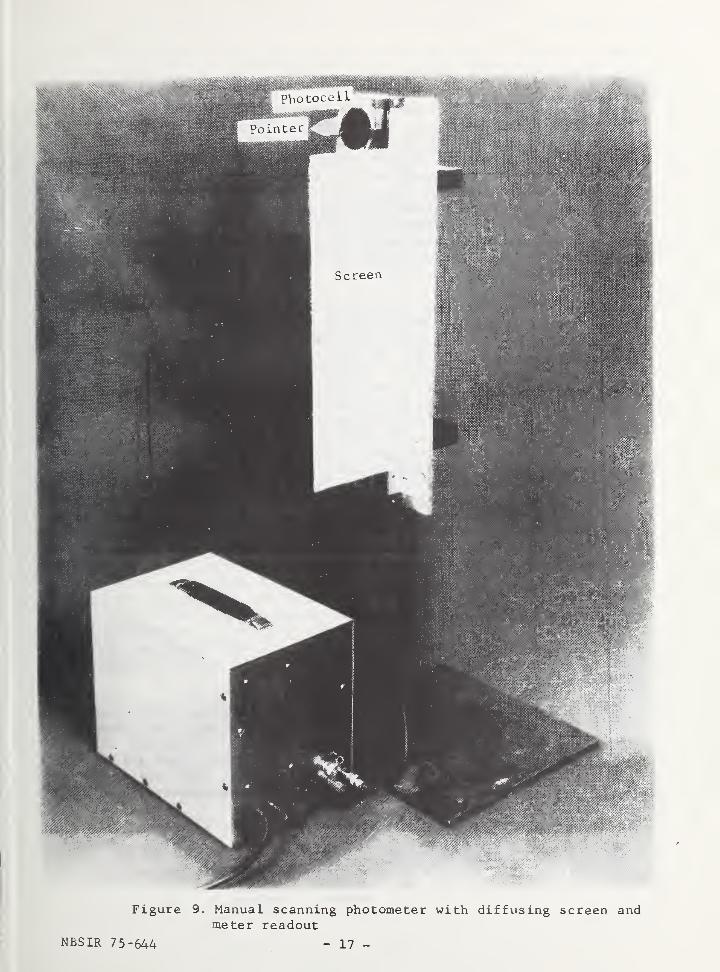
9 Photograph of equipment for photometric methodwith meter readout (back view) ^ 7
10 Geometry of peep-sight focusing device ^11 Equipment arrangement for peep sight focusing
method 20
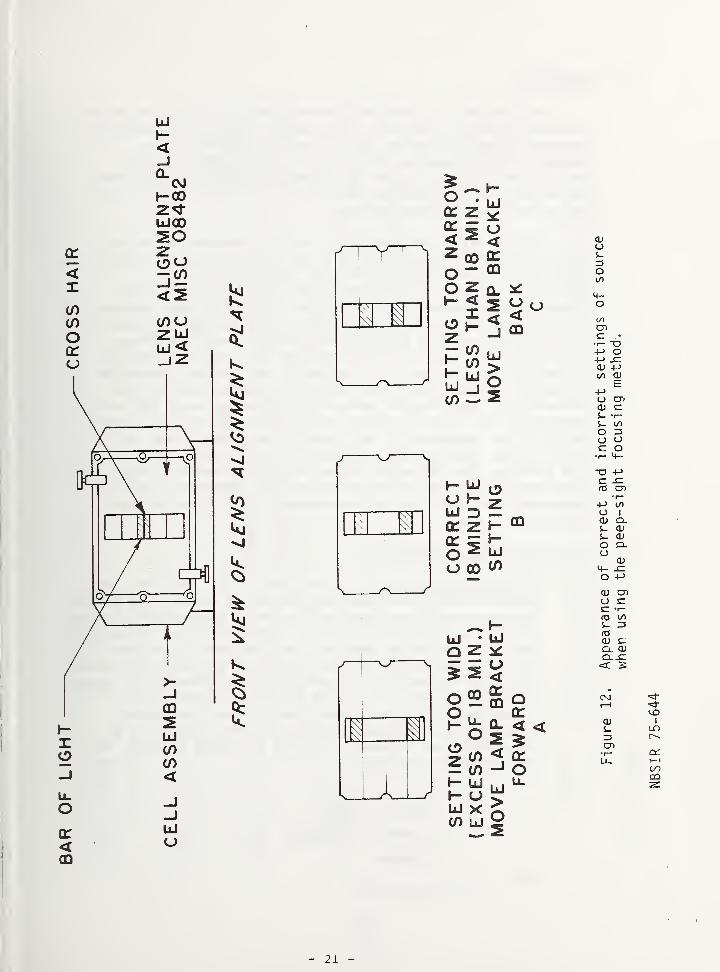
12 Appearance of correct and incorrect settings of21source9-3
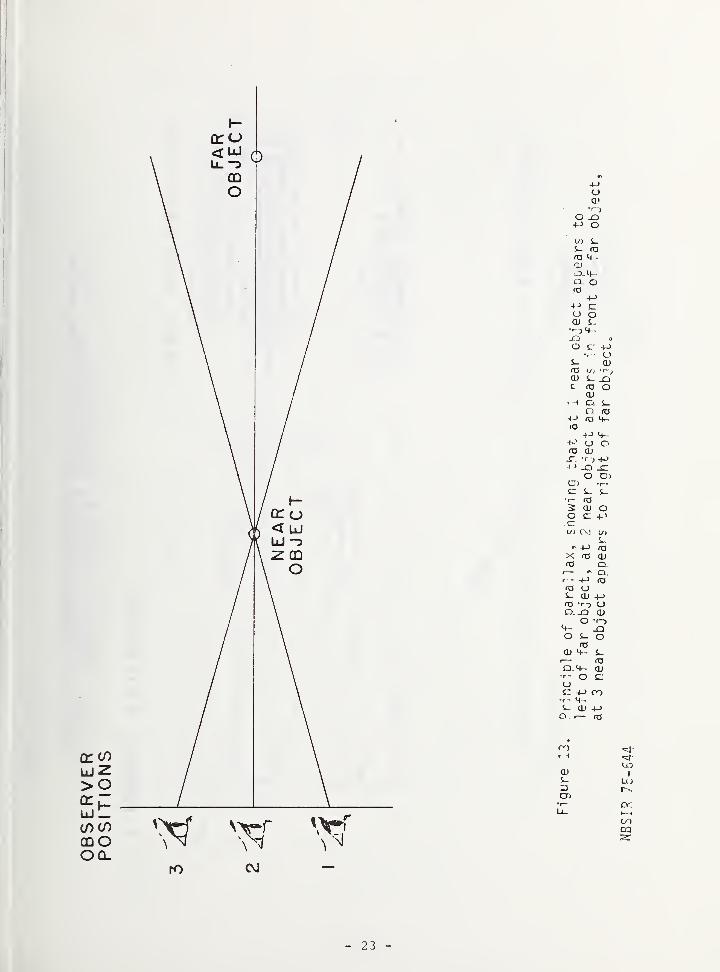
13 Principle of parallax ^ J
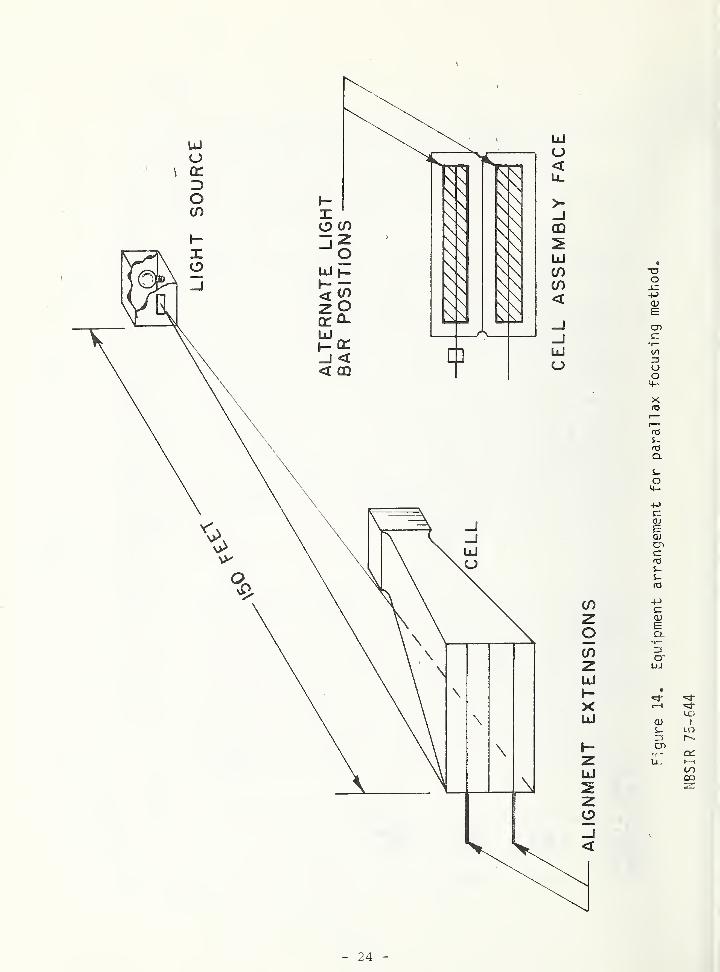
14 Equipment arrangement for parallax focusing 2 ^
9 s15 Image-formation by auxiliary lens
9 n16 Principle of chromatic aberration17 Equipment arrangement for focusing by matching
cell pattern 29
18 Cell and standard pattern display device19 Beam spread with lens No. 211720 Beam spread with lens No. 331
21 Beam spread with lens No. 247
22 Beam spread with lens No. 704
23 Beam spread with "Bad Lens" 36
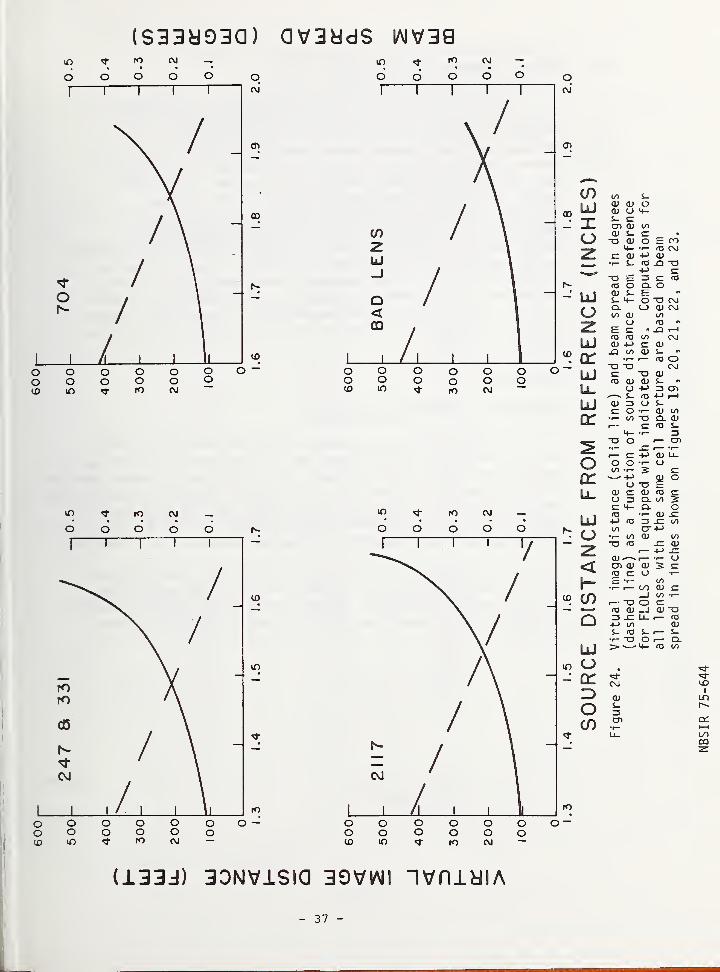
24 Virtual image distance and beam spread as a
function of the source distance 37
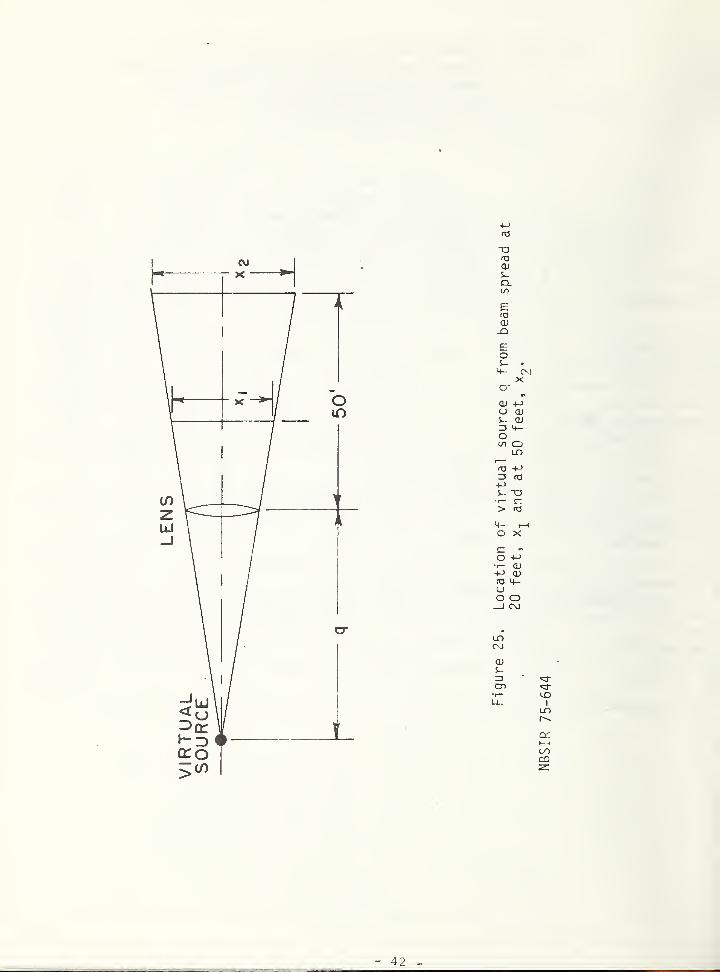
25 Location of virtual sources 42
A-l Effect of lenticular lens on beam spread 47
A-2 Effect of lens temperature on beam spread 49
A-3 Effect of slit width on beam spread 50
A-4 Effect of slit alignment on beam distribution ... 52
- iii -
TABLES
Page
I. Measurement of Source Distance for Focusing Methods 39
II. Computed Beam Spread and Image Distance, Lens 2117 ...... 40
III. Computed Beam Spread and Image Distance, Bad Lens 41
IV. Range of Source Position by Several Procedures 44
A-I Effect of Lamp Dimming on Beam Spread and VirtualSource Distance 54
A-II Effects of Source Color on Beam Spread and Virtual SourceDistance 55
- iv -
ABSTRACT
The Naval Air Engineering Center requested the NationalBureau of Standards to develop a method of evaluating the per-formance of lenses of the Fresnel Lens Optical Landing System(FLOLS) . In the course of this work, it was found that focusingof the cells of a FLOLS unit varied considerably. This led the
NBS to examine the various focusing techniques used in the pastand to develop a more precise method for focusing a cell. The
focusing methods studied include the following:
1 . Photometric2. Peep Sight3. Parallax4. Auxiliary Image-Forming Lens5. Pattern Matching
In addition, in the study of these focusing methods, severalother factors that affect the light-beam-forming characteristicsof a cell were investigated. These include the effects of,
1. Lenticular Lens2 . Lens Temperature 1
3. Slit Width4. Slit Alignment5. Lamp Dimming and Source Color
The results of this study indicate that visual methods offocusing the FLOLS system have inherent difficulties that lead toimproper focusing. Photometric procedures developed at NBS,however, can give adequate focusing precision.
- v -

1. IntroductionI
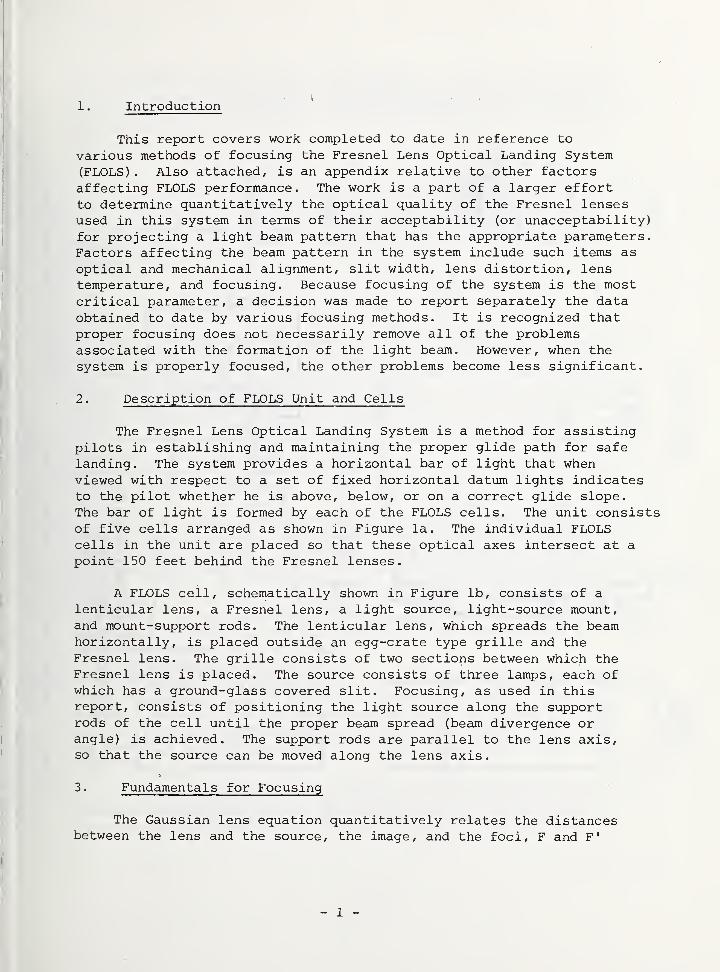
This report covers work completed to date in reference to
various methods of focusing the Fresnel Lens Optical Landing System(FLOLS) . Also attached, is an appendix relative to other factorsaffecting FLOLS performance. The work is a part of a larger effortto determine quantitatively the optical quality of the Fresnel lensesused in this system in terms of their acceptability (or unacceptability)for projecting a light beam pattern that has the appropriate parameters.Factors affecting the beam pattern in the system include such items as
optical and mechanical alignment, slit width, lens distortion, lenstemperature, and focusing. Because focusing of the system is the mostcritical parameter, a decision was made to report separately the dataobtained to date by various focusing methods. It is recognized thatproper focusing does not necessarily remove all of the problemsassociated with the formation of the light beam. However, when thesystem is properly focused, the other problems become less significant.
2. Description of FLOLS Unit and Cells
The Fresnel Lens Optical Landing System is a method for assistingpilots in establishing and maintaining the proper glide path for safe
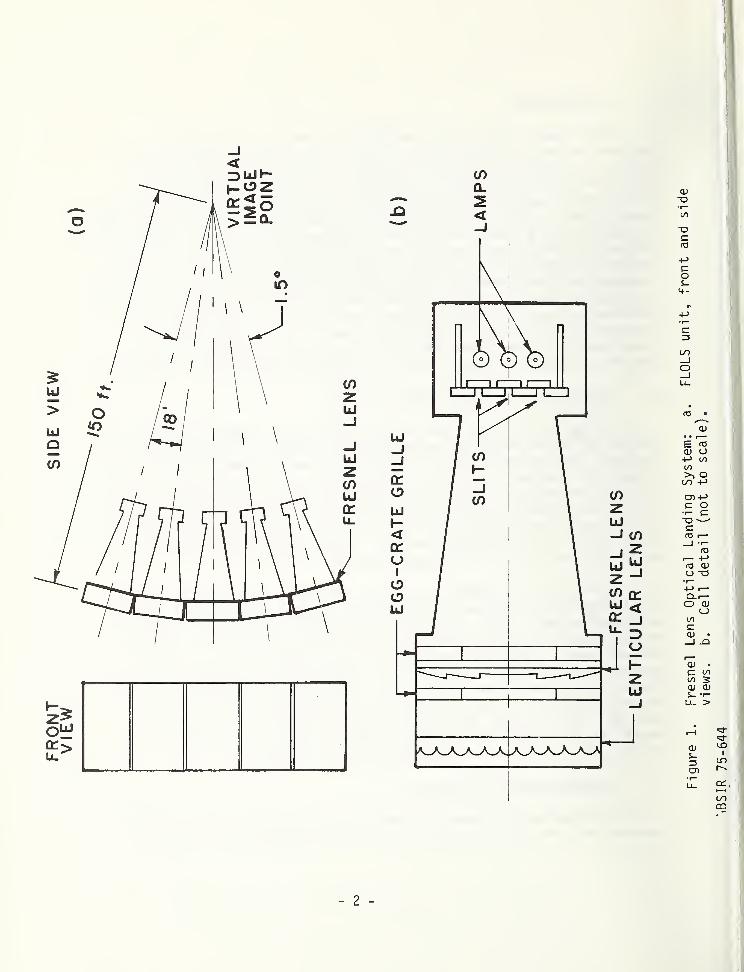
landing. The system provides a horizontal bar of light that whenviewed with respect to a set of fixed horizontal datum lights indicatesto the pilot whether he is above, below, or on a correct glide slope.The bar of light is formed by each of the FLOLS cells. The unit consistsof five cells arranged as shown in Figure la. The individual FLOLScells in the unit are placed so that these optical axes intersect at a
point 150 feet behind the Fresnel lenses.
A FLOLS cell, schematically shown in Figure lb, consists of a
lenticular lens, a Fresnel lens, a light source, light-source mount,and mount-support rods. The lenticular lens, which spreads the beamhorizontally, is placed outside an egg-crate type grille and theFresnel lens. The grille consists of two sections between which theFresnel lens is placed. The source consists of three lamps, each ofwhich has a ground-glass covered slit. Focusing, as used in thisreport, consists of positioning the light source along the supportrods of the cell until the proper beam spread (beam divergence orangle) is achieved. The support rods are parallel to the lens axis,so that the source can be moved along the lens axis.
3. Fundamentals for Focusing
The Gaussian lens equation quantitatively relates the distancesbetween the lens and the source, the image, and the foci, F and F'
- 1 -
(f)
a.
<T3
-oC(T3
+->
Co
+->
•r—
c
I/)
_1O
QJ
E ^<1J o+-> LO
>, qoo +->
en +Jc or- C-O '—
'
fC i—_l !-
ror— +->
fC <D(_) "O
•p
—
+-> i—Q-i—O <L>O10szQJ •
_! -Q
0} •
C CO
OJ O)S- -r-
u. >
L£)
I
LO
cc.
- 2 -
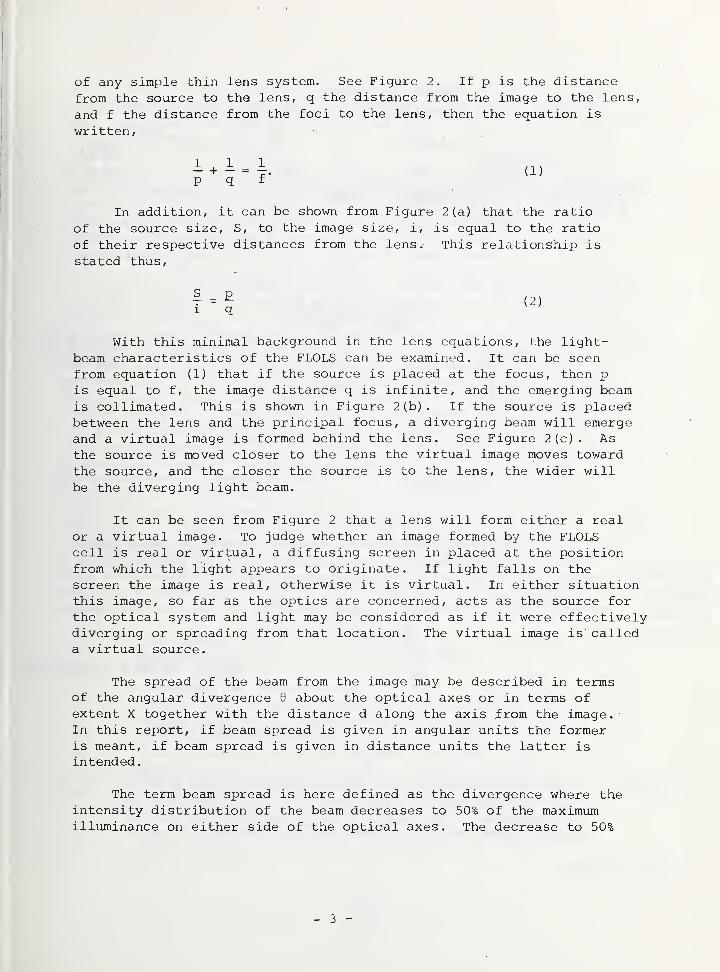
of any simple thin lens system. See Figure 2. If p is the distancefrom the source to the lens, q the distance from the image to the lens,
and f the distance from the foci to the lens, then the equation is
written,
p q f
In addition, it can be shown from Figure 2(a) that the ratioof the source size, S, to the image size, i, is equal to the ratio
of their respective distances from the lens.' This relationship is
stated thus,
i q(2)
With this minimal background in the lens equations, the light-beam characteristics of the FLOLS can be examined. It can be seenfrom equation (1) that if the source is placed at the focus, then pis equal to f, the image distance q is infinite, and the emerging beamis collimated. This is shown in Figure 2(b). If the source is placedbetween the lens and the principal focus, a diverging beam will emergeand a virtual image is formed behind the lens. See Figure 2(c). Asthe source is moved closer to the lens the virtual image moves towardthe source, and the closer the source is to the lens, the wider will
be the diverging light beam.
It can be seen from Figure 2 that a lens will form either a realor a virtual image. To judge whether an image formed by the FLOLScell is real or virtual, a diffusing screen in placed at the positionfrom which the light appears to originate. If light falls on thescreen the image is real, otherwise it is virtual. In either situationthis image, so far as the optics are concerned, acts as the source for
the optical system and light may be considered as if it were effectivelydiverging or spreading from that location. The virtual image is calleda virtual source.
The spread of the beam from the image may be described in termsof the angular divergence 6 about the optical axes or in terms ofextent X together with the distance d along the axis from the image.In this report, if beam spread is given in angular units the formeris meant, if beam spread is given in distance units the latter isintended.
The term beam spread is here defined as the divergence where theintensity distribution of the beam decreases to 50% of the maximumilluminance on either side of the optical axes. The decrease to 50%
- 3 -
Co])
BEAM SPREADANGLE, 9
LENSSOURCE
OPTICAL S
REALIMAGE
BEAM SPREADANGLE, 9
SOURCEi
> «
VIRTUAL-IMAGE(VirtualSource)
IMAGE ATINFINITY
BEAM SPREAD
BEAM SPREAD (INCHES)AT d
APERTURE STOP
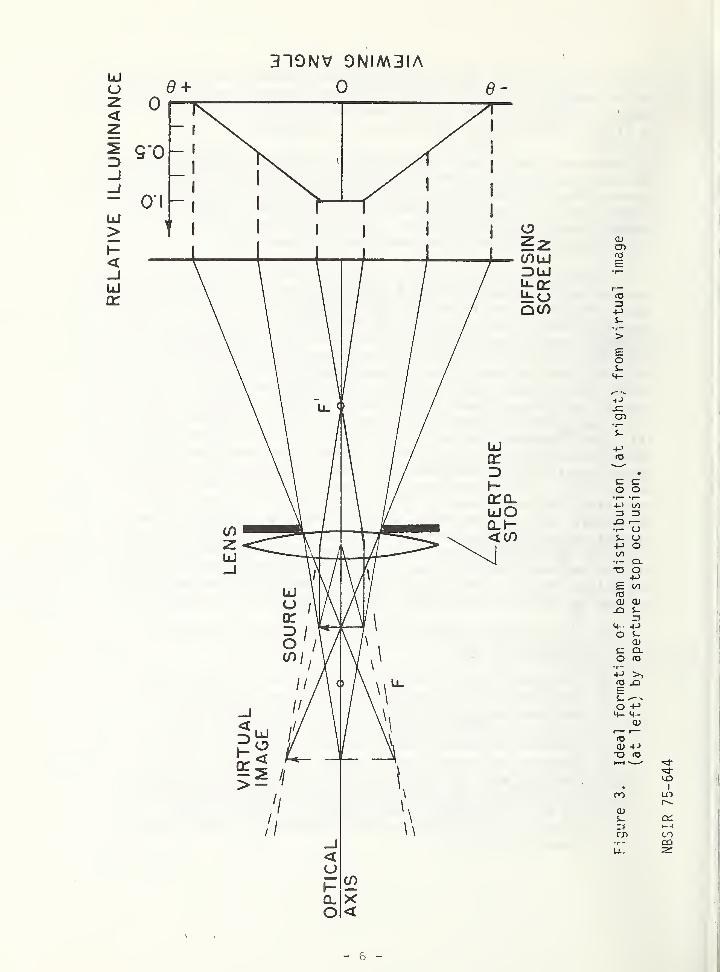
Figure 2 a Image formation by a thin lens: a} Source S at distance p from
lens, outside focus F forms real image i at distance q from lens,
outside focus F'; b} Source at p = F, image at q = * ; c) Source
at p between lens and F, image at -q, outside F.
MBS I R 75-544
- 4 -
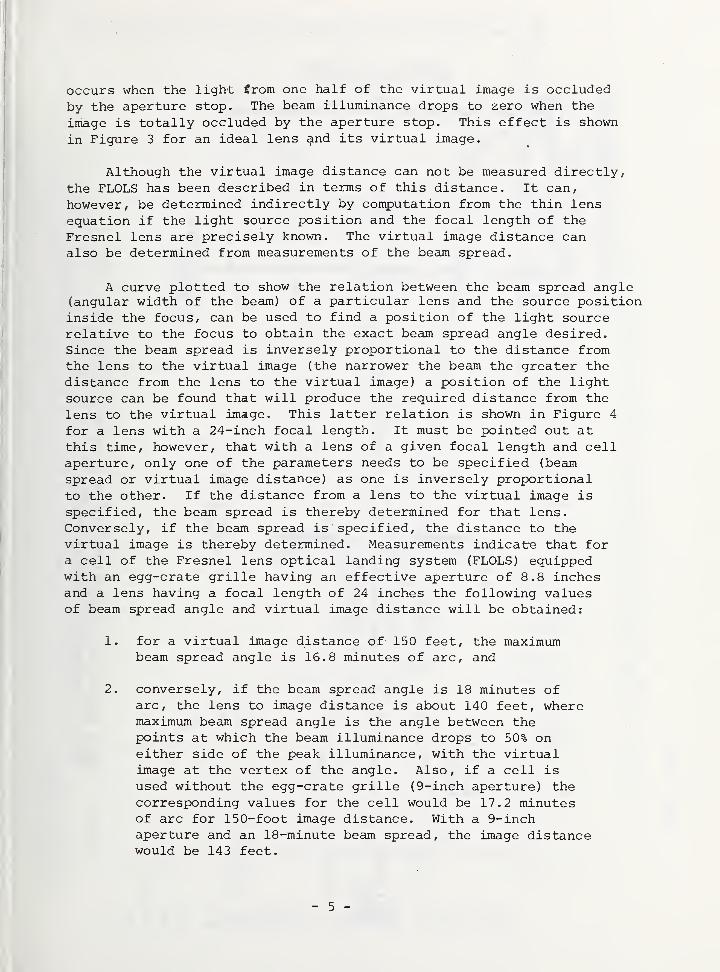
occurs when the light from one half of the virtual image is occluded
by the aperture stop. The beam illuminance drops to zero when the
image is totally occluded by the aperture stop. This effect is shown
in Figure 3 for an ideal lens and its virtual image.
Although the virtual image distance can not be measured directly,
the FLOLS has been described in terms of this distance. It can,
however, be determined indirectly by computation from the thin lens
equation if the light source position and the focal length of the
Fresnel lens are precisely known. The virtual image distance canalso be determined from measurements of the beam spread.
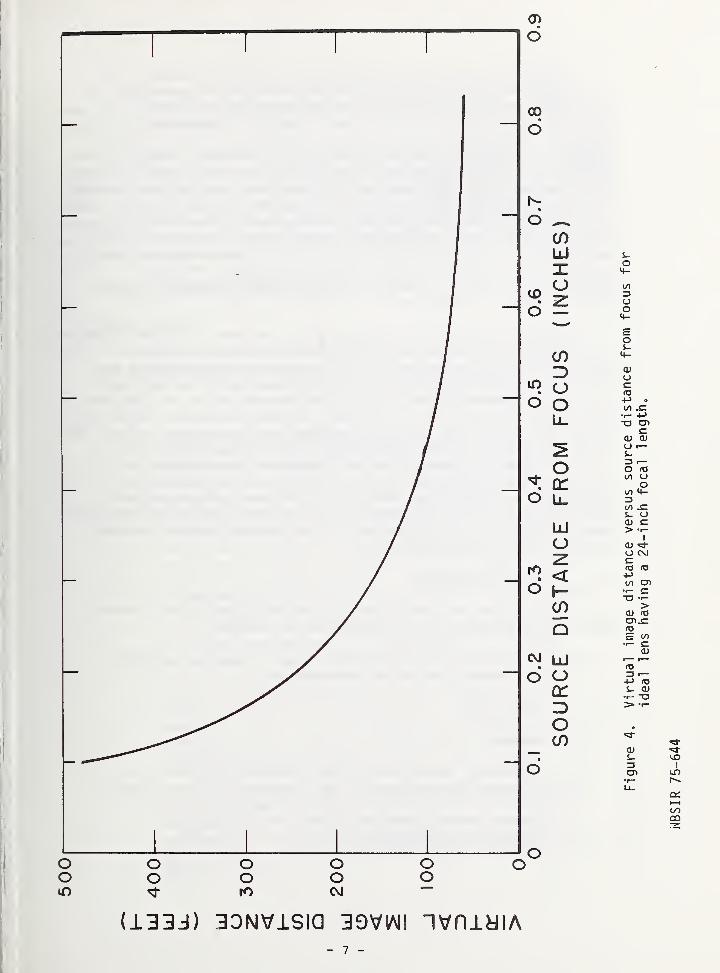
A curve plotted to show the relation between the beam spread angle(angular width of the beam) of a particular lens and the source positioninside the focus, can be used to find a position of the light sourcerelative to the focus to obtain the exact beam spread angle desired.Since the beam spread is inversely proportional to the distance fromthe lens to the virtual image (the narrower the beam the greater thedistance from the lens to the virtual image) a position of the lightsource can be found that will produce the required distance from the
lens to the virtual image. This latter relation is shown in Figure 4
for a lens with a 24-inch focal length. It must be pointed out atthis time, however, that with a lens of a given focal length and cellaperture, only one of the parameters needs to be specified (beam
spread or virtual image distance) as one is inversely proportionalto the other. If the distance from a lens to the virtual image is
specified, the beam spread is thereby determined for that lens.Conversely, if the beam spread is specified, the distance to thevirtual image is thereby determined. Measurements indicate that fora cell of the Fresnel lens optical landing system (FLOLS) equippedwith an egg-crate grille having an effective aperture of 8.8 inchesand a lens having a focal length of 24 inches the following valuesof beam spread angle and virtual image distance will be obtained:
1. for a virtual image distance of 150 feet, the maximumbeam spread angle is 16.8 minutes of arc, and
2. conversely, if the beam spread angle is 18 minutes ofarc, the lens to image distance is about 140 feet, wheremaximum beam spread angle is the angle between thepoints at which the beam illuminance drops to 50% oneither side of the peak illuminance, with the virtualimage at the vertex of the angle. Also, if a cell isused without the egg-crate grille (9-inch aperture) thecorresponding values for the cell would be 17.2 minutesof arc for 150-foot image distance. With a 9-inchaperture and an 18-minute beam spread, the image distancewould be 143 feet.
- 5 -
LdO
0<
IEZ>_l_J
0 1
Ld 1
> 1
<—1Ldcr
319NV 9NIM3IA
0
cucn
+->
s-
>
os-<+-
-i->
szCD
o oI— •!
—
4-> COZS 3-Q i—•r- US- U4-> Oto•.- Q.-o O
+JE tofOa) cu
n<+-• +->
O s-
a>C Q.O 03
+J >,
ES -
o +->
0Ji— i—
(1) 4-»
0)
13cn•r™U.
in
>—
<
CO
- 6 -
6
Since the beam spread angle can be measured photometrically to
an accuracy of a few seconds of arc (method explained later) andsince the position of the source can be measured mechanically to a
couple of thousandths of an inch, the problem of focusing becomesprimarily a matter of how much precision is required. The precisionrequired, in turn, determines which of the available focusing methodsshould be employed. Computations indicate that a 0.010 inch movementof the light source for a nominal lens, in the region of proper beamspread, changes the distance to the image about 5 feet. Corres-pondingly, the 0.010 inch movement changes the beam spread in thisregion about 1 minute of arc. These effects reduce the problem offocusing to two considerations: (1) what focusing precision is
required and (2) which parameter, virtual image distance or beamspread, "should be specified.
The overall FLOLS unit is mounted in the rack with five individualcells stacked in such a way as to project a total beam spread of 1.5degrees or 90 minutes of arc, This arrangement suggests that eachcell is intended to cover an angle of 18 minutes. To cover thisangle with a smooth transition of light between cells, an 18-minutebeam spread (measured to the one-half maximum illuminance level) is
required so that there be no illuminance decrease between cells. Thecells are placed so that their optical axes intersect at a point150 feet behind the Fresnel lenses. However, as seen from thediscussion above, the beam spread angle is 16.8 minutes to the 50%points for a virtual image distance of 150"feet. It is probablethat an angle smaller than 18 minutes per cell (0.3 degree) has beenused in practice, as a comparison of the various focusing methodsdescribed below will demonstrate.
4 . Methods of Focusing
Listed below are the various methods of focusing the FresnelLens Optical Landing System included in this study.
1. Photometric (photometer and either a graphic recordingor a meter readout of beam spread)
2. Peep sight
3; Parallax
4. Auxilliary image-forming lens (observing face of cellor observing beam pattern as projected onto white card)
5. Pattern matching (matching cell beam pattern to a
standard film pattern)
- 8 -
Five lenses were used in focusing by the photometric method.
In the intercomparison of the other methods only two lenses wereused, one designated No. 2117 and the other (furnished by NAEC)
designated "Bad Lens".
Repetitive measurements were made with each method to determinethe precision obtainable. Normally, 10 such measurements were made(five for each of two operators or observers) with each method.
However, if the settings by a particular method were very widelydispersed, work with this method was stopped with fewer than 10
measurements. A description of the test procedure for each methodutilized is given below.
5 . Description of Focusing Methods
5.1 Photometric
The photometric focusing method is based on the principleof measuring photometrically the illuminance in a verticalplane at a stated distance from the cell and finding thewidth of the beam at which one-half peak illuminance occurs.
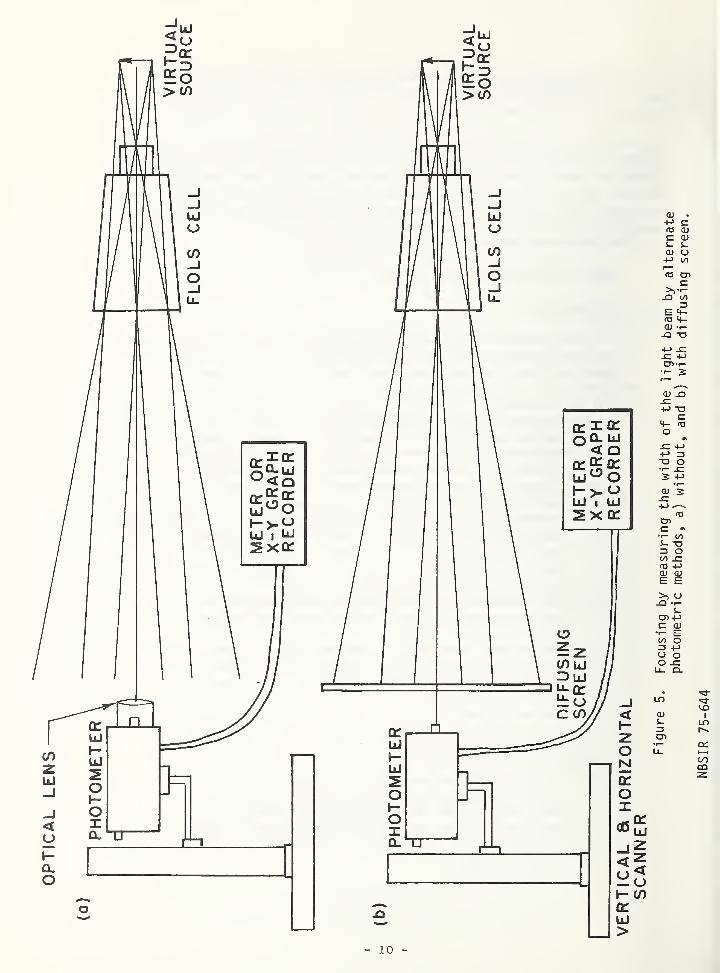
5.1.1 Photometer with Graphic Recorder . These measure-ments can be made by directly illuminating the photo-detector of a photometer, used as an illuminancemeter. Alternatively, with the photometer used asa luminance meter, measurements can be made by scanningthe light beam pattern as projected onto a diffusingscreen (ground glass or milky plastic) . The photometerscans the pattern formed after the light from the cellhas passed through the screen. The alternate arrange-ments of cell and photometer, with and withoutdiffusing screen are shown in Figure 5. The scanningis accomplished by traversing the beam pattern withthe photometer rather than by rotating the cell sothat its beam traverses the photometer. Rotationof the cell results in a small angular error in thatthe virtual light source is not at the axis of rota-tion but rather 150 feet beyond it. Because thetravel involved is small and would result in anextremely small error, rotation of the cell couldhave been used. In these measurements, however, thetraversing procedure was used for convenience.
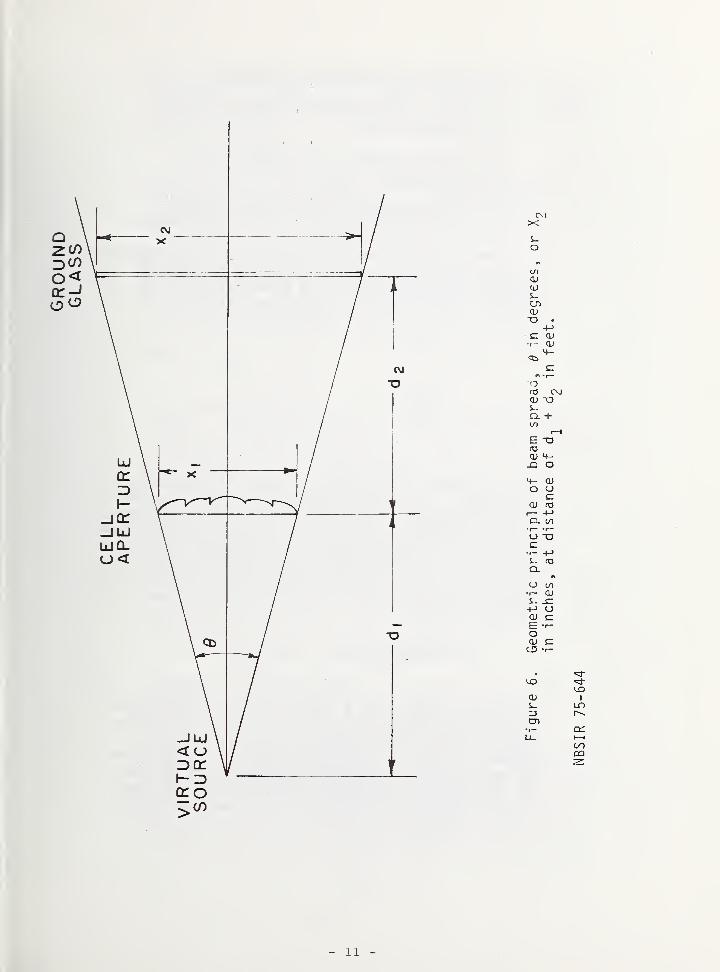
In photometric focusing the light source (lamps,slit and ground glass of the cell) is moved alongthe optical axis until the correct beam spread isobtained for the particular distance selected for themeasurements. The geometric principle is shown inFigure 6 where
- 9 -
- 10 -
CMX
o
cuO)S-cnCDT3 •
+->
C CD•r- <D
4—<*>
C«\ •
r
—
a03 CXI
cu "as-CL +(/)
i—
I
E -a
cu 4-jq o4- CU
o oc
cu foi— 4->
CL CO' I— I
—
o -acz•I- +Ji- fOCL
U (/)
r- a>s.- x:o
cu
Eoa>CD
CO
ai
cr>
«=*•
^i-co
i
LO
i—
i
ooCD
- 11 -
X^ is the cell 1 aperture or opening
X^ is the beam spread in inches at the 50%
luminance level
is the distance to the virtual imagefrom the cell aperture
d^ is the distance from the cell apertureto the plane selected for the measurement.
From Figure 6, because the source can be considereda point in the plane of the figure, it is apparent, thatthe beam spread in inches at a given distance from cellaperture can be computed from the relation
, or
X„ =x1(d
1+ d
2)
(3)
It can be seen from Figure 3 that the beam does not cutoff sharply, but gradually tapers off, hence the 50%
illuminance points are used to define the beam spread.Use of a diffusing screen is a means that permits visualestimate of the beam spread. As an example of the beamspread at a diffusing screen distance of 20 feet from a
a cell that has an effective aperture of 8.8 inches (cellwith egg-crate grille) and a virtual image distance of150 "feet would be,
. 8.8,15^ 20,- . 9 . 97 inches .
For a cell aperture of 9 inches (as for a cell withoutthe egg-crate) the beam spread under the same distancesas the example above would be 10.2 inches. Thus in-
creasing the aperture increases the beam spread if thedistances are not changed. Furthermore, the accuracyof the computed beam spread depends on how accuratelythe cell aperture is measured, on the assumption that no
- 12 -
lens effect in the vertical plane is caused by the
lenticular lens which covers the Fresnel lens. Actually,
a lens effect is introduced by the lenticular lens whichspreads the beam slightly. (This effect is discussedin the Appendix.)
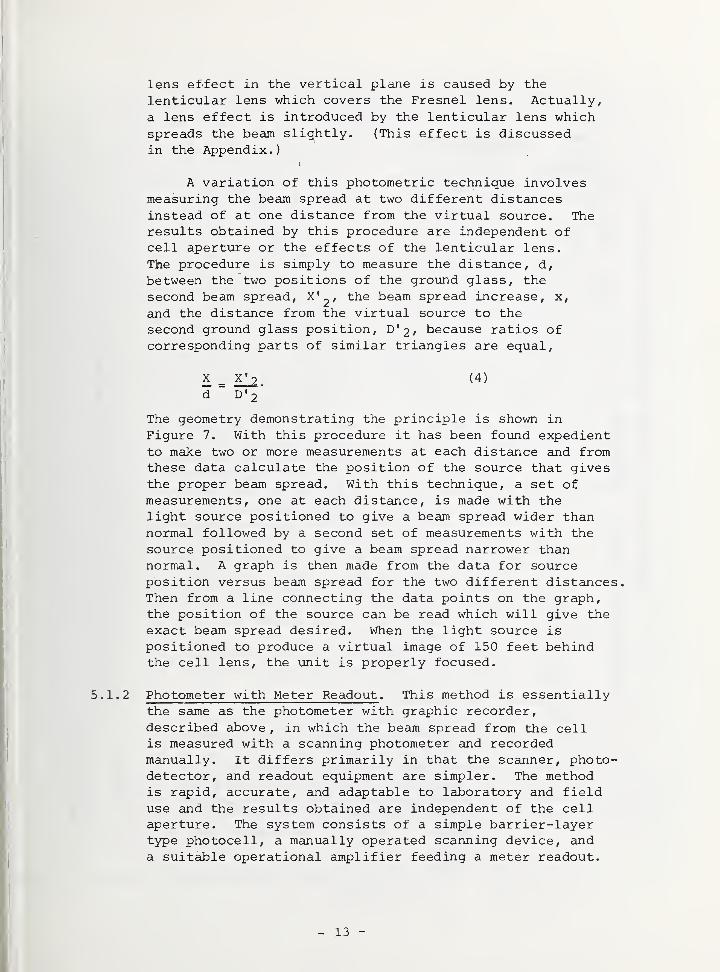
A variation of this photometric technique involvesmeasuring the beam spread at two different distancesinstead of at one distance from the virtual source. Theresults obtained by this procedure are independent ofcell aperture or the effects of the lenticular lens.
The procedure is simply to measure the distance, d,
between the two positions of the ground glass, the
second beam spread, the beam spread increase, x,
and the distance from the virtual source to the
second ground glass position, D'2, because ratios ofcorresponding parts of similar triangles are equal,
X = X^2 < 4 )
d D' 2
"
The geometry demonstrating the principle is shown in
Figure 7. With this procedure it has been found expedientto make two or more measurements at each distance and fromthese data calculate the position of the source that givesthe proper beam spread. With this technique, a set ofmeasurements, one at each distance, is made with thelight source positioned to give a beam spread wider thannormal followed by a second set of measurements with the
source positioned to give a beam spread narrower thannormal. A graph is then made from the data for sourceposition versus beam spread for the two different distances.Then from a line connecting the data points on the graph,the position of the source can be read which will give the
exact beam spread desired. When the light source is
positioned to produce a virtual image of 150 feet behindthe cell lens, the unit is properly focused.
5.1.2 Photometer with Meter Readout . This method is essentiallythe same as the photometer with graphic recorder,described above , in which the beam spread from the cellis measured with a scanning photometer and recordedmanually. It differs primarily in that the scanner, photo-detector, and readout equipment are simpler. The methodis rapid, accurate, and adaptable to laboratory and fielduse and the results obtained are independent of the cellaperture. The system consists of a simple barrier-layertype photocell, a manually operated scanning device, anda suitable operational amplifier feeding a meter readout.
- 13 -
CD
t/J
fO
<u
uuc•H
+J•H
w
u
cH <D
OU00
CD w0)
03 rHCD rd
U 3u -P
c H•H •H
>T3
etu 0i-i
Qt 4-1
-p
i<u
CD
4-1
4-1 c0 •H
CD «•
T3
•H CD
O UC C•H 03
^1 •P
D4 tn
HU T3HU +J
-P . W(11 <u
e0CD 4-1
o 0
<D
•Hfa
i
Ln
HCO
W2
> CO
- 14 -
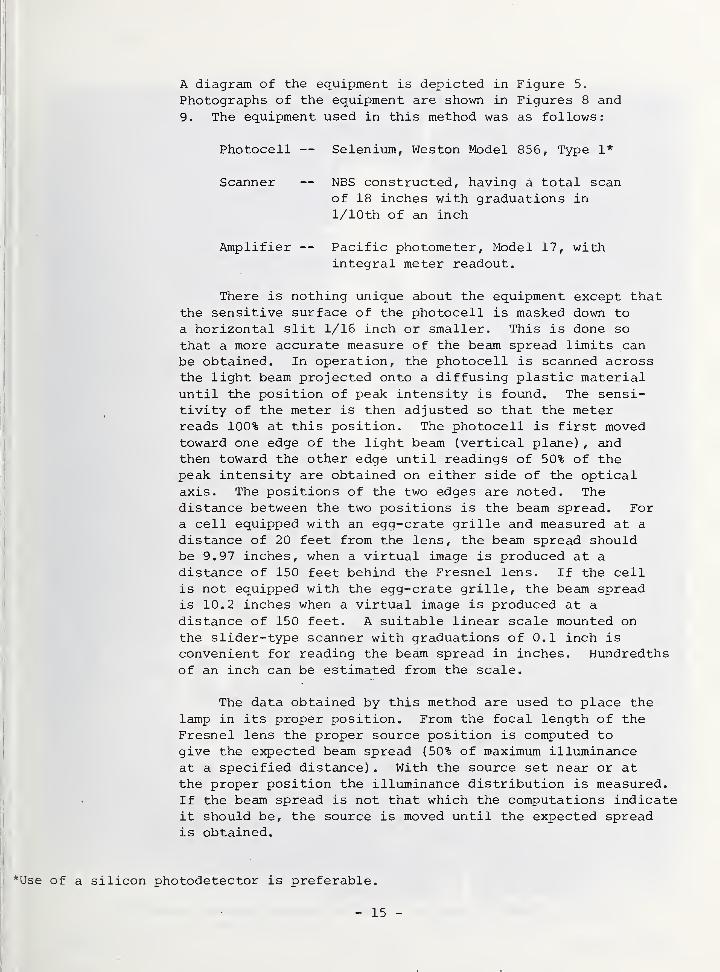
A diagram of the equipment is depicted in Figure 5.
Photographs of the equipment are shown in Figures 8 and9. The equipment used in this method was as follows:
Photocell — Selenium, Weston Model 856, Type 1*
Scanner — NBS constructed, having a total scanof 18 inches with graduations in
l/10th of an inch
Amplifier — Pacific photometer, Model 17, withintegral meter readout.
There is nothing unique about the equipment except thatthe sensitive surface of the photocell is masked down to
a horizontal slit 1/16 inch or smaller. This is done so
that a more accurate measure of the beam spread limits canbe obtained. In operation, the photocell is scanned acrossthe light beam projected onto a diffusing plastic materialuntil the position of peak intensity is found. The sensi-tivity of the meter is then adjusted so that the meterreads 100% at this position. The photocell is first movedtoward one edge of the light beam (vertical plane) , andthen toward the other edge until readings of 50% of thepeak intensity are obtained on either side of the opticalaxis. The positions of the two edges are noted. Thedistance between the two positions is the beam spread. Fora cell equipped with an egg-crate grille and measured at a
distance of 20 feet from the lens, the beam spread shouldbe 9.97 inches, when a virtual image is produced at a
distance of 150 feet behind the Fresnel lens. If the cellis not equipped with the egg-crate grille, the beam spreadis 10.2 inches when a virtual image is produced at a
distance of 150 feet. A suitable linear scale mounted onthe slider-type scanner with graduations of 0.1 inch is
convenient for reading the beam spread in inches. Hundredthsof an inch can be estimated from the scale.
The data obtained by this method are used to place the
lamp in its proper position. From the focal length of theFresnel lens the proper source position is computed togive the expected beam spread (50% of maximum illuminanceat a specified distance) . With the source set near or atthe proper position the illuminance distribution is measured.If the beam spread is not that which the computations indicateit should be, the source is moved until the expected spreadis obtained.
*Use of a silicon photodetector is preferable.
- 15 -
Figure 8. Manual scanning photometer with diffussing screen andmeter readout.
NBSIR 7 5-644~ 16 -
5.2 Peep Sight
The peep sight method measures, at a given test distancefrom the Fresnel lens, the vertical displacement, from the
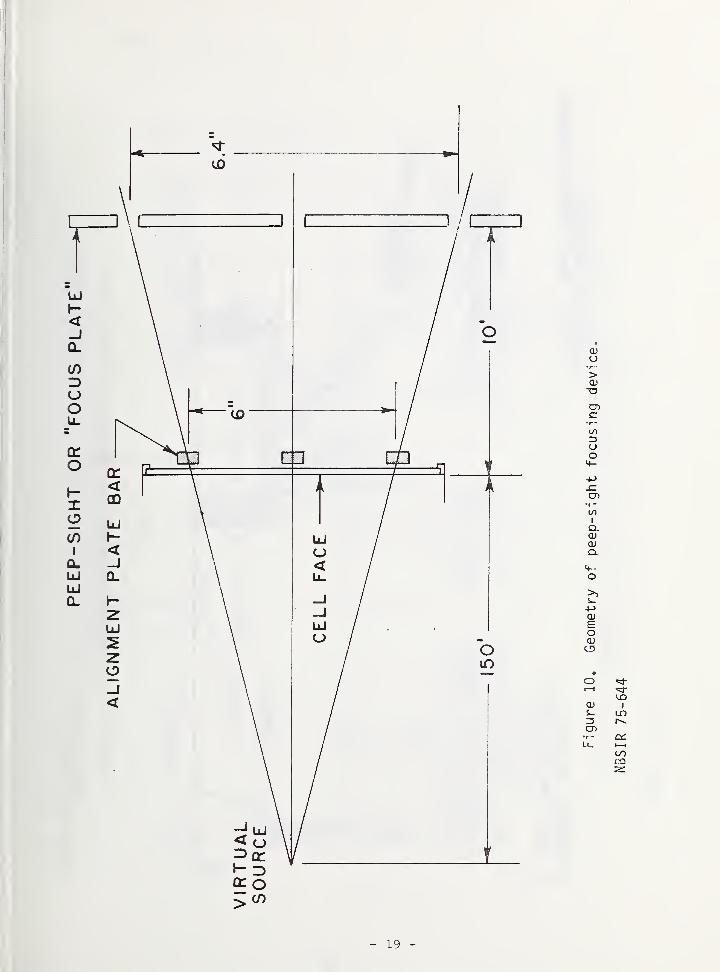
optical axis of the cell, of the bar of light ("meat ball")emanating from the virtual source. ' When the displacementis such as to indicate that the virtual source is at a distanceof 150 feet from the Fresnel lens, the unit is properly focused.The geometry of the method is as shown in Figure 10. Theprocedure for focusing by this method is described in the
Naval Air Engineering publication, NAEC-MISC-08668 , RevisionA, "Acceptance Requirements for Fresnel Lens Cell Assembly,N2562/42534.
"
This method was executed by means of a hole-alignment kitfurnished by NAEC, Philadelphia, Pa. The kit consists of a
"focus plate" with three tiny holes through which the lightemanating from the. cell is viewed and a "lens-alignment plate",consisting of a vertical plate and three horizontal bars, whichfastens to the face of the cell, simultaneously. The verticalspacing of the holes in the plate together with the spacingof the bars of the lens alignment plate are chosen to positionthe virtual image at a distance of 150 feet when the light barof the cell is successively aligned with the proper peep holeand bar of the focusing device. The device used was designedfor a test distance of 10 feet. Thus, the outside holespacing in the focus plate was 6.4 inches while the outside barspacing of the lens alignment plate was 6 inches.
In using the equipment, the height of the focus plate is
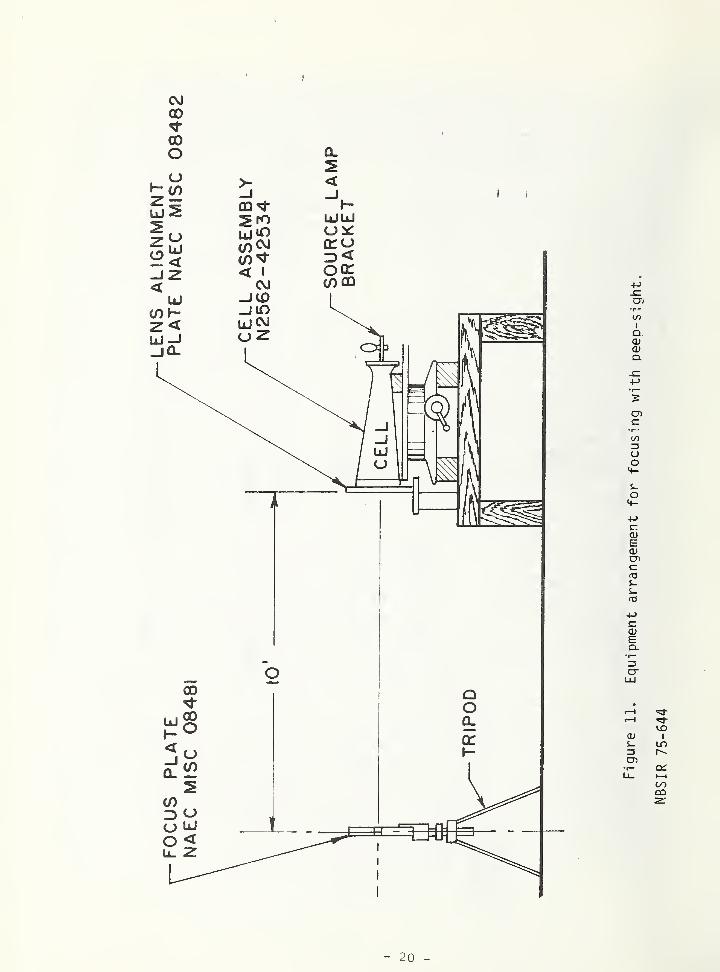
adjusted so that its center hole is at the same height as thecenter grid of the egg-crate of the cell face. Then whilealternately viewing through the other two holes (upper andlower) of the plate, the source is moved along the opticalaxis of the cell until the correct setting, in the judgementof the observer, is achieved. Figure 11 depicts the equipmentset-up for the measurements while Figure 12 shows the appear-ance of correct and incorrect settings.
For the measurements reported here two persons were usedto make the settings; one served as operator while the otherserved as observer. While the operator moved the source, the
observer sighted through the holes of the focus plate and
made the judgements as to the correct focus. Then theyexchanged roles until a total of ten such measurements (five
by each observer) were made.
- 18 -
- 19 -
Ld
<X
HCO
UJOOSO
<5
X
<CD
LdCOCO<
LdO
I
<0
K
5
n
1
•
j; w ~s
\ —r
1
o: z 2< s <2 00 Kq - QD
O 2 Q. *
_j CD
K Ld O-J 9
CO — 2
j— Ld
O h-Ld 3or 2
Ld
U 00 to
CD
o ^
• Ldzu<orCD
Ul q_
LdQ Z
o 5o
"
^ CO— COK LdH ULd XCO Ld
Ld>o
cr< <
or
oLi-
euas-
O(/)
M—Oto
C •
•i- -a+-> o+-> x:<u -pto O)
4->
OQJS-
oo
enc•r~
to3Uo<4-
-O 4->
+->
oais-s-
oa
t/>
i
a;
o -m
a> cno cc !-fO toS- =5fOCU c
CXI
a)s-Z3cn
tOI
LD
i—
t
ooCO
- 21 -
5.3 Parallax
This method is based on an established principle of optics
in which relative positions of an object closer to an observerappears to shift relative to an object further from the
observer as the observer moves across the line joining the
two objects. This is shown in Figure 13. Although this prin-ciple was used on the first feasibility models, it later cameto be known as the Xerox method.
In this method an observer visually compares the motionof the light bar of the eel] with that of a stationary objectpositioned 150 feet behind the cell as he moves his eyevertically across the projected beam from the cell. In the
present measurements, a light source with a slit type aperture1/4 inch in height and approximately 1 1/2 inch in the hori-zontal plane was used to help the observer judge the properalignment. Two small rods are mounted from the cell face andto the side of the unit. A diagram of the set-up is shown in
Figure 14. As had been done with the preceding method, twopersons were used for the measurements, one operator and oneobserver. The operator varied the position of the cell sourceuntil in the judgement of the cbserver the correct rate ofmovement, was observed and alignment was achieved. The operatorand observer then exchanged roles until each observer madefive such judgements of the coincidence of the light bar andextension rods near the extreme movement for a total of tenreadings
.
5.4 Auxiliary Image-forming Lens
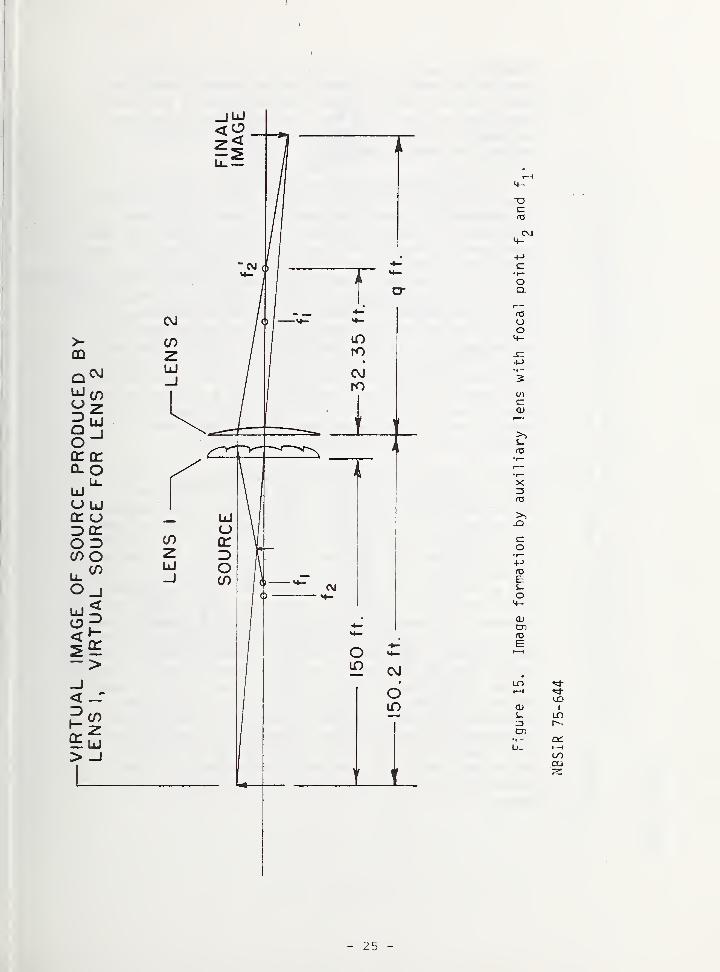
5.4.1 Observing Face of Cell. Focusing by the auxiliary lensmethod employs the quantitative law of lenses that relatesdistances of the source and the image to the focal lengthas was explained in Section 3. This method is accomplishedwith the use of an auxiliary hang-on lens. The lensused in this investigation, furnished by NAEC, Philadelphia,is plano-convex with a diameter of approximately 15 inches,and a focal length of about 32.35 feet. The virtualimage formed by the Fresnel lens acts as the virtualsource of the auxiliary lens and forms an image at a
distance q as is shown in Figure 15. This distance canbe computed from eg. 1
1 1 1
q 32. 35 150.2
0.030912 - 0.006658
0.024254or
q 41.23 feet
- 22 -
o
+J<_>
(Li
'<•->
O _QM O</> i-i- fOTO U -
Q.1-CL OrO
-»-> EU Oa> s~
-TJ .o
e: 4->
ua)
ra </> t-j
c. ro oa>
• H a s~.
O ra+-> ra 4-
4-> q~-i- cj oro CD
-sr. t-3 +j+J j3 x:
oDlCI S_•r- 1X3
3 a> oO C..c
</; C\l I/)
s*.•> 4-> raX ra CDra Q.
i— " Oli— +> rara u£- CD +->
ra -r-} uCL_a CD
u ° ' r">
O S- Ora
O) f~ S~i— raQ. <+- CD•r- O Gu£- +J CO•r- M -
i- CD +->
a . i~ ra
D)I""
CDi-
CT)
I
U>r--.
DCi—
i
<S)
CO
- 23 -
- 24 -
t
-JUJ
- 25 -
Therefore, when the auxiliary lens is mounted over the
face of the cell, 0.2 foot from the Fresnel lens, the
image can be observed at a distance of 41.23 feet from
the auxiliary lens. To make the focus determinations,an observer looks into the cell while an operatoradjusts the source position.
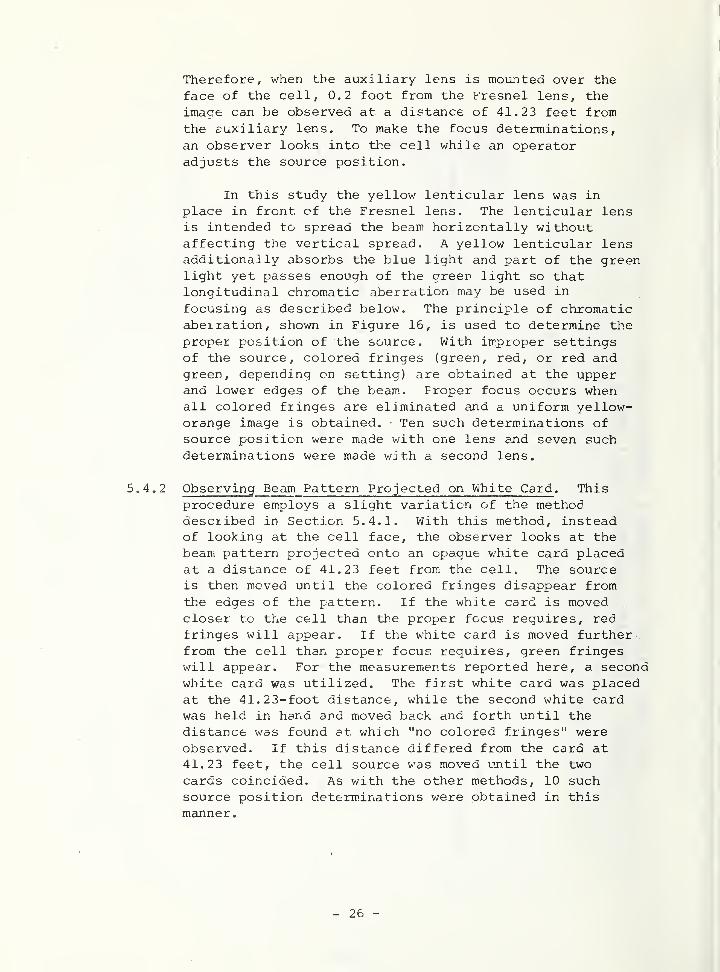
In this study the yellow lenticular lens was in
place in front, of the Fresnel lens. The lenticular lensis intended to spread the beam horizontally withoutaffecting the vertical spread. A yellow lenticular lensadditionally absorbs the blue light and part of the greenlight yet passes enough of the green light so thatlongitudinal chromatic aberration may be used in
focusing as described below. The principle of chromaticabei ration, shown in Figure 16, is used to determine the
proper position of the source. With improper settingsof the source, colored fringes (green, red, or red andgreen, depending on setting) are obtained at the upperand lower edges of the beam. F roper focus occurs whenall colored fringes are eliminated and a uniform yellow-orange image is obtained. Ten such determinations ofsource position were made with one lens and seven suchdeterminations were made with a second lens.
5.4.2 Observing Beam Pattern Projected on White Card . Thisprocedure employs a slight variation of the methoddescribed in Section 5.4.1. With this method, insteadof looking at the cell face, the observer looks at thebeam pattern projected onto an opaque white card placedat a distance of 41.23 feet from the cell. The sourceis then moved until the colored fringes disappear fromthe edges of the pattern. If the white card is movedcloser to the cell than the proper focus requires, redfringes will appear. If the white card is moved furtherfrom the cell than proper focus requires, green fringeswill appear. For the measurements reported here, a secondwhite card was utilized. The first white card was placedat the 41.23-foot distance, while the second white cardwas held in hand and moved back and forth until the
distance was found at. which "no colored fringes" wereobserved. If this distance differed from the card at41.23 feet, the cell source was moved until the two
cards coincided. As with the other methods, 10 suchsource position determinations were obtained in thismanner.
- 26 -
S39NIUJ N33H9 9 Q3U
S39NIU3 ONS39NIU3 Q3d
S39Nldd N33U9
Ou
s-O)+->
TJOil
S-O
i
—
T3C
a; ro 4
>, I/)
c airO QJ cn
ai c-C S-+-> CT> S-•I
—
s -o£Z O
+-> Erar *>
+J "CS OO)
C7> i~ #»
C•
i
—
0k oC •i
—
O ai toQJs_cno
0J oo >
-l->
+-> 1/1
r0 rOs- c O)s- ra
<D oJD 4—ra to O
a>(_) CD qj•r~ ra4-> E UrO °i
—
S-
E •r™
O Us- to-C c +->
u <u ra
<+- •n
o s- s-ro o
<D s
—
i
—
cl o to•i— aiCJ CD
G cQJ
si siex.
QJS-=3COi
—
I
CD
- 27 -
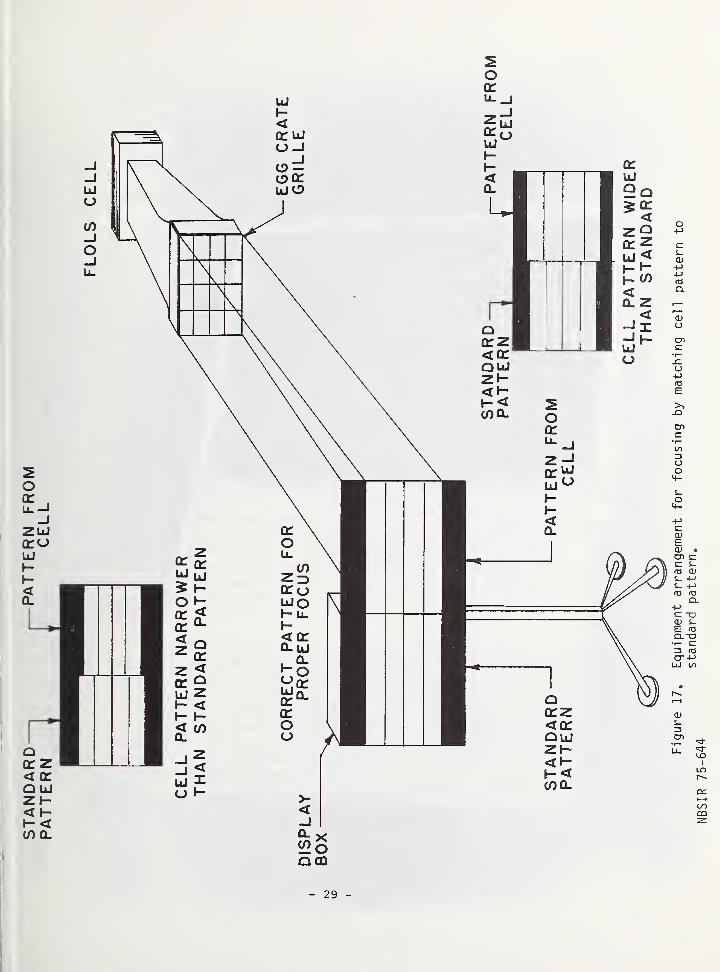
Pattern Matching (Matching cell beam pattern to a standardpattern)
\ \
The principle of the pattern matching method is to judgewhen, at a given distance from the cell being focused, the
beam pattern formed on a translucent screen matches a "standardpattern" placed at that distance. The standard pattern is a
photographic color transparency of a cell beam patternproperly focused on a transmitting diffuser. The verticaland horizontal bars of the grille cause shadows in the beam andform the pattern. The lenticular lens tends to diffuse lightinto the shadows of the vertical bars and leaves only distincthorizontal shadows in the pattern. To obtain the transparencya photograph is made of the beam pattern after being transmittedby the diffuser. For the measurements here reported, thephotograph was made at a distance of 20 feet from the face of
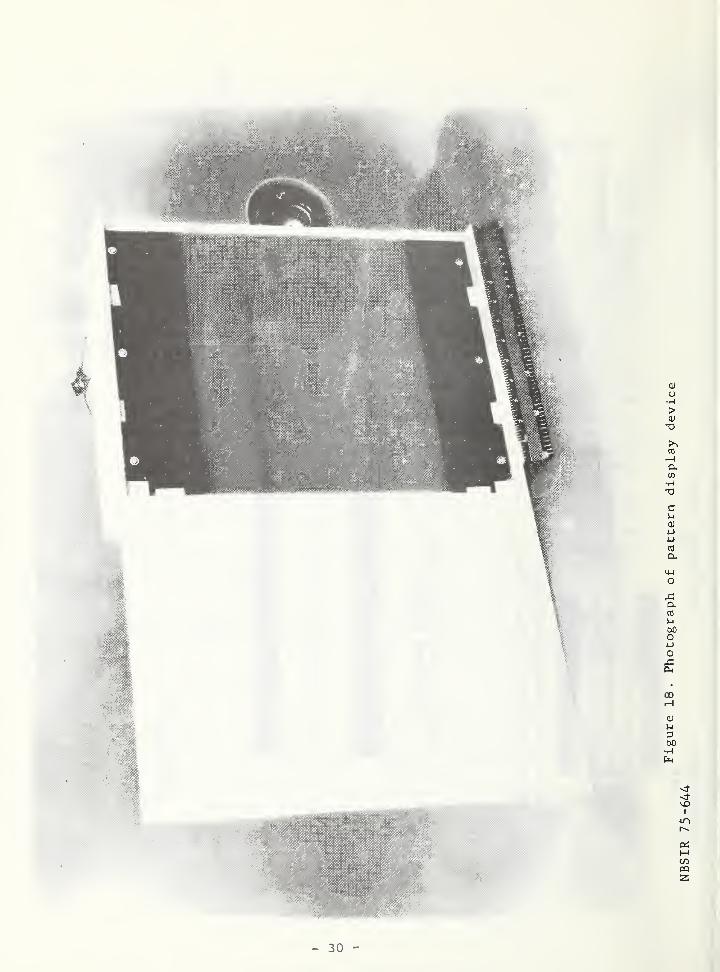
the cell. Similarly, the pattern-matching determinations weremade at the 20- foot distance. At this distance the beam spread(at 50% points) of a properly focused cell is about 9.97 inchesin the vertical plane. The transparency for the standard patternis made to actual size by using appropriate dimension markersin the initial photograph. To display the transparency for thematching determinations, a box, painted white inside, is constructedand equipped with a translucent plastic window and an incandescentlamp mounted in the box. The window is made of the same milkyplastic material as the initial photograph. The plastic materialnot only covers the window but extends about 12 inches to one sideof the box. The purpose of the extension is to receive the lightbeam from the cell for the pattern matching determinations. Thisarrangement places the beam pattern and the standard patternside by side for convenient pattern matching. Only a very thindark strip separates the two patterns. The window and theextension plastic material are made in two sections. Theirabutting edges are painted black to prevent light spillagefrom one section to the other by diffusion. The arrangement ofthe equipment is depicted in Figure 17. Figure 18 is a photographof the pattern display device.
In use, the equipment is placed in front of the test cellat the distance prescribed for the pattern. The light sourceof the cell is then moved along the optical axis of the Fresnellens as was done for the other focusing procedures until, in
the judgement of an observer, an exact match of the beampattern and standard pattern is obtained. Particular attentionis paid to matching the respective beam widths as thisparameter determines the proper focus of the cell. This
- 28 -
Q GQ
- 29 -
- 30 -
procedure was used for the measurements reported here. Tensuch determinations were made with approximately half startingwith the pattern wider and half starting with the patternnarrower than the standard pattern.
6 . Results
6.1 Photometric Procedures
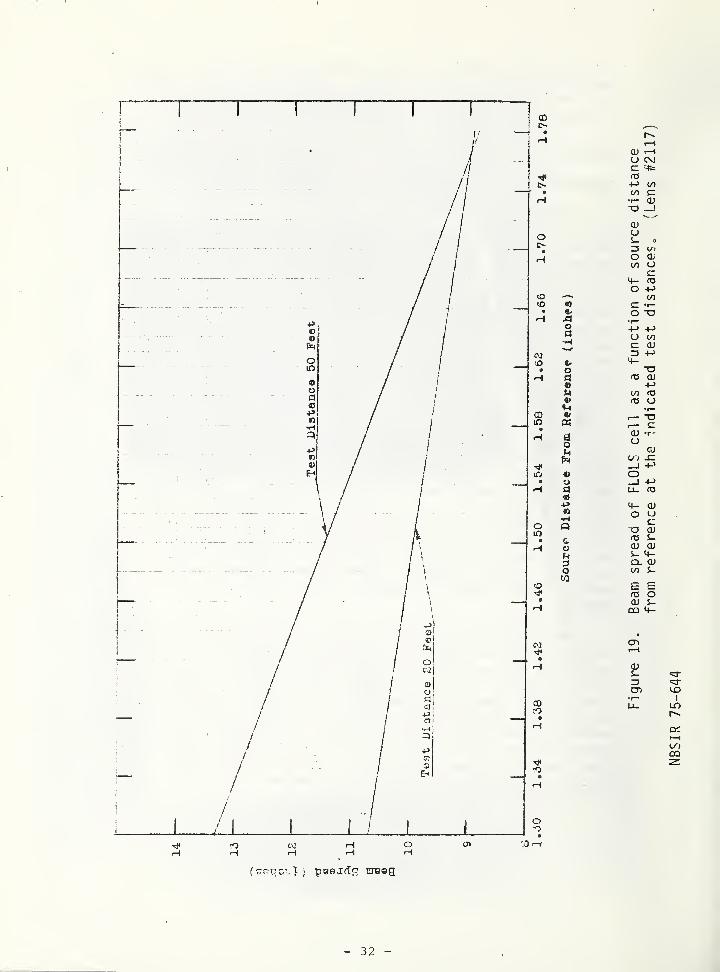
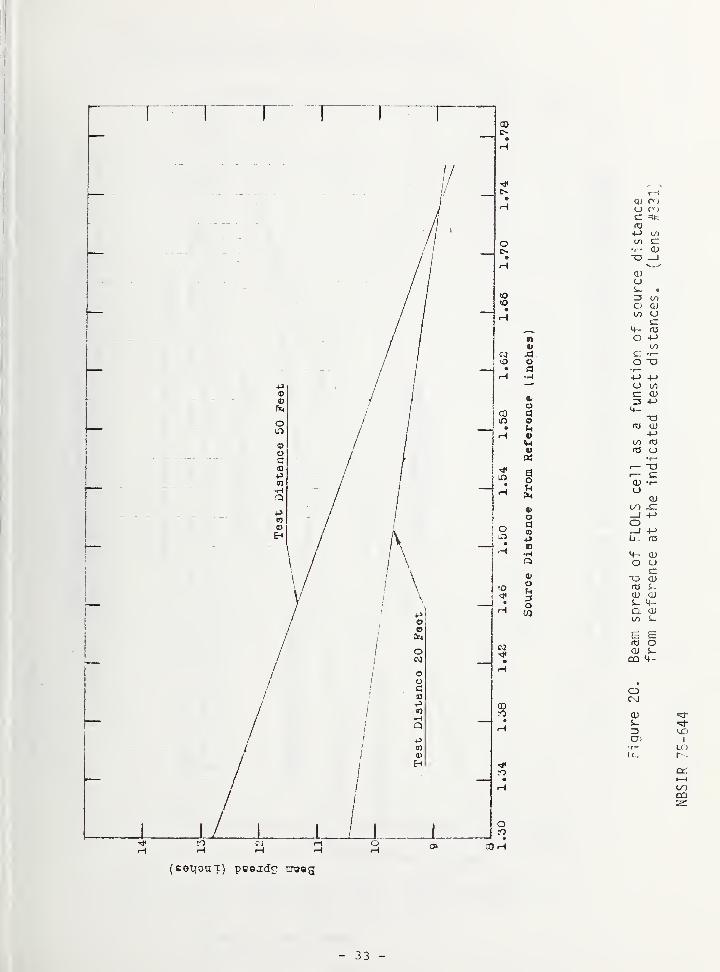
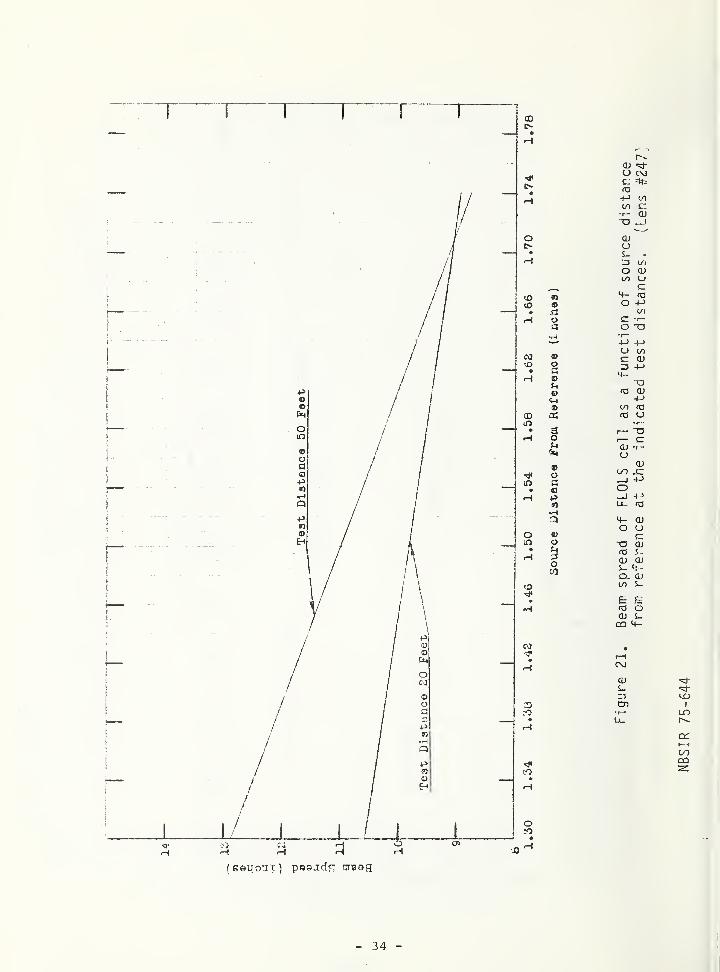
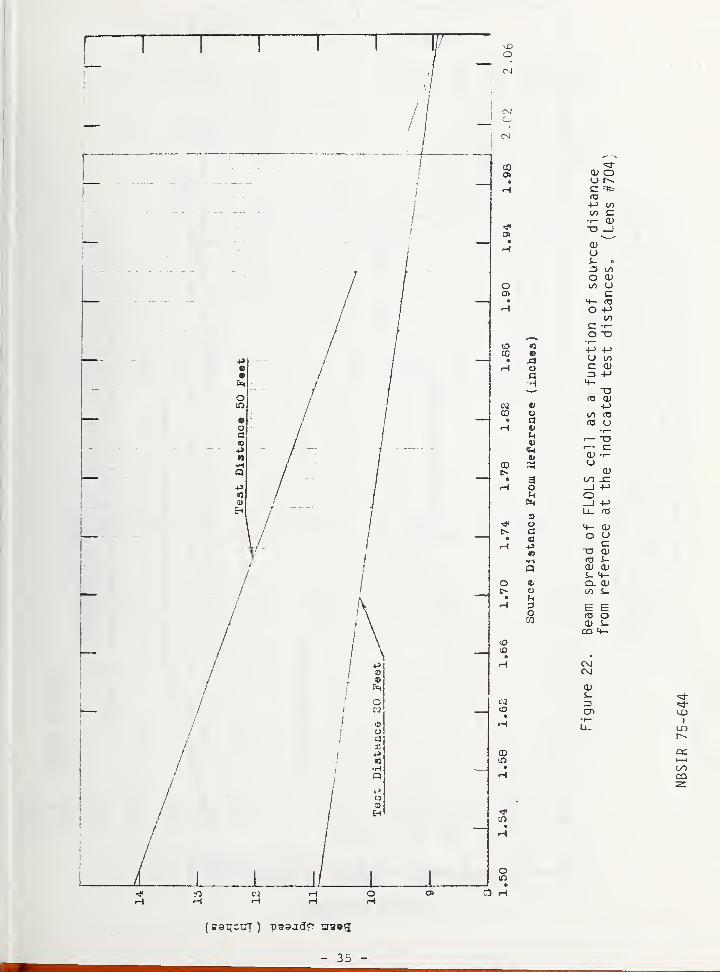
The results of the focusing measurements of the five
lenses utilizing the photometric method of measurement aregiven in Figures 19, 20, 21, 22 and 23. These figures givethe beam spread, in inches, as measured at photometric distancesof 20 feet and 50 feet from the cell lens, for a cell equippedin turn with each of the lenses as a function of the sourcedistance from an arbitrarily fixed reference point. All thecurves were made with respect to the same reference. Thesedata for the lenses and the FLOLS cell aperture were used to
compute the virtual image distance in feet and the beam spreadin degrees. Figure 24 shows the relation of source position to
virtual image distance and to the beam spread in degrees. Lenses247 and 331 are sufficiently similar that their curves coincide.
It is apparent from curves of the type shown in Figures19 to 23 that a source setting can be obtained to provide anydesired beam spread and that the accuracy of the setting can bemade to within about two thousandths of an inch. This uncertaintyin source position results in a virtual image distance un-certainty of less than two feet. Only one of the two curvesrelating beam spread to source distance is needed if thecell aperture is utilized in calculating the normal beamspread at a given distance. Both curves are required, how-ever, in cases where the aperture size is unknown, or un-certain.
The differences in focal length of the lenses are alsoapparent from the curves as indicated by the point of inter-section of the two curves in Figures 19, 20, 21, 22 and 23.
When the source is at this intersection point the light beamfrom the cell emerges collimated and a near-zero beam spreadis obtained. Figure 2b shows that if the source is placedexactly at the focal point of a lens, a collimated beam willemerge and the virtual image will be at infinity. Notice thatthe curves for lenses 704 (Figure 22)' and the "Bad Lens"(Figure 23) furnished by NAEC were extended to the point ofintersection.
- 31 -
j—
(
o C\J
cfO
(/)
in
CD-q
J
QJ(jS_ 0
U
1
o CD
14— rt>
o 4_>
o "O
4-> +J(j I/)
c OJn +J4-
"OrO CD
4_>
</> ra
o
co
OJ(y j
1o_J +->
U-
4- OJo o
c:
a OJre i-a> OJS- 4-Q. OJ(/) S-
E Ert3 oa> s~CQ 4-
CD
OJ^3-
Lf)
CKI—
1
u~>CO
- 32 -
nvXI.oar-l
OaouV
«
o
«l
oaa43n
ou
oCO
rHCU COU CO
ra+-> 0000 c:
ai-o 1
a>CJs- •
=5 COO CUCO Oc
if- ra
O -l->
00c; •—o -a
+->
o 00
c <urs +->
4-T3
rO CO4->
00 f0rO U
• r—r— -a1— cCU -r-
oa»
CO sz__l 4->O-_l +->
u. <"0
4- CUo au CUra S-
a; cu5- 4-Cl CU00
E £ra oCU S-CQ 4-
OCM
CU
13L7> I
LOr .
or.
1—
1
CQ
CO H
(ceuionT) peejdc; rrsog
- 33 -
r^-
o C\l
fO+J <n(/I c:•1— CDo i
(L)
Oi- •
13O <u(/) u4- rO
O 4->
CO•1
—
o X3•I—4-> +->
U </l
13 +->
4—X)
fT3 O)+->
1/1 rOfU U
•r-
1— ~o
a<DU
a>oo
14->
o_l 4 J
U- rD
4- CDO U"O CDfO
d) a>s_
D. cus-
£ Erc o<1J
OQ 4-
CU
C75
IT)
ooCO
- 34 -
«d-CU ouc =*t=
(O+-> COCO c
<1)
-o _J
cuus- o
=J CO
o atto oM— fO
o +->
COc •1
—
O XJ
4-> +->
u coc cu
+->
<4-
ara a>
+->
CO rn<T3 o
•I
—
i— -o
<1) -r-
uCD
CO -C_1 +->
o_J 4->
U. fO
4- CUO O"O CU(13 S-CU CUi_ 4-Q_ CUCO S-
n3 OCU s_CQ 4-
CM(XI
CU
cn•i
—
u.
C£>
I
LT)
CO
35 -
toCD £=U CD
C —
I
(O+-> -ato <o•i- DQ-a =
<uas- •
3 too ojto u
c(13
-t->
4-o
o x>
u to
3 +->
4-T3
(O <u4->
to fO(O ui— -5i— ca> •<-
uCD
t/1 -C_l +-> .O_J +-> <_>Lu (C UJ
«=c4- a> ^o o
s= >>a ai J2<a s-a ojxij- s- a>a. a) -cto S- to
EEC<o O S-a» s- 3CO 4- 4-
i-=3
<3-
tDI
in
- 36 -
(S33U93Q) CIV3UdS INV39
o o o o oo o o o o<T> tf> <t ro C\J
LUorLUli-
or
oa:
fO C\J —
CO s-ai CD o<u M-S- ccn toa> S- c: •
-a a> o E•r~ n3 CM
c cu 4J CUi— _Q o
c-a £ fO03 o CL oCD s- ci- 4- o "O C\JQ. <_) CU CMCO O) inO IT3
E c a -O t—
1
ra (/) CMa> -!-> CU-Q to CU #»
•1
—
O-a TO CMc CUTO <L> CD s-
o 4-> 13 CTi— S- +-> t—
1
o s-o 0J 00
1
—
00 ~o CL CD1
—
c A3 S-<+- 'I—
"O O CD•1
—
1
—
sz +-> '(I) Ll_
o o •r- Oto '1
—
3 C-M OJ oO ~o E
cu c CU TOo 3 CL CO 2c M— CL oTO CU+-> rO rs -C 00CO cr+J
V) CU CO
"O (0 QJ-!-> -C
CU •1
—
Ucu CU 2 c
JO u •r-
(/)
•1
—
oo QJ E_i CO
-a o cra QJ -J cu -a
Ll TO-!-> 00 QJS- ro S- S-"I™ *o o CL> 4- "to to
CM
QJS-Z3cn
tOi
LOr--
(1333) 30NV1SIQ 39VIAJI IVniUIA
- 37 -
6. 2 Other Procedures for Focusing
The results of the comparison focusing measurements ofother procedures for focusing the FLOLS System are given in
Tables I, II, and III. Only two of the lenses (No. 2117and the Bad Lens) listed above were used for these measure-ments. Table I gives the individual readings as obtainedfor the various focusing methods on lens No. 2117, whileTables II and III separate the data into the maximum,minimum and average readings, the reading variation, and the
calculated beam spread and image distance represented bythese readings for each lens. Note that one setting is givenin the tables for the photometric methods using a recorder or
a meter readout as these settings were based not on visualjudgements but on readings from spatial distribution graphsfor the lenses. The source was thus set to the known imagedistance (150 feet) , as calculated for the cell without the
egg-crate grille.
7 . Uncertainty
7 . 1 Photometric Procedure Uncertainty
An estimate of the uncertainty in the location of thevirtual image position by means of the photometric method wasobtained for lens 2117 and "Bad" lens. The beam spreads observedat 20 feet and at 50 feet for the condition of the virtual imagecomputed to be at 150 feet from the lens and the beam spreadsobtained for these distances from readings, fitted the curvesshown in Figure 19 for lens 2117 and in Figure 23 for "Bad Lens".
The beam spread , in inches, at 20 feet from the lensand the beam spread X^> in inches, were used to locate thevirtual source position q, in feet, following equation, basedon ratios of corresponding parts of similar triangles shownin Figure 25.
20 + q X1
(5)
50 + q X2
or
50 X - 20 X2
qx - x2 1
- 38 -
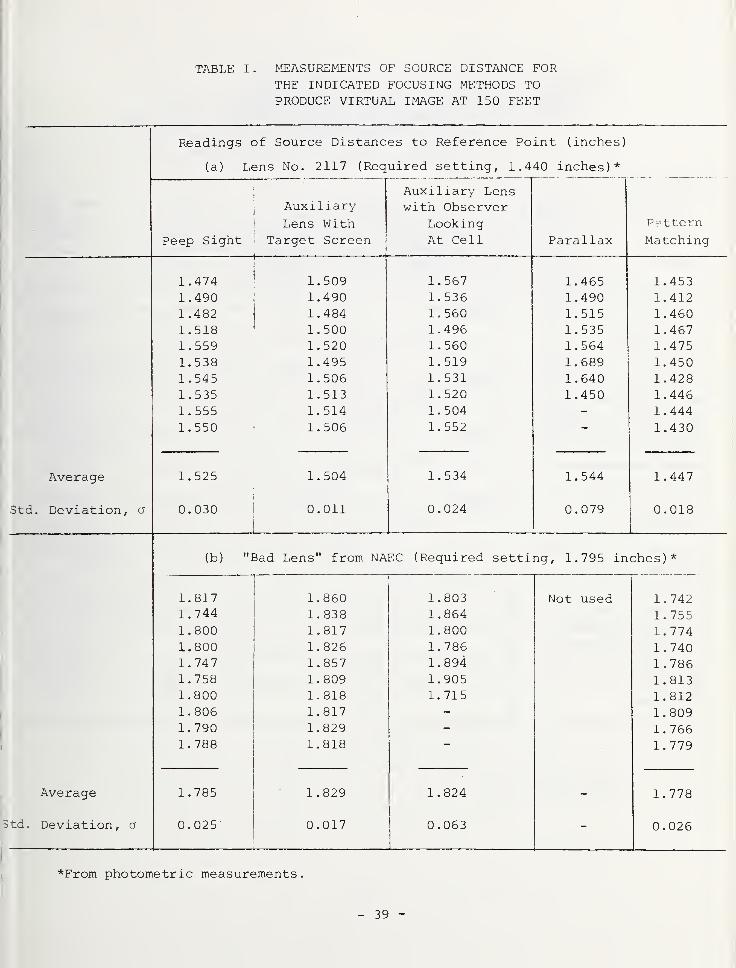
TABLE I. MEASUREMENTS OF SOURCE DISTANCE FORTHE INDICATED FOCUSING METHODS TOPRODUCE VIRTUAL IMAGE AT 150 FEET
Readings of Source Distances to Reference Point (inches)
(a) Lens No. 2117 (Required setting, 1.440 inches)*
huxi lidry Lens[ \ n J—i
—
i i y T.T T 4~ h f*\ V"\ C d V T T {~\ V"wiLii uDbciverLens With Looking P?ttern
Peep Sight Target Screeni
Paral lax Matching
1.474 1. 509 1. 567 1.465 1.4531.490 1.490 1. 536 1.490 1. 412
X . _) J—
J
1.4601. 518 1.500 1.496 1. 535 1 . 467
1. 559 1.520 1. 560 1.564 1.4751.538 1.495 1. 519 1.689 1.4501.545 1. 506 1. 531 1.640 1.4281. 535 1.513 1. 520 1.450 1.4461. 555 1. 514 1. 504 1 . 444
1.550 1. 506 1.552 1.430
Average 1.525 1. 504 1.534 1.544 1.447
Std. Deviation, a 0.030 0.011 0. 024 0.079 0.018
(b) "Bad Lens" from NAEC (Required setting, 1.795 inches)*
1.827 1. 860 1.803 Not used 1.7421.744 1. 838 1.864 1.7551.800 1.817 1.800 1. 7741.800 1.826 1.786 1.7401.747 1.857 1.894 1.7861.758 1. 809 1.905 1.8131.800 1. 818 1.715 1.8121.806 1. 817 1.8091. 790 1.829 1.7661. 788 1.818 1.779
Average 1.785 1.829 1.824 1. 778
td. Deviation, a 0.025 0.017 0.063
I
0.026
*From photometric measurements.
- 39 -
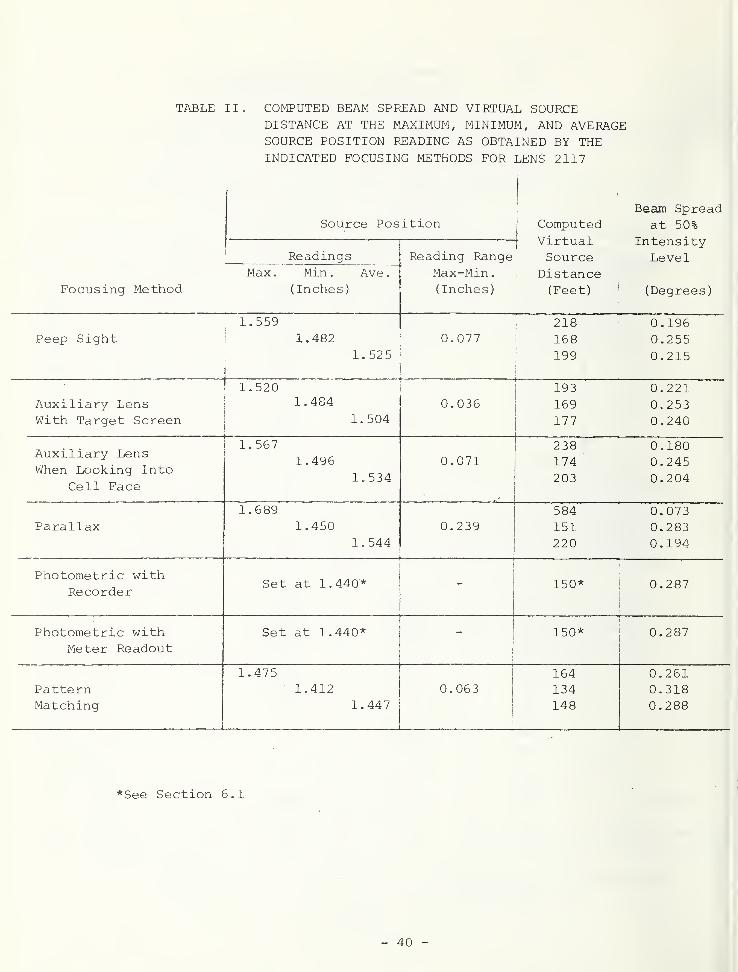
TABLE II. COMPUTED BEAM SPREAD AND VIRTUAL SOURCEDISTANCE AT THE MAXIMUM, MINIMUM, AND AVERAGESOURCE POSITION READING AS OBTAINED BY THEINDICATED FOCUSING METHODS FOR LENS 2117
Focusing Method
Source Position
i
|
Computed) Virtual
Beam Spreadat 50%
IntensityLevel
(Degrees)
ReadingsMax. Min . Ave.
( Inches')
Reading RangeMax-Min.( Inches
)
SourceDistance(Feet) 1
Peep Sight1 . 559
1.482
1. 525
0. 077218 0.196168 0.255199 0.215
Auxiliary LensWith Target Screen
1 1.5201.484
1. 5040.036
193 0.221169 0.253177 0.240
Auxiliary LensWhen Looking Into
Cell Face
1. 567
1.4961. 534
0.071238 0.180174 0.245203 0.204
Parallax1.689
1.4501. 544
.0.239
584 0.073151 0.283220 0.194
Photometric withRecorder
Set at 1.440* 150* 0.287
Photometric withMeter Readout
Set at 1.440*
1
150* 0.287
PatternMatching
1.4751.412
1.4470.063
164
134
148
0.2610.3180.288
*See Section 6.1
- 40 -
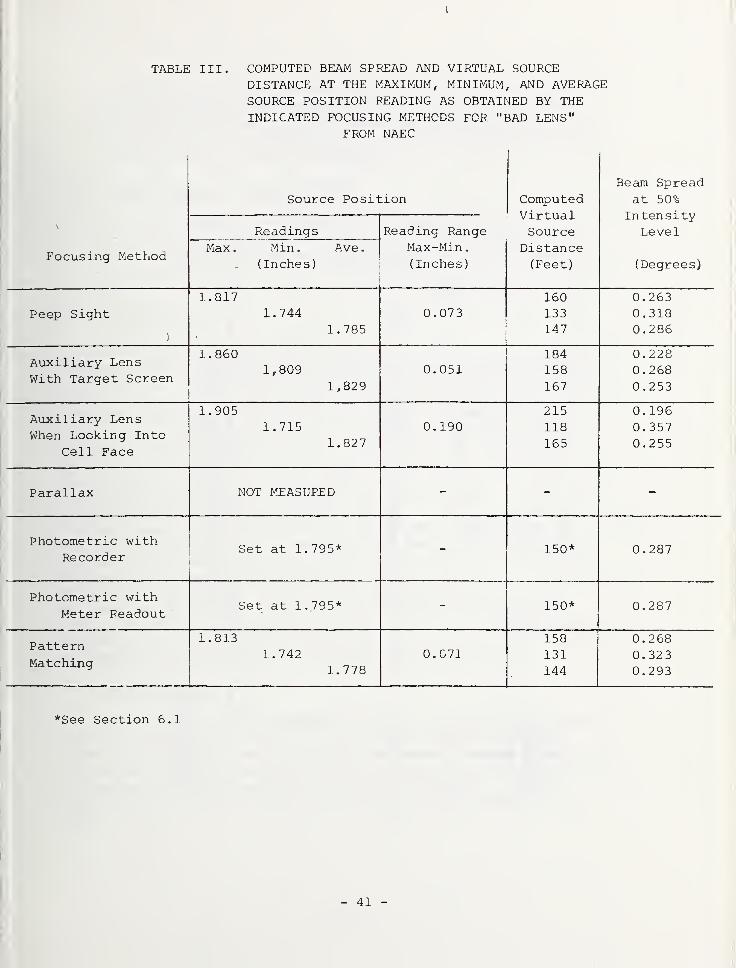
TABLE III. COMPUTED BEAM SPREAD AND VIRTUAL SOURCEDISTANCE AT THE MAXIMUM, MINIMUM, AND AVERAGESOURCE POSITION READING AS OBTAINED BY THE
INDICATED FOCUSING METHODS FOR "BAD LENS"
V
Focusing Method
FROM NAEC
Source Position ComputedVirtualSource
Distance(Feet)
Beam Spreadat 50%IntensityLevel
(Degrees)
ReadingsMax . Min . Ave
.
(Inches)
Reading RangeMax-Min
.
( Inches
)
Peep Sight1.817
1.744
1.785
0.073
-
160
133
147
0.2630.3180.286
Auxiliary LensWith Target Screen
1. 8601,809
1,829
0. 051184
158
167
0.2280.2680.253
Auxiliary LensWhen Looking Into
PpI 1 Fa rp
1.9051.715
1.827
0. 190215
118
165
0.1960. 357
0.255
Parallax NOT MEASURED
Photometric withRecorder
Set at 1.795* 150* 0.287
Photometric withMeter Readout
Set at 1.795* 150* 0.287
Pattern
Matching
1.8131.742
1.7780.C71
158
131
144
0.2680. 323
0.293
*See Section 6.1
- 41 -
-t-J
(T3
<DS-
Q(/I
E'O<D-O
Eos-M— CM
XO"
t\
O) -Mo O)S- CDzs M—o1/1 O
LT>
03 4->
3 fO+Js_ "D
c:> fC
r-l
o X
o -»->
•r- CU-M <U
(_>
o o—1 CM
inCM
CDs-
r- <X>U- I
LT)
r*-»
oil—
4
CQ
Differences in virtual source position obtained from beamspreads by direct observation and by the fitted curves areconsidered to be an estimate of the range of measurementsby the photometric methods. These ranges are located in TableIV for lens 2117 and the "Bad Lens".
7 . 2 Uncertainty in Other Procedures
The maximum and minimum virtual source positions obtainedby means of the other procedures are listed in Tables II and
III and give the range for those procedures. These rangesare also listed in Table IV for comparison with the photometricmethod
.
)
8 . Discussion
Generally, results obtained with all focusing methods where visualjudgements were required differed greatly from the results obtainedphotometrically. Large variations in individual readings were obtainedalso; although some readings within a group were close, they tended to
give much longer image distances than the specified 150 feet. Forexample, for Fresnel lens No. 2117, the peep sight method gave imagedistances from 168 feet to 218 feet. Similarly, the two proceduresthat use an auxiliary lens gave virtual image distances much too longfor this Fresnel lens. The only visual method that gave reasonableresults for this lens was the pattern matching method. Here again, how-ever, the spread between individual readings is considered too great.
The same trend is seen for the measurements of the "Bad Lens", except that
the set of measurements with the peep sight method gave much closertolerances. An image distance spread from 133 feet to 160 feet wasobtained during the ten individual readings. This again, is consideredgreater than desired but does show what results this method mightachieve from lens to lens. Again, the other methods (except thepattern matching method) gave results that tend to place the image attoo great a distance. The pattern matching variation was the same orderof magnitude for this lens as for the previous lens.
9. Recommendation
In conclusion it is recommended that the precision of a focusingmethod be sufficient to determine the virtual image distance to
5 feet, consistently. To achieve this precision the source needs tobe positioned within 0.010 inch. Of the focusing methods tested onlythe photometric method appears to meet this criterion. It is
recommended also that no method that requires visual judgements beused.
- 43 -
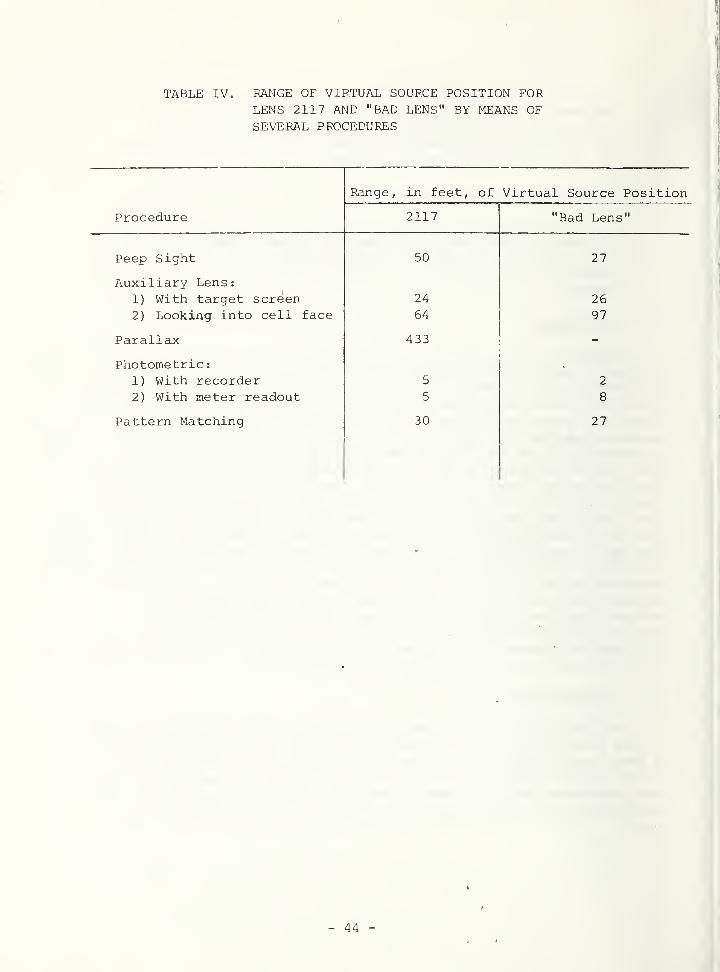
TABLE IV. RANGE OF VIRTUAL SOURCE POSITION FORLENS 2117 AND "BAD LENS" BY MEANS OFSEVERAL PROCEDURES
Procedure
Range, in feet, of Virtual Source Position
2117 "Bad Lens"
Peep Sight
Auxiliary Lens:
1) With target screen
2) Looking into cell face
Parallax
Photometric
:
1) With recorder2) With meter readout
Pattern Matching
50
24
64
433
5
5
30
27
26
97
27
Of the two photometric methods, the procedure that uses a
meter readout would appear to lend itself better to field use. It is
simple, precise and will give fairly rapid results. Further, thismethod would require only a short period of training in its use.
- 45 -
APPENDIX
A-l OTHER FACTORS AFFECTING CELL PERFORMANCE
In conducting the focusing investigations, certain otherfactors were observed relative to the FLOLS system that areof interest. These include:
1) Effect of the lenticular lens on beam spread.
2) Effect of lens temperature on beam spread.
3) Effect of slit-width on beam spread.
4) Effect of slit alignment on beam distribution.
5) Effect of lamp dimming and source color on beamspread and image distance.
In addition, certain operational and mechanical designfeatures of the FLOLS cell were noted where improvements areconsidered desirable. The first section below treats theoperational features while the second section treats thedesign features.
A-2 OPERATIONAL FEATURES
A-2.1 Effect of the Lenticular Lens on Beam Spread.
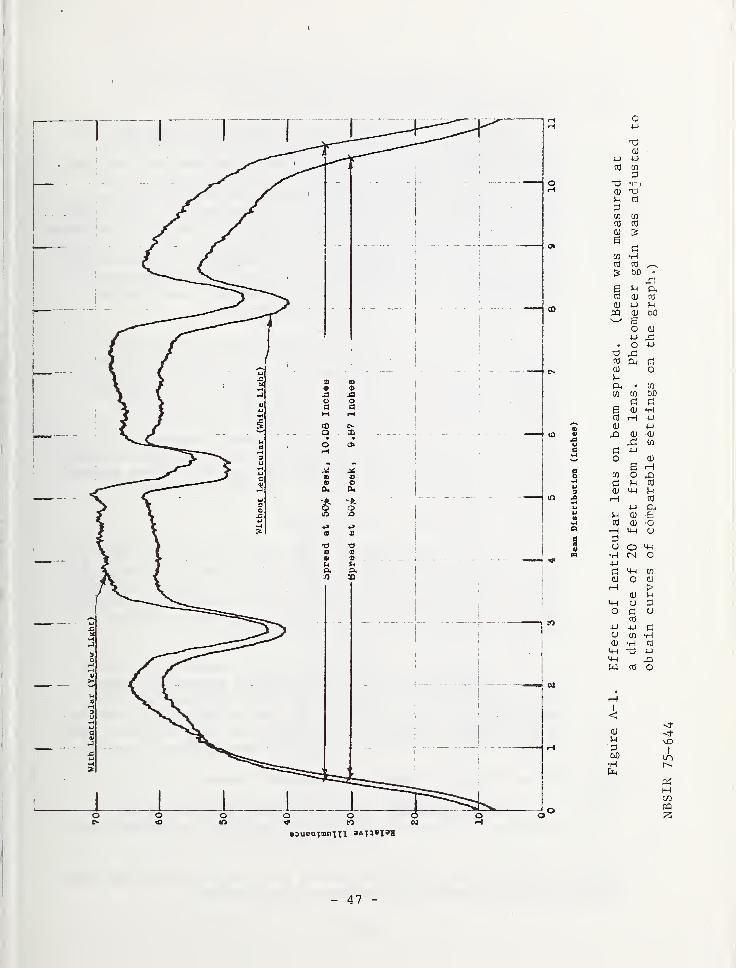
Beam spread measurements were made of a cell with andwithout the lenticular lens installed. The measurements weremade with a 1980 Pritchard recording photometer by scanning thelight beam pattern as projected from the cell onto a diffusingplastic plate at a test distance of 20 feet. The temperatureof the cell was allowed-to stabilize at approximately 35°C priorto the measurements. The results of the measurements are givenin Figure A-l. As will be noted, the lenticular lens increasesthe beam spread of the cell by about 0.21 inch at this distance.The increase amounts to approximately 0.06 degree or 3.6minutes of arc in the vertical plane. Instead of beingneutral, the lenticular lens exhibits some "lens effect" in
the vertical plane as well as its intended function ofspreading the beam in the horizontal plane.
- 46 -
o4-1
T301
4-1 4-J
CO CO
T3 -i-
)
0)>-< CO
CO CO
cO cd
0) S6
dCO >Hcfl cd
^ bO.d
cu nj4-1 MCU bO6O CU
4J 43
CJ
4-)
d ^cu o
CU
M-l O
cd4-J 4-1
U CO
CU -H
W CO
4CU
bO
O
CO Cm pi
cu oi-i
Cu • CO
co co bO
rtc c
g CU «Hti h 4J
CU 4-1
XI CU 0)
d 4JCO
CU
e HO ,0co
d mCU M-l
H4-1
i-t CU
CO 0)i—I M-i CJ
oCN
CO
CU
>uo
d•MCO
4-1
o
Im
piHCOPQ3
- 47 -
A-2. 2 Effect of Lens Temperature on Beam Spread.
A series of measurements were made of the beam spread atlens temperatures of 22°C and 35°C as a function of sourcedistance from a fixed reference point. The cell was equippedin its usual configuration with a lenticular lens and egg-crate grille. The measurements were made photometrically in a
manner similar to that described in paragraph 5.1, except thatfor these measurements the heater circuit of the cell was turnedoff during the first set of measurements and turned on duringthe second set of measurements. Air temperature inside of the
unit adjacent to the lens was monitored with a thermocouplearrangement. The temperature was allowed to stabilize forabout 30 minutes prior to the measurements.
Results of the two sets of measurements are shown in
Figure A-2. The beam spread of the cell increases with lenstemperature. The increase has the effect of decreasing thedistance to the virtual source. Conversely, if the heatersbecome disabled during operation and the lens cools, thedistance to the virtual source increases. For example, at a
given point near proper lens setting (source setting 1.71 inch)
the distance to the virtual source changes approximately 12.8feet for a temperature change from 35°C to 22 °C. This amountsto an approximate change of 1 foot per degree Celsius.
A-2. 3 Effect of Slit-Width on Beam Spread.
Beam spread measurements were made of a cell equipped in
turn with two slit-widths, namely: 0.055 and 0.070 inch. Allother parameters were held constant during these measurements.Again, the beam spread measurements were made photometricallyat a test distance of 20 feet with a recording photometersimilar to the one described in paragraph 5.1.
The results of the measurements are presented in FigureA-3. As indicated, the slit width had no appreciable effecton the beam spread.* Although the wider slit gave a curvewhich appears to be slightly wider, its relative peak intensityis also higher and when the two curves are read at 50% of theirrespective peaks, their beam spreads are essentially the same.
A-2. 4 Effect of Slit Alignment on Beam Distribution.
Beam distribution measurements were made of the cell asa function of the slit alignment relative to the optical axis
*Note the width of the "meat ball" is not directly related to the beamspread, but is increased with increase in slit v/idth.
- 48 -
I
- 50 -
of the lens. For this measurement, only the 0.055 inch slit wasused. For the cell in use, the mounting holes of the slit
plate were oversized so that the slit plate is not pinned in a
fixed position. The extreme movement of the slit plateamounts to approximately 3/32 inch up and down or side-
to-side. Because of the slit dimensions and the effects of
the lenticular lens, the up and down movement is criticaland significant while the horizontal movement is notsignificant. Therefore, measurements were made of the cell
only as the slit movement affects the projected beam distri-bution in the vertical plane. The .first measurements weremade with the slit shifted to the extreme upward positionwhile the second measurements were made with the slitshifted to its extreme bottom position. In positioning theslit, attempts were made to maintain a horizontal positionalthough the slit can be tilted slightly at the two extremes.
The results of the measurements are shown in Figure A-4
.
It is evident that the two distributions differ considerably.The need for pinning the slit in a fixed position once the
cell is properly aligned is evident. The pinning should beaccomplished at the factory during the initial alignmentto prevent any likelihood of slippage or maladjustment ata later time.
A-2.5 Effect of Lamp Dimming and Source Color on Focusing.
Measurements of beam spread as a function of lamp dimmingand of source color were made of a FLOLS cell equipped in turnwith a yellow and a clear lenticular lens. Measurements werealso made of the cell equipped with the clear lenticular lensand sources of several colors. The beam spread measurementswere made photometrically as described under the section 5.1.
During the measurements, the three lamps of the cellwere operated in series and the cell temperature was allowedto stabilize prior to obtaining the successive readings. Forthe dimming measurements, the lamps were operated at 54, 20and 12.5 volts when the cell was equipped with the yellowlenticular lens and operated at 54, 20, 12.5, and 10 voltswhen equipped with the clear lenticular lens. The lattervoltage range corresponds to an intensity range from approxi-mately 100% to 0.3%. The voltage was held constant at 54
volts when making the measurements of the effects of sourcecolor on the beam spread. For the latter measurements, thecolor was changed by inserting colored glass filters in turnbetween the source (lamps) and the frosted glass covering theslit of the cell.
- 51 -
1
- 52 -
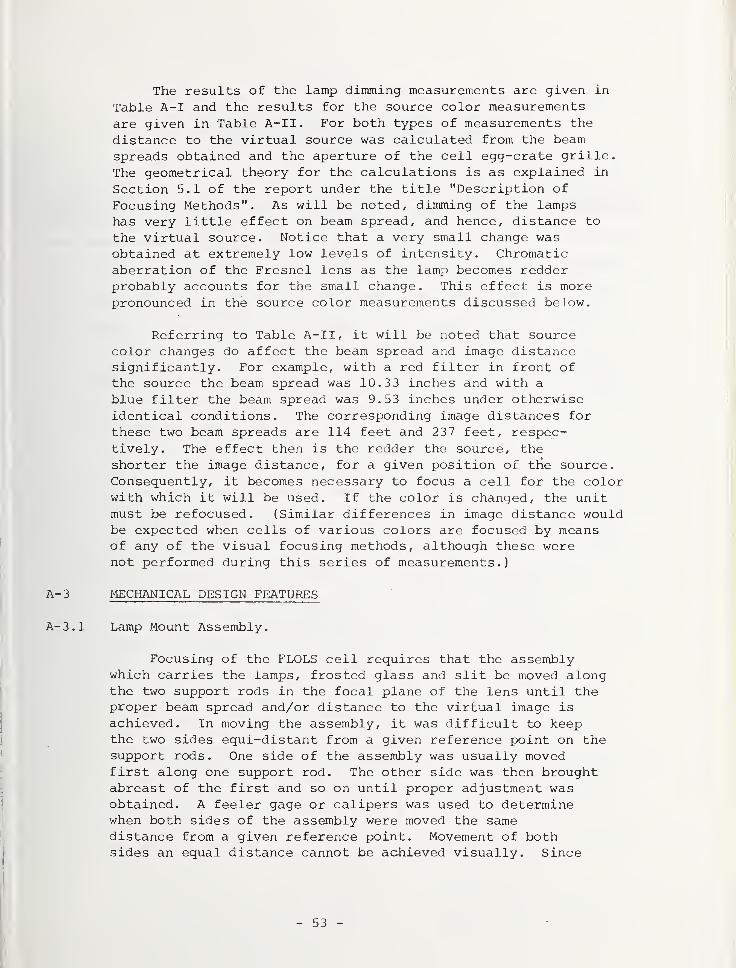
The results of the lamp dimming measurements are given in
Table A-I and the results for the source color measurementsare given in Table A—II. For both types of measurements the
distance to the virtual source was calculated from the beamspreads obtained and the aperture of the cell egg-crate grille.
The geometrical theory for the calculations is as explained in
Section 5.1 of the report under the title "Description of
Focusing Methods". As will be noted, dimming of the lampshas very little effect on beam spread, and hence, distance to
the virtual source. Notice that a very small change wasobtained at extremely low levels of intensity. Chromaticaberration of the Fresnel lens as the lamp becomes redderprobably accounts for the small change. This effect is morepronounced in the source color measurements discussed below.
Referring to Table A-II, it will be noted that sourcecolor changes do affect the beam spread and image distancesignificantly. For example, with a red filter in front ofthe source the beam spread was 10.3 3 inches and with a
blue filter the beam spread was 9.53 inches under otherwiseidentical conditions. The corresponding image distances for
these two beam spreads are 114 feet and 237 feet, respec-tively. The effect then is the redder the source, theshorter the image distance, for a given position of trie source.
Consequently, it becomes necessary to focus a cell for the colorwith which it will be used. If the color is changed, the unitmust be refocused. (Similar differences in image distance wouldbe expected when cells of various colors are focused by meansof any of the visual focusing methods, although these werenot performed during this series of measurements.)
A- 3 MECHANICAL DESIGN FEATURES
A- 3.1 Lamp Mount Assembly.
Focusing of the FLOLS cell requires that the assemblywhich carries the lamps, frosted glass and slit be moved alongthe two support rods in the focal plane of the lens until theproper beam spread and/or distance to the virtual image is
achieved. In moving the assembly, it was difficult to keepthe two sides equi-distant from a given reference point on thesupport rods. One side of the assembly was usually movedfirst along one support rod. The other side was then broughtabreast of the first and so on until proper adjustment wasobtained. A feeler gage or calipers was used to determinewhen both sides of the assembly were moved the samedistance from a given reference point. Movement of bothsides an equal distance cannot be achieved visually. Since
- 53 -
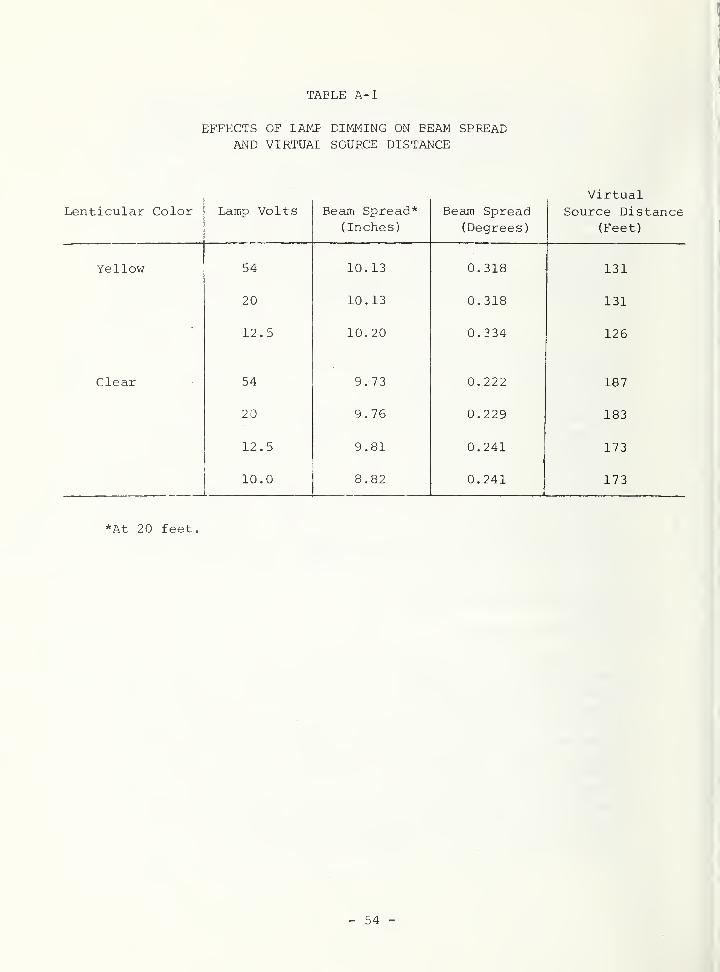
TABLE A-
I
EFFECTS OF LAMP DIMMING ON EEAM SPREADAND VIRTUAI SOURCE DISTANCE
VirtualLenticular Color Lamp Volts Beam Spread*
( Inches
)
Beam Spread(Degrees)
Source Distance(Feet)
Yellow 54 10. 13 0 . 318 131
o nu in l ^ n no 131
12. 5 10.20 0. 334 126
Clear 54 9.73 0.222 187
20 9.76 0.229 183
12.5 9.81 0.241 173
10.0 8.82 0.241 173
*At 20 feet.
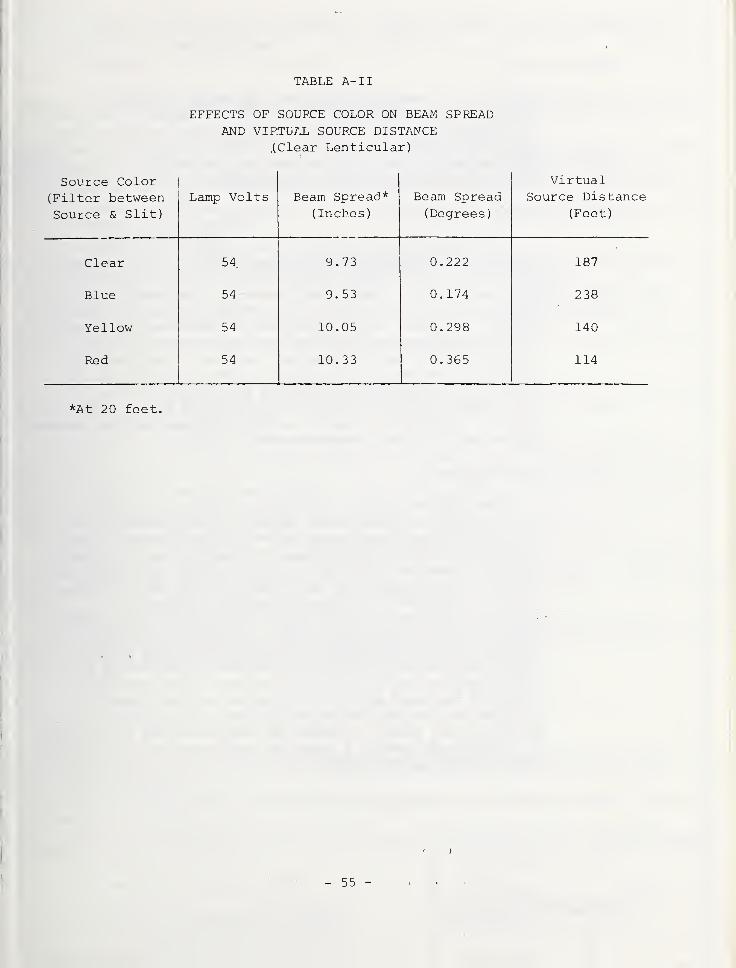
TABLE A- I
I
EFFECTS OF SOURCE COLOR ON BEAM SPREADAND VIRTUAL SOURCE DISTANCE
.(Clear Lenticular)
Source Color(Filter betweenCAlivnp ST. Q "I -j +-
1
Lamp Volts Beam Spread*
( Inches
)
Beam Spread( Degrees
)
VirtualSource Distance
(Feet)
Clear 54 9.73 0.222 187
Blue 54 9.53 0.174 238
Yellow 54 10.05 0.298 140
Red 54 10.33 0.365 114
*At 20 feet.
- 55 -

satisfactory results were obtained by using the methoddescribed, accurate calipers should be available at each repairor alignment facility. Further, because this procedure compli-
cates the focusing of a cell, consideration should be given to
redesigning the lamp mount so that the two sides of the assemblycan be moved simultaneously on the mount.
A-3.2 Fresnel Lens Mounting.
The Fresnel lens is held in place against its seatingstuds by four spacer-type 90° angle clamps. The clamps arepadded with a rubberized sponge material on the surface thatbears on the lens. When first installed, the material is
resilient and provides sufficient pressure to hold the lenssecurely in place. After prolonged use, however, the materialbecomes compressed or packed and no longer holds the lens
securely. With the clamp padding compacted, slight movementof the lens can occur. The effect of the lens movement, ofcourse, is to change focus position with respect to the slitand, hence change the location of the virtual source. Conse-quently, consideration should be given to replacing the presentrubber pads by a more stable material.
A-3.3 Lens Temperature.
The temperature of the lens of a FLOLS cell is normallyheld constant to within a few degrees by circulating the internalair over thermostatically-controlled heating elements. Whenthe system is operating normally, temperature control appearsadequate. However, of the four cells on hand, three were foundto have wiring failures at the point where the power terminallugs are connected to the heater element. A form ofcorrosion develops at this location that may cause electricalfailure over a long period of time. It appears advisable,therefore, that a different type of heater be used or atleast a more permanent type of connection to the heater be
substituted for the one currently in use. Cognizant Navyofficials indicated orally that changes to avoid heaterfailures are currently being implemented. The defects arementioned here solely to report the failures noted in the cellsat the National Bureau of Standards and to confirm that similartype failures had been found.
USCOMM NHS -DC - 56 -
NSS-W4A 'Fit..'. 7-73)
U.S. DEPT. OF COMM. I PUBLICATION OK REPORT NO.BIBLIOGRAPHIC DATA NBSIR 75-644
SHEET
2. Gov't AccessionNo.
3. Recipient's Accession No.
4. TITLE AND SUBTITLE
Focusing the Fresnel Lens Optical Landing System
5. Publication Date
6. Performing Organization Code
7. AUTHOR(S)W. F. Mullis, I. Nimeroff, and E. L. Walters
8. PerformingOrgan. Report No.NBSIR 75-644
9. PERFORMING ORGANIZATION NAME AND ADDRESS
NATIONAL BUREAU OF STANDARDSDEPARTMENT OF COMMERCEWASHINGTON, D.C. 20234
10. Project/Task/Work Unit No.
11. Contract/Grant No.
12. Sponsoring Organization Name and Complete Address (Streel, City, State, ZIP)
Department of the NavyNaval Air Engineering CenterPhiladelphia, Pa, 19112
13. Type of Report & PeriodCovered
Final, April 1975
14. Sponsoring Agency Code
15. SUPPLEMENTARY NOTES
16. ABSTRACT (A 200-word or less factual summary of most significant information, if document includes ti significant
bibliography or literature survey, mention it here.)
The Naval Air Engineering Center requested the National Bureau of Standards todevelop a method of evaluating the performance of lenses of the Fresnel Lens OpticalLanding System (FLOLS) . In the course of this work, it was found that focusing of thecells of a FLOLS unit varied considerably. This led the NBS to examine the variousfocusing techniques used in the past and to develop a more precise method for focusinga cell. The focusing methods studied include the following: 1. Photometric,2. Peep Sight, 3. Parallax, 4. Auxiliary Image-Forming Lens, 5. Pattern Matching.
In addition, in the study of these focusing methods, several other factors thataffect the light-beam- forming characteristics of a cell were investigated. These includethe effects of, 1. Lenticular Lens, 2. Lens Temperature, 3. Slit Width, 4. SlitAlignment, 5. Lamp Dimming and Source Color.
The results of this study indicate that visual methods of focusing the FLOLS systemhave inherent difficulties that lead to improper focusing. Photometric proceduresdeveloped at NBS, however, can give adequate focusing precision.
17. KEY WORDS (six to twelve entries; alphabetical order; capitalize only the first letter of the first key word unless a proper
name; separated by semicolons
)
Eeam spread; Fresnel lens; focusing methods; photometric focusing; visual landingsystem.
18. AVAILABILITY Unlimited
[x| For Official Distribution. Do Not Release to NTIS
Q^j Order From Sup. of Doc, U.S. Government Printing OfficeWashington, D.C. 20402, SD Cat. No. CM
[7 ] Order From National Technical Information Service (NTIS)Springfield, Virginia 221M
19. SECURITY CLASS(THIS REPORT)
UNCL ASSIFIED
20. SECURITY CLASS(THIS PAGE)
UNCLASSIFIED
21. NO. OF PAGES
63
22. Price
USCOMM-OC 29042-P74


![Fluctuation microscopy: a probe of medium range order › d513 › 51827b5706693442b48636… · with the advent of efficient x-ray focusing systems, such as Fresnel zone plates [1,2,105],](https://img.pdfslide.net/doc/110x75/5f13b20f196bd773c66505d3/fluctuation-microscopy-a-probe-of-medium-range-order-a-d513-a-51827b5706693442b48636.jpg)