Embed Size (px)
Citation preview

Basic Fluorescence Principles III: David Jameson
Förster Resonance Energy Transfer (FRET):In Vitro and In Vivo Fluorescence Probes
Principles of Fluorescence Techniques 2015 Urbana-Champaign, Illinois
April 6-9, 2015
Förster Resonance Energy TransferFRET
Some of these slides were prepared by Pierre Moens
I should note before we start that the Merriam-Webster online dictionary defines “FRET” as:
“to cause to suffer emotional strain”
Milestones in the Theory of Resonance Energy Transfer
1925 J. Perrin proposed the mechanism of resonance energy transfer
1928 H. Kallmann and F. London developed the quantum theory of resonance energy transfer between various atoms in the gas phase. The dipole-dipole interaction and the parameter R0 are used for the first time
1932 F. Perrin published a quantum mechanical theory of energy transfer between molecules of the same specie in solution. Qualitative discussion of the effect of the spectral overlap between the emission spectrum of the donor and the absorption spectrum of the acceptor
1946-1949 T. Förster develop the first complete quantitative theory of molecular resonance energy transfer
1924 E. Gaviola and P. Pringsham observed that an increase in the concentration of fluorescein in viscous solvent was accompanied by a progressive depolarization of the emission.
1922 G. Cario and J. Franck demonstrate that excitation of a mixture of mercury and thallium atomic vapors with 254nm (the mercury resonance line) also displayed thallium (sensitized) emission at 535nm.
This sentence appears in a 2006 book!Let’s correct this mistake!

hhDonor Acceptor
h
FRET
h
What is FRET ?
FRET results in a decrease of the fluorescence intensity andlifetime of the donor probe, It enhance the fluorescence of theacceptor probe when the acceptor is fluorescent.
When the donor molecule absorbs a photon, and there is anacceptor molecule close to the donor molecule, radiationlessenergy transfer can occur from the donor to the acceptor.
PM
FRET
Tuning fork analogy for resonance energy transfer
TV
D
D*A*
A
Coupled transitions
Simplified FRET Energy Diagram Suppose that the energydifference for one of thesepossible deactivation processes inthe donor molecule matches thatfor a possible absorptiontransition in a nearby acceptormolecule. Then, with sufficientenergetic coupling between thesemolecules (overlap of theemission spectrum of the donorand absorption spectrum of theacceptor), both processes mayoccur simultaneously, resulting ina transfer of excitation from thedonor to the acceptor molecule
D* A* The interaction energy is of a dipole-dipole nature and depends on thedistance between the molecules as wellas the relative orientation of the dipoles
PM

Dipole-dipole interaction
D* A*
The rate of transfer (kT) of excitation energy is given by:
6
0 ))(1( rRk dT
Where d is the fluorescence lifetime of the donor in theabsence of acceptor, r the distance between the centersof the donor and acceptor molecules and R0 the Förstercritical distance at which 50% of the excitation energy istransferred to the acceptor and can be approximated fromexperiments independent of energy transfer.
6124
0 )(2108.0 JQnR d Å
Förster critical distance
n is the refractive index of the medium in the wavelength rangewhere spectral overlap is significant (usually between 1.2-1.4 forbiological samples)
Qd is the fluorescence quantum yield of the donor in absence of acceptor (i.e. number of quanta emitted / number of quanta absorbed)
2 (pronounced “kappa squared”) is the orientation factor for the dipole-dipole interaction
J is the normalized spectral overlap integral [() is in M-1 cm-1, is in nm and J units are M-1 cm-1 (nm)4]
0
4)()( dIJ AD
Where is the wavelength of thelight, A() is the molar absorptioncoefficient at that wavelength andID() is the fluorescence spectrum ofthe donor normalized on thewavelength scale:
0
)(
)()(
dF
FI
D
DD
Where FD () is the donor fluorescence per unit wavelength interval
The overlap integral J is defined by:

d
da
F
FE 1
Flu
ores
cenc
e In
tens
itie
s (A
U)
Wavelength (nm)
Fda
Fd
Intensity decrease due to FRET
Steady state method: Decrease in donor fluorescence. thefluorescence intensity of the donor is determined in absence andpresence of the acceptor.
Determination of the efficiency of energy transfer (E)
Determination of the efficiency of energy transfer (E)
Time-resolved method: Decrease in the lifetime of the donor
If the fluorescence decay of the donor is a single exponential then:
0
D
D1E
Where D and D0 are the lifetime of the donor in the
presence and absence of acceptor, respectively
Determination of the efficiency of energy transfer (E)
If the donor fluorescence decay in absence of acceptor is not a single exponential (probably resulting from heterogeneity of the probe’s microenvironment) , then it may be modeled as a sum of exponential and the transfer efficiency can be calculated using the average decay times of the donor in absence and presence of acceptor:
01
D
DE
Where < > is the amplitude-average decay time and is defined as:
ii
iii

0
61
11
RE
r
Where r is the distance separating the donorand acceptor fluorophores, R0 is the Försterdistance.
Many equivalent forms of this equation is found in the literature, such as:
6
0
66
0
6
0 11or )/( r/R/ErRRE
The distance dependence of the energy transfer efficiency (E)
The distance dependence of the energy transfer efficiency (E)
The efficiency of transfer varies withthe inverse sixth power of thedistance.
0
0.25
0.5
0.75
1
0 20 40 60 80 100
Distance in Angstrom
Eff
icie
nc
y o
f tr
an
sfe
r
R0 in this example was set to 40 Å.When the E is 50%, R=R0
Distances can usually be measured between 0.5 R0 and ~1.5R0. Beyondthese limits, we can often only say that the distance is smaller than 0.5R0 or greater than 1.5R0. If accurate distance measurement is requiredthen a probe pair with a different R0 is necessary.
JACS 87:995(1965)
How was FRET theory tested experimentally?
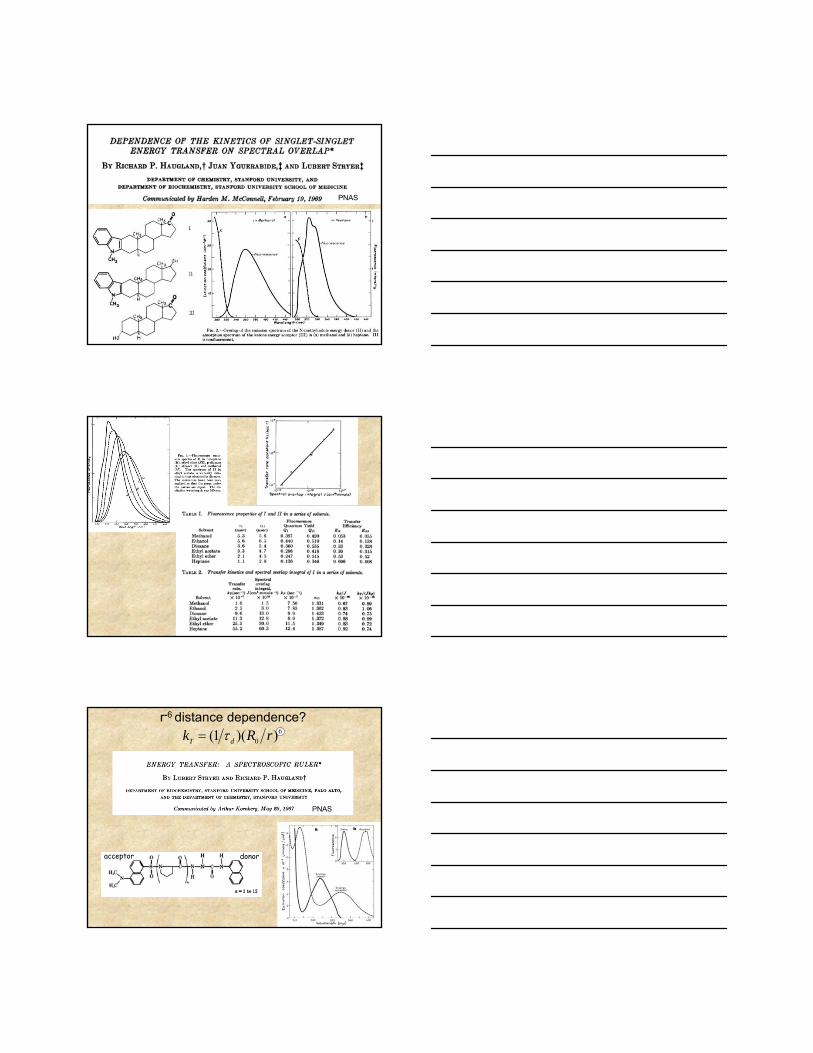
PNAS
r-6 distance dependence?
donoracceptor
6
0 ))(1( rRk dT
PNAS
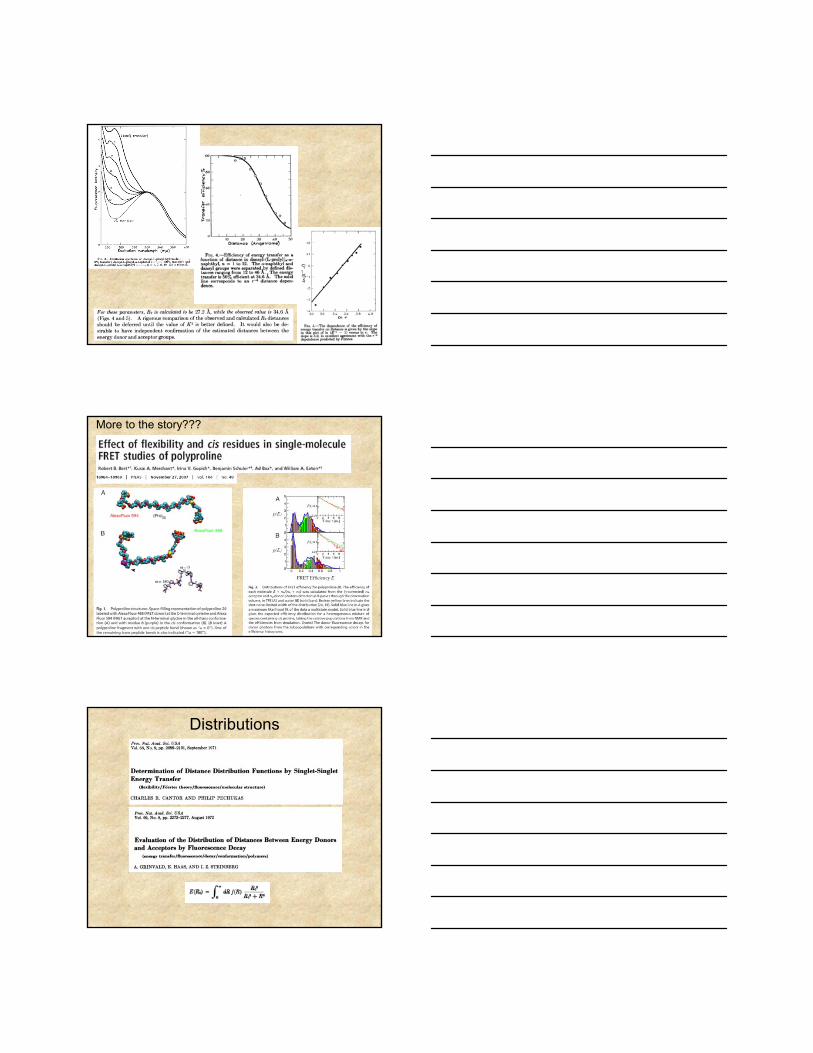
More to the story???
Distributions
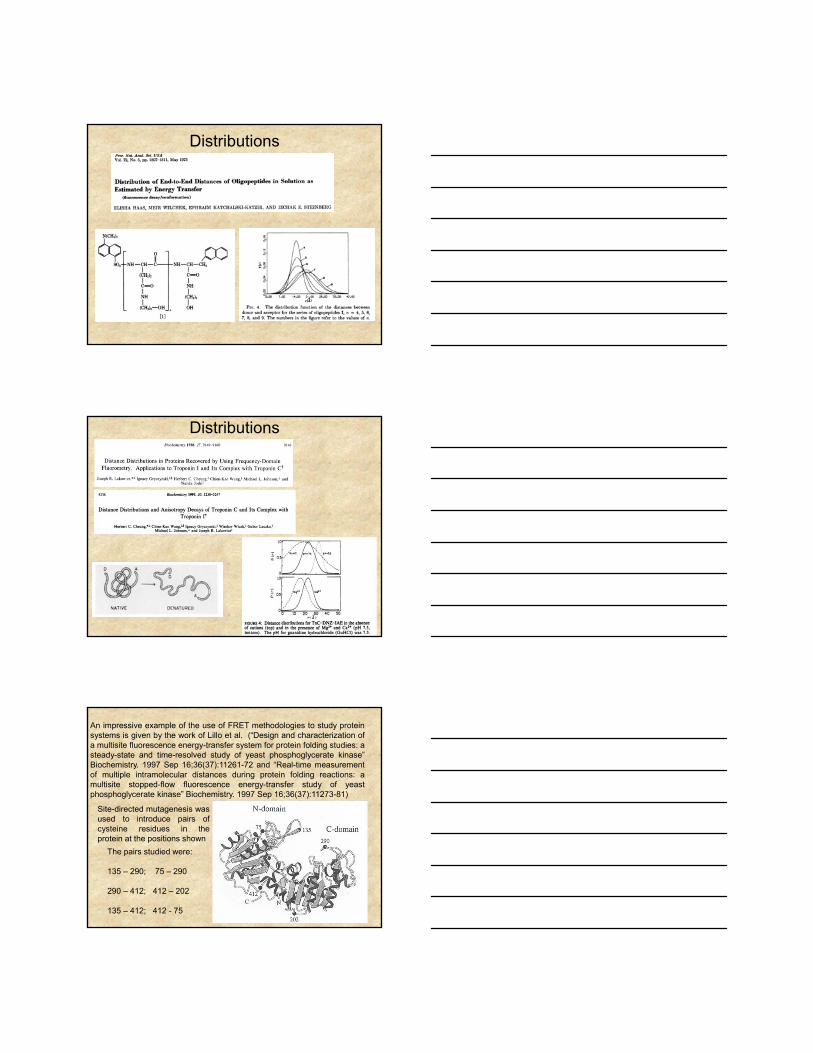
Distributions
Distributions
An impressive example of the use of FRET methodologies to study proteinsystems is given by the work of Lillo et al. (“Design and characterization ofa multisite fluorescence energy-transfer system for protein folding studies: asteady-state and time-resolved study of yeast phosphoglycerate kinase”Biochemistry. 1997 Sep 16;36(37):11261-72 and “Real-time measurementof multiple intramolecular distances during protein folding reactions: amultisite stopped-flow fluorescence energy-transfer study of yeastphosphoglycerate kinase” Biochemistry. 1997 Sep 16;36(37):11273-81)
Site-directed mutagenesis wasused to introduce pairs ofcysteine residues in theprotein at the positions shown
The pairs studied were:
135 – 290; 75 – 290
290 – 412; 412 – 202
135 – 412; 412 - 75
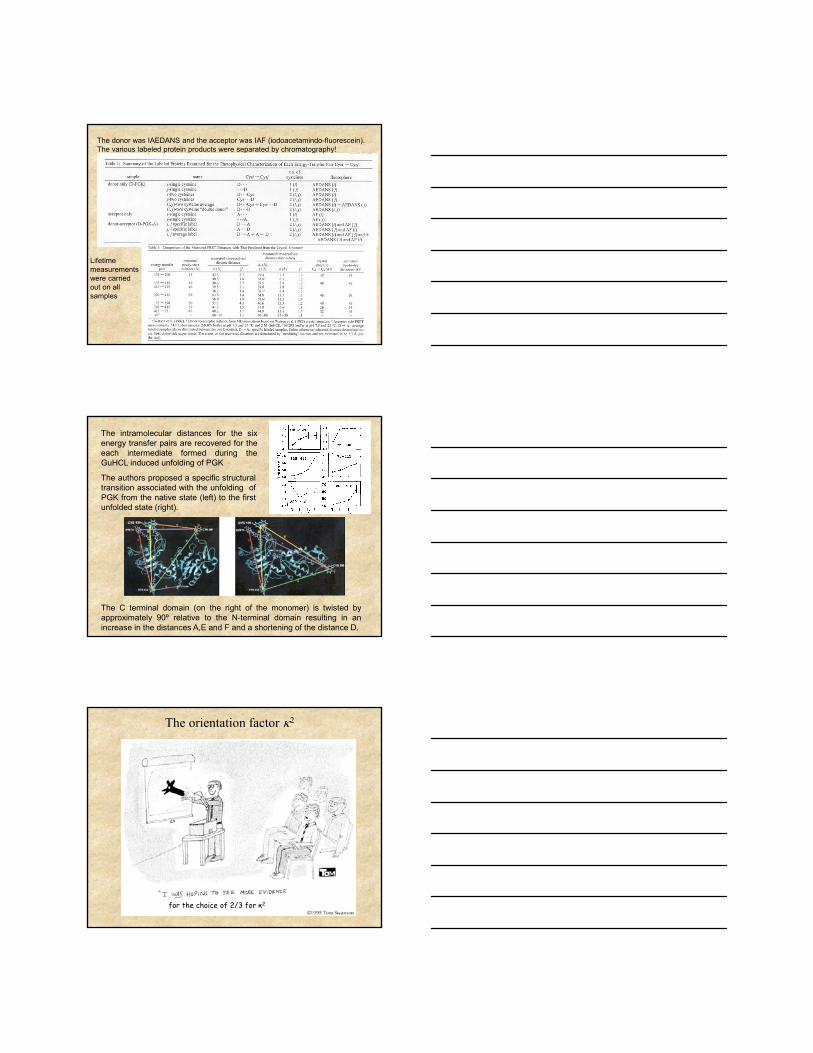
The donor was IAEDANS and the acceptor was IAF (iodoacetamindo-fluorescein). The various labeled protein products were separated by chromatography!
Lifetime measurements were carried out on all samples
The intramolecular distances for the sixenergy transfer pairs are recovered for theeach intermediate formed during theGuHCL induced unfolding of PGK
The authors proposed a specific structuraltransition associated with the unfolding ofPGK from the native state (left) to the firstunfolded state (right).
The C terminal domain (on the right of the monomer) is twisted byapproximately 90º relative to the N-terminal domain resulting in anincrease in the distances A,E and F and a shortening of the distance D.
for the choice of 2/3 for κ2
The orientation factor 2

22 )coscos3(cos ADT
R
D
AD
T
A
Where T is the angle betweenthe D and A moments, given by
ADADT coscoscossinsincos
In which D, A are the angles between the separation vector R,and the D and A moment, respectively, and is the azimuthbetween the planes (D,R) and (A,R)
The orientation factor 2
The orientation factor 2
The limits for 2 are 0 to 4, The value of 4 is only obtained whenboth transitions moments are in line with the vector R. The valueof 0 can be achieved in many different ways.
D
A
A
A
A 2 = 4
2 = 0
2 = 0
2 = 1
If the molecules undergo fast isotropic motions (dynamic averaging) then 2 = 2/3
From Eisinger and Dale in:“Excited States of Biological Molecules” Edited by John Birks (1976)

What if the system is static but randomly oriented?
Then 2 = 0.476
For example for a system in a highly viscous solvent or in general if the fluorescence lifetimes are very short relative to any rotational motion.
But don’t ask me to prove it!
Except in very rare cases, 2 can not beuniquely determined in solution.
We can assume fast isotropic motions of the probes and value of 2 = 2/3, and verify experimentally that it is indeed the case.
So how do we determine 2?
We can calculate the lower and upper limit of 2 using polarization spectroscopy (Dale, Eisinger and Blumberg 1979).
What value of 2 should be used ?
Assuming 2 = 2/3
By swapping probes: The micro-environment of the probeswill be different. Therefore, if the micro-environment affectthe probes mobility and, 2 is not equal to 2/3, onceswapped, the value of 2 will changed and hence thedistance measured by FRET.
We can test this assumption experimentally:
By using different probes: If the distance measuredusing different probe pairs are similar (taking into accountthe size of the probes) then the assumption that 2 isequal to 2/3 is probably valid.

We can calculate the lower and upper limit of 2 usingpolarization (Dale, Eisinger and Blumberg 1979).
Lets consider that eachprobe is rotating within acone of axes D and A forthe donor and acceptor,respectively, then 3depolarization steps occurafter the absorption of theexcitation energy by thedonor: An axialdepolarization of thedonor, a depolarizationdue to transfer and anaxial depolarization of theacceptor
Lower and upper limit of 2
In the Dale-Eisinger-Blumberg approach, one measures the ratio of the observed polarizations of donors and acceptors to their limiting polarizations and then uses the calculated contour plots to put limits on 2
FRET occurs between DAPI and TNP-GTP bound to tubulin – a heterodimer protein
This approach was used in:Arbildua et al., Fluorescence resonance energy transfer and molecular modeling studies on 4',6-diamidino-2-phenylindole (DAPI) complexes with tubulin.Protein Sci. (2006) 15(3):410-9.

But DAPI is bound non-covalently - hence has no local motion so its polarization is high (~0.42)
And, TNP-GTP is also non-covalently bound and has a short lifetime and hence a high polarization (~0.48)
Assuming a 2 value of 2/3, one would calculate the DAPI-TNP-GTP distance to be ~43 Angstoms
These observed polarization values are close to the limiting polarization values for these probes: 93% and 100% respectively, for DAPI and TNP-GTP
Using the Dale-Eisenger-Blumberg plot one can then estimate that 2 can be anywhere between 0.02 and 3.7!
In fact the authors concluded, based on other information, that the distance between DAPI and TNP-GTP bound to tubulin was likely to ~ 30 Angstroms.

~77Å
Quantitative distance determinations using FRET – i.e., as a true “spectroscopic ruler” - remain difficult at best
But FRET can be very powerful when used to detect changes in a system, such as alterations in distance and or orientation between donor and acceptor attached to biomolecules, i.e., due to ligand binding or protein-protein interactions
42Å
24Å
The development of Fluorescent Proteins has led to a significant increase in FRET studies
The GFP is fused to the protein of interest andexpressed in the organism under study.
Fluorescent proteins with the appropriate absorption and emission properties are chosen as donors and acceptors. Such systems can be used in vitro as well as in vivo

« …L’existence de transferts d’activation est expérimentalement prouvée pour de telles molécules par la décroissance de la polarisation de la lumière de fluorescence quand la concentration croit… » (F. Perrin Ann de Phys. 1932)
…The existence of transfer of activation is proven experimentally for such molecules by the decrease in polarization of the fluorescent light when the concentration is increased…
« Il suffit qu’un transfert d’activation puisse se produire entre deux molécules voisines d’orientation différentes, c’est a dire portant des oscillateurs non parallèles, pour qu’il en résulte en moyenne une diminution de l’anisotropie de distribution des oscillateurs excites et par suite de la polarisation de la lumière émise. »
(F. Perrin Ann de Phys. 1929)
It suffices that a transfer of activation can occur between two neighboring molecules with different orientations, that is with non-parallel oscillators, in order to have, on average, a decrease in the anisotropy of the distribution of excited oscillators, and therefore a decrease of the polarization of the emitted light.
So far, we considered the donor and acceptor molecules to bedifferent.However, if the probe excitation spectrum overlaps itsemission spectrum, FRET can occur between identical molecules.
Homo-transfer of electronic excitation energy
Electronic energy transfer between identical fluorophores was originally observed by Gaviola and Pringsheim in 1924.
(note: uranin is the sodium salt of fluorescein)
A. Depolarization resulting from rotational diffusion of the fluorophore. Theexcited fluorophore (F1*) rotates then emits light. B. The excited fluorophore(F1*) transfer energy to another fluorophore F2 which in turn emits light.
“…Excitation transfer between alike molecules can occur in repeatedsteps. So the excitation may migrate from the absorbing molecule overa considerable number of other ones before deactivation occurs byfluorescence or other process. Though this kind of transfer cannot berecognized from fluorescence spectra, it may be observed by thedecrease of fluorescence polarization…” (Förster, 1959)
Homo-transfer of electronic excitation energy

In 1970 Weber andShinitzky published amore detailed examinationof this phenomenon. Theyreported that in the manyaromatic residuesexamined, transfer ismuch decreased orundetectable on excitationat the red edge of theabsorption spectrum .
In 1960 Weber was the first to report that homotransfer among indole molecules disappeared upon excitation at the red-edge of the absorption band - this phenomenon is now known as the “Weber red-edge effect”.
Weber’s Red-Edge Effect
The efficiency of transfer can be calculated from a knowledge of thepolarization in the absence and presence of energy transfer.
The steady state expression for the efficiency of energy transfer (E) asa function of the anisotropy is given by
)/()(2 add rrrrE
Where rd and ra are the anisotropy decay of the donor and acceptoronly, respectively and r is the observed anisotropy in presence ofboth donor and acceptor. If 2 =2/3 then ra = 0 and
dd rrrE /)(2
Distance determination using homotransfer
An example of homo-FRET used to study protein interactions is the work by Hamman et al (Biochemistry 35:16680) on a prokaryotic ribosomal protein

L7/L12 is present as two dimers in the ribosome. An X-ray structure of monomeric C-terminal domains led to the speculation that the C-terminal domains of L7/L12 interacted through hydrophobic surfaces as shown below
To study this protein fluorescence probes were introduced at specific locations along the L7/L12 peptide backbone.
To introduce these probes at specific locations site-directed mutagenesis was used to place cysteine residues in different locations
Sulfhydryl-reactive fluorescence probes were then covalently attached to these cysteine residues
Subunit exchange experiments allowed the preparation of singly labeled dimers
FFF F
C-33-F2wildtype
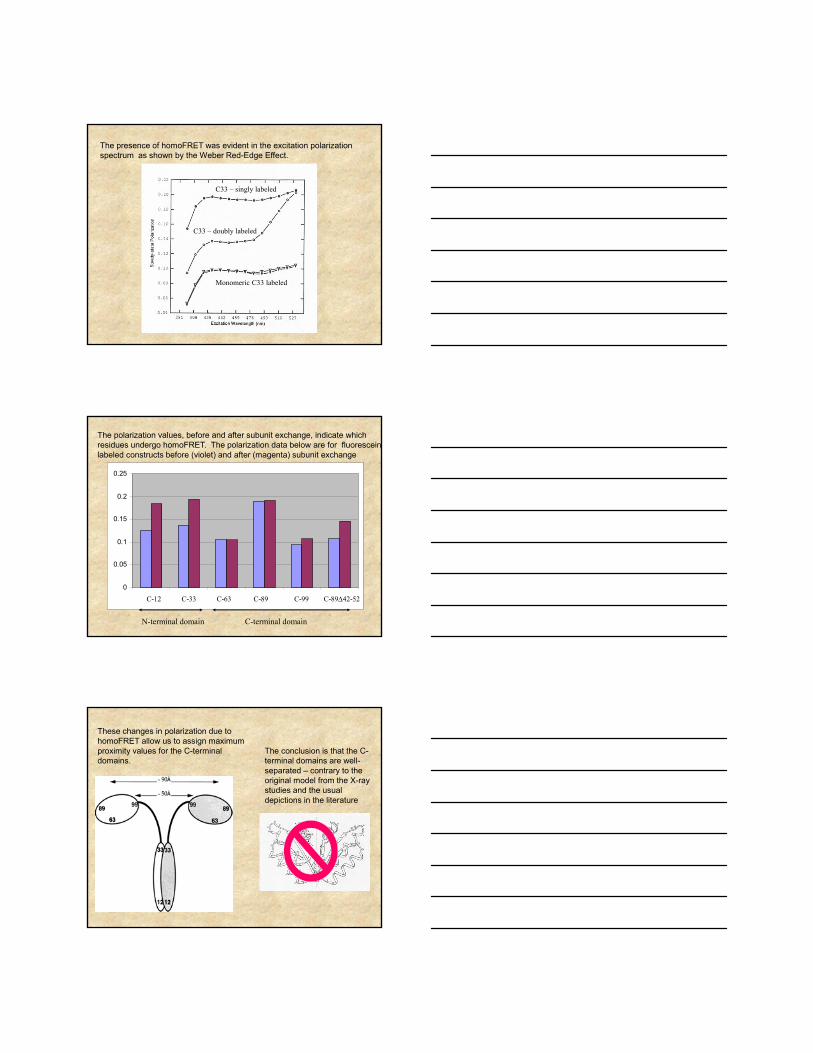
The presence of homoFRET was evident in the excitation polarization spectrum as shown by the Weber Red-Edge Effect.
C33 – singly labeled
C33 – doubly labeled
Monomeric C33 labeled
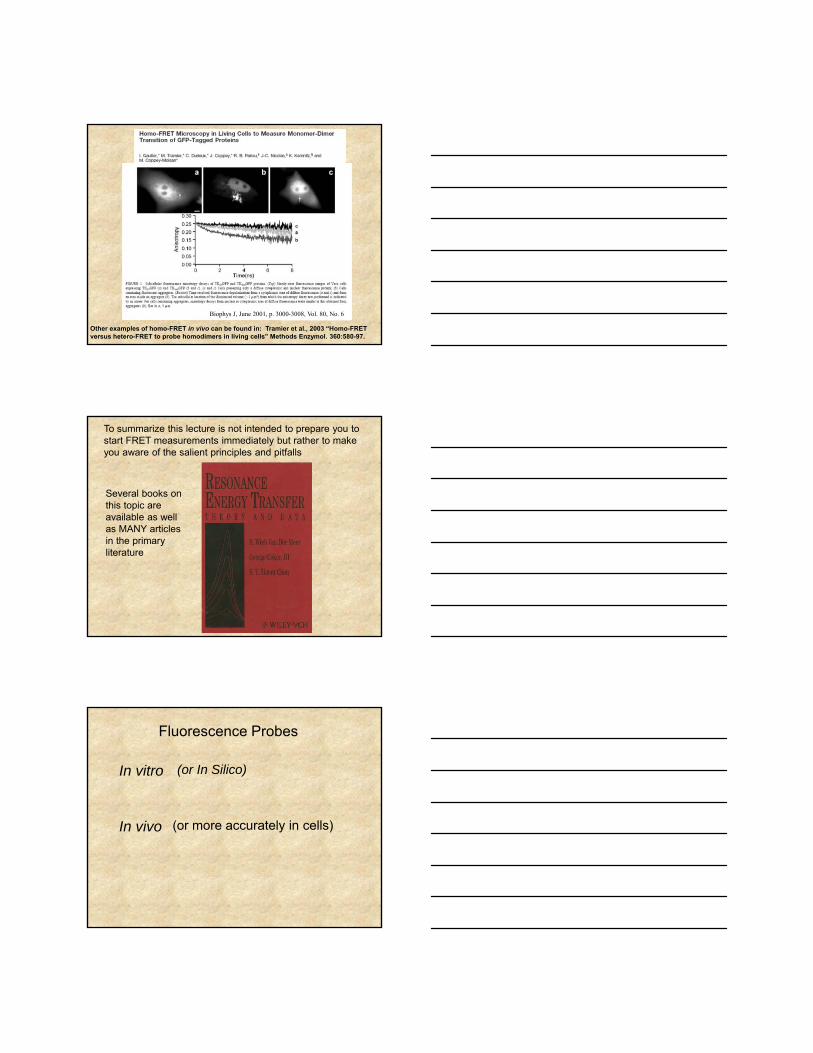
The polarization values, before and after subunit exchange, indicate which residues undergo homoFRET. The polarization data below are for fluorescein labeled constructs before (violet) and after (magenta) subunit exchange
0
0.05
0.1
0.15
0.2
0.25
1 2 3 4 5 6C-12 C-33 C-63 C-89 C-99 C-8942-52
C-terminal domain N-terminal domain
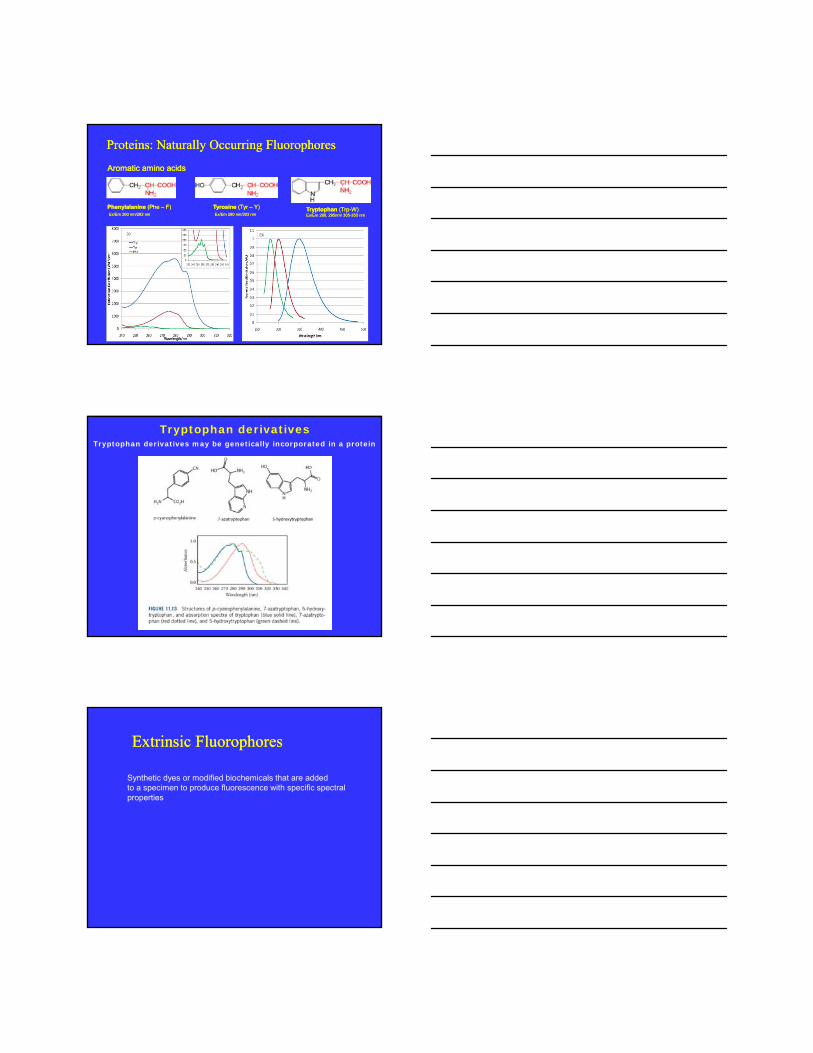
These changes in polarization due to homoFRET allow us to assign maximum proximity values for the C-terminal domains.
The conclusion is that the C-terminal domains are well-separated – contrary to the original model from the X-ray studies and the usual depictions in the literature
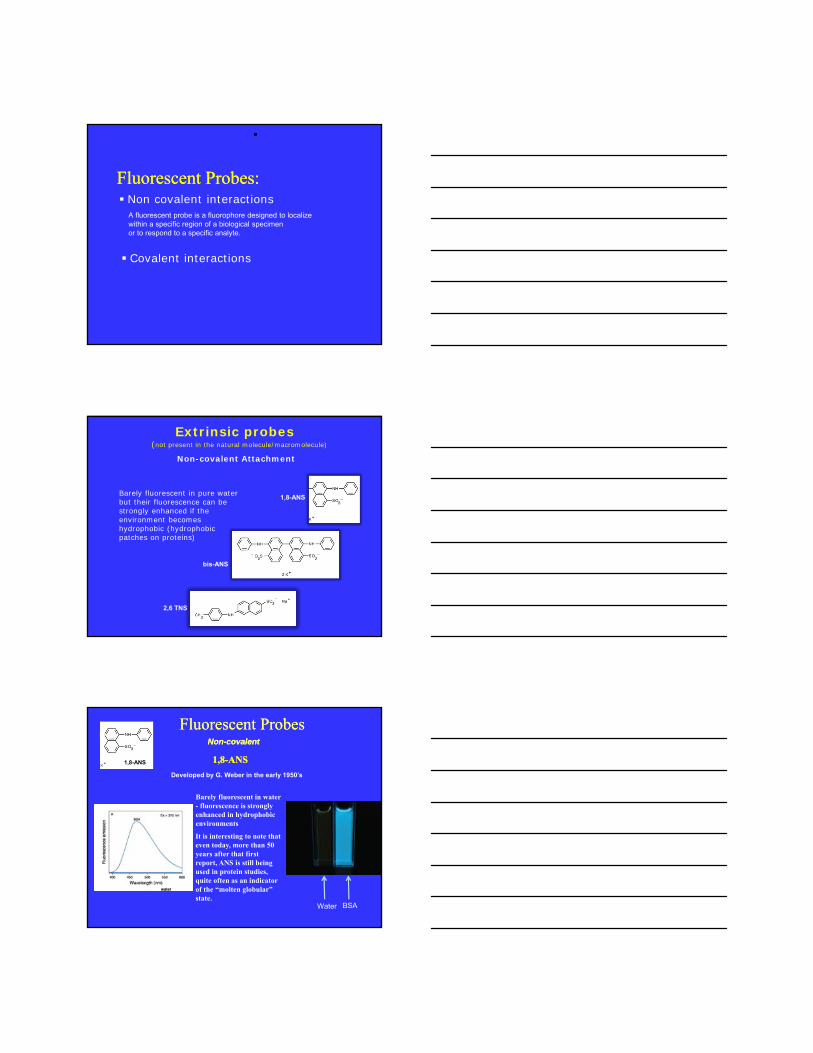
Other examples of homo-FRET in vivo can be found in: Tramier et al., 2003 “Homo-FRET versus hetero-FRET to probe homodimers in living cells” Methods Enzymol. 360:580-97.
Biophys J, June 2001, p. 3000-3008, Vol. 80, No. 6
To summarize this lecture is not intended to prepare you to start FRET measurements immediately but rather to make you aware of the salient principles and pitfalls
Several books on this topic are available as well as MANY articles in the primary literature
Fluorescence Probes
In vitro
In vivo
(or In Silico)
(or more accurately in cells)

Some of these slides were prepared by Susana Sanchez
andEwald Terpetschnig
Extrinsic Fluorophores
Intrinsic Fluorophores
Classification:Classification:
Aromatic amino acidsAromatic amino acids
Phenylalanine (Phe – F)Ex/Em 260 nm/282 nm
Phenylalanine (Phe – F)Ex/Em 260 nm/282 nm
Tyrosine (Tyr – Y)Ex/Em 280 nm/303 nm
Tyrosine (Tyr – Y)Ex/Em 280 nm/303 nm
Tryptophan (Trp-W)Ex/Em 280, 295nm/ 305-350 nmTryptophan (Trp-W)Ex/Em 280, 295nm/ 305-350 nm
Proteins: Naturally Occurring FluorophoresProteins: Naturally Occurring Fluorophores
Tryptophan derivatives may be genetically incorporated in a protein
Tryptophan derivatives
Extrinsic FluorophoresExtrinsic Fluorophores
Synthetic dyes or modified biochemicals that are added to a specimen to produce fluorescence with specific spectral properties.
Covalent interactions
Non covalent interactionsFluorescent Probes:Fluorescent Probes:
A fluorescent probe is a fluorophore designed to localize within a specific region of a biological specimen or to respond to a specific analyte.
Non-covalent Attachment
Extrinsic probes(not present in the natural molecule/macromolecule)
Barely fluorescent in pure water but their fluorescence can be strongly enhanced if the environment becomes hydrophobic (hydrophobic patches on proteins)
bis-ANS
1,8-ANS
2,6 TNS
Non-covalentNon-covalent
Fluorescent ProbesFluorescent Probes
Developed by G. Weber in the early 1950’s
1,8-ANS
Barely fluorescent in water - fluorescence is strongly enhanced in hydrophobic environments
It is interesting to note that even today, more than 50 years after that first report, ANS is still being used in protein studies, quite often as an indicator of the “molten globular” state.
water
1,8-ANS1,8-ANS
Water BSA
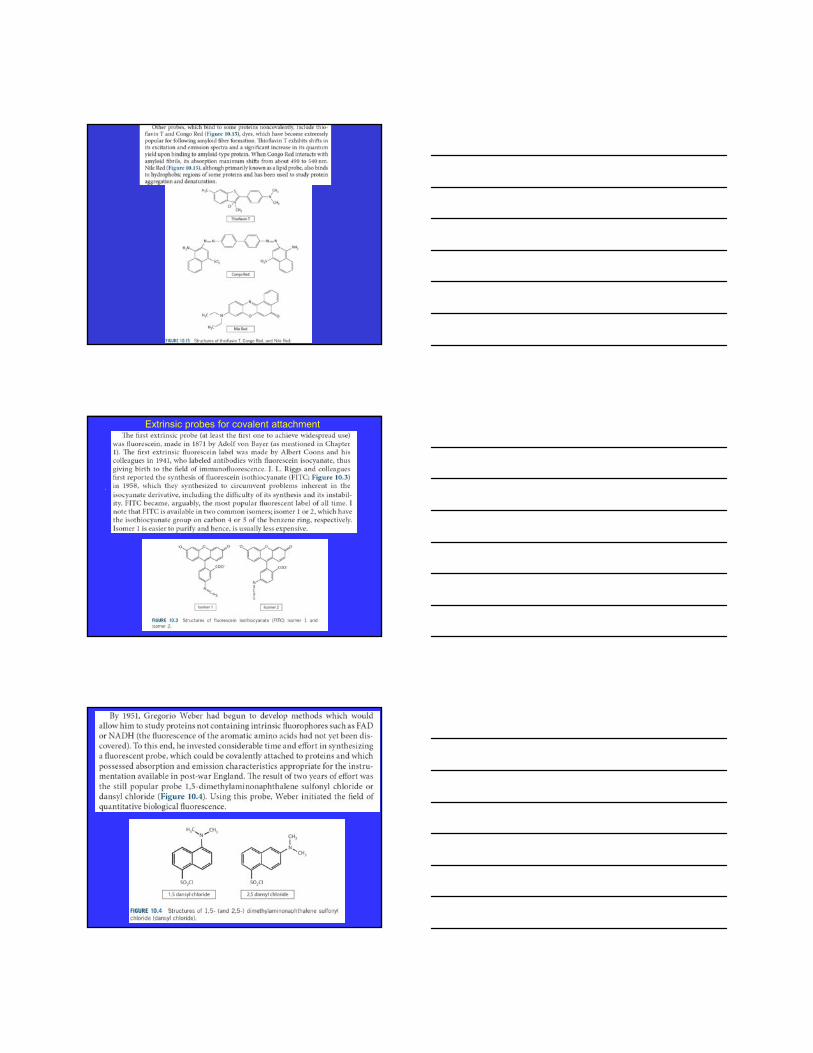
Extrinsic probes for covalent attachment
1999“there is a needfor probes with high fluorescence quantum yield and high photostability to allow detection of low-abundance biologicalstructures with great sensitivity and selectivity”
The Alexa-Fluor series
The Journal of Histochemistry & CytochemistryVolume 47(9): 1179–1188, 1999.Molecular Probes, Inc., Eugene, Oregon
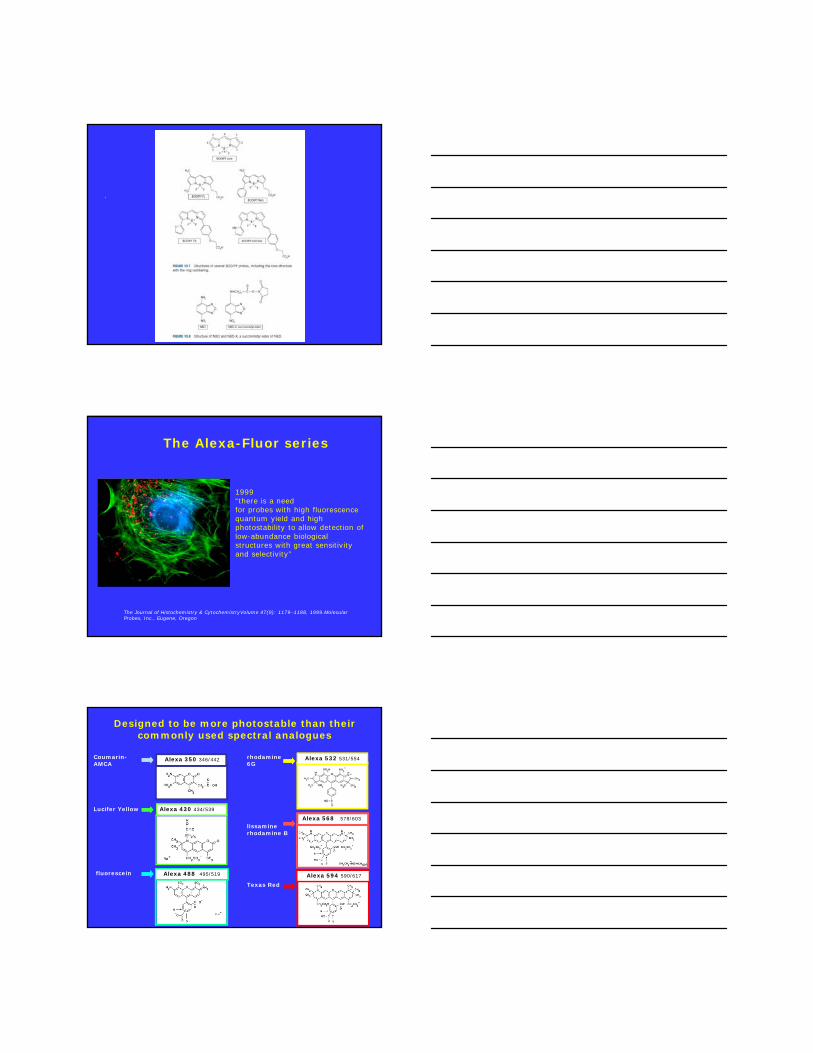
Lucifer Yellow
fluorescein
Alexa 350 346/442
Alexa 430 434/539
Alexa 488 495/519
Coumarin-AMCA
rhodamine 6G
Alexa 532 531/554
lissamine rhodamine B
Alexa 568 578/603
Texas RedAlexa 594 590/617
Designed to be more photostable than their commonly used spectral analogues
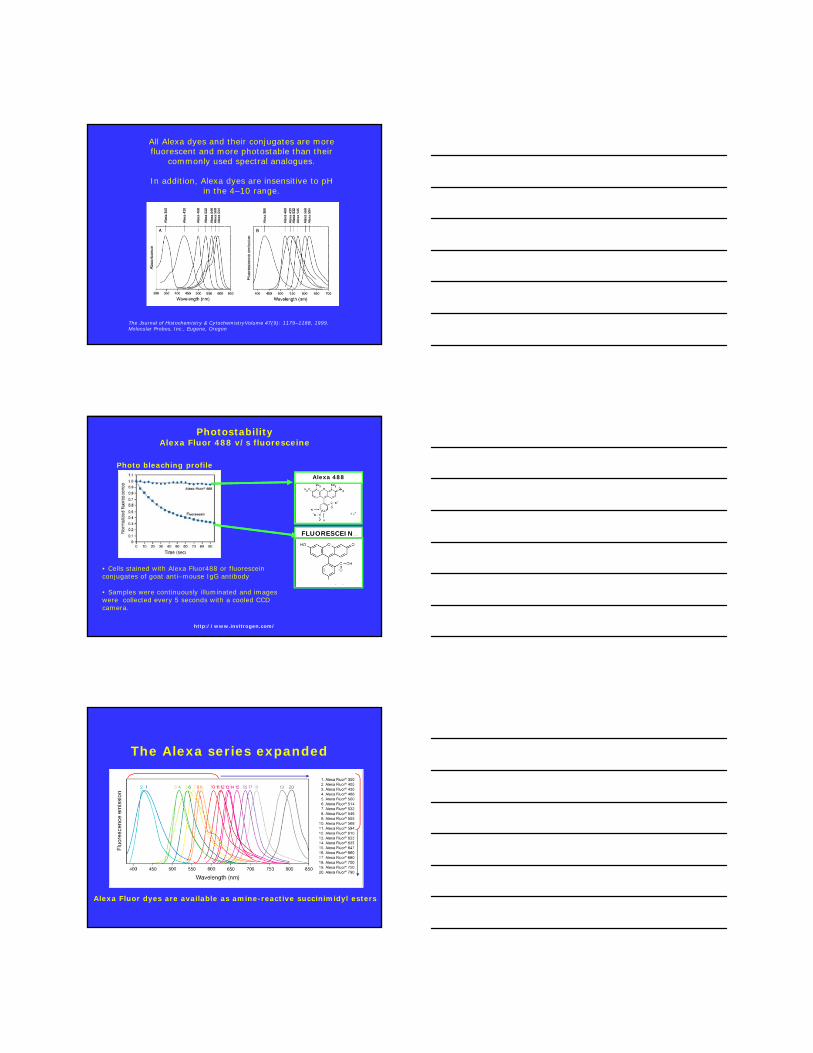
All Alexa dyes and their conjugates are more fluorescent and more photostable than their
commonly used spectral analogues.
In addition, Alexa dyes are insensitive to pH in the 4–10 range.
The Journal of Histochemistry & CytochemistryVolume 47(9): 1179–1188, 1999. Molecular Probes, Inc., Eugene, Oregon
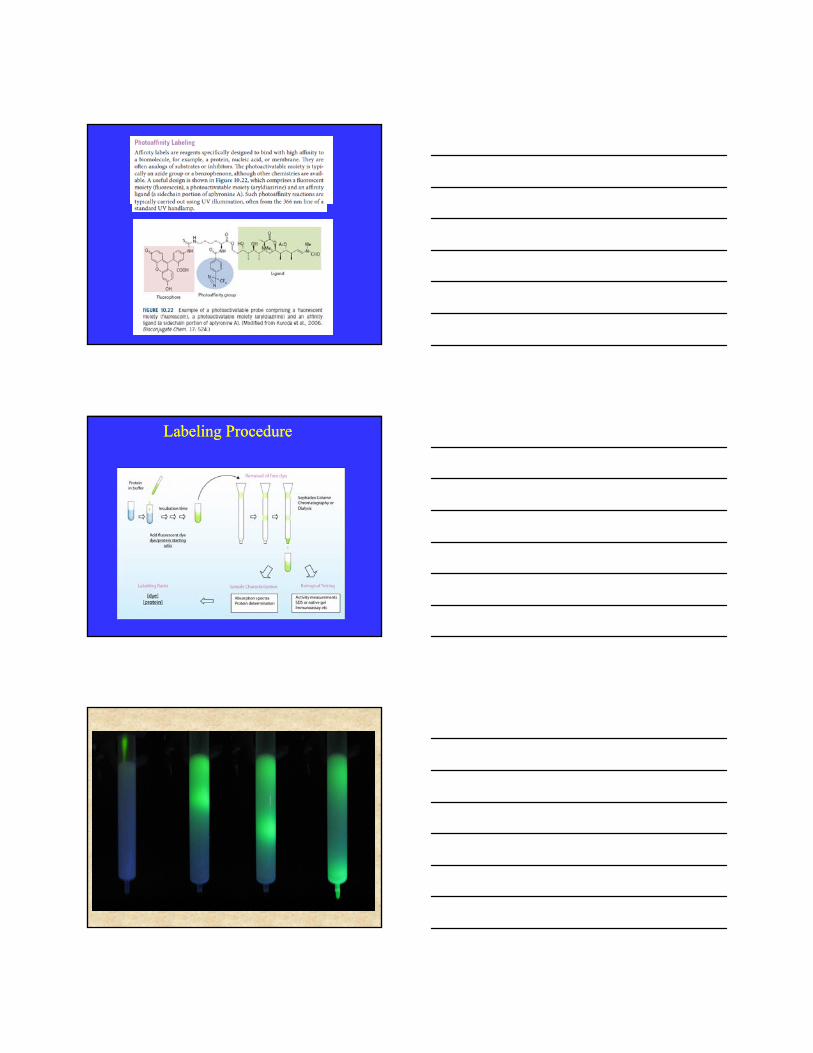
Alexa 488
• Cells stained with Alexa Fluor488 or fluorescein conjugates of goat anti–mouse IgG antibody
• Samples were continuously illuminated and images were collected every 5 seconds with a cooled CCD camera.
PhotostabilityAlexa Fluor 488 v/s fluoresceine
http://www.invitrogen.com/
Photo bleaching profile
FLUORESCEINE
Alexa Fluor dyes are available as amine-reactive succinimidyl esters
The Alexa series expanded

http://www.invitrogen.com
Labeling should not alter the biological activity of biomoleculesLabeling should not alter the biological activity of biomolecules
Light source
NH2
SH
Reactive groups on proteins
Reactive groups on proteins
LysineN-terminusCysteine
Depends on the reactive group on
the protein
Spectral propertiesAutofluorescencePhotostability
Protein LabelingProtein Labeling

LysineN-terminusLysineN-terminus
NH2
+
Amino-Modification:Amino-Modification:
Protein-NH2Protein-NH2
Protein LabelingProtein Labeling
SH
CysteineCysteine
+
Thiol-Modification:Thiol-Modification:
Protein-SHProtein-SH
Protein LabelingProtein Labeling
Labeling ProcedureLabeling Procedure
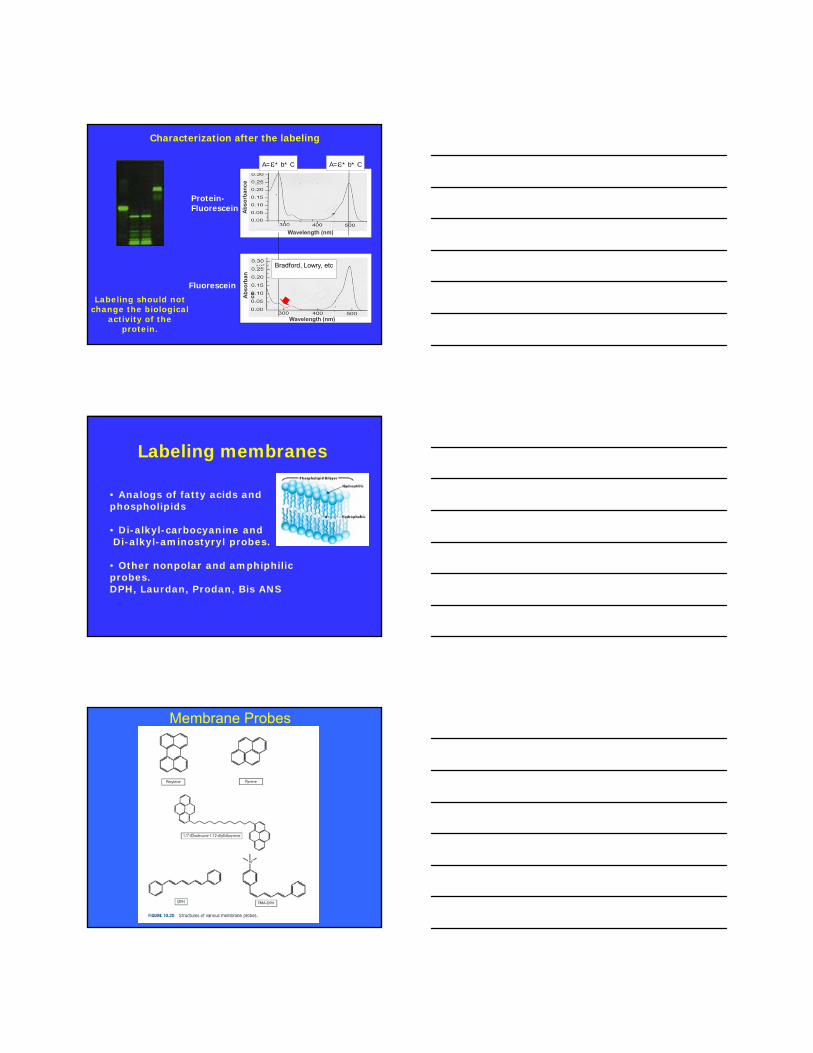
Characterization after the labeling
Protein-Fluorescein A
bso
rban
ce
A=* b* C A=* b* C
Wavelength (nm)
Fluorescein
Ab
sorb
ance
Bradford, Lowry, etc
Wavelength (nm)
Labeling should not change the biological
activity of the protein.
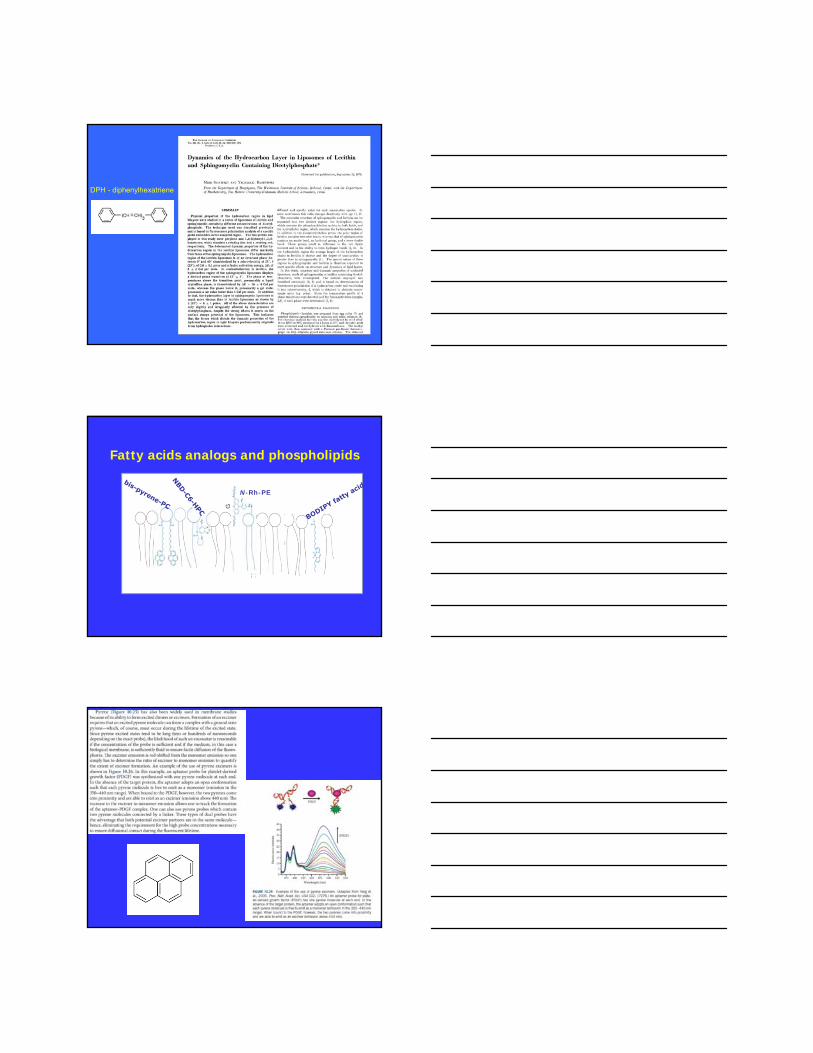
Labeling membranes
• Analogs of fatty acids and phospholipids
• Di-alkyl-carbocyanine and Di-alkyl-aminostyryl probes.
• Other nonpolar and amphiphilic probes.DPH, Laurdan, Prodan, Bis ANS
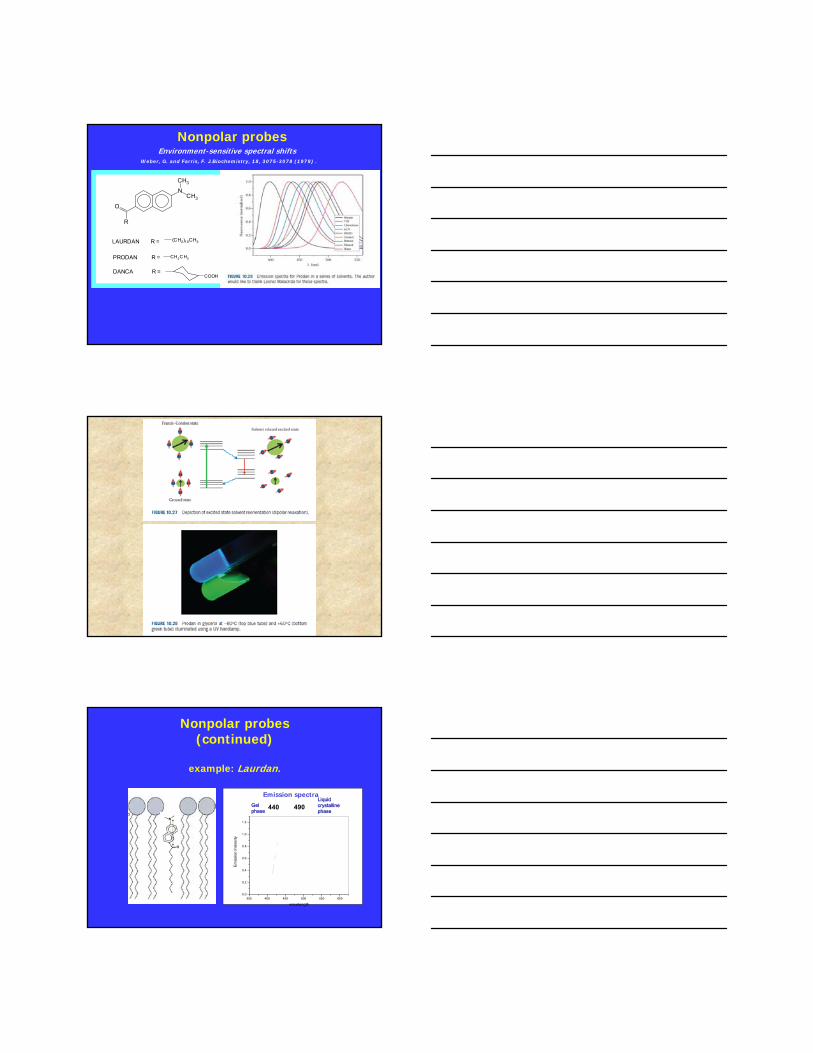
Membrane Probes
DPH - diphenylhexatriene
Fatty acids analogs and phospholipids
N-Rh-PE
Weber, G. and Farris, F. J.Biochemistry, 18, 3075-3078 (1979) .
Nonpolar probes
N
CH3
CH3
R
O
LAURDAN R =
PRODAN R =
DANCA R =
CH2C H3
(CH2)10CH3
COOH
Environment-sensitive spectral shifts
350 400 450 500 550 6000.0
0.2
0.4
0.6
0.8
1.0
1.2
Em
issi
on
Inte
nsi
ty
wavelength
Gel phase
Liquid crystalline phase
Nonpolar probes(continued)
example: Laurdan.
Emission spectra
440 490
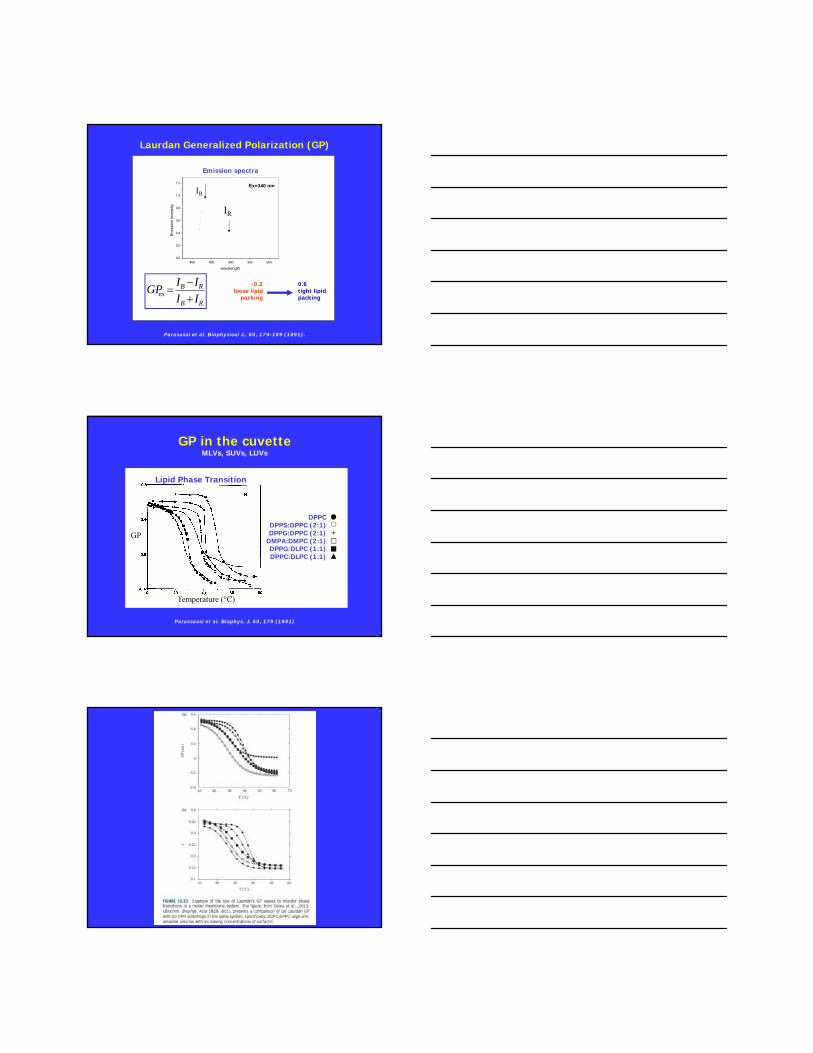
Laurdan Generalized Polarization (GP)
RB
RBex II
IIGP
Parasassi et al. Biophysical J., 60, 179-189 (1991).
0.6tight lipid packing
-0.2loose lipid
packing
400 450 500 550 6000.0
0.2
0.4
0.6
0.8
1.0
1.2
Em
issi
on
Inte
nsity
wavelength
IB
IR
Ex=340 nm
Emission spectra
GP
Temperature (°C)
Lipid Phase Transition
DPPCDPPS:DPPC (2:1)DPPG:DPPC (2:1)
DMPA:DMPC (2:1)DPPG:DLPC (1:1)DPPC:DLPC (1:1)
+
Parassassi et al. Biophys. J. 60, 179 (1991)
GP in the cuvetteMLVs, SUVs, LUVs
70
60
50
40
30
20
10
0
% T
rans
mitt
ance
600550500450400350
Wavelength (nm)
140x103
120
100
80
60
40
20
Fluorescence (au)
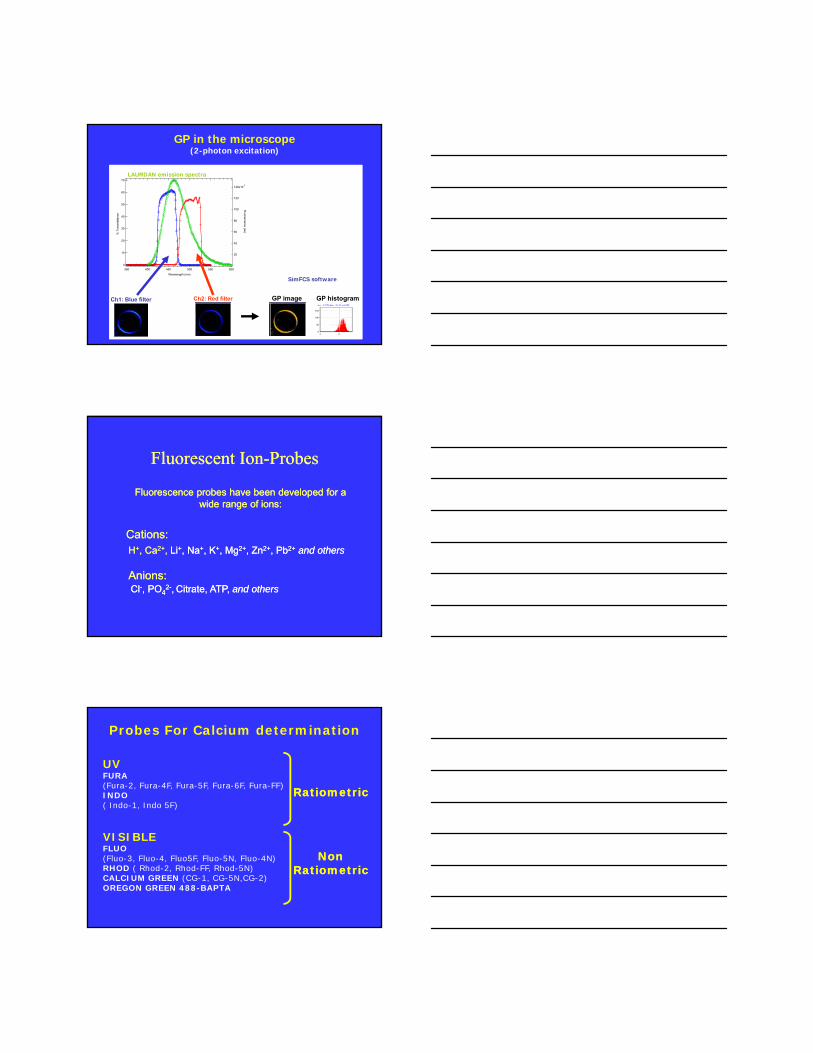
GP in the microscope(2-photon excitation)
Ch1: Blue filter Ch2: Red filter GP image
SimFCS software
GP histogram
LAURDAN emission spectra
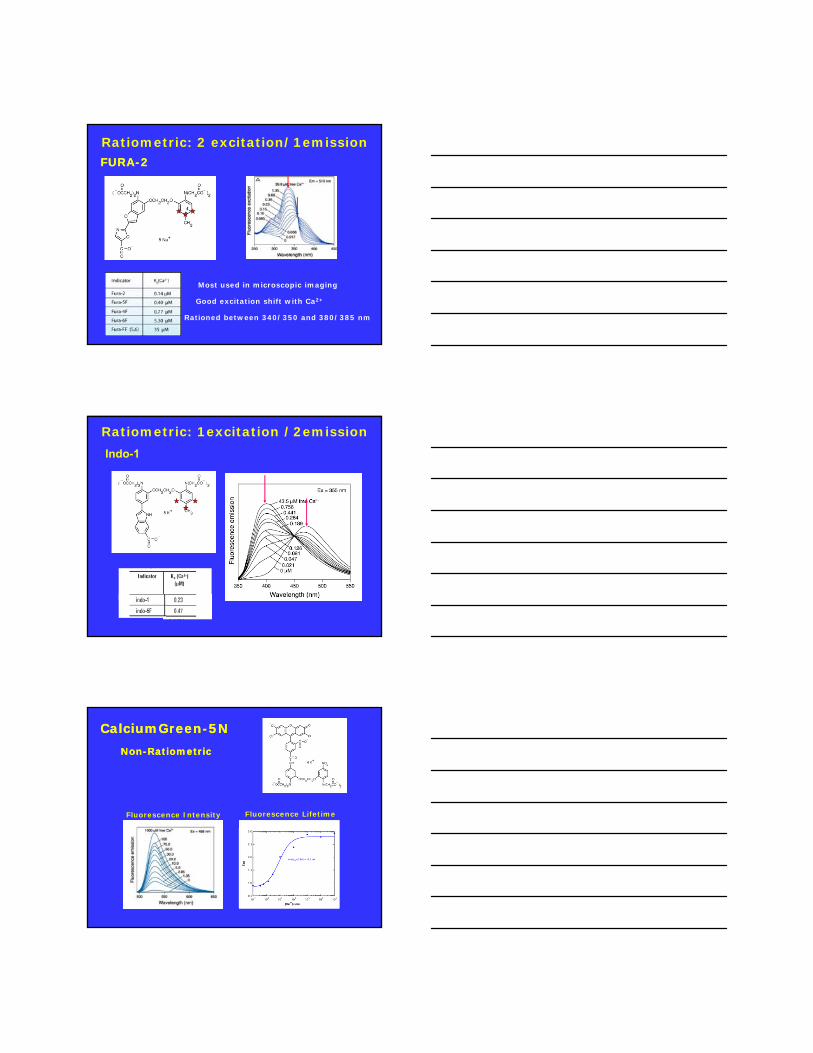
Fluorescent Ion-ProbesFluorescent Ion-Probes
Fluorescence probes have been developed for a wide range of ions:
Fluorescence probes have been developed for a wide range of ions:
Cations:Cations:H+, Ca2+, Li+, Na+, K+, Mg2+, Zn2+, Pb2+ and othersH+, Ca2+, Li+, Na+, K+, Mg2+, Zn2+, Pb2+ and others
Anions:Anions:Cl-, PO4
2-, Citrate, ATP, and othersCl-, PO42-, Citrate, ATP, and others
UVFURA(Fura-2, Fura-4F, Fura-5F, Fura-6F, Fura-FF)INDO( Indo-1, Indo 5F)
VISIBLEFLUO(Fluo-3, Fluo-4, Fluo5F, Fluo-5N, Fluo-4N) RHOD ( Rhod-2, Rhod-FF, Rhod-5N)CALCIUM GREEN (CG-1, CG-5N,CG-2)OREGON GREEN 488-BAPTA
Probes For Calcium determination
RatiometricRatiometric
NonRatiometric
NonRatiometric
FURA-2FURA-2
Most used in microscopic imaging
Good excitation shift with Ca2+
Rationed between 340/350 and 380/385 nm
Ratiometric: 2 excitation/1emission
Indo-1
Ratiometric: 1excitation /2emission
CalciumGreen-5NCalciumGreen-5NNon-RatiometricNon-Ratiometric
Fluorescence Intensity Fluorescence Lifetime

Molecular Probes' pH indicator families, in order of decreasing pKaMolecular Probes' pH indicator families, in order of decreasing pKa
pH-ProbespH-Probes
BCECFBCECF
Most widely used fluorescent indicator for intercellular pH
Membrane-permeant AM: pKa ~ 6.98 is ideal for intracellular pH measurements
R. Tsien 1982
Excitation-ratiometric probe with Ip at 439 nm, which is used a the reference point
Quantum DotsQuantum Dots
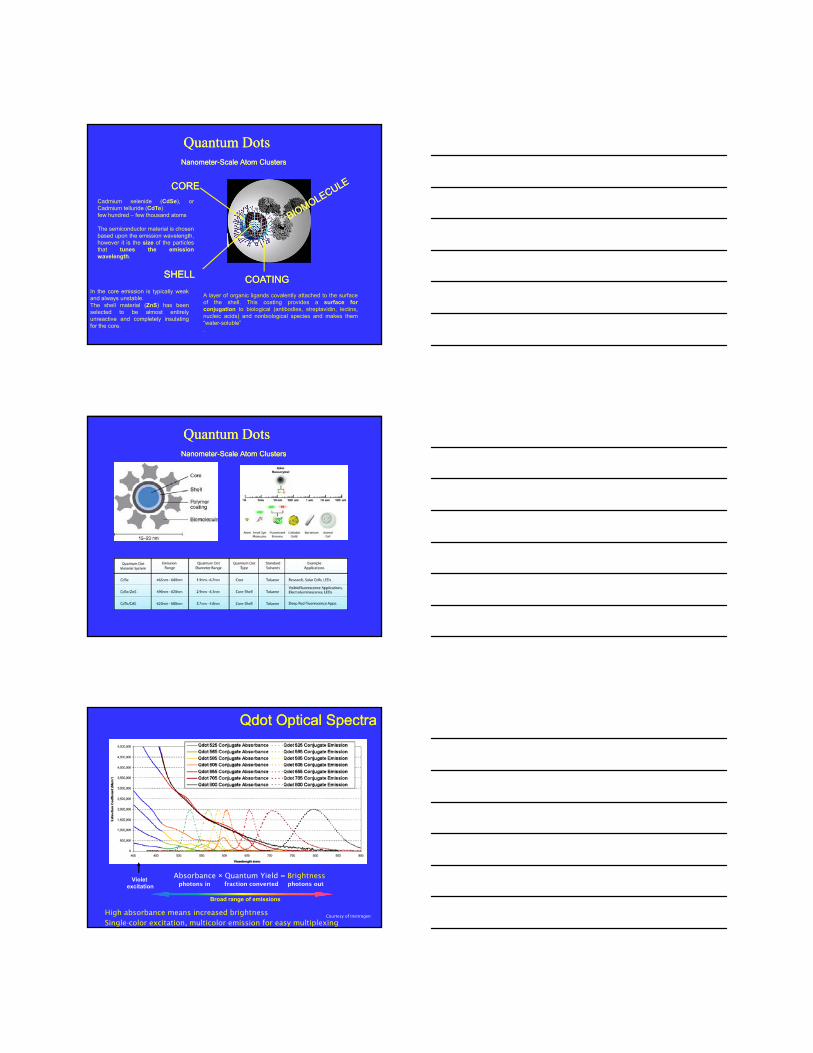
In the core emission is typically weakand always unstable.The shell material (ZnS) has beenselected to be almost entirelyunreactive and completely insulatingfor the core.
A layer of organic ligands covalently attached to the surfaceof the shell. This coating provides a surface forconjugation to biological (antibodies, streptavidin, lectins,nucleic acids) and nonbiological species and makes them“water-soluble”.
Cadmium selenide (CdSe), orCadmium telluride (CdTe)few hundred – few thousand atoms
The semiconductor material is chosenbased upon the emission wavelength,however it is the size of the particlesthat tunes the emissionwavelength.
SHELLSHELL COATINGCOATING
CORECORE
Quantum DotsQuantum DotsNanometer-Scale Atom ClustersNanometer-Scale Atom Clusters
Quantum DotsQuantum DotsNanometer-Scale Atom ClustersNanometer-Scale Atom Clusters
Violet excitation
Broad range of emissions
Single-color excitation, multicolor emission for easy multiplexing
Qdot Optical SpectraQdot Optical Spectra
High absorbance means increased brightness
Absorbance × Quantum Yield = Brightnessphotons in fraction converted photons out
Courtesy of Invitrogen
Narrow and symmetrical emission spectra
Fluorescein
Q-Dotin PBS
Emission tunable with size and material composition
Exhibit excellent photo-stability
Broad absorption spectra, making it possible to excite all colors of QDs simultaneously with a single light source - Multiplexing
Advantages:Advantages:
Disadvantages:Disadvantages:
Large size and high mass limit their use in applications requiring high diffusional mobilityLarge size and high mass limit their use in applications requiring high diffusional mobility
Qdot SummaryQdot Summary
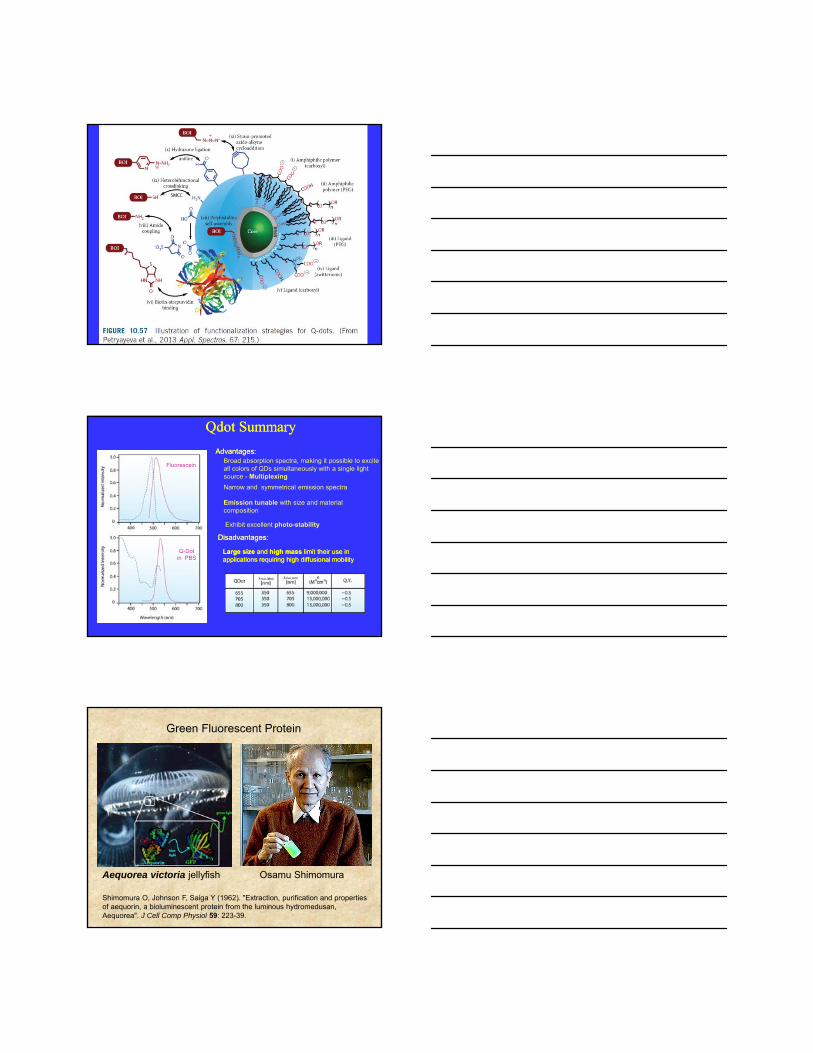
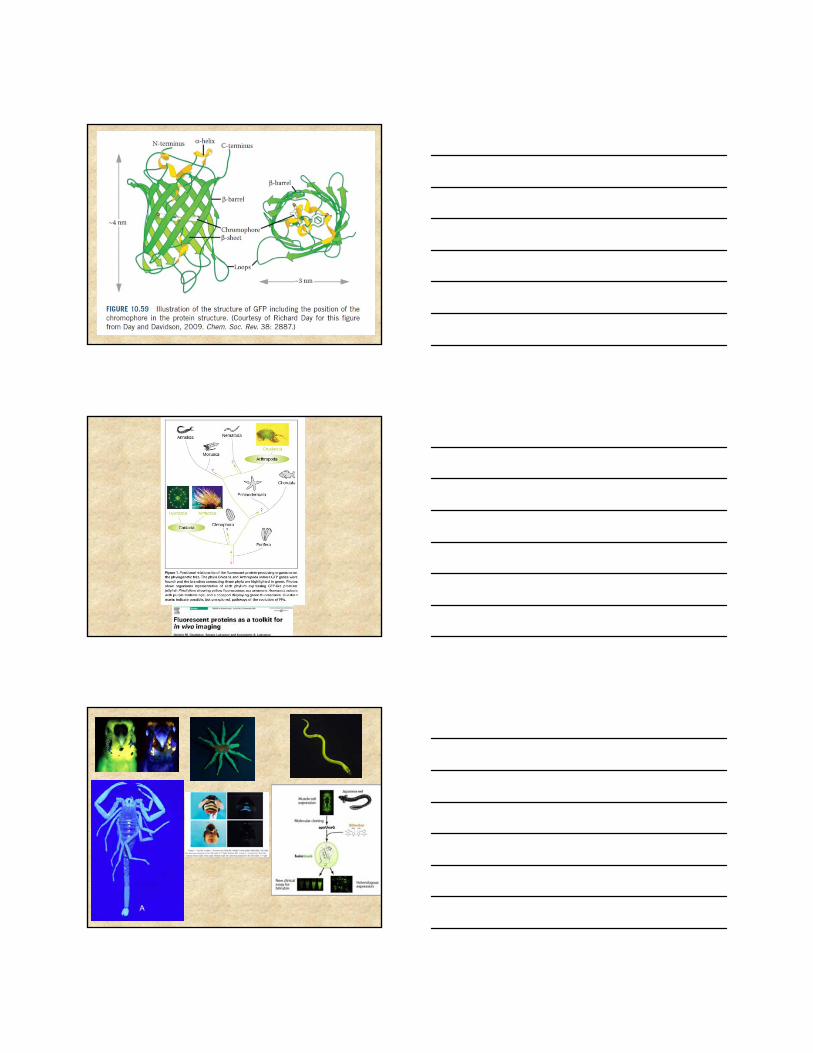
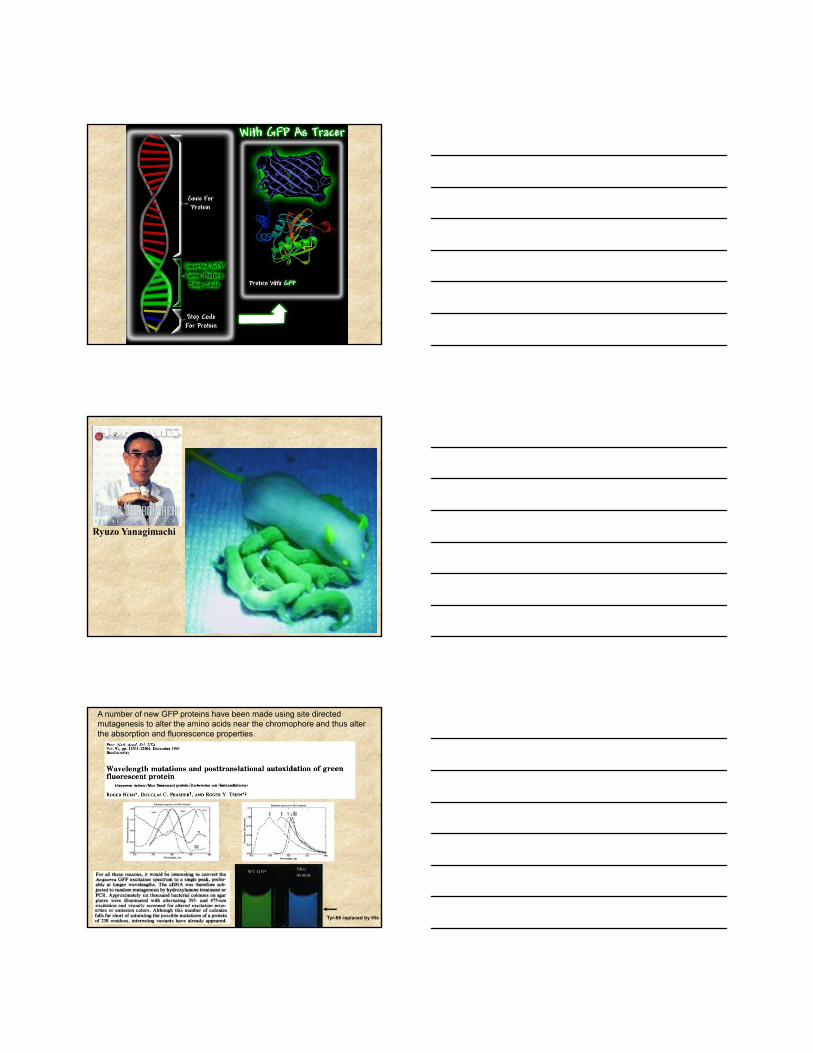
Green Fluorescent Protein
Aequorea victoria jellyfish Osamu Shimomura
Shimomura O, Johnson F, Saiga Y (1962). "Extraction, purification and properties of aequorin, a bioluminescent protein from the luminous hydromedusan, Aequorea". J Cell Comp Physiol 59: 223-39.
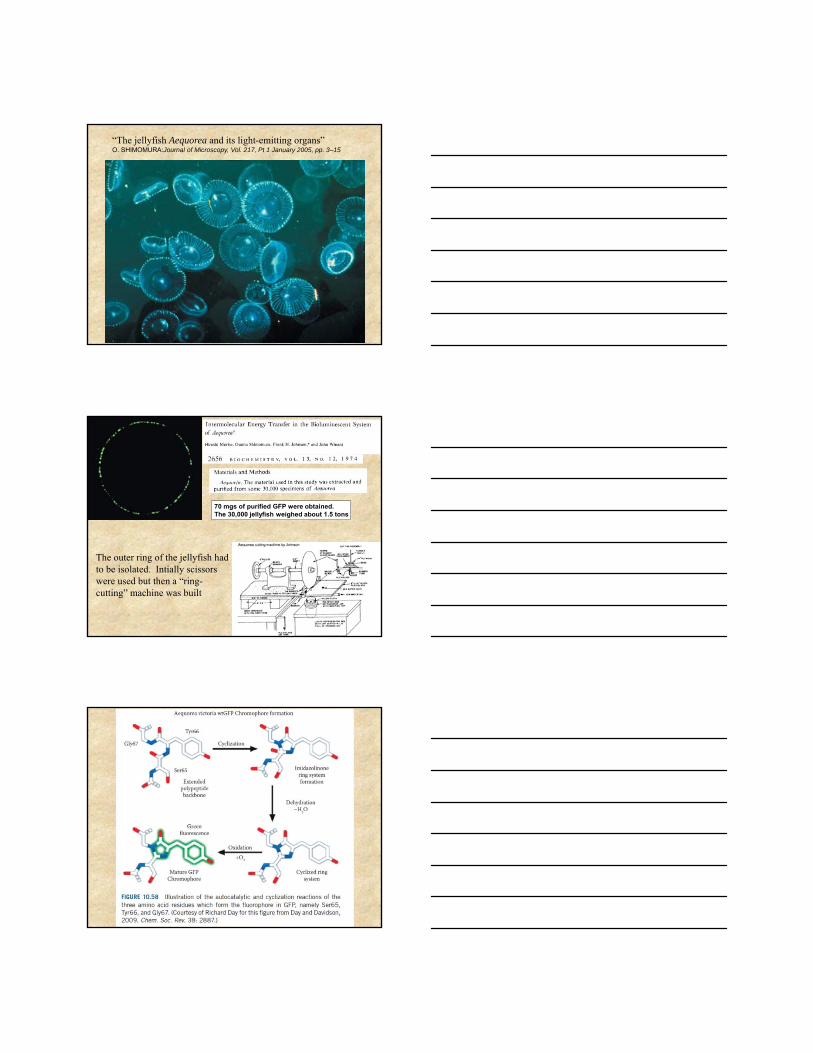
“The jellyfish Aequorea and its light-emitting organs”O. SHIMOMURA:Journal of Microscopy, Vol. 217, Pt 1 January 2005, pp. 3–15
70 mgs of purified GFP were obtained.The 30,000 jellyfish weighed about 1.5 tons
The outer ring of the jellyfish had to be isolated. Intially scissors were used but then a “ring-cutting” machine was built
Ryuzo Yanagimachi
A number of new GFP proteins have been made using site directed mutagenesis to alter the amino acids near the chromophore and thus alter the absorption and fluorescence properties.
Tyr-66 replaced by His
Another increasingly popular fluorescent protein is DsRed - originally isolated from the IndoPacific sea anemone relative Discosoma species
DsRed GFP
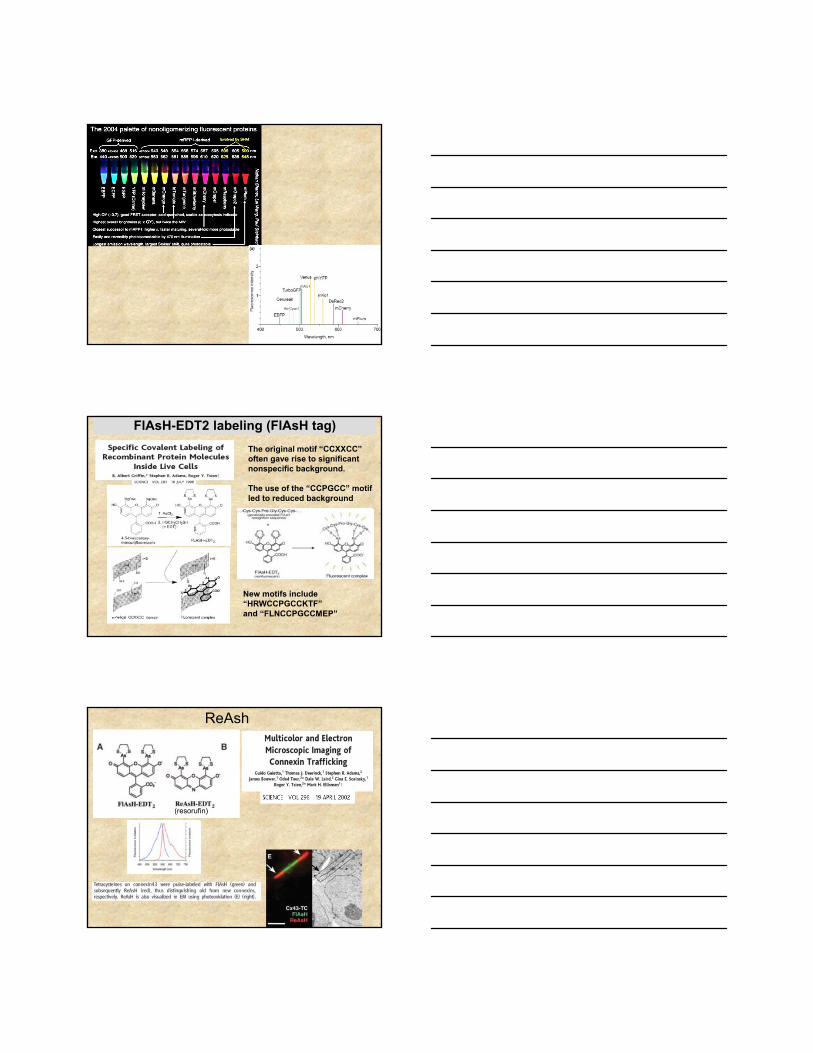
FlAsH-EDT2 labeling (FlAsH tag)
The original motif “CCXXCC” often gave rise to significant nonspecific background.
The use of the “CCPGCC” motif led to reduced background
New motifs include “HRWCCPGCCKTF”and “FLNCCPGCCMEP”
ReAsh
(resorufin)
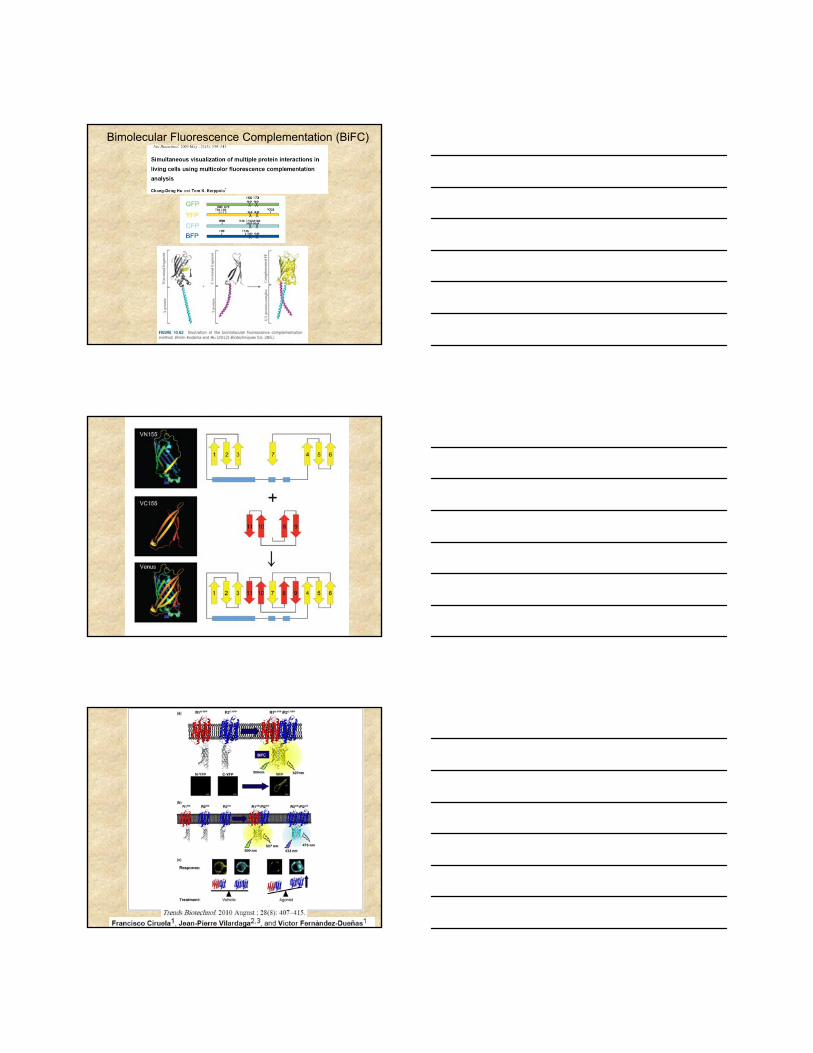
Bimolecular Fluorescence Complementation (BiFC)
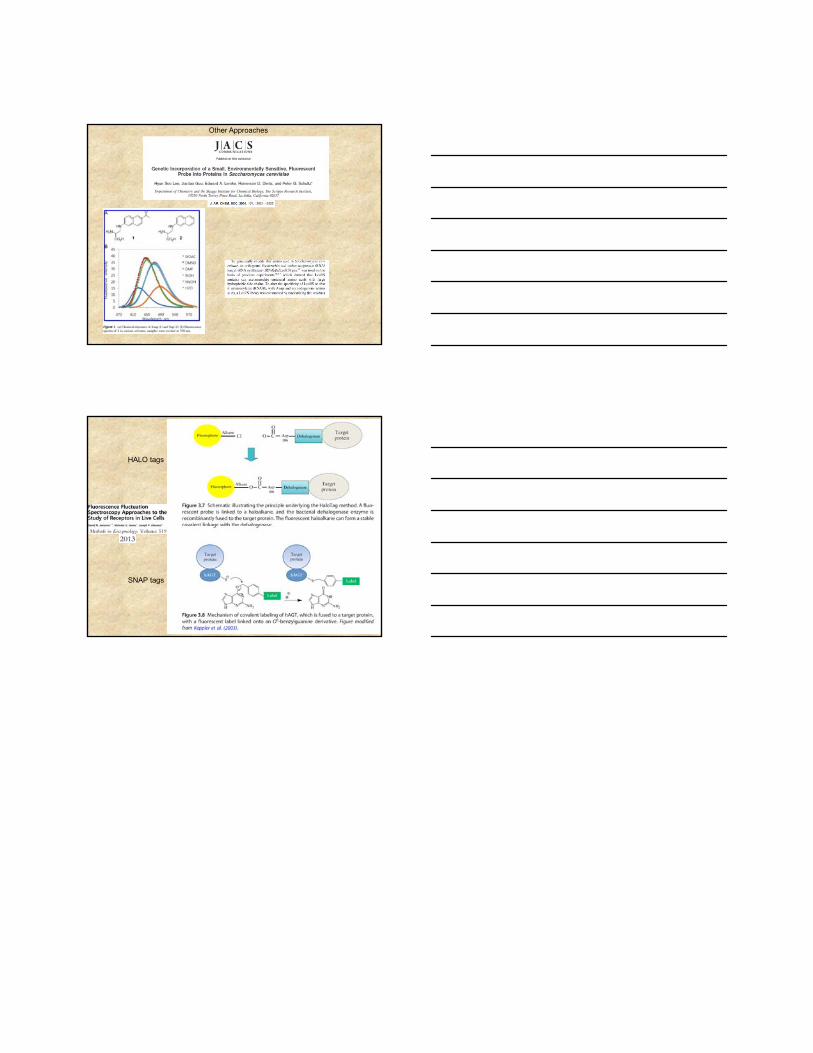
Other Approaches
HALO tags
SNAP tags

![PreventionofH-AggregatesFormationin Cy5LabeledMacromoleculesdownloads.hindawi.com/journals/ijps/2010/264781.pdf · 2019-07-31 · [4], Fluorescence Resonance Energy Transfer (FRET)](https://img.pdfslide.net/doc/110x75/5f48e833f187485a7671e6fc/preventionofh-aggregatesformationin-cy5labeledmac-2019-07-31-4-fluorescence.jpg)