Embed Size (px)
Citation preview

Prefatory Note The attached document represents the most complete and accurate version available based on original copies culled from the files of the FOMC Secretariat at the Board of Governors of the Federal Reserve System. This electronic document was created through a comprehensive digitization process which included identifying the best-preserved paper copies, scanning those copies,1
and then making the scanned versions text-searchable.2
Though a stringent quality assurance process was employed, some imperfections may remain. Please note that some material may have been redacted from this document if that material was received on a confidential basis. Redacted material is indicated by occasional gaps in the text or by gray boxes around non-text content. All redacted passages are exempt from disclosure under applicable provisions of the Freedom of Information Act. 1 In some cases, original copies needed to be photocopied before being scanned into electronic format. All scanned images were deskewed (to remove the effects of printer- and scanner-introduced tilting) and lightly cleaned (to remove dark spots caused by staple holes, hole punches, and other blemishes caused after initial printing). 2 A two-step process was used. An advanced optical character recognition computer program (OCR) first created electronic text from the document image. Where the OCR results were inconclusive, staff checked and corrected the text as necessary. Please note that the numbers and text in charts and tables were not reliably recognized by the OCR process and were not checked or corrected by staff.
Content last modified 6/05/2009.

CONFIDENTIAL (FR)
SUPPLEMENT
CURRENT ECONOMIC AND FINANCIAL CONDITIONS
Prepared for theFederal Open Market Committee
By the StaffBoard of Governors
of the Federal Reserve SystemApril 2, 1971

SUPPLEMENTAL NOTES
The Domestic Economy
Construction. Expenditures for new construction put in
place showed little month-to-month change in March. But based on the
data now available, the seasonally adjusted annual rate for February
had already reached a record $103.7 billion--6 per cent higher than
initially indicated--as a result of substantial upward revisions for
February and some earlier months. (These revisions related mainly to
the "additions and alterations" component of residential construction
and to outlays for State and local government projects, by far the
major component of the "public" sector.)
Compared with a year earlier, total construction outlays in
March averaged 14 per cent higher in current dollars and 5 per cent
more in 1957-59 dollars. The 9 per cent year-to-year increase in con-
struction costs in March was about the same rate of increase as during
all of 1970.
Even though current dollar outlays for none of the major
groups apparently expanded further in March, all reached new highs in
the first quarter as a whole. Particularly striking was the advance
registered by the public sector. Reflecting the appreciably increased
availability of funds--discussed in Supplemental Appendix A on State and
local financing developments--outlays in this sector actually exceeded
the further increase in residential construction expenditures from the
fourth quarter of 1970, as indicated in the table.

- 2-
NEW CONSTRUCTION PUT IN PLACE
PrivateAll Non- Public
Total Residential e dresidential
Billions of dollars
Annual
1970 (r) 91.3 63.1 29.3 33.8 28.3
Quarterly (SAAR)
1970 - IV (r) 94.4 65.3 31.9 33.4 29.11971 - I (p) 103.0 70.0 35.1 35.1 32.8
Monthly (SAAR)
1971January (r) 101.7 69.8 33.4 35.5 31.9February (r) 103.7 70.3 35.4 34.9 33.4March (p) 1/ 103.4 70.2 35.4 34.8 33.2
Per cent change in March from year earlier
In current dollars 14 9 21 -- 25
In 1957-59 dollars 5 2 15 -10 13
1/ Data for most recent month (March) are confidential Census Bureauextrapolations. In no case should public reference be made to them.
Labor market. Nonfarm payroll employment was unchanged
between February and March at 70.6 million--about the same level as in
September just before the GM strike began. Employment rose slightly
in March in nonmanufacturing activities but manufacturing employment
declined further in part because of increased strike activity.
Except for the period of the GM strike, manufacturing employment was
at its lowest level in March since January 1966.

-3-
Nonmanufacturing employment is somewhat higher
ago. In manufacturing, however, employment has declined
million, including a drop of over a quarter of a million
and technical people, many more than in earlier economic
than a year
about 1.3
white-collar
contractions.
TotalGovernmentPrivate
NonmanufacturiManufacturing
Production wNonproductio
NONFARM PAYROLL EMPLOYMENT(Seasonally adjusted, in thousands)
1970March September
71,242 70,53112,503 12,58558,739 57,946
.ng 38,795 38,66119,944 19,285
orkers 14,512 14,000on workers 5,432 5,285
The average workweek rose 0.2 hours in March for rank-and-
file workers on private nonfarm payrolls and 0.4 hours for production
workers in manufacturing. These workweek increases followed declines
of about the same size in February, when the workweek figures appear
to have been distorted by holidays (Lincoln's birthday during the
survey week and the Washington's birthday holiday on the following
Monday.)
The unemployment rate rose to 6 per cent in March from 5.8
per cent in February. The rise in unemployment occurred largely among
16 to 24 year-olds--the same group that accounted for the decline of
0.2 percentage points in the over-all unemployment rate in February.
On balance, the unemployment situation appears little changed since the
end of the GM strike. At 83.5 million in March, the civilian labor
force has declined since the end of last year and increased only one
million over the past year.
1971March
70,56812,87957,68939,03418,65513,4805,175

- 4 -
LABOR FORCE, EMPLOYMENT AND UNEMPLOYMENT(Seasonally adjusted, in thousands)
Civilian labor forceTotal employmentTotal unemployment
Unemployment rates:Total
Men aged 20-24 yearsMen aged 25 and over
Women aged 20 and over
Teenagers
1970 1971Oct. Nov. Dec. Jan. Feb. Mar.
83,300 83,473 83,609 83,897 83,384 83,47578,691 78,550 78,463 78,864 78,537 78,4754,609 4,923 5,146 5,033 4,847 5,000
--------------- (Per cent)-----------------
5.5 5.9 6.2 6.0 5.8 6.0
10.6 10.4 10.9 10.4 9.7 10.03.2 3.4 3.7 3.5 3.4 3.4
5.0 5.6 5.8 5.7 5.6 5.8
17.0 17.6 17.8 17.6 16.7 17.8
Wholesale prices. Wholesale prices rose at a seasonally
adjusted annual rate of 3.4 per cent between early February and early
March--about half the average rate of increase in the first two months
of the year. Farm products dropped somewhat after their sharp February
surge, but increases for processed foods and feeds more than offset the
decline. The rise in industrial prices was faster than in February,
but the increase of about 3 per cent (annual rate) was about the same
as the 3-month average and below both the first and second half of 1970.

- 5 -
WHOLESALE PRICES(Per cent changes, seasonally adjusted annual rates)
De
J
All commodities1/Farm and food-
Industrials
Crude materials2-Intermediate materials-Finished goods 2/
ProducerConsumer 2/
Durable 2/Nondurable-
1/ Farm products, and processed2/ Excludes foods.
6 months 3ec. 1969 June D
to toune 1970 Dec. M
2.6 2.0
-1.8 -.53.9 3.4
8.7 .74.5 1.6
3.7 6.42.5 5.5
2.7 5.92.6 4.9
foods and feeds.
monthsec. 1970
toar. 1971
6.1
13.72.9
1.74.4
3.51.5
2.61.1
MonthlyJan. 1971 Feb.
to toFeb. Mar.
9.1 3.4
33.5 1.11.6 3.0
-1.0 -7.63.3 6.6
3.2 2.10.0 -1.1
5.6 -4.3-3.2 0.0
The rise in prices of both consumer and producer nonfood
finished goods slowed in the first quarter and increases were substan-
tially below those in the last half of 1970.
Lumber and wood products prices rose sharply in March reflec-
ing heavy demand for softwood lumber and plywood. However, inventories
have been replenished and, more recently, there has been little change
in spot prices for softwood lumber and plywood.
Nonferrous metals prices fell last month but more recently
nonferrous metal markets have firmed. Copper, zinc and tin prices
have gone up and further increases for copper and probably for aluminum
may follow the reopening of labor contracts in May and June.

- 6-
Steel mill products prices have been raised 1.2 per cent
since December compared to 2.5 per cent in the first quarter of last
year. However, judging by the pattern of recent and announced future
increases on products covered by the one-year price guarantee (which
will expire for all products by the end of June), the steel price
increase in the first six months of this year may exceed the 6 per cent
rise in the same period last year.
Consumer credit. The February increase in consumer instal-
ment credit outstanding amounted to $1.2 billion at a seasonally
adjusted annual rate. Almost all of the gain occurred in automobile
credit and in personal loans. Automobile credit outstanding rose $0.6
billion, the largest monthly increase for this component since November
1969. On the other hand, nonautomotive consumer goods credit declined
for the first time since June 1961.
Seasonally adjusted extensions of instalment credit during
February exceeded the previous high reach last July. Repayments were
at a record level for the second month in a row.
The Domestic Financial Situation
Monetary aggregates. The narrowly defined money supply,
currency plus private demand deposits, (M1) is now estimated to have
increased in March at an annual rate of about 9.5 per cent--below the
unusually sharp February increase but substantially above the late 1970
pace. Over the first quarter, growth was at an annual rate of about
8 per cent compared with 3.4 per cent in the fourth quarter of 1970 and
6.1 per cent in the third.

- 7-
The rate of growth in M2 (M1 plus commercial bank time and
savings deposits other than large CD's) also slowed somewhat in March--
an annual rate of about 18 per cent compared with 22 per cent in
February. Over the first quarter, however, expansion at an annual rate
of 17.5 per cent was almost double the rate of growth in the fourth
quarter.
MONETARY AGGREGATES(Seasonally adjusted percentage changes at annual rates)
1970 1971Concepts of money 1970 1971QIV January February March e/ QI e/
M 1Currency plus privatedemand deposits 3.4 1.1 14.0 9.5 8.0
MM plus commercial banktime and savings depositsother than large CD's 9.2 11.5 22.1 18.0 17.5
e/ Estimated.
Bank credit. Preliminary estimates now available for March
indicate that commercial bank credit, adjusted for transfers of loans
between banks and their affiliates (and also for System matched sale-
purchase transactions outstanding at the February month-end) increased
at an annual rate of 11.6 per cent--somewhat below the rate earlier in
the first quarter. Expansion in loans slowed reflecting principally
weakness in business loans. Borrowing by businesses declined at an
annual rate of 6-1/2 per cent in March following growth at an annual
rate of about 10 per cent earlier in the year.

- 8 -
Growth in investment holdings accounted for two-thirds of
the total credit growth in March--a somewhat higher proportion than in
January or February. Expansion in holdings of municipal and Federal
agency issues--which had slackened in February--accelerated in March
to an annual rate of over 33 per cent--not too far below the high late
1970-early 1971 rates. But the pace of expansion in holdings of U.S.
Government securities declined somewhat despite two Treasury financings.
COMMERCIAL BANK CREDIT ADJUSTED TO INCLUDEOUTSTANDING AMOUNTS OF LOANS SOLD TO AFFILIATES--
(Seasonally adjusted percentage changes, at annual rates)
1970 1971
Q IV Jan. Feb. Mar. QI
2/ 4/ 4/Total loans & investments- 6.1 14.9 13.14 11.6 4 13.3
U.S. Government securities 2.8 8.3 24.7 10.1 14.5Other securities 34.5 39.3 19.0, 33.4 31.3Total loans 2/ -1.0 9.1 9.4 - / 4.9; 7.8
3/Business loans- -9.2 5.4 14.0 -6.4 4.3
1/ Last Wednesday of month series.2/ Includes outstanding amounts of loans sold outright by banks to
their own holding companies, affiliates, subsidiaries, and foreignbranches.
3/ Includes outstanding amounts of business loans sold outright bybanks to their own holding companies, affiliates, subsidiaries, andforeign branches.
4/ Excludes $814 million of System matched sale-purchase agreementsoutstanding on February 24.
Nonbank depositary institutions. Mutual savings banks in
New York City have, as expected, incurred only very modest outflows
during the beginning of the current reinvestment period, the three grace
days at the end of March. Similar data are not yet available for savings

and loan associations but there is every reason to expect that they
also will experience only minimal outflows. In fact, according to a
usually reliable FHLBB sample of associations, the industry received a
net deposit inflow of about $2.5 billion during the first three weeks
of March. That amount is almost two-and-one-half times as great as the
inflow during the corresponding period in 1967--a similar period of
large deposit growth--and already matches the savings received during
all of February (not seasonally adjusted).
15 LARGEST NEW YORK CITY SAVINGS BANKSNet Deposit Flows during the Three-Day End-of-March Grace Period 1/
Millions As per cent ofof dollars deposits outstanding
1966 -121 -. 781967 - 55 -. 341968 - 72 -. 401969 - 99 -. 531970 -146 -. 781971 - 42 -. 20
1/ These savings banks account for 28 per cent of industry deposits.These data have been adjusted for repayments of passbook loans madeearlier to save interest credited.

- 10 -
INTEREST RATES
1970 1971Highs Lows Mar. 8 Apr. 1
Short-Term Rates
Federal funds (weekly averages) 9.39 (2/18) 4.82 (12/30) 3.41 (3/3) 4.02 (3/31)
3-monthTreasury bills (bid)Bankers' acceptancesEuro-dollarsFederal agenciesFinance paperCD's (prime NYC)Most often quoted new issueSecondary market
6-monthTreasury billsBankers' acceptancesCommercial paper (4-6 months)Federal agenciesCD's (prime NYC)Most often quoted new issueSecondary market
1-yearTreasury bills (bid)CD's (prime NYC)
Most often quoted new issuePrime municipals
Intermediate and Long-Term
Treasury coupon issues5-years20-years
CorporateSeasoned Aaa
Baa
New Issue Aaa
MunicipalBond Buyer IndexMoody's Aaa
7.938.7510.508.308.25
(1/6)(1/13)(1/9)(1/9)(2/1)
4.745.256.504.815.38
(12/17)(12/31)(12/31)(12/18)(12/10)
3.323.755.053.333.88
6.75 (10/30) 5.50 (11/25) 4.009.25 (1/23) 5.38 (12/23) 3.90
7.998.889.138.50
(1/5)(1/13)(1/8)(1/28)
7.00 (10/7)9.38 (1/23)
7.62 (1/30)
7.50 (9/16)5.60 (1/9)
8.30 (1/7)7.73 (5/26)
8.60 (6/24)9.47 (8/28)
9.30 (6/19)
7.12 (5/28)6.95 (6/18)
4.785.505.635.12
(12/17)(12/4)(12/4)(12/18)
3.423.884.253.66
5.50 (12/23) 4.005.50 (12/23) 3.70
3.654.005.32
(3/5) 3.643.75
3.753.90
3.74(e) 4.12 (a)
4.50(3/5) 3.78
4.134.05
4.74 (12/31) 3.60
5.50 (12/23) 4.382.95 (12/17) 2.35 (3/5)
5.85 (12/4) 5.166.15 (12/16) 6.16
7.47 (12/29) 7.188.57 (3/10) 8.44
3.67
4.502.30
5.165.85
7.238.46
7.68 (12/18) 7.79 (3/3) 7.15
5.33 (12/10) 5.37 (3/5) 5.155.15 (12/10) 5.15 (3/5) 5.00
Mortgage--implicit yieldin FNMA biweekly auction 1/ 9.36 (1/2)
1/ Yield on 6-month forward commitment after
8.36 (12/28) 7.43 (3/1) 7.45 (3/29)
allowance for commitment fee andrequired purchase and holding of FNMA stock. Assumes discount on 30-yearloan amortized over 15 years. e--estimated

- 11 -
International developments
Monetary policy actions abroad. In Germany, the Bundes-
bank reduced its discount rate from 6 to 5 per cent, and its rate
on advances ("Lombard" rate) from 7-1/2 to 6-1/2 per cent, effec-
tive April 1. At the same time, however, it reduced the banks'
rediscount quotas by 10 per cent (while allowing banks which had
been using more than 90 per cent of their previous quotas to adjust
to the new quotas by June 30), and announced that open-market opera-
tions with non-banks to absorb liquidity would be intensified. These
actions are intended to reduce short-term interest rate differentials
between Frankfurt and the Euro-dollar market, and thus to reduce the
incentive for inflows of foreign funds, without relaxing domestic
credit restraints. They are similar to the actions taken last Novem-
ber, when the Bundesbank lowered the discount rate but increased re-
serve requirements. Money market rates in Frankfurt are likely to
remain relatively high; in recent months they have tended to stay
near the Bundesbank's Lombard rate (now 6-1/2 per cent).
In the United Kingdom, the Bank of England reduced its
discount rate from 7 to 6 per cent on April 1. The main aim, as in
Germany, was to narrow international interest rate differentials and
discourage inflows of funds which have been very large in recent
months. But in Britain, unlike Germany, some easing of domestic
credit restraints is now thought to be justified by economic prospects.
In the Chancellor's budget speech of March 30, he indicated that bank

- 12 -
loans and the money supply would be allowed to increase more rapidly
over the year ahead than had earlier been thought appropriate. (See
Appendix B for a discussion of the U.K. budget and related measures.)
The Netherlands Bank lowered its discount rate from 6 to 5-1/2
per cent effective April 5, and the Bank of Italy reduced its rate
from 5-1/2 to 5 per cent effective April 5. Earlier, the Swedish
Riksbank had cut its discount rate from 7 to 6-1/2 per cent effective
March 19, and the National Bank of Belgium had cut its rate from 6-1/2
to 6 per cent effective March 25. In all these cases, a main consid-
eration was the decline in rates in other countries and in the Euro-
dollar market; but in Sweden and Italy some easing of domestic re-
straints was also intended.
The Reserve Bank of South Africa raised its discount rate
from 5-1/2 to 6-1/2 per cent on March 31. South Africa has been ex-
periencing a gathering inflation domestically and a large balance
of payments deficit.
Foreign exchange markets. Following the announcement on
March 31 of the German monetary actions described above, speculative
pressures on the dollar, which had been building for several weeks,
intensified. Market participants interpreted the German actions as
implying that market interest rates in Germany would remain high,
and that German reserve gains would continue. After an initial
easing, the mark moved back to the ceiling on March 31 and the

- 13 -
Bundesbank purchased $292 million. On April 1, it purchased an addi-
tional $430 million spot and swapped out $608 million. By Friday
morning, April 2, the 3-month forward mark, which had been at a dis-
count of 3/4 to 1 per cent per annum last week, had moved up to the
spot ceiling rate, and the Bundesbank entered the forward market,
selling forward marks outright, to keep the forward rate from moving
to a premium. On that day, April 2, it purchased $137 million for-
ward and $598 million spot. The Federal Reserve Bank of New York
also sold a small amount of marks forward for Open Market account
on April 2.
Other EEC currencies and the Swiss franc firmed along with
the German mark. By Friday, all were at their official ceilings ex-
cept for the lira. Forward rates for the Netherlands guilder and the
Swiss franc, which had been above their spot ceiling rates for several
weeks, moved even higher.
Total dollar purchases by the central banks of the Nether-
lands, Switzerland, France, and Belgium swelled to roughly $450 mil-
lion on April 2, with Switzerland alone accounting for $360 million.
Euro-dollar market. The U.S. Treasury announced on April 1
that it will sell (for payment April 9) $1.5 billion of 3-month certi-
ficates of indebtedness to foreign branches of U.S. banks, at 5-3/8
per cent; allocations to individual banks will be based on their
average Euro-dollar borrowings from branches and Ex-Im security

- 14 -
holdings of branches in the computation period ended March 17. The
Federal Reserve amended its regulations to permit U.S. banks to
count toward maintenance of their reserve-free Euro-dollar bases
any funds invested by their overseas branches in U.S. Treasury
securities offered under this program.
Correction. The liquidity deficit of about $2-1/2 bil-
lion in the first quarter of 1971 was not a record, as stated in
the Greenbook on page I-6 and suggested on page IV-1. A larger
liquidity deficit ($3.8 billion) was registered in the second
quarter of 1969, and a deficit about as large ($2.3 billion) in
the third quarter of 1969.
U.S. PAYMENTS BALANCES, SEASONALLY ADJUSTED, 1969-71 1/(In billions of dollars, quarterly)
Liquidity Official settle-Quarter basis ments basis
1969 - I -1.4 +1.5II -3.8 +1.3
III -2.3 -.6IV +.4 +.5
1970 - I -1.7 -3.1II -1.5 -2.0
III -.8 -2.0IVp -.8 -3.5
1971 - Ie -2-1/2 -5
p Preliminary. e Partly estimated.1/ Excluding new allocations of Special Drawing
Rights.
Correction:
Section I, page 1. Add "little" after changed at the end
of line 3 from the bottom.

STRICTLY CONFIDENTIAL (FR)
APPENDIX A: STATE AND LOCAL GOVERNMENT LONG-TERM BORROWINGANTICIPATIONS AND REALIZATIONS: FOURTH QUARTER 1970*
Results of the FRB-Census 1/ survey of long-term borrowinganticipations and realizations of State and local governments for thefourth calendar quarter of 1970 2/ indicate that individual unitspostponed or cancelled about $1.8 billion of the borrowing they hadplanned for that quarter. Approximately 30 per cent of this amountwas induced by a combination of the levels of long-term municipal yieldsthen prevailing and expectations of further declines in interest rates.Because of the substitution of other financial expedients, these interestrate induced borrowing setbacks led to only a $60 million postponement orcancellation of capital projects. Moreover, expectations of continuedfavorable market conditions were reflected in a marked increase inlong-term borrowing anticipations for the first half of calendar 1971.
Partly offsetting the $1.8 billion of planned borrowing thatdid not occur, about $1.1 billion of the long-term borrowing actuallyundertaken during the fourth quarter had not been included in plans byborrowing units as of the end of the third quarter. A falling levelof yields was responsible for at least a third of these accelerations.
Borrowing Short-falls
The level of long-term municipal yields during the fourthquarter of calendar 1970 induced about $534 million in short-fallsfrom borrowing plans. As indicated in Table 1, about one-half ofthis short-fall was experienced by units that deferred plans mainly
1/ The Bureau of the Census is responsible for the design of the sampleas well as the polling of respondents.
2/ The respondents to the survey accounted for $5.2 billion or about90 per cent of the $5.8 billion borrowed during the fourth quarter.The difference is fully accounted for by non-response; non-respondents
are excluded from this report.The response rate for units in the anticipations survey was
about 76 per cent. It is felt that the non-respondents generallyhad no plans to report and thus anticipations totals are most likelyaccurate. An 84 per cent response rate was experienced in the
realizations survey. Although it is felt that non-respondentperformance paralleled the experiences of the respondents, they arenot represented in the tables or text.
* Prepared by Paul Schneiderman, Economist, Capital Markets Section,
Division of Research and Statistics.

Table 1
REASONS FOR BORROWING SETBACKSFOURTH CALENDAR QUARTER, 1970
(Millions of dollars)
Interest Rate InducedRate Too Expected Admin. or All Per
Total Ceilings High to Fall Legal Delay Other Total cent
States andState Colleges 202.3 17.3 163.5 1/ 21.5 194.9 29.6 426.8 23.5
Counties 42.8 26.2 0.0 16.6 112.4 75.2 230.4 12.7
Cities & Towns 71.5 1.5 28.7 41.3 274.9 170.5 516.9 28.5
Special Districts 111.3 8.1 1.6 101.6 89.4 23.1 223.8 12.3
School Districts 106.0 12.3 19.3 74.4 137.2 173.2 416.4 23.0
Total 533.9 65.4 213.1 255.4 808.8 471.6 1,814.3 100.0
Per cent 29.4 3.6 11.7 14.1 44.6 26.0 100.0
1/ This amount is the result of reports by three State agencies.

A - 3
in anticipation of lower interest rates. The largest volume of borrow-ing setbacks, however, was not directly related to interest rates.Administrative and legal delays caused a larger than normal $800 millionin borrowing postponements and cancellations during the period. Questionsconcerning the constitutionality of some bond authorizations affectedall types of units, while bond limit laws had an additional effect onlocal units facing expanding needs and fixed tax bases.
It is notable that State and local governments now have firmplans to reenter the long-term bond market over the course of calendar1971, planning to make-up 80 per cent of their fourth quarter borrowingsetbacks. The planned make-up rate for those units influenced byinterest rates in their decision to cancel or postpone was almost 90per cent.
Capital Outlay Postponements and Cancellations
It appears that $385 million of capital projects were post-poned or cancelled due to long-term borrowing setbacks in the fourthquarter. Approximately $234 million are currently scheduled to bereinitiated during calendar year 1971, however, leaving a potentialnet loss for the current year due to fourth quarter 1970 borrowingshort-falls of about $151 million.
Interest rate induced short-falls in borrowing accounted foronly about 16 per cent of the total capital project cutbacks. Indicativeof borrowing expectations regarding future interest rates, only $8million of these projects were expected to be cancelled for the rest ofcalendar 1971.
Long-term borrowing setbacks of about $800 million caused bylegal or administrative delays induced postponements of almost $100million of capital projects. As earlier analysis suggests, a substantial
amount of these delayed capital projects is due to be reinitiated duringcalendar 1971.
Alternative Financing
Further evidence of State and local governments' expectationsregarding financial market conditions in 1971 can be read from the
survey results. Approximately $760 million in borrowing short-falls
for the fourth quarter of 1970 reflected lack of current need. Anattempt to gain better market terms and resolve local legal problems

Table 2
CAPITAL OUTLAY POSTPONEMENTS AND CANCELLATIONSFOURTH CALENDAR QUARTER, 1970
(Millions of dollars)
Interest Rate Induced All Other Reasons TotalGross 1/ Gross 1/ Gross 1/Cutback Postponed Cancelled Cutback Postponed Cancelled Cutback Postponed Cancelled
States andState Coll. 55.5 52.0 3.5 24.0 19.0 5.0 79.5 71.0 8.5
Counties 0.0 0.0 0.0 11.9 0.0 11.9 11.9 0.0 11.9
Cities andTowns 0.0 0.0 0.0 63.8 28.5 35.3 63.8 28.5 35.3
SpecialDistricts 0.0 0.0 0.0 17.7 17.7 0.0 17.7 17.7 0.0
SchoolDistricts 4.5 0.0 4.5 207.4 116.3 91.1 211.9 116.3 95.6
Totals 60.0 52.0 8.0 324.8 181.5 143.3 384.8 233.5 151.3
1/ Gross = Postponed & Cancelled

A - 5
was apparent as 86 per cent of this short-fall has been tentativelyrescheduled.
Table 3
EFFECTS OF BORROWING SETBACKSFOURTH CALENDAR QUARTER, 1970
Per Cent Millions of Dollars
Capital Outlay Reductions 385.3 1/
Funds Not Currently Needed 759.8
Alternative Financing:
Short-term Financing 60.3 405.2
Reduction of Liquid Assets 27.1 182.3
Reduction or Postponement ofOther Cash Outlays 11.6 77.9
Other .9 6.1100.0 671.5
Total Effect 1,816.6 1/
1/ A borrowing short-fall may cause a capital project of amagnitude to be cancelled or postponed. Thus the totalthan the levels of shortfalls.
largeris larger
State and local units with $672 million of borrowing setbackswere able to maintain expenditures by using other financial expedients,as shown in Table 3. Units utilizing these alternatives plan to fund,long-term, about 80 per cent of these alternative financing expedients.As in the past, most of the respondents in this group indicated use oflow cost short-term financing to cover their long-term borrowingshort-falls.
Accelerations in Long-term Borrowing
A decline in bond yields over the course of the fourth quarterinduced an additional $343 million in long-term borrowing above plans
A - 6
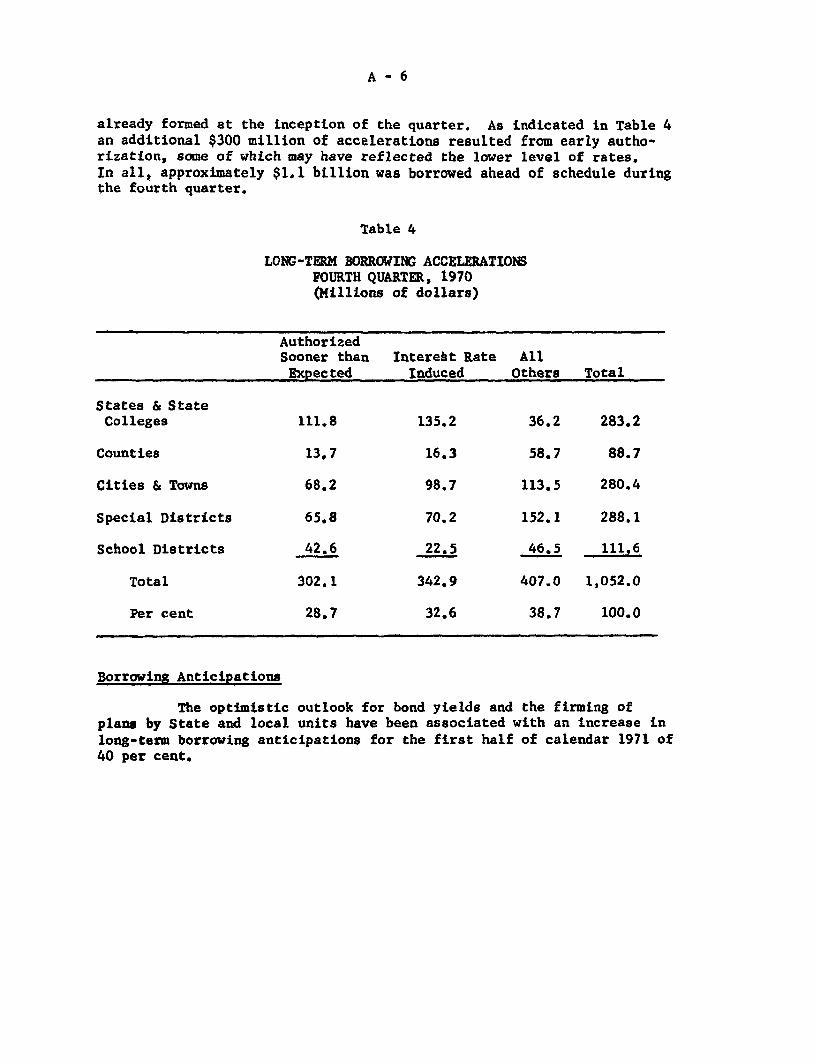
already formed at the inception of the quarter. As indicated in Table 4an additional $300 million of accelerations resulted from early autho-rization, some of which may have reflected the lower level of rates.In all, approximately $1.1 billion was borrowed ahead of schedule duringthe fourth quarter.
Table 4
LONG-TERM BORROWING ACCELERATIONSFOURTH QUARTER, 1970(Millions of dollars)
AuthorizedSooner than Interest Rate All
Expected Induced Others Total
States & StateColleges 111.8 135.2 36.2 283.2
Counties 13.7 16.3 58.7 88.7
Cities & Towns 68.2 98.7 113.5 280.4
Special Districts 65.8 70.2 152.1 288.1
School Districts 42.6 22.5 46.5 111.6
Total 302.1 342.9 407.0 1,052.0
Per cent 28.7 32.6 38.7 100.0
Borrowing Anticipations
The optimistic outlook for bond yields and the firming ofplans by State and local units have been associated with an increase in
long-term borrowing anticipations for the first half of calendar 1971 of40 per cent.

A - 7
Table 5
LONG-TERM BORROWING ANTICIPATIONSAS OF DECEMBER 31, 1970(Billions of dollars)
Jan.-Mar. 1971 Apr.-June 1971Anticipations Auth. Unauth. Total Auth. Unauth. Total
As of September 30 2.45 1.94 4.39 2.22 1.61 3.83
As of December 31 7.00 .94 7.94 3.42 2.33 5.75
Net Change 4.55 -1.00 3.55 1.20 .72 1.92
Table 6 reflects the growing volume of State and local borrow-ing, the continued moderating impact of monetary policy on postponementsand cancellations of such borrowing, and the subsequent reduced impactson capital projects. Maintenance of present credit market conditions isexpected to push long-term borrowing by these governments to a recordlevel in calendar 1971 as projects which have been previously postponedare reinitiated and capital needs continue to accumulate.
Table 6
SUMMARY OF STATE AND LOCAL LONG-TERM BORROWING, SHORTFALLOF BORROWING AND CAPITAL OUTLAYS DUE TO INTEREST RATES
(Billions of dollars)
Gross Gross Cutbacks inActual Shortfalls Capital Outlays
Long-term Due to Initiated Due toBorrowing High Int. Rates High Int. Rates
1969 - III 2.5 1.67 0.68IV 3.0 2.24 1.20
1970 - I 4.1 0.97 .20II 3.7 1.10 .25III 4.4 0.59 .06IV 5.9 0.53 .06
1970 - 1 6.6 e/ n.a. n.a.
e/ Estimated

SUPPLEMENTAL APPENDIX B: THE UNITED KINGDOM BUDGET FORFISCAL 1971-72*
The British budget for fiscal 1971-72 -- which began April 1 --moves British economic policy in an expansionary direction. The immediategoal of the budget, presented to Parliament on March 30, is to raise therate of growth of real gross national product, currently running below2 per cent.
This aim is to be achieved mainly through reductions in bothpersonal and business taxes that will reduce revenue by about £550 million
(equal to a little less than 1-1/2 per cent of GNP) in 1971-72 and £680million a year when the reductions are fully operative. Monetary policywill also be eased somewhat. The ceiling on non-priority bank lending israised to 10 per cent for 1971-72, compared to 5 per cent in the previousyear. On April 1, the Bank of England lowered its discount rate from 7 to6 per cent.
The budget presentation also outlined a plan of broad tax reformaimed primarily at simplifying Britain's tax system. As part of that reform,Britain will introduce a value added tax in April 1973.
The Budget in Relation to the Current State of the Economy
Growth in 1970 was disappointing in light of the widely heldexpectation a year ago that GNP would expand by at least three per centa year. The increase from the second half of 1969 to the second half of1970 was no more than 1-1/2 per cent, and there has been little if anygrowth thus far in 1971. Seasonally adjusted unemployment has climbedsteadily since October and reached 2.9 per cent in March -- exceedinglyhigh by British standards. With growth expected to be sluggish again in1971, the outlook was for a continued rise in unemployment in the absenceof new stimulative measures. The need to check the rise in unemployment --which is about all achievement of the government's 3 per cent growth targetcan do -- was noted by Chancellor Barber in his budget speech and undoubtedlywas a major factor in the government's decision to reflate.
The Chancellor acknowledged that inflation remains a seriousproblem but maintained -- with little evidence -- that the rapid rise inwages that has been the root-cause of inflation would henceforth slow down.He also said that, in any event, the stimulus the government was preparingto administer to the economy would not aggravate what was essentially acost-push variety of inflation. Wage earnings in 1970 rose by about 14 percent, while wholesale prices of manufactured goods and retail pricesincreased by over 8 per cent.
* Prepared by Martin J. Kohn, Economist, Europe and British CommonwealthSection, Division of International Finance.

-2 -
The balance of payments remains strong, thus permitting thegovernment to enact expansionary measures without fear of provoking asterling crisis. The current account is in substantial surplus,and heavycapital inflows into sterling in the last six months have enabled Britainto reduce its short- and medium-term external debt by $2.3 billion to about$1.7 billion, all but $56 million of it owed to the IMF. On March 31, theBritish repaid in advance $684 million of the $1.4 billion IMF drawing ofJune 1968.
Principal Stimulative Measures for 1971-72
About half of the tax relief for 1971-72 announced in the budgetspeech is to be provided directly to business. The corporate income tax,which was reduced from 45 to 42-1/2 per cent in October,will be cut byanother 2-1/2 percentage points in 1971-72. The selective employment tax(SET) -- which affects mostly service industries and requires employers topay a fixed sum per employee -- will be halved in July. The tax reductionsfor business are almost certainly designed to stimulate investment. Littlegrowth in industrial investment expenditures is expected this year, with adecline from 1970 forecast for investment in the manufacturing sector.
The largest reduction in personal taxation will result from anincrease in child allowances permitted to payers of income tax. This movewill lower revenue by an estimated £163 million in 1971-72 and by £207million on a full-year basis.
Pensions will be raised, effective September 20, with theadditional payments expected to total £560 million annually. Though mostof the increase will be financed by higher social insurance contributions,the net effect should be stimulative, given the high marginal propensityto consume of pension recipients.
In addition to the reductions disclosed March 30, the cut in thestandard rate of income tax from 41.25 to 38.75 per cent announced lastOctober will take effect April 6. In general, the standard rate appliesto the taxable income of persons with a gross annual income up to £5,500.
The cut in the standard rate was not represented, when announcedlast autumn, as a stimulative measure. It was explained as a counterpartof the reduction in government spending being made in accordance with theConservatives' long-term program for diminishing the role of the governmentin the economy, particularly in providing subsidies for welfare purposes.
The government also announced several tax reductions, allegedlyintended to promote savings and remove inequities, which will ease the taxburden of the wealthy. These measures include: a reduction in the steepprogression of marginal income tax rates, with the peak rate lowered from

- 3-
88.75 per cent to 75.4 per cent; elimination of the distinction betweenshort- and long-term capital gains, with the lower long-term rate to applyto all capital gains; and an increase in the amount of an estate that isexempt from taxes. The revenue loss from these measures is expected to besmall.
The central government expects to run a deficit of about £600million in 1971-72, and a deficit of £1.2 billion for the public sector asa whole -- which includes, in addition to the central government, localauthorities and public corporations -- is predicted. In 1970-71, the centralgovernment ran a surplus of about £50 million, while the public sector wasin deficit by about £600 million.
Monetary stringency will be relaxed in 1971-72, as is indicatedby the liberalization of the bank lending ceiling and the cut in Bank rateon April 1. The latter measure came one day after the Bundesbank reducedits discount rate by a full point and was intended at least in part to pre-vent an intensification of hot money flows into sterling as a result ofinterest differentials in favor of sterling assets. However, cutting Bankrate is consistent with the expansionary policy laid out on March 30.
The money supply will be allowed to expand at an annual rate of12 per cent in 1971-72, the same rate at which it grew from the end of Marchto the end of December. The government has thus accepted a rate of increasehitherto considered too rapid.
Long-term Tax Reform
Chancellor Barber's speech set forth plans for extensive taxreform, to be implemented for the most part two years from now. Thesereforms are intended to simplify the tax system and encourage savings, inthe interest of promoting economic growth. A value added tax is to beinstituted in April 1973, accompanied by the abolition of the SET and pur-chase taxes. The latter are excises, collected at the wholesale level, ona variety of consumer goods, with the rates varying according to categoriesof goods.
The personal income tax system is to be simplified effectiveApril 1973. A single set of progressive rates will apply to both earnedand investment income. The distinction between the two types of incomewill be retained, however, with a surtax to be imposed on investment income.But the maximum amount of investment income subject only to the basic rate oftaxation will be raised.
In the business sphere, starting in 1973 corporate income will betaxed in such a way as to remove the current incentive for corporations to
retain earnings. The method by which this objective is to be accomplishedhas not yet been determined. At present, all corporate profits are taxed atthe same rate, regardless of the amount distributed in dividends. This, theConservatives maintain, leads to inefficient allocation of capital investment.