Embed Size (px)
Citation preview

Prefatory Note The attached document represents the most complete and accurate version available based on original copies culled from the files of the FOMC Secretariat at the Board of Governors of the Federal Reserve System. This electronic document was created through a comprehensive digitization process which included identifying the best-preserved paper copies, scanning those copies,1
and then making the scanned versions text-searchable.2
Though a stringent quality assurance process was employed, some imperfections may remain. Please note that some material may have been redacted from this document if that material was received on a confidential basis. Redacted material is indicated by occasional gaps in the text or by gray boxes around non-text content. All redacted passages are exempt from disclosure under applicable provisions of the Freedom of Information Act. 1 In some cases, original copies needed to be photocopied before being scanned into electronic format. All scanned images were deskewed (to remove the effects of printer- and scanner-introduced tilting) and lightly cleaned (to remove dark spots caused by staple holes, hole punches, and other blemishes caused after initial printing). 2 A two-step process was used. An advanced optical character recognition computer program (OCR) first created electronic text from the document image. Where the OCR results were inconclusive, staff checked and corrected the text as necessary. Please note that the numbers and text in charts and tables were not reliably recognized by the OCR process and were not checked or corrected by staff.
Content last modified 6/05/2009.
CONFIDENTIAL (FR)
July 14, 1976
CURRENT ECONOMIC AND FINANCIAL CONDITIONS
By the StaffBoard of Governors
of the Federal Reserve System

TABLE OF CONTENTS
Section Page
DOMESTIC NONFINANCIAL DEVELOPMENTS II
Retail sales.................................................. 1Industrial production........................................ 3Nonfarm payroll employment.................................... 4Unemployment rate........................................... 4Personal income............................................... 4Private housing starts....................................... 4Manufacturers' inventories.................................... 8Nondefense capital goods...................................... 12State and local spending................................... 14Federal cash outlays.......................................... 14Private nonfarm hourly earnings index......................... 15Capacity utilization......................................... 15
Wholesale prices............................................. 18Consumer price index...................................... 20
TABLES:
Retail sales.................... .............................. 2Auto sales ............................................. 2Nonfarm payroll employment.................................... 5Selected unemployment rates................................... 6Unemployment rate............................................ 6Personal income.............................................. 7New private housing units.................................... 9Home sales................................. ... ........ ..... 10Business inventories......................................... 11Inventory ratios.............................................. 11New orders received by manufacturers.......................... 13Construction contracts for commercial
and industrial building.................................... 13Hourly earnings index ........................................ 16Materials capacity utilization............................... 17Consumer prices................... ..................... 19Wholesale prices............................................. 19Federal sector accounts...................................... 22

TABLE OF CONTENTS
Section
Continued
Page
DOMESTIC FINANCIAL DEVELOPMENTS III
Monetary aggregates and bank credit........................... 3Business finance.............................................. 7Other securities markets..................................... 9Mortgage market and consumer credit........................... 12
TABLES:
Selected financial market quotations.......................... 2Monetary aggregates ......................... .. ....... ........ 5Commercial bank credit...................................... . 8Security offerings............................................ 10Interest rates and supply of funds
for conventional home mortgages atselected S&L's.............................................. 13
Secondary home mortgage activity.............................. 13Consumer instalment credit.................................... 15
INTERNATIONAL DEVELOPMENTS IV
Foreign exchange markets...................................... 1U.S. banks' foreign branch activity........................... 3U.S. international transactions.............................. 7Exports...................................................... 8Agricultural exports.......................................... 8Nonagricultural exports....................................... 8Nonfuel imports.............................................. 9Bank-reported claims on foreigners............................ 9Data on private securities
transactions................................................ 10Foreign official assets...................................... 10U.S. reserve assets........................................... 10World commodity prices....................................... 11Monetary conditions in major
foreign countries............................... . .......... 15
TABLES:
Assets and liabilities of foreignbranches of U.S. banks...................................... 4
U.S. merchandise trade, BOP basis............................ 7Trade volume................................. ................. 7The Economist commodity
price index................................................. 12

TABLE OF CONTENTSContinued
Section Page
TABLES: IV
Three-month and long-term interestrates in selected industrialcountries................................................... 16
Growth of the money stock in majorindustrial countries....................................... 18

II -- T - 1July 14, 1976
SELECTED DOMESTIC NONFINANCIAL DATAAVAILABLE SINCE PRECEDING GREENBOOK
(Seasonally adjusted)
Latest Data Per Cent Change FromThree
Release Preceding Periods YearPeriod Date Data Period Earlier Earlier
(At Annual Rates)
Civilian labor forceUnemployment rate (per cent)Insured unemployment rate (%)
Nonfarm employment, payroll (mil.)ManufacturingNonmanufacturing
Private nonfarm:Average weekly hours (hours)Hourly earnings ($)
Manufacturing:Average weekly hours (hours)Unit labor cost (1967=100)
Industrial production (1967=100)Consumer goodsBusiness equipmentDefense & space equipmentMaterial
Consumer prices (1967=100)FoodCommodities except foodServices
Wholesale prices (1967=100)Industrial commoditiesFarm products & foods & feeds
Personal income ($ billion)2/
Mfrs. new orders dur. goods ($ bil.)Capital goods industriesNondefenseDefense
Inventories to sales ratio:Manufacturing and trade, total
ManufacturingTrade
Ratio: Mfrs.' durable goods inven-tories to unfilled orders
Retail sales, total ($ bil.)GAF
Auto sales, total (mil. units)2/Domestic modelsForeign models
Housing starts, private (thous.)2/
Leading indicators (1967=100)
JuneJuneJuneJuneJuneJune
7-2-767-2-767-2-767-2-767-2-767-2-76
94.67.54.5
79.018.960.1
June 7-2-76 36.1June 7-2-76 4.83
June 7-2-76 40.2May 6-29-76 150.1
MayMayMayMayMay
MayMayMayMay
JuneJuneJune
6-15-766-15-766-15-766-15-766-15-76
6-22-766-22-766-22-766-22-76
7-9-767-9-767-9-76
123.2133.9123.878.9
123.8
169.3180.6155.3178.8
182.4180.5187.5
May 6-16-76 1357.2
6-30-766-30-766-30-766-30-76
May 7-14-76May 6-30-76May 7-14-76
50.013.811.7
2.1
1.461.581.34
May 6-30-76 .838
June 7-9-76 54.0June 7-9-76 13.2
June 7-5-76June 7-5-76June 7-5-76
10.59.11.4
May 6-16-76 1,415May 6-29-76 109.2
1.1/7.3-,4.3-
.4-3.5
1.6
3.9 l/
4 .3 /7.5,4.31'1.8.5
2.2
2.2.
8.71/6.7-3.54.43.2
36.3 36.2 36.01/4.83' 4.77- 4.51-
40.213.2
8.89.9
19.710.710.8
7.111.47.05.4
5.36.04.5
40.216.5
7.95.8
11.3-1.012.7
4.82'.74.76.4
6.53.6
16.9
39.31/1.4
11.910.57.7
-4.618.0
6.14.75.08.4
5.46.43.0
9.8 9.4 11.5(Not at Annual Rates)
4.51.01.6-2.3
1.451.58-!1.31-1
.845 - /
2.73.0
4.57.1
-10.3
2.51.4
11.210.5
9.417.4
1.4711.6211.321
1.2-1.0
1.62.2-2.2
-8.53.1
26.415.413.726.2
1 621.8711.31.30-
11.16.9
20.729.3
-16.7
30.413.0
1/ Actual data. 2/ At Annual rate.
.844- .824-

II - 1
DOMESTIC NONFINANCIAL DEVELOPMENTS
There have been further signs of a moderating pace of economic
growth of late, but an upturn in consumer spending suggests that the
advance of business activity should soon pick up again. Growth in
production and employment slowed substantially in June as a result of
the recent weakness in retail sales and a build-up of nondurable goods
inventories earlier this year. Most seriously affected were production
and employment in nondurable goods manufacturing. This rapid adjustment
to rising stocks has kept inventories from ballooning, and retail sales
picked up briskly in June, following the May decline. Price and wage
developments continue to be generally favorable, but increases for fuel
and metal products pushed wholesale industrial prices up more in June
than in other recent months.
Consumer sales appear to have broken out of their recent
slump in June. The advance estimate indicates that total retail sales
rose 2.7 per cent, on a seasonally adjusted basis, with all major
categories of stores participating in the gain. The largest increase
occurred in the automotive group. Even excluding autos, the monthly
advance in sales was greater than 2 per cent. Sales at stores in the
GAF group (general merchandise, apparel, and furniture and appliances)
were up 3.0 per cent in June. In view of the recent cutback in
employment and production by nondurable goods manufacturers, the sharp
advance in nondurable goods sales--2.2 per cent--is most encouraging.
Sales at food stores and apparel stores were up well over 1 per cent;
in addition, sales at gasoline stations and general merchandise stores
were up 2.3 and 4.0 per cent, respectively.

II - 2
RETAIL SALES(Seasonally adjusted, percentage
change from previous period)
1975 1976 1976III-IV IV-I I-II Mar. April May June
Total sales 2.2 3.3 1.7 1.4 .7 -2.1 2.7
(Real*) (1.0) (3.0) n.a. (1.5) .3 -2.9 n.a.
Total, less auto andnonconsumption items 1.6 1.9 1.1 2.0 -.6 -1.0 2.1
GAF 2.8 1.4 -.1 2.1 -3.1 -.8 3.0
Durable 4.4 6.4 3.2 .0 3.7 -4.4 3.7
Auto 4.9 8.7 5.3 -1.8 5.3 -4.8 6.1
Furniture andappliances 5.1 1.0 2.0 2.4 -.1 -1.0 1.0
Nondurable 1.2 1.9 1.0 2.1 -.8 -.9 2.2
Apparel .7 2.8 -3.0 .3 -6.2 2.6 1.6
Food 1.0 2.0 .7 1.3 -1.0 .8 1.3
General merchandise 2.7 1.1 .1 2.4 -3.1 -1.7 4.0
GasoliAe -1.2 3.0 .2 .8 -.2 -1.3 2.3
Deflated by an unpublished Bureau of Economic Analysis price measure.
AUTO SALES(millions of units; seasonally adjusted annual rates)
1975 1976 1976III IV I Jan. Feb. Mar. Apr. May June
Total auto sales 9.2 9.2 10.1 9.6 10.2 10.4 10.5 10.0 10.5
Imports 1.7 1.3 1.3 1.2 1.4 1.4 1.5 1.5 1.4
Domestic 7.5 7.9 8.7 8.4 8.7 8.9 9.0 8.5 9.1
Large 4.3 4.4 5.1 4.9 5.1 5.4 5.5 5.2 5.5
Small 3.2 3.6 3.5 3.5 3.6 3.5 3.4 3.2 3.6

II - 3
Revised sales figures for April now show a gain of 0.7 per cent,
rather than the slight decline previously indicated. However, the
preliminary figure for May shows a sharper decline than reported earlier.
The net result for the second quarter as a whole is an increase in sales
of 1.7 per cent--about half the first quarter growth rate. Much of the
quarters' strength came from the automobile group, and an abnormal
decrease in auto scrappage rates in the year ending last July suggests
that replacement demand should continue strong in the near future.
Excluding autos and nonconsumer items, the second quarter gain was 1.1
per cent, down from a 1.9 per cent rise in the first quarter.
The advance in the newly revised industrial production index is
tentatively estimated to have slowed to 0.3 per cent in June--probably
reflecting repercussions of the weak retail sales in May and earlier
industrial build-ups of nondurable goods inventories. Increases in the
output of durable materials and business equipment were partially offset
by weakness in consumer nondurables and nondurable materials. Auto
assemblies rose by 1.9 per cent in June, and recently announced production
schedules call for further increases in the current quarter.
Industrial production in the second quarter increased by 7.4 per
cent at a compound annual rate--a considerable moderation from the 12.6
per cent increase of the first quarter. However, the second quarter did
show a more rapid increase in production of business equipment, which
accelerated from a 7.9 per cent annual rate rise in the first quarter to
9.7 per cent in the second. The new June index is estimated to be
about 16 per cent above its low of March 1975 and only 1-1/2 per cent
below its pre-recession high.

II - 4
The recent slowing in the pace of industrial expansion has been
paralleled by sluggish employment growth. Nonfarm payroll employment
(adjusted for strike activity) was unchanged in June after little growth in
May. Thus, two stagnant months have followed five months of vigorous
expansion. The recent weakness is most apparent in nondurable manufacturing
where widespread cutbacks caused about 50,000 jobs to be lost in the
last two months--more than 100,000 including those on strike in the rubber
industry. So far there is little discernible spillover to other
industries from this strike. The vigorous increases in durable manufacturing
employment evident between last November and April have also tapered off.
Overall, only 40 per cent of private nonfarm industries increased
employment in June--the lowest proportion in a year.
The seasonally adjusted unemployment rate rose 0.2 per cent to
7.5 per cent in June, reflecting some growth in the civilian labor force
and a decline in total household employment. However, problems with
seasonal adjustment continue to distort the picture. This years
seasonal adjustments appear to have exaggerated the decline in unemploy-
ment earlier this year and the subsequent June rise. Current dollar
personal income continued to rise vigorously in May despite the strike-
diminished growth of manufacturing wage and salary disbursements.
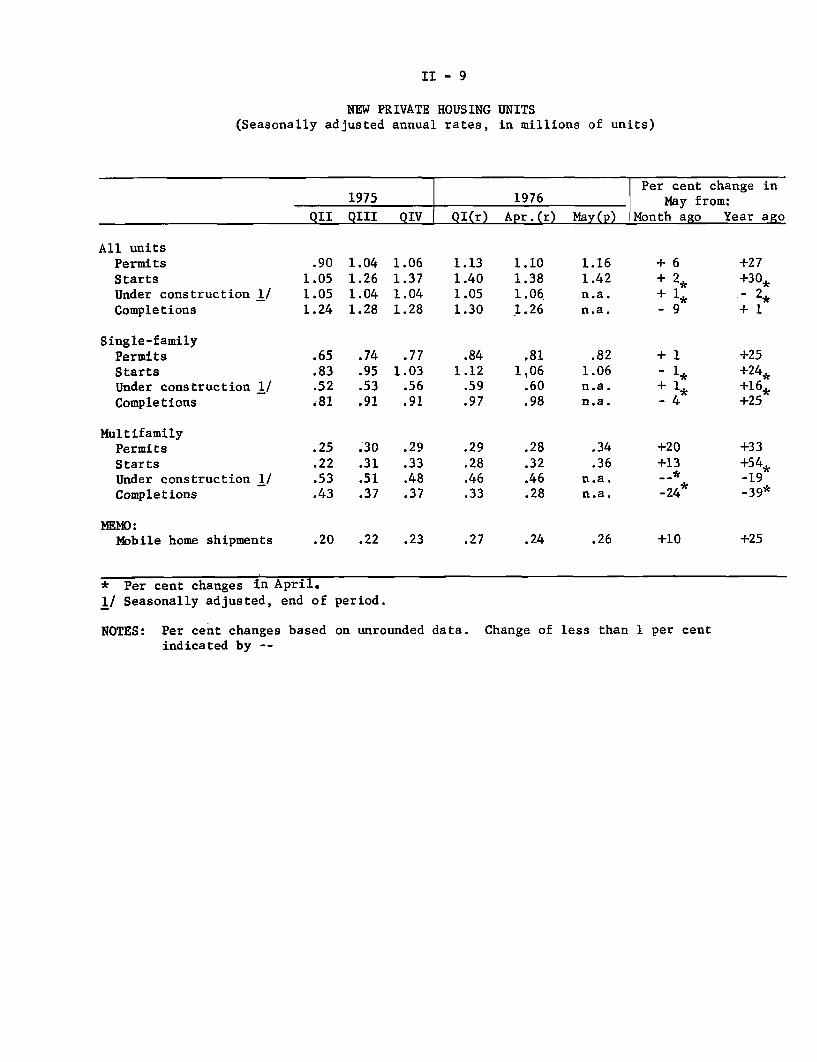
A slow rate of advance continues in the residential construction
sector. Private housing starts rose by only 2-1/2 per cent in May to a
seasonally adjusted annual rate of 1.42 million units, and for the second
quarter as a whole starts will probably average only slightly above the
1.4 million rate of the first quarter. The improvement in May was

II - 5
NONFARM PAYROLL EMPLOYMENT(In thousands; seasonally adjusted)
Average Monthly ChangeJune 75- Nov. 75- Apr. 76- Apr.- May-Nov. 75 Apr. 76 June 76 May June
Total 246.2 277.8 12.5 1.0 24.0(Strike adjusted) (238.8) (279.6) ( 47.5) (95.0) ( 0.0)
Construction 3.4 -2.0 -3.0 8.0 -14.0
Manufacturing 76.4 98.2 -36.0 -17.0 -55.0(Strike adjusted) (80.0) (98.2) (-12.5) (45.0) (-70.0)
Durable 25.2 69.4 17.5 40.0 -5.0Nondurable 51.2 28.8 -53.5 -57.0 -50.0
Trade 26.6 86.8 5.0 -9.0 19.0Services and Finance 72.6 71.0 43.5 29.0 58.0Total Government 56.8 19.8 0.5 -3.0 4.0State and Local 52.2 26.0 7.0 0.0 14.0

II - 6
SELECTED UNEMPLOYMENT RATES(Seasonally adjusted)
1974 1975 1976June May June April May June
Total 5.3 8.9 8.7 7.5 7.3 7.5
Men, 20 years and older 3.5 7.2 7.0 5.4 5.6 6.0Women, 20 years and older 5.1 8.4 8.2 7.3 6.8 7.1Teenagers 16.3 20.3 20.7 19.2 18.5 18.4
Household Heads 3.0 6.1 6.1 4.8 4.8 5.1Married Men 2.5 5.7 5.5 - 3.9 4.0 4.4
White 4.8 8.3 8.0 6.7 6.6 6.8Negro and other races 9.2 14.2 14.0 13.0 12.2 13.3
State Insured* 3.3 7.0 6.7 4.2 4.3 4.5
* Per cent of covered workers under regular State programs.NOTE: May 1975 was the specific high for the total unemployment rate.
Unemployment Rate
1975 1976Dec. Jan. Feb. Mar. Apr. May June
Adjusted by:1976 seasonal factors
1975 seasonal factors
7.8 7.6 7.5 7.5 7.3 7.5
8.3 8.0 7.8 7.7 7.7 7.5 7.4

II - 7
PERSONAL INCOME(Per cent change from preceding period, compound annual rate; seasonally adjusted)
Nov. 73- July 75- Mar. 76- Apr. 76-July 75 May 76 Apr. 76 May 76
Current Dollars
Personal Income 7.7 11.0 9.6 10.3
Wage and SalaryDisbursements 5.6 11.3 10.7 10.8
Private 4.6 12.3 12.0 11.7
Manufacturing 1.3 14.8 13.2 8.0
Transfer Payments 24.4 8.1 -9.6 -3.7
Addenda:
Total Nonfarm Income 8.5 10.9 7.8 8.0
Total Farm Income -12.2 15.2 88.7 117.8
Constant Dollars*
Personal Income -2.5 5.5 4.2 2.7
Wage and SalaryDisbursements -4.4 5.7 5.3 3.2
Addenda:
Total Nonfarm Income -1.7 5.3 2.6 .6
Total Farm Income -20.5 9.4 79.5 102.9* Deflated by the consumer price index, seasonally adjusted.
NOTE: November 1973 was the specific high and July 1975 was the specific
low for deflated wage and salary disbursements.

II - 8
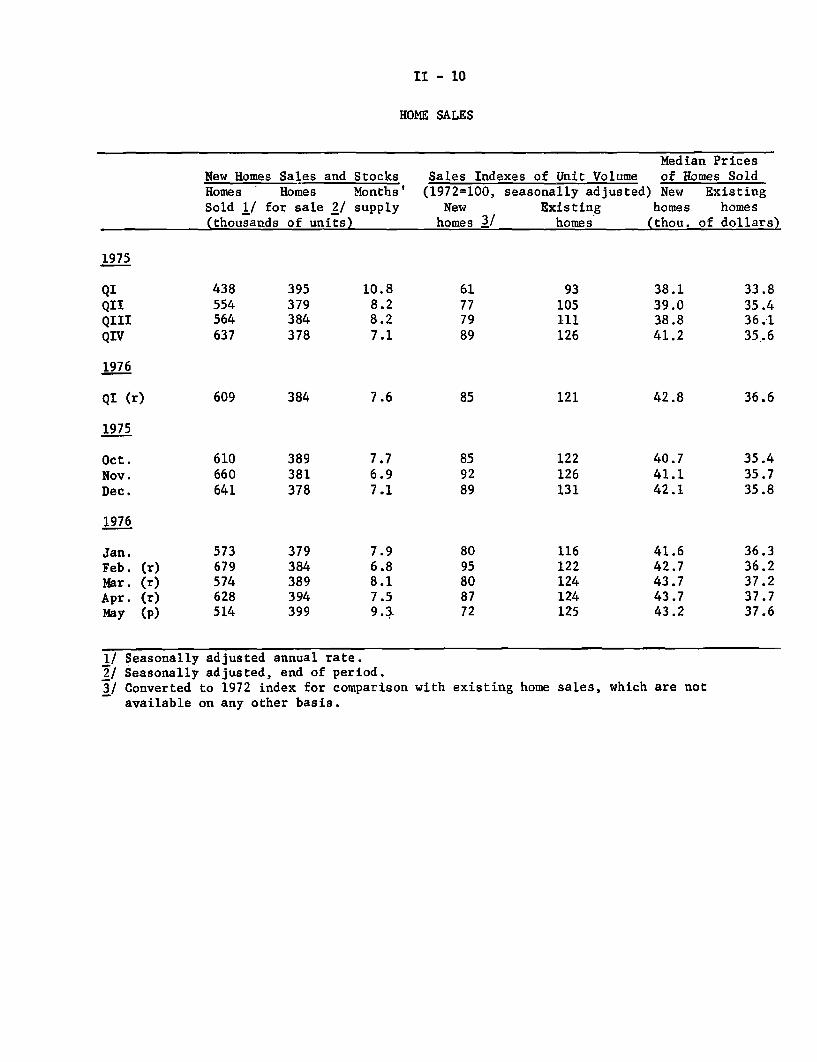
concentrated in the multifamily sector. Single-family starts remain
high despite some slippage in May. Total residential building permits
rose a bit further in May to their highest level in two years. Though
they are no longer rising, existing home sales remained quite high in
May. The more volatile series measuring new home sales fell sharply
in May; it is likely that part of the decline reflected seasonaly
adjustment problems.
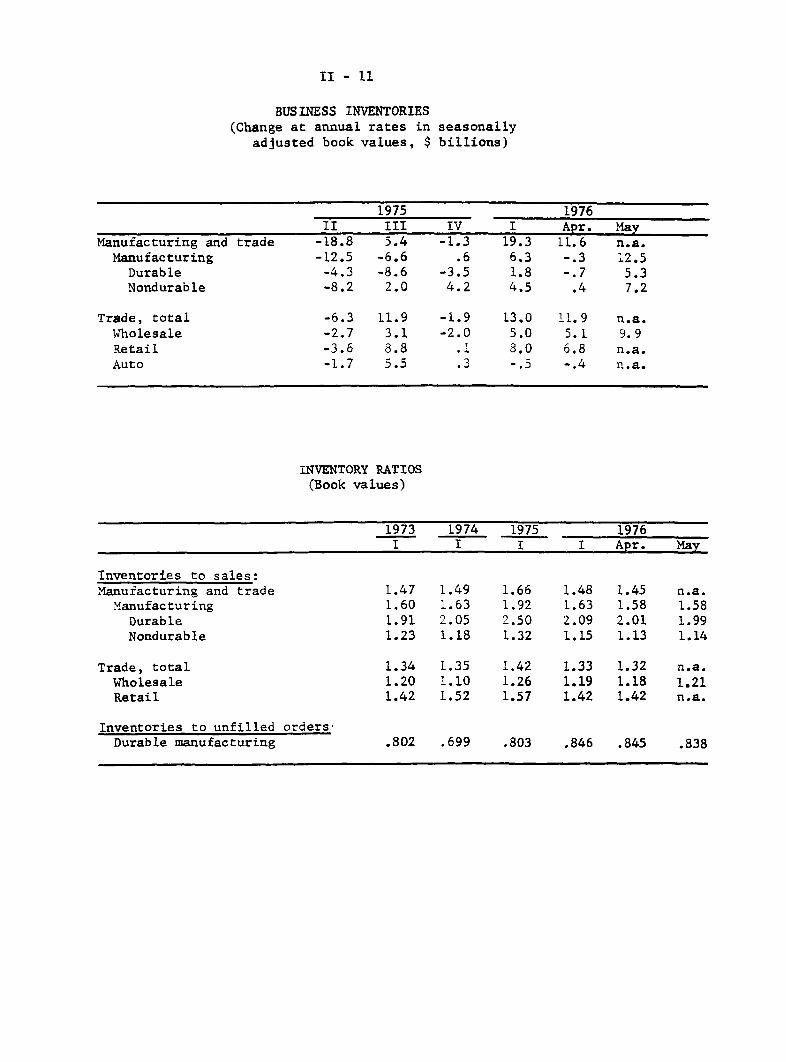
The book value of total manufacturers inventories rose at a
$12.5 billion annual rate in May after having fallen at a $0.3 billion
rate in April. The increase for the two months together was in line with
the $6.3 billion rate of rise of the first quarter. Durable stocks
resumed the accumulation seen in the first quarter after a slight April
runoff. Nondurable goods inventories also rose substantially in May
adding to the accumulation of the first quarter.
Despite the inventory accumulation in May, the inventory-
shipments ratio for manufacturers was unchanged. Thus, the slowdown
in industrial production in May and June (especially in nondurable
manufacturing) seems to reflect a continuation of conservative policies
designed to keep stocks in line with shipments. Inventories at all
stages of processing--materials and supplies, work-in-process, and
finished goods--rose in May. The book value of wholesale trade
inventories also rose sharply in May--by $9.9 billion, at an annual rate.
Retail inventory data for May are not yet available, but the sharp decline
in retail sales that month could indicate an unintended build-up in
this sector as well.
II - 9
NEW PRIVATE HOUSING UNITS(Seasonally adjusted annual rates, in millions of units)
Per cent change in1975 1976 May from:
QII QIII QIV QI(r) Apr.(r) May(p) Month ago Year ago
All unitsPermits .90 1.04 1.06 1.13 1.10 1.16 + 6 +27
Starts 1.05 1.26 1.37 1.40 1.38 1.42 + 2, +30,
Under construction 1/ 1.05 1.04 1.04 1.05 1.06 n.a. + 1 - 2,
Completions 1.24 1.28 1.28 1.30 1.26 n.a. - 9 + 1
Single-familyPermits .65 .74 .77 .84 .81 .82 + 1 +25
Starts .83 .95 1.03 1.12 1.06 1.06 - 1i +24,
Under construction 1/ .52 .53 .56 .59 .60 n.a. + 1 +16,
Completions - 81 .91 .91 .97 .98 n.a. - 4 +25
MultifamilyPermits .25 .30 .29 .29 .28 .34 +20 +33
Starts .22 .31 .33 .28 .32 .36 +13 +54,Under construction 1/ .53 .51 .48 .46 .46 n.a. -- * -19
Completions .43 .37 .37 .33 .28 n.a. -24 -39*
MEMO:Mobile home shipments .20 .22 .23 .27 .24 .26 +10 +25
* Per cent changes in April.
1/ Seasonally adjusted, end of period.
NOTES: Per cent changes based on unrounded data. Change of less than 1 per centindicated by --
II - 10
HOME SALES
Median PricesNew Homes Sales and Stocks Sales Indexes of Unit Volume of Homes SoldHomes Homes Months' (1972=100, seasonally adjusted) New ExistingSold 1/ for sale 2/ supply New Existing homes homes
(thousands of units) homes 3/ homes (thou. of dollars)
1975
QI 438 395 10.8 61 93 38.1 33.8QII 554 379 8.2 77 105 39.0 35.4QIII 564 384 8.2 79 111 38.8 36.1QIV 637 378 7.1 89 126 41.2 35.6
1976
QI (r) 609 384 7.6 85 121 42.8 36.6
1975
Oct. 610 389 7.7 85 122 40.7 35.4Nov. 660 381 6.9 92 126 41.1 35.7Dec. 641 378 7.1 89 131 42.1 35.8
1976
Jan. 573 379 7.9 80 116 41.6 36.3Feb. (r) 679 384 6.8 95 122 42.7 36.2Mar. (r) 574 389 8.1 80 124 43.7 37.2Apr. (r) 628 394 7.5 87 124 43.7 37.7
May (p) 514 399 9.3 72 125 43.2 37.6
1/ Seasonally adjusted annual rate.2/ Seasonally adjusted, end of period.3/ Converted to 1972 index for comparison with existing home sales, which are not
available on any other basis.
II - 11
BUSINESS INVENTORIES(Change at annual rates in seasonally
adjusted book values, $ billions)
1975 1976II III IV I Apr. May
Manufacturing and trade -18.8 5.4 -1.3 19.3 11.6 n.a.Manufacturing -12.5 -6.6 .6 6.3 -.3 12.5
Durable -4.3 -8.6 -3.5 1.8 -.7 5.3Nondurable -8.2 2.0 4.2 4.5 .4 7.2
Trade, total -6.3 11.9 -1.9 13.0 11.9 n.a.Wholesale -2.7 3.1 -2.0 5.0 5.1 9.9Retail -3.6 8.8 .1 8.0 6.8 n.a.Auto -1.7 5.5 .3 -.5 -.4 n.a.
INVENTORY RATIOS(Book values)
1973 1974 1975 1976I I I I Apr. May
Inventories to sales:Manufacturing and trade 1.47 1.49 1.66 1.48 1.45 n.a.Manufacturing 1.60 1.63 1.92 1.63 1.58 1.58
Durable 1.91 2.05 2.50 2.09 2.01 1.99Nondurable 1.23 1.18 1.32 1.15 1.13 1.14
Trade, total 1.34 1.35 1.42 1.33 1.32 n.a.Wholesale 1.20 1.10 1.26 1.19 1.18 1.21Retail 1.42 1.52 1.57 1.42 1.42 n.a.
Inventories to unfilled ordersDurable manufacturing .802 .699 .803 .846 .845 .838
II - 12
New Commerce data recently became available on constant dollar
inventory/sales ratios through the first quarter of the year. Viewed
in these terms, manufacturing and trade inventories are higher relative
to sales than the book value ratios had indicated. The reason for the
difference is that a large proportion of inventories is recorded in book
values at old prices which bias the value of the stock downward in periods
of inflation. In real terms, nondurable manufacturing and nondurable
wholesale inventories appear to be at about a normal level in relation to
sales. The nondurable retail inventory-sales ratio is low relative to
trend, but not as low as the book value ratio suggests. The durable
manufacturing and wholesale trade constant dollar ratios appear to be
somewhat high by historical standards, while the ratio for durables at
retail is a bit low in historical perspective.
The outlook for business fixed investment remains positive. New
orders for nondefense capital goods rose 1.6 per cent in May. This series
now has risen for five consecutive months and stands above the December
1975 level by 15 per cent in current dollars and by about 13 per cent
in real terms. In constant dollars, orders are still a fourth below their
previous peak. New orders for nondefense capital goods slightly exceeded
shipments in May, so that unfilled orders rose for the first time in
nineteen months.
Contracts data--a leading indicator of nonresidential construction
investment--suggest that the recovery in this area continues to be con-
centrated in the nonbuilding components. While the value of such construction
contracts are 18 per cent above their monthly average for 1975, contracts
for manufacturing and commercial buildings have yet to show any strength.
Building contracts (measured in square feet of floor space) were relatively
unchanged in April and May, and thusfar in 1976, the monthly average of new
contracts is only equal to the depressed level of 1975.

II - 13
NEW ORDERS RECEIVED BY MANUFACTURERS(Seasonally adjusted; percentage change from preceding period)
May 19751975 1976 1976 to
QIII QIV QI Jan. Feb. Mar. Apr. May May 19762/
Total Durable Goods
Current Dollars 7.3 1.0 7.0 .8 4.2 6.5 -.1 4.5 26.41967 Dollars 1/ 6.7 -1.6 5.5 .3 4.0 5.9 -.3 4.1 19.5
Nondefense Capital Goods
Current Dollars 1.9 0.6 1.6 1.9 3.5 2.6 5.0 1.6 13.71967 Dollars 1/ .7 -1.3 .1 1.2 3.0 2.3 4.5 1.3 7,6
1/ FR deflation by the appropriate wholesale price index.
2/ Per cent change, not at a monthly rate.
CONSTRUCTION CONTRACTS FOR COMMERCIAL AND INDUSTRIAL BUILDING(Seasonally adjusted percentage change from preceding period)
May 19751975 1976 1976 to
QIII QIV QI Jan. Feb. Mar. Apr. May May 1976
Total / -4.1 .6 -8.6 -24.1 7.5 31.4 -.7 1.3 22.2
Commercial -1. 4.5 .9 -9.2 .7 12.3 -8.7 4.9 20.9Industrial -8.0 11.8 -13.4 -30.4 24.3 -4.7 25.0 -6.8 15.0
1/ Components are seasonally adjusted by FR and may not add to total which isseasonally adjusted by Census.

II - 14
Government purchases have added only modest strength to the
recovery in recent months. Indicators of state and local spending
have sloed down after several months of healthy increases. According
to preliminary estimates, state and local employment has grown very
little during May and June. Furthermore, the value of construction
put-in-place declined in June on a seasonally adjusted basis. Never-
theless, the underlying fiscal position of the sector is improving
as the recovery brings in much needed revenues.
Recent Treasury Department data suggest that Federal cash
outlays--particularly for defense and income maintenance--ere
unusually weak in the final months of fiscal year 1975. Federal
spending on a unified budget basis is now expected to be about $368
billion, roughly $4 billion below the level forecast by the Adminis-
tration in late May and $7 billion under the Congressional
budget target. This decline in outlays partly reflects lower income
support payments. However, it also may have been due to legislation
permitting government agencies to carryover into the third quarter
unobligated balances which usually expire at the end of a fiscal
year--a one-time measure to facilitate the transition to the new
fiscal year starting date, October 1. Much of the expenditure
shortfall should be made up in the current (transition) quarter,
as agencies attempt to spend the allocated funds before the new
fiscal year begins. In addition, income support payments will be
boosted beginning in July by a 6.4 per cent cost-of-living increase
for social security recipients.

II - 15
For fiscal 1977, outlays and the deficit are now forecast
at $410 billion and $57 billion, respectively--both about $2 billion
below the levels in the last Greenbook. Downward adjustments in
income security and interest payments suggested the revision in
spending. Federal receipts are projected at $353 billion for fiscal
year 1977. The staff continues to assume that last year's tax
reductions will be permanently extended once Congress resolves the
difficult issue of tax reform. However, no revenue gains from
reform have been projected, given current legislative uncertainties.
On a full employment budget basis, our projection continues
to indicate a shift toward restraint. After registering a $6 billion
deficit in calendar year 1976, the full employment budget moves close
to balance during calendar year 1977.
Overall inflationary pressures have been less than
generally expected. Wage increases continued to be moderate during
the second quarter of 1976. The private nonfarm hourly earnings
index, which excludes the effect of interindustry shifts in employ-
ment and overtime pay in manufacturing, rose at an annual rate of
3.3 per cent in June and at a 6.3 per cent rate from the first to the
second quarter. However, earnings could easily escalate in the
second half of the year when there will be more new wage settlement
activity as well as numerous deferred and cost of living increases.
The capacity utilization series for materials which has
been expanded from 15 "major materials" to all 96 materials in the

II - 16
HOURLY EARNINGS INDEX*(Per cent change from preceding period, compound
annual rate; seasonally adjusted)
1975 1976 June 75- Dec. 75- May 76-QIII QIV QI OII June 76 June 76 June 761/
Private Nonfarm 8.6 8.3 6.4 6.3 7.0 6.4 3.3Construction 6.6 4.4 4.8 8.6 6.0 6.9 7.2Manufacturing 8.6 8.3 6.8 6.2 7.2 6.5 5.7Trade 8.7 6.4 4.7 5.5 5.8 5.7 -0.6Services 7.3 10.6 8.3 5.9 7.5 6.7 3.7Transportation &
Public Utilities 12.9 11.7 8.1 7.9 9.7 8.8 3.7
* Excludes the effects of interindustry shifts in employment and fluctuationsin overtime pay in manufacturing.
1/ Monthly change at an annual rate, not compounded.

II - 17
Materials Capacity Utilization
1973 1975 1976Qtr. High Qtr. Low QIp QIIe
Total materials 92.9 70.6 78.9p 80.2
Durable goods materials 92.3 64.4 73.1 75.4
Basic metal material 97.5 67.2 73.5 --
Nondurable goods materials 94.0* 70.0 85.7 85.2
Textile, paper, chemical materials 94.1 68.0 85.2 --
Textile materials 94.6 60.9 85.7
Paper and pulp 99.5 73.4 89.8
Chemical materials 92.7 67.2 83.8 --
Energy materials 94.1 84.3 85.3 85.4
First Quarter 1974.

II - 13
index of industrial production, was at a rate of about 80 per cent
in the second quarter. This compares to 92.9 per cent at the
cyclical high in the fourth quarter of 1973. These data suggest
that prices do not seem to be threatened by lack of capacity to
produce materials in most of the areas where bottlenecks have
previously occurred. The present rate of utilization does, however,
represent a significant recovery from the cyclical low of 70.6 per
cent in the second quarter of 1975. As with industrial production,
employment, nd inventory behavior, where exists a sharp contrast
between the ratios of capacity utilization in the durable and
nondurable materials industries. Utilization in durable goods
material plants is estimated at 75 per cent in the second quarter,
but should be rising as equipment production expands and durable
inventories increase. The spurt in the production of nondurable
goods materials early in the year brought its capacity utilization
to 85 per cent in the second quarter of 1976.
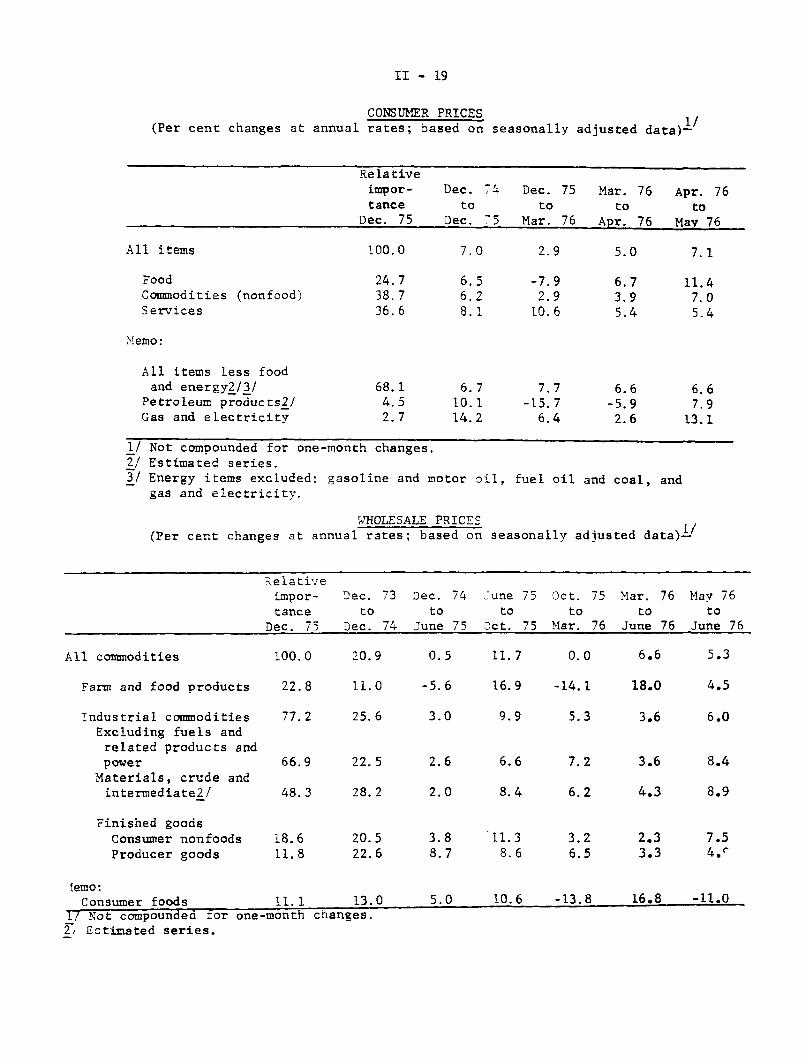
Wholesale prices increased by 0.4 per cent (seasonally
adjusted, not at an annual rate) from May to June as prices of
industrial commodities accelerated while price increases for farm
and food products moderated. Industrial commodities were up [0.5]
per cent, largely reflecting higher prices for steel mill products,
gasoline, and machinery and equipment. The third consecutive monthly
rise for farm and food products--0.4 per cent in June--reflected
increases for manufactured animal feeds, soybeans, cotton, and
II - 19
CONSUMER PRICES(Per cent changes at annual rates; based on seasonally adjusted data)1
Relativeimpor- Dec. 74 Dec. 75 Mar. 76 Apr. 76tance to to to to
Dec. 75 Dec. 75 Mar. 76 Apr. 76 May 76
All items 100.0 7.0 2.9 5.0 7.1
Food 24.7 6.5 -7.9 6.7 11.4Commodities (nonfood) 38.7 6.2 2.9 3.9 7.0Services 36.6 8.1 10.6 5.4 5.4
Memo:
All items less foodand energy2/3/ 68.1 6.7 7.7 6.6 6.6
Petroleum products2/ 4.5 10.1 -15.7 -5.9 7.9Gas and electricity 2.7 14.2 6.4 2.6 13.1
Not compounded for one-month changes.Estimated series.Energy items excluded: gasoline and motor oil,gas and electricity.
fuel oil and coal, and
WHOLESALE PRICES
(Per cent changes at annual rates; based on seasonally adjusted data)1/
Relativeimpor- Dec. 73 Dec. 74 June 75 Oct. 75 Mar. 76 May 76tance to to to to to to
Dec. 75 Dec. 74 June 75 Oct. 75 Mar. 76 June 76 June 76
All commodities 100.0 20.9 0.5 11.7 0.0 6.6 5.3
Farm and food products 22.8 11.0 -5.6 16.9 -14.1 18.0 4.5
Industrial commodities 77.2 25.6 3.0 9.9 5.3 3.6 6.0Excluding fuels and
related products andpower 66.9 22.5 2.6 6.6 7.2 3.6 8.4
Materials, crude andintermediate2/ 48.3 28.2 2.0 8.4 6.2 4.3 8.9
Finished goodsConsumer nonfoods 18.6 20.5 3.8 11.3 3.2 2.3 7.5Producer goods 11.8 22.6 8.7 8.6 6.5 3.3 4.r
lemo:Consumer foods 11.1 13.0 5.0 10.6 -13.8 16.8 -11.0
1/ Not compounded for one-month changes.T/ Ectimated series.

II - 20
coffee and cocoa. Declines for cattle, meats, fresh fruits and
vegetables, and sugar were partially offsetting.
Prices at the early stages of processing rose rapidly in
June. Crude materials (excluding food) rose 1.4 per cent, reflecting
higher prices for natural gas (lagged 2 months) and scrap metals.
The index of nonfood intermediate materials increased 0.7 per cent
as steel mill, plywood, and textile products moved up. Nonfood
consumer finished goods rose by 0.6 per cent, and the producers
finished goods index was up by 0.4 per cent.
On the consumer front, prices rose by 0.6 per cent from
April to May on a seasonally adjusted basis. This increase in the
consumer price index was more rapid than previous months this year
when food and gasoline prices dampened the over-all rise in the
index. During the first quarter declines in these items held the
rise in consumer prices to a 3 per cent annual rate. If food and
energy items are excluded, the May rate of rise is close to the
rates of the past 12 months.
Meats were responsible for most of the May increase in food
prices, reflecting earlier rises in livestock prices. Since live-
stock prices have not been increasing since April, meat prices are
not likely to rise much in the next month or two. Coffee prices
rose again in May, and price increases in commodity markets and at
the wholesale level suggest continued further pressures. Over the
past year coffee prices have risen by 35 per cent, representing
about 16 per cent of the total advance in the index for food.

II - 21
Nonfood commodity prices were also up in May. Gasoline
prices reversed their earlier 1976 declines, and apparel and other
nondurable increases were larger than those of recent months. Used
cars rose another 2 per cent from April to May. Conversely, service
price increases continued to moderate in May. This abatement reflected
the smaller rises in the medical component as well as a drop in
mortgage interest rates. In addition, the rapid increases in service
prices that reflected extraordinary adjustments in auto insurance,
public transport, and postal rates have recently diminished.

Federal Sector Accounts(billions of Dollars)
Unified budget receiptsUnified budget outlays
Surplus/deficit (-), unified budgetSurplus/deficit (-), off-budget agencies
Means of financing combined deficits:Net borrowing from publicDecrease in cash operating balanceOther 5/
Cash operating balance, end of period
Memo: Sponsored agency borrowing 6/
NIA BudgetReceiptsOutlaysSurplus/deficit (-)
High Employment surplus/deficit(-)(NIA basis) 8/9/
Fiscal Year 1 97 6e/
Admin. F.R.est.1/ Board
299.6 29.6372.2 368.0-72.6 -68.4
4/ -9.3 -8.8
Fiscal Year 1977 e/ CY 1976
Admin. Cong. F.R. F.R.est.l/ est.2/ Board Board
751.5 362.5 352.5 317.2397.2 413.3 410.0 382.9-45.7 -50.8 -57.5 -65.6-11.1 n.a. -11.1 -14.1
82.4 82.4 ).1 11. A.-7.2 -7.2 8.8 n.a.
6.7 2.0 -7.1 n.a.
14.8 14.8 6.0 n.a.
5.1 3.1 10.8 n.a.
307.4378.7-71.3
n. a.
306.4-376.0-69.6
364.7404.5-39.8
0 .3 ]/. 24.8 -. 3
.5 2.8
I F.R.B. Estimates
Calendar quarters; unadjusted data1976 _____
1* II II13/ IV
93.3
93.8-. 5
-1.5
82.1100.5-18.4-4.7
75.099.0
-24.0-4.1
1977I
77.8101.2-23.4-3.0
106.6104.0
2.6-1.0
24. I 9. 15.5 28.6 21.8 1 .0.5 -6.8 5.4 .6 -. 1 -1.1
1.8 -. 2 2.3 -1.0 4.7 -1.5
10.0 8.8 8.u 14.8
n.e.
n.a. 355.3n.a. 418.0n.a. -62.7
-8.0 i1.a. n.a.
9.4 8.8 8.9 10.0
.3 .3 .8 1.2 n.e.
326.1391.3-65.2
Seasonally adjusted, annual312.7 320.4 330.8381.3 384.7 394.9-68.6 -64.3 -64.1
rates340.6404.3-63.7
-2.3 -6.3 -11.7 -5.0 -4.9 -3.4
351.8414.4-62.5
n.e. i
360.5421.4-60.9
-4.7 -. 8
* actual e--estimated n.e.--not estimated n.a. --not available p--preliminaryTreasury statement, June 24, 1976.First Concurrent Resolution on the Budget, April 29, 1976Effective in CY 1976, the fiscal year for the U.S. Government changes from July 1 - June 30 to ) ctober 1 - September 30.Hence, 1976 QIII represents a transition quarter.Includes Federal Financing Bank, Postal Service, Export-lmport Bank, Rural Electrification and Telephone revolving fund,Housing for the Elderly or Handicapped Fund, and Pension Benefit Guaranty CorporationChecks issued less checks paid, accrued items and other transactionsIncludes Federal Home Loan Banks, Federal National Mortgage Association, Federal Land Banks,Federal Intermediate Credit Banks, and Banks for CooperativesQuarterly average exceeds fiscal year total by $.7 billion for FY 1976 due to spreading of wage base effect over calendar yearEstimated by F.R.B. staffThe high employment budget estimates now fully incorporates taxes on inventory profits beginning 1973.
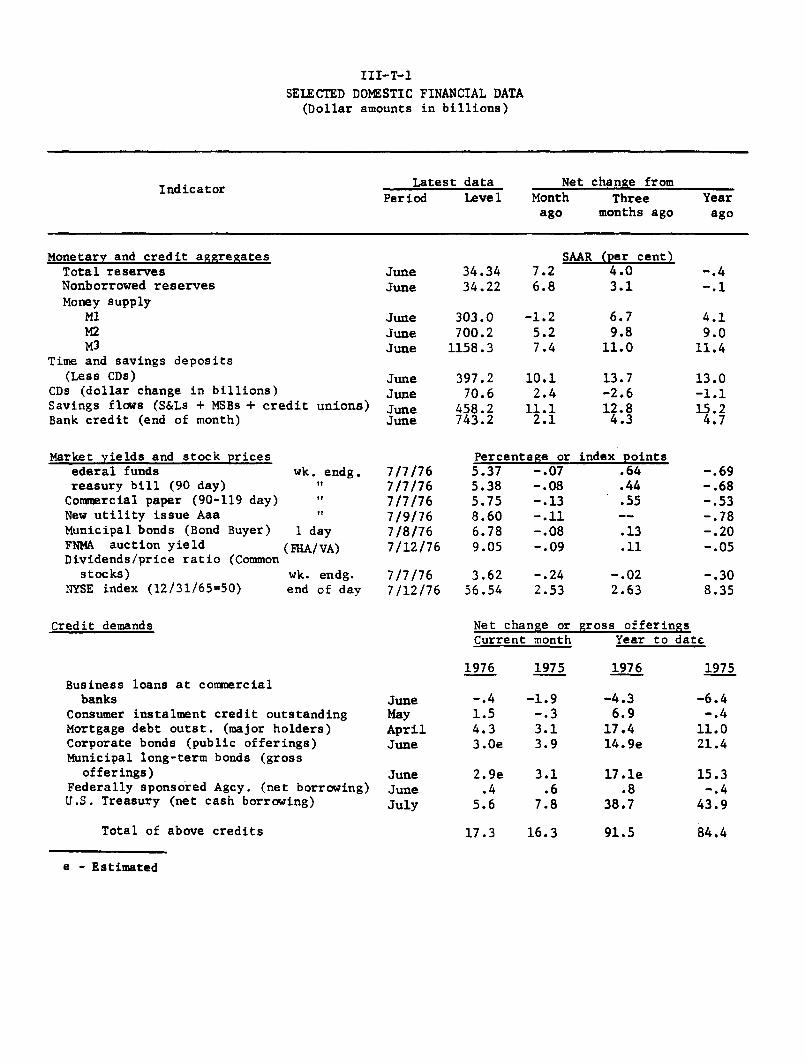
III-T-1SELECTED DOMESTIC FINANCIAL DATA
(Dollar amounts in billions)
Indicator Latest data Net change fromPeriod Level Month Three Year
ago months ago ago
Monetary and credit aggregatesTotal reservesNonborrowed reservesMoney supply
MlM2M3
Time and savings deposits(Less CDs)
CDs (dollar change in billions)Savings flows (S&Ls + MSBs + credit unions)Bank credit (end of month)
Market yields and stock pricesederal funds wk. endg.reasury bill (90 day) "Commercial paper (90-119 day) "New utility issue Aaa "Municipal bonds (Bond Buyer) 1 dayFNMA auction yield (FHA/VA)Dividends/price ratio (Common
stocks) wk. endg.NYSE index (12/31/65=50) end of day
JuneJune
JuneJuneJune
JuneJuneJuneJune
7/7/767/7/767/7/767/9/767/8/767/12/76
34.3434.22
303.0700.2
1158.3
397.270.6
458.2743.2
7.26.8
-1.25.27.4
10.12.4
11.12.1
Percentage or5.37 -.075.38 -.085.75 -.138.60 -.116.78 -.089.05 -.09
7/7/76 3.62 -.247/12/76 56.54 2.53
SAAR (per cent)4.03.1
6.79.8
11.0
13.7-2.612.84.3
index points.64.44.55
.13
.11
-.022.63
Credit demands Net change or gross offeringsCurrent month Year to date
1976 1975Business loans at commercial
banksConsumer instalment credit outstandingMortgage debt outst. (major holders)Corporate bonds (public offerings)Municipal long-term bonds (gross
offerings)Federally sponsored Agcy. (net borrowing)U.S. Treasury (net cash borrowing)
JuneMayAprilJune
JuneJuneJuly
Total of above credits 17.3 16.3
e - Estimated
-. 4-.1
4.19.0
11.4
13.0-1.115.2
4.7
-.69-.68-. 53-.78-.20-.05
-.308.35
-. 41.54.33.0e
2.9e.4
5.6
-1.9-.33.13.9
3.1.6
7.8
1976
-4.36.9
17.414.9e
17. le.8
38.7
91.5
1975
-6.4-.4
11.021.4
15.3-.4
43.9
84.4

III - 1
DOMESTIC FINANCIAL DEVELOPMENTS
Most market rates of interest have declined somewhat since
the June 22 FOMC meeting. During the early part of the intermeeting
period, market sentiment was bolstered by incoming data indicating
slow growth in the monetary aggregates--particularly M1--and a
moderating pace of expansion in economic activity. In this environ-
ment the bond markets were able to absorb a sizable volume of new
issues at stable yield levels. More recently, a downward movement
in the Federal funds rate from 5-1/2 per cent to 5-1/4 per cent,
occurring as near-term financing calendars lightened, has sparked a
rally in the money and capital markets.
Yields on short-term market instruments on balance have
fallen by about 20 to 35 basis points since the June Committee meeting,
while most bond rates have eased about 10 basis points. In the
primary market for home mortgages, the average interest rate on new
loan commitments has edged a bit higher since mid-June.
Data for the month of June confirm the emergence of several
new developments in financial flows first noted in the last Greenbook.
In addition to maintaining a strong pace of long-term financing,
domestic business firms expanded their short-term indebtedness to
a modest extent for the second consecutive month. With the rate
spread between bank and open market credit sources widening, busi-
nesses focused their demands for short-term funds in the commercial
paper market. Even so, total bank credit continued to expand slowly,
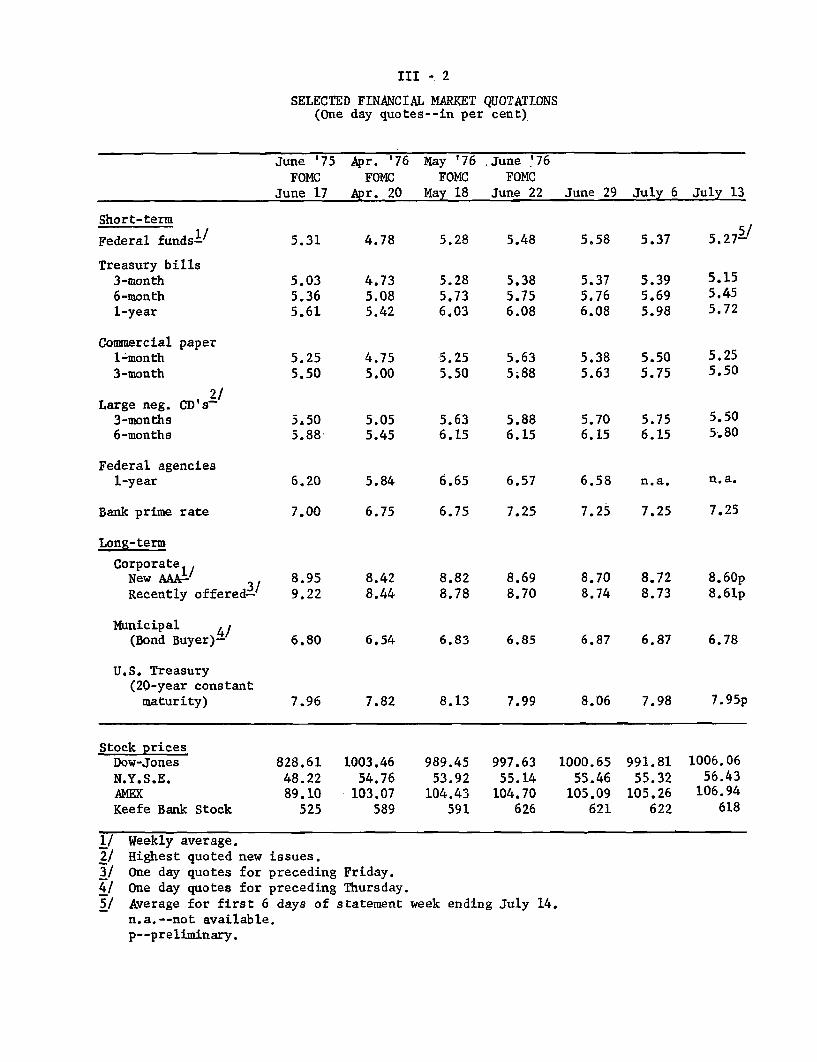
III - 2
SELECTED FINANCIAL MARKET QUOTATIONS(One day quotes--in per cent)
June '75 Apr. '76 May '76 .June '76FOMC FOMC FOMC FOMC
June 17 Apr. 20 May 18 June 22 June 29 July 6 July 13
Short-term
Federal funds-1
Treasury bills3-month6-month1-year
Commercial paper1-month3-month
2/Large neg. CD's-
3-months6-months
Federal agencies1-year
Bank prime rate
Long-term
Corporate,New AAA-Recently offered-3
Municipal 4/(Bond Buyer)-
U.S. Treasury(20-year constantmaturity)
5.31
5.035.365.61
5.255.50
5,505.88
6.20
7.00
8.959.22
6.80
7.96
4.78
4.735.085.42
4.755.00
5.055.45
5.84
6.75
8.428.44
6.54
7.82
5.28
5.285.736.03
5.48
5.385.756.08
5.25 5.635.50 5.88
5.63 5.886.15 6.15
6.65 6.57
6.75 7.25
8.82 8.698.78 8.70
6.83 6.85
8.13 7.99
5.58 5.37
5.375.766.08
5.395.69
5.98
5.275/
5.155.455.72
5.38 5.50 5.255.63 5.75 5.50
5.70 5.756.15 6.15
6.58 n.a.
7.25 7.25
5.505.80
n.a.
7.25
8.70 8.72 8.60p8.74 8.73 8.61p
6.87 6.87 6.78
8.06 7.98 7.95p
Stock pricesDow-Jones 828.61 1003.46 989.45 997.63 1000.65 991.81 1006.06N.Y.S.E. 48.22 54.76 53.92 55.14 55.46 55.32 56.43AMEX 89.10 103.07 104.43 104.70 105.09 105.26 106.94
Keefe Bank Stock 525 589 591 626 621 622 618
1/ Weekly average.2/ Highest quoted new issues.
3/ One day quotes for preceding Friday.
4/ One day quotes for preceding Thursday.
5/ Average for first 6 days of statement week ending July 14.n.a.--not available.p--preliminary.

III - 3
and banks increased their CD and reservable nondeposit liabilities--
thereby more than offsetting declines in savings accounts and private
demand deposits. Deposit growth at thrift institutions also slackened
in June, but perhaps not as sharply as did inflows to similar accounts
at commercial banks.
Monetary Aggregates and Bank Credit
M1 expanded at an annual rate of nearly 8-1/2 per cent in
the second quarter. However, since rising strongly in April, it has
fluctuated along an essentially sideways course, and the average
daily level in June was actually slightly below that in May. Although
it is impossible to account conclusively for the sluggish behavior of
M1 in May and June, a number of possible explanatory factors can be
noted. It seems likely, for example, that there has been a gradual
readjustment of cash balances to desired levels following the earlier
upsurge in M1/. Moreover, empirical money demand relations suggest
that the rise in interest rates since mid-April may have damped
monetary expansion to a minor extent. During June, M1 may also have
been depressed temporarily by deposit drains associated with what
appears to have been unusually heavy corporate reliance on asset
liquidations to finance tax payments and by a smaller than usual
bulge in Federal outlays at the end of the fiscal year. (Average
U.S. Government deposits rose $2.4 billion, seasonally adjusted, in
1/ Data on demand deposit ownership at large banks suggest thatconsumer-held demand balances--which had risen rapidly in Marchand April--declined sharply in May, while business accounts rose.

III - 4
the month.) Finally, demand deposits at commercial banks likely were
affected slightly by transfers of funds to newly-authorized checking
accounts at New York mutual savings banks; net inflows to these new
2/accounts totaled $44 million during June.2
Whatever its cause, the flatness in M1 was the major factor
behind the slowing of M2 and M3 growth to rates of 5.2 and 7.4 per
cent, respectively, in June. However, diminished inflows of interest-
bearing deposits also contributed to the reduction in the growth of
these broader aggregates. At commercial banks, savings deposits are
3/estimated to have contracted slightly on a seasonally adjusted basis.1/
This weakness evidently represents a reversal of the inflows of
interest-sensitive funds that occurred earlier in 1976; several
bankers contacted in a telephone survey reported that depositors
have shifted funds to market securities and to CD's, including large
nonnegotiable certificates that are a part of the time deposit
component of M2 . Indeed, the time deposit component of M2 (excluding
savings) increased in June at the most rapid rate in two years,
apparently reflecting the strength in large time deposits.
2/ Total demand deposits at these institutions were $101 millionat the end of June, but $57 million represented transfers frompre-existing "POW" accounts.
3/ Data from weekly reporting banks indicate that, on an unadjustedbasis, savings deposits of domestic governmental units registeredthe largest decline over the month; deposits of individuals andnonprofit institutions also posted a noticeable decline, while
business savings fell only slightly.

III - 5
MONETARY AGGREGATES1 /
(Seasonally adjusted changes)
Twelve1975 1976 months
endingHII HI QI QII May Junep June 1976
Per cent at annual rates
M1 (currency plus demanddeposits)
M2 (M1 plus time depositsat commercial banksother than large CDs)
M3 (M2 plus deposits atthrift institutions)
Adjusted bank credit proxy
Total time and savings de-posits at commercial banks
a. Other than large nego-tiable CD's
Savings depositsTime deposits
4.7 5.5 2.6 8.4 6.4
8.3 10.8 10.1 11.2
11.5 12.0 11.4 12.2 10.6
3.7 2.4 2.3 2.4 -4.6
7.3 7.1 7.8 6.2
11.4 15.1 15.9 13.7
17.0 25.8 28.3 21.77.4 6.9 6.7 7.0
1.0
11.4
18.35.6
-1.2
5.2
7.4 11.4
16.3
15.1
10.1 13.0
-0.719.0
20.77.4
Deposits at nonbank thrift
a. Savings and loanassociations
b. Mutal savings banksc. Credit unions
Billions of dollarsseasonally adjusted monthly data, not annualized)
Memoranda:
a. Total U.S. Governmentdeposits
b. Negotiable CD's
c. Nondeposit sources
of funds
0.3 0.4 1.1 -0.4-0.2 -2.1 -3.2 -0.9
0.2 -- -0.1 0.1
0.2-3.2
0.1
2.4 0.32.4 -1.1
1/ Half-year and quarterly growth rates are based on quarterly average data.
2/ Twelve months ending April 1976.
18.211.918.6
15.49.7
14.5e
15.09.1
16.8
15.310.111.7e
14.510.36.9e
12.29.26.9e
(Based on
16.910.615.8e

III - 6
Making rough allowance for the inflows of large time
deposits at commercial banks, inflows of savings and consumer-type
time deposits taken together probably weakened somewhat more at
commercial banks than at thrift institutions. Nevertheless, measured
on a month-end basis, deposit growth at savings and loan associations
and mutual savings banks fell to a 9-1/2 per cent annual rate in June
from 13-1/2 per cent in May. This is a more pronounced deceleration
than would seem explicable by the movement of market rates of interest
relative to deposit rate ceilings. An additional influence may have
been efforts of thrift institutions in some areas to moderate inflows
of high cost time deposits--possibly in response to high liquidity
levels. Press reports (confirmed by staff contacts in the industry)
indicate that, over the past several months, a number of institutions
cut offering rates, increased minimum denominations, lengthened
minimum maturities, and curtailed advertising--particularly for
longer-term accounts.
The volume of large negotiable CD's outstanding increased
$4 billion between mid-May and the end of June, on a seasonally
adjusted basis. Quarter-end window dressing appears to have con-
tributed importantly to this reversal of the earlier downtrend, but
responses to the May Survey of Bank Lending Practices provide support
for the view that some of the rise reflected positioning for an expected
strengthening of business loan demand.4/ The Euro-dollar liabilities
4/ A summary of the results of this survey will appear in an appendixto the Greenbook Supplement.

III - 7
of member banks also increased in June, and the credit proxy rose
markedly. Available information suggests that the rise in Euro-
dollar borrowings was more the result of a coincidence of special
factors than of a fundamental shift in liability management.
Total loans and investments of commercial banks increased
at a 2 per cent annual rate in June, somewhat less than in the pre-
5/ceding two months.5/ Once again, purchases of Treasury securities
accounted for nearly all of the gain; total loans increased only
marginally. Loans to nonbank financial institutions fell $900
million and those to commercial and industrial firms dropped $400
million; in addition, real estate loan growth slowed.
Business Finance
Business short-term credit outstanding rose at a 2-1/2 per
cent annual rate in June, as a large increase in commercial paper
issued by nonfinancial firms more than offset the decline in business
loans at banks. For the April-June period as a whole, business
short-term borrowing registered a modest net increase--the first
quarterly advance since late 1974. At large banks, borrowing by
trade and nondurable manufacturing firms was fairly strong in June,
perhaps reflecting inventory accumulation in these sectors.
5/ The large discrepancy between the growth rates of bank credit(2.1 per cent SAAR) and the credit proxy (16.3 per cent SAAR)apparently is attributable in part to the difference betweensingle day and daily average calculations--the increase in theproxy from the last week of May to the last week of June was$5.6 billion, as compared to the $7.0 billion change in themonthly averages. A decline in Federal funds purchases (a liabilitynot included in the proxy) and a rise in certain cash assets(not included in bank credit) appear also to have contributedsignificantly to the divergence of the two aggregates.

III - 8
COMMERCIAL BANK CREDIT(Seasonally adjusted changesat annual percentage rates)1/
1975 1976H2 HI Ql Q2 April May June
Total loans and investments2 / 4.5 4.9 5.5 4.3 5.4 5.4 2.1
U.S. Treasury securities 22.1 36.8 44.3 26.3 24.5 40.0 12.9
Other securities 2.9 -1.0 -4.1 2.2 5.9 -- .8
Total loans2 / 2.3 1.6 2.1 1.0 1.9 .7 .5
Business loans 2 / -1.7 -4.9 -7.4 -2.2 -6.2 2.1 -2.8Real estate loans 4.3 8.0 8.9 6.9 6.9 8.6 5.1Consumer loans* 5.0 n.a. 3.7 n.a. 11.0 n.a. n.a.
MEMO: Business loans plusnonfinancial commercialpaper3/ -3.5 -1.7 -5.3 1.9 -- 3.2 2.6
1/ Last Wednesday-of-month series except for June and December, which are adjusted tothe last business day of the month.
2/ Includes outstanding amounts of loans reported as sold outright by banks to theirown foreign branches, nonconsolidated nonbank affiliates of the bank holdingcompanies (if not a bank), and nonconsolidated nonbank subsidiaries of holdingcompanies.
3/ Nonfinancial commercial paper is measured from end-of-month to end-of-month.p - Preliminary.n.a. - Not available.* Data for consumer loans have not yet been revised to conform with latest revision
in consumer credit statistcs.

III - 9
The further increase in business short-term borrowing
occurred contemporaneously with a very large amount of capital market
financing. Domestic firms sold $3 billion of new bonds in the public
market during June, more than half of this total being accounted
for by offerings rated A or lower. During the earlier months of
the year, such lower-rated issues accounted for about 40 per cent
of total public offerings, but the staff expects that they will
preponderate over the remainder of 1976. The projected July and
August borrowing volumes are well below the pace of the first half;
some of this drop-off is seasonal, but conversations with under-
writers suggest that many firms--particularly the larger, higher-
rated ones--concentrated their long-term financing for this year
in the first half in the expectation that bond rates would move
upward later.
Equity financing activity, in contrast, is projected to
slow only slightly in July and August from the average pace of the
first half. Although utilities have accounted for about 60 per cent
of the volume of common and preferred stock sold thus far this year,
equity flotations by manufacturing firms have proceeded at a record
rate. The major stock price indexes recently have been near or
above their previous 1976 highs.
Other Securities Markets
As in the corporate market, some decline in the volume of
new municipal bond financing from recent high levels appears in
prospect for the third quarter. The Board staff projects July and

III - 10
SECURITY OFFERINGS(Monthly totals or monthly averages, in millions of dollars)
1975 1976Year QIV QIe; QIIe/ June e/ Julyf/ Aug.f/
Gross offerings
Corporate securities--Total
Publicly offered bondsBy quality--Aaa and AaLess than Aa
By type of borrowerUtilityIndustrialOther
Privately placed bonds
StocksBy type of issuerManufacturingUtility and transp.Other
Foreign securities
State and local governmentsecuritiesLong-termShort-term
4,471 4,362 4,523 4,666 5,500 3,700 3,100
2,717 1,939 2,444 2,533 3,000 1,600 1,400
1,4221,295
9251,432
360
776 1,480 1,160 1,1801,163 964 1,373 1,820
783 630780 1,210376 604
847 1,379
1,065950985
933 1,000 800
907 1,044 1,181 1,200 1,500 1,200
123 158598 664186 221
357 170643 1,130200 200
614 1,065
2,544 2,252 2,781 2,902 2,900 2,200 2,0002,420 2,216 1,671 2,293 2,000 1,600 1,300
Net offerings
U.S. TreasurySponsored Federal agencies
7,564 8,048187 390
7,897 2,540 4,259 5,500 5,000414 -80 929 199 -298
e/ Estimated.f/ Forecast.T/ Bonds categorized according to Moody's bond ratings.2/ Includes issues not rated by Moody's.3/ Includes only publicly offered issues of marketable securities.

III - 11
August offerings averaging a shade over $2 billion--well below the
$2.8 billion monthly average of the first half. There normally is a
summer lull in primary market activity, but it may be somewhat
accentuated this year because the funding of short-term debt that
apparently helped to boost bond issuance in the first half should
now be abating.
New York City paid down the balance of its debt to the
Treasury by the end of the fiscal year and received a new loan of
$500 million on July 1. This loan and future Federal credits are
conditioned on further austerity measures by the City and satisfactory
wage agreements with municipal unions. The offer of the Municipal
Assistance Corporation to exchange its debt obligations for out-
standing City notes--extended to July 21 following Moody's down-
grading of certain MAC issues--has elicited little response from
investors.
Since the last FOMC meeting, the Treasury has sold $2.5
billion of 5-year, 1-month notes and redeemed $800 million of maturing
3- and 6-month bills. Budget projections for the current transition
quarter are subject to greater than usual uncertainty, but net
sales of marketable Treasury obligations are likely to amount to
somewhere between $12 and $16 billion--the precise sum depending in
part on the extent to which the Treasury is willing to run down
the nearly $15 billion cash balance it held on June 30, given the
projected large deficit in the fourth quarter. The Board staff

III - 12
estimates that the Treasury will need to raise $5-1/2 billion in
the market prior to the mid-August refunding. The Treasury is
likely to continue emphasizing maturity lengthening in its debt
management, and thus it probably will meet most of its cash needs
through coupon issues.
Mortgage Market and Consumer Credit
Conditions in the residential mortgage market have been
relatively stable since mid-June. Secondary market yields generally
edged down, while the average rate on new loan commitments at S&L's
rose slightly further. Loan demand apparently continues to be strong
in many areas, and despite the recent slowing of deposit growth,
S&L's seem generally to remain willing lenders. Any discomfort they
may feel because of the deterioration in their over-all cash flows
likely is eased by the fact that their liquid assets ($34 billion
at the end of May) are high relative to their loan commitments
($22 billion), and their indebtedness to Home Loan Banks is much
reduced from the peak levels of late 1974. The mortgage portfolios
of S&L's rose $3.2 billion in May, seasonally adjusted--somewhat
less than in the preceding two months, but still a substantial figure.
Extensions of consumer instalment credit declined moderately
for the second consecutive month in May, probably reflecting the
weakness in auto sales. However, repayments fell even more, and thus
the volume of credit outstanding expanded at an annual rate of nearly
11 per cent--up slightly from the pace in April. All major categories,
save mobile home credit, contributed to the expansion.

III - 13
INTEREST RATES AND SUPPLY OF FUNDS FORCONVENTIONAL HOME MORTGAGES
AT SELECTED S&Ls
Average rate on Basis pointnew commitments change from Per cent of S&L'sfor 80% loans previous with funds in
End of period (Per cent) week short supply
1975--High 9.59 -- 66Low 8.80 -- 7
1976--High 9.10 -- 10Low 8.70 -- 0
June 4 8.78 0 111 8.83 +5 318 8.88 +5 525 8.90 +2 6
July 2 8.93 +3 n.a.9 8.93 0 n.a.
SECONDARY HOME MORTGAGE MARKET ACTIVITY
FNMA AUCTIONS OF FORWARD PURCHASE COMMITMENTS Yields on GNMAConventional Govt.-underwritten guaranteed' mortgage
Yield Yield backed securitiesAmount to Amount to for immediate
($ millions) FNMA1/ ($ millions) FNMA1/ delivery 2/Offered Accepted Offeredl Accepted
1975--High 100 51 10.02 643 366 9.95 9.10Low 11 9 8.96 25 18 8.78 7.99
1976--High 13] 91 9.31 634 321 9.20 8.44Low 33 22 9.00 58 32 8.83 8.00
June 7 8.3914 77 70 9.30 147 99 9.14 8.3421 8.3428 94 59 9.31 261 158 9.12 8.34
July 6 8.4112 91 82 9.27 148 88 9.05 8.34
1/ Average gross yields before deducting fee of 38 basis points for mortgage servicing.Data reflect the average accepted bid yield for home mortgages, assuming a prepaymentperiod of 12 years for 30-year loans, without special adjustment for FNMA commitmentfees and FNMA stock purchase and holding requirements on 4-month commitments. Mortgageamounts offered by bidders relate to total bids received.
2/ Average net yields to investors assuming prepayment in 12 years on pools of 30-yearSFHA/VA mortgages carrying the prevailing ceiling rate on such loans.

III - 14
Although more than one month's data will be needed to
assess fully the impact of the recent FTC ruling regarding the
holder in due course doctrine, the May figures on consumer instal-
ment credit suggest no more than marginal effects from the FTC
edict. The small decline in mobile home loans and some weakness
in home improvement loans are the only perceptible signs of shifting
lending patterns that might tentatively be attributed to the regula-
tory action.

III - 15
CONSUMER INSTALMENT CREDIT
1975 19761974 1975 QIV* QI* Apr.* May*
TotalChange in outstandings
$ Billions 9.0 6.9 16.0 16.3 16.6 17.7Per cent 6.1 4.4 10.2 10.0 10.3 10.9Bank share (%) 44.4 41.7 49.2 37.6 38.3 48.4
Extensions$ Billions 160.2 160.0 177.4 190.1 186.1 180.5Bank share (%) 45.4 47.1 48.3 48.9 48.3 48.0
Liquidations ($ billions) 151.1 156.4 161.4 173.8 169.5 162.8
Automobile CreditChange in outstandings
$ Billions 0.3 2.6 7.4 8.2 8.2Per cent 0.6 5.2 14.3 15.5 15.3 14.3
Extensions$ Billions 43.2 47.8 53.4 62.1 61.1 53.7New-car loans over 36 mos.as % of total new-car loans
Commercial banks 1/ 8.8 14.0 17.0 20.0Finance companies 8.6 23.5 25.4 29.5 32.3
New-car finance rate (APR)Commercial banks
(36 mo. loans) 10.97 11.36 11.24 11.17 11.08 11.01Finance companies 12.61 13.11 13.17 13.15 13.13
1/ Series was begun in May 1974, with data reported for the mid-month of each quarter.Figure for 1974 is average of May, August, and November.
* Quarterly and monthly dollar figures and related percentage changes are SAAR.

IV - T - 1
U.S. International Transactions(In millions of dollars, seasonally adjusted1/)
Merchandise exportsMerchandise importsTrade balance
Bank-reported private capital flowsClaims on foreigners (increase -)
Long-termShort-term(of which on commercial banks in
offshore center2/)
Liabilities to foreigners (increase +)Long-termShort-term
to commercial banks abroad(of which to commercial banks in
offshore centers2/)to other private foreignersto int'l and regional organizations
Foreign private net purchases (+) of U.S. Treasury securities
Other private securities transactions (net)Foreign net purchases (+) of U.S. corp. securities
(of which stocks)U.S. net purchases (-) of foreign securities
(new foreign issues of bonds and notes)
Change in foreign official assets in the U.S.OPEC countries (increase +)
(of which U.S. corporate stocks)Other countries (increase +)
Change in U.S. reserve assets (increase -)
Other transactions and statistical discrepancy (net payments (-))Other current account items
Military transactions, nedt3/Receipt of income on U.S. assets abroadPayment of income on foreign assets in U.S.Other services, netRemittances and pensionsU.S. Govt. grants3/
Other capital account itemsU.S. Govt. capital, net claims3/ (increase -)U.S. direct investment abroad (increase -)Foreign direct investment in U.S. (increase +)Nonbank-reported capital, net claims (increase -)
Statistical discrepancy
1975 1976
YEAR Q4 Q1 Mar. Apr. May
107,133 27,655 26,939 9,252 9,313 9,47998,150 25,456 28.447 9,891 9,736 9,4008.983 2.199 -1.508 -639 -423 79
-12,585 -4.585 -2.833 -2.100 3,429 -87-13,238 -5,287 -3,714 70 -2,452 -983-2,351 -943 -245 -289 -180 -258
-10,887 -4,344 -3,469 359 -2,272 -725
(-6,920) (-2,076) (-3,735) (409) (-1,577) (327)
653 702 881 -2,170 5,881 896-355 91 166 178 15 -21,008 611 715 -2,348 5,866 898-605 -992 1,034 -2,612 4,797 1,254
(1,795) (706) (-229) (-2,609) (3,888) (68)1,549 758 146 75 563 -213
64 845 -465 189 506 -1432,649 162 451 19 245 146
-3.479 -1.144 -1.481 -589 -242 -4432,727 1,217 1,026 386 135 38(3,205) (944) (942) (425) (155) (47)-6,206 -2,361 -2,507 -975 -377 -481(-7,168) (-2,573) (-2,824) (-1,039) (-475) (-560)
4.604 2.088 1.856 488 1.353 1.1355,677 1,780 1,249 807 1,441 1,068(1,469) (519) (531) (157) (256) (68)-1,073 308 607 -319 -88 67
-607 89 -773 -330 -521 -557
435 1.191 4,288 3.151 -3.841 -2732,963
-1,22318,219
-12,2122,163
-1,727-2,257
-7,128-2,027-6,307
2,437-1,231
4,602
956-160
4,709-3,039
455-433-576
-1,908-523
-1,6941,229-920
2,143
1,460-79
5,419-3,290
441-480-551
-1,746763
-1,580-689-240
4,574
1 1 t 1--48 I 1 I
MENO:41. Current account balance42. Official settlements balance
43. 0/S bal. excluding OPEC
11,945 3,155-3,997 -2,177
1,680 -397
NOTES:1/ Only trade and services, U.S. Govt. grants and U.S. Govt. capital are seasonally adjusted.
2/ Offshore centers are United Kingdom, Bahamas, Panama and Other Latin America (mainly
Cayman Islands and Bermuda)3/ Excludes certain special transactions with Israel which are recorded in Department of
Coemerce statistics as offsetting shifts between U.S. Govt. capital and both military
transactions and U.S. Govt. grants.
-48-1,083 -158 -832 -578
166 649 609 490
July 14, 1976

INTERNATIONAL DEVELOPMENTS
Foreign exchange markets. In the four weeks since the last
green book selling pressure on the pound and guilder has eased and that
on the Italian lira has been reversed. In addition new downward pressure
on the French franc and upward pressure on the yen has emerged. During
this period the trade-weighted value of the dollar has declined only a
slight 1/4 per cent. The dollar remains at roughly the same level it
reached some 3 months ago, after appreciating about 15 per cent over the
previous 12 months.
The pound has been under more or less continuous downward pressure
since early March. However, in the last two weeks this pressure has greatly
eased; , and the pound
has appreciated almost 1 per cent.
The pound's recent stability
seems to be due to expectations that (a) the U.K. government will announce
cuts in public expenditures and (b) the Bank of England will intervene
heavily to prevent the pound from falling below the $1.77-$1.78 level.
Downward pressure on the guilder has also eased recently.
the
guilder has been replaced by the Belgian franc at the bottom of the snake.
IV- 2
Since the conclusion of Italian elections on June 21, the lira
has appreciated 1.8 per cent against the dollar,
. Besides the reduced uncertainty associated
with the conclusion of the elections, the lira was also boosted by the
discussion of further financial aid for Italy at the Puerto Rican Summit.
The Japanese yen has also strengthened recently, rising 2-1/2
per cent over the last four weeks
. The main factors behind the yen's strength were reports that
the Japanese Ministry of International Trade and Investment and U.S. Treasury
officials were urging Japanese monetary authorities to allow the yen to
appreciate.
The French franc has come under selling pressure during the last
week-and-a-half -- declining 3/4 per cent against the dollar
. The weakness of the French franc is probably
due to forecasts of increased inflation, and to a growing awareness of
the impact that the current European drought will have on the French trade
balance (reduced net grain exports and increased oil imports due to a
decrease in the production of hydro-electric power).
. The Syatem purchased $26 million equivalent of Belgian francs, and,
on July 9, made a $25 million equivalent repayment on the Belgian franc
swap debt leaving an outstanding debt of $102 million. The System also
purchased $8 million equivalent of marks to hold in balances.

IV - 3
Euro-dollar interest rates have fallen about 5/8 of a percentage
point in both the 6 and 12 month maturities during the last month, and
by lesser amounts in the shorter maturities.
The gold price has drifted downward about $3.00 over the last
four weeks to a 2-1/2 year low of about $122 per ounce. The second IMF
gold auction was held on July 14 but the results are not available at
this writing. At the June 2 auction the Bank of France purchased 33,000
ounces of gold and the Swiss National Bank bought 32,000 ounces (worth
about $4 million at market prices).
U.S. banks' foreign branch activity. Assets of foreign branches
of U.S. banks, exclusive of interbranch claims within the same parent bank,
rose at a 17 per cent annual rate ($8 billion) in the first four months
of 1976 compared with a 15 per cent annual rate in the last half of 1975
and a 5 per cent annual rate ($2.1 billion) in the same period last year.
Branch loans to foreign nonbanks rose at an 11 per cent annual
rate in the first four months of the year, about the same as in the second
half of last year, although there is other evidence that overall loan
demand in several major industrial countries has strengthened recently.
Loans to nonbanks continued to be bolstered in about the same measure as
the second half of last year by branch participation in syndicated Euro-
dollar loans to borrowers in industrial countries as well as to developing
countries, which have continued this year to have heavy recourse to the
Euro-dollar market to cover payments deficits. Branch placements with
other banks, the largest asset category, rose only one-half as fast as

IV -4
Assets and Liabilities of Foreign Branches of U.S. Banks(billions of dollars; excluding accounts with other branches of parent bank)
1974 1975 1976Dec. Apr. June Dec. Apr.
Assets: total 124.3 125.4 131.5 141.4 149.5
Claims on U.S. residents: 6.9 5.8 5.5 6.7 9.1Parent bank 4.5 3.1 2.3 3.7 6.1Other 2.4 2.8 3.2 3.1 3.0
Claims on foreigners: 111.2 114.8 119.6 128.4 133.8Other banks 60.3 60.3 63.7 68.4 70.5Official institutions 4.1 4.4 4.8 5.9 7.2Nonbanks 46.8 50.1 51.1 54.1 56.1
Other assets 6.3 5.8 6.3 6.3 6.5
Liabilities: total 125.0 126.4 131.9 142.0 150..
To U.S. residents: 12.0 14.9 18.6 20.1 26.7Parent bank 5.8 8.7 12.2 12.1 14.5Other 6.2 6.2 6.4 8.1 12.2
To foreigners: 106.1 105.4 106.8 115.6 117.5Other banks 65.7 62.3 65.0 72.2 72.1Official institutions 20.2 23.2 21.1 22.8 21.8Nonbanks 20.2 19.9 20.7 20.6 23.6
Other liabilities 6.9 6.1 6.5 6.4 5.8
total branch assets. However, loans to foreign official institutions,
which arise mostly from branch participations in syndicated Euro-dollar
loans to central governments or monetary authorities, underwent a sharp
increase. Claims on U.S. residents other than the parent bank were virtually
unchanged. However, claims on the parent bank, which showed little change
between end-December and end-March, rose sharply at the end of April, when
the last working day was a Friday, in reflection of week-end Euro-dollar
operations.
IV - 5
The funding of the $8.0 billion rise in branch assets came largely
from the United States. Advances from head offices increased $2.4 billion,
after being essentially unchanged in the second half of 1975. Liabilities
to U.S. residents other than parent banks rose $4.1 billion, substantially
more rapidly than in most of last year; however, much of the increase
occurred in April when the end-month figures reflected week-end placements
of Euro-dollars by U.S. agencies and branches of foreign banks. While
liabilities to foreign official institutions were down, foreign private
nonbanks increased their deposits with the branches by $3.1 billion.
The quarterly data on the distribution of branch accounts by
country of customer show that in the first quarter of this year claims
on non-oil developing countries rose 11 per cent ($2.5 billion) to $24.0
billion, compared with a 3 per cent ($4.0 billion) rise in claims on other
countries. In particular, claims on Brazil rose 25 per cent, to $6.9 billion.
Other especially large increases in claims in the first quarter occurred
with respect to West Germany (19 per cent, to $8.9 billion), the Soviet
Union (62 per cent, to $1.0 billion), and Middle East oil-exporting countries
(16 per cent, to $2.5 billion). For the three quarter-ends for which data
are available, the geographical distribution of assets of the reporting
branches was as follows after eliminatinn of claims on other branches of
the same parent bank (in billions of dollars):

IV - 6
9/30/75 12/31/75 3/31/76
Industrial countries1/ 90.8 95.5 98.7Offshore bankingcenters2/ 17.2 17.3 18.0Developing countries:Non-oil 19.8 21.5 24.0Oil-exporting 4.2 5.4 6.0
Other and unallocated 2.4 3.1 2.6
Total 134.4 142.8 149.3
1/ Europe, Canada, Japan, South Africa, Australia, New Zealand,and United States.2/ Bahamas, Bermuda, Cayman Islands, Netherlands Antilles,
Panama, Hong Kong, and Singapore.

IV - 7
U.S. International Transactions. The U.S. merchandise trade
balance was a small surplus in May-the first surplus in five months.
For April and May combined the merchandise trade deficit was $2.1 billion
(seasonally adjusted annual rate, balance of payments basis), down from
the $6 billion first quarter deficit rate. The smaller than expected April-
May deficit was largely due to the strong performance of agricultural and
non-agricultural exports.
U.S. Merchandise Trade. Balance-of-Payments Basis(billions of dollars, seasonally adjusted annual rates)
19 75 r 1 9 7 5 1 9 7 6April
Year 1Q 2Q 3Q 1Qr & May April May
EXPORTS 107.1 108.1 103.4 106.4 110.6 107.8 112.8 111.8 113.7Agric. 22.3 24.3 19.6 22.3 23.0 21.3 23.2 22.6 23.7Nonagric. 84.9 83.8 83.8 84.2 87.7 86.4 89.6 89.1 90.0
IMPORTS 98.2 102.3 90.4 98.0 101.8 113.8 114.8 116.8 112.8Fuels 28.5 27.8 26.7 30.0 29.5 31.9 34.4 38.8 30.0Nonfuels 69.6 74.5 63.7 68.0 72.3 81.9 80.4 78.0 82.8
TOTAL BALANCE +9.0 +5.7 +13.0 +8.4 +8.8 -6.0 -2.1 -5.1 +0.9
Trade Volume(1975 = 100)
EXPORTS 100 100 96.5 100 103 99.6 103 103 103Agric. 100 100 87.8 103 108 102 112 110 115Nonagric. 100 100 98.9 99.1 102 98.7 101 101 101
IMPORTS 100 103 90.1 101 105 116 115 117 113Fuels 100 96.9 93.8 108 102 105 112 129 94.4Nonfuels 100 106 88.9 99.4 106 120 115 112 118
I, I__________________ I____________
NOTE: Details may not add to totals because of rounding.

IV - 8
Exports in April-May were $113 billion at an annual rate, 5
per cent above the first quarter rate but only 2 per cent greater than the
fourth quarter of 1975. The volume of exports in April-May recovered to
the fourth quarter 1975 level.
Agricultural export volume continued to be very strong in May
as corn and soybeans exports again rose due to increased exports to Western
Europe and the Soviet Union. Volume will remain high as drought conditions
persist in Western Europe and further Russian purchases of grain are
expected under the U.S.-U.S.S.R. grain agreement. In addition, the Soviet
Union has recently purchased nearly 2.5 million metric tons of soybeans,
not covered by the agreement, from U.S. firms. Most of these soybeans
are expected to come from the 1976 U.S. crop. Corn and wheat prices rose
about 10 per cent and soybean prices 40 per cent between May 1 and July 1,
and export prices will reflect these increases.
Nonagricultural exports were at an annual rate of $90 billion
in April and May combined. Volume rose to a level near that of the fourth
quarter of 1975 and 2.5 per cent higher than in the first quarter of 1976.
Virtually all major export categories registered increases in April-May over
the first quarter of 1976. Exports of capital goods and nonagricultural
industrial supplies were especially strong, a trend which may continue as
Western Europe and Japan extend their recovery from the recession. However,
new export orders declined in May and exports to non-OPEC LDC's remained
somewhat below 1975 levels.

IV - 9
The average April-May value of imports was $115 billion at
an annual rate, one per cent above the rate in the first quarter of 1976.
While the level of fuel imports fluctuated widely from April to May, the
combined April-May value, $34.4 billion at an annual rate was up by 7.8
per cent from the first quarter, in line with the rate of economic
expansion in the United States and the decline in domestic production.
The April-May volume of fuel imports averaged 7.2 million barrels per day
(vs. 6.9 million barrels per day in the first quarter of 1976).
Nonfuel imports in April-May averaged $80.4 billion at an
annual rate, slightly lower than the rate in the first quarter of 1976.
Imports in a number of categories had picked up much more sharply than U.S.
production and consumption earlier, and a pause was anticipated as this
apparent swing in inventory adjustment ran its course. With continuing
domestic expansion, nonfuel imports should soon resume an upward trend.
Bank reported claims on foreigners increased by about $1 billion
in May, bringing the total increase in January-May to $7.2 billion. Much
of the May increase was in claims on Latin America. Liabilities to private
foreigners reported by banks increased about $900 billion in May; for the
January-May period the increase in such liabilities was about $7.7 billion
-- slightly more than the increase in claims for those months. So far
this year the pace of lending to foreigners by U.S.-based banks has been
a little higher than last year's rate, but there has been a much larger
increase in liabilities to foreigners in January-May this year than in 1975.

IV - 10
Data on private securities transactions other than U.S. Treasury
obligations showed net U.S. purchases of foreign securities exceeding
foreign net purchases of U.S. securities by $400 million in May, about the
same rate of outflow as in January-April. The list of issuers of foreign
bonds in the U.S. market expanded, with Brazil and Japan added to the
usual Canadian and European borrowers. Interest rate increases in May
caused the postponement of at least one large new foreign bond issue in
in the United States. Relatively few new foreign bonds were issued in
June, but several large issues are scheduled for July, including a $750
million issue by the World Bank and $600 million by Canadian utilities.
Foreign official assets in the United States increased by $1.1
billion in May, after increasing by $1.4 billion in April. OPEC countries,
notably Saudi Arabia and Iran, accounted for virtually all the increase in
both months. The April-May total was already double the amount these
countries acquired in the first quarter of 1976. Factors behind this surge
were increased oil revenues, lessened attractiveness of sterling assets,
and U.S. interest rates that were higher than earlier in the year. Non-
OPEC foreign official holdings in the United States were almost unchanged,
although there were substantial changes reported for individual countries.
United States reserve assets increased by $273 million, largely
owing to an increase in the U.S. reserve position with the I.M.F. as others
drew dollars.

IV - 11
World Commodity Prices. World commodity prices have recovered
rapidly from low levels of late 1975. By June 22, the Economist dollar
index of commodity prices, which weights commodities by their value in
OECD imports, had risen by 28 per cent over its cyclical quarterly low
in the fourth quarter of 1975. The overall index, shown in the first
column in Table 1, is now 6 per cent above its cyclical quarterly peak
in the second quarter of 1974. The food, feed and beverage price
component of the composite index is higher now than in the first
half of 1974, while the industrial raw materials component is still
far below the levels reached then.
The general price level in the United States, as measured
by the GNP deflator, has risen by 17 per cent during the period in
which these commodity prices fell and then recovered. The relative
price of commodities, constructed by dividing the Economist dollar
price index by the GNP deflator, has increased by 24 per cent from
its cyclical quarterly low in the fourth quarter of 1975 and stands
at 90 per cent of the quarterly peak reached in the second quarter
of 1974. For most commodities, the recent price increases can be
traced to higher rates of consumption associated with increases in
real income or significant decreases in supply rather than to
speculative demand such as occurred in the 1973-1974 price runup.
The Economist food price index, which might better be
called a food, feed and beverage price index, has a weight of 61 per

IV - 12
Table 1
The Economist Commodity Price Index
1970=100
All Items
1973 - 1
- 2
- 3
- 4
1974- 1
- 2
- 3
- 14.
1975- 1
- 2
- 3
- 4
1976- 1
- 2
June 29, 1976
160.3
191.0
213.3
21S.1
240.1
249.3 H
235.5
240.9
217.1
207.3
210.4
205.4 L
213.7
245.0 P
263.3 P
H: quarterly high ofL: quarterly low ofe: estimatedP: provisional
Food Total
163.0
200.0
232.9
222.6
253.3
264.7
200.5
311.7 H
265.7
24 3 .3L
250.1
243.7
257.u
206.5 P
310.2 P
Industrial Raw 1-iaterial
150.6
170.0
200.1
212.3
223.9
230.011
179.3
152.3
14C.4
150.2
147.3
144.66 L
1-3.41
177.4 P
187.4
index of 1973 orindex of 1975
United StatesFibers Ietals GNP deflator
1970 = 100259.4
272.1
300.5
29C0.
296.9
264.0
237.9
199.2
197.3
209.3
202.0
207.1
22C.6
23. P
264.7 P
1974
100.3
122.0
150.4
169.3
184.7
216.7d
150.3
125.0
121.5
117.6
113.1
107.2 L
112.
136.3
140.7 P
112.7
144.7
116.3
119.3
122.2
125.1
123.0
133.0
135.4
136.3
139.2
141.5
142.
144.7 e
145.8 e
Quarterly figures are averages of weekly data.

IV - 13
cent in the composite index. It is less than one per cent below its
all-time quarterly hi h at the end of 1974, whereas the (deflated)
relative food price index is currently 10 per cent below its quarterly
peak, which was also in the fourth quarter of 1974. The commodities
whose prices are given the largest weights in the food index
are coffee, sugar, beef, soybeans and soybean meal, corn and wheat.
The price of coffee has more than doubled following the July 1975
frost that destroyed millions of coffee trees in Brazil. (It will
be 1979 or 1980 before world coffee production again reaches 1974
levels.) Sugar, soybean, corn and wheat prices have risen recently,
partly because of the drought in Western Europe. (Sugar prices,
however, are still far below levels recorded in the speculative
bubble of 1974.) Soybean prices have also risen because American
farmers are reported to have planted 10 per cent fewer acres of
the crop and because Brazilian soybean exports have been smaller
than expected. Beef prices are currently lower than in 1975 as
lower feed costs and higher beef prices induced cattle feeders
to increase production.
The industrial raw materials index has increased by
31 per cent over its quarterly low in 1975 but is still well below
its quarterly peak in 1974. The relative price of industrial raw
materials, as measured by the deflated index, has increased by 24
per cent over its quarterly trough in 1975. Prices of commodities

IV - 14
classed as industrial raw materials have risen less sharply and more
uniformly across commodities. An exception is cotton prices, which
have exceeded levels reached in late 1973 and early 1974, reflecting
possible crop damage by bad weather in cotton producing regions of
the United States and fears of a poor Soviet cotton crop, together
with stronger demand associated with the recovery from world
recession.
The record high volume of futures trading at U.S. markets
in June may be evidence that commodity speculation has recently
increased. It is difficult, however, to distinguish hedgers from
speculators in such markets; and hedging would be expected to
increase as the volume of economic activity picks up. Some British
investors, as a way of avoiding exchange controls, used sterling to
buy futures contracts on the London Metal Exchange in April and May
as the pound was falling. While this gave them a method of hedging
against future pound depreciations, it may have temporarily caused
not only the pound-denominated but also the dollar denominated
prices of copper and zinc to increase faster than supply and demand
conditions would justify. (The Bank of England threatened to move
to halt what it saw as "speculative trading" in any commodity on
the London Metal Exchange when speculative transactions accounted
for more than 30-35 per cent of total business.) Nonetheless, there
is no convincing evidence yet that speculators have had a major
effect on commodity prices in 1976.

IV - 15
Monetary conditions in major foreign countries. Evidence is
increasing that monetary authorities abroad are beginning to shift to
a somewhat more restrictive policy posture. This shift reflects two
factors. First, economic activity in the industrial countries has
been recovering more strongly than had previously been expected. Second,
a high degree of liquidity had been generated in most countries, due
partly to earlier fairly easy or at least accomodative monetary policies
and, in some countries -- especially Switzerland -- to increases in
official foreign reserve assets. The conjunction of a strong economic
recovery and a high degree of domestic liouidity, at a time when rates
of price increase remain high and government deficits are still large,
has created fears of an intensification of inflation. At the same
time, however, the shift toward restriction is likely to remain modest
in most cases, given that unemployment levels remain high and are not
expected to come down quickly, and investment has not yet recovered.
The shift toward more restrictive monetary policies abroad
is indicated by an upward movement of interest rates and a slowing in
the growth of money stocks, and by the policy actions adopted. As
shown in the following table, 3-month interest rates in several countries
are higher now than they were three months ago. In Canada, where a
restrictive policy adopted last fall raised interest rates earlier in
that country than elsewhere, interest rates have been declining since
March. In Italy, where interest rates were raised sharply earlier this
year in response to exchange-market pressure, there has been a sizable
decline in rates in July, though the level of rates remains extremely

3-MONTH AND LONG-TERM INTEREST RATESIN SELECTED INDUSTRIAL COUNTRIES
(Per cent per annum or percentage points)
Level: Change during month: Total changeend-March Apr. May June July 1976 since Level
3-MONTH RATES end-1975 1976 1976 1976 1976 (to date) end-March Latest
Canada 9.25 10.38 -0.75 0 -0.13 0 -0.88 9.50 (7/13 )France 6.50 7.63 0.12 0.38 -0.13 -0.06 0.31 7.94 (7/13)Germany 4.20 3.70 -0.20 0.20 0.80 -0.20 0.60 4.30 (7/14)Italy 7.63 18.25 -0.75 1.63 1.75 -3.00 -0.37 17.88 (7/13)Japan 8.25 7.75 -0.50 0 0.50 0 0 7.75 (7/14)Switzerland 2.75 1.25 -0.12 0.50 -0.75 0.12 -0.25 1.00 (7/14)United Kingdom 10.81 8.75 2.00 0.75 -0.31 0 2.44 11.19 (7/13)United States 5.25 5.00 0 0.63 -0.13 0.13 0.63 5.63 (7/7)
LONG-TERM GOV'T.BOND YIELDS 2/
Canada 9.51 9.48 -0.14 -0.02 0 0.03 -0.13 9.35 (7/2)France 9.91 9.98 0.05 -0.05 0.15 -0.09 0.06 10.04 (7/4)Germany 7.74 6.52 0.12 0.31 0.18 0.12 0.73 7.25 (7/7)Italy 11.37 12.37 0.73 0.20 0.20 n.a. 1.13 13.50 (6/30)Japan 9.02 8.71 -0.03 0.09 0 n.a. 0.06 8.77 (6/30)United Kingdom 14.48 13.75 -0.27 0.38 -0.18 0.05 -0.02 13.73 (7/9)United States 8.03 7.89 0.05 0.23 -0.15 -O.04 0.06 7.96 (7/13)
1/ The short-term rates quoted are generally 3-month rates: interbank rates for France, GermanyItaly, and the United Kingdom; the finance company paper rate for Canada; and the CD rate for theUnited States. For Japan, the rate on paper of 2-month or greater maturity is quoted.2/ The long-term rates quoted are all government bond yields -- mostly composite yields. For theUnited States, the 20-year constant maturity yield is quoted.

IV - 17
high (as, of course, does the expected rate of inflation). In contrast,
interest rates in Switzerland, where purchases of foreign exchange by
the Swiss National Bank have contributed to a high degree of liquidity,
remain very low.
Strengthening demand for credit seems to be exerting upward
pressure on interest rates in several countries, especially in Germany
and France. In the United Kingdom, private demand for credit has also
strengthened in recent months, but the upward pressure on interest rates
has been counteracted by other factors. In Japan, a strengthening of
credit demand halted the decline in interest rates and helps to explain
some increase in rates since the end of April.
In Germany and Japan, the pattern of movement in long-term
interest rates has reflected the movement of short-term rates; in
both countries the earlier decline in bond yields was halted, and was
significantly reversed in Germany. With the exception of Italy, where
yields rose sharply from already-high levels, bond yields in other
countries have shown little net change since the end of iiarch. It may
be that a downward revision of long-run expectations of inflation has
offset the general tendency for interest rates to rise.
The growth of the money stock in major foreign countries is
shown in the next table. Rates of growth of both narrowly- and broadly-
defined money have tended to be slower in recent months than in previous
months -- quite a bit slower in France, Japan, and the United Kingdom.
Growth of the broader money stock in Canada is the major exception;
but the underlying growth rate of [Canadian M1] has declined from the

GROWTH OF THE MONEY STOCK IN MAJOR INDDUSTRIAL COUNTRIES(percentage change; seasonally adjusted)
Change from Change from Change fromFebruary 1976 to November 1975 to May 1975 to
May 1976 February 1976 May 1976
Canada M1, -1.4 -2.4 10.4
M2 5.1 3.8 20.0
France M 3.31 .6.01/ 20.21
M2 3.1 5.2 20.3
Germany M1 1. 1.9 12.0
M2 0.9 0.9 5.5
1/ I. 1Japan M11 2.9 7.1 13.2
M2 3.31/ 4.51/ 15.41 /
Switzerland 11 0.91' 2 ' 5.51/' 7. '1/2/
United Kingdom M1 2.7 5.0 14.8M3 2.3 2.5 8.9
United States M1 1.73 / 1.1 ' 4.13/S2.5 2.9S3 9.03 /
Various national sources. Data on the Italian money stock are available only throughJanuary, and are therefore not presented.
1/ Changes shown are from January to April, October to January, and April to April, respectively.2/ Not seasonally adjusted.3/ Changes shown are from March to June, December to March, and June to June, respectively.

IV - 19
high levels of late last year and is now near the bottom of the 10-15
per cent target range announced by the Bank of Canada last November.
The Bank of Canada has indicated that it may lower that target range
"before long."
Many countries have been acting either to reduce what is deemed
to be excessive domestic liquidity or, at least, to stop liquidity from
increasing further. Swiss authorities evidently face the most difficult
problem. In order to moderate the upward movement of the Swiss franc,
Swiss authorities have intervened heavily in the exchange market. To
offset the liquidity generated by sizable official purchases of foreign
exchange, the Swiss authorities have: (1) encouraged capital outflows
(including a 2-1/2 year, 750 million Deutsche-mark -- $290 million --
loan by Swiss banks to Germany); (2) issued long-term bonds to finance
future government deficits, and sterilized the proceeds, and (3) announced
an increase in minimum reserve requirements against foreign liabilities,
from 10 to 65 per cent (effective July 26). It remains to be seen
whether even these measures can hold the growth of M1 down to the 6 per
cent target rate this year.
Japanese authorities have also been faced with the choice
between increasing foreign exchange reserves -- and consequent liquidity
creation -- or an unwanted appreciation of the exchange rate. The
Ministry of Finance reacted by reducing the ceiling on term loans
("impact" loans) that Japanese firms are allowed to draw from foreign
banks, and by lowering the ceiling on the amount of bonds issued overseas
IV - 20
by Japanese firms. However, the ceiling on new loans ("window guidance")
by the Japanese city banks, recently announced for the third quarter,
appears to be no more restrictive than in previous quarters.
The French Government recently issued a 2-1/2 billion French
franc ($1/2 billion) 15-year bond to soak up liquidity; the issue was
fully subscribed the first day (2/3 by private nonbanks), and another
such issue is being considered for the fall. It is reported that French
banks generally have no margin now remaining under their credit ceilings,
so those ceilings may begin to bite; current credit ceilings imply
slightly more than a 7 per cent annual rate of growth of credit in the
second half of this year, compared with a 9-1/2 per cent growth rate
allowed in the first half (with actual growth presumably being somewhat
higher due to the elimination of spare margins within the ceilings).
The German Government renewed, on July 1, its sales of one-to-
two year Treasury bonds, which had been suspended last November, and of
longer-term Federal debt, new sales of which had been dormant since
April. Reserve requirements for commercial banks were raised by a total
of 10 per cent in two stages (May 1 and June 1); the Bundesbank character-
ized this move as being designed merely to offset a decline in Government
deposits at the Bundesbank. According to Bundesbank officials, they
are currently "on target" so far as their 1976 target for 8 per cent
growth of "central bank money" is concerned.
In some of the smaller countries, as well, restrictive monetary
policies have been adopted primarily for domestic reasons, i.e., to

IV - 21
reduce the potential for inflationary monetary growth. In Sweden, the
discount rate was raised on June 3, from 5-1/2 to 6 per cent. Banks'
required liquidity ratios were effectively raised, by enlarging the
base against which these ratios apply, and a proposal was made to apply
the ratios to financial institutions other than banks. This tightening
was anticipated in January, when the Riksbank recommended that banks
reduce the growth of credit. In Norway, a gradual increase in banks'
required holdings of bonds and of primary reserves was announced in June.
Discount rates were raised in the Netherlands on June 1 and again on
June 18 -- each time by 50 basis points; the basic rate now stands at
5 per cent. These discount rate changes were described as an adjustment
to higher domestic market rates, though the authorities also wanted to
help resist downward pressure on the exchange rate for the guilder.
In other countries, external considerations have dominated
monetary policy decisions. Responding to extreme downward pressure on
the lira, Italian authorities acted to reduce the monetary base, which
had risen in large part because of the sizable government deficit. On
May 6, they imposed a temporary import-deposit scheme and, on June 4,
announced an increase (from 30 to 42 per cent) in the portion of the
growth of banks' deposit liabilities that must be invested in government
securities. The money market tightened severely, and interest rates
rose sharply. More recently, however, monetary conditions have
eased significantly, reflecting Italy's success in reversing capital
flows and the Bank of Italy's purchases of Treasury bills.

IV - 22
Interest rates in Britain rose sharply in April and May, when
the exchange rate for sterling was under severe downward pressure. The
Bank of England's Minimum Lending Rate was raised by 150 basis points
on April 23 and by another 100 basis points on May 21; it now stands
at 11.50 per cent. The Bank renewed its sales of gilt-edged securities,
which had been suspended in January, and engaged in some spot sales and
forward purchases of dollars (which are analagous to open-market sales
of domestic securities under repurchase agreements). Some strength
in sterling lending to the private sector in the latest 2-3 months
has added to upward pressure on British interest rates. In contrast,
signs of success in reducing the still-high rate of inflation, improving
prospects of a lower public sector borrowing requirement, and reduced
speculation against sterling, help to account for the slightly easier
conditions in financial markets since the end of May.
In Denmark there is a severe credit squeeze. Many banks are
exceeding their credit ceilings and therefore must place an amount equal
to the excess in a non-interest-bearing account at the National Bank.
Thus, Danish firms are being forced to borrow abroad, which is the
major objective of the tight monetary policy, given the large Danish
current-account deficit.