Embed Size (px)
Citation preview
Prefatory Note
The attached document represents the most complete and accurate version available based on original copies culled from the files of the FOMC Secretariat at the Board of Governors of the Federal Reserve System. This electronic document was created through a comprehensive digitization process which included identifying the best-preserved paper copies, scanning those copies,1 and then making the scanned versions text-searchable.2 Though a stringent quality assurance process was employed, some imperfections may remain.
Please note that this document may contain occasional gaps in the text. These gaps are the result of a redaction process that removed information obtained on a confidential basis. All redacted passages are exempt from disclosure under applicable provisions of the Freedom of Information Act.
1 In some cases, original copies needed to be photocopied before being scanned into electronic format. All scanned images were deskewed (to remove the effects of printer- and scanner-introduced tilting) and lightly cleaned (to remove dark spots caused by staple holes, hole punches, and other blemishes caused after initial printing). 2 A two-step process was used. An advanced optimal character recognition computer program (OCR) first created electronic text from the document image. Where the OCR results were inconclusive, staff checked and corrected the text as necessary. Please note that the numbers and text in charts and tables were not reliably recognized by the OCR process and were not checked or corrected by staff.

Confidential (FR) Class II FOMC
January 27, 1982
RECENT DEVELOPMENTS
Prepared for the Federal Open Market CommitteeBy the staff of the Board of Governors of the Federal Reserve System

TABLE OF CONTENTS
Section Page
DOMESTIC NONFINANCIAL DEVELOPMENTS II
Industrial production ........................................... 1Employment and unemployment..................................... 5Consumer spending and personal income............................ 7
Housing........................................................... 9Business fixed investment....................................... 13Inventory investment............................................ 15
Federal government.............................................. 17
State and local government........................................ 18Wages .................................... ......... ............... 19
Prices...................................... .................... 21
TABLES:
Industrial production........................................................ 2
Capacity utilization rates...................................... 2Changes in employment........................................... 4
Selected unemployment rates..................................... 4Retail sales . . . .................................... .............. 6Auto sales................... .................................... 6Personal income ....... .................. ........................ 8
Private housing activity........................................ 10
Business capital spending indicators............................. 12
Business capital spending commitments ............................ 12
Survey of plant and equipment expenditures....................... 14
Error history of annual surveys.................................. 14
Changes in manufacturing and trade inventories................... 16
Inventories relative to sales.................................... 16
Hourly earnings index......... .................................. 20
Recent changes in consumer prices................................. 22
Recent changes in producer prices................................ 22
CHARTS:
Industrial production and capacity utilization................... 3
Private housing starts........................................... 11
DOMESTIC FINANCIAL DEVELOPMENTS III
Monetary aggregates and bank credit............................. 3
Business finance................................................. 7
Government finance.......................................... 9
Federal sector............................................... 9
State and local sector.......................................... 13
Insurance companies.............................................. 14
Mortgage markets................................................ 15
Consumer credit.................................................. 19

TABLE OF CONTENTS (cont.)
Section Page
TARLES: III
Monetary aggregates............................................. 2Commercial bank credit and short- and intermediate-
term business credit................... .......................... 6Gross offerings of corporate securities........................... 8Federal government and sponsored agency financing................ 10State and local government security offerings.................... 12Secondary market for home mortgages.............................. 16Consumer installment credit..................................... 18
CHART:
Ratio of tax-exempt to taxable yields............................ 12
INTERNATIONAL DEVELOPMENTS IV
Foreign exchange markets........................................ 1U.S. international transactions................................. 8Foreign economic developments................................... 13Individual country notes........................................ 14
TABLES:
Gross borrowing in international capital markets.................. 6U.S. merchandise trade........................................... 8U.S. oil imports in 1981........................................ 9International banking data....................................... 11Summary of U.S. international transactions....................... 12Major industrial countries:
Real GNP and IP............................................... 15Trade and current-account balances............................. 16Consumer and wholesale prices.................................. 17
CHARTS:
Weighted-average exchange value of the U.S. dollar............... 2Net official purchases of dollars................................. 2
APPENDIX A: International Banking Facilities

January 27, 1982
SELECTED DOMESTIC NONFINANCIAL DATA(Seasonally adjusted)
Latest data Percent change fromThree
Period Release Data Preceding periods Yeardate period earlier earlier
(At annual rate)
Civilian labor forceUnemployment rate (%) 1/Insured unemployment rate (%) 1/
Nonfarm employment, payroll (mil.)ManufacturingNonmanufacturing
Private nonfarm:Average weekly hours (hr.) 1/Hourly earnings ($) 1/
Manufacturing:Average weekly hours (hr.) 1/Unit labor cost (1967-100)
Industrial production (1967-100)Consumer goodsBusiness equipmentDefense & space equipmentMaterials
Consumer prices all items (1967=100) Dec.All items, excluding food & energy Dec.Food Dec.
Producer prices: (1967=100)Finished goodsIntermediate materials, nonfoodCrude foodstuffs & feedstuffs
Personal income ($ bil.) 2/
Mfrs. new orders dur. goods ($ bil.)Capital goods industries
NondefenseDefense
Inventories to sales ratio: 1/Manufacturing and trade, total
ManufacturingTrade
Ratio: Mfrs.' durable goods inven-tories to unfilled orders 1/ Nov.
Retail sales, total ($ bil.) Dec.GAF 3/ Dec.
Dec. 1-8-82Dec. 1-8-82Dec. 1-8-82Dec. 1-8-82Dec. 1-8-82Dec. 1-8-82
Dec. 1-8-82Dec. 1-8-82
Dec. 1-8-82Nov. 12-29-81
1-15-821-15-821-15-821-15-821-15-82
1-22-821-22-821-22-82
Dec. 1-13-82Dec. 1-13-82Dec. 1-13-82
106.78.94.1
91.219.871.4
34.97.45
39.1220.5
143.3142.3176.3105.4139.5
282.6268.2281.2
275.9316.9237.5
-4.28.44.0
-3.8-13.4
-1.2
35.07.44
39.324.4
-25.4-22.3-14.1
5.7-38.3
5.15.85.1
3.14.6
-30.0
1.67.53.4
-3.6-13.9
-. 6
1.57.43.7.3
-1.9.9
34.9 35.37.37 6.94
39.3 39.918.4 10.3
-21.9-14.9-14.0
9.3-34.1
5.25.63.7
5.33.4
-28.0
Dec. 1-19-82 2,492.1 2.2
-4.7-3.3-.54.4-8.3
8.99.64.1
7.07.4
-13.9
4.8 9.5
(Not at annual rates)
Dec. 1-25-82Dec. 1-25-82Dec. 1-25-82Dec. 1-25-82
Nov. 1-14-82Nov. 12-31-81Nov. 1-14-82
80.5 1.628.1 .022.8 -2.1
5.4 10.5
1.50 1.481.73 1.701.29 1.29
12-31-81 .603 .597
1-13-82 87.5 .41-13-82 18.6 1.1
-6.7-4.9-1.1
-18.2
-7.0-5.2-7.7
7.4
1.42 1.401.61 1.581.25 1.23
.574 .557
-1.3 4.9.6 5.0
Auto sales, total (mil. units.) 2/Domestic modelsForeign models
Plant & Equipment expen. ($ bil.)4/Total nonfarm business
ManufacturingNonmanufacturing
Dec. 1-5-82Dec. 1-5-82Dec. 1-5-82
198219821982
1-13-821-13-821-13-82
Housing starts, private (thous.) 2/ Dec.Leading indicators (1967=100) Nov.
1-19-82 .98 13.312-29-81 127.8 -. 3
6.8 -36.3-4.0 -6.4
7.3 -4.94.9 -9.32.4 5.7
-17.6-28.8
21.1
-19.1-24.1-6.4
346.42139.34207.08
1/ Actual data used in lieu of percent changes for earlier periods.
2/ At annual rate.3/ Excludes mail order houses.4/ Planned-Commerce December 1981 Survey.
II - T - 1

DOMESTIC NONFINANCIAL DEVELOPMENTS
Economic activity contracted sharply in the fourth quarter, although
the momentum of decline in some sectors appears to have moderated toward
the end of the year. Consumer spending leveled off in real terms in
November and December, and auto sales have edged up in recent weeks.
Moreover, housing starts rose slightly in December. However, inventories
apparently remained high relative to the depressed level of sales, and
declines in industrial output and employment probably continued into
January. The inflation rate slowed noticeably in the final months of
1981, and by year-end rates of increase in all broad price measures were
well below the double-digit rates of 1979 and 1980.
Industrial Production
The index of industrial production fell 2.1 percent in December,
slightly more than in November. The cumulative decline in industrial
output since its peak in July totals nearly 7 percent, a contraction that
almost equals the sharp drop in the first half of 1980. Production
cutbacks at year's end again were widespread; output of defense and space
equipment was the exception. Reductions were especially large for durable
home goods, construction supplies, durable materials (mainly metals and
parts for consumer durable goods), and nondurable materials. As is typical
in cyclical downturns, the production of materials has dropped more pre-
cipitously than output of final products; from July through December,
materials production fell more than 10 percent, while output of products
declined about 4-3/4 percent.
II-1

II-2
INDUSTRIAL PRODUCTION(Percentage change from preceding period;
based on seasonally adjusted data)
1981 1981Q2 Q3 Q4 Oct. Nov. Dec.
---annual rate--- ---monthly rate---
Total 1.9 1.4 -16.5 -1.6 -1.9 -2.1
Final products 7.1 .8 -9.7 -.6 -1.1 -1.4Consumer goods 6.3 -1.5 -11.9 -. 6 -1.3 -1.9
Durable 14.5 -8.9 -31.6 -2.9 -4.8 -4.2Nondurable 3.4 1.4 -3.5 .3 -. 1 -1.1
Business equipment 9.4 3.9 -11.5 -1.2 -1.2 -1.2Defense and space eq. 4.1 4.3 8.6 1.5 .4 .5
Construction supplies -7.4 -8.6 -26.3 -3.2 -2.4 -2.2
Materials -1.9 2.5 -24.2 -2.6 -3.0 -3.2Durable goods 3.7 1.2 -28.8 -3.2 -3.6 -3.9Nondurable goods -1.7 -5.7 -23.4 -2.8 -3.6 -3.6Energy materials -16.6 22.4 -11.3 -.5 -.4 -.5
CAPACITY UTILIZATION RATES: MANUFACTURING AND MATERIALS(Percent, seasonally adjusted)
1978-80 1980 1981 1981High Low Q3 Q4 Nov. Dec.
Manufacturing industries 87.2 74.9 79.3 74.8 74.8 72.9
Primary processing 90.1 71.0 79.4 72.8 72.9 69.9Advanced processing 86.2 77.2 79.2 75.8 75.8 74.5Motor vehicles & pts. 94.5 51.0 60.4 51.4 50.4 48.7
Materials producers 88.8 73.8 81.2 75.3 75.3 72.7
Durable goods mats. 88.4 68.2 78.7 71.9 72.0 69.0Raw steel 100.7 55.3 81.4 70.3 70.0 67.6
Nondurable goods mats. 91.6 77.5 83.3 77.2 77.1 74.2Energy materials 88.8 82.7 84.9 82.1 82.1 81.5

II-3
INDUSTRIAL PRODUCTION
1973 1975 1977 1979 1981
CAPACITY UTILIZATION
Total Manufacturing
1977 1979
.00
160
150
140
130
120
110
100
95
85
75
01973 1975 1981
II-4
CHANGES IN EMPLOYMENT 1
(Thousands of employees; based on seasonally adjusted data)
1979 1980 1981 1981
H1 Q3 Q4 Oct. Nov. Dec.
- - Average monthly changes - -
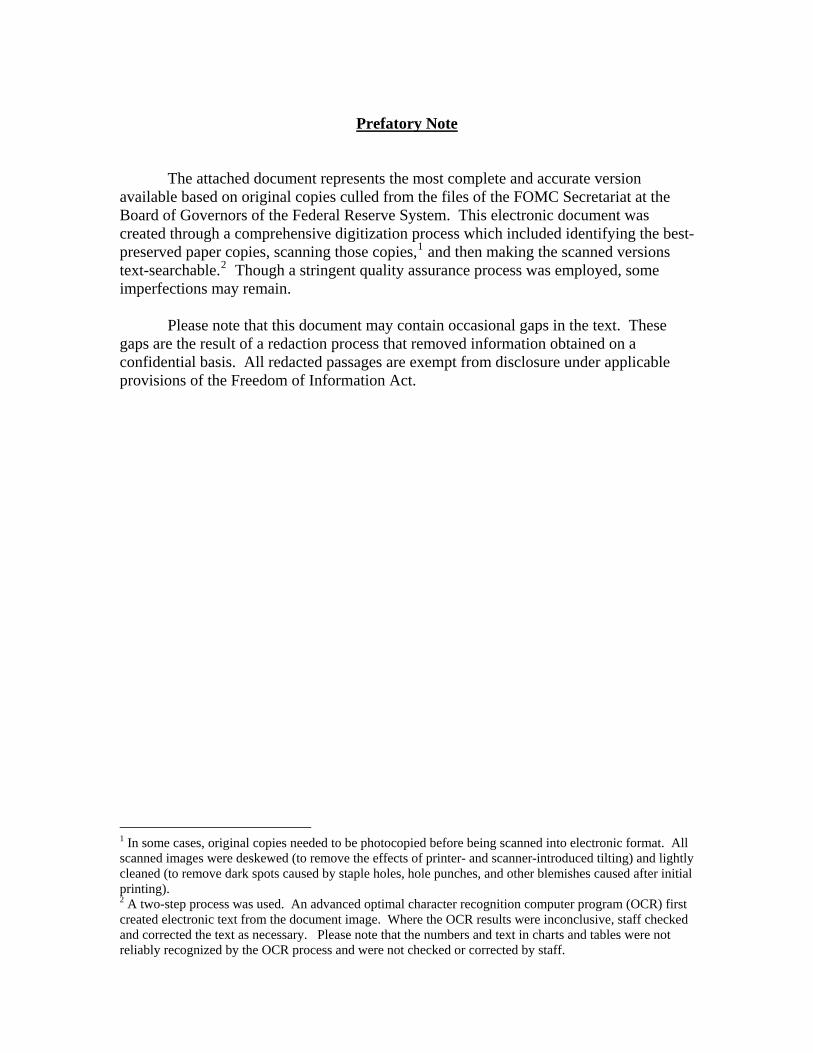
Nonfarm payroll employment2 170 34 111 139 -276 -201 -333 -293Strike adjusted 176 28 124 122 -287 -216 -354 -292
Manufacturing -5 -58 42 24 -237 -255 -233 -223Durable 1 -47 34 11 -186 -196 -187 -174Nondurable -6 -12 8 13 -51 -59 -46 -49
Construction 15 -12 -17 -4 -26 -13 -31 -34Trade 30 12 41 52 -49 44 -95 -95Finance and services 84 79 66 83 29 8 40 38Government 27 13 -33 -45 21 33 -5 34
Private nonfarm productionworkers 103 -9 104 159 -321 -243 -351 -370Manufacturing productionworkers -16 -67 31 12 -230 -251 -242 -196
Total employment3 172 -42 185 -41 -361 -53 -192 -837Nonagricultural 174 -48 207 -56 -296 -79 -218 -590
1. Average change from final month of preceding period to final month ofperiod indicated. These figures are revised to reflect new seasonal factorsand the 1980 benchmark to the establishment survey data.2. Survey of establishments. Strike-adjusted3. Survey of households.
data noted.
SELECTED UNEMPLOYMENT RATES(Percent; based on seasonally adjusted data)
1979 1980 1981 1981H1 Q3 Q4 Oct. Nov. Dec.
Total, 16 years and older 5.8 7.1 7.4 7.2 8.4 8.0 8.4 8.9
Teenagers 16.1 17.7 19.2 18.7 21.3 30.6 21.8 21.720-24 years old 9.0 11.5 12.1 11.7 13.2 12.8 13.0 13.7Men, 25 years and older 3.3 4.7 4.8 4.8 5.9 5.5 5.8 6.5Women, 25 years and older 4.8 5.5 5.8 5.7 6.3 6.1 6.4 6.5
White 5.1 6.3 6.6 6.2 7.4 6.9 7.4 7.8Black and other 11.3 13.2 13.5 14.6 15.7 15.5 15.5 16.1
Fulltime workers 5.3 6.8 7.1 6.9 8.2 7.7 8.1 8.7
White collar 3.3 3.7 4.0 4.0 4.3 4.1 4.2 4.6Blue collar 6.9 10.0 9.9 9.6 11.9 11.1 11.8 12.9

II-5
Further cutbacks in production appear to be occurring in January.
Poor auto sales in December frustrated dealers' efforts to trim inven-
tories significantly, and auto assemblies scheduled for January were
scaled back even further to a 3.6 million unit annual rate--down from a
4.6 million unit rate in December. In addition, weekly data on steel
production suggest that more reductions likely occurred in January.
Employment and Unemployment
Labor market conditions continued to deteriorate in December:
manufacturing layoffs again were widespread, construction employment
declined further, and hiring at retail establishments was unseasonably
weak. As a result, the unemployment rate jumped another 1/2 percentage
point to 8.9 percent. Moreover, in the period since the mid-December
labor market surveys were taken, labor demand appears to have remained
weak; initial claims for unemployment insurance have remained very high.
There have been reports of additional plant closings, although some of
those shutdown earlier have reopened.
The establishment survey reported that nonfarm employment fell
300,000 in December. With this third consecutive large monthly drop,
employment in both manufacturing and construction fell to a level below
their 1980 troughs. As in recent months, the December decline was con-
centrated in the cyclically sensitive durable goods industries in which
sales have been especially weak; the factory workweek also was shortened
again. At retail stores, pre-Christmas hiring fell short of the normal
December increase, and seasonally adjusted employment dropped 80,000
for the second consecutive month.

II-6
RETAIL SALES
(Percent change from preceding period;based on seasonally adjusted data)
1981Q1 Q2 Q3 Q4 Sept. Oct. Nov. Dec.
- - quarterly rate - - - - monthly rate - -
Total sales 4.9 -.4 2.3 -1.2 .1 -2.3 .7 .4
(Real)1 2.9 -1.7 .5 n.a. -.8 -2.7 .4 n.a.
Total, less autos andnonconsumption items 3.5 1.0 1.1 .8 .3 -. 2 .4 .6
Total, exc. auto group,gasoline, and nonconsump-tion items 3.3 1.1 1.3 .8 .0 .0 .3 .7
GAF 2 3.1 1.1 .6 .1 -.9 -.5 .0 1.1
Durable goods 8.5 -4.1 5.2 -6.1 -.2 -7.3 .7 .4Automotive 10.0 -5.6 9.8 -8.7 -.6 -10.2 1.2 -.6Furniture &appliances 4.4 -2.6 .2 -.2 .6 -2.6 -.3 2.3
Nondurable goods 3.3 1.3 1.0 1.1 .3 .0 .6 .3Apparel 5.1 -.5 2.3 -1.9 .2 -1.7 -1.3 .6Food 2.1 2.2 2.1 1.8 -1.1 .8 1.8 -.4General merchandise 1.8 3.2 .1 1.1 -1.9 .7 .6 .9Gasoline 4.9 .1 -.1 .6 2.4 -1.5 1.3 -.4
1. BCD series 59. Data are available approximately 3 weeks following theretail sales release.2. General merchandise (excludes mail-order nonstores), apparel, and furnitureand appliance stores.
AUTO SALES(Millions of units; seasonally adjusted annual rates)
1981
Q1 Q2 Q3 Q4 Sept. Oct. Nov. Dec.
Total 10.0 7.9 9.0 7.4 8.8 7.2 7.7 7.3
Foreign-made 2.7 2.3 2.1 2.2 2.0 2.0 2.3 2.4
U.S.-made 7.3 5.6 6.9 5.1 6.9 5.1 5.4 4.9
Small 3.9 2.9 3.5 2.6 3.5 2.6 2.8 2.3
Intermediate& standard 3.4 2.8 3.4 2.5 3.5 2.5 2.6 2.6
Note: Components may not add to totals due to rounding.

II-7
Virtually all of the increase in unemployment last month resulted
from layoffs. Since last summer, when unemployment averaged about 7-1/4
percent, the rate has jumped 1-3/4 percentage points. Much of the increase
has been among adult men, reflecting the widespread layoffs in manufac-
turing. In addition to the rise in measured unemployment in recent
months, the number of workers on involuntary part-time schedules and the
number of discouraged workers--those who have left the labor force because
they think no work is available--has increased substantially.
Consumer Spending and Personal Income
Consumer demand fell sharply early in the fourth quarter, but appears
to have leveled off toward year-end. Sales of new domestic model autos
have averaged 5-1/4 million units (annual rate) since early December,
about the same pace as for the fourth quarter as a whole. In the first
three weeks of January, sales of these models were reported to have picked
up to a 6 million unit annual rate. Demand for imported automobiles has
remained firm in recent months, averaging 2-1/4 million units in the
fourth quarter.
Outside the automotive area, retail sales for consumer items increased
0.7 percent in December, following practically no change in the three
preceding months; after adjusting for price increases, sales probably
were about unchanged. Sales of furniture and appliances rose substan-
tially, partially reversing a large decline over the preceding two months,
and spending for general merchandise rose almost 1 percent. The gains
were partially offset by declines in expenditures for food.

II-8
PERSONAL INCOME
(Based on seasonally adjusted data)
1979 1980 1981 1981__Q3 Q4 Oct. Nov. Dec.
- - - - Percentage changes at annual rates - - - -
Total personal income 12.3 11.0 10.1 13.0 7.2 5.3 6.8 2.2Wage and salary
disbursements 10.8 9.0 9.0 8.9 6.7 5.7 6.7 -0.6Private 11.6 9.2 9.3 9.5 5.2 2.4 6.7 -1.9
Disposable personal incomeNominal 11.7 10.9 10.3 11.8 9.0 12.5 5.8 1.7Real 2.0 .8 2.1 2.6 -1.3 4.7 .5 -3.3
- - - - - Changes in billions of dollars2 - - - - -
Total personal income 18.3 18.7 18.0 26.1 9.8 10.9 14.2 4.4
Wage and salary disbursements 10.3 9.8 9.5 12.1 5.0 7.1 8.6 -0.7Private 8.9 8.1 7.8 10.3 2.5 2.5 6.9 -2.0
Manufacturing 2.0 2.3 1.6 2.2 -2.2 -1.5 -2.3 -2.9
er income 8.9 9.6 9.7 14.7 5.2 4.5 6.0 5.0Transfer payments 2.8 4.1 2.8 5.5 1.6 0.3 2.7 1.9
Less: Personal contributionsfor social insurance .9 .8 1.2 .7 .3 .8 .4 -.2
Memorandum:Personal saving rate3 5.2 5.6 5.3 5.2 6.0 6.0 6.0 n.a.
1. Changes over periods longer than one quarter are measured from final quarter ofpreceding period to final quarter of period indicated. Changes for quarterly periodsare compounded rates of change; monthly changes are not compounded.2. Average monthly changes are from the final month of the preceding period to thefinal month of period indicated; monthly figures are changes from the precedingmonth.3. Monthly saving rate equals the centered three-month moving average of personalsaving as a percentage of the centered three-month moving average of disposablepersonal income.
II-9
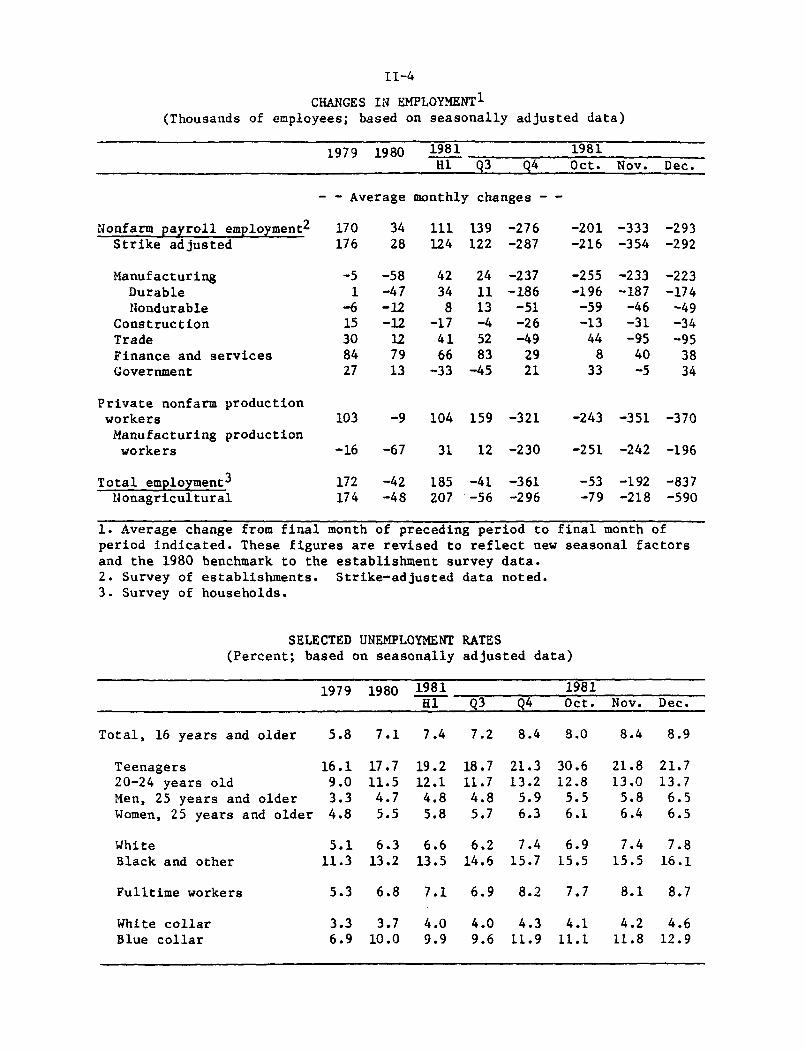
As employment weakened, nominal personal income growth slowed
further in December, rising just 2.2 percent at an annual rate. Cut-
backs in employee hours more than offset wage gains, and wage and salary
disbursements fell in December for the first time since the spring of
1980. Both farm and nonfarm proprietors' income also declined in December
and are now lower than a year earlier. In addition, the growth of personal
interest income slowed in the final months of the year as interest rates
declined. Real disposable income was unchanged in November and posted
a small decline in December, leaving real income only about 2 percent
higher than a year ago. The saving rate had been boosted appreciably in
October by the tax cut and by a sizable drop in spending for durable
goods; but by December it fell back to 5-1/2 percent.
Housing
Housing starts remained under a 1 million unit annual rate in December,
despite a 13 percent rise from November. Almost all of the December
increase was for multifamily units, as starts of single-family units
were little changed from their unusually depressed November level. At
the same time, the number of permits issued for both single-family and
multifamily construction increased somewhat; like the boost in starts,
the rise in permits appeared to be widespread geographically. However,
these data reflect economic conditions prior to the reversal of mortgage
rates, which moved them back up to about 17-1/2 percent in recent weeks.
Housing sales also increased a bit at the end of the year, but they
remained well below last year's depressed pace. New house sales rose
more than 10 percent in November, helping to reduce inventories of unsold

II-10
PRIVATE HOUSING ACTIVITY(Seasonally adjusted annual rates, millions of units)
1981 1981
Type of unit Annual Q2 Q3 Q4 Oct. Nov. Dec.1
TotalPermits .97 1.11 .88 .75 .72 .72 .81Starts 1.09 1.18 .97 .90 .87 .86 .98
Single-familyPermits .56 .64 .49 .42 .40 .40 .46Starts .71 .78 .65 .55 .51 .57 .58
SalesNew homes n.a. .44 .36 n.a. .36 .40 n.a.Existing homes 2.35 2.59 2.28 1.95 1.97 1.92 1.95
MultifamilyPermits .41 .47 .38 .33 .32 .32 .35Starts .38 .39 .32 .35 .36 .29 .40
Mobile home shipments n.a. .26 .24 n.a. .21 .21 n.a.
1. Preliminary estimates.

II-11
PRIVATE HOUSING STARTS(Seasonally adjusted annual rate)
Milli
Total
Single-family
Multifamily
1978 1979
units2.4
1980 1981

II-12
BUSINESS CAPITAL SPENDING INDICATORS
(Percentage change from preceding comparable period;based on seasonally adjusted data)
1981Q2 Q3 Q4 Oct. Nov. Dec.
Nondefense capital goodsshipmentsCurrent dollarsConstant dollars1
Addendum: Sales of heavy-weight trucks (thousands)
Nonresidential constructionCurrent dollarsConstant dollars
Addendum:drilling
Oil and gas well(millions of feet)
3.2 .9 -1.3 -4.4 3.8 -1.0-. 6 -. 1 -. 3 -3.3 3.7 .1
226 232 201 196 190 216
1.7 5.11.4 4.0
30.1 26.7
- -. 1 -. 5- -. 5 -. 8
36.3 36.6 33.9 38.5
1. FRB staff estimate.
BUSINESS CAPITAL SPENDING COMMITMENTS
(Percentage change from preceding comparable period;
based on seasonally adjusted data)
1981
Q2 Q3 Q4 Oct. Nov. Dec.
Nondefense capital goods
ordersCurrent dollars 1.9 .2 -6.9 -8.8 10.8 -2.1
Constant dollars .8 1.3 -5.7 -12.9 14.4 1.9
Machinery
Current dollars 3.1 .4 -2.1 -9.9 9.4 3.4
Constant dollars 1 .6 -1.3 -3.7 -11.0 9.7 3.1
Addenda: Ratio of
current dollar unfilled
orders to shipments
Total 6.10 6.00 5.86 6.10 5.83 5.83
Machinery 4.62 4.50 4.44 4.53 4.34 4.41
Nonresidential
building permits
Current dollars .5 14.5 -- -24.4 -11.0
Constant dollars1 .5 12.9 -- -24.8 -11.2
1. FRB staff estimate.
II-13
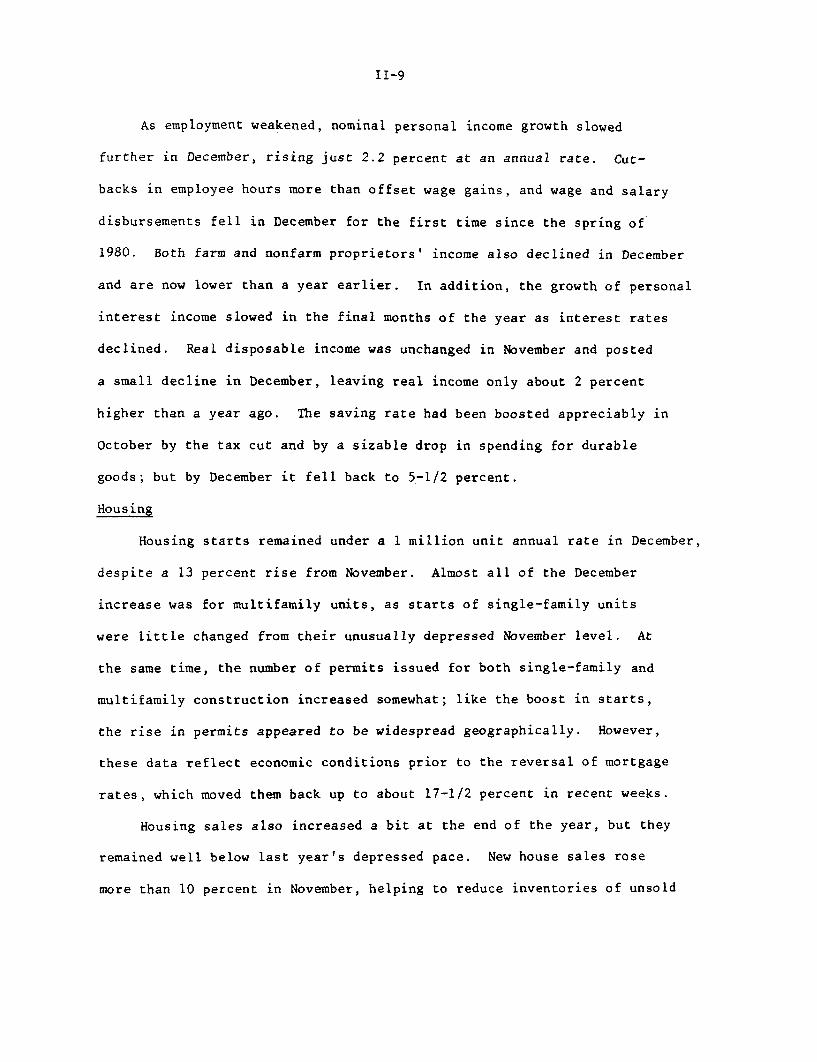
new units further, and sales of existing homes increased in December,
benefiting from the brief decline in mortgage rates.
Record high mortgage rates during most of last year, coupled with
reduced inflation expectations, restrained increases in house prices
during 1981. The average price of existing homes sold rose 6 percent in
the 12 months ending in December of 1981, in contrast with an average
increase of more than 15 percent in the three preceding years. Price
increases for new houses have also slowed noticeably, rising 5 percent
from November 1980 to November 1981. Moreover, seller financing has be-
come more widespread in the past year, and many sellers probably are
offering concessions, that are not reflected in the price data.
Business Fixed Investment
Business fixed investment declined sharply, at an 11 percent annual
rate in real terms, in the fourth quarter of 1981; this left it only
slightly above a year earlier. The decline was concentrated in equipment,
particularly machinery and transportation equipment. In structures, a
decline in nonresidential construction was partially offset by an increase
in spending for oil- and gas-well drilling rigs.
Data on near-term spending commitments have continued to be weak,
and several basic determinants of capital spending remain adverse. The
outlook for business sales currently is unfavorable, and capacity utiliza-
tion in manufacturing, at 72.9 percent in December, has been at depressed
levels for nearly two years. In addition, real interest rates remain
quite high.
Bookings of orders for nondefense capital goods--an indicator of
near-term demand for about 80 percent of producers' durable equipment--

II-14
SURVEY OF PLANT AND EQUIPMENT EXPENDITURES(Percent change from prior year)
1 Planned for 19821981 CommerceSurvey Department McGraw-Hill2 Merrill Lynch2
(Actual) Jan. 1982 Fall 1981 Fall 1981
All Business 9.1 7.4 9.6 7.5Manufacturing 10.7 8.6 11.5 8.8
Durables 6.8 7.7 10.1 3.9Nondurables 14.8 9.5 12.9 13.6
Nonmanufacturing 8.1 6.6 8.3 6.6Mining 24.4 11.8 24.8 19.9Transportation -.2 10.9 18.6 -6.3Utilities 7.0 5.1 5.2 3.6Trade and Services 5.5 5.7 4.73 n.a.Communications and 4other 11.6 6.3 12.2 7.4
1. Growth in actual expenditures reported in the January Commerce Survey.2. Not strictly comparable to Commerce Survey.3. Includes only commercial category.4. Includes commercial category.
ERROR1 HISTORY OF ANNUAL SURVEYS
2 2Year Commerce McGraw-Hill Merrill Lynch
Department Fall Fall
1970 3.8 2.8 1.51971 -.5 .5 1.11972 .2 2.6 .11973 .1 -2.2 -2.81974 -.7 .9 -1.01975 4.3 11.5 9.71976 -1.3 2.0 -3.91977 -1.4 .3 .81978 -3.2 -2.2 -3.11979 -3.9 -5.2 -6.11980 1.3 .2 -2.21981 1.7 3.1 -1.8
Mean Absolute Error 1.9 3.1 3.1
1. Anticipated minus actual percent change.2. Fall Survey taken in October and November of 1981.

II-15
rose in November and fell in December. But these orders were extremely
weak throughout 1981 and in real terms have remained well below their
previous peak attained in early 1979. In addition, permits for nonresi-
dential construction fell sharply in October and November.
The Commerce Department's annual survey of plant and equipment spend-
ing for 1982 confirmed the pessimistic outlook for the year as a whole.
According to the survey, as of November business firms planned to increase
1982 nominal expenditures for plant and equipment 7-1/2 percent from those
in 1981; given their price expectations, they anticipate no change in
real expenditures. This Commerce Department survey has a history of over-
estimating capital expenditures during cyclical downturns--by 4-1/4 per-
centage points for 1975.
Inventory Investment
Production cutbacks slowed the rate of inventory accumulation in
the manufacturing and trade sectors to approximately a $42 billion annual
rate in book value terms in October and in November, compared with the
$56 billion pace in the third quarter. In real terms, manufacturing and
retail trade inventories were liquidated. However, total sales continued
to slip and nudged the constant dollar inventory-sales ratio to 1.77 for
November, about equal to previous cyclical peaks.
In the manufacturing sector, production cutbacks in the fourth
quarter of 1981 progressively reduced accumulation of stocks of durable
goods from September through November. After months of sizable increases,
the book value of stocks of nondefense capital goods actually declined
in November, reversing the pattern of large accumulations of these goods
in the preceding months.

II-16
CHANGES IN MANUFACTURING AND TRADE INVENTORIES
(Billions of dollars at annual rates)
19811979 1980 Q1 Q2 Q3(r) Sept. Oct.(r) Nov.(p)
Book Value Basis
Total 49.0 31.0 41.1 35.0 55.6 68.1 42.6 41.8Manufacturing 31.5 16.4 34.2 12.7 27.6 39.1 21.9 13.6
Durable 23.7 10.2 18.5 9.8 25.9 35.0 18.9 5.3Nondurable 7.8 6.2 15.7 3.0 1.8 4.0 3.0 8.2
Wholesale Trade 10.3 11.7 .0 6.7 8.3 17.7 5.5 23.3Retail Trade 7.2 2.9 6.8 15.6 19.6 11.3 15.2 4.9Automotive 1.4 -2.3 -3.5 12.2 7.3 -.2 .6 -2.1Gen. Merchandise 1.1 1.4 3.1 2.6 5.5 8.1 8.4 -2.0
Constant Dollar Basis
Total 7.2 -2.5 -1.3 11.0 12.5 17.8 13.4 6.9Manufacturing 6.8 -1.0 4.6 .9 5.4 9.6 4.8 -. 4Wholesale Trade .4 .6 -1.6 3.2 2.7 7.4 2.4 9.0Retail Trade -. 1 -2.2 -4.3 6.9 4.5 .8 6.2 -1.6
Automotive -. 3 -1.2 -5.9 5.7 .0 -3.6 -1.3 -2.9
INVENTORIES RELATIVE TO SALES1
1974 1980Cyclical Cyclical 1981
Peak2 Peak2 Q1 Q2 Q3(r) Sept. Oct.(r) Nov.(p)
Book Value Basis
Total 1.64 1.53 1.39 1.41 1.44 1.44 1.48 1.50
Manufacturing 1.95 1.76 1.61 1.60 1.63 1.64 1.70 1.73Durable 2.51 2.36 2.09 2.05 2.13 2.15 2.26 2.30Nondurable 1.39 1.18 1.11 1.12 1.11 1.11 1.13 1.15
Wholesale Trade 1.24 1.21 1.08 1.11 1.14 1.13 1.16 1.17Retail Trade 1.57 1.44 1.31 1.36 1.39 1.38 1.43 1.42
Automotive 2.17 2.01 1.47 1.77 1.72 1.70 1.90 1.86Gen. Merchandise 2.41 2.28 2.22 2.21 2.34 2.35 2.40 2.37
Constant Dollar Basis
Total 1.76 1.76 1.63 1.66 1.69 1.70 1.76 1.77Manufacturing 2.18 2.11 1.97 1.95 2.00 2.01 2.09 2.13Wholesale Trade 1.40 1.45 1.33 1.40 1.43 1.42 1.45 1.45Retail Trade 1.52 1.48 1.36 1.42 1.43 1.42 1.49 1.48
Automotive 2.05 2.05 1.51 1.84 1.72 1.67 1.92 1.88
1. Ratio of end-of-period inventories to average monthly sales for the period.2. Highs are specific to each series and(r) Revised estimates.(p) Preliminary estimates.
are not necessarily coincident.

II-17
Accumulation of retail trade inventories slowed considerably in
November. The book value of retailers' stocks rose at a moderate $5
billion annual rate. General merchandise stocks, which had been accumu-
lating rapidly since April, were reduced. Stocks held by auto dealers
also declined in November, but dismal sales in December caused these
stocks to climb again, prompting further production cutbacks and a new
round of purchase incentive programs in January. Even if domestic auto
sales were to continue at about recent relatively poor rates, the drastic
production cutback in January would work off about 10 days'supply of
dealer inventories.
In the wholesale trade sector, where inventory changes have been
quite volatile, a substantial inventory buildup occurred during November.
The book value of merchant wholesalers' stocks rose at a $23.3 billion
pace, with significant runups in automotive products, machinery, and
metals.
Federal Government
Total federal expenditures on national income and product account
basis increased at a 15 percent annual rate during the fourth quarter,
reflecting a very large increase in purchases of goods and services. Out-
lays for compensation were boosted by the October pay increases for
civilian and military personnel. Defense operations and procurement
proceeded in step with the Administration's plans, and Commodity Credit
Corporation loans increased substantially. Other nondefense purchases
continued the decline that began in the second quarter.

II-18
Transfer payments increased at a surprisingly moderate rate in the
fourth quarter, considering the rapid deterioration in employment.
Medicare payments accounted for most of the increase, as the more cyclically
sensitive unemployment compensation rose only $0.8 billion at an annual
rate. However, monthly and daily Treasury statement data indicate that
unemployment outlays began to rise sharply in December and January.
On the receipts side of the budget, personal taxes declined $4.6
billion in annual rate terms in the fourth quarter, reflecting the first
phase of the personal income tax cut and reduced employment. This revenue
loss was partially offset by higher payments for Social Security taxes.
Windfall profits tax receipts also declined because the rise in crude oil
prices has not kept pace with the inflation rate; the windfall profits
tax is based on the difference between current oil prices and a base price
that is indexed to the GNP deflator.
State and Local Government
Real purchases of goods and services by state and local governments
were unchanged in the final months of 1981, following sizable declines
in the spring and summer. As a result, these outlays were below 1980
average levels. State and local governments hired 25,000 workers in
December, offsetting only a fraction of the 260,000 jobs--mostly CETA
slots--that had been eliminated in the first 11 months of the year. Jobs
in local education, general administration, and the judiciary system
have been reduced substantially, so that year end employment was at its
lowest level in 2-1/2 years.

II-19
With $9 billion slashed from federal grants last year, the Adminis-
tration's budget policy significantly alters the relationship between
the federal sector and states and localities. The lack of support from
the federal sector, coupled with the sluggishness and decline in growth
of state and local government tax revenues, has severely limited the
possibilities for spending increases. Thus, the state and local sector
can be expected to lend little support to the recovery of economic activity
at the aggregate level.
Wages
Wage rate increases for production workers moderated further toward
the end of 1981. Preliminary data indicate that straight-time wage rates
of nonfarm production workers increased at a 7.1 percent annual rate in
the fourth quarter. This rise brought the increase over the four quarters
of 1981 to 8.3 percent--considerably below the 9.6 percent rise in 1980.
Increases in wage rates in the manufacturing and trade sectors during
1981 were about 2 percentage points less, on average, than during 1980.
In contrast, there has not been a significant moderation in wage gains
by service workers; wages in service industries, which so far have been
relatively less affected by the recession, continued to increase more
than 9 percent last year.
During 1981 a number of workers renegotiated labor contracts in
industries in which heightened competition and slack demand imposed
severe financial difficulties on firms. Recently, several major unions
have agreed to early negotiations of contracts that were due to expire
in 1982 and to significant concessions relative to their traditional
contracts. In December, new labor contracts were reached with major

II-20
HOURLY EARNINGS INDEX 1
(Percentage change at annual rates;
based on seasonally adjusted data)2
19811980 1981 Ql Q2 Q3 Q4 Nov. Dec.
Total private nonfarm 9.6 8.3 9.6 8.3 8.3 7.1 11.1 1.4
Manufacturing 10.9 8.8 9.3 9.7 8.5 7.5 7.3 4.3Durable 11.6 8.9 9.4 9.6 8.5 7.9 8.7 3.9Nondurable 9.8 8.6 9.1 10.0 8.4 6.9 4.9 5.2
Contract construction 7.6 7.8 9.2 4.9 8.9 8.5 8.3 4.4Transportation and
public utilities 9.4 8.5 9.4 11.0 6.8 7.0 15.7 2.7Total trade 8.8 7.1 9.6 7.1 8.0 3.7 8.0 -0.3Services 9.5 9.1 9.8 8.5 8.8 9.5 15.5 -0.2
1. Excludes the effect of interindustry shifts in employment and fluctuationsin overtime pay in manufacturing.2. Changes over periods longer than one quarter are measured from final quarterof preceding period to final quarter of period indicated. Quarterly changes areat compound rates; monthly changes are at simple annual rates.

II-21
meatpacking firms that call for a freeze on wage rates for 44 months, and
a tentative Master Freight Agreement covering 300,000 truckdrivers and
warehouse workers would eliminate scheduled wage increases (leaving only
annual cost-of-living adjustments) and alter work rules. At Ford and
General Motors, fringe benefits for nonunion workers were cut effective
January 1, and agreements are being sought with the UAW for a reduction in
benefit costs along with some sort of freeze on wage rates. Furthermore,
depressed conditions and high union wages in the rubber and farm machinery
industries also may lead to more moderate settlements in these industries
later this year.
Some spillover to other industries is likely. In the past, Master
Freight Agreements often were imitated in other union contracts within
the trucking and warehousing industries. Likewise, the auto settlement
generally has set the tone for new agreements in supplier industries.
The influence of recent union concessions on negotiations in other indus-
tries is uncertain. For example, workers at oil refineries, which are
not suffering any financial strain, recently reached a new contract that
raises wages nearly 17 percent over the next two years.
Prices
The rate of inflation continued to decline during the closing months
of 1981. Consumer prices rose 0.5 percent in November and 0.4 percent
in December, while producer prices of finished goods advanced only 0.3
percent in December. Over the year, both indexes rose considerably less
than in 1980: the increase in the CPI slowed from nearly 12-1/2 percent
to about 9 percent and the PPI for finished goods decelerated from 11-3/4
to 7 percent.

II-22
RECENT CHANGES IN CONSUMER PRICES 1(Percentage change at seasonally adjusted annual rates) 2
Relativeimportance 1981Dec. 1980 1980 1981 H1 H2 Nov. Dec.
All items 100.0 12.4 8.9 8.5 9.3 6.0 5.1Food 17.3 10.2 4.3 1.0 7.3 2.6 5.1Energy 10.8 18.1 11.9 24.9 .3 -2.3 1.4
Homeownership 25.8 16.5 10.1 9.8 10.4 2.3 2.6All items less food,energy, and homeowner-
ship3 49.6 9.9 9.4 8.4 10.3 6.5 8.5
Used cars 3.0 18.3 20.3 5.7 37.0 30.7 12.2
Other commodities 3 20.5 8.1 6.1 7.2 5.3 4.1 4.7
Other services 3 26.1 10.3 10.6 10.0 11.3 8.9 8.4
Memorandum:Experimental CPI 4 100.0 10.8 8.5 8.5 8.6 5.7 6.6
1. Based on index for all urban consumers (CPI-U).
2. Changes are from final month of preceding periodindicated; monthly changes at simple annual rates.
to final month of period
3. Includes the home maintenance and repair items of homeownership costs.4. BLS experimental index for "All items"--CPI-U-X1--which uses a rentsubstitution measure for homeownership costs.
RECENT CHANGES IN PRODUCER PRICES(Percentage change at annual rates; based on seasonally adjusted data)1
Relativeimportance 1981Dec. 1980 1980 1981 H1 H2 Nov. Dec.
Finished goods 100.0 11.8 7.0 10.0 4.1 6.1 3.1Consumer food 23.1 7.5 1.5 1.7 1.5 -6.1 1.4Consumer energy 12.0 27.8 14.3 32.0 -1.1 10.9 8.8
Other consumer goods 44.6 10.4 6.9 8.3 5.4 9.6 0.5Capital equipment 20.3 11.4 9.2 10.9 7.6 9.8 6.6
Intermediate materials2 93.6 12.4 7.4 10.9 3.9 5.3 4.6Exc. energy 77.3 10.1 6.7 8.4 4.9 3.7 4.6
Crude MaterialsFood 57.7 8.6 -14.0 -8.6 -18.9 -25.6 -30.0Energy 26.8 26.9 22.9 48.0 2.0 6.3 15.3Other 15.5 7.5 -11.3 -12.2 -9.1 -38.5 -29.7
1. Changes are from final month of preceding period to final month ofperiod indicated; monthly changes at simple annual rates.2. Excludes materials for food manufacturing and animal feeds.

II-23
As during most of 1981, food prices rose relatively little at retail
in November and December, and farm prices fell substantially in December
for the fifth consecutive month. However, more recent developments in
agricultural markets have caused spot prices of farm products to turn up
sharply since early January. Cold weather damaged fruit and vegetable
crops in Florida in mid-January, and while the full extent of the damage
to crops is not yet clear, the experience of 1977 and 1981 suggests that
consumer prices for fruits and vegetables are likely to rise steeply in
the coming months. However, in these earlier years much of the weather-
induced price increases dissipated fairly quickly as new crop supplies
became available in the spring. Livestock prices also turned up sharply
in mid-January; this upturn may reflect disruptions in marketings owing
to the recent spell of bad weather, but in addition there are indications
that producers are trimming output in response to low prices.
In the energy grouping, slack in the petroleum markets also contri-
buted to a lower rate of inflation during most of 1981. Over the year,
energy prices rose about 12 percent, more than the overall CPI increase
but 6 percentage points less than in 1980. After jumping sharply follow-
ing decontrol in January and February, gasoline prices actually fell.
Natural gas rates continued to reflect the deregulation of wellhead prices,
rising about 15 percent for the second year.
Homeownership costs increased sharply through much of 1981, but
eased towards year-end. A decline in house prices was the major factor.
Although the CPI measure of mortgage rates rose rapidly throughout most
of the year, a decline in FHA/VA ceiling rates contributed to a slowing
of mortgage interest costs in the December index. However, conventional

II-24
settlement rates continued to climb in the December index and FHA/VA
ceiling rates were increased again in mid-January.
While moderate increases for food and energy prices contributed to
the drop in the inflation rate during 1981, there also was a significant
downturn in the pace of price increases for many other consumer goods, and
to a lesser extent for capital equipment. In the second half of the
year, prices for these other consumer commodities--excluding the wide
swings in used car prices--moderated to about a 5-1/4 percent annual rate.
Producer prices of capital equipment rose rapidly early in 1981, but by
the second half of the year they had slowed markedly to a 7-1/2 percent
annual rate. In contrast, price increases for most services, notably
medical and public transportation, persisted at rapid rates. However,
at year's end even inflation in the service sector began to ease a bit.
Prices for intermediate materials, which represent inputs for the
manufacturing and other sectors, also slowed considerably over the course
of 1981. Excluding food and energy, these prices rose at about a 5 per-
cent annual rate in the second half of 1981, down from 8-1/2 percent in
the first half of the year.

III-T-1
SELECTED FINANCIAL MARKET QUOTATIONS 1
(Percent)
1981 1982 Change from:
Nov.-Dec. FOMC Nov.-Dec. FOMCHighs Lows Dec. 22 Jan. 26 Lows Dec. 22
Short-term rates
Federal funds 2
Treasury bills3-month6-month
1-year
Commercial paper1-month3-month
Large negotiable CDs3
1-month
3-month
6-month
Eurodollar deposits2
1-month
3-month
Bank prime rate
Treasury bill futures
June 19R2 contract
Dec. 1982 contract
Intermediate- and long-
term rates
20.06 12.04
17.0115.9315.21
9.9410.3410.42
18.63 11.171.29 11.04
18.9010.0118.50
11.1611.2311.64
19.80 11.8619.56 12.16
21.50 15.75
14.46 10.5814.20 11.07
U.S. Treasury3-year10-year30-year
(constant maturity)16.5915.8415.20
Municipal (Bond Buyer) 13.44
Coroorate--Aaa utility
Recently offered 17.72
12.5412.9212.76
11.43
14.52
14.1114.0213.65
13.004
15.40
14.7114.5414.19
13.164
15.85
2.171.621.43
1.73
1.33
S&L fixed-rate mort-gage commitment 18.63 16.90 16.905 17.615 .71 .71
1981 1982 Percent change from:FOMC 1981 FOMC
Highs Dec. 22 Jan. 26 Highs Dec. 22
Stock Prices
Dow-Jones IndustrialtlYSE CompositeAMEX Composite
WASDAQ (OTC)
1,024.0579.14
380.36223.47
871.9671.27
318.49195.64
1. One-day quotes except as noted. 4.
2. Averages for statement week closest to date shown. 5.
3. Secondary market.p--Preliminary.
841.5166.49
279.04183.41
One-day quotes
-17.8 -3.5-16.0 -6.7-26.6 -12.4-17.9 -6.3
for preceding Thursday.One-day quotes for preceding Friday.
12.43
11.0311. 9312.06
12.6512.65
12.7313.1113.76
13.2313.65
15.75
12.7013.01
13.97p
13.0213.1112.91
13.8814.09
14.0214.5814.91
14.2315.05
15.75
13.5813.66
1.93
3.082.772.49
2.713.05
2.863.353.27
2.372.89
0
3.002.59
1.54
1.991.18.85
1.231.44
1.291.471.15
1.001.40
0
.88
.65

DOMESTIC FINANCIAL DEVELOPMENTS
In the face of a considerable drop in economic activity, the mone-
tary aggregates have climbed steeply over the past few months. The brisk
uptrend in Ml that began in November extended into December and was aug-
mented by a burst in early January. M2 also has expanded rapidly, despite
some moderation in the growth of its nontransaction component following
a big November increase. As a result of the strength in deposits, the
gap between required and nonborrowed reserves has widened substantially,
placing upward pressure on money market interest rates.
Federal funds most recently have traded in the neighborhood of 14
percent, as compared with the 12 to 12-1/2 percent range prevailing when
the FOMC met in December. Other private short-term market rates are up
1-1/4 to 1-1/2 percentage points, and Treasury bill yields have risen as
much or more, apparently in reflection of heavier supplies as the Treasury
has tapped that sector in size to meet both seasonal and longer-range cash
needs.
Yields on long-term taxable bonds are up about 1/2 percentage point
since the last FOMC meeting; municipal yields have posted a smaller net
increase, but, unlike other bond rates, they touched new highs during the
intermeeting period. The higher levels of long-term rates appear to be
due in part to a deepening pessimism about the potential conflict between
fiscal and monetary policy as the money stock has soared and plans for
paring prospective federal deficits have failed to materialize; in addi-
tion, however, the weakness of the bond markets seems to be symptomatic
of a growing discouragement among investors who, already having suffered
III-1

III-2
MONETARY AGGREGATES(Based on seasonally adjusted data unless otherwise noted)
1
1981
Q2 Q3 Q4 Oct. Nov.
QIV '80to
Dec. QIV. '81
--- Percentage change at annual rates ---
Money stock measures1. Ml2. (Adjusted)2
3. M24. M3
Selected components5. Currency
6. Demand deposits
8.6(5.2)10.610.6
0.5(-0.4)7.210.3
5.6(4.6)10.6
9.8
3.3(3.1)8.15.9
13.6(11.4)
17.313.9
11.0(9.3)11.310.2
4.9(2.1)9.5
11.2
7.9 5.0 4.0 3.0 6.9 9.8
-11.8 -8.0 0.0 1.5 6.1 4.1 -12.7
7. Other checkable deposits
8. M2 minus M1 (9+10+11+14)9. Overnight RPs and Eurodollars, NSA3
.0. Money market mutual fund shares, NSA11. Commercial banks12. savings deposits13 . small time deposits14. Thrift institutions
15. savings deposits16. small time deposits
17. Large time deposits18. at commercial banks, net 4
19. at thrift institutions
.Term RPs, NSA
107.4 21.5 26.6
11.358.9
113.74.2
-11.913.4-0.3
-12.64.7
9.413.988.26.7
-19.621.0-2.9
-23.05.1
12.3-52.7
83.010.6
-10.420.61.7
-11.86.8
10.0 46.2
9.7-124.3
71.810.9
-19.024.7
1.8-16.3
8.3
10.3 25.3 3.0 -4.010.1 27.3 -1.0 -10.111.2 15.1 23.5 26.2
12.2 43.6 21.4 -17.8
-9.6-16.0
21.0
36.2
36.5 175.2
11.421.453.75.29.24.13.9
16.5-0.7
5.74.413.7
-10.0
11.03.1
129.27.1
-17.023.00.5
-17.99.1
20.820.322.8
25.9
-Average monthly change in billions of dollars--
MEMORANDA:21. Managed liabilities at commercial
banks (22+23)(Adjusted for shifts to IBFs) 5
22. Large time deposits, gross(Adjusted for shifts to IBFs) 5
23. Nondeposit funds(Adjusted for shifts to IBFs) 5
24. Net due to related foreigninstitutions, NSA(Adjusted for shifts to IBFs) 5
25. Other6(Adjusted for shifts to IBFs) 5
26. U.S. government deposits atcommercial banks 7
6.6
7.0
-0.4
-7.2(0.8)-0.9
(-0.7)-6.3(1.5)
0.7 1.1 -8.6(-1.5)
0.9 -1.6 2.3(3.0)
-0.3 -0.7 0.5
-4.7 -2.8
-1.2 -3.1
-3.5 0.3
-14.0(9.9)1.6
(2.3)-15.6(7.6)
-4.5 -1.4 -19.8(1.4)
1.1 1.6 4.2(6.2)
3.4 -0.4 -1.5
1. Quarterly growth rates are computed on a quarterly average basis. Dollar amounts shown under memorandafor quarterly and year over year changes are calculated on an end-month-of-quarter basis.2. Figures in parentheses have been adjusted to remove the distorting effects during 1981 of shifts offunds out of demand deposits and other accounts into NOW accounts. Based on a variety of evidence, it isestimated that 77-1/2 percent of inflows into other checkable deposits--in excess of "trend"--was fromdemand deposits in January, and 72-1/2 percent in other months.3. Overnight and continuing contract RPs issued to the nonbank public by commercial banks, net of amountsheld by money market mutual funds, plus overnight Eurodollar deposits issued by Caribbean branches of U.S.member banks to U.S. nonbank customers. Excludes retail RPs.4. Net of large-denomination time deposits held by money market mutual funds and thrift institutions.5. Numbers in parentheses have been adjusted to remove the effects of shifts of assets and liabilities fromdomestic banking offices to International Banking Facilities (IBFs).6. Consists of borrowings from other than commercial banks in the form of federal funds purchased, securi-ties sold under agreements to repurchase and other liabilities for borrowed money (including borrowingsfrom the Federal Reserve and unaffiliated foreign banks), loans sold to affiliates, loan RPs, and otherminor items. Changes since October 1980 are partially estimated.7. Consists of Treasury demand deposits at commercial banks and Treasury note balance.
3.2(5.1)4.7(4.7)-1.5(0.4)
-2.1(-0.3)
0.6(0.8)
0.2
III-3
large losses over the past two years, were surprised by the sudden upturn
in short rates in the midst of a cyclical decline in the economy.
While the federal government has continued to borrow at an unprece-
dented pace, the total volume of funds raised by other sectors appears to
have fallen considerably in the past two months. Public bond issuance by
nonfinancial corporations declined precipitously from a record high in
November, prompting a step-up in short-term financing. Following a year-
end surge swollen by housing issues, borrowing by state and local govern-
ments has abated somewhat in January. Borrowing by households in the con-
sumer installment and mortgage credit markets evidently has remained weak.
Monetary Aggregates and Bank Credit
M1 grew at an 11 percent annual rate in December, and appears to have
accelerated in January. Part of the spurt in narrow money growth in the
past few months may represent a lagged response to the sizable drop in money
market rates last summer and early fall. That decline in rates reduced the
the opportunity cost of holding transactions balances and evidently inter-
rupted the extraordinary effort by the public to pare transactions balances
that had characterized most of 1981. Some of the recent behavior of narrow
money also may derive from the use of its other checkable deposit (OCD) com-
ponent as a temporary repository for savings as well as transactions bal-
ances. A good part of the increase in M1 since October has reflected a rapid
expansion in OCDs that was part of a broader buildup in liquid short-term
assets; this pattern of growth is consistent with the notion that investors
are unwilling to take on the interest-rate risk and illiquidity associated
with holding longer-term instruments, given prevailing economic uncertainties.
III-4
Related evidence of a heightened preference for liquidity also can
be found in the behavior of the other components of M2. The growth rate
of M2 moderated in December, but at 11-1/4 percent was still relatively
strong. Within the non-transaction component of this aggregate, the more
liquid short-term assets exhibited the stronger rates of growth. In par-
ticular, savings deposits surged in December, posting their largest gain
since the summer of 1980, and the growth of overnight RPs and Eurodollars
remained relatively strong for the second consecutive month.
Growth of shares in money market mutual funds (MMMFs) has zig-zagged
over the past couple of months. Flows into these funds slowed abruptly
during December, with some run-off late in the month. At first glance,
this deceleration would seem to be at odds with the presumption that inves-
tors were placing funds in liquid assets; however, yields switched in mid-
December to favor money market certificates and open market alternatives
to MMMFs, prompting some individuals to scale back their acquisition of
MMMF shares and institutions to withdraw funds.1 To the extent such funds
were shifted into short-term open market paper, the slower December growth
of MMMFs would not contradict the notion of a general shift toward liquid-
ity. In early January, MMMFs have grown more rapidly despite continuing
disadvantageous rate spreads, suggesting that the portfolio adjustments to
changing rate relationships were completed rather quickly.
With M2 moderating, M3 growth also slowed in December, despite a
resumption in large time deposit growth. The December increase in gross
1. It should be noted that the data on money market mutual funds are notseasonally adjusted. Some of the variability in growth during Decemberand January may thus reflect large swings associated with spending andinvestment patterns around the holiday season and the year-end.

III-5
issuance of large time deposits by commercial banks was probably in re-
sponse to an imbalance between a strengthening demand for bank credit and
a slower growth of savings and small time deposits. In January, net issu-
ance of large time deposits appears to have accelerated, leading to some
pickup in M3 growth.
Analysis of bank credit numbers for December and January is compli-
cated by the introduction of International Banking Facilities (IBFs) be-
ginning December 3, 1981.1 The assets of IBFs have grown rapidly, large-
ly because of asset transfers from domestic and offshore offices of the
parent banks. By January 6, IBF assets had grown to $68.7 billion, of
which approximately $38 billion is estimated to have been transferred from
U.S. offices.2
When adjusted by adding back the domestic assets estimated to have
been transferred to IBFs, bank credit accelerated to an 11 percent annual
rate in December. Business loans were particularly strong (20-3/4 percent
expansion), but real estate, consumer, and security loans also registered
significant gains. Data through mid-January for large domestically chart-
ered banks suggest further loan expansion, especially in the business loan
category, although the pace of business lending appears to have slowed from
that of December. Securities holdings turned up in December.
1. See Appendix IV-A for a discussion of the nature of International Bank-ing Facilities and their effect on bank asset and liability growth.2. While the bank credit measure has been affected significantly by shiftsof assets from domestic offices to IBFs, the impact on the monetary aggre-gates has been slight. Based on reports of liabilities shifted from domes-tic offices to IBFs, virtually no demand deposit balances were shifted inDecember, and only about $750 million of large time deposits were transfer-
red on a monthly average basis. Consequently, M3 growth was reduced byless than 1/2 percentage point in that month.

III-6
COMMERCIAL BANK CREDIT AND SHORT- AND INTERMEDIATE-TERM BUSINESS CREDIT(Percentage changes at annual rates, based on seasonally adjusted data)
1
1981 QIV 80to
Q2 Q3 Q4 Oct. Nov. Dec. QIV 81
---- Commercial Bank Credit ------
10.9 6.8 - .1 5.7 3.5 -9.3 8.2(6.8)
7.2 .5 4.6
13.5 -12.0 -8.1
4.0 7.2 10.8
12.2 9.0 -1.7(7.5)
16.6 17.7 -2.7(10.4)
28.6 -36.2 58.6
10.8 8.0 6.8
1. Total loans and investmentsat banks2 3
(Adjusted for shifts to IBFs)
2. Investments
3. Treasury securities
4. Other securities
5. Total loans2 3(Adjusted for shifts to IBFs)
6. Business loans2 3(Adjusted for shifts to IBFs)
7. Security loans
8. Real estate loans
9. Consumer loans
10. Total short- and intermediate-term business credit (sum oflines 14, 15 and 16)
11. Business loans net ofbankers acceptances 3
(Adjusted for shifts to IBFs)
12. Commercial oaer issued bynonfinancial firms
4
13. Sum of lines 11 & 12 3(Adjusted for shifts to IBFs)
14. Line 13 plus loans atforeign branches 5 3
(Adjusted for shifts to IBFs)
15. Finance company loans tobusiness
6
16. Total bankers acceptancesoutstanding6
4.4 4.1
and Intermediate-
(11.1)
8.9 1.1 3.9
- 7.4 -23.5 6.5
16.5 13.1 2.6
4.6 4.3 -13.9(13.6)
10.6 - .3 -18.4(20.7)
31.4 85.7 51.4
5.1 5.5 9.7
1.3 2.0 9.1
Term Business Credit -
(8.8)
6.5
2.6
8.5
8.8(9.6)
12.6(13.8)
20.9
9.7
3.0
19.9 23.4 n.a. 10.3 14.9 n.a. n.a.
16.2 19.6 -3.0(10.5)
43.5 61.2 32.5
19.1 24.4 1.5(13.3)
19.0 26.2 4.9(16.4)
9.2 1.3 -19.2 12.8(20.9) (14.0)
7.1 54.3 33.9
8.9 8.0 -12.3(22.5)
44.7
16.1(17.2)
12.8 11.8 -9.7 18.0(24.2) (19.1)
19.3 14.7 n.a. 3.0 12.2 n.a. n.a.
26.6 16.6 n.a. 3.7 38.6 n.a. n.a.
1.3
- Short-
1. Average of Wednesdays for domestic-chartered banks and average of currentmonths for foreign-related institutions.
and preceding ends of
2. Loans include outstanding amounts of loans reported as sold outright to a bank's own foreign bran-ches, unconsolidated nonhank affiliates of the bank, the bank's holding company (if not a bank), andunconsolidated nonbank subsidiaries of the holding company.3. 'lumbers in parentheses have been adjusted to remove the effects of shifts of assets from domesticbanking offices to International Banking Facilities (IBFs).4. Average of Wednesdays.5. Loans at foreign branches are loans made to U.S. firms by foreign branches of domestic-charteredbanks.6. Based on average of current and preceding ends of month.n.a.--not available.

III-7
Business Finance
With the further backup in rates since the December FOMC meeting,
corporate bond yields now have retraced about half of their fall rally.
The Board's index of recently offered Aaa-rated utility bonds once again
has edged above 16 percent. Yield spreads between lower- and higher-rated
corporate bonds and between corporate and Treasury bonds have changed lit-
tle on balance, which is somewhat surprising in view of the overall rise
in yields and the weakening economic conditions. With the full impact of
the recession on cash flows yet to be felt, there already have been extra-
ordinary numbers of downgradings, dividend reductions, and bankruptcy fil-
ings over the past year.
Potential bond issuers backed away quickly from the weakening market.1
A large volume of previously registered domestic offerings thus remains on
the shelf, awaiting more favorable conditions for long-term financing. In
the meantime, nonfinancial firms have concentrated their short-term borrow-
ing at commercial banks, where business lending adjusted for IBFs picked
up considerably in December following two months of reduced growth. Some
of this strength may reflect the fall-off in lending by foreign branches
of U.S. banks to U.S. residents as a decrease in the spread between the
domestic prime rate and Eurodollar rates reduced the incentive of compan-
ies to use LIBOR pricing options. Commercial paper issuance by nonfinan-
cial corporations was fairly strong in December, but appears to have dried
up in early January; moreover, paper issuance by financial subsidiaries of
1. Several corporations have sold original issue discount bonds abroad inrecent weeks. These Eurobond issues appear to have received relatively fav-orable rates; demand by Japanese investors in particular was reported to be
heavy.

III-8
GROSS OFFERINGS OF CORPORATE SECURITIES(Monthly totals or monthly averages, millions of dollars)
1981 1982
H1 Q3 Q4 Nov. Dec. Jan.
------------ Seasonally adjusted ------------
Corporate securities--totalPublicly offered bonds1Privately placed bondsStocks
Publicly offered bonds--total1By industry
UtilityIndustrialFinancial
By quality2
Aaa and AaA and BaaLess than Baa3
6,1053,093
6452,367
4,0471,603
5871,857
7,3605,461
3801,519
10,5578,410
1761,971
7,3175,405
7001,212
---------- Not seasonally adjusted -----------
3,318
1,2001,336
782
1,0801,696
542
Memo items:Convertible bondsOriginal discount bonds
Par valueGross proceeds
1,676 4,114
960 1,067345 1,566371 1,481
685 1,881627 1,706364 527
150
6,560 3,200
1,1882,9322,440
3,6682,050
842
235
530 1,478 3,500191 676 1,601
1,0651,180
955
1,2651,490
445
565
800322
Stocks--totalBy industry
UtilityIndustrialFinancial
2,369 1,701 1,564 1,794 1,400
7561,305
308
577721403
455799310
400800200
p--preliminary, f--forecast.1. Total reflects gross proceeds rather thanbonds.
par value of original discount
Bonds categorized according to Moody's bond ratings.Includes issues not rated by Moody's.
1,865615400850

III-9
domestic auto manufacturers declined sharply as cutbacks in dealer inven-
tories pared their financing needs.
Share prices have fallen substantially since early December. Most
major composite indexes have declined from 6 to 12 percent since the Decem-
ber FOMC meeting and are currently close to their near-term lows of late
September. Reflecting the drop in prices, the pace of gross stock offer-
ings in December and January was sluggish by recent standards, running at
about one-third the record rate observed for the first half of 1981. The
retirement of shares through mergers--the U.S. Steel acquisition of Mara-
thon Oil being the most important recent example--has continued to push
net equity issuance into negative territory, despite the current popular-
ity of stock-for-debt exchanges. Such exchanges, when conducted in accor-
dance with IRS guidelines, permit firms to achieve, in effect, tax-free
capital gains by purchasing outstanding debt at well below par; they have
totaled at least $1 billion since September.
Government Finance
Federal Sector. The U.S. Treasury continued to place heavy demands
on credit markets as the year drew to a close. It raised $15.5 billion
through marketable borrowing in December--$6.1 billion in regular weekly
and monthly bill auctions, $5.0 billion through cash management bills
maturing in both January and April, and the remaining $4.4 billion in
auctions of 2-, 4-, and 5-year notes. For the fourth quarter as a whole,
the Treasury raised $37-1/2 billion in new money through the issuance of
marketable securities to finance a record quarterly deficit of $50 billion.

III-10
FEDERAL GOVERNMENT AND SPONSORED AGENCY FINANCING 1
(Total for period; billions of dollars)
1981 1982e e f f
FY81 Dec. Q4 Jan. Q1
Treasury financing
Combined surplus/deficit(-) -78.9 -19.2 -50.5 8.7 -28.0
Means of financing deficit:
(1) Net cash borrowingfrom the public 79.4 14.3 35.7 10.1 33.8
Marketable borrowings/repayments(-) 88.9 15.5 37.5 10.8 36.1Bills 23.0 11.1 21.6 5.7 17.9Coupons 65.9 4.4 15.9 5.1 18.2
Nonmarketable -9.5 -1.2 -1.8 -. 7 -2.3
(2) Decrease in the cashbalance 2.3 -4.2 6.7 -11.1 1.2
(3) Other means of finance 2 -2.7 -9.1 8.2 -7.7 -7.0
Federally sponsored creditagencies net cash borrowing3 37.5 .3 2.9 - 3.1
e--estimated. f--forecast.1. Numbers reported on a not seasonally adjusted, payment basis.2. Includes checks issued less checks paid, accrued items and othertransactions.3. Includes debt of Federal Home Loan Banks, the Federal Home Loan Mort-gage Corporation, Federal National Mortgage Association, and the FederalFarm Credit Bank System.

III-11
Its cash balance was depleted by $6-3/4 billion, and other means of finance
provided another $8 billion or so. 1
The Treasury is likely to raise nearly as much new money in the mar-
ket during the first quarter as it did in the fourth, even though it faces
a smaller combined deficit, estimated at about $28 billion. The staff ex-
pects marketable borrowing to outstrip the deficit as other means of finance
drain $7 billion and nonmarketable securities decline about $2-1/2 billion.
During January, the Treasury raised $5.1 billion through the sale of 7-year
notes and 20-year bonds, and it raised another $1.3 billion in an auction
of 2-year notes that will be issued at the beginning of February. Moreover,
the weekly and monthly bill auctions were enlarged recently, and are expect-
ed to raise $5.7 billion in January. The Treasury also will be conducting
its mid-quarter refunding in early February.
Net borrowing by federally sponsored agencies remained weak in Decem-
ber, amounting to only $300 million (NSA). Most of this borrowing was done
by FNMA, which used the proceeds to buy mortgages. FHLBs raised very lit-
tle money in December as their lending to thrift institutions continued to
be small. A sharp drop in borrowing by the Federal Farm Credit Banks over
the past few months appears to reflect a substitution by farmers of cheaper
sources of finance and, possibly, some further curtailment of agricultural
investment expenditures due to the adverse economic conditions in this sec-
1. The social security payment for January was pushed forward to December,increasing the deficit, but also raising the amount of uncashed Treasurychecks outstanding at the end of the fourth quarter. As a result, "othermeans of finance" was large and positive in the fourth quarter but accord-ingly will be large and negative in the first quarter.

III-12
RATIO OF TAX-EXEMPT TO TAXABLE YIELDS l
(Monthly)
Percent
-1 80
1974 1976 1978 1980 1982I/ Moody's Aaa-rated municipal yield as a percent of the FRB recently
offered Aaa corporate yield.
Note: The figure for January 1982 is based upon data for three weeks.
STATE & LOCAL GOVERNMENT SECURITY OFFERINGS(Monthly averages, billions of dollars)
1981 1982
H1 Q3 Q4e Nov.e Dec.e Jan.
------------- Seasonally adjusted -------------
Total 6.61 6.46 8.60 7.80 9.00 7.50Long-term 3.79 3.79 4.30 4.80 4.70 3.80Short-term 2.82 2.77 4.30 3.00 4.30 3.70
----------- Not seasonally adjusted ----------
Total 6.50 6.11 7.50 7.80 7.20 6.30Long-term 3.87 3.34 4.30 5.00 4.30 3.50
Hsg. rev. bonds .38 .24 .60 .90 .95 .05Short-term 2.63 2.77 3.20 2.80 2.90 2.80
e--estimate. f--forecast.

III-13
tor. 1 All three agencies engaged in a considerable amount of debt restruc-
turing, however, replacing $3 billion in short-term bonds and discount notes
notes with longer-term debt. Available data for January indicate that net
agency borrowing has continued at about the pace set in December.
State and Local Sector. Gross issuance of long-term municipal securi-
ties maintained considerable strength through the end of the year, in spite
of escalating rates, but partial data indicate a decline for January. The
recent pattern in municipal offerings has been strongly influenced by the
behavior of mortgage bond issuance. Under the provisions of the 1980 Mort-
gage Subsidy Bond Act, issuers are subject to yearly limits on the quantity
of such bonds that can he sold. Consequently, issuers who had waited vainly
for rates to fall earlier in 1981 found themselves having to "use it or lose
it" in December, and many appear to have chosen to use it. The recent rise
in interest rates, however, taken together with the greater flexibility with
regard to timing that the new year permits for housing issues, has led to a
reduction in the volume of long-term municipal offerings.
Although municipal bond rates are now only slightly above their mid-
December levels, they reached new highs during the intermeeting period.
Over the past year, ratios of tax-exempt to taxable bond yields have risen
to historically high levels (see chart). Much of this movement in relative
returns can be attributed to the virtual exodus of traditional institutional
investors from the long-term tax-exempt market, which has left individuals
swamped by the persistent flood of paper. Underwriting losses of property
1. The runoff in debt by the Farm Credit Banks in December was confinedto shorter-term obligations as mortgage lending by Federal Land Banks con-tinued to be large. Over the fourth quarter, short-term inventory loansextended to farmers by the Commodity Credit Corporation showed a sharp in-crease of $3.7 billion according to staff estimates.

III-14
and liability insurance companies have greatly diminished the demand for
tax-exempt securities by firms in this industry. In addition, various
changes in the personal income tax code--notably the reduction in marginal
tax rates and possibly the liberalization of eligibility and other provi-
sions governing IRA and Keogh accounts--have reduced the relative attrac-
tiveness of municipal obligations for many individuals.1
Insurance Companies
While property and liability (P/L) investment income rose to a record
$13.4 billion in 1981, underwriting losses reached a record $6 billion.
Underwriting losses have been growing since 1979, reflecting the impact of
inflation on claims, widespread rate-cutting to attract customers, and accep-
tance of relatively risky policies in order to enhance the cash flow avail-
able for investment. As a consequence, P/L companies--typically large pur-
chasers of tax-exempts--found little need to shield taxable interest income
and reduced their acquisitions of such securities in 1981 to only $3 bil-
lion--less than one-third of the annual average increase over the 1977-1980
period. In contrast, their purchases of taxable debt securities surged to
a record $11-1/2 billion in 1981.
Life insurance companies (LICOs) continued to experience cash flow
pressures in 1981, as persistently high rates of interest stimulated large
policy loan extensions and voluntary policy terminations. Preliminary data
for November 1981 show that net policy loan extensions through the first 11
1. Available data do not permit any assessment of the quantitative impor-tance of the change in retirement account rules; it seems likely that actualflows of funds to date have been small, although public interest obviouslyhas been considerable. Investors face a confusing array of alternatives,and many firms are still exploring payroll deduction schemes. Moreover,individuals have until April 1983 to make their contributions for the cur-rent tax year.
III-15
months of that year amounted to $7.1 billion, already $500 million more
than the previous annual record set in 1980. Furthermore, industry
sources indicate that cash surrender values on policies terminated dur-
ing 1981 may have surpassed the record $6.7 billion figure of 1980.
Accordingly, LICOs adjusted their portfolio management strategies
in an effort to limit their vulnerability to changes in market conditions.
One such adjustment was to increase holdings of short-term assets, primar-
ily commercial paper. In managing their long-term portfolios, LICOs
increased the liquidity of their holdings by purchasing more government
securities and publicly offered corporate bonds, as well as by shortening
the average maturity of their acquisitions from 15 years to about 10 years.
At the same time, they substantially reduced their commitments to purchase
corporate bonds and mortgages. Partly as a result of these developments,
the gross volume of privately placed corporate bonds--for which LICOs are
the primary customers--shrank to an estimated $7-1/2 billion in 1981, the
lowest in seven years. Net acquisitions of mortgages by LICOs have drop-
ped to the lowest level in three years. In contrast, their net direct
investment in real estate rose significantly in 1981, as equity in office
buildings became more attractive.
Mortgage Markets
Mortgage lending activity appears to have shown only a small response
to the moderate easing in mortgage rates that occurred last fall. S&Ls
issued $4.7 billion (seasonally adjusted) in new mortgage commitments in
December, up slightly further from the extremely low levels of September
and October. New commitments at federal and related agencies were stronger
during November, although much of the activity may reflect the FHLMC program

III-16
SECONDARY MARKET FOR HOME MORTGAGES
FNMA auctions of forward purchase commitments 1Conventional FHA/VA Yield on GNMA
securities forAmount Yield Amount Yield immediate
($ millions) to FNMA ($ millions) to FNMA delivery2
Offered Accepted (percent) Offered Accepted (percent) (percent)
1980--HighLow
1981--HighLow
Nov. 29162330
Dec. 7142128
17.5112.76
19.2214.83
17.51
16.89
16.82
17.07
17.331982--Jan.
15.9312.28
19.2314.84
16.82
16.49
16.76
17.08
17.56
18.05
14.4110.79
17.4613.18
16.0815.1514.6214.6814.96
15.3615.4515.4515.75
15.9816.2916.2016.30
Auction yields on fixed-rate level-payment loans are gross, before deduction ofbasis points for mortgage servicing.Average net yields to investors assuming prepayment in 12 years on pools of 30-yearA/VA level-payment mortgages typically carrying the prevailing ceiling rate on such)ans.

III-17
introduced in October to buy outstanding mortgages that bear below-market
rates. The volume of commitments for new loans accepted in secondary mar-
ket auctions during recent weeks has been close to--or below--the extremely
low levels experienced when interest rates were at their peaks.
The volume of mortgage takedowns around year-end remained quite de-
pressed, according to the data that are currently available. In December,
loan repayments to S&Ls exceeded new loans made by these institutions for
the third month in a row. This three-month decline was only the second
shrinkage in S&L mortgage portfolios to occur in several decades; the first
occurred in the spring of 1980. Commercial bank real estate lending, which
in October and November also had fallen to the lowest level since the spring
of 1980, rebounded noticeably in December. During November, the volume of
net mortgage lending at federal agencies increased somewhat, as commitments
made earlier were taken down.
The most serious constraint on mortgage lending clearly has been the
high cost of such credit. Moreover, rates on new commitments and in the
secondary market have turned up in recent weeks; the average quotation on
S&L commitments for conventional fixed-rate home mortgages has climbed 70
basis points since the last FOMC meeting--to 17.6 percent in late January--
while yields in FNMA auctions for FHA/VA loans have risen about 150 basis
points since late November, and yields for GNMA-guaranteed, mortgage-backed
securities also have posted considerable increases. With discounts on FHA/
VA loans rising sharply, the ceiling rate on these home mortgages was raised
to 16-1/2 from 15-1/2 percent, effective January 25, 1982.
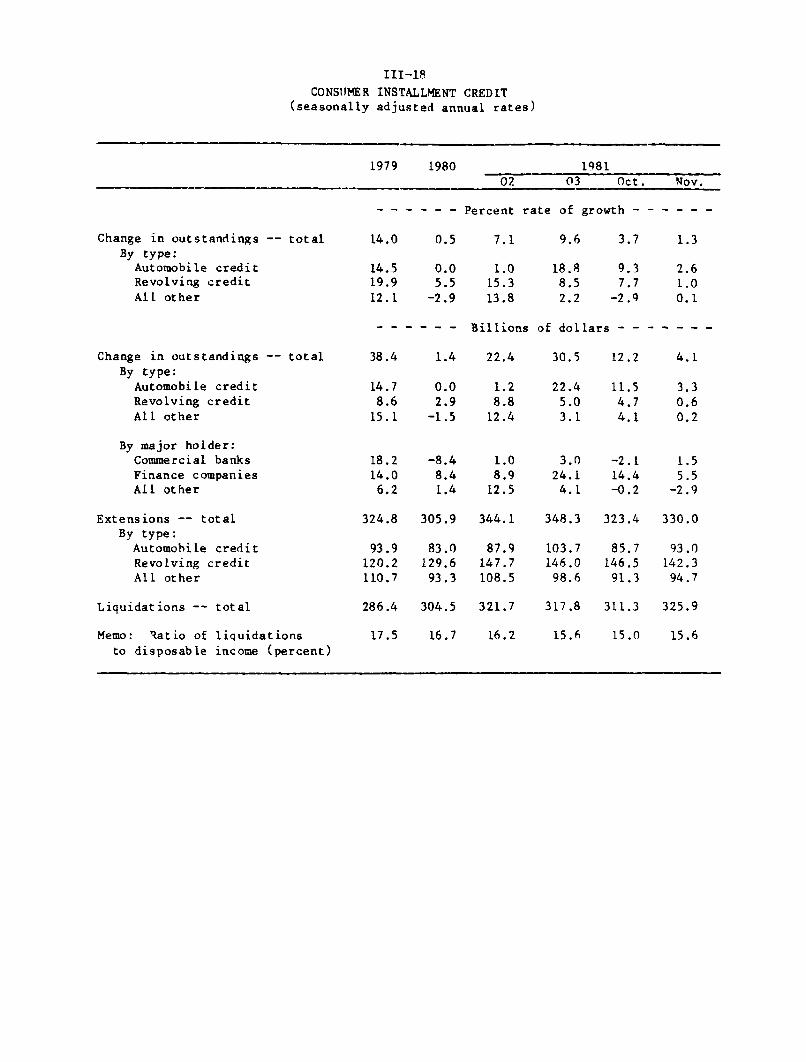
CONSUMER INSTALLMENT CREDIT(seasonally adjusted annual rates)
III-18
1979 1980 198102 03 Oct. Nov.
- - - - - - Percent rate of growth -
Change in outstandings -- totalBy type:
Automobile creditRevolving creditAll other
Change in outstandings -- totalBy type:
Automobile creditRevolving creditAll other
By major holder:Commercial banksFinance companiesAll other
Extensions -- totalBy type:
Automobile credit
Revolving creditAll other
14.0 0.5
14.519.912.1
0.05.5
-2.9
7.1
1.015.313.8
9.6
18.88.52.2
3.7
9.37.7-2.9
Billions of dollars - - - - - - -
38.4 1.4 22.4 30.5 12.2
14.78.6
15.1
18.214.0
6.2
0.02.9
-1.5
-8.48.41.4
1.28.8
12.4
1.08.9
12.5
22.45.03.1
3.024.14.1
11.54.74.1
-2.114.4-0.2
4.1
3.30.60.2
1.55.5
-2.9
324.8 305.9 344.1 348.3 323.4 330.0
93.9120.2110.7
83.0129.6
93.3
87.9147.7108.5
103.7146.098.6
85.7146.591.3
93.0142.3
94.7
Liquidations -- total 286.4 304.5 321.7 317.8 311.3 325.9
Memo: Ratio of liquidations
to disposable income (percent)
17.5 16.7 16.2 15.6 15.0 15.6
--

III-19
Consumer Credit
Growth in consumer installment credit slowed to a 1 percent annual
rate during November--the lowest rate since the end of the consumer credit
restraint program in July 1980. The weakness in consumer credit was perva-
sive. Although gross extensions of auto credit did increase--reflecting
some improvement in unit auto sales from October--this boost was more than
offset by a large rise in auto credit liquidations. Revolving credit and
"other" credit were virtually unchanged, mirroring the continued stagnation
in non-automotive, non-food retail expenditures. As noted above, however,
consumer lending at banks picked up in December.
Average rates on new-auto loans at finance companies were a full per-
centage point higher in November than in August, about double the increase
in the average "most common" rate charged on commercial bank auto credit.
The large increase in the finance company auto loan rate was due in part to
the termination of a program through which the General Motors Acceptance
Corporation was extending credit to customers at below-market rates.
Delinquencies on commercial bank installment credit and on auto loans
at finance companies continued to decline through the third quarter, but
delinquencies on mortgages have risen further through November. Third-quar-
ter data on home mortgage delinquencies reveal that much of the increase
has occurred, not surprisingly, in the North Central states, where the
effects of unemployment have been the strongest and most protracted. Much
of the rise in mortgage delinquency rates during 1981 has involved conven-
tional home mortgages, suggesting that the effects of economic weakness now
are being felt by those borrowers who had been able to post the higher down-
payments ordinarily needed to obtain conventional mortgage financing.

INTERNATIONAL DEVELOPMENTS
Foreign Exchange Markets
Since the last FOMC the dollar's value in foreign exchange
markets has remained firm, and in the past ten days it has generally
risen. Overall, the dollar's weighted-average value climbed by 1-1/2
percent. These movements are indicated in the chart on the next page.
Changes against individual foreign currencies have been rather diverse.
Against the yen the dollar appreciated by 3-1/2 percent, whereas against
the German mark and Canadian dollar the rise was a little less than
1 percent, and against the pound sterling a small net depreciation
was registered.
The major factor dominating exchange-market attention during
the past six weeks appears to have been current and prospective
interest-rate developments in the major industrial countries. Short-
term U.S. rates and Eurodollar rates have remained firm, and even
climbed further until early this week, whereas foreign short-term
interest rates have dropped noticeably in the past three weeks.
As a result, the differential between returns on dollar assets and a
weighted-average of foreign rates rose from about 0.5 percentage
points in late December to around 2.0 percentage points at the end
of last week. Money-market rates have declined in several foreign
countries, notably Germany, France, and the United Kingdom. Last
week the Bundesbank cut its special Lombard rate and the Netherlands
Bank reduced its official lending rates by 0.5 percentage points
each, and the Bank of England lowered some repurchase rates in several
stages by about the same amount.
IV-1

STRICTLY CONFIDENTIAL (FR)
CLASS II FOMC
1 27 82
WEIGHTED AVERAGE EXCHANGE VALUE OF THE U.S. DOLLAR March 1973=100
November December January1981 1982
IV-2
October

IV-3
Exchange-market participants now reportedly expect U.S. interest
rates to remain high, or perhaps even rise, for the foreseeable future.
During the past few weeks considerable attention has been given to the
weekly money supply figures and to the outlook for substantial govern-
ment budget deficits for 1982 and 1983. Following the early-January
money-supply figures, Eurodollar rates jumped by around 1 percentage
point, and the dollar surged still higher in the exchange markets,
reaching about the DM 2.35 and Y230 levels on Monday before dropping
back at mid-week.
The Belgian franc has remained at the bottom of the EMS currency
spread, and at various times the Dutch guilder, French franc, and

IV-4
Italian lira have been at or near the top. For the most part, however,
the currency band has not been fully extended, and EMS currencies
have traded comfortably within their agreed margins from central rates.
IV-5
Borrowing in international capital markets. The gross amount of
funds raised in the markets for medium-term Eurocurrency bank credits,
Eurobonds, and foreign bonds increased in 1981 to about $185 billion, a
rise of $66 billion from the previous year. (See table on next page.)
Two-thirds of the increase reflected arrangements by U.S. companies of
credits for possible takeovers. U.S. companies also raised an increased
amount through Eurocredits for purposes other than takeovers, credits to
non-OPEC developing countries rebounded following their decline in 1980,
and international bond issues increased considerably.
The volume of new medium-term Eurocurrency credits announced in
1981, amounting to $132 billion, was $55 billion more than in the preceding
year. An estimated $42 billion was arranged by U.S. companies in connec-
tion with possible takeover efforts involving the U.S. oil industry.
Almost all of these were in July; a high percentage of them have not been
drawn and may never be. U.S. companies also arranged a further $12 bil-
lion of Eurocredits for other purposes, an amount almost twice as large
as the total volume of such credits raised by U.S. companies in 1980.
Eurocredits to non-OPEC developing countries recovered in 1981 from
the depressed levels of the year before, reaching $33 billion compared
with $24 billion in 1980. However, the 1981 volume was actually less
than the $35 billion raised by the non-OPEC developing countries in 1979;
all of the seven largest borrowers in this group, except Chile, arranged
less credit in 1981 than in 1979. Among other country groups, foreign
industrial countries and OPEC countries each arranged about the same
volume of credits as in 1980. Borrowings arranged by Communist countries,
already reduced in 1980, declined sharply after mid-1981.

IV-6
GROSS BORROWING IN INTERNATIONAL CAPITAL MARKETS(Billions of dollars)
1979 1980 1981
year year year 1st H Q-3 Q-4
I. Total 123.8 119.3 185.8 60.8 77.3 47.7
II. Medium-Term Eurocredits 82.8 77.4 132.3 38.9 65.3 28.1Industrial countries 27.2 39.1 86.0 16.0 54.7 15.3
of which: U.S. (2.3) (6.7) (54.2) (1.3) (46.5) (6.4)others (24.9) (32.4) (32.0) (14.7) (8.4) (8.9)
Non-OPEC developingcountries 35.2 24.0 33.1 17.6 7.3 8.2of which: Brazil (6.3) (4.2) (5.7) (2.6) (1.4) (1.7)
Mexico (8.2) (6.0) (7.5) (5.0) (1.3) (1.2)Others (20.7) (13.8) (19.9) (10.0) (4.6) (5.3)
OPEC countries 12.7 11.0 11.7 4.1 3.2 4.4Communist countries 7.3 2.8 1.5 1.1 .2 .2International org.'s .3 .4 .1 .1 0 0
III. Bonds (Euro- and Foreign) 41.0 41.9 53.5 21.9 12.0 19.6Industrial countries 31.9 32.7 41.7 17.1 9.7 14.9
of which: U.S. (6.8) (5.6) (6.8) (3.2) (1.2) (2.4)
Non-OPEC developingcountries 2.7 1.9 4.1 1.6 1.1 1.4of which: Mexico (.4) (.5) (2.9) (1.2) (.8) (.9)
others (2.3) (1.4) (1.2) (.4) (.3) (.5)OPEC countries .4 .5 .4 .3 */ .1Communist countries .1 .1 .1 .1 0 */International org.'s 5.9 6.6 7.2 2.8 1.2 3.2
Eurobonds, by currency:U.S. dollar 12.6 16.4 26.7 10.5 6.3 9.9
German mark 3.6 3.6 1.3 .2 .3 .8
other 2.5 4.0 3.5 1.9 .6 1.0Total, Eurobonds 18.7 24.0 31.5 12.6 7.2 11.7
Foreign bonds, bymarket:United States 4.5 3.4 8.4 3.3 1.5 3.6Switzerland 9.8 7.6 8.3 3.7 2.1 2.5Japan 1.8 1.1 2.4 1.2 .5 .7Germany 5.4 4.8 1.3 .4 .2 .7other .8 1.1 1.6 .7 .5 .4
Total, foreignbonds 22.3 18.0 22.0 9.3 4.8 7.9
*/ Less than $0.1 billion.
Source: Morgan Guaranty Trust Co.

IV-7
New Eurobond and foreign bond issues rose from $42 billion in 1980
to $53-1/2 billion in 1981, principally reflecting larger Eurobond offer-
ings. Borrowers in industrial countries, together with international
institutions, continued to account for a very high percentage of total
international bond issues, but there was a surge in issues by Mexico,
which raised almost $3 billion in the bond markets last year. Borrowings
by U.S. companies were not greatly different from the previous two years.
The proportion of Eurobonds denominated in dollars, which had been two-
thirds in 1979 and 1980, rose to 85 percent last year, while the share
(and absolute amount) denominated in German marks fell sharply. These
changes resulted from the strength of the dollar on the exchange markets
and from Germany's prohibition of DM-denominated bond issues by non-
German borrowers in the first quarter of 1981 in an effort to reduce
capital outflows and strengthen the mark. That prohibition also
contributed to a sharp reduction in the volume of foreign issues in the
German capital market, but this was more than offset by increased foreign
issues in the U.S., Swiss, and Japanese markets. In the U.S. market
there were large increases by Canadian issuers, international institutions,
and other foreigners, especially in the closing months of the year.

IV - 8
U.S. International Transactions
The U.S. merchandise trade deficit was only marginally smaller in
November than in the month before. For the two months combined the
deficit was $49 billion at an annual rate, substantially larger than the
deficits recorded during the previous six quarters. A rise in imports
accounted for much of the increased deficit.
Despite a slowing of U.S. economic activity since the spring of
1981, the volume of imports has continued to grow, particularly in
October-November. The October-November rise over the third-quarter
level was spread among commodity categories -- with notable increases
in capital goods, consumer goods, and oil imports, and lesser growth in
imports of industrial supplies and automotive products.
U.S. Merchandise Trade*
Value (Bil. $. SAAR)Exports
AgriculturalNonagricultural
ImportsPetroleumNonpetroleum
Trade Balance
Years
1980 1981 1/
224.0 237,742.2 44.6
181,7 193.1
249.3 267.078.9 79.4
170.4 187.6
-25.3 -29.3
1 9 8 11
93 Oct./Nov Nov.01
244.450.9
193.5
263.183.3179.8
-18.7
09
241.944.3
197.6
269.584.8
184.7
-27.6
232.140.2192.0
260.371.8
188.5
-28.2
229 942.4
187.5
279.276.6
202.6
-49.2
230.641.2
189.4
276.878.8
197.9
-A,1
Volume (Bil. 72$, SAAR)Exports - Agricultural 18.1 18.1 19.5 17.5 16.9 18.5 18.0
- Nonagric. 73.4 71.0 73.2 73.3 69.6 66.4 67.1
Imports - Petroleum 6.8 6.0 6.3 6.2 5.6 6.1 6.3
- Nonpetrol. 67.6 72.3 67.8 70.7 73.5 79.6 78.0
*/ International Transactions and GNP basis.1/ 11 months at an annual rate.
Monthly data are estimated.

IV - 9
The volume of oil imports rose slightly in October-November from
a low third-quarter rate, partly as a result of increased arrivals for
the Strategic Petroleum Reserve, but oil imports in the second half of
1981 remained below the average rate in the first half,
1981 U.S. Oil Imports
1Q 2Q 3Q Oct./Nov.Volume (mbd, SA) 6.59 6.52 5.91 6.47Price ($/BBL) 34.63 35.62 33.27 32.43Value (Bil. $, SAAR) 83.3 84.8 71.8 76.6
Agricultural exports increased in value in October-November from
the low third-quarter rate despite continued declines in prices. Of
the major export commodities, wheat export prices declined 11 percent,
corn prices dropped 24 percent, and soybean prices fell by 18 percent
from January to November. The volume exported in October-November was
almost as large as in the strong first quarter, with stepped-up ship-
ments to Western Europe, Eastern Europe, and the developing countries.
Nonagricultural exports have declined since the second quarter,
with most of the decreases in civilian aircraft exports, in automotive
exports to Canada, and in gold exports. Other industrial supplies and
machinery exports (which together account for two thirds of nonagricultural
exports) have been essentially unchanged since spring.
Turning to U.S. international financial transactions, the opening
of International Banking Facilities (IBFs) in early December produced
substantial gross shifts of eligible claims and liabilities from banks'
own foreign offices to IBFs but no net effect on US. international

IV - 10
1/capital flows. Shifts to IBFs from related foreign offices -- from
early December through mid-January--have consisted primarily of IBF-
eligible-foreign loans which were accompanied by an estimated $13 billion
in net borrowing by IBFs from related foreign offices. Overall, U.S.
banking offices (including IBFs) increased their net borrowings from own
foreign offices by $7.6 billion in the December-January period (line l(a)
in the table below) as U.S. offices -- other than IBFs -- reduced their
net borrowings from own foreign offices.
Loans to U.S. nonbank residents from foreign branches of U.S. banks
reached $13.2 billion, on a daily average basis, in December, $4 billion
greater than in September. However, the volume of these loans fell some-
what in January as the differential between prime and LIBOR, which had
reached 400 basis points in November, narrowed to less than 200 basis
points. Total Eurodollar holdings of U.S. nonbanks rose $4.5 billion in
November, bringing the cumulative increase for the year to $29 billion.
U.S. net purchases of foreign securities reached $2 billion in
November as foreign borrowers responded to the U.S. bond market rally.
Subsequently, the volume of new foreign bond issues in the U.S. market
tapered off as bond market conditions deteriorated.
Foreign official holdings of assets in the United States increased
by $5 billion in November. Partial data, based on holdings at the FRBNY,
indicated little further net change in December in either G-10 or OPEC
countries' accounts.
1/ A detailed discussion of IBFs appears as Appendix IV-A.

IV - 11
International Banking Data(billions of dollars)
1. U.S. Banking Offices'(including IBFs)Positions Vis-a-vis OwnForeign Offices 1/(a) Total(b) U.S.-Chartered Banks(c) Foreign-Chartered Banks
2. Credit Extended to U.S.Nonbank Residents byForeign Branches of U.S. banks 2/
3. Eurodollar Holdings of U.S.Nonbank Residents 3/
1980Dec Mar. June
6.5-15.2
21.7
4.2
60.8
3.0-17.220.2
3.0-14.917.9
1981Sept. Nov Dec
7.3-12.519.8
2.4-14.817.2
8.9-10.219.0
7.0 7.1 9.2 12.0 13.2
66.3 76.8 86.8 91.2 n.a.
Jan.
10.0-7.117.1
12.7
n.a.
1/ Averages of Wednesday, net due to own foreign office = (+).2/ Daily Averages.3/ End of month*/ Average of Wednesdays through January 13.

IV - 12
Summary of U.S. International Transactions(in billions of dollars)
Banks1. Change in net foreign positions of banking
offices in the U.S. (+ = inflow)1/
Securities2. Private securities transactions, net
a) Foreign net purchases (+) of U.S.corp. bonds
b) Foreign net purchases (+) of U.S.corp. stocks
c) U.S. net purchases (-) of foreignsecurities
3. Foreign net purchases (+) of U.S. Treasuryobligations 2/
Official4. Changes in foreign official reserves assets
in U.S. (+ = increase)
a) By areaG-10 countries and SwitzerlandOPECAll other countries
b) By typeU.S. Treasury securitiesOther 3/
5. Changes in U.S. official reserve assets(+ = decrease) 4/
Other transactions (Quarterly data)6. U.S. direct investment (-) abroad7. Foreign direct investment (+) in U.S.8. Other capital flows (+ = inflow) 5/ 6/9. U.S. current account balance 6/
10. Statistical Discrepancy 6/
1980Year
"-29.8
2.5
1.2
4.3
-3.0
2.7
14.9
-2.512.15.3
9.75.2
-7.8
-18.510.9-8.2
3.729.6
Q-1 Q-2 Q-i
-11.8 -6.4
1.9 1.7 .4
.7 .6 .6
1.7 2.6 .1
-. 5 -1.4 -. 4
1.4 .7 -. 8
5.5 -3.0 -5.5
1.9 -7.9 -5.65.7 2.5 2.5
-2.1 2.4 -2.4
7.2 -2.1 -4.6-1.6 -. 9 -. 9
-3.7
-1.62.5
-8.43.3
10.9
.8 -. 1
-4.93.8-1.71.17.9
198 1Aug. Sept. UCt. Nov.
-1.9 -.6 -1.5 -5.5
-2.0
*
.1
-2.1
-. 1 -. 2
.1 . 1
* -. 1
-. 2 -. 2
.3 -.5 .1 -. 2
-4.6 -. 8 -1.8 4.6
-2.8 -1.4 -3.0 2.2-1.6 1.7 1.6 1.2-.2 -1.1 -.4 1.3
-1.7 -1.4 .1 2.9-3.0 .6 -2.0 1.7
-.4 -.5 -.5 -.8
MEMO:U.S. merchandise trade balance -- part of line 9(Balance of payments basis, seasonally adjusted) -25.3 -4.7 -6.9 -7.0 -4.5 -1.6 -4.4 -3.8
I/ Excludes liabilities to foreign official institutions./ Includes U.S. Treasury notes publicly issued to private foreign residents.3/ Includes deposits in banks, commercial paper, acceptances, & borrowing under repurchase agreements.T/ Includes newly allocated SDR's of $1.1 billion in January 1979; $1.2 billion in January 1980,; and
$1.1 billion in January 1981.5/ Includes U.S. government assets other than official reserves, transactions by nonbanking concerns,
and allocations of SDRs, and other banking and official transactions not shown elsewhere.6/ Includes seasonal adjustment for quarterly data.T / Less than $50 million.
NOTE: Details may not add to total because of rounding.

IV - 13
Foreign Economic Developments. Evidence concerning the rate of
economic activity abroad is currently mixed. Annual data for the
growth of real GNP in Germany implies fourth-quarter growth only
slightly below the 3.8 (s.a.a.r.) percent rate experienced in the third
quarter. This strength is not confirmed, however, by the data for
industrial production; and unemployment was still rising in December.
In the United Kingdom, even though industrial production fell 1-1/2 per-
cent (s.a.) in November, it was still above its third-quarter level,
while in France real GDP grew at an annual rate of almost 4 percent
during the middle quarters of 1981. In contrast, Japanese real growth
in the third quarter of 1981 slowed to 2.4 percent (s.a.a.r.); and in-
dustrial production in Canada fell again in the latest observation
(November).
Some improvement in the rate of inflation is evident abroad. In
both Germany and the United Kingdom the December increase in the con-
sumer price index was below that for November. In Japan wholesale
prices decreased in December for the third consecutive month, while con-
sumer prices were unchanged. Inflation rates remain high in France,
Canada and Italy.
Weakness in domestic demand continued to contribute to improvement
in the external sector for Germany, Japan, France, and Italy. The trade
balance has improved in all these countries in 1981 relative to
comparable periods in 1980. In October through December the German current
account was in surplus for the first time in more than two years.
Although the data are not complete, the trade balance appears to have
worsened recently in the United Kingdom.

IV - 14
New targets for the growth of monetary aggregates in 1982 have
been announced by the central banks of Germany, France, and Switzer-
land. As of January 22, the Bundesbank lowered its Special Lombard rate
by one-half percentage point to 10 percent, and the Netherlands Bank
lowered all its official rates by one-half percentage point. In
addition, the Bank of England at about the same time lowered the rate at
which it buys short-term bills from the market by one-half percentage
point to 13-7/8 percent.
Individual Country Notes. According to provisional data, German
real GNP declined by 0.3 percent in 1981. This decline was smaller than
expected, owing to a relatively strong third quarter in which GNP grew
at almost four percent (s.a.a.r.). The fourth-quarter growth rate,
implied by the published annual rate, was almost three percent. These
relatively strong results do not appear to be supported by other data on
economic activity. Industrial production remained essentially flat last
year through November, as did the volume of new orders. The rate of
unemployment, which rose steadily throughout the year, reached 6.7 per-
cent (s.a.) in December.
Consumer price inflation averaged six percent in 1981. The rate
appears to be slowing, however, with December recording a monthly in-
crease of only 0.3 percent. Recent declines in import prices have
contributed to the slowing of consumer price inflation. Wholesale and
producers prices as of December confirm the trend toward easing.

REAL GNP AND INDUSTRIAL PRODUCTION IN MAJOR INDUSTRIAL COUNTRIES(Percentage change from previous period, seasonally adjusted)
1978 1979 19801980
Q1 Q2 Q3 Q41981
Q1 Q2 Q31981
Aug. Sept. Oct. Nov.
Canada: GNPIP
France: GDPIP
Germany: GNP
IP
Italy: GDPIP
Japan: GNPIP
United Kingdom:
United States:
3.7 3.0 - 0.0 -0.9 -1.0 0.2 2.3 0.9 1.4 -1.0 *3.5 5.3 -2.0 -0.9 -2.5 0.0 2.2 1.0 2.6 -3.0 -1.6
4.0 3.7 1.51.9 4.7 -1.2
3.6 4.5 1.72.0 5.3 -0.1
2.6 5.0 4.01.9 6.6 5.6
5.2 5.2 4.26.2 8.3 7.1
0.4 -0.5 0.0 0.0 -0.9 1.3 0.6 *0.5 -2.2 0.0 -2.0 -4.4 -0.5 3.0 1.6
1.9 -2.0 0.0 -0.4 0.4 -0.7 0.90.9 -2.4 -1.5 -1.8 1.6 -0.3 0.0
2.1 -0.9 -2.74.4 -2.7 -7.6
2.0 0.6 -1.2 -1.65.3 0.7 -2.5 -4.3
*
-0.9
-15.-15. 7
1.6 0.2 1.2 0.7 0.7 1.2 0.6 *4.1 0.2 -2.3 1.6 1.7 -0.3 1.6 -2.6
GDP 3.6 1.6 -2.3 -1.0 -1.4 -1.5 -0.4 -0.8 -0.4IP 3.6 2.7 -6.6 -2.3 -3.0 -3.0 -2.4 -1.2 -0.6
4.8 3.2 -0.25.8 4.4 -3.6
0.70.9
0.8 -2.6 0.6 0.9 2.1 -0.4 0.4 *0.1 -5.4 -1.5 4.5 2.0 0.5 0.3 -0.2
* * *
-1.5 -1.3 -0.5
* * *
0.8 0.8 n.a.
*0.9 *
0.9 0.0 -0.9
* *
18.2 -2.56.86.8 U
* * *
3.8 1.5 -0.3
* * *
0.4 2.0 -1.5
* * *
-1.3 -1.6 -1.9
* GNP data are not published on monthly basis.

TRADE AND CURRENT-ACCOUNT BALANCES OF MAJOR INDUSTRIAL COUNTRIESa(Billions of U.S. dollars; seasonally adjusted)
1980 1981
Canada: TradeCurrent Account
France: Tradeb
Current Account
Germany: TradeCurrent Account (NSA)
Italy: Trade
Current Account (NSA)
Japan: Trade bCurrent Account
United Kingdom: TradeCurrent Account
United States: TradeCurrent Account
6. 7-1.6
1980Q3 Q4
1981Q1 Q2 Q3 Q4
n.a. 2.0 2.4 1.4 0.8 0.6 n.a.n.a. -0.2 0.3 -1.2 -1.8 -2.2 n.a.
Oct. Nov. Dec.
0.6 0.9 n.a.* * *
-14.2 n.a. -4.0 -3.2 -2.7 -2.1 -2.4 n.a. -1.1 -1.2-7.9 n.a. -2.1 -2.0 -2.4 -0.4 -1.9 n.a. * *
4.9 n.a. 1.1 0.9-17.4 -7.6 -7.1 -3.3
0.2-4.4
3.1-2.3
3.1-4.9
n.a. 1.8. 1.84.0 1.3 0.5
n.a.*
n.a.2.2
-22.6 n.a. -8.6 -5.5 -4.5 -4.8 -4.4 n.a. -0.6 -0.9 n.a.-9.8 n.a. -1.0 -2.9 -5.8 -2.3 n.a. n.a * * *
2. 1-10.7
n.a. 1.4 2.9 3.3 5.5 6.3n.a. -1.8 -0.2 -1.0 2.0 2.5
2.9 n.a. 1.5 3.0 n.a. n.a. n.a. 1.46.6 n.a. 2.1 4.5 n.a. n.a. n.a. 2.3
-25.33.7
n.a. -2.9 -5.6 -4.7n.a. 5.0 1.4 3.3
n.a. 2.6 1.3n.a. 1.5 -0.2
n.a.n.a.
0.7 0.1 0.61.0 0.4 0.9
-6.9 -7.0 n.a. -4.4 -3.81.1 2.1. n.a. * *
n.a.*
The current account includes goods, services, and private and official transfers.Quarterly data are subject to revision and are not consistent with annual data.Comparable monthly current account data are not published.
____

CONSUMER AND WHOLESALE PRICES IN MAJOR INDUSTRIAL COUNTRIES(Percentage change from preceding period)
MEMO:
Latest 3 Months1980 1981
Q3 Q4 Q 1 Q2 Q3 Q4
Canada: CPI 2.8 2.8 3.2 3.1 3.0 2.5WPI 2.8 3.2 2.5 2.1 1.3 n.a.
France: CPI 3.2 2.8 3.0 3.3 3.9 3.2WPI 0.6 3.4 1.5 4.5 4.3 n.a.
Germany: CPI 0.7 0.8 2.2 1.8 1.2 1.2WPI -0.2 0.7 3.9 2.3 2.1 1.8
Italy: CPI 4.2 5.3 5.2 4.4 2.9 4.6WPI 2.2 3.8 5.0 5.1 3.5 n.a.
Japan: CPI 1.1 1.2 1.3 1.3 -0.1 1.5WPI 0.7 -0.7 -0.7 1.1 1.4 -0.1
United Kingdom: CPI 2.2 1.9 2.4 4.9 1.7 2.5WPI 2.3 1.2 3.0 3.4 2.1 2.2
United States: CPI(SA) 1.9 3.1 2.6 1.8 2.9 1.9WPI(SA) 3.3 2.1 2.6 2.3 1.0 1.1
1981Sept. Oct. Nov.
0.7 1.0 0.93.1 0.6 -0.1
1.1 1.2 0.90.9 0.8 -0.7
0.5 0.3 0.50.9 0.3 0.5
1.2 2.0 1.71.3 1.2 1.7
2.0 0.4 0.20.0 -0.1 -0.1
0.6 0.9 1.10.8 0.8 0.6
1.2 0.4 0.50.1 0.6 0.5
Dec.
0.4
n.a.
0.6n.a.
0.30.0
1.0n.a.
0.0-0. 1
0.60.4
0.40.3
fromYear Ago
12.38.9
14.1L2.9
6.5
10.4
18.318.9
4.11.7
11.911. 1
9.57.2

IV - 18
During the fourth quarter of 1981 the German current account
registered its first monthly surpluses since April 1979. The cumula-
tive deficit for 1981 was $7.6 billion compared with $17.4 billion
for 1980.
Central Bank Money increased in December, after declining in the
two preceding months. During the target period, the fourth quarter of
1980 to that of 1981, CBM increased by 3.5 percent, below the lower
limit of the Bundesbank's target range of 4 to 7 percent. The 1982
target range is again 4 to 7 percent.
In the United Kingdom, industrial production fell 1.5 percent
(s.a.) in November 1981; nevertheless, the November level of produc-
tion was 5 percent (s.a.a.r.) above the level prevailing six months
earlier and only slightly below that recorded in November 1980.
The December 1981 increase in consumer prices was about one half
the rate of growth recorded in the two preceding months. During the
last six months of 1981, consumer and wholesale prices rose 8 - 9 per-
cent (a.r.). Wage inflation moderated considerably in 1981: in the
eleven months to November, average wage earnings increased 10 percent
(s.a.a.r.), down over 9 percentage points from the rate of wage growth
recorded during 1980. The deceleration of wages in 1981, as well as
strong increases in labor productivity, have produced a marked re-
duction in the rate of growth of unit labor costs in the United Kingdom.
Between the third quarters of 1980 and 1981, unit labor costs rose just

IV - 19
4 percent, compared with a 25 percent increase between the third
quarters of 1979 and 1980. The recent vote by U.K. coal miners not to
strike in support of this year's wage claim seems to indicate that U.K.
wage increases can be expected to continue to be moderate. (The miners
have been offered a package that includes a pay increase of 9 - 10 per-
cent.)
The U.K. current-account balance appears to have been strongly
positive in 1981, but data are available for five months only (January,
February, September, October, and November). The (now ended) civil
service labor dispute has delayed the publication of the March-August
data. The September-November data indicate that the U.K.'s trade and
current accounts were still in surplus in late 1981 -- averaging $1/4
billion and $1/2 billion, respectively -- but that there has been a
sharp reduction from the extraordinarily high surpluses recorded in Jan-
uary and February. Sterling M3 increased only 2 percent (a.r.) in
December. Annualized growth since February 1981 was 15.5 percent, how-
ever, well above the 6 - 10 percent target range.
In Japan the continued sluggishness of domestic demand led author-
ities to take steps in December to stimulate the domestic economy by
easing monetary policy and thereby help reduce Japan's sizeable current-
account surplus as well. Third-quarter GNP statistics, released last
month, showed a disappointing real growth rate of only 2.4 percent
(s.a.a.r.), well below the almost 5 percent rate of the previous quarter.
Private consumption, which had been making slow progress in recent
quarters, was nearly flat, while private plant and equipment investment

IV - 20
fell slightly for the second quarter in a row. Housing, which has been
on an extended decline, fell by almost 15 percent (s.a.a.r.) in the
quarter. Whatever strength there was in GNP was found in external de-
mand, but even there the previous intensity of export growth appears to
have moderated. Industrial production figures have moved somewhat
erratically in recent months, but the November IP index was down slightly,
suggesting that weak activity continued in the fourth quarter. The
labor market also appears to have been soft in recent months; the un-
employment rate was 2.2 percent in November, a relatively high figure
for Japan. In the face of these developments, the authorities have
lowered the official forecast for real growth in FY 1981, ending in
March, by more than half a percentage point to 4.1 percent.
The inflation situation continues to be a bright spot in Japan.
Wholesale prices either fell or were flat in the four months ending in
December, and the WPI at the end of 1981 was less than one percent above
its year-ago level. Soft domestic demand and a strengthening yen in
recent months have contributed to this easing. Consumer prices have
continued to move ahead at about a 5.5 percent annual rate.
Although the November current account, aided by a sharp drop in
export volume and surge in import volume, registered a small deficit
($210 million, s.a.), the cumulative current account for 1981 remained
in strong surplus. When December's figures are included, it is estimated
to have been as much as $6 billion for the year as a whole. Bilateral
trade surpluses with the United States ($13.5 billion for 1981) and the
IV - 21
EC ($10 billion) have become particular problems. Accordingly,
monetary policy has been eased in an attempt to stimulate domestic de-
mand although some depreciation of the yen has also resulted in the short
run. In addition to the reduction of the discount rate in December,
restraints on lending by banks were completely eliminated for the
current quarter. The authorities also initiated last month a program
of other measures designed specifically to reduce the external surplus,
including accelerated reductions in tariffs, $500 million in subsidized
loans for import financing, and stockpiling of imported oil and metals.
The government's proposed FY 1982 budget, approved by the Cabinet
in mid-December, is one of the least expansionary in the post-World War
II era, as expenditure is planned to increase by only slightly more
than 6 percent over that of the previous year.
In the middle quarters of 1981 French GDP grew by nearly 4 percent
(s.a.a.r.), sustained by growing consumer expenditure and exports but
restrained by sluggish investment expenditure. Inventories are now in
the normal range, and order books and general demand perceptions continue
to improve.
Consumer price inflation accelerated in each of the first three
quarters of 1981 and was over 16.5 percent (a.r.) in the third quarter.
Under limited price controls, inflation was under 13.75 percent in the
fourth quarter. Hourly wages increased in France by about 15.5 percent
over the past year; in the most recent two quarters the increase was 18
percent.

IV - 22
The French trade deficit through November was nearly $10 billion
at an annual rate, over $4 billion less than the 1980 deficit. The
French current account was in deficit at an annual rate of more than
$6 billion (s.a.) for the first three quarters compared with a deficit
of $8 billion for the year 1980.
After a reported disagreement between the Bank of France and the
government, an M2 growth target of 12.5 - 13.5 percent was announced for
this year, up from the 10 percent target originally set for 1981. In
the past the French have not had a range but a single number represent-
ing an acceptable upper bound. The new practice appears to reflect
disagreement to be solved later, rather than an effective range within
which M2 growth is hoped to be constrained. Credit controls will be
somewhat looser in 1982 than in 1981, reflecting the higher acceptable
monetary growth. In the first ten months of 1981 actual M2 growth was
14 percent (s.a.a.r.).
In Canada, industrial production fell by .5 percent in November of
last year -- representing the fifth consecutive monthly decline in this
index. The unemployment rate rose in December to 8.6 percent after
having remained virtually unchanged for the previous three months.
Consumer price inflation, which has been in double digits since
June of 1980, still remains high. CPI inflation was about 12.5 percent
in 1981 as compared with 10.2 percent the previous year.
The trade surplus rose about $300 million to almost $500 million
in November. The surplus for the first eleven months of 1981 was about
$4.5 billion, as compared with $6.3 billion for the same period in 1980.

IV - 23
Canadian M1 rose over 7 percent (s.a.) in December. Nevertheless,
it was below its year-earlier level, was less than 1 percent above the
current target base, and was therefore well below the target range of
4 - 8 percent growth.
Economic activity remains weak in Italy. Industrial production in
the third quarter was about 1 percent below its year-earlier level,
while the unemployment rate in October rose to 9.1 percent, compared
with 8.8 percent in July. In view of planned layoffs in the automobile
industry in the first quarter of this year, the unemployment rate is
likely to rise further.
Inflation remained high during the fourth quarter, as the CPI rose
at an annual rate of just under 20 percent. During 1981 inflation de-
creased, however, from approximately 21.5 percent in 1980 to just over
18 percent (fourth quarter to fourth quarter rate), The rising unemploy-
ment rate seems to have had little impact on the rate of increase in
wages, which in October were 24 percent above their year-earlier level.
The effects of the current weakness of the Italian economy and the
devaluation of the lira early last year have begun to appear in the
trade account. During the three-month period ending in November, the
trade deficit was $3.2 billion, compared with a $7.8 billion deficit in
the corresponding period of 1980.
In Switzerland officials announced a target of 3 percent growth
during 1982 for the Swiss measure of central bank money, This year's
target was for 4 percent growth; however, data through October show an
increase of less than 1 percent at an annual rate.

Appendix IV-A*
INTERNATIONAL BANKING FACILITIES
International Banking Facilities (IBFs) began operations onDecember 3. The authorizing amendments to Regulations D and Q weredesigned to reduce the costs of providing international banking servicesat U.S. offices. In general, they permit an IBF to accept deposits offoreign residents, other IBFs, and U.S. offices of its establishinginstitution, free from reserve requirements or interest rate limitations.Funds raised may support extensions of credit to the same set of entities,provided the proceeds are used to finance operations outside the UnitedStates. However, any net advances to U.S. offices of the establishinginstitution are subject to the same reserve requirements on Eurocurrencyliabilities as are net advances from foreign offices. IBF loans anddeposits may be denominated in either U.S. dollars or foreign currencies.
As of January 6, IBFs had been established by 216 institutions--76commercial banks, 131 branches and agencies of foreign banks, and 9 Edgeand Agreement Corporations. They were concentrated largely in threestates--New York, California, and Florida. Those three states, alongwith Connecticut, Georgia, Illinois, Maryland, and North Carolina, havepassed legislation providing favorable state tax environments for IBFs.
Growth and Funding of IBF Assets
On January 6 total IBF assets were $68.7 billion, of which $60.9billion were claims on unaffiliated entities. As shown in appendixtable 1, these asse t s were funded largely by advances from affiliated for-eign offices and the U.S. offices of the establishing institutions; IBFsreported only $19.7 billion in liabilities to unaffiliated entities. Asdiscussed below, U.S. banking offices reported shifts of claims on unaf-filiated entities totaling $35.2 billion and shifts of liabilities tounaffiliated entities totaling $7.0 billion. From a flow-of-funds per-spective, the $28.2 billion excess of assets over liabilities shiftedfrom domestic offices to IBFs implies that domestic offices funded theirIBFs by that amount. This funding took two forms. First, IBFs acquireddirect net liabilities to their establishing U.S. offices of $13.7 bil-lion. Second, U.S. offices transferred to IBFs from their own books$14.5 billion of net liabilities to own foreign offices. The reductionof net liabilities of U.S. offices to own foreign offices constitutesan advance of funds to the foreign offices. Thus, in effect, U.S. officeschanneled $14.5 billion to their IBFs through their foreign offices.
Impact of IBFs on Bank Credit and the Monetary Aggregates
As shown in appendix table 2, about 80 percent of IBF claims on un-affiliated entities are loans and investments, with commercial and industri-al loans the largest component. Since loans to foreigners on the books of
* Prepared by Fred Jensen, Economist, Banking Section, Division of Researchand Statistics, and Patrick Parkinson, Economist, U.S. International Trans-actions Section, Division of International Finance.

IV-A-2
U.S. offices of establishing institutions are included in measures ofdomestic bank credit but loans on the books of IBFs are excluded, shiftsof loans and investments from U.S. offices of the establishing institu-tions to their IBFs would have a distorting effect on these measures.Bank credit measures can be adjusted for this effect by adding back theestimated amounts shifted to IBFs from U.S. offices during December. Itis estimated that U.S. offices shifted a cumulative total of loans andinvestments to their IBFs of about $31.6 billion through January 6, andan estimated $23.8 billion on a month average basis during December.The resulting adjustment increased bank credit growth during Decemberfrom -9.3 to 11.1 percent.
The monetary aggregates also exclude liabilities of IBFs. As indi-cated in appendix table 2, only about S1 billion of IBF liabilities due toforeign money stock holders (foreign residents other than foreign banksand foreign government and official institutions) were shifted from U.S.offices of the establishing institutions to their IBFs through January 6.Since negligible amounts were reported to have been transferred from de-mand deposits there was no effect on M1. In addition, IBF depositors arelimited to transactions of at least $100,000; thus, it is likely that thebulk of these liabilities were transferred from large time deposits orterm RPs,1 leaving M2 unaffected. Even for M3 the effect is small.Adjusting for this shift would have added less than 1/2 percent to M3growth on an annual basis during December.
Impact of IBFs on Eurocurrency Transactions
As discussed above, U.S. offices of establishing entities trans-ferred to IRFs an excess of assets over liabilities of $28.2 billion byJanuary 6. Since IBFs are included with foreign offices for reserverequirement purposes, this transfer lowered the U.S. offices' net lia-bilities to their foreign offices and IBFs by the same amount. ReservableEurodollar liabilities were lowered further by shifts from U.S. offices
to IBFs of borrowings from foreign banks and foreign governments andofficial institutions. Shifts of such borrowings are estimated to havetotaled about $2-1/4 billion by the end of December. Through January 6,the reduction in required reserves against Eurocurrency liabilities re-
sulting from these shifts is estimated to have totalled between $140 and$160 million.
It should be noted that IBFs are regarded as domestic offices for
balance-of-payments purposes. Thus, transfers to IBFs from U.S. offices
of the establishing institutions would have no effect on either capital
inflows or outflows. In addition, transfers of assets and liabilitiesto IBFs from offshore have no effect on net capital inflows to theUnited States. Such transfers merely have the effect of increasing bothsides of the aggregate U.S. resident balance sheet by, for example,
increasing loans to non-U.S. residents and IBF liabilities to affiliated
foreign offices by equal amounts.
1. Because IBF deposits of money stock holders are required to have a
minimum maturity of two days, they are unlikely to have been substitutedfor overnight RPs.

IV-A-3
Outlook
IBFs are likely to continue to grow in the months ahead, althoughnot at the December pace. The rapid growth in December was due largelyto shifts of existing assets from other offices of the establishing in-stitutions. A large portion of the December shifts from U.S. officeswas accounted for by agencies and branches of Japanese banks, which,because they have no shell branches, had large amounts of eligible assetson their U.S. books. However, many banks, particularly New York memberbanks, have sizable amounts of IBF-eligible assets on their U.S. books,but have not yet shifted those assets to their IBFs. Some New York memberbanks apparently have been cautious about transferring eligible assetsto their IBFs because they fear a restrictive enforcement of IBF taxregulations by New York tax authorities. The portion of an IBF's netincome to be exempt from New York state taxation is inversely related tothe proportion of its funding that is provided by U.S. residents. Somebanks apparently fear that in this context "U.S. funding" will not benarrowly defined as net liabilities to U.S. offices of the establishing
institution, but instead will be defined to include a portion of fundingobtained from offshore shell branches on the grounds that shell branchesimplicitly channel some deposits from U.S. residents to IBFs. If the
New York tax authorities should adopt the broader definition, the growthof IBFs in New York will be deposit-driven in the sense that transfersof assets to IBFs will be delayed until IBFs obtain additional liabilitiesto unaffiliated entities.
Although a sizable amount of foreign resident deposits remain on
the books of domestic banking offices, some of these deposits may not be
eligible for transfer to IBFs.1 For example, IBFs are prohibited fromoffering negotiable instruments or demand balances. Funds held in nego-
tiable instruments could be transferred to IBFs, but only after those
instruments mature. IBFs are allowed to offer very short-dated time
deposits (a minimum of 2 days for foreign money stock holders, overnight
for others), which may be attractive to certain depositors as cash
management devices and induce some shifting from foreign-held demand
deposits. However, similar short-term bank liabilities already are
available offshore as well as domestically in such instruments as RPs.
Hence, while the introduction of IBF liabilities may intensify the use of
cash management, it is unlikely to result in large shifts of demand
balances from U.S. offices to IBFs in the near future.
The ability of IBFs to obtain new deposits will depend in part on
the relative attractiveness for foreign depositors of U.S. country expo-
sure and in part on rates offered. The scope for IBFs to offer attractive
1. Deposits at U.S. banking offices of foreign money stock holders are
estimated at about $18 billion ($5 billion in demand deposits, $13 billion
in time deposits). Deposits of foreign banks and foreign governments
and official institutions are estimated at about $25 billion ($15 billion
in demand deposits, $10 billion in time deposits).

IV-A-4
deposit rates was broadened with the passage of legislation exempting
IBF deposits from FDIC insurance assessments. Nonetheless, to date IBFs
have not captured a significant share of deposits in the Euromarket. In
particular, one might expect that until their nonbank deposit base is
developed IBFs would rely heavily on borrowings from foreign banks. But
as of January 6, IBF liabilities to unaffiliated foreign banks, which
totalled $130 billion at foreign branches of U.S. banks in November,accounted for only $12.2 billion of IBF liabilities. Moreover, there
has not been any significant amount of inter-IBF activity.

IV-A-5
Appendix Table 1
TOTAL IBF ASSETS AND LIABILITIES 1/($ billions, as of January 6, 1982)
Assets
Gross claims on non-U.S. offices of theestablishing institution 7.8
Total claims on entities other thanU.S. and non-U.S. offices ofthe establishing institution 60.9
Total Assets 68.7
Liabilities
Gross liabilities due to non-U.S. offices ofthe establishing institution 35.3
Total liabilities due to entities other thanU.S. and non-U.S. offices of theestablishing institution 19.6
Total Liabilities 54.9
Residual: Net liabilities due to U.S.offices of the establishinginstitution (Total Assets minusTotal Liabilities) 13.7
Memo: Net liabilities due to non-U.S.offices of the establishinginstitution 27.6
1/ Total assets and liabilities of all IBFs with at least $50 millionin assets or liabilities as of January 6.