Embed Size (px)
Citation preview

Prefatory Note
The attached document represents the most complete and accurate version available based on original copies culled from the files of the FOMC Secretariat at the Board of Governors of the Federal Reserve System. This electronic document was created through a comprehensive digitization process which included identifying the best-preserved paper copies, scanning those copies,1 and then making the scanned versions text-searchable.2 Though a stringent quality assurance process was employed, some imperfections may remain.
Please note that this document may contain occasional gaps in the text. These gaps are the result of a redaction process that removed information obtained on a confidential basis. All redacted passages are exempt from disclosure under applicable provisions of the Freedom of Information Act.
1 In some cases, original copies needed to be photocopied before being scanned into electronic format. All scanned images were deskewed (to remove the effects of printer- and scanner-introduced tilting) and lightly cleaned (to remove dark spots caused by staple holes, hole punches, and other blemishes caused after initial printing). 2 A two-step process was used. An advanced optimal character recognition computer program (OCR) first created electronic text from the document image. Where the OCR results were inconclusive, staff checked and corrected the text as necessary. Please note that the numbers and text in charts and tables were not reliably recognized by the OCR process and were not checked or corrected by staff.
Strictly Confidential (FR) Class I FOMC
MONETARY POLICY ALTERNATIVES
Prepared for the Federal Open Market Committee
By the staff Board of Governors of the Federal Reserve System
STRICTLY CONFIDENTIAL June 24, 1988CLASS I - FOMC
MONETARY POLICY ALTERNATIVES
Recent Developments
(1) In accordance with the Committee's decision at its May 17
meeting, the allowance for adjustment plus seasonal borrowing was raised
from $400 million to $500 million about a week following the meeting.
Actual borrowing averaged $530 million in the first two maintenance
periods. In the current maintenance period, with the federal funds rate
running a little above expectations even as long-term debt and equity
markets were rallying, the borrowing assumption was raised $50 million,
rather than allowing the provision of reserves under the previous speci-
fication to push the federal funds rate lower. This action was taken
against the backdrop of a directive indicating greater readiness to
tighten than to ease and of economic indicators that suggested a continu-
ing risk of inflation pressures. Over the first eight days of the current
maintenance period, adjustment plus seasonal borrowing has averaged around
$490 million. Seasonal borrowing has increased a little more than usual
in recent months, and is currently running around $320 million; overall,
the relationship between the sum of seasonal and adjustment borrowing and
the federal funds rate does not appear to have changed appreciably from
earlier this year.
(2) Responding to the further increases in reserve pressures, the
federal funds rate moved up from around 7 percent at the time of the May
FOMC meeting to the 7-1/2 percent area most recently. Other money market
interest rates increased by around 1/4 to 3/8 of a percentage point over
the intermeeting period. Despite the rise in short-term rates, substan-
tial increases in commodity prices, and evidence of stronger economies and
tighter monetary policies in some key foreign industrial countries, bond
yields fell about 1/4 of a percentage point over the intermeeting period,
and stock prices rose, with broad stock price indexes up from 4 to 8
percent. Apparently, demands for longer-term instruments were buoyed by
improved prospects for the dollar and by signs of some moderation in the
economic expansion towards a more sustainable pace, together with percep-
tions that U.S. monetary policy was being tightened in a timely manner.
(3) The dollar rose about 5-1/4 percent on a weighted average basis
over the intermeeting period, with 3-1/4 percent of that occurring in the
last few days. It moved higher in response to the better-than-expected
U.S. trade figures both for March, released on the day of the last FOMC
meeting, and for April, released in mid-June. These data apparently led
market participants to revise their expectations about the pace of U.S.
external adjustment. Indications of a tighter Federal Reserve stance also
contributed to the dollar's firmness over the period, helping to offset
the effects of monetary tightening in a number of foreign countries,
including Germany, Canada, and the United Kingdom. The firming trend has
gathered momentum in recent days, as convictions about a brighter outlook
for the dollar seem to have become more firmly entrenched.

MONETARY, CREDIT, AND RESERVE AGGREGATES(Seasonally adjusted annual rates of growth)
March QIV '87April May June to to
Junee Junee
Money and credit aggregates
11.2 7.0
5.9
6.9
4.9
7.2
7.0
Domestic nonfinancialdebt
Bank credit 11.4
Reserve measures
Nonborrowed reservesNonborrowed reserves
Total reserves
Monetary base
Memo: (Millions of dollars)
Adjustment plus seasonalborrowing
Excess reserves
10.4
12.3
11.4
370
859
8.1
13.0
-2.2
-. 2
5.1
-- 8.21
-- 12.21
8.5
8.12
.3 4.2
7.7
471
1028
pe--preliminary estimate based on partial data through June 20.1. March to May.2. 1987:Q4 to May.3. Reserve estimates incorporate assumptions of $550 million of adjustment plusseasonal borrowing and $950 million of excess reserves during the second half ofJune.4. Includes "other extended credit" from the Federal Reserve.
NOTES: Monthly reserve measures, including excess reserves and borrowing, arecalculated by prorating averages for two-week reserve maintenance periods thatoverlap months. Reserve data incorporate adjustments for discontinuitiesassociated with changes in reserve requirements.
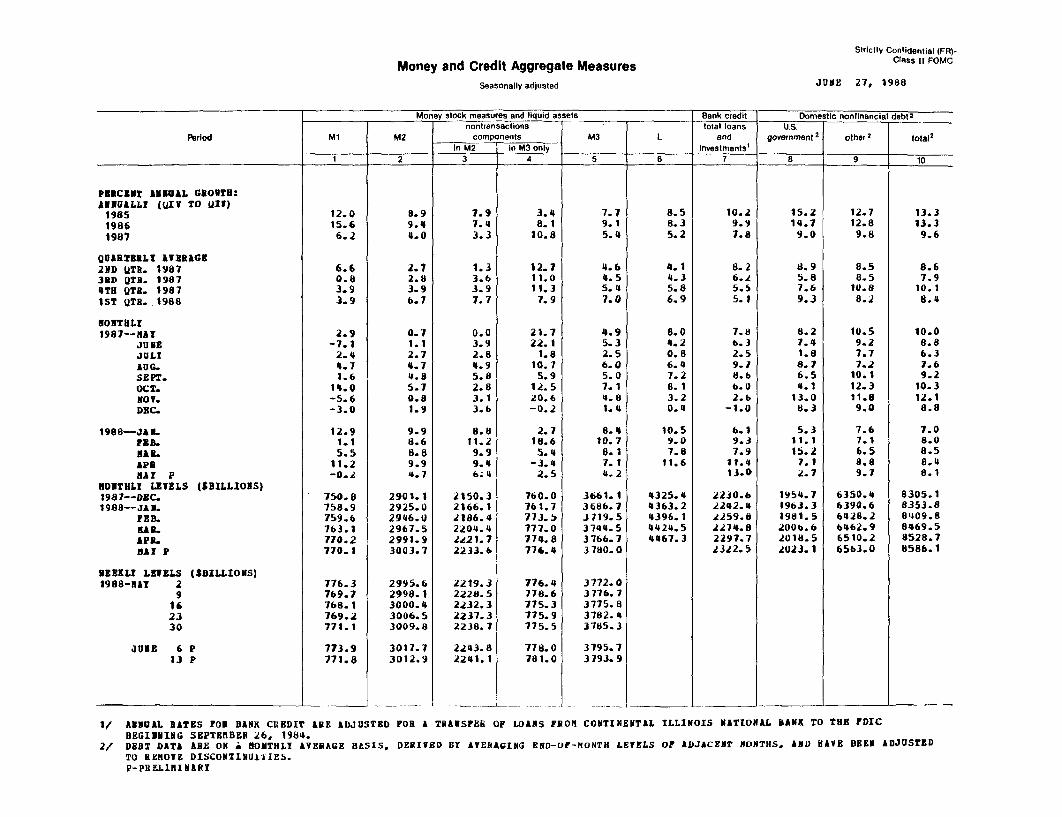
(4) Expansion of the monetary aggregates slowed substantially in
May, mainly reflecting the runoff of tax-related balances. Based on
partial data through June 20, growth of the aggregates appears to have
rebounded in June. Still, expansion of M2 at 6 percent in June is slower
than earlier in the year, as demands are evidently being restrained
somewhat by the rise in opportunity costs that has resulted from the
increase in short-term market interest rates. M2 is estimated to have
increased at a 7 percent rate over the March-to-June period, in line with
the Committee's specification of 6 to 7 percent for the broader aggre-
gates. Growth of M3 over the March-to-June period is estimated at 6
percent. The moderate growth of this aggregate in the face of fairly
rapid expansion of bank credit reflected heavier reliance on nondeposit
sources--especially borrowings from foreign branches--to fund credit
growth.
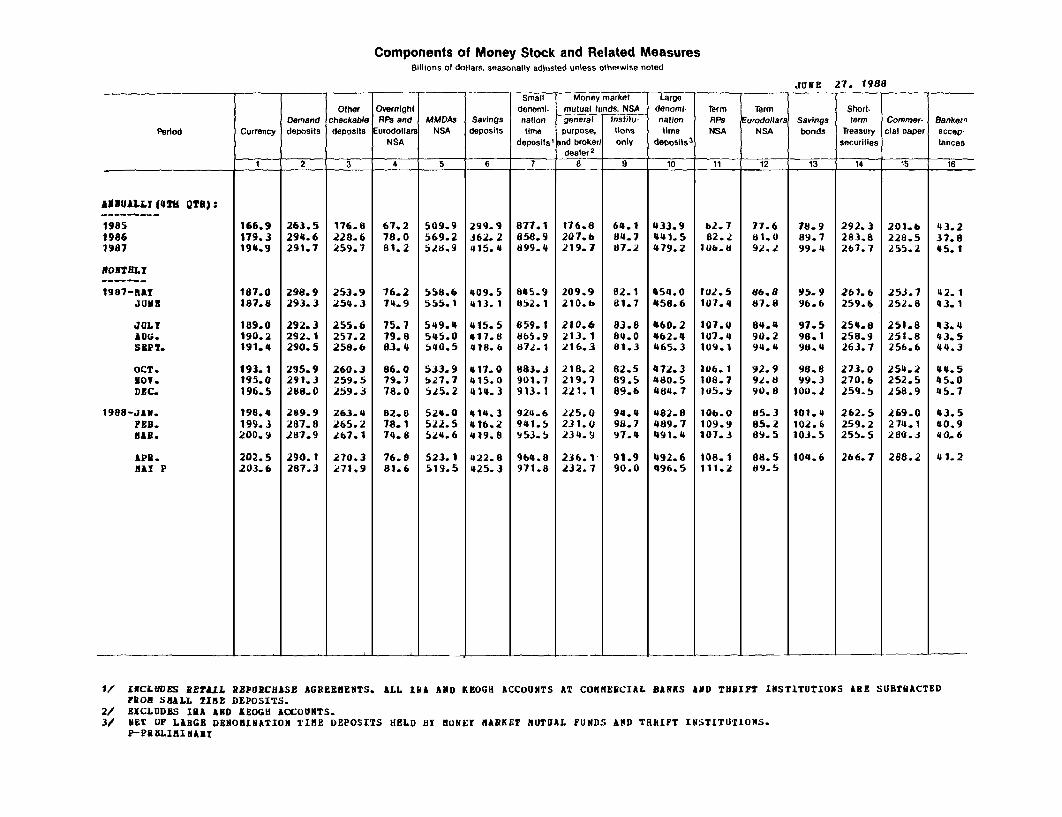
(5) M1 was about unchanged in May following its April bulge, but its
growth appears to have snapped back to around a 7 percent rate in June.
OCDs, along with other liquid deposits, have remained surprisingly strong
given a steeper deposit yield curve, perhaps reflecting uncertainty about
the future course of interest rates; in addition, demand deposits have
rebounded following a decline in May. In June, Ml is estimated to be 5
percent at an annual rate above its fourth-quarter level. Growth in
required reserves has generally tracked expansion of Ml. Expansion in
total reserves from March to June at about a 4-1/4 percent annual rate was
held down to an extent by declining excess reserves. The monetary base

-5-
increased at a 7-1/2 percent rate over that period, about a percentage
point slower than over the first three months of the year, as both cur-
rency and reserves grew less rapidly.
(6) M2 and M3 are estimated to have expanded at 7-1/4 and 7 percent
annual rates, respectively, from their fourth-quarter bases through June,
leaving these aggregates in the upper halves of their annual ranges.
Expansion of M2 has been supported this year by fairly strong growth of
income. The pickup in this aggregate relative to its growth over 1987
stems in part from the turnaround in market interest rates and opportunity
costs from October through February. In addition, special factors may
have accounted for some of the relatively rapid M2 growth, at least judg-
ing by the overshoot of money growth relative to the money demand models.
M2 holders apparently found equity investments less attractive in the
aftermath of the stock market collapse--as evidenced by very weak sales of
mutual funds--and also lower incentives to shift savings to IRAs before
the April tax date depressed flows into these accounts. With respect to
M3, while credit at banks and thrifts expanded over the first half of
1988 at about the same pace as last year, it was financed to a greater
extent by liabilities included in the aggregates. In particular, inflows
to banks from their foreign branches dropped off sharply compared with
1987.
(7) Overall, domestic nonfinancial sector debt expanded at an 8-1/2
percent annual rate from the fourth quarter through May, leaving this
measure just below the middle of its annual range. In recent months,
business credit demands appear to have picked up appreciably, reflecting
continuing strong equity retirements, as well as a large shortfall of
-6-
internal funds relative to capital spending. In addition to rapid busi-
ness loan expansion, which appears to have extended into June, corporate
bond issuance has strengthened since the drop in bond yields. Household
borrowing is estimated to have been maintained at about the first quarter
pace, a shade below that of 1987. Borrowing by the federal government was
light over most of the second quarter, but the Treasury has increased the
gross sizes of coupon issues in mid-June in order to begin funding a much
higher third quarter deficit.
Long-run Ranges
(8) For 1988, the aggregates are expected to grow well within their
existing ranges. Under the staff greenbook forecast, M2 and M3 would be
around the midpoint and in the upper portion of their 4 to 8 percent
ranges, respectively, and debt in the middle of its 7 to 11 percent range.
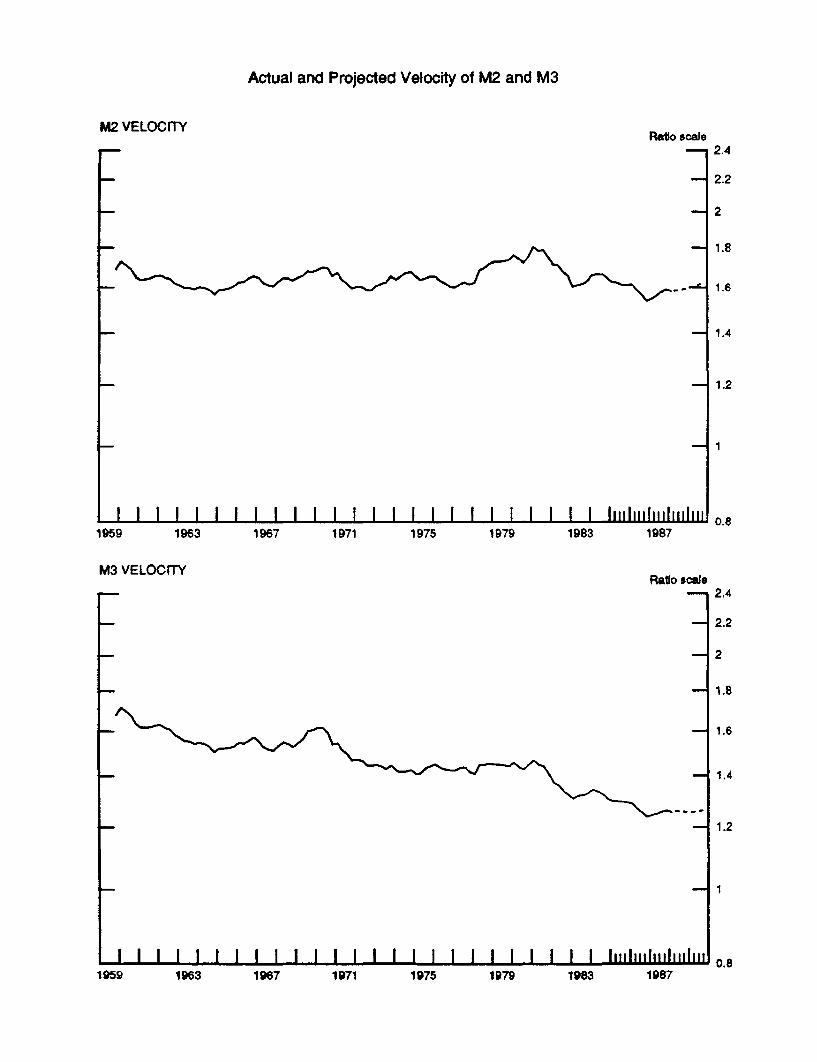
In that forecast, the growth of M2 is projected to slow substantially in
the second half of the year from its pace of 7-1/4 percent through June.
This moderation primarily results from the effects of higher interest
rates and opportunity costs on money demand. Opportunity costs have
already risen in recent months and this increase is expected to be aug-
mented under the staff forecast by a further upward movement in market
interest rates. As a consequence, velocity is expected to increase at
about a 1 percent annual rate over the second half of the year after
falling at almost that rate in the first half. (Actual and projected
velocities of the aggregates are illustrated in the charts on the follow-
ing pages.) With nominal GNP projected to expand at a 6-1/2 percent annual
rate in the second half of the year, M2 growth would be around 5 percent
over this period, bringing growth for the year down close to 6 percent.
Were this rate of expansion of the economy to be achieved without further
increases in rates, growth in M2 for the year would probably be only about
1/4 percentage point higher.
(9) With respect to M3 and debt, the staff is projecting about the
same growth in the second half of the year as in the first. For M3 this
implies expansion of 7-1/4 percent in 1988, in the upper half of its
range, and for debt 8-1/2 percent, just below the midpoint of its moni-
toring range. Although equity retirements are projected to slow in the
Actual and Projected Velocity of M2 and M3
M2 VELOCITY
1 I I I I I I I I I I I I I I I I I I I II I I I I1iiliiil,,,Iiiiliii1959 1963
M3 VELOCITY
I I I I I I I I I I I I I I I I I I I I I I I I I Iittliiiliiiliiiliii
Ratio scale
1967 1971 1975 1979 1983 1987
Ratio scale
I 1.6
1.4
1959 1963 1967 1971 1975 1979 1983 1987
Actual and Projected Velocity of M1 and Debt
M1 VELOCITYRatio scale
I I I I I I I I I I I I I I I I I I I I I I I I I Iiiiliiiliiiliiiliii1963 1967 1971 1975 1979 1983
DOMESTIC NONFINANCIAL DEBT VELOCITY
1987
Ratio scale- 1.2
-1 0.6
I I . 1 1 I I I I I I I I I I I I I I I I I I I Iitiliiliiirlrili
1959
- 0.8
1959 1963 1967 1971 1975 1979 1983 1987
second half of the year, debt growth is still expected to exceed the pace
of GNP by 2 percentage points as a widening corporate financing gap boosts
credit market borrowing. The share of bank and thrift credit in this
total is not expected to change much in the second half of the year from
the first. Rising long-term interest rates will continue to encourage
borrowers to finance through short-term or floating-rate obligations--
including ARM mortgages and business loans--which typically are held by
depository institutions. Given the slowing of core deposits, banks and
thrifts will have to rely more on managed liabilities, including those in
M3. These expectations for M2 and M3 presume that the problems of in-
dividual distressed depository institutions do not spread in such a way as
to disrupt the overall availability and terms of credit at depository
institutions and their access to regular sources of funds.
(10) For 1989, the table below gives three possible alternatives for
tentative long-run ranges for growth in M2, M3, and nonfinancial debt from
the fourth quarter of 1988 to the fourth quarter of 1989. Alternative I
would carry over the specifications of the current ranges. Alternative II
would lower the ranges by 1/2 percentage point, while alternative III
would reduce the M2 range by another 1/2 percentage point, given that any
additional monetary restraint would have a greater impact on growth of
this aggregate than on the other two. All the suggested alternatives
would retain for 1989 the wider 4 point range adopted for 1988 at the
February meeting. The aggregates are not likely to be any less interest
sensitive next year or their demand properties known with any greater
confidence than they were thought to be last February. An unusual degree
of uncertainty about the economic outlook in February also was an impor-
tant element in the decision to widen the ranges; judgement as to whether
the prospects for 1989 were clearer, thus permitting narrower ranges,
might be easier to make next February.
Alternative 1989 Ranges
Alt. I Alt. II Alt. III
(Current Ranges)
M2 4 to 8 3-1/2 to 7-1/2 3 to 7M3 4 to 8 3-1/2 to 7-1/2 3-1/2 to 7-1/2Debt 7 to 11 6-1/2 to 10-1/2 6-1/2 to 10-1/2
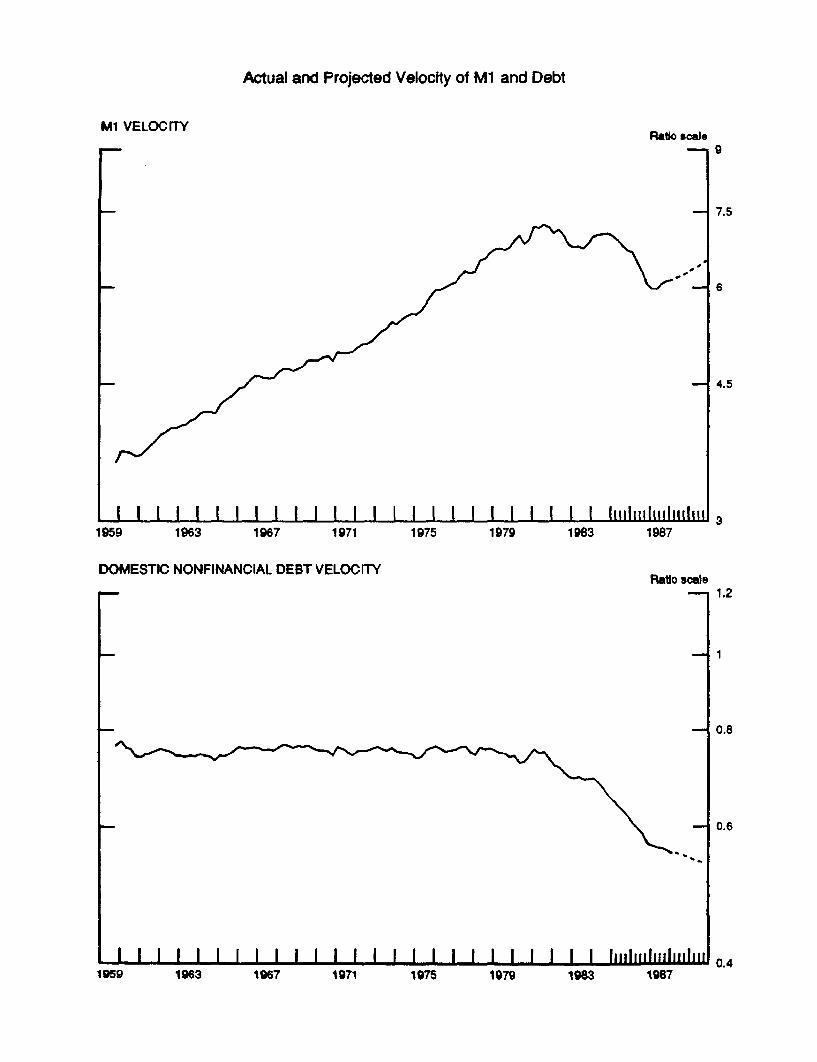
(11) The monetary policy restraint embodied in the greenbook forecast
is likely to involve a significant slowing of money growth next year. In
this forecast, given the underlying strength in demands on the economy, a
rise in interest rates of more than a percentage point from the middle of
1988 to the middle of 1989 may be required to contain nominal income
growth to 6 percent next year. This combination of rising interest rates
and resulting moderate income growth is expected to be consistent with M2
growth of 4 percent, or perhaps even a little lower. The implied
increase in velocity would be 2 percent or so, as shown in the chart
following page 7.
(12) M3 growth also is projected to slow in 1989 under the staff
forecast, though, at 5-1/2 percent, to remain well above that of M2.
1. The staff's econometric models of money demand suggest that M2 growthon the order of 3 to 4 percent would be consistent with the combination ofinterest rates and income in the staff forecast.

-10-
Velocity of M3 would be about unchanged (see chart). The decline in M3
growth would accompany an overall slowing in the growth of nonfinancial
debt to a little over 8 percent. The moderation in debt growth is
prompted by slower expansion of demand by domestic borrowers, and a drop-
off in equity retirement as interest rates rise. Of the debt growth
projected, the proportion that is intermediated may decline a little,
producing a greater deceleration in M3 than in debt. With long-term
interest rates projected to level off next year, borrowers may find bonds
and fixed-rate mortgages more attractive. In addition, banks and thrifts
will continue under pressure from capital requirements, prompting further
efforts to repackage and sell assets. However, our projections of M3 do
not allow for a major shift of bank activities--such as government securi-
ties trading--and associated funding to nonbank subsidiaries of holding
companies as a result of court, Congressional, or Federal Reserve regula-
tory actions.
(13) Of the long-run ranges, alternative III would be most appro-
priate if the risks were seen to be on the side of demands outpacing
productive capacity, threatening progress toward price stability. This is
the assessment implicit in the staff GNP forecast, and the degree of
monetary restraint needed in that forecast to damp domestic demand and
check inflationary pressures would seem to require some reduction in the
lower bound of the M2 range. Even with the one-point decrease under this
alternative, M2 would be expected to be in the lower half of its range
given the staff forecast. M3 and debt would be in the middle of their
alternative III ranges. The upper bounds of the reduced ranges of this
alternative allow some scope for less restraint and lower interest rates
-11-
if the economy turns out to be weaker than anticipated, but relative to
the other ranges would provide for fairly prompt resistance to unexpected
strength in the economy. On balance, the alternative III ranges would
seem to imply an intention that nominal income decelerate in 1989, thus
underscoring a commitment of policy to work toward gradually slowing
inflation rates in 1989 and beyond.
(14) The larger reduction in the M2 range than in the M3 and debt
ranges under alternative III recognizes the greater interest sensitivity
of M2, and hence the need to have it decelerate more markedly should
substantial restraint be appropriate. A higher range for M3 than M2 also
is consistent with a tendency for more rapid growth of the broader ag-
gregate over time--a tendency that frequently has been reflected in higher
FOMC ranges for M3 than for M2. (A history of long-run ranges--and out-
comes as they appeared at the time the results were reported to Congress--
is given in first table following the directive.) Alternative II would
reduce the M2 range by only 1/2 percentage point, thereby retaining the
current equality of M2 and M3 ranges. Alternative II further reduces
the ranges toward those more consistent with price stability, and it
allows for restraint on demand should that be needed. But there is some
greater risk than under alternative III that, should demands on the
economy prove strong, the lower end of the M2 range would not be consis-
tent with the degree of restraint the Committee might want to consider.
(15) Alternative I would be more appropriate if the risks to the
economy and inflation were seen as more balanced than underlying the staff
forecast. This might involve a judgment that there was a good chance that
the policy tightening that has already occurred along with developing
-12-
cyclical forces, such as the unsustainable pace of inventory accumulation,
were already pointing to growth in income at an acceptable pace next year,
without further monetary restraint. In these circumstances, M2 would be
expected to grow more in line with nominal GNP as the damping effects of
recent rate increases subside. On balance, M2 growth of around 5-1/2
percent in 1989 might be associated with nominal GNP growth on the order
of that in the staff forecast with no further change in interest rates.
This alternative would allow for even faster M2 growth and an appreciable
pickup from 1988 should an easier policy be needed to support the economy.
Such an outcome might be associated, for example, with a tighter fiscal
policy than markets now anticipate, resulting from credible actions this
fall to meet Gramm-Rudman targets or a major new initiative on the budget
deficit early in 1989. This alternative might also be preferred if the
Committee saw a higher path for income as desirable. More rapid GNP
expansion might be needed to keep unemployment from rising from current
levels, and would be consistent with no uptick in underlying inflation
rates if current labor market conditions were seen as consistent with an
absence of feed-through into wages of price level adjustments associated
with imports or farm commodities.
-13-
Short-run Policy Alternatives
(16) The policy alternatives presented below include the current
degree of pressure on reserve positions along with somewhat greater and
slightly lesser restraint. Alternative B would continue to specify
adjustment plus seasonal borrowing at the discount window of $550 million.
Alternative C would specify a borrowing level of $750 million. Under
alternative A, borrowing is assumed to decline only $100 million, to $450
million, reversing the most recent increase and part of the tightening
early in the period. Federal funds are expected to trade in a range
around 7-1/2 percent or a little below under alternative B and would move
up toward the 8 percent area under alternative C and down to 7-1/4 percent
or a bit below under alternative A.
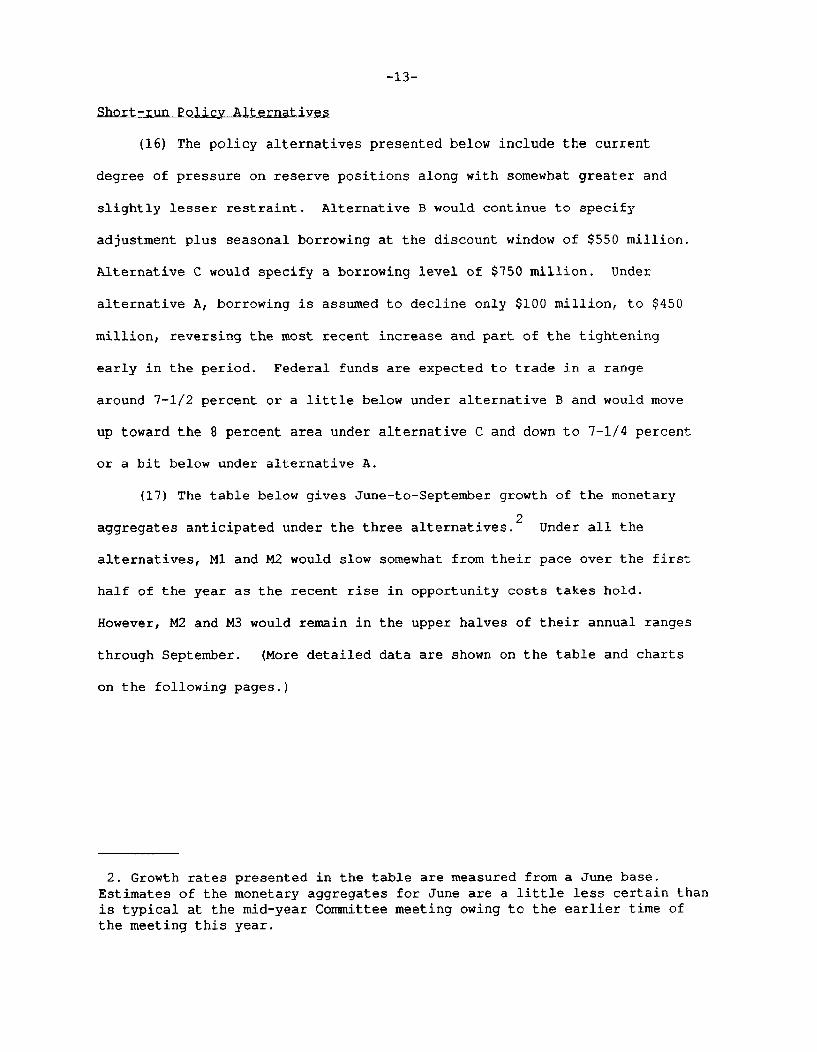
(17) The table below gives June-to-September growth of the monetary
2aggregates anticipated under the three alternatives. Under all the
alternatives, M1 and M2 would slow somewhat from their pace over the first
half of the year as the recent rise in opportunity costs takes hold.
However, M2 and M3 would remain in the upper halves of their annual ranges
through September. (More detailed data are shown on the table and charts
on the following pages.)
2. Growth rates presented in the table are measured from a June base.Estimates of the monetary aggregates for June are a little less certain thanis typical at the mid-year Committee meeting owing to the earlier time ofthe meeting this year.
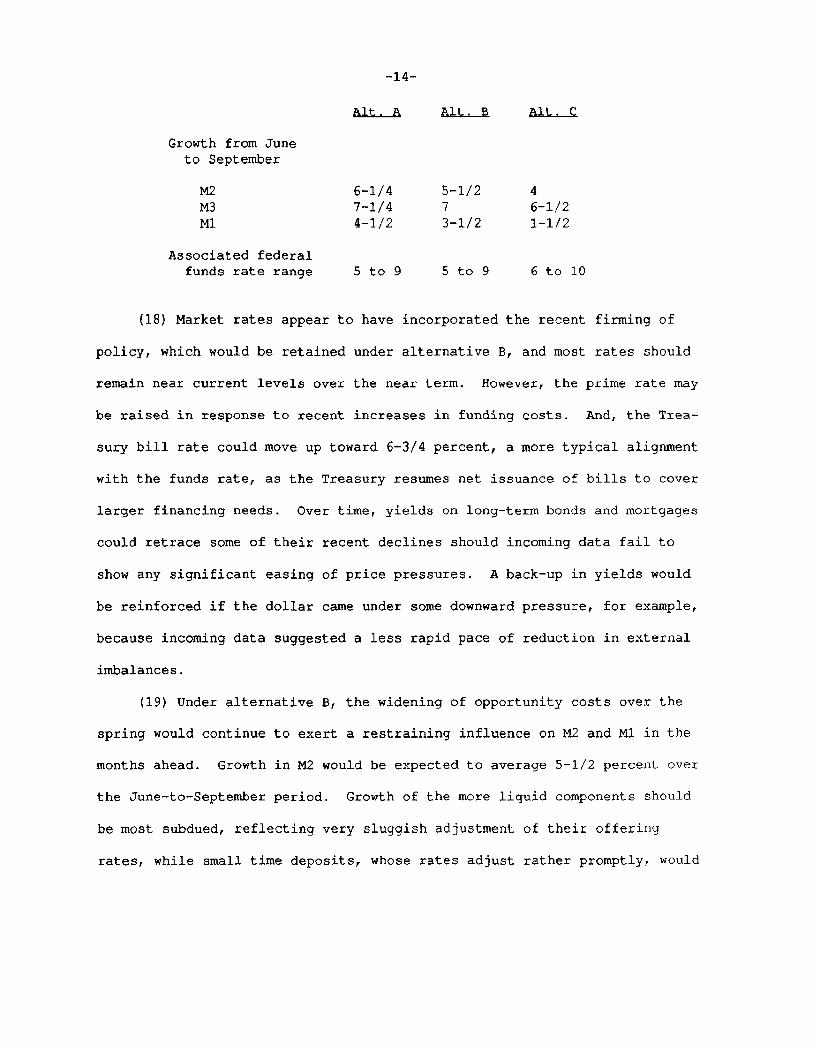
-14-
Growth from Juneto September
M2 6-1/4 5-1/2 4M3 7-1/4 7 6-1/2M1 4-1/2 3-1/2 1-1/2
Associated federalfunds rate range 5 to 9 5 to 9 6 to 10
(18) Market rates appear to have incorporated the recent firming of
policy, which would be retained under alternative B, and most rates should
remain near current levels over the near term. However, the prime rate may
be raised in response to recent increases in funding costs. And, the Trea-
sury bill rate could move up toward 6-3/4 percent, a more typical alignment
with the funds rate, as the Treasury resumes net issuance of bills to cover
larger financing needs. Over time, yields on long-term bonds and mortgages
could retrace some of their recent declines should incoming data fail to
show any significant easing of price pressures. A back-up in yields would
be reinforced if the dollar came under some downward pressure, for example,
because incoming data suggested a less rapid pace of reduction in external
imbalances.
(19) Under alternative B, the widening of opportunity costs over the
spring would continue to exert a restraining influence on M2 and M1 in the
months ahead. Growth in M2 would be expected to average 5-1/2 percent over
the June-to-September period. Growth of the more liquid components should
be most subdued, reflecting very sluggish adjustment of their offering
rates, while small time deposits, whose rates adjust rather promptly, would

Alternative Levels and Growth Rates for Key Monetary Aggregates
M2 M3 M1
Alt. A Alt. B Alt. C Alt. A Alt. B Alt. C Alt. A Alt. B Alt. C
Levels in billions1988 April 2991.9 2991.9 2991.9 3766.7 3766.7 3766.7 770.2 770.2 770.2
May 3003.7 3003.7 3003.7 3780.0 3780.0 3780.0 770.1 770.1 770.1June 3018.4 3018.4 3018.4 3801.7 3801.7 3801.7 774.6 774.6 774.6
July 3034.7 3033.5 3031.0 3824.4 3823.9 3823.0 777.3 776.9 776.1August 3050.7 3047.6 3041.4 3847.5 3846.2 3843.7 780.1 779.0 776.8September 3065.8 3060.3 3049.2 3871.2 3868.6 3863.4 783.1 781.1 777.2
Monthly Growth Rates1988 April 9.9 9.9 9.9 7.1 7.1 7.1 11.2 11.2 11.2
May 4.7 4.7 4.7 4.2 4.2 4.2 -0.2 -0.2 -0.2June 5.9 5.9 5.9 6.9 6.9 6.9 7.0 7.0 7.0
July 6.5 6.0 5.0 7.2 7.0 6.7 4.2 3.6 2.3August 6.3 5.6 4.1 7.3 7.0 6.5 4.3 3.2 1.1September 5.9 5.0 3.1 7.4 7.0 6.2 4.6 3.2 0.6 m
Quarterly Ave. Growth Rates1987 Q3 2.8 2.8 2.8 4.5 4.5 4.5 0.8 0.8 0.8
Q4 3.9 3.9 3.9 5.4 5.4 5.4 3.9 3.9 3.91988 Q1 6.7 6.7 6.7 7.0 7.0 7.0 3.9 3.9 3.9
Q2 7.9 7.9 7.9 7.1 7.1 7.1 5.8 5.8 5.8Q3 6.1 5.6 4.8 6.9 6.7 6.4 4.4 3.8 2.6
Mar. 88 to June 88 6.9 6.9 6.9 6.1 6.1 6.1 6.0 6.0 6.0May 88 to Sept. 88 6.2 5.7 4.5 7.2 7.0 6.6 5.1 4.3 2.8June 88 to Sept. 88 6.3 5.5 4.1 7.3 7.0 6.5 4.4 3.4 1.4
Q4 87 to Q2 88 7.4 7.4 7.4 7.1 7.1 7.1 4.9 4.9 4.9Q4 87 to June 88 7.2 7.2 7.2 7.0 7.0 7.0 4.9 4.9 4.9Q4 87 to Sept. 88 7.0 6.7 6.3 7.2 7.1 6.9 4.8 4.4 3.8
4.0 to 8.0 4.0 to 8.01988 Target Ranges:
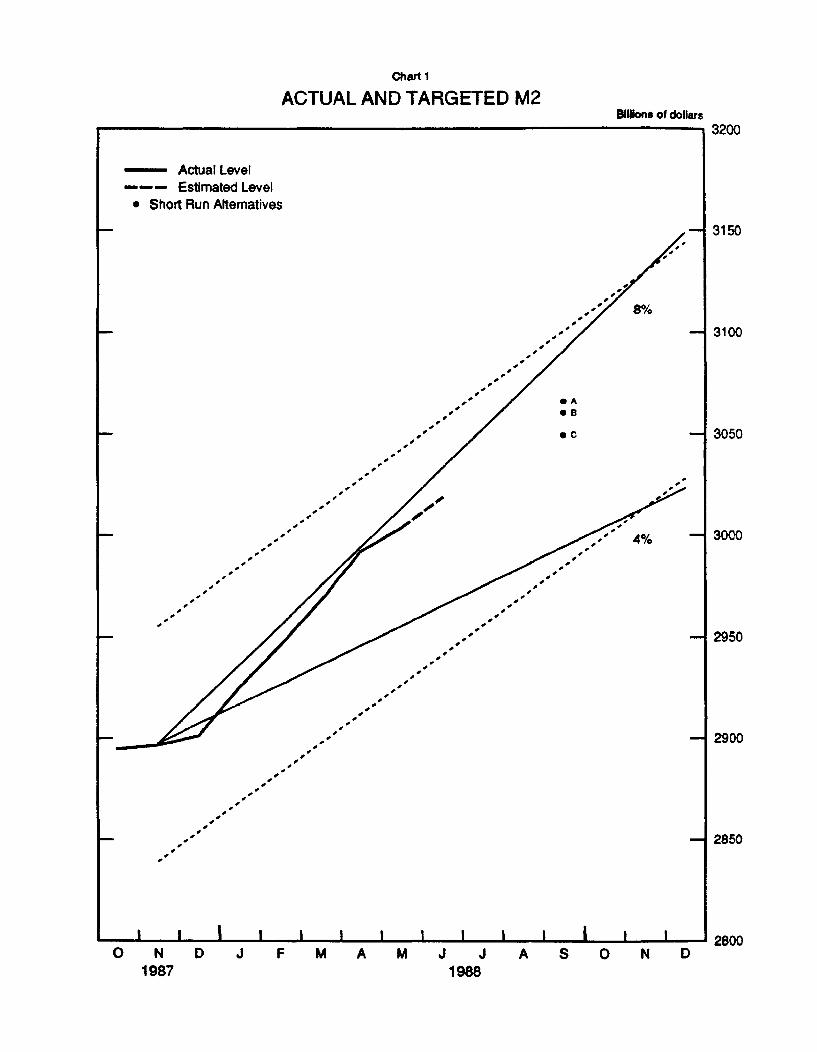
Chart 1
ACTUAL AND TARGETED M2Billions of dollars
- Actual Level- Estimated Level
* Short Run Alternatives
I I I I I I I I I I I I I IO N D J F M A M J J A S O N D
2800
3200
3150
-4 3100
-- 3050
-- 3000
-1 2950
2900
-1 2850
I I I I I I I I I I
1987 1988

Chart 2
ACTUAL AND TARGETED M3Billons of dollars
4050
Actual Level--- Estimated Level
* Short Run Alternatives
O N D J1987
F M A M J J A S O N D1988
4000
3950
3900
3850
3800
3750
3700
3650
3600
3550
S^e
S#
f
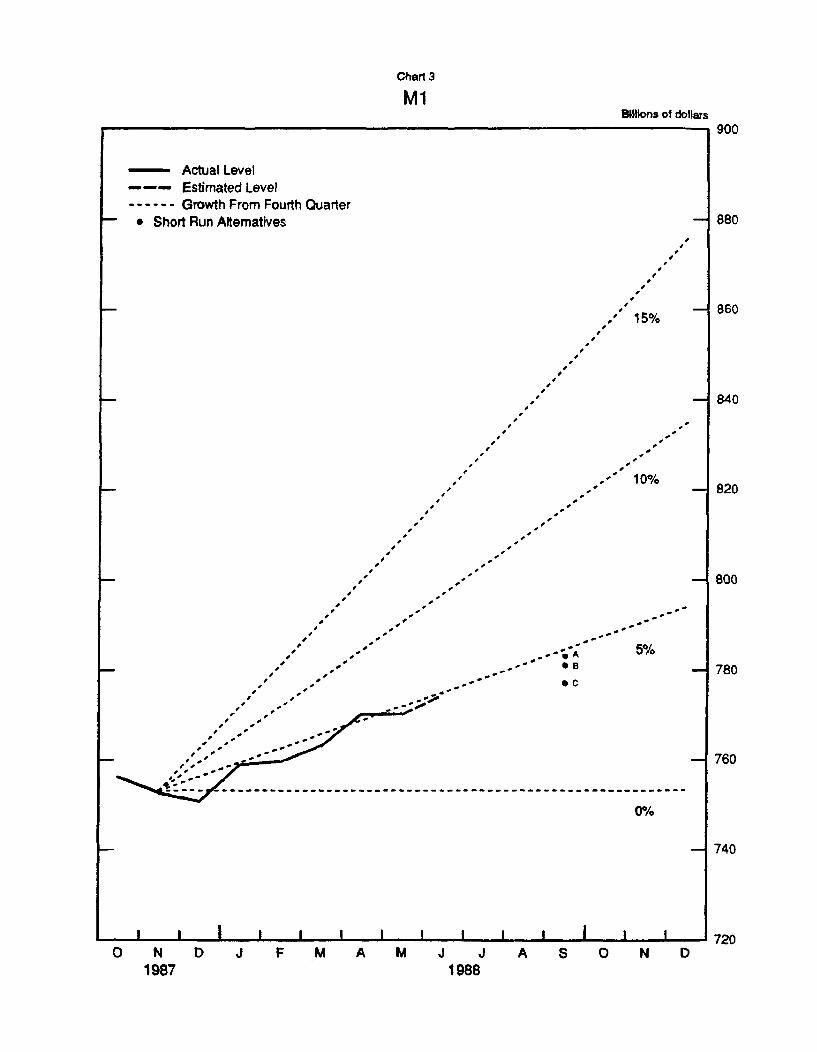
Chart 3
M1Billions of dollars
- Actual Level--- Estimated Level
------ Growth From Fourth QuarterS * Short Run Alternatives
,' 15%
-- 880
860
- 840
==,p
-'10%-1 820
Vs
-1 800
- -
VV
S -- * A 5%/-- 780
_ ,,
-- --- --(%
760
740
I I I I I I I I i I I I
O N D J F M A M J J A S O N D720I I
1987 1988
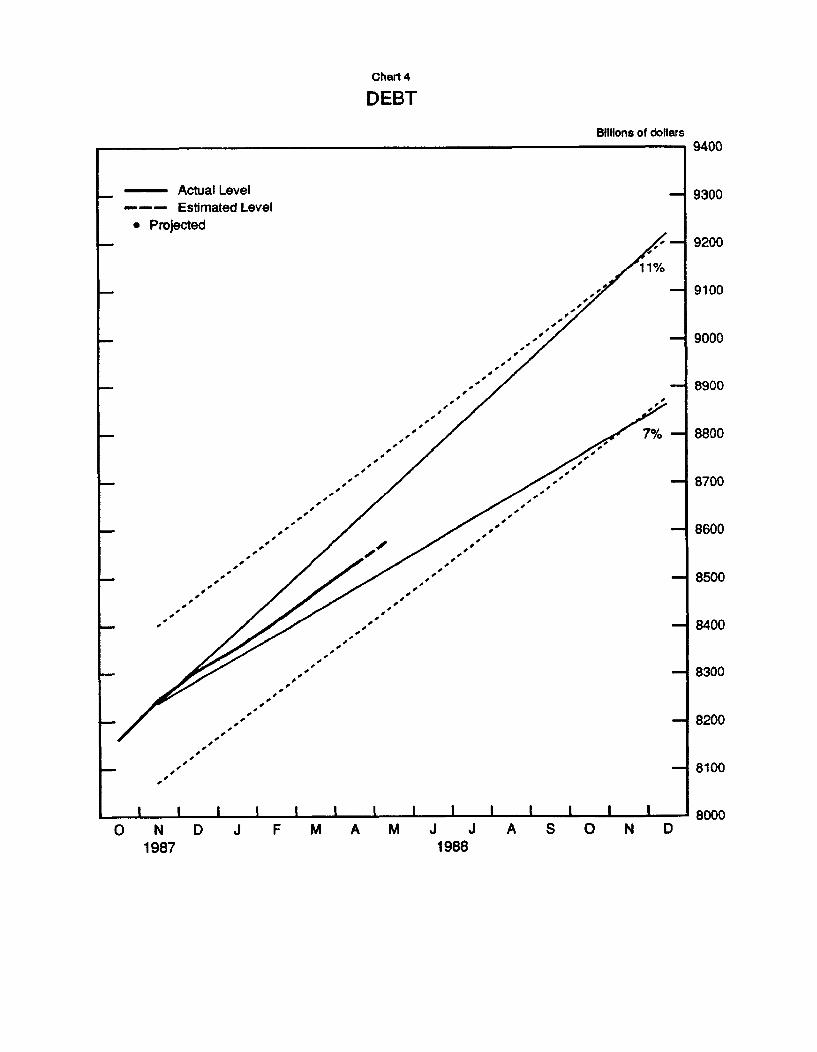
Chart 4
DEBT
Billions of dollars
- Actual Level--- Estimated Level
* Projected
O N D J1987
F M A M J J A S O N D1988
9400
9300
9200
9100
9000
8900
8800
8700
8600
8500
8400
8300
8200
8100
8000
-16-
strengthen a bit following their recent lull. In reflection of this
pattern, M1 would slow to only a 3-1/2 percent pace under this alternative.
(20) M3, under alternative B, is expected to pick up a little over June
to September from the pace of recent months as outflows from money funds
abate with the stable interest rates assumed under this alternative. Credit
demands on banks and thrifts and their issuance of managed liabilities
should remain strong. Corporate merger activity is projected to decline
appreciably, but business credit demands are expected to slow only a bit,
remaining focused on bank loans and short-term paper, as external financing
needs rise further. Household borrowing should remain moderate, but
Treasury financing will strengthen in the coming months along with the
deficit, leading to a pickup in federal debt growth. Total nonfinancial
debt is expected to expand at around an 8 percent annual rate over the June-
to-September period, about in line with that of the second quarter, placing
this aggregate 8-1/2 percent above its fourth-quarter 1987 base.
(21) The market does not appear to be anticipating an immediate further
monetary tightening as contemplated in alternative C. Thus, the half-point
increase in the funds rate under this alternative would prompt other private
short-term rates to move up by a similar amount. In view of still higher
funding costs, a boost in the prime rate of at least 1/2 percentage point
would seem much more likely. The Treasury bill rate would rise to 7 percent
or above. Such a firming in policy, at a time of market concern about
resource constraints and inflationary pressures, would tend to assuage some
inflation worries and any rise in bond rates could be quite small. Recent
-17-
firmness of the dollar could be sustained for a time unless foreign authori-
ties took this opportunity to tighten their policies substantially.
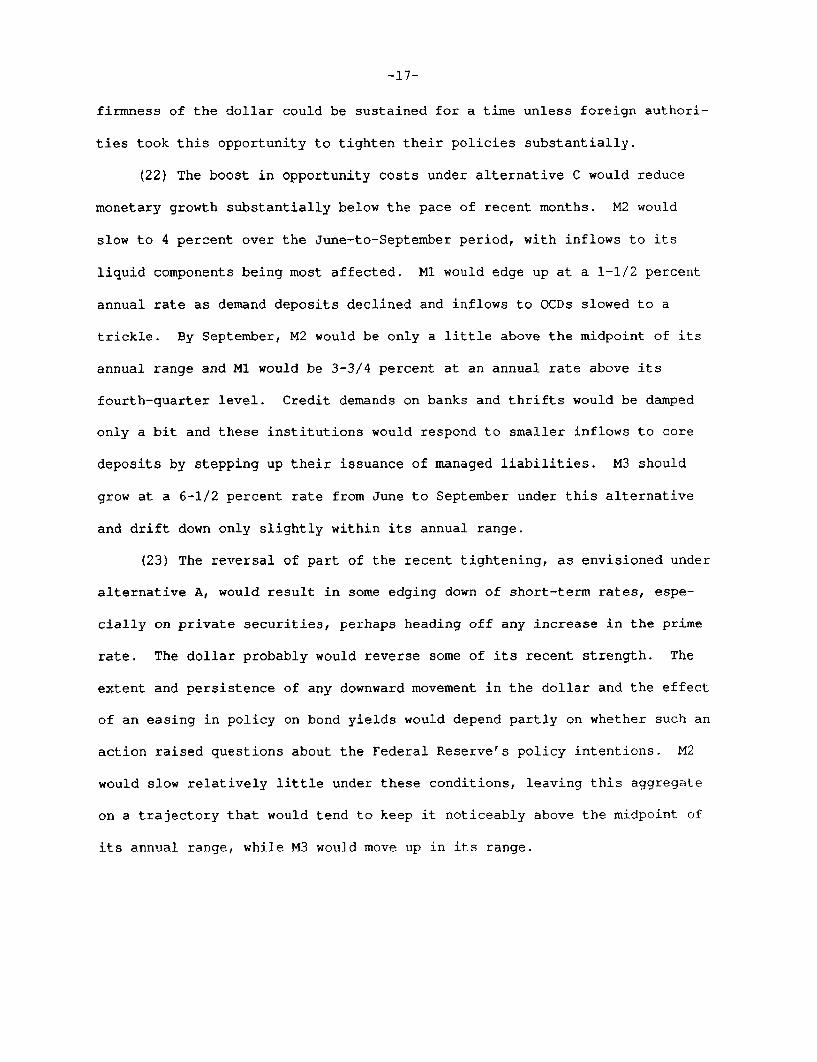
(22) The boost in opportunity costs under alternative C would reduce
monetary growth substantially below the pace of recent months. M2 would
slow to 4 percent over the June-to-September period, with inflows to its
liquid components being most affected. M1 would edge up at a 1-1/2 percent
annual rate as demand deposits declined and inflows to OCDs slowed to a
trickle. By September, M2 would be only a little above the midpoint of its
annual range and M1 would be 3-3/4 percent at an annual rate above its
fourth-quarter level. Credit demands on banks and thrifts would be damped
only a bit and these institutions would respond to smaller inflows to core
deposits by stepping up their issuance of managed liabilities. M3 should
grow at a 6-1/2 percent rate from June to September under this alternative
and drift down only slightly within its annual range.
(23) The reversal of part of the recent tightening, as envisioned under
alternative A, would result in some edging down of short-term rates, espe-
cially on private securities, perhaps heading off any increase in the prime
rate. The dollar probably would reverse some of its recent strength. The
extent and persistence of any downward movement in the dollar and the effect
of an easing in policy on bond yields would depend partly on whether such an
action raised questions about the Federal Reserve's policy intentions. M2
would slow relatively little under these conditions, leaving this aggregate
on a trajectory that would tend to keep it noticeably above the midpoint of
its annual range, while M3 would move up in its range.
-18-
Directive language
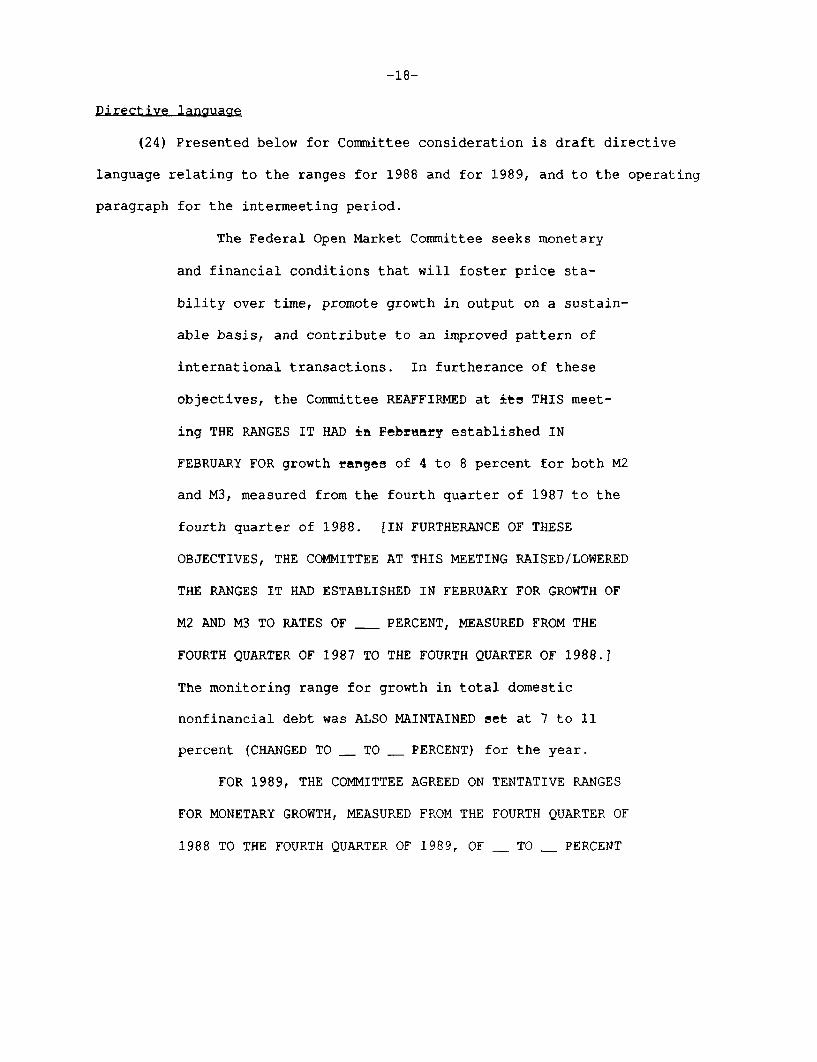
(24) Presented below for Committee consideration is draft directive
language relating to the ranges for 1988 and for 1989, and to the operating
paragraph for the intermeeting period.
The Federal Open Market Committee seeks monetary
and financial conditions that will foster price sta-
bility over time, promote growth in output on a sustain-
able basis, and contribute to an improved pattern of
international transactions. In furtherance of these
objectives, the Committee REAFFIRMED at its THIS meet-
ing THE RANGES IT HAD in February established IN
FEBRUARY FOR growth ranges of 4 to 8 percent for both M2
and M3, measured from the fourth quarter of 1987 to the
fourth quarter of 1988. [IN FURTHERANCE OF THESE
OBJECTIVES, THE COMMITTEE AT THIS MEETING RAISED/LOWERED
THE RANGES IT HAD ESTABLISHED IN FEBRUARY FOR GROWTH OF
M2 AND M3 TO RATES OF ____ PERCENT, MEASURED FROM THE
FOURTH QUARTER OF 1987 TO THE FOURTH QUARTER OF 1988.]
The monitoring range for growth in total domestic
nonfinancial debt was ALSO MAINTAINED set at 7 to 11
percent (CHANGED TO ____ TO _____ PERCENT) for the year.
FOR 1989, THE COMMITTEE AGREED ON TENTATIVE RANGES
FOR MONETARY GROWTH, MEASURED FROM THE FOURTH QUARTER OF
1988 TO THE FOURTH QUARTER OF 1989, OF ____ TO ____ PERCENT

-19-
FOR M2 AND ____ TO ____ PERCENT FOR M3. THE COMMITTEE PRO-
VISIONALLY SET THE ASSOCIATED MONITORING RANGE FOR
GROWTH IN TOTAL DOMESTIC NONFINANCIAL DEBT AT ____ TO
PERCENT.
With respect to M1, the Committee REAFFIRMED ITS
DECISION decided in February not to establish a specific
target for 1988 AND ALSO DECIDED NOT TO SET A TENTATIVE
RANGE FOR 1989. The behavior of this aggregate in
relation to economic activity and prices [DEL: has become very
sensitive to changes in interest rates, among other
factors as evidenced by sharp swings in its velocity in
recent years. -Consequently, the appropriateness of
changes in M1 this year] will continue to be evaluated in
the light of the behavior of its velocity, developments
in the economy and financial markets, and the nature of
emerging price pressures.
OPERATIONAL PARAGRAPH
In the initial implementation of policy FOR THE
IMMEDIATE FUTURE, the Committee seeks to DECREASE
SLIGHTLY (Alt. A)/maintain (Alt. B)/INCREASE SOMEWHAT
(SLIGHTLY) (Alt. C) the existing degree of pressure on
reserve positions. Taking account of conditions in
financial markets, the strength of the business expan-

-20-
sion, indications of inflationary pressures, develop-
ments in foreign exchange markets, and the behavior of
the monetary aggregates, [DEL: the Committee expects that a
slight-increase in the degree of pressure on reserve
positions would be appropriate in the weeks ahead.
Depending on further developments in these factors,]
somewhat (SLIGHTLY) greater reserve restraint would
(MIGHT) or (SOMEWHAT) slightly lesser reserve restraint
(WOULD) might also be acceptable later in the intermeet-
ing period. The contemplated reserve conditions are
expected to be consistent with growth in M2 and M3 over
the period from March through June THROUGH SEPTEMBER at
annual rates of about ____ AND ____ [DEL: 6 to 7] percent, RESPEC-
TIVELY. The Chairman may call for Committee consul-
tation if it appears to the Manager for Domestic Opera-
tions that reserve conditions during the period before
the next meeting are likely to be associated with a
federal funds rate persistently outside a range of ____ TO
____ [DEL: 5 to 9] percent.
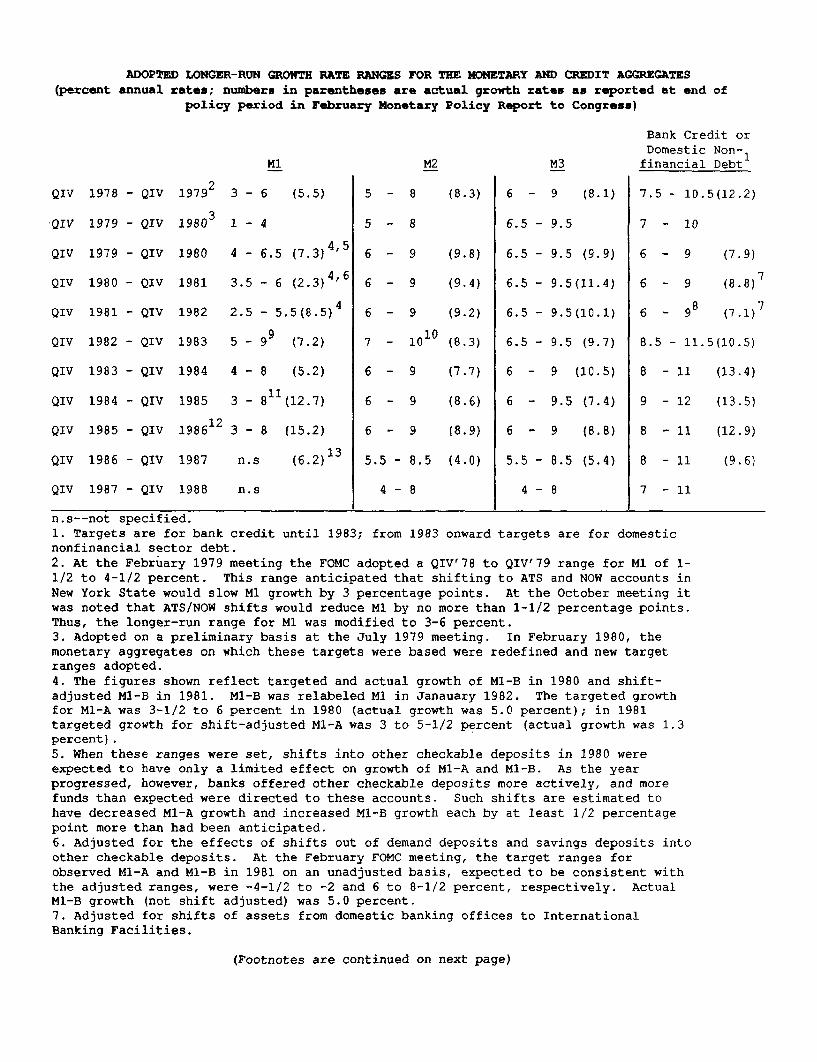
ADOPTED LONGER-RUN GROWTH RATE RANGES FOR THE MONETARY AND CREDIT AGGREGATES(percent annual rates; numbers in parentheses are actual growth rates as reported at end of
policy period in February Monetary Policy Report to Congress)
QIV 1978 - QIV
QIV 1979 - QIV
QIV 1979 - QIV
QIV 1980 - QIV
QIV 1981 - QIV
QIV 1982 - QIV
QIV 1983 - QIV
QIV 1984 - QIV
QIV 1985 - QIV
QIV 1986 - QIV
QIV 1987 - QIV
19792
19803
1980
1981
1982
1983
1984
1985
M1
3 - 6 (5.5)
1 - 4
4 - 6.5 (7.3) 4 ' 5
3.5 - 6 (2.3) 4 ' 6
2.5 - 5.5(8.5) 4
95 - 9 (7.2)
4 - 8 (5.2)
3 - 811 (12.7)
198612 3 - 8
1987
1988
(15.2)
n.s (6.2)13
n.s
8 (8.3)
5 - 8
9 (9.8)
9 (9.4)
6 - 9 (9.2)
7 - 1010 (8.3)7 - 10 (8.3)
9 (7.7)
9 (8.6)
6 - 9 (8.9)
5.5 - 8.5 (4.0)
4 - 8
M3
6 - 9
6.5 - 9.5
6.5 - 9.5
6.5 - 9.5
6.5- 9.5
6.5 - 9.5
6 - 9
6 - 9.5
6 - 9
(8.1)
(9.9)
(11.4)
(10.1)
(9.7)
(10.5)
(7.4)
(8.8)
5.5 - 8.5 (5.4)
4 - 8
Bank Credit orDomestic Non-financial Debt
7.5 - 10.5(12.2)
7 -10
6 - 9
6 - 9
(7.9)
(8.8) 7
-98 76 - 8 (7.1) 7
8.5 - 11.5(10.5)
8 - 11 (13.4)
- 12 (13.5)
8 - 11 (12.9)
- 11 (9.6)
7 - 11
n.s--not specified.1. Targets are for bank credit until 1983; from 1983 onward targets are for domesticnonfinancial sector debt.2. At the February 1979 meeting the FOMC adopted a QIV'78 to QIV'79 range for M1 of 1-1/2 to 4-1/2 percent. This range anticipated that shifting to ATS and NOW accounts inNew York State would slow M1 growth by 3 percentage points. At the October meeting itwas noted that ATS/NOW shifts would reduce M1 by no more than 1-1/2 percentage points.Thus, the longer-run range for M1 was modified to 3-6 percent.3. Adopted on a preliminary basis at the July 1979 meeting. In February 1980, themonetary aggregates on which these targets were based were redefined and new targetranges adopted.4. The figures shown reflect targeted and actual growth of Ml-B in 1980 and shift-adjusted Mi-B in 1981. MI-B was relabeled Ml in Janauary 1982. The targeted growthfor Ml-A was 3-1/2 to 6 percent in 1980 (actual growth was 5.0 percent); in 1981targeted growth for shift-adjusted MI-A was 3 to 5-1/2 percent (actual growth was 1.3percent).5. When these ranges were set, shifts into other checkable deposits in 1980 wereexpected to have only a limited effect on growth of Ml-A and Mi-B. As the yearprogressed, however, banks offered other checkable deposits more actively, and morefunds than expected were directed to these accounts. Such shifts are estimated tohave decreased Mi-A growth and increased Ml-B growth each by at least 1/2 percentagepoint more than had been anticipated.6. Adjusted for the effects of shifts out of demand deposits and savings deposits intoother checkable deposits. At the February FOMC meeting, the target ranges forobserved MI-A and Ml-B in 1981 on an unadjusted basis, expected to be consistent withthe adjusted ranges, were -4-1/2 to -2 and 6 to 8-1/2 percent, respectively. ActualM1-B growth (not shift adjusted) was 5.0 percent.7. Adjusted for shifts of assets from domestic banking offices to InternationalBanking Facilities.
(Footnotes are continued on next page)

8. Range for bank credit is annualized growth from the December 1981-January 1982average level through the fourth quarter of 1982.9. Base period, adopted at the July 1983 FOMC meeting, is QII'83. At the February1983 meeting, the FOMC had adopted a QIV'82 to QIV'83 target range for M1 of 4 to 8percent.10. Base period is the February-March 1983 average.11. Base period, adopted at the July 1985 FOMC meeting, is QII'85. At the February1985 meeting the FOMC had adopted a QIV'84 to QIV'85 target range for M1 of 4 to 7percent.12. Actual reported rates in the February 1987 Monetary Policy Report to Congress.13. No range for M1 was specified at the February FOMC meeting because ofuncertainties about its underlying relationship to the behavior of the economy and itssensitivity to economic and financial circumstances.
June 27, 1988
Short- term----- Treasury bills--
-- secondary market---
87--HighLow
88--HighLow
MonthlyJUN 87JUL 87AUG 87SEP 87OCT 87NOV 87DEC 87JAN 88FEB 88MAR 88APR 88MAY 88
MeeklyMAR 2 88MAR 9 8hMAR 16 88MAR 23 88MAR 30 88
APR 6 88APR 13 88APR 20 88APR 27 88
MAY 4 88MAY 11 88MAY 18 88MAY 25 88
JUN 1 88JUN 8 88JUN 15 88JUN 22 88
DailyJUN 17 88JUN 23 88JUN 24 88
federal 3funds month
7.62 6.845.95 5.24
6month
7.365.36
12month
7.645.40
cdssec mkt3-month
8.495.83
comm.
paper1-month
8.125.88
SELECTED INTEREST RATES(percent)
moneymarketmutualfund
6.705.28
LOna- er ,-U.S. Gov't. constant---- maturity yields---
bankprimeloan
9.257.50
3-year
9.296.37
10-year
9.967.03
30-year
9.977.34
corp. Autilityrec off
11.508.79
muni.BondBuyer
9.596.92
-- conventional home----- mortgages
sec mkt primary market
fixed- fixed-rate rate ARM
11.98 11.58 8.458.97 9.03 7.47
7.54 6.44 6.82 7.11 7.53 7.41 6.79 9.00 8.41 9.21 9.33 10.73 8.34 10.86 10.58 7.906.38 5.61 5.81 6.15 6.58 6.50 6.03 8.50 7.33 8.16 8.40 9.63 7.76 9.98 9.84 7.49
6.736.586.737,227.296.696.776.836.586.586.877.09
6.606.516.616.516.62
5.675.696.046.406.135.695.775.815.665.705.916.26
5.615.705.685.725.74
6.82 5.906.81 5.986.93 5.826.85 5.86
6.82 6.067.02 6.287.04 6.227.14 6.26
7.417.377.437.54
7.547.557.58p
6.446.446.406.42
6.376.526.51
5.995.766.156.646.696.196.366.255.935.916.216.56
5.815.905.825.886.03
6.356.246.547.117.056.506.696.526.216.286.566.90
6.196.266.256.286.36
6.16 6.51
6.16 6.506.18 6.566.24 6.57
6.39 6.706.48 6.836.48 6.856.65 7.00
6.946.706.757.378.027.247.666.926.606.636.927.24
6.586.616.626.626.66
6.866.576.627.267.386.777.766.766.556.576.807.07
6.546.536.566.566.61
6.78 6.696.85 6.766.97 6.826.99 6.84
7.05 6.897.17 6.987.24 7.087.28 7.08
6.016.026.006.226.576.456.576.576.226.046.096.20
6.106.046.056.036.03
6.046.096.096.14
6.136.146.276.28
6.82 7.11 7.47 7.34 6.376.71 7.01 7.46 7.36 6.416.61 6.89 7.43 7.34 6.506.74 7.02 7.53 7.41 6.56
6.706.766.75
7.03 7.50 7.386.99 7.53 7.416.98 7.53 7.44
8.258.258.258.709.078.788.758.758.518.508.508.84
8.508.508.508.508.50
8.508.508.508.50
8.508.579.009.00
9.009.009.009.00
7.827.748.038.678.757.998.137.877.387.507.838.24
7.337.427.447.527.65
8.408.458.769.429.528.868.998.678.218.378.729.09
8.178.278.328.428.54
7.78 8.637.71 8.577.86 8.777.88 8.80
8.578.648.979.599.618.959.128.838.438.638.959.23
8.418.528.588.708.79
8.878.799.019.04
8.00 8.89 9.138.17 9.02 9.188.20 9.07 9.198.34 9.21 9.33
8.41 9.178.25 8.998.11 8.848.27 8.97
9.00 8.309.00 8.229.00 8 .21p
9.028.888.84p
9.279.098.959.05
9.128.908.87p
10.0510.1710.3710.8411.0710.3910.4210.059.759.91
10.2310.61
9.789.839.98
10.0110.09
10.0210.2610.3710.46
10.5610.5110.7310.70
10.4310.4610.4710.36
8.138.098.118.619.068.398.438.117.838.088.228.30
7.808.028.098.278.23
8.158.218.278.25
8.278.268.348.32
8.218.158.108.10
10.3810.2010.3911.0111.4210.7310.8210.4310.0210.1210.4410.73
10.0810.1110.0610.2210.36
10.36
10,4510.4910.55
10.6810.5810.7910.86
10.7310.5710.6510.53
10.5410.2810.3310.8911.2610.6510.6510.439.899.93
10.2010.46
9.859.969.929.99
10.05
10.1910.1910.3010.28
10.3210.4010.5210.58
10.5810.5110.3510.40
7.937.817.767.958.258.007.967.857.617.527.587.71
7.537.537.497.527.53
7.56
7.597.617.60
7.637.667.797.77
7.907.887.797.83
NOTE: Neekly data for columns 1 through 11 are statement week averages. Data in column 7 are taken from Donoghue's Honey Fund Report. Columns 12, 13 and 14are 1-day quotes for Friday, Thursday or Friday, respectively, following the end of the statement week. Column 13 is the Bond Buyer revenue index. Column 14is the FNMA purchase yield, plus loan servicing fee, on 30-day mandatory delivery commitments. Column 15 is the average contract rate on new commitments forfixed-rate mortgages(FRMs) with 80 percent loan-to-value ratios at a sample of savings and loans. Column 16 is the average initial contract rate on newcommitments for 1-year, adjustable-rate mortgagesARMs) at SILs offering both FRMs and ARMs with the same number of discount points.
Strictly Confidential (FR)-Class II FOMCMoney and Credit Aggregate Measures
Seasonally adjusted JUNE 27, 1988
Money stock measures and liquid assets Bank credit Domestic nonfinancial debt2nontransactions total loans U.S.
Period M1 M2 components M3 L and government 2 other2 total2
in M2 In M3 only Investments'1 2 3 4 5 6 7 8 9 10
PERCENT ANNUAL GROTBH:ANNUALLY (ulV TO UIV)
198519861987
QUARTERLY AVERAGE2ND UTR. 19873BD QTB. 19874TH QTR. 19871ST QTR. 1988
HONTUL1987--MHA
JUNEJULYAUG.SEPT.OCT.NOV.DEC.
1988-JAR.FEB.
APRNAr pMAI P
MONTHLI LEVELS1987--DEC.1988--JAN.
FEB.BAL.APL.MAI P
(SBILLIONS)
EBEKLI LEVELS ($BILLIONS)1988-BAT 2
9162330
JUNE 6 P13 P
12.015.6
6.2
6.60.83.93.9
2.9-7.1
2.44.71.6
14.0-5.6-3.0
12.91.15.5
11.2-0.2
750.8758.9759.6763.1770.2770.1
776.3769.7768.1769.2771.1
773.9771.8
8.99.44.0
2.72.83.96.7
0.71.12.74.74.85.70.81.9
9.98.68.89.94.7
2901.12925.02946.02967.52991.93003.7
2995.62998.13000.43006.53009.8
3017.73012.9
7.97.43.3
1.33.63.97.7
0.03.92.84.95.82.83.13.6
8.811.2
9.99.46; 4
2150.32166.12186.42204.42421.72233.6
2219.32228.52232.32237.32238.7
2243.82241.1
3.48. 1
10.8
12.711.011.3
7.9
21.722.1
1.810.75.9
12.520.6-0.2
2.718.65.4
-3.42.5
760.0761.7773.5777.0774.8776.4
776.4778.6775.3775.9775.5
778.0781.0
7.79.15.4
4.64.55.47.0
4.95.32.56.05.07.14.81.4
8.410.7
8.17. 14.2
3661.13686.73719.53744.53766.73780.0
3772.03776.73775.83782.43785.3
3795.73793.9
8.58.35.2
4.14.35.86.9
8.04.20.86.47.28.13.20.4
10.59.07.8
11.6
4325.44363.24396.14424.54467.3
10.29.97.8
8.26.25.55. 1
7.86.32.59.18.66.02.6
-1.0
6.19.37.9
11.413.0
2230.62242.42259.82274.82297.72322.5
15.214.7
9.0
8.95.87.69.3
8.27.41.88.76.54.1
13.08.3
5.311.115.2
7. 12.7
1954.71963. 31981.52006.62018.52023.1
12.712.8
9.8
8.58.5
10.88.2
10.59.27.77.2
10.112.311.8
9.0
7.67.16.58.89.7
6350.46390.66428.26462.96510.26563.0
13.313.39.6
8.67.9
10.18.4
10.08.86.37.69.2
10.312.1
8.8
7.08.08.58.48.1
8305.18353.88409.88469.58528.78586.1
1/ ANNUAL BATES FOR BANK CBEDIT ABE ADJUSTED FOR A TRANSFEk OF LOANS FBOM CONTINENTAL ILLINOIS NATIONAL BANK TO THE FDIC
BEGINNING SEPTEBBER 26, 1984.
2/ DEBT DATA ABE ON HMONTHLY AVERAGE BASIS, DERITBD BY AVERAGING END-OF-MnNTH LEVELS OF ADJACENT MONTHS. AND HAVE BEEN ADJUSTED
TO BEMOVE DISCONTINUIAIES.
P-PBELIMINARY
Components of Money Stock and Related MeasuresBillions of dollars, seasonally adjusted unless otherwise noted
JUNE 27, 1988Small Money market Large
Other Overnight denomi- mutual funds, NSA denomi- Term Term Short.Demand checkable RPs and MMDAs Savings nation general Institu- nation RPs Eurodollars Savings term Commer- Banker"
Period Currency deposits deposits Eurodollars NSA deposits time purpose, tlons time NSA NSA bonds Treasury cial paper accep-NSA deposits
1 and brokerl only deposits
3 securities tances
_dealer 21 2 3 4 5 6 7 8 9 10 11 12 13 14 15 16
AIUALLT (4TH OQT):
1985 166.9 263.5 176.8 67.2 509.9 299.9 877.1 176.8 64.1 433.9 b2.7 77.6 78.9 292.3 201.6 43.21986 179.3 294.6 228.6 78.0 569.2 362.2 858.9 207.6 84.7 441.5 82.2 81.0 89.7 283.8 228.5 37.81987 194.9 291.7 259.7 81.2 528.9 415.4 899.4 219.7 87.2 479.2 106.8 92.2 99.4 267.7 255.2 45.1
MONTHLI
1987-HAT 187.0 298.9 253.9 76.2 558.6 409.5 845.9 209.9 82.1 454.0 102.5 86.8 95.9 261.6 253.7 42.1JONE 187.8 293.3 254.3 74.9 555.1 413.1 852.1 210.6 81.7 458.6 107.4 87.8 96.6 259.6 252.8 4 3.1
JULY 189.0 292.3 255.6 75.7 549.4 415.5 859.1 210.6 83.8 460.2 107.0 84.4 97.5 254.8 251.8 43.4AUG. 190.2 292.1 257.2 79.8 545.0 417.8 865.9 213.1 84.0 462.4 107.4 90.2 98.1 258.9 251.8 43.5SEPT. 191.4 290.5 258.6 83.4 540.5 418.6 872.1 216.3 81.3 465.3 109.1 94.4 98.4 263.7 256.6 44.3
OCT. 193.1 295.9 260.3 86.0 533.9 417.0 883.3 218.2 82.5 472.3 106.1 92.9 98.8 273.0 254.2 44.5NOV. 195.0 291.3 259.5 79.7 527.7 415.0 901.7 219.7 89.5 480.5 108.7 92.8 99.3 270.6 252.5 45.0DEC. 196.5 288.0 259.3 78.0 525.2 414.3 913.1 221.1 89.6 484.7 105.5 90.8 100.2 259.5 258.9 45.7
1988-JA1. 198.4 289.9 263.4 82.8 524.0 414.3 924.6 225.0 94.4 482.8 106.0 85.3 101.4 262.5 269.0 43.5FEB. 199.3 287.8 265.2 78.1 522.5 416.2 941.5 231.0 98.7 489.7 109.9 85.2 102.6 259.2 274.1 40.9BAR. 200.9 287.9 e67.1 74.8 524.6 419.8 953.5 234.9 97.4 491.4 107.3 89.5 103.5 255.5 280.3 40.6
APi. 202.5 290.1 270.3 76.8 523.1 422.8 964.8 236.1 91.9 492.6 108.1 88.5 104.6 266.7 288.2 41.2nAI P 203.6 287.3 271.9 81.6 519.5 425.3 971.8 232.7 90.0 496.5 111.2 89.5
1/ INCLUDES BETAIL BREPOCHASE AGREEHENTS. ALL IBA AND KEOGH ACCOUNTS AT COlEBCIAL BANKS AND THRIFT INSTITUTIONS ABBE SUBTRACTEDFROM SHALL TIME DEPOSITS.
2/ EXCLUDES IRA AND KEOGH ACCOUNTS.3/ NET OF LARGE DENOMINATION TIME DEPOSITS HELD BI RONE HARKET MUTUAL FUNDS AND THRIFT INSTITUTIONS.
P-PBBLIBI ABT
STRICTLY CONFIDENTIAL (FR)CLASS II--FOMC
Net Changes in System Holdings of Securities'Millions of dollars, not seasonally adjustedJune 27, 1988
Treasury bills Treasury coupons Federal Net changePeriod Net purchases3 agencies outright Net RPs S
Net Redemp- Rch e w n Redemp- redemptions holdingspurchases2 tions (-) N 1-5 5-10 over(-) Net change tota
1-year 10198219831984198519861987
1987--Q102Q3Q4
1988--01
1987--Oct.Nov.Dec.
1988--Jan.Feb.Mar.Apr.May
Apr. 6132027
May 4111825
June 18
1522
Memo: LEVEL (bil.$)'June 22
-I-
8,698 3,000 5,69815,468 2,400 13,06811,479 7,700 3,77918,096 3,500 14,59620,099 1,000 19,09912,933 9,029 3,905
-1,914 800 -2,7145,823 -- 5,8234,690 8,229 -3,5394,334 -- 4,334
319 2,200 -1,881
7953,388
150
-49-192
560423
515248
41120
6001,600
7953,388
150
-649-1,792
560423
-- 515-- 248-- 41-- 120
111.0
1. Change from end-of-period to end-of-period.2. Outright transactions in market and with foreign accounts.3. Outright transactions in market and with foreign accounts, and short-term notes acquired in
exhange for maturing bills. Excludes maturity shifts and rollovers of maturing coupon issues.
312484826
1,349190
3,358
1,71
1,4
1,7971,8961,9382,185
8939,779
388890236358236
2,441
307383441293158
1,858
- -252767 5,036 1,226.43 2,356 619149 2,639 596
-800 -175
300670479
1,092
622
470
502,589
-800
3,661
1,944
1,717
2,8033,5663,4404,1851,476
17,366
-2528,9483,6105,059
-975
300650
4,109
-975
6,737
3,680
3,057
596
-175
1,017
596
421
53.5 15.4 26.5 117.0
k F
8,31216,3426,964
18,61920,17820,994
-3,07614,735
129,323
-3,011
1,0394,0384,246
-780-2,788
5577,040
-11
5153,909
-593,177
-11
1,461-5,4451,4503,001
10,033-11,033
-14,2542,121
-1,4332,533
-3,514
7,493-3,331-1,629
-4,8071,247
459,111
-10,575
5,776-4,9725,917
-4,191
-3,5227,529
-10,380-3,761
7,6142,4621,403
-3,034
235.3 -4.3
4. Reflects net change and redemptions (-) of Treasury and agency securities.5. Includes changes in RPs (+), matched sale-purchase transactions (-), and matched purchase
sale transactions (+). --
6. The levels of agency issues were as follows: hin - -1 or7 3y.2 1.1 total. 7
2.7 3.2 1.1 1 .2 1 7.3