Embed Size (px)
Citation preview

Content last modified 03/31/2011.
Prefatory Note The attached document represents the most complete and accurate version available based on original files from the FOMC Secretariat at the Board of Governors of the Federal Reserve System. Please note that some material may have been redacted from this document if that material was received on a confidential basis. Redacted material is indicated by occasional gaps in the text or by gray boxes around non-text content. All redacted passages are exempt from disclosure under applicable provisions of the Freedom of Information Act.

Confidential (FR) Class III FOMC
Part 2 January 26, 2005
CURRENT ECONOMICAND FINANCIAL CONDITIONS
Recent Developments
Prepared for the Federal Open Market Committeeby the staff of the Board of Governors of the Federal Reserve System

Confidential (FR) Class III FOMC
January 26, 2005
Recent Developments
Prepared for the Federal Open Market Committeeby the staff of the Board of Governors of the Federal Reserve System

Domestic NonfinancialDevelopments

Domestic Nonfinancial Developments
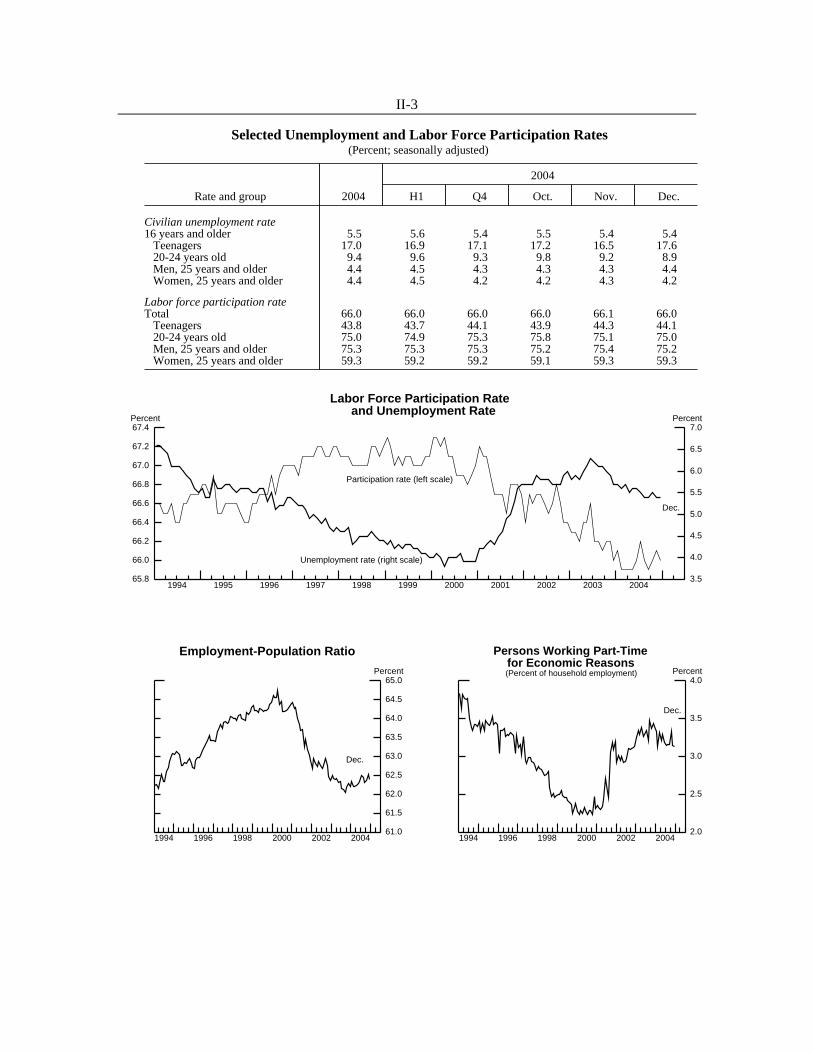
Overview The economy appears to have expanded at a solid pace in the final quarter of 2004. Household spending rose at a brisk pace, and residential construction activity remained at a high level. Growth of demand in the business sector was strong as well: Outlays for equipment and software posted another robust increase, and inventory accumulation appears to have been rapid. The industrial sector registered broad-based increases in production. At the same time, private payrolls have expanded at a moderate rate, and slack in the labor market appears to be dissipating only slowly. Core consumer prices have increased at a steady but modest pace in recent months. The overall CPI, however, has been buffeted by sizable movements in energy prices. Labor Market Developments Private nonfarm payroll employment rose 181,000 per month, on average, in the fourth quarter, a significant step-up from 93,000 in the third quarter and on par with average monthly increases for 2004 as a whole. Boosted by these employment gains, aggregate hours of production or nonsupervisory workers increased at an annual rate of 2.1 percent last quarter. Meanwhile, measures of labor market slack were little changed. In December, private nonfarm payrolls rose 128,000, a gain similar to November’s. By industry, manufacturing employment edged up 3,000 last month, and the related industries of wholesale trade (17,000) and temporary help services (9,000) added jobs as well. Seasonally adjusted employment fell in retail trade (-20,000), as holiday hiring was below the seasonal norm. But job gains elsewhere in the services-producing sector were widespread, with solid advances in health care services (36,000), professional and technical services (29,000), and financial activities (14,000). Average weekly hours of production or nonsupervisory workers bounced back 0.1 hour last month to their October level of 33.8 hours. In the household survey, the unemployment rate held steady at 5.4 percent in December, and the labor force participation rate ticked down to 66.0 percent after having increased in October and November.1 The employment-population ratio, which combines these two measures, was 62.4 percent in December, equal to its third-quarter average and still
1 With December’s employment report, the BLS revised seasonal factors for labor force series going
back to January 2000. The resulting revisions to the unemployment rate and the labor force participation rate were small.

II-2
1997 1998 1999 2000 2001 2002 2003 2004-400
-300
-200
-100
0
100
200
300
400
500
-400
-300
-200
-100
0
100
200
300
400
500Thousands
Dec.
3-month moving average
Changes in Private Payroll Employment
1997 1998 1999 2000 2001 2002 2003 200494
96
98
100
102
104
106
94
96
98
100
102
104
1062002 = 100
Dec.
Aggregate Hours of Production orNonsupervisory Workers
Changes in Employment(Thousands of employees; seasonally adjusted)
2004
Measure and sector 2004 Q2 Q3 Q4 Oct. Nov. Dec.
Average monthly change Monthly change
Nonfarm payroll employment (establishment survey) 186 209 134 202 312 137 157 Private 172 218 93 181 289 125 128 Previous ... 218 93 ... 279 104 ... Manufacturing 6 16 5 -2 -1 -9 3 Construction 22 19 16 25 60 7 7 Wholesale trade 8 5 8 11 8 8 17 Retail trade 14 14 -8 5 25 9 -20 Transportation and utilities 9 8 9 4 8 1 3 Information -1 4 -8 1 4 1 -3 Financial activities 12 15 10 14 14 15 14 Professional and business services 46 73 30 52 95 21 41 Temporary help services 17 23 17 20 53 -3 9 Nonbusiness services1 55 60 30 70 78 69 63 Total government 14 -8 41 21 23 12 29 Total employment (household survey) 146 250 123 210 300 466 -137 Memo:Aggregate hours of private production workers (percent change)2 2.4 2.2 3.1 2.1 .3 -.2 .4 Average workweek (hours)3 33.8 33.7 33.8 33.8 33.8 33.7 33.8 Manufacturing (hours) 40.8 40.9 40.8 40.5 40.6 40.5 40.5
1. Nonbusiness services comprises education and health, leisure and hospitality, and "other." 2. Establishment survey. Annual data are percent changes from Q4 to Q4. Quarterly data are percent changes from precedingquarter at an annual rate. Monthly data are percent changes from preceding month. 3. Establishment survey. ... Not applicable.
II-3
1994 1995 1996 1997 1998 1999 2000 2001 2002 2003 200465.8
66.0
66.2
66.4
66.6
66.8
67.0
67.2
67.4Percent
3.5
4.0
4.5
5.0
5.5
6.0
6.5
7.0Percent
Unemployment rate (right scale)
Participation rate (left scale)
Dec.
Labor Force Participation Rateand Unemployment Rate
1994 1996 1998 2000 2002 200461.0
61.5
62.0
62.5
63.0
63.5
64.0
64.5
65.0
61.0
61.5
62.0
62.5
63.0
63.5
64.0
64.5
65.0Percent
Dec.
Employment-Population Ratio
1994 1996 1998 2000 2002 20042.0
2.5
3.0
3.5
4.0
2.0
2.5
3.0
3.5
4.0Percent
Dec.
Persons Working Part-Timefor Economic Reasons (Percent of household employment)
Selected Unemployment and Labor Force Participation Rates(Percent; seasonally adjusted)
2004
Rate and group 2004 H1 Q4 Oct. Nov. Dec.
Civilian unemployment rate16 years and older 5.5 5.6 5.4 5.5 5.4 5.4 Teenagers 17.0 16.9 17.1 17.2 16.5 17.6 20-24 years old 9.4 9.6 9.3 9.8 9.2 8.9 Men, 25 years and older 4.4 4.5 4.3 4.3 4.3 4.4 Women, 25 years and older 4.4 4.5 4.2 4.2 4.3 4.2
Labor force participation rateTotal 66.0 66.0 66.0 66.0 66.1 66.0 Teenagers 43.8 43.7 44.1 43.9 44.3 44.1 20-24 years old 75.0 74.9 75.3 75.8 75.1 75.0 Men, 25 years and older 75.3 75.3 75.3 75.2 75.4 75.2 Women, 25 years and older 59.3 59.2 59.2 59.1 59.3 59.3

II-4
Labor Market Indicators
1990 1992 1994 1996 1998 2000 2002 20041.5
2.0
2.5
3.0
3.5
4.0
4.5Millions
250
300
350
400
450
500
550Thousands
4-week moving average
Initial claims(right scale)
Insured unemployment(left scale)
Jan. 15
Jan. 8
Unemployment Insurance
1990 1992 1994 1996 1998 2000 2002 200440
60
80
100
120
140Index
20
40
60
80
100
120Index
Jan.
Jan.(p)
Conference Board(left scale)
Michigan SRC(right scale)
Note. The proportion of households expecting labormarket conditions to improve, minus the proportion expecting conditions to worsen, plus 100.
Expected Labor Market Conditions
1990 1992 1994 1996 1998 2000 2002 200450
70
90
110
130
150
50
70
90
110
130
150Index
Jan.
Note. The proportion of households believing jobsare plentiful, minus the proportion believing jobs arehard to get, plus 100. Source. Conference Board.
Job Availability
2001 2002 2003 20041.8
2.0
2.2
2.4
2.6
2.8
3.0
3.2
3.4
3.6Percent of private employment
2.6
2.8
3.0
3.2
3.4
3.6
3.8
4.0
4.2Percent of private employment
Layoffs and Hires
Expectations
Labor Market Tightness
Nov.
Openings(left scale)
Hires(right scale)
Source. Job Openings and Labor Turnover Survey.
Job Openings and Hires
1990 1992 1994 1996 1998 2000 2002 20040
5
10
15
20
25
30
0
5
10
15
20
25
30Percent
Q1
Dec.
Manpower, Inc.
National Federation of Independent Businesses(3-month moving average)
Note. Percent planning an increase in employmentminus percent planning a reduction.
Net Hiring Plans
1990 1992 1994 1996 1998 2000 2002 20045
10
15
20
25
30
35
40
5
10
15
20
25
30
35
40Percent
Source. National Federation of Independent Businesses.
Dec.
3-month moving average
Note. Percent of firms surveyed with at least one"hard to fill" job opening.
Positions Hard to Fill

II-5
only a bit above the lows reached in the middle of 2003. Mirroring this pattern, the percent of employed individuals working part-time for economic reasons (an alternative indicator of labor market slack) has only edged down from its 2003 highs. Other labor market indicators point to continued moderate gains in employment early this year. The four-week moving average of initial claims for unemployment insurance was 341,000 for the week ending January 15 and has fluctuated within a narrow range centered on 340,000 since last spring. According to the Job Openings and Labor Turnover Survey, the rate of hires in the private sector jumped in November to its highest level since January 2001, and, despite moving down in November, the rate of job openings remained above the average level seen in the first half of 2004. Employers’ net hiring plans are approaching pre-recession peaks, according to indexes from both Manpower Inc. and the National Federation of Independent Businesses (NFIB). Although individuals’ expectations of future labor market conditions as gauged by the Conference Board and the Michigan Survey have changed little, on net, over the past year, they remain well above their cyclical lows. Recent surveys also show that, to date, firms and workers have noticed only a moderate amount of tightening in the labor market. Although the share of small businesses finding positions to be hard to fill ticked up last month according to the NFIB, it has increased only modestly from the low point reached in 2003 and remains below levels prevailing in the mid-1990s. The view from the opposite end of the labor market is similar, according to the Conference Board, as individuals believe that jobs are still relatively difficult to find. Industrial Production The pace of expansion in the industrial sector picked up in the fourth quarter, and gains were broadly based across industries. Total IP rose at an annual rate of 4.1 percent, a step-up from the more subdued third-quarter rate and just a bit less than the average quarterly increase for 2004. Manufacturing output also rose at a 4.1 percent rate in the fourth quarter—which was about the same pace as that of the previous quarter, and the 5 percent increase for the year as a whole was the largest increase since 1999. Output at mines declined in the fourth quarter, largely the result of a drop in natural gas extraction, while utilities output rose at a rapid clip. The rate of capacity utilization

II-6
Selected Components of Industrial Production (Percent change from preceding comparable period)
Proportion 2004 20042004 20041
Component (percent) Q3 Q4 Oct. Nov. Dec.
Total 100.0 4.2 2.7 4.1 .8 .2 .8Previous 100.0 ... 3.2 ... .6 .3 ...
Manufacturing 82.5 5.0 4.0 4.1 .9 .1 .7 Ex. motor veh. and parts 75.0 5.2 4.5 3.2 .7 .1 .7 Ex. high-tech industries 70.3 4.3 3.8 2.5 .7 .0 .6
Mining 7.6 -1.5 -2.0 -1.3 .0 2.2 .4Utilities 9.9 2.3 -4.7 8.7 -.2 -.1 2.7
Selected industriesHigh technology 4.8 18.6 15.6 14.0 .8 1.7 1.7 Computers 1.2 7.6 -1.0 17.2 1.6 1.5 1.4 Communications equipment 1.3 9.6 22.3 13.3 1.3 2.3 .3 Semiconductors2 2.3 29.2 20.0 12.9 .2 1.5 2.6
Motor vehicles and parts 7.5 2.5 -1.1 14.4 3.5 -.8 .5
Market groups excludingenergy and selected industriesConsumer goods 22.3 3.5 1.4 2.5 .8 -.1 .4 Durables 4.4 1.9 -2.9 1.2 .7 .2 .9 Nondurables 17.9 3.9 2.5 2.8 .8 -.1 .3
Business equipment 7.5 9.4 11.7 2.5 .9 -.6 1.2Defense and space equipment 1.9 6.9 9.1 8.0 .3 1.0 1.4
Construction supplies 4.2 4.2 3.6 1.6 .7 -.1 .3Business supplies 8.3 3.1 1.6 .6 .4 -.1 .6
Materials 25.1 3.8 4.3 2.6 .5 .3 .5 Durables 13.6 4.7 5.5 4.4 .7 .4 .5 Nondurables 11.5 2.6 2.9 .3 .2 .1 .4
1. From fourth quarter of preceding year to fourth quarter of year shown. 2. Includes related electronic components. ... Not applicable.
Annual rate Monthly rate
Capacity Utilization (Percent of capacity)
1972- 1990- 20042003 1982 1991
Sector average low low Q2 Q3 Q4 Nov. Dec.
Total industry 81.1 70.8 78.6 77.9 78.2 78.8 78.6 79.2
Manufacturing 79.9 68.5 77.2 76.5 77.0 77.6 77.4 77.8 High-tech industries 78.6 74.1 74.3 69.7 69.9 69.7 69.7 70.1 Excluding high-tech industries 80.0 68.2 77.3 77.2 77.8 78.4 78.3 78.7
Mining 87.1 78.6 83.5 86.6 86.3 86.1 86.6 87.0Utilities 86.9 77.7 84.2 85.1 83.7 85.1 84.3 86.5

II-7
climbed to 79.2 percent at the end of the 2004, 2.4 percentage points above its year-ago level but still 1.9 percentage points below its 1972-2003 average.2 Overall, the production of high-tech goods rose at an annual rate of 14 percent in the fourth quarter, a pace somewhat slower than that seen earlier in the year. Semiconductor manufacturers posted strong gains in December. Moreover, stronger-than-expected sales in the fourth quarter have helped Intel eliminate much of its excess inventories, and the company’s strong earnings forecast for the first quarter, coupled with its plans to press ahead with the release of next-generation chips for both laptops and high-end servers, suggests solid gains in real semiconductor output in the near term. The production of computers also moved up respectably in December, and output of communications equipment edged up following larger increases in October and November. Forward-looking indicators of activity for the high-tech industries are mostly consistent with moderate production gains in coming months. Industry contacts were notably optimistic about the outlook for servers, and they cited several factors that suggest sustained production increases in 2005, including a shift in demand toward more-expensive models, the arrival of new high-end products from IBM, and the onset of a server-replacement cycle. Reinforcing this outlook, Gartner reported that PC sales rose in the fourth quarter. CIO Magazine diffusion indexes for future spending on computer hardware and on networking equipment edged down in December for the second consecutive month, but the levels of these indexes remain elevated.
In transportation equipment, motor vehicle assemblies rose 200,000 units in the fourth quarter of 2004 to an annual rate of 12.0 million units; the increase contributed to a jump of 14½ percent in the output of motor vehicles and parts. Over the four quarters of 2004, motor vehicles and parts rose 2½ percent. The output of military aircraft and
2 In the annual revision of industrial production, capacity, and capacity utilization that was published in
December, the rate of capacity utilization was revised up nearly 1 percentage point in recent quarters. The higher utilization rates were concentrated among electric and gas utilities, mining, and high-technology industries. Overall changes to total IP were small; the rise in output in 2002 is now shown to have been slightly stronger than previously reported, and the increases in 2003 and 2004 are somewhat smaller. Recent production increases for high-technology industries are now estimated to have been lower than previously estimated.

II-8
Indicators of High-Tech Manufacturing Activity
1999 2000 2001 2002 2003 2004
100
200
400
600
800
10001997 = 100, ratio scale
Computers
Communications equipment
Semiconductors
Dec.
Industrial Production in the High-Tech Sector
1998 1999 2000 2001 2002 2003 200430
40
50
60
70
80
90
100
30
40
50
60
70
80
90
100Percent
Dec.
Communications equipment
Computers and peripherals
High-Tech Capacity Utilization Rates
1999 2000 2001 2002 2003 2004 20055.0
5.5
6.0
6.5
7.0
7.5
8.0
8.5
9.09.5
Note. Q1 is the range of Intel’s guidance as of Jan. 11, 2005.FRB seasonals. Source. Intel and Semiconductor Industry Association.
Worldwide MPU shipments
Intel revenue
Billions of dollars, ratio scale
Q4
Q1
Microprocessor Unit (MPU) Shipmentsand Intel Revenue
1999 2000 2001 2002 2003 2004 20050.15
0.20
0.25
0.30
0.35
0.40
0.45
0.15
0.20
0.25
0.30
0.35
0.40
0.45Ratio
Q4
Note. FRB seasonals.
Intel Inventories-to-Shipments Ratio
1999 2000 2001 2002 2003 2004 20050.30
0.36
0.42
0.48
0.54
0.60
0.66
0.720.78
9
10
11
12
13
14
15
16
17
Q1PCs (right scale)
Servers (left scale)
Millions of units, ratio scale Millions of units, ratio scale
Note. FRB seasonals. Values for Q4 servers and Q1 PCs areGartner forecasts.
Source. Gartner.
Q4
U.S. Personal Computer and Server Sales
45
50
55
60
65
70
75
45
50
55
60
65
70
75Index
2001 2002 2003 2004 Note. The diffusion index equals the percentage of respon-dents planning to increase future spending plus one-half thepercentage of respondents planning to leave future spendingunchanged. Source. CIO Magazine.
Data networking equipment
Computer hardware
Dec.
CIO Magazine Future SpendingDiffusion Indexes

II-9
Indicators of Manufacturing Activity
1999 2000 2001 2002 2003 2004 200525
30
35
40
45
50
55
60
65
70
75
25
30
35
40
45
50
55
60
65
70
75Index
Dec.
3-month change
Note. The diffusion index equals the percentage ofseries that increased over 3 months plus one-half the percentage that were unchanged.
Industrial Production Diffusion Index
1999 2000 2001 2002 2003 2004 200510
11
12
13
14
15
10
11
12
13
14
15Millions of units
Annual rate
+Jan.
Note. January value is based on Ward’s latest productionschedules.
Motor Vehicle Assemblies
1999 2000 2001 2002 2003 2004 2005
50
70
90
110
130
1501997=100
Dec.
Civilian aircraft
Military aircraft
Industrial Production: Military andCivilian Aircraft
1999 2000 2001 2002 2003 2004 2005
30
35
40
45
50
55
60
65
70
75
80Diffusion index
FRB Philadelphia survey
ISM
Note. The diffusion index equals the percentage of respondents reporting greater levels of new orders plus one-half the percentage of respondents reporting that new orders were unchanged.
Dec.
Jan.
New Orders: ISM and FRB Philadelphia Surveys
1970 1972 1974 1976 1978 1980 1982 1984 1986 1988 1990 1992 1994 1996 1998 2000 2002 200430
40
50
60
70
80
90 Index
-20
-10
0
10
20
30
40Percent change
Investment (right scale)
ISM capital spending plans (left scale)
Note. Manufacturing investment data are from the Annual Survey of Manufacturers; figures for 2002 and 2003 are staff estimates.The ISM series is a diffusion index that equals the percentage of respondents reporting plans to increase investment plus one-half the percentage reporting no plans to change investment.
Manufacturing Investment

II-10
equipment, which continued to climb briskly, was up more than 12 percent in 2004. In contrast, commercial aircraft production was up only slightly from its year-ago level. Excluding high-tech, transportation, and energy, production of business equipment rose noticeably less in the fourth quarter than it did in the third, as the production of industrial and other equipment flattened after sharp increases earlier in the year. Production of both construction and business supplies as well as of materials also decelerated somewhat in the fourth quarter. In contrast, production of consumer goods accelerated a bit—though to a still-moderate rate—with most of the greater strength in the production of durables. Most of the forward-looking indicators of production, as well as reports from the staff’s industry contacts, suggest that activity in the industrial sector will expand at a moderate pace in coming months. For example, the ISM diffusion index of new orders moved up in December. The various regional diffusion indexes of new orders, some of which now extend through January, moved down but were still at levels suggestive of further gains in production. Finally, the limited weekly data we have in hand suggest that manufacturing IP will increase moderately in January. In the ISM’s Semiannual Economic forecast that was released in December, the number of manufacturing purchasing managers indicating that their companies plan to increase capital expenditures in 2005 exceeded the number indicating a planned decrease. If historical norms hold true, this diffusion index—coupled with the still-low manufacturing operating rate of 77.8 percent in December—would be consistent with an increase in nominal capital spending by manufacturers in 2005 of about 5½ percent, a shade higher than the forecast for 2004. As a result, we now estimate that manufacturing capacity in 2005 will increase around 1½ percent, a rate slightly faster than the 1¼ percent pace seen in 2004. Motor Vehicles Sales of light vehicles surged 2 million units in December to an annual rate of 18.3 million units, the highest monthly sales rate since October 2001. For the fourth quarter as a whole, light-vehicle sales were up about 100,000 units. The December jump in sales occurred even though the average value of incentives declined for a fourth consecutive month; indeed, from September through December, the average value fell more than $450. According to industry reports, sales were boosted by a pickup in advertising and other inducements that do not show up in our incentive series. Also,

II-11
Sales of Light Vehicles(Millions of units at an annual rate; FRB seasonals)
2004 2004
Category 2003 Q2 Q3 Q4 Oct. Nov. Dec.
Total 16.6 16.5 17.1 17.2 16.9 16.3 18.3
Autos 7.6 7.5 7.3 7.7 7.5 7.3 8.3 Light trucks 9.0 9.1 9.7 9.5 9.4 9.0 10.0
North American1 13.3 13.1 13.8 13.6 13.1 12.9 14.6 Autos 5.5 5.3 5.3 5.4 5.1 5.1 5.9 Light trucks 7.8 7.9 8.5 8.2 8.1 7.8 8.7
Foreign-produced 3.3 3.4 3.3 3.6 3.8 3.5 3.7 Autos 2.1 2.2 2.0 2.3 2.5 2.2 2.3 Light trucks 1.2 1.2 1.2 1.3 1.3 1.2 1.4
Memo:Medium and heavy trucks .33 .40 .44 .48 .45 .46 .52
Note. Components may not sum to totals because of rounding. Data on sales of trucks and imported autos for the mostrecent month are preliminary and subject to revision. 1. Excludes some vehicles produced in Canada that are classified as imports by the industry.
Average Value of Light Vehicle Incentives(Current dollars per vehicle; n.s.a.)
2004 model year 2005 model year
Incentives, Incentives Sales Incentives SalesPeriod all models share1 share1
2004: Sept. 2356 2801 74 1126 25 Oct. 2208 2890 55 1323 45 Nov. 1936 2789 32 1508 67 Dec. 1905 2660 23 1680 77
2005: Jan.2 1889 2355 17 1794 83
Note. Incentives include cash rebates and average values of interest subvention.1. Percent of total sales. Shares may not add to 100 percent because of other model-yearvehicles that are still being sold.2. Based on data through January 16.Source. J.D. Power and Associates.
2000 2001 2002 2003 2004 2005
125
130
135
140
145
150
155
160
165Index
Jan.
Michigan Survey Index of Car-Buying Attitudes
2002 2003 200415.0
15.5
16.0
16.5
17.0
17.5
18.0
18.5
19.0
Dec.
Millions of units, annual rate
Sales of Light Vehicles
Note. FRB seasonals. Adjusted for shifts in reportingperiods.

II-12
Production of Domestic Autos and Trucks(Millions of units at an annual rate except as noted; FRB seasonals)
2004 2005 2004
Item H1 Q3 Q4 Q11 Oct. Nov. Dec.
U.S. production 12.1 11.8 12.0 12.4 12.1 11.9 12.1 Autos 4.3 4.3 4.1 4.6 4.1 4.1 4.3 Trucks 7.8 7.6 7.9 7.9 8.0 7.8 7.7
Days’ supply2 77 72 73 n.a. 76 78 67 Autos 62 62 58 n.a. 66 64 53 Trucks 88 79 82 n.a. 83 87 77
Inventories3 3.33 3.26 3.21 n.a. 3.27 3.26 3.21 Autos 1.09 1.08 1.02 n.a. 1.09 1.06 1.02 Trucks 2.24 2.18 2.19 n.a. 2.18 2.20 2.19
Note. Components may not sum to totals because of rounding. 1. Production rates for the first quarter reflect the latest schedules from Ward’s Communications. 2. Quarterly and semiannual values are calculated with end-of-period stocks and average reported sales; excludes mediumand heavy trucks. 3. End-of-period stocks; excludes medium and heavy trucks. n.a. Not available.
much of the decline in the average value of incentives appears to reflect a shift in sales from more heavily discounted 2004 model-year vehicles to new 2005 models, rather than reductions in effective prices on individual vehicles.3 Over the first half of January, the overall average value of incentives per vehicle has changed little: Incentives on 2005 models have increased, but with lower inventories of 2004 models, incentives have been cut back for these vehicles. 4 The Michigan SRC index of car-buying attitudes dipped in early January, in part a result of less-favorable views on interest rates. In December, total motor vehicle production was 12.1 million units (annual rate), up from a rate of 11.9 million units in November. Despite the surge in sales in December and the modest increase in production last month, inventories held by domestic producers remained high through year-end, especially for light trucks. Days’ supply of total light vehicles last quarter was about unchanged from the third-quarter level and stood at about 73 days. Nevertheless, manufacturers’ assembly plans for January call for a further step-up in total motor vehicle production to a pace of 12.5 million units.
3Seasonal adjustment is able to mitigate only a small part of this mix shift because of irregularities in
the series’ seasonal pattern. 4 Incentives on 2004 models still remained above those on 2005 models over the first half of January.

II-13
Retail and Food Services Sales(Percent change from preceding period; seasonally adjusted current dollars)
2004
Category H1 Q3 Q4 Oct. Nov. Dec.
Total sales 4.2 1.4 2.5 1.0 .1 1.2 Previous estimate 4.2 1.4 ... .8 .1 ...
Retail control1 4.2 1.4 2.4 1.4 .4 .3 Previous estimate 4.2 1.4 ... 1.3 .4 ...
GAF2 2.9 1.0 1.7 1.1 .0 .5 Gasoline stations 14.5 2.2 6.1 5.5 1.2 -2.0 Food services 3.9 1.5 2.0 1.3 .1 .5 Other retailers3 3.2 1.5 1.9 .5 .6 .4
1. Total retail trade and food services less sales at building material and supply stores and automobileand other motor vehicle dealers. 2. Furniture and home furnishing stores; electronics and home appliance stores; clothing andaccessories stores; sporting goods, hobby, book, and music stores; and general merchandise stores. 3. Health and personal care stores, food and beverage stores, electronic shopping and mail-orderhouses, and miscellaneous other retailers. ... Not applicable.
2610
2665
2720
2775
2830
2885
2940
2610
2665
2720
2775
2830
2885
2940Billions of chained (2000) dollars
2003 2004
Dec.Quarterly averageStaff estimate
Note. December value is a staff estimate.
Real PCE Goods Excl. Motor Vehicles
4190
4228
4266
4304
4342
4380
4418
4190
4228
4266
4304
4342
4380
4418Billions of chained (2000) dollars
2003 2004
Nov. Quarterly average
Real PCE Services
-2
0
2
4
6
8
10
12
-2
0
2
4
6
8
10
12Percent, annual rate
H1 H2 H1 Q3 Oct. Nov.
2003 2004
Real wage and salary disbursementsOther components of real DPIReal personal consumption
Change in Real Wages and Salaries, Other Real DPI, and Real Personal Consumption

II-14
For the first quarter as a whole, production schedules are at an annual rate of 12.4 million units. Consumer Spending Consumer spending expanded briskly last quarter, supported by rising wealth, solid increases in income, and an upbeat mood among consumers. In the retail control category of goods—which excludes auto dealers and building material and supply stores—nominal spending increased 0.3 percent in December after having risen 0.4 percent in November. Factoring in the relevant measure of prices, which declined in both November and December as gasoline prices dropped, we estimate that real spending in the control category advanced at a rapid clip at the end of the year—enough to bring the quarterly increase in real PCE for goods excluding motor vehicles and parts to an estimated 4¾ percent. Real outlays on consumer services rose 0.3 percent in November, close to the strong gains posted in September and October. Real disposable personal income moved up at an average annual rate of about 2½ percent in the first three quarters of the year and continued that pace of advance in October and November. (Although complete income data for December are not yet available, wages and salaries apparently posted a moderate increase last month.5) Still, the increase in consumer spending outstripped income gains through November, and the personal saving rate slid to ¼ percent, down ¼ percentage point from the third quarter and a full percentage point from a year earlier. Meanwhile, the ratio of household net wealth to income was boosted significantly last year by increasing housing and equity values. According to surveys by both the Michigan SRC and the Conference Board, consumer sentiment remained favorable in January. The levels of both indexes are consistent with continuing solid gains in consumer spending early this year. Housing Markets Starts of single-family homes rebounded in December to an annual rate of 1.68 million units, an increase that more than reversed a sharp decline in November. For the fourth
5 The BEA’s advance estimate of the increase in real disposable income in December, which will be
published next week, is likely to be boosted 3.3 percentage points (on a monthly, not annual, basis) by Microsoft’s dividend payout. However, the accompanying decline in the company’s stock price seems to have had a largely offsetting effect on household financial resources. Thus, the net effect on personal consumption should be small.

II-15
Household Indicators
1994 1995 1996 1997 1998 1999 2000 2001 2002 2003 2004 20053000
5000
7000
9000
11000
13000
15000Index
4.0
4.5
5.0
5.5
6.0
6.5
7.0Ratio
Q3
Dec.
Wilshire 5000 (left scale)
Ratio of household net worth to DPI(right scale)
Household Net Worth and Wilshire 5000
1994 1995 1996 1997 1998 1999 2000 2001 2002 2003 2004 2005-1
0
1
2
3
4
5
6
7
-1
0
1
2
3
4
5
6
7Percent
Nov.
Personal Saving Rate
1994 1995 1996 1997 1998 1999 2000 2001 2002 2003 2004 200540
60
80
100
120
140
1601985 = 100
60
70
80
90
100
110
1201966 = 100
Jan. (p) Jan.
Michigan SRC(right scale)
Conference Board (left scale)
p Preliminary.
Consumer Confidence

II-16
quarter as a whole, single-family starts averaged 1.61 million units, about the same as the average during the first three quarters of the year. Moreover, because the backlog of permits for single-family homes remained high in December, starts likely have remained at a high level in January.6 Multifamily starts in December came in at an annual rate of 326,000 units, about the same as in November. The average reading in those two months was about 7 percent lower than the average during the first ten months of 2004. However, the rise in the backlog of permits for multifamily homes in both November and December points to a rebound in starts in January. The most recent data on home sales weakened some. Sales of existing homes slipped 3¼ percent in December to an annual rate of 6.69 million units; still, this sales pace was slightly more than the average pace during the January-November period. New home sales fell 12 percent in November (the most recent observation) to an annual rate of 1.13 million units, about 6 percent lower than the average pace during the first ten months of 2004. However, key indicators of demand have remained favorable. The thirty-year fixed-rate mortgage rate has changed little, on balance, since August, averaging about 5¾ percent. Similarly, the one-year adjustable mortgage rate has changed little since last May, averaging about 4.1 percent over that period. The four-week moving average of the Mortgage Bankers Association index of mortgage applications for home purchase has declined during the past few weeks, and the most recent reading is near the low end of the range seen during the past year. The Michigan Survey’s index of homebuying sentiment in December and early January was somewhat higher than the levels seen last fall. Home prices have continued to rise rapidly. The average price of existing homes was up 8.2 percent in December from a year earlier. The twelve-month change in the average price of new homes has fluctuated widely of late, but the average for October and November (the most recent observations) was about 8 percent higher than in the same period in the previous year.7 The repeat-transactions price index for existing homes, which measures the value of the same units over time, rose 13 percent in the
6 By definition, the change in the backlog equals permits minus starts minus permit cancellations. The
level of permits—after adjusting for activity in areas where permits are not required—was lower than the level of starts last month; in itself, this figure pulled down the permit backlog. However, permit cancellations in December were negative, which boosted the backlog. Negative cancellations may result from errors in the data.
7 The twelve-month change in the average price of new homes was 16½ percent in October and close to zero in November.

II-17
Private Housing Activity(Millions of units; seasonally adjusted annual rate except where noted)
2004
Sector 2004 Q2 Q3 Q4 Oct. Nov. Dec.
All unitsStarts 1.95 1.92 1.97 1.96 2.07 1.81 2.00 Permits 2.02 2.02 2.01 2.02 2.02 2.03 2.02
Single-family unitsStarts 1.61 1.60 1.63 1.61 1.66 1.48 1.68 Permits 1.57 1.57 1.57 1.56 1.56 1.55 1.56 Adjusted permits1 1.58 1.60 1.60 1.59 1.59 1.57 1.60 Permit backlog2 .148 .136 .142 .148 .136 .146 .148New home sales n.a. 1.21 1.16 n.a. 1.28 1.13 n.a.Existing home sales 6.68 6.79 6.68 6.79 6.76 6.92 6.69
Multifamily unitsStarts .35 .32 .34 .35 .40 .32 .33 Permits .45 .45 .44 .47 .46 .48 .46 Permit backlog2 .075 .058 .067 .075 .063 .072 .075
Mobile homesShipments n.a. .127 .128 n.a. .141 .139 n.a.
1. Adjusted permits equal permit issuance plus total starts outside of permit-issuing areas. 2. Number outstanding at end of period. Seasonally adjusted by Board staff. Excludes permits that have
been canceled, abandoned, expired, or revoked. Not at an annual rate. n.a. Not available.
1988 1989 1990 1991 1992 1993 1994 1995 1996 1997 1998 1999 2000 2001 2002 2003 2004 2005.0
.2
.4
.6
.8
1.0
1.2
1.4
1.6
1.8
2.0
2.2
.0
.2
.4
.6
.8
1.0
1.2
1.4
1.6
1.8
2.0
2.2
Millions of units
Private Housing Starts(Seasonally adjusted annual rate)
Dec.
Dec.
Dec.Total
Single-family
Multifamily

II-18
Indicators of Single-Family Housing
1998 1999 2000 2001 2002 2003 2004 20054500
5000
5500
6000
6500
7000
7500
4500
5000
5500
6000
6500
7000
7500Thousands of units
Dec.
Source. National Association of Realtors.
Existing Home Sales
1998 1999 2000 2001 2002 2003 2004 2005700
900
1100
1300
1500
700
900
1100
1300
1500Thousands of units
Nov.
Source. Census Bureau.
New Home Sales
1998 1999 2000 2001 2002 2003 2004 20053
4
5
6
7
8
9
3
4
5
6
7
8
9Percent
Fixed rate
Adjustable rate
Jan.
Jan.
Note. The January readings are based on datathrough Jan. 19. Source. Freddie Mac.
Mortgage Rates
1998 1999 2000 2001 2002 2003 2004 20050
20
40
60
80
100
120Diffusion index
200
250
300
350
400
450
500
550Index
Jan. 21
Note. MBA index is a 4-week moving average. MichiganSurvey data are not seasonally adjusted.
Jan. (p)
p Preliminary. Source. Mortgage Bankers Association and Michigan Survey.
MBA purchase index (right scale)Michigan homebuying attitudes (left scale)
Homebuying Indicators
1998 1999 2000 2001 2002 2003 2004 20050
2
4
6
8
10
12
14
0
2
4
6
8
10
12
14Percent change from year earlier
Q3
Dec.
Repeat transactionsAverage price of homes sold
Source. For repeat transactions, OFHEO; foraverage price, National Association of Realtors.
Prices of Existing Homes
1998 1999 2000 2001 2002 2003 2004 2005-5
0
5
10
15
20
25
-5
0
5
10
15
20
25Percent change from year earlier
Q3
Nov.
Constant qualityAverage price of homes sold
Source. Census Bureau.
Prices of New Homes

II-19
Equipment and Software Investment Fundamentals
1990 1991 1992 1993 1994 1995 1996 1997 1998 1999 2000 2001 2002 2003 2004-4
-2
0
2
4
6
8
-4
-2
0
2
4
6
8Percent change from year earlier
Q3
Real Business Output
1990 1991 1992 1993 1994 1995 1996 1997 1998 1999 2000 2001 2002 2003 2004-10
0
10
20
30
-10
0
10
20
30Percent change from year earlier
Q3
Real Corporate Cash Flow
1990 1992 1994 1996 1998 2000 2002 200450
86
122
158
194
250
50
86
122
158
194
250High-Tech 2000 = 100, ratio scale
User Cost of Capital(Includes the effects of the partial-expensing tax incentive)
Q3
1990 1992 1994 1996 1998 2000 2002 200480
84
88
92
96
100
104
108
80
84
88
92
96
100
104
108Non-High-Tech 2000 = 100, ratio scale
Q3

II-20
third quarter from a year earlier.8 The constant-quality price index for new homes—which controls for changes in the geographic composition of sales, home size, and a few other readily measurable attributes—was up 6¼ percent in the third quarter from a year earlier. Equipment and Software Business outlays for equipment and software look to have increased at a solid pace last quarter, though not as briskly as the 18 percent (annual rate) gain recorded in the third quarter. It appears that stronger growth in business purchases of high-tech gear in the fourth quarter was more than offset by a significant deceleration in spending on transportation and other equipment. Nevertheless, underlying fundamentals remain consistent with robust growth in investment demand: Business output continues to expand, firms remain flush with cash, and although the partial-expensing tax provision has now expired, the cost of capital remains favorable because of low interest rates. Furthermore, anecdotal reports, business surveys, and our business contacts offer an optimistic reading on near-term capital spending plans. In the high-tech sector, nominal shipments of computing equipment dropped 4 percent in November (not at an annual rate), but this decline reversed only a fraction of the sizable gain posted in the previous month, and orders for computers moved up in November. Coupled with ongoing steep declines in computer prices, real outlays for computing equipment are poised for an appreciable increase in the fourth quarter. Shipments of communications equipment, which have been inching up since last spring, increased further in November, and the backlog of orders fell. Coupled with higher net imports of communications gear through November and falling prices, the latest data suggest that real spending on communications equipment also increased modestly in the fourth quarter. Business spending on light motor vehicles likely fell in the fourth quarter despite an estimated uptick in December.9 In contrast, sales of medium and heavy trucks rose in the fourth quarter, and purchases in December were up more than 14 percent. Orders
8 A version of the index that excludes the appraised values of refinanced properties—which are not
sales prices—was up 10 percent in the third quarter from a year earlier and shows a smoother acceleration in recent years.
9 Staff estimates suggest that light-vehicle fleet sales to businesses jumped ½ million units at an annual rate in December. The BEA splits light-vehicle sales between businesses and consumers on the basis of data on vehicle registrations, which it obtains from R.L. Polk with a lag. Thus, at this juncture, it is impossible to determine for certain the strength of business light-vehicle demand in December.

II-21
1999 2000 2001 2002 2003 2004 20055
6
7
8
9
10
11
12
5
6
7
8
9
10
11
12Billions of dollars, ratio scale
Nov.
ShipmentsOrders
Computers and Peripherals
1999 2000 2001 2002 2003 2004 20053
6
9
12
15
1821
3
6
9
12
15
1821
Billions of dollars, ratio scale
Nov.
ShipmentsOrders
Communications Equipment
1999 2000 2001 2002 2003 2004 2005200
290
380
470
560
650
740
890
200
290
380
470
560
650
740
890Thousands of units, ratio scale
Dec.
Dec.
Note. Annual rate, FRB seasonals.Source. For class 4-8 trucks, Ward’s Communications; for class 5-8 trucks, ACT Research.
Sales of class 4-8 trucksNet new orders of class 5-8 trucks
Medium and Heavy Trucks
1999 2000 2001 2002 2003 2004 200536
39
42
45
48
51
36
39
42
45
48
51Billions of dollars, ratio scale
Nov.
ShipmentsOrders
Other Equipment
Orders and Shipments of Nondefense Capital Goods(Percent change; seasonally adjusted current dollars)
2004
Indicators Q2 Q3 Sept. Oct. Nov.
Annual rate Monthly rate
Shipments 9.0 14.1 -.3 2.2 -2.5 Excluding aircraft 9.2 15.0 -.3 2.4 -1.8 Computers and peripherals 8.9 10.9 2.8 8.5 -4.0 Communications equipment 8.7 11.8 -8.4 -.4 2.3 All other categories 9.4 16.2 .3 1.6 -1.9
Orders 15.1 25.5 3.2 -3.2 7.1 Excluding aircraft 7.8 14.1 5.4 -4.0 .8 Computers and peripherals 36.9 5.6 17.4 -9.8 4.0 Communications equipment 13.5 -10.9 -8.2 .8 -1.9 All other categories 2.4 19.7 5.2 -3.4 .5
Memo: Shipments of complete aircraft1 25.7 27.8 27.2 30.3 23.8
1. From Census Bureau, Current Industrial Reports; billions of dollars, annual rate.

II-22
Nonresidential Construction and Indicators
Real Construction(Seasonally adjusted, annual rate; nominal CPIP deflated by
BEA prices through Q3 and staff projection thereafter)
1997 1998 1999 2000 2001 2002 2003 2004 2005170
190
210
230
250
270
290
170
190
210
230
250
270
290Billions of chained (2000) dollars
Nov.
Total Structures
1997 1998 1999 2000 2001 2002 2003 2004 200520
30
40
50
60
70
20
30
40
50
60
70Billions of chained (2000) dollars
Office
Nov.
Commercial
Nov.
Office and Commercial
1997 1998 1999 2000 2001 2002 2003 2004 20050
10
20
30
40
50
60
0
10
20
30
40
50
60Billions of chained (2000) dollars
Nov.
Manufacturing
Nov.
Power & communication
Manufacturing and Power &Communication
1997 1998 1999 2000 2001 2002 2003 2004 200555
60
65
70
75
55
60
65
70
75Billions of chained (2000) dollars
Nov.
Note. Includes religious, educational, lodging, amusementand recreation, transportation, and health-care facilities.
Other
1997 1998 1999 2000 2001 2002 2003 2004 20050
3
6
9
12
15
18
0
3
6
9
12
15
18Percent
Q3Office
Q3Retail
Q3
Industrial
Indicators
Source. National Council of Real Estate InvestmentFiduciaries.
Vacancy Rates
1997 1998 1999 2000 2001 2002 2003 2004 20050
200
400
600
800
1000
1200
0
200
400
600
800
1000
1200Number
Natural gas
Petroleum
Jan.
Jan.
Note. Jan. values are averages through Jan. 21.Source. DOE/Baker Hughes.
Drilling Rigs in Operation

II-23
for heavy (class 8) trucks have been particularly strong. Backlogs for these vehicles climbed steadily throughout 2004 and in December were at their highest level since late 1999. Business purchases of aircraft likely increased moderately in the fourth quarter. Smoothing through the lumpiness in the monthly data, shipments of aircraft by domestic producers in October and November were about unchanged from the previous quarter, but imports of jets strengthened. Outside of high-tech and transportation, nominal shipments of nondefense capital goods fell in November, retracing the gains posted in September and October. Orders in this category ticked up after having seesawed in the preceding two months. As noted in previous Greenbooks, the partial-expensing tax provision provided an especially strong incentive to purchase the types of equipment included in this category because such equipment is treated as depreciating slowly. We had originally expected investment in this sector to surge most dramatically just before year-end, but the available data suggest that the surge may have occurred somewhat earlier. However, distinguishing the effect of the tax provision from the influence of other factors and the inherent volatility in the data is quite difficult. Nonresidential Construction Real outlays for nonresidential structures have edged down, on balance, in recent months. Spending on commercial structures posted robust gains through August of last year but has slipped since then. Real construction of office buildings has been declining since last spring, and the vacancy rate, although down some recently, remains high. Real construction of manufacturing structures has been essentially flat—at a very low level—since the latter part of 2002, and the recent data show no evidence of an upturn. Investment in drilling and mining structures trended up through the first three quarters of last year in response to higher prices for natural gas, and the further rise in the number of rigs drilling for natural gas through year-end points to another increase in this sector’s investment in the fourth quarter. Business Inventories The book value of manufacturing and trade inventories excluding motor vehicles surged in October and November. Given the observed changes in prices, these data imply a sizable contribution from real non-auto inventory investment to the fourth-quarter increase in real GDP. Inventory accumulation was widespread among manufacturers, wholesalers, and retailers, as well as across stages of production. Inventory-sales ratios have been about flat since the middle of last year after having fallen considerably over

II-24
1992 1993 1994 1995 1996 1997 1998 1999 2000 2001 2002 2003 2004 20051.000
1.175
1.350
1.525
1.700
1.000
1.175
1.350
1.525
1.700Ratio
Nov.
Wholesale trade ex. motor vehicles and parts
Manufacturing
Retail trade ex. motor vehicles and parts
Book-Value Inventories Relative to Shipments and Sales
1992 1993 1994 1995 1996 1997 1998 1999 2000 2001 2002 2003 2004 200546
48
50
52
54
56
58
60
62
64
46
48
50
52
54
56
58
60
62
64Days’ supply
Dec.
Total
Total ex. motor vehicles and parts
Inventory-Consumption Ratios, Flow-of-Goods System
Changes in Manufacturing and Trade Inventories (Billions of dollars; seasonally adjusted book value; annual rate)
2004
Sector Q1 Q2 Q3 Sept. Oct. Nov.
Manufacturing and trade 82.0 120.4 84.1 -.3 66.3 147.3 Ex. wholesale and retail motor vehicles and parts 55.6 94.1 75.9 35.3 115.1 114.1
Manufacturing 24.0 38.9 32.3 4.8 48.1 39.5 Ex. aircraft 25.6 39.0 33.9 15.1 47.4 31.6
Wholesale trade 23.5 33.7 39.1 21.9 43.0 44.0 Motor vehicles and parts 3.2 1.3 3.3 -3.2 -5.2 1.6 Ex. motor vehicles and parts 20.3 32.4 35.7 25.2 48.2 42.4
Retail trade 34.5 47.7 12.8 -27.1 -24.8 63.9 Motor vehicles and parts 23.1 25.0 4.9 -32.4 -43.6 31.7 Ex. motor vehicles and parts 11.4 22.7 7.9 5.3 18.8 32.2

II-25
the previous three years. But even with the recent spurt of stockbuilding, the fraction of purchasing managers in the ISM survey who viewed customers’ inventories as too high in December was only a bit above the third-quarter reading and well below the fraction who viewed those inventories as too low. Data from the staff’s flow-of-goods inventory system indicate that inventories fell back in December after having moved up in the previous two months. Inventories are estimated to have remained elevated relative to consumption for a few products, including motor vehicles, semiconductors, paper, leather and allied products, and chemicals excluding pharmaceuticals. Nonetheless, the aggregate days’ supply of inventories continued to edge down in December. Federal Government Sector Recent data point to some improvement in the budget outlook. According to the Monthly Treasury Statement, the federal government recorded a $3 billion deficit in December, down considerably from the $18 billion deficit posted in December 2003. The budget deficit over the twelve months ending in December was $401 billion, similar to the level recorded over the comparable period a year earlier but below the levels recorded last spring. Although outlays have been increasing strongly, receipts have been rising even more rapidly. Receipts in December jumped 15½ percent above the level posted a year earlier: Corporate income tax collections surged, and individual income and payroll taxes rose despite the damping effects of last year=s tax cuts. Outlays, adjusted for financial transactions and payment timing shifts, rose 7½ percent in December over year-earlier levels, similar to the pace seen over the past two years. Defense spending was 10 percent higher in December than a year ago, while growth in Medicare and Medicaid last year was subdued. Other spending has been relatively strong over the past few months, with large increases posted in education grants, disaster relief, and international affairs. CBO’s just-released Economic and Budget Outlook report shows a baseline deficit for fiscal 2005 of $368 billion, falling to $295 billion in fiscal 2006. Because of scoring conventions, these baseline figures exclude the budget effects of future appropriations for the war in Iraq and future extensions of expiring tax provisions. CBO estimates that the budget deficit including these programs would be nearly $400 billion in both fiscal

II-26
Federal Government Outlays and Receipts(Unified basis; billions of dollars except as noted)
12 months ending December in December
Percent Percent
Function or source 2003 2004 change 2003 2004 change
Outlays 204.4 219.2 7.2 2194.6 2327.0 6.0 Financial transactions1 .1 .4 ... -1.0 -1.7 ... Payment timing2 12.1 12.4 ... .4 .2 ... Adjusted outlays 192.2 206.3 7.4 2195.1 2328.4 6.1
Receipts 186.7 215.7 15.5 1795.5 1926.2 7.3 Payment timing .0 .0 ... .0 .0 ... Adjusted receipts 186.7 215.7 15.5 1795.5 1926.2 7.3
Surplus or deficit (-) -17.6 -3.4 ... -399.1 -400.7 ...
Selected componentsof adjusted outlaysand receiptsAdjusted outlays 192.2 206.3 7.4 2195.1 2328.4 6.1 Net interest 13.6 13.6 .4 153.5 163.1 6.3 Non-interest 178.6 192.7 7.9 2041.7 2165.3 6.1 National defense 38.3 42.1 9.8 418.0 464.3 11.1 Social Security 40.4 42.5 5.0 479.1 501.7 4.7 Medicare 23.6 24.0 1.6 251.7 275.6 9.5 Medicaid 15.4 15.7 1.9 164.6 178.0 8.2 Income security 26.7 27.1 1.4 335.7 334.0 -.5 Agriculture 3.3 4.1 25.5 25.5 20.4 -20.2 Other 30.8 37.3 21.1 367.0 391.3 6.6
Adjusted receipts 186.7 215.7 15.5 1795.5 1926.2 7.3 Individual income and payroll taxes 134.0 152.0 13.4 1464.7 1521.9 3.9 Withheld + FICA 129.4 145.4 12.4 1368.6 1419.8 3.7 Nonwithheld + SECA 6.3 8.1 28.2 289.2 289.0 -.1 Less: Refunds 1.7 1.6 -9.5 193.1 186.9 -3.2 Corporate 39.3 51.9 32.2 142.0 208.6 47.0 Gross 44.1 54.1 22.9 201.4 243.5 20.9 Less: Refunds 4.8 2.2 -53.6 59.4 34.9 -41.3 Other 13.4 11.8 -11.7 188.8 195.7 3.6
Adjusted surplus or deficit (-) -5.4 9.4 ... -399.6 -402.2 ...
Note. Components may not sum to totals because of rounding. 1. Financial transactions consist of deposit insurance, spectrum auctions, and sales of major assets. 2. A shift in payment timing occurs when the first of the month falls on a weekend or holiday, orwhen the first three days of a month are nonworking days. Outlays for defense, Social Security,Medicare, income security, and "other" have been adjusted to account for these shifts. ... Not applicable.

II-27
CBO Budget Projections and Economic Assumptions
2005 2006 2007 2008 2009 2010 2011 2012 2013 2014 2015
Baselinebudget projections1 Billions of dollars(fiscal years)
Total surplus -368 -295 -261 -235 -207 -189 -80 71 85 115 141 On-budget -541 -484 -471 -464 -454 -451 -357 -217 -212 -190 -169 Off-budget 173 190 210 229 246 262 277 289 298 305 310
Adjusted budget(fiscal years)
Adjusted surplus -398 -384 -390 -381 -362 -346 -397 -376 -404 -421 -443Total adjustments -30 -89 -129 -146 -155 -157 -317 -447 -489 -536 -584 Iraq -30 -70 -75 -65 -45 -30 -25 -26 -27 -27 -28 Expiring taxes 0 -16 -45 -65 -86 -95 -248 -358 -378 -401 -422 Debt service 0 -3 -9 -16 -24 -32 -44 -63 -84 -108 -134
Economic assumptions(calendar years) Percent change, year over year
Nominal GDP 5.7 5.3 5.4 5.2 5.0 4.8 4.6 4.5 4.5 4.4 4.4Real GDP 3.8 3.7 3.7 3.4 3.1 2.9 2.8 2.7 2.7 2.6 2.5CPI-U 2.4 1.9 2.1 2.2 2.2 2.2 2.2 2.2 2.2 2.2 2.2
Percent, annual average
Unemployment rate 5.2 5.2 5.2 5.2 5.2 5.2 5.2 5.2 5.2 5.2 5.2
Treasury yields Three-month 2.8 4.0 4.6 4.6 4.6 4.6 4.6 4.6 4.6 4.6 4.6 Ten-year 4.8 5.4 5.5 5.5 5.5 5.5 5.5 5.5 5.5 5.5 5.5
1. The on-budget surplus excludes the Social Security surplus and the Postal Service (which are off-budget).The baseline assumes that budget authority for discretionary programs grows with inflation after fiscal 2005.In addition, it assumes that no new mandatory spending or tax legislation is enacted. Source. Congressional Budget Office, The Budget and Economic Outlook (January 2005).

II-28
State and Local Employment and Construction
2000 2001 2002 2003 2004-15
0
15
30
45
60
-15
0
15
30
45
60Thousands
Quarterly average of monthly changes
Employment
1995 1996 1997 1998 1999 2000 2001 2002 2003 200490
110
130
150
170
190
210
230
90
110
130
150
170
190
210
230Billions of dollars
Nov.Monthly
Construction Put in Place

II-29
2005 and 2006, essentially the same as the $412 billion deficit recorded in fiscal 2004. Both the baseline and adjusted baseline deficits improve over the 2007-2015 period as outlays are projected to decline as a share of GDP over time. State and Local Governments Spending by state and local governments appears to be rising. Employment in this sector has now increased for six consecutive months, and the quarterly gains during the second half of 2004 were the largest since the end of 2001. While much of the recent strength has been at educational establishments, steady increases were reported outside of education as well. Following a large drop in August, state and local outlays for construction rose steadily through November to bring the level of spending back near the elevated range seen earlier last year. Most legislatures reconvene in January, and governors are making their state-of-the-state speeches and introducing budget proposals for fiscal 2006 (which begins July 1 for all but four states). Revenue growth has strengthened over the past year in most states. However, even with tax bases expected to remain strong, some states will still have to deal with lingering fiscal difficulties, such as depleted reserve funds, the expiration of temporary tax hikes, and rising Medicaid costs. In addition, with anti-tax sentiment still strong, legislatures are unlikely to enact significant tax increase during the upcoming legislative cycle. A number of key states still have severely strained budgetary situations. One example is California, where the governor continues to promise that taxes will not be raised; the state is likely once again to borrow in financial markets and to restrain some spending programs. Meanwhile, the situation in New York is not as grim as once expected: A $1 billion surplus is now being forecast for fiscal 2005, which ends March 31 for that state, and receipts in fiscal 2006 are expected to be higher than previously thought. Prices The overall consumer price index declined 0.1 percent in December—following a 0.2 percent increase in November—as consumer prices for oil products fell and prices for food held steady. Over the twelve months ending in December, the CPI increased 3.3 percent, up nearly 1½ percentage points from the year-earlier period. About half of the past year’s CPI acceleration was the direct result of a sharp increase in consumer energy prices, but core consumer price inflation also picked up 1 percentage point. Following October’s sharp increase, the CPI for energy edged up only a bit in

II-30
Measures of Inflation(Percent)
12-month change 3-month change 1-month change
Annual rate Monthly rate
Dec. Dec. Sept. Dec. Nov. Dec.Measures 2003 2004 2004 2004 2004 2004
CPITotal 1.9 3.3 .6 3.0 .2 -.1 Food 3.6 2.7 1.3 3.0 .2 .0 Energy 6.9 16.6 -9.8 10.4 .2 -1.8 Ex. food and energy 1.1 2.2 1.8 2.0 .2 .2 Ex. tobacco 1.1 2.3 1.8 2.0 .2 .1 Core commodities -2.5 .6 -.9 1.4 .1 -.1 Core services 2.6 2.8 3.0 2.1 .2 .2 Chained CPI (n.s.a.) 1 1.5 2.9 ... ... ... ... Ex. food and energy 1 .7 1.9 ... ... ... ...
PCE prices 2
Total 1.6 2.3 .5 2.0 .1 .0 Food 2.9 2.6 1.6 2.7 .2 .0 Energy 6.7 17.3 -9.2 10.8 .2 -2.0 Ex. food and energy 1.1 1.4 .9 1.3 .1 .1 Ex. tobacco 1.1 1.4 .9 1.3 .1 .1 Core commodities -2.3 .1 -2.1 .6 .0 -.1 Core services 2.5 2.0 2.2 1.6 .2 .2 Core market-based 1.0 n.a. .7 n.a. .2 n.a. Core non-market-based 1.3 n.a. 2.0 n.a. .0 n.a.
PPITotal finished goods 4.0 4.1 .5 6.3 .5 -.7 Food 7.7 2.8 -8.0 8.7 .4 .1 Energy 11.4 13.4 7.1 18.2 1.8 -4.0 Ex. food and energy 1.0 2.2 1.6 2.6 .2 .1 Ex. tobacco 1.1 2.3 1.6 2.7 .2 .1 Core consumer goods 1.1 2.0 1.3 2.3 .2 .1 Capital equipment .8 2.4 2.0 3.1 .2 .1 Intermediate materials 3.9 9.1 7.5 5.3 .8 -.3 Ex. food and energy 2.1 8.3 9.6 4.6 .4 .5 Crude materials 19.5 18.0 -20.4 46.7 8.7 -2.9 Ex. food and energy 21.6 20.1 51.3 27.5 2.5 -1.7
1. Higher-frequency figures are not applicable for data that are not seasonally adjusted. 2. PCE prices in December are staff estimates. ... Not applicable. n.a. Not available.

II-31
November and fell 1.8 percent in December. Consumer prices of motor fuel fell markedly last month, as spot prices for crude oil declined about $5 per barrel in December and plentiful inventories restrained markups of retail gasoline prices over crude oil costs. Retail gasoline prices continued to decline through mid-January in response to December’s drop in crude oil costs. However, with crude oil prices moving back up in January, retail gasoline prices began to rise again around mid-month. The CPI for natural gas moved up somewhat further in December after November’s large increase despite an ample level of inventories. Consumer food prices increased 0.2 percent in November and were unchanged in December. The deceleration in December reflected a decline in the CPI for fresh fruits and vegetables following the earlier massive price increases caused by the hurricane damage to crops in Florida. Over the twelve months ending in December, overall food prices rose 2.7 percent, nearly 1 percentage point less than over the preceding year. Excluding food and energy, the CPI rose 0.2 percent in both November and December. The twelve-month change in core consumer prices was 2.2 percent in December, up from the extraordinarily low 1.1 percent rate posted in December 2003. The increase in core consumer price inflation over the past year was concentrated in goods prices, which moved up 0.6 percent in 2004 after dropping 2½ percent in 2003 and 1½ percent in 2002. Although much of the pickup in core goods inflation occurred as higher costs for imports, energy, and core intermediate materials were passed through to consumer goods prices, some of the pickup appears to reflect transitory factors that are not readily explainable: In particular, prices of new and especially used motor vehicles accelerated last year after their plunge in 2003. In contrast, core services prices rose 2.8 percent in 2004, up just ¼ percentage point from the rate posted in 2003 and noticeably lower than the increases in the three previous years. The core PCE price index has accelerated by much less than the core CPI over the past year. In particular, core PCE prices increased 1½ percent over the twelve months ending in November (the last available observation), an acceleration of only ¼ percentage point from the preceding year. The difference in the acceleration in the core CPI and the core PCE price index stems from several factors. Medical services prices accounted for much of the difference. In November, the twelve-month change in the CPI for medical services was about 1 percentage point higher than the year-earlier increase; in contrast, PCE medical

II-32
Energy Prices and Inventories(Data from Energy Information Administration except as noted)
2003 200460
65
70
75
80
85
90
95
100
105
60
65
70
75
80
85
90
95
100
105Cents per gallon
Retail price less WTI spot price*
Jan. 24
* Average of all grades (DOE) seasonally adjusted, less West Texas intermediate spot price.
Total Gasoline Margin
2003 200435
75
115
155
195
35
75
115
155
195
Cents per gallon
Retail price*
WTI spot price
Jan. 24
Jan. 24
* Average of all grades (DOE) seasonally adjusted.
Gasoline Price Decomposition
190
195
200
205
210
215
220
225
230
235
190
195
200
205
210
215
220
225
230
235Millions of barrels
J F M A M J J A S O N D
Average historical rangeCurrent year
2004 Note. Average historical range calculated by EnergyInformation Administration.
Gasoline Inventories
30
35
40
45
50
55
60
65
30
35
40
45
50
55
60
65Millions of barrels
J F M A M J J A S O N D
Average historical rangeMonthlyWeekly
2004Note. Historical range calculated by FRB staff.
Heating Oil Inventories
500
1000
1500
2000
2500
3000
3500
500
1000
1500
2000
2500
3000
3500Billions of cubic feet
J F M A M J J A S O N D J
Historical range, 1999-2003Present year
2004Note. Historical range calculated by FRB staff.
Natural Gas Inventories
1
2
3
4
5
6
7
8
9
10
11
12
13
1
2
3
4
5
6
7
8
9
10
11
12
13Dollars per million BTU
2001 2002 2003 2004 2005
Jan. 24
Note. Spot price, Henry Hub.
Natural Gas Prices

II-33
Core Consumer Price Inflation(12-month change except where noted)
1999 2000 2001 2002 2003 2004 20050
1
2
3
0
1
2
3Percent
Dec.
chainedCPIPCE
CPI
CPI and PCE excluding Food and Energy
1999 2000 2001 2002 2003 2004 20050
1
2
3
0
1
2
3Percent
Dec.
Core PCE
Market-based components
Note. December value is a staff estimate.
PCE excluding Food and Energy
1999 2000 2001 2002 2003 2004 20050
1
2
3
4
0
1
2
3
4Percent
3-month change, annual rate
Dec.
CPI excluding Food and Energy
1999 2000 2001 2002 2003 2004 2005-3
-2
-1
0
1
2
3
4
5
-3
-2
-1
0
1
2
3
4
5Percent
Dec.
Dec.
Services ex. energy
Commodities ex. food and energy
CPI Services and Commodities

II-34
Broad Measures of Inflation(Percent change, Q3 to Q3)
Measure 2001 2002 2003 2004
Product pricesGDP price index 2.4 1.5 1.8 2.3 Less food and energy 2.1 1.9 1.5 2.1
Nonfarm business chain price index 1.9 1.0 1.1 1.8
Expenditure pricesGross domestic purchases price index 1.9 1.5 1.9 2.6 Less food and energy 1.9 1.8 1.5 2.1
PCE price index 2.0 1.6 1.7 2.2 Less food and energy 2.0 1.9 1.1 1.5
PCE price index, market-based components 1.9 1.2 1.8 2.3 Less food and energy 1.8 1.5 1.1 1.4
CPI 2.7 1.6 2.2 2.7 Less food and energy 2.7 2.2 1.3 1.8
Chained CPI 2.1 1.3 1.9 2.2 Less food and energy 2.1 1.8 1.0 1.4
Median CPI 3.7 3.3 2.0 2.5 Trimmed mean CPI 2.7 2.1 1.8 2.1
Actual CPI inflation 1
Professional forecasters (10-year) 4
Surveys of Inflation Expectations(Percent)
University of Michigan
1 year 2 5 to 10 years 3
Period Mean Median Mean Median
2003:Q1 2.9 3.2 2.8 3.0 2.7 2.5 Q2 2.1 2.6 2.2 3.1 2.7 2.5 Q3 2.2 2.8 2.3 3.1 2.7 2.5 Q4 1.9 3.0 2.6 3.1 2.8 2.5
2004:Q1 1.8 3.1 2.7 3.4 2.9 2.5 Q2 2.9 4.0 3.3 3.3 2.8 2.5 Q3 2.7 3.3 2.9 3.1 2.8 2.5 Q4 3.3 3.4 3.0 3.1 2.8 2.5
2004:July 3.0 3.5 3.0 3.1 2.8 ... Aug. 2.7 3.1 2.8 3.1 2.7 ... Sept. 2.5 3.2 2.8 3.1 2.8 2.5 Oct. 3.2 3.6 3.1 3.2 2.8 ... Nov. 3.5 3.3 2.8 3.1 2.7 ... Dec. 3.3 3.4 3.0 3.1 2.8 2.5 2005:Jan. n.a. 3.5 2.9 3.2 2.8 ...
1. Percent change from the same period in the preceding year. 2. Responses to the question: By about what percent do you expect prices to go up, onaverage, during the next 12 months? 3. Responses to the question: By about what percent per year do you expect prices to go up,on average, during the next 5 to 10 years? 4. Quarterly CPI projections compiled by the Federal Reserve Bank of Philadelphia. ... Not applicable. n.a. Not available.

II-35
services decelerated nearly 1 percentage point over this period. Some of this divergence likely reflects the narrower scope of CPI medical services: PCE medical services include some components (for example, Medicare and Medicaid reimbursements and non-market prices) that are not covered in the CPI.10 In addition, the PCE medical services prices are mostly derived from source data other the CPIs—in particular, the PCE medical services prices depend heavily on the producer price indexes. Another part of the differential acceleration in the core CPI and core PCE price index arises from the inclusion of non-market prices (other than those in medical services) in the PCE price index. In particular, the non-market category for imputed financial service charges declined sharply over the twelve months ending in November after having changed little over the preceding twelve-month period. Excluding all non-market-based components, the core PCE price index moved more closely in line with the core CPI (accelerating ¾ percentage point to a 1.7 percent increase over the twelve months ending in November). According to this month’s preliminary release of the Michigan Survey, median expectations for inflation over the coming year edged down to 2.9 percent in early January. Median expectations for inflation over the next five to ten years—at 2.8 percent—were unchanged and remained within the narrow range reported over the past several years. The PPI for capital equipment edged up 0.1 percent in December, the smallest monthly increase since July. Over the twelve months ending in December, however, prices of capital equipment rose 2½ percent, compared with an increase of only ¾ percent over 2003 and a decline in 2002. The PPI for core intermediate materials rose 0.5 percent in December, following slightly smaller increases in October and November. Although these figures are down from the outsized increases in the first three quarters, core intermediate prices stood 8¼ percent above their year-earlier level in December, compared with a 2 percent rise over the twelve months of 2003. The pickup in these prices reflects rising capacity utilization, higher prices for imported industrial materials, and the continued pass-through of the earlier increases in energy prices.
10 Because of this difference in scope, medical care has a much larger weight in the PCE index than in
the CPI.

II-36
Commodity Price Measures
1986 1988 1990 1992 1994 1996 1998 2000 2002 2004 200660
70
80
90
100
110
120
130
Jan.Metals
Total
Journal of Commerce IndexRatio scale, 1996=100
Dec Jan2004 2005
108
112
116
120Total
Dec Jan2004 2005
116
120
124
128
132
136Metals
1986 1988 1990 1992 1994 1996 1998 2000 2002 2004 2006200
240
280
320
360
Jan.
CRB Spot IndustrialsRatio scale, 1967=100
Dec Jan2004 2005
310
320
330CRB Industrials
1986 1988 1990 1992 1994 1996 1998 2000 2002 2004 2006170
190
210
230
250
270
290
Jan.
CRB FuturesRatio scale, 1967=100
Note. Larger panels show monthly average of weekly data through last available week. Smaller panels show weekly data, Tuesdays. Verticallines on small panels indicate week of last Greenbook. The Journal of Commerce index is based almost entirely on industrial commodities, witha small weight given to energy commodities, and the Commodity Research Board (CRB) spot industrials index consists entirely of industrial commodities,excluding energy. The CRB futures index gives about a 60 percent weight to food commodities and splits the remaining weight roughly equallyamong energy commodities, industrial commodities, and precious metals. Copyright for Journal of Commerce data is held by CIBCR, 1994.
Dec Jan2004 2005
270
280
290
300CRB Futures

II-37
2
Spot Prices of Selected Commodities(Percent change except as noted)
Memo:Current 12/30/03 12/7/04 52-week
price to to change toCommodity (dollars) 2002 1 2003 1 12/7/04 2 1/25/05 1/25/05
MetalsCopper (lb.) 1.628 5.6 47.9 39.8 7.8 41.6 Steel scrap (ton) 202.667 49.2 66.8 34.1 -6.6 12.8 Aluminum, London (lb.) .821 2.8 16.7 16.8 -1.3 12.3
Precious metalsGold (oz.) 424.500 24.3 20.7 8.5 -6.0 4.6 Silver (oz.) 6.710 3.8 24.6 32.2 -15.0 3.2
Forest products 3
Lumber (m. bdft.) 365.000 -8.9 44.5 18.3 6.7 6.1 Plywood (m. sqft.) 397.000 .7 36.7 3.8 -3.2 -11.4
PetroleumCrude oil (barrel) 46.080 66.9 -7.4 26.3 23.2 50.2 Gasoline (gal.) 1.326 69.2 12.5 6.7 30.4 34.2 Fuel oil (gal.) 1.424 63.8 6.3 29.9 19.3 43.6
LivestockSteers (cwt.) 89.680 16.5 4.1 18.0 1.3 6.8 Hogs (cwt.) 52.000 -13.2 18.3 54.9 -5.5 20.9 Broilers (lb.) .748 6.5 10.9 2.1 10.5 -5.1
Farm cropsCorn (bu.) 1.860 18.1 1.7 -20.8 .5 -28.3 Wheat (bu.) 3.948 37.7 -2.1 3.3 -6.0 -5.8 Soybeans (bu.) 5.300 32.2 37.1 -32.9 2.8 -35.6 Cotton (lb.) .436 52.1 42.5 -38.9 4.7 -35.8
Other foodstuffsCoffee (lb.) .988 1.1 23.1 59.7 12.9 42.1
Memo:JOC Industrials 111.500 16.8 22.3 9.8 -1.1 2.6 JOC Metals 121.800 9.7 38.1 17.8 -1.2 14.8 CRB Futures 286.520 24.4 9.1 9.9 1.9 7.3 CRB Spot Industrials 321.160 13.7 24.0 5.2 -1.0 3.5
1. Changes are from the last week of the preceding year to the last week of the year indicated. 2. December 7, 2004, is the Tuesday preceding publication of the December Greenbook. 3. Prices shown apply to the Friday before the date indicated. n.a. Not available.

II-38
Prices of core crude materials fell 1.7 percent in December, on the heels of large increases in October and November. December’s drop in crude materials prices partly owed to a sharp decline in the index for iron and steel scrap. Spot prices of steel scrap continued to decline through late January, although at a somewhat more modest pace. Since the December Greenbook, the Journal of Commerce metals index has declined 1¼ percent. Over the same period, the CRB spot industrials index (which excludes energy) has declined 1 percent, and the JOC industrial index (which includes energy products) also has declined about 1 percent.

Domestic FinancialDevelopments

III-T-1Selected Financial Market Quotations(One-day quotes in percent except as noted)
Change to Jan. 25 from2003 2004 2005 selected dates (percentage points)
Instrument 2003 2004 2004 Dec. 31 June 28 Dec. 13 Jan. 25 Dec. 31 June 28 Dec. 13
Short-termFOMC intended federal funds rate 1.00 1.00 2.00 2.25 1.25 1.25 .25
Treasury bills 1
3-month .93 1.36 2.21 2.36 1.43 1.00 .15 6-month 1.00 1.74 2.44 2.63 1.63 .89 .19
Commercial paper (A1/P1 rates)2
1-month 1.00 1.28 2.29 2.42 1.42 1.14 .13 3-month 1.05 1.45 2.39 2.61 1.56 1.16 .22
Large negotiable CDs 1
1-month 1.06 1.30 2.36 2.49 1.43 1.19 .13 3-month 1.09 1.53 2.45 2.66 1.57 1.13 .21 6-month 1.16 1.82 2.65 2.88 1.72 1.06 .23
Eurodollar deposits 3
1-month 1.04 1.29 2.33 2.48 1.44 1.19 .15 3-month 1.07 1.51 2.42 2.63 1.56 1.12 .21
Bank prime rate 4.00 4.00 5.00 5.25 1.25 1.25 .25
Intermediate- and long-termU.S. Treasury4
2-year 1.83 2.88 2.98 3.24 1.41 .36 .26 10-year 4.40 4.90 4.27 4.30 -.10 -.60 .03 30-year 5.22 5.55 4.87 4.70 -.52 -.85 -.17
U.S. Treasury 10-year indexed note 2.00 2.23 1.65 1.74 -.26 -.49 .09
Municipal revenue (Bond Buyer) 5 5.04 5.37 4.99 4.89 -.15 -.48 -.10
Private instruments 10-year swap 4.66 5.21 4.55 4.55 -.11 -.66 .00 10-year FNMA6 4.72 5.30 4.53 4.53 -.19 -.77 .00 10-year AA 7 5.05 5.59 4.87 4.93 -.12 -.66 .06 10-year BBB 7 5.74 6.18 5.34 5.35 -.39 -.83 .01 5-year high yield 7 7.94 8.30 7.29 7.51 -.43 -.79 .22
Home mortgages (FHLMC survey rate) 8
30-year fixed 5.85 6.21 5.68 5.67 -.18 -.54 -.01 1-year adjustable 3.72 4.19 4.18 4.11 .39 -.08 -.07
Change to Jan. 25 Record high 2004 2005 from selected dates (percent)
Stock exchange index Record 2004 2004 Level Date June 28 Dec. 13 Jan. 25 high June 28 Dec. 13
Dow Jones Industrial 11,723 1-14-00 10,357 10,638 10,462 -1.76 1.01 -1.66S&P 500 Composite 1,527 3-24-00 1,133 1,199 1,168 -23.51 3.09 -2.53Nasdaq 5,049 3-10-00 2,020 2,149 2,020 -59.99 .01 -5.98Russell 2000 655 12-28-04 584 638 607 -7.34 3.83 -4.94Wilshire 5000 14,752 3-24-00 11,056 11,790 11,484 -22.15 3.87 -2.60
1. Secondary market. 2. Financial commercial paper. 3. Bid rates for Eurodollar deposits collected around 9:30 a.m. eastern time. 4. Derived from a smoothed Treasury yield curve estimated using off-the-run securities. 5. Most recent Thursday quote. 6. Constant maturity yields estimated from Fannie Mae domestic noncallable coupon securities. 7. Derived from smoothed corporate yield curves estimated using Merrill Lynch bond data. 8. Home mortgage data for Jan. 25, 2005, is from Jan. 20, 2005. _______________________________________________________________________
NOTES:
June 28, 2004, is the day before the beginning of the current tightening period. December 13, 2004, is the day before the most recent FOMC meeting. _______________________________________________________________________

III-C-1
Policy Expectations and Treasury Yields
3.3
3.4
3.5
3.6
3.7
3.8
Dec. 13 Dec. 16 Dec. 21 Dec. 27 Dec. 30 Jan. 5 Jan. 10 Jan. 13 Jan. 19 Jan. 242.5
2.6
2.7
2.8
2.9
3.0
Note. 5-minute intervals.
December minutes
Employment reportDecember
FOMC
Futures Contract RatesPercentPercent
December 2005 Eurodollar (left scale)
April 2005 federal funds (right scale)
Jan. May Oct. Mar. Aug. Jan.2005 2006 2007
1.5
2.0
2.5
3.0
3.5
4.0
4.5Percent
January 25, 2005December 13, 2004
Implied Federal Funds Futures Rate
Note. Estimates from federal funds and Eurodollar futures,with an allowance for term premia and other adjustments.
Implied Distribution of Federal Funds Rateabout 6 Months Ahead
2.25 2.75 3.25 3.75 4.25
January 25, 2005 (bars)December 13, 2004 (dashed line)
0
5
10
15
20
25
30
35
40
Percent
Note. Based on the distribution of the 3-month Eurodollar rate 5 months ahead (adjusted for a risk premium), impliedby options on Eurodollar futures contracts.
Target Rate
Jan. Apr. July Oct. Jan.2004
1
2
3
4
5
6
7PercentTreasury Yields
10-year
2-year
Jan.25
Daily
Note. Estimates from smoothed Treasury yield curve basedon off-the-run securities.
FOMC
Jan. May Sept. Feb. June Oct.2003 2004
50
100
150
200
250
300
350
400Basis pointsPolicy Uncertainty
Note. Width of a 90 percent confidence interval for thefederal funds rate computed from the term structures for boththe expected federal funds rate and implied volatility.
DailyFOMC
12 months ahead
6 months ahead

Domestic Financial Developments
Overview The market’s anticipated path for the federal funds rate shifted up over the intermeeting period, prompted by the December FOMC minutes—which suggested greater-than-expected concern about inflation on the part of policymakers—and by economic data releases and statements by Federal Reserve officials that were viewed as consistent with continued gradual policy tightening. Short- and intermediate-term Treasury yields moved up in line with the revision to policy expectations, but yields on 10-year Treasuries were about unchanged. Stock prices declined over the intermeeting period against the backdrop of increases in oil prices, lackluster earnings reports, and expectations of more-rapid policy tightening. Indicators of corporate credit quality continued to be strong, and corporate risk spreads stayed quite narrow. As of late last year, borrowing by households remained robust and that of businesses quickened. Policy Expectations and Interest Rates The decision at the December FOMC meeting to hike the funds rate target 25 basis points was largely anticipated, and the response in financial markets that day was limited. However, market participants reportedly read the minutes of the December meeting, released on January 4, as expressing more widespread concern among FOMC members about inflation risks than had previously been anticipated. This reinterpretation led to an upward revision in the anticipated pace of monetary policy tightening. Incoming data on economic activity, on balance, did not dent these expectations of firmer monetary policy. Interest rate futures contracts almost fully price in an increase of 25 basis points in the target rate at the upcoming FOMC meeting and place very high odds on quarter-point hikes at each of the two subsequent meetings. The expected federal funds rate at the end of this year rose about 20 basis points, to 3.4 percent, consistent with quarter-point firmings at half of the FOMC meetings over the year. Uncertainty about the future path of policy, judging from implied volatilities on Eurodollars and swaps, has edged down. Consistent with these revisions to short-term policy expectations, the yield on two-year Treasury securities rose about ¼ percentage point over the intermeeting period, with the largest daily move coming on the heels of the release of the minutes. In contrast, the ten-year Treasury yield was little changed, on net, implying that longer-horizon one-year forward rates declined. A large portion of the drop in forward rates was apparently attributable to decreases in real rates, as inflation compensation—measured by the difference between the yields on nominal and inflation-indexed Treasury securities and adjusted for the effect of the TIPS indexation lag—was about unchanged, on net, at both the five-year and five-year-ahead horizons. Longer-term yields may have been held

III-2
Corporate Yields, Risk Spreads, and Stock Prices
7
9
11
13
15
4
6
8
10Percent Percent
2002 2003 2004 2005
Yields for BBB and High-Yield Corporate Bonds
Daily
5-year high yield(left scale)
10-year BBB(right scale)
FOMC meeting
Jan. 25
Note. Yields from smoothed yield curves based on Merrill Lynch bond data.
100
300
500
700
900
1100
50
150
250
350
450Basis points Basis points
1995 1997 1999 2001 2003 2005
Corporate Bond Spreads to Similar Maturity Treasury
Daily
5-year high yield(left scale)
10-year BBB(right scale)
Jan. 25
0
30
60
90
120
150
Basis points
1999 2001 2003 2005
Commercial Paper Quality Spread(30-Day A2/P2 less A1/P1)
Weekly Friday*
Jan. 25
* Latest observation is for most recent business day.
85
90
95
100
105
25
30
35
40
45
50Ratio scale, Dec. 14, 2004=100 Dollars per barrel
Jan. Mar. May July Sept. Nov. Jan.2004
S&P 500 and Oil Futures Price 24 Months Ahead
Daily
S&P 500(left scale)
Oil futures price(right scale)
FOMC meeting
Jan. 25
2
4
6
8
10
12
Percent
1985 1989 1993 1997 2001 2005
12-Month Forward Earnings-Price Ratiofor S&P 500 and Long-Run Treasury
Monthly
12-month forwardE/P ratio
Long-run real Treasury yield*
+
+
Jan. 25
* Yield on synthetic Treasury perpetuity minus Philadelphia Fed 10-year expected inflation. + Denotes the latest observation using daily interest rates and stock prices and latest earnings data from I/B/E/S.
10
20
30
40
50
60
Percent
2002 2003 2004 2005
Implied Volatility on Nasdaq 100 (VXN) andS&P 500 (VIX)
Weekly Friday*
S&P 500
Nasdaq
FOMC meeting
Jan. 25
* Latest observation is for most recent business day.

III-3
down by several factors, including some reduction in market participants’ expectations of longer-run economic growth, owing to higher oil futures prices; a decline in term premiums that may have stemmed from subdued interest rate volatility; and speculation about foreign official purchases of Treasuries prompted by the dollar’s depreciation against some Asian currencies. Corporate Rates and Spreads Yields on corporate bonds moved roughly in line with those on comparable-maturity Treasuries over the intermeeting period, leaving spreads near the bottom end of their range over the past fifteen years. These spreads are at about the same levels as in 1995 and 1996, a period—similar to the current one—that followed a sharp improvement in corporate credit quality and profitability. The yield spread between thirty-day A2/P2 and A1/P1 commercial paper, which rose in late December on year-end pressures and light trading, has since reversed some of its decline. Stock Prices, Earnings, and Credit Quality Broad stock price indexes were down 2½ percent, on net, over the intermeeting period, with steeper declines recorded for the shares of technology companies and small firms. Share prices, which had continued to climb after the December FOMC meeting, fell on net in early January because of increases in oil prices and expectations of more-rapid monetary policy tightening. Share prices slid further on the initial wave of fourth-quarter earnings reports and the accompanying cautious guidance provided by some firms that left investors somewhat disappointed. With stock prices lower, the forward earnings-price ratio ticked higher over the period. The gap between the earnings-price ratio and the long-run real Treasury yield is now at about its average level over the past two decades. Actual and implied volatilities on both the Nasdaq 100 and the S&P 500 remained near their ten-year lows. With reports from about 150 companies in the S&P 500 now in hand, and on the basis of analysts’ latest estimates for the rest, earnings per share in the fourth quarter are estimated to have increased about 16 percent from a year earlier, down from the even larger four-quarter gains experienced in the first half of the year. Reflecting the softer earnings outlook contained in fourth-quarter reports, analysts’ forecasts of year-ahead earnings for S&P 500 firms were marked down in mid-January, a divergence from the recent pattern.

III-4
Corporate Earnings and Credit Quality
-30
-20
-10
0
10
20
30
Percent
S&P 500 EPSNIPA, economicprofits before tax
1990 1993 1996 1999 2002 2005
Corporate Earnings Growth
Quarterly*
Q4
Q3
* Change from four quarters earlier. Source. I/B/E/S for S&P 500 EPS.
e
e Staff estimate.
-4
-3
-2
-1
0
1
2
3Percent, monthly rate
2002 2003 2004 2005
S&P 500 Revisions Index
Monthly
Mid- Jan.
Note. Index is a weighted average of the percent change in the consensusforecasts of current-year and following-year EPS.
0.03
0.06
0.09
0.12
0.5
1.0
1.5
2.0
2.5
Ratio Ratio
1989 1992 1995 1998 2001 2004
Cash and Equivalents
Nonfinancial corporations
Over fixed investment(right scale)
Over assets(left scale)
Q3
Note. Computstat data, annual through 1999 and quarterly thereafter; fixedinvestment is at an annual rate.
1990 1992 1994 1996 1998 2000 2002 200450
40
30
20
10
0
10
20
30Upgrades
Downgrades
Bond Ratings Changes ofNonfinancial Companies Percent of outstandings
H1
Q3
Q4
Note. Data are at an annual rate. Source. Moody’s Investors Service.
0
1
2
3
4
5
6
7Percent of outstandings
1990 1993 1996 1999 2002 2005
Bond Defaults andC&I Loan Delinquency Rates
C&I loan delinquency rate (Call Report)
Bond default rate*
Dec.
Q3
* 6-month moving average, from Moody’s Investors Service.
0.0
0.5
1.0
1.5
2.0Percent of liabilities
1993 1996 1999 2002 2005
Expected Year-Ahead Defaults
Monthly
Dec.
Note. Firm-level estimates of default weighted by firm liabilities as apercent of total liabilities, excluding defaulted firms. Source. KMV Corporation.

III-5
Business FinanceGross Issuance of Securities by U.S. Corporations(Billions of dollars; monthly rates, not seasonally adjusted)
2004 2005Type of security 2001 2002 2003 H1 Q3 Q4 Dec. Jan. e
Nonfinancial corporationsStocks 1 6.5 5.2 3.7 5.7 4.7 5.2 6.6 3.0 Initial public offerings 2.1 0.7 0.4 0.8 2.0 2.6 3.8 n.a. Seasoned offerings 4.4 4.4 3.2 4.9 2.6 2.6 2.9 n.a.
Bonds 2 39.8 24.8 31.6 22.7 18.9 23.7 20.7 17.0 Investment grade 27.5 15.7 16.0 8.2 9.2 7.7 3.1 n.a. Speculative grade 8.9 4.8 11.3 10.5 6.3 10.8 13.7 n.a. Other (sold abroad/unrated) 3.4 4.2 4.3 4.0 3.5 5.3 3.9 n.a.
MemoNet issuance of commercial paper 3 -8.0 -6.3 -3.8 2.8 1.9 -2.1 -11.0 9.0Change in C&I loans at commercial banks 3,4 -5.8 -5.2 -7.9 -0.4 4.7 7.0 11.2 n.a.
Financial corporationsStocks 1 4.2 4.0 6.9 8.3 4.3 5.6 5.1 n.a.Bonds 2 80.2 87.0 111.1 130.9 154.7 136.4 126.2 n.a.
Note. Components may not sum to totals because of rounding. 1. Excludes private placements and equity-for-equity swaps that occur in restructurings. 2. Data include regular and 144a private placements. Bond totals reflect gross proceeds rather than par value of original discount bonds. Bonds are categorized according to Moody’s bond ratings, or to Standard & Poor’s if unrated by Moody’s. 3. End-of-period basis, seasonally adjusted. 4. Adjusted for FIN 46 effects. e Staff estimate.
2000 2001 2002 2003 2004
-30
-20
-10
0
10
20
30
40
50
Commercial paper*C&I loans*Bonds
Total
Selected Components of Net Debt Financing
Billions of dollars
Monthly rate, nonfinancial firms
H1Q3
Q4
* Seasonally adjusted, period-end basis.
2000 2001 2002 2003 2004
-50
-40
-30
-20
-10
0
10
20
30
40
50
60
Public issuancePrivate issuanceRepurchasesCash mergers
Total
Components of Net Equity Issuance
Billions of dollars
Monthly rate, nonfinancial firms
H1Q3 Q4 e
e Staff estimate.

III-6
1996 1998 2000 2002 2004 0
2
4
6
8
10
12
14
16
18Percent
Q4e
Growth of Commercial Mortgage Debt
Quarterly, s.a.a.r.
e Staff estimate.
Billions of dollars
Quarterly
1996 1998 2000 2002 20040
5
10
15
20
25
30
35
Gross Issuance of CMBS
Source. Commercial Mortgage Alert.
2000 2001 2002 2003 2004 2005 5
6
7
8
9
10Percent
Dec.
10-Year Commercial Mortgage Rates
Source. Barron’s/Levy.
Monthly
2000 2001 2002 2003 2004 2005 3
4
5
6
7
8
9
10Percent
AAA
BBB
Jan. 19
Investment-Grade CMBS Yields
Source. Morgan Stanley.
Weekly
2000 2001 2002 2003 2004 2005 0
50
100
150
200
250
300Basis points
AAA
BBB
Jan. 19
Investment-Grade CMBSSpreads over 10-Year Treasuries
Source. Morgan Stanley.
Weekly
1996 1998 2000 2002 2004
0
1
2
3
4Percent
Q3
Q3
Dec.
At lifeinsurancecompanies
CMBS
At commercial banks
Delinquency Rates on CommercialMortgages and CMBS
Source. Call Report, ACLI, Morgan Stanley.
Commercial Real Estate

III-7
Measures of business credit quality continue to show that nonfinancial firms are in good shape. These firms retain hefty cash reserves, according to balance sheet data for the third quarter. Although the value of bond downgrades rose in the fourth quarter and swamped the value of upgrades, about half of the value of the downgrades resulted from idiosyncratic factors related to two mergers rather than broad industry or macroeconomic trends. The six-month trailing bond default rate ticked up in December but remained at a low level, and the aggregate expected default rate based on KMV data continued to edge down, reaching a level not seen since mid-1998. Business Finance Gross issuance of bonds by nonfinancial corporations in December and January to date came in just a bit below the strong pace of October and November. Issuance of speculative-grade bonds remained robust in December, with reports indicating that the proceeds increasingly went to finance mergers, but offering of these bonds have dropped back a bit so far this year. C&I loan growth strengthened in December and moved up further in the first half of January, consistent with reports of stronger demand and less-restrictive lending standards and terms in the Senior Loan Officer Opinion Survey. Commercial paper dropped a bit, on net, in December and January, as some large firms paid down their outstandings at year-end. Overall, net debt financing by nonfinancial firms from C&I loans, commercial paper, and bonds moved up in the fourth quarter to its highest quarterly rate in 2004 and appears to have remained strong early this year. Equity issuance by nonfinancial firms increased in December as initial public offerings picked up, but it has slowed in January. Share repurchases, fueled by strong profits and liquid balance sheets, are estimated to have risen to a record pace in the fourth quarter. At the same time, cash-financed mergers jumped to their highest pace in more than seven years, with Cingular’s cash acquisition of AT&T Wireless accounting for half the total. The anticipated repatriation of profits earned overseas could keep equity retirements elevated over the coming year. The Treasury Department announced in mid-January that repatriated profits could not be used directly for share repurchases, but it noted that the use of funds freed up by repatriated profits would not be restricted. Commercial Real Estate Commercial mortgage debt appears to have risen at a strong 9½ percent annual rate in the fourth quarter, and respondents to the Senior Loan Officer Opinion Survey indicated that demand for these loans has increased, on net, over the past three months. The CMBS calendar suggests that issuance will slow in the current quarter from its record pace in the

III-8
1996 1998 2000 2002 20045
6
7
8
9Percent
30-yearFRM
Jan. 19
Freddie Mac Mortgage Rates
Weekly
1996 1998 2000 2002 2004 2
4
6
8
10
12
14
16Percent change from year earlier
Consumer credit
Mortgage
Q4e
Nov.
Debt Growth
e Staff estimate.
1991 1994 1997 2000 2003 0
10
20
30
40
50
60
70
80
90
100Billions of dollars
Q4
Cash-outs from Mortgage Refinancing
Quarterly
Source. MBA, HMDA.1996 1998 2000 2002 2004
0
5
10
15
20
25
30Percent change from year earlier
Q3 Quarterly
Home Equity Loan Growth
1996 1998 2000 2002 20041.5
2.0
2.5
3.0
3.5
4.0
4.5
5.0
5.5
6.0Percent
Credit cards in securitized pools
Auto loans at captive finance companies
Nov.
Nov.
Delinquency Rates
Monthly
Source. Moody’s, Federal Reserve.1996 1998 2000 2002 2004
300
350
400
450
500
550
600
650Filings per 100,000 persons
8-week moving average, s.a.a.r.
Jan. 15
Household Bankruptcies
Source. Visa Bankruptcy Notification Service.
Household Liabilities

III-9
fourth quarter, but it will remain solid. Despite abundant supply, CMBS spreads over the ten-year Treasury yield are still narrow. Delinquency rates on loans backing CMBS have fallen almost 1 percentage point on net since their peak in late 2003, and delinquency rates on commercial mortgages on the books of banks and life insurance companies remain quite low. Household Finance Thirty-year fixed-rate mortgage rates changed little, on net, over the intermeeting period and have stayed in a narrow range around 5¾ percent since last fall. Low mortgage rates in the fourth quarter likely contributed to strong growth in home mortgage debt. In contrast, the growth rate of consumer credit is estimated to have remained subdued, held down perhaps by the funding of household expenditures with equity extracted from homes: Although cash-out mortgage refinancing has recently been running well below the spectacular rates seen in 2002 and 2003, home equity loans from all types of lenders increased at a record rate of 27 percent over the year ending in the third quarter. Measures of household credit quality have continued to improve. Delinquencies on credit card loans in securitized pools declined again in November, while those on auto loans at captive finance companies remained low. Household bankruptcy filings have continued to trend lower. The ratio of net worth to disposable personal income is estimated to have increased in the fourth quarter, reflecting the solid rise in stock prices and the staff’s estimate of a further increase in home prices based on data on the average prices of existing homes sold through November. Inflows into equity mutual funds picked up in the fourth quarter, consistent with the rise in stock returns that quarter. Treasury and Agency Finance The Treasury conducted auctions of two- and five-year notes and ten- and twenty-year TIPS over the intermeeting period. Indirect bidding, which partly reflects demand from foreign official institutions, took up a bit less than 40 percent of the issues, slightly below the average share over the past year. Treasury securities held on behalf of foreign official institutions at the FRBNY continued to grow robustly. Early in the intermeeting period, the SEC announced that it had determined that Fannie Mae had violated accounting rules. The CEO and CFO subsequently announced that they would leave the firm. In late December, Fannie Mae placed $5 billion in preferred stock

III-10
1990 1992 1994 1996 1998 2000 2002 20044
5
6
7Net Worth Relative to Disposable Income Ratio
Quarterly, period-end, s.a.
Household Assets
Q4e
e Staff estimate.
1990 1992 1994 1996 1998 2000 2002 2004 50
150
250
350Asset Prices 1993:Q1 = 100
Quarterly, n.s.a.
Stock prices (Wilshire 5000)
House prices*
Q4e
Q4
e Staff estimate based on Census Bureau data on prices of new homes sold and National Association of Realtors data on prices of existing homes sold. * Source. Office of Federal Housing Enterprise Oversight (OFHEO).
Net Flows into Long-Term Mutual Funds(Billions of dollars, monthly rate)
Fund Type 2003 2004 2004 Assets
e
Q2 Q3 Q4e Nov. Dec.e Nov.
Total long-term funds 18.0 18.4 3.8 11.7 21.8 27.5 23.6 6,003 Equity funds 12.7 15.1 11.3 6.9 14.0 21.3 13.4 4,222 Domestic 10.7 9.5 7.6 3.8 6.7 12.9 4.9 3,568 International 2.0 5.7 3.7 3.1 7.3 8.5 8.6 654 Hybrid funds 2.7 3.6 3.1 2.8 3.3 4.1 2.4 504 Bond funds 2.6 -0.3 -10.5 2.0 4.5 2.0 7.8 1,277 High-yield 2.2 -0.8 -2.7 0.5 0.6 1.0 0.2 154 Other taxable 1.0 1.6 -4.0 2.0 4.0 1.0 8.1 797 Municipals -0.6 -1.1 -3.9 -0.5 -0.2 -0.0 -0.5 325
Note. Excludes reinvested dividends.
e Staff estimates based on confidential ICI weekly data.
Source. Investment Company Institute.

III-11
GSE Market Developments
Aug. Sept. Oct. Nov. Dec. Jan.2004
20
25
30
35
40
45Basis points
Fannie MaeFreddie Mac
Ten-Year GSE Yield Spreadsto Treasury
Daily
Jan. 25
Dec.FOMC
Aug. Sept. Oct. Nov. Dec. Jan.2004
60
65
70
75
80
85
Fannie MaeFreddie Mac
GSE Stock Prices
Daily
Jan. 25
Dec.FOMC
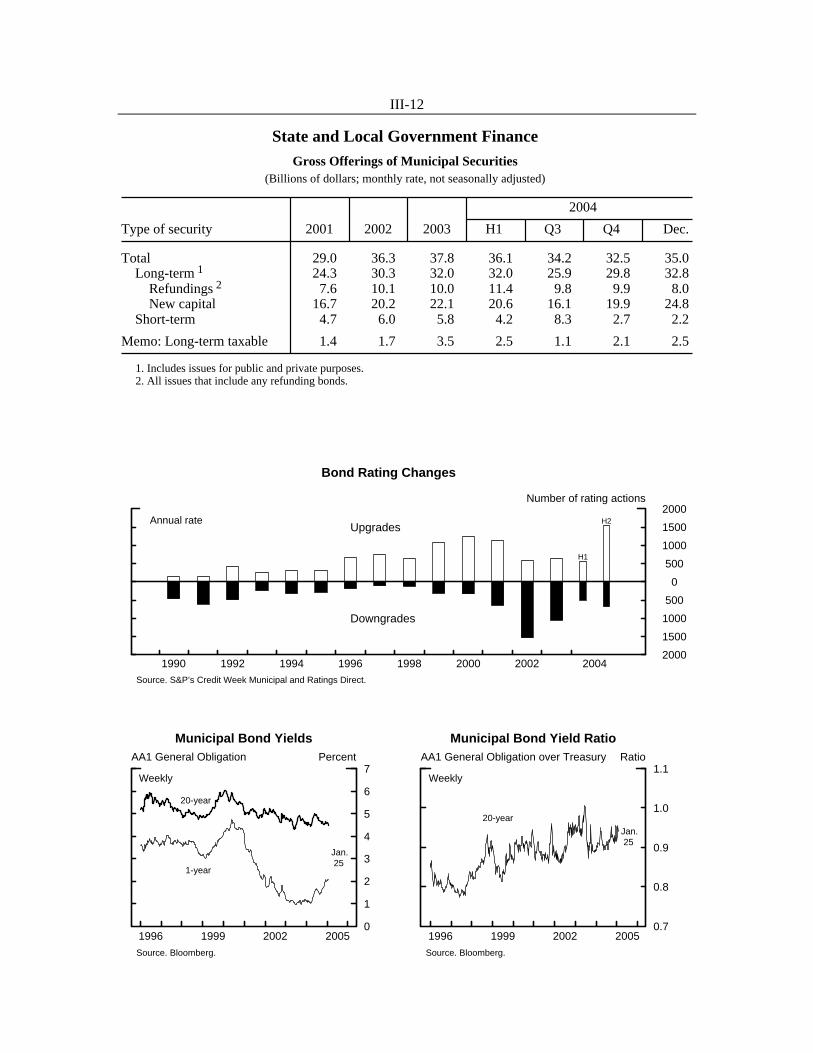
III-12
State and Local Government FinanceGross Offerings of Municipal Securities
(Billions of dollars; monthly rate, not seasonally adjusted)
2004
Type of security 2001 2002 2003 H1 Q3 Q4 Dec.
Total 29.0 36.3 37.8 36.1 34.2 32.5 35.0 Long-term 1 24.3 30.3 32.0 32.0 25.9 29.8 32.8 Refundings 2 7.6 10.1 10.0 11.4 9.8 9.9 8.0 New capital 16.7 20.2 22.1 20.6 16.1 19.9 24.8 Short-term 4.7 6.0 5.8 4.2 8.3 2.7 2.2
Memo: Long-term taxable 1.4 1.7 3.5 2.5 1.1 2.1 2.5
1. Includes issues for public and private purposes. 2. All issues that include any refunding bonds.
1990 1992 1994 1996 1998 2000 2002 20042000
1500
1000
500
0
500
1000
1500
2000
Upgrades
Downgrades
Bond Rating Changes
Number of rating actions
Annual rate
H1
H2
Source. S&P’s Credit Week Municipal and Ratings Direct.
0
1
2
3
4
5
6
7AA1 General Obligation Percent
1996 1999 2002 2005
Municipal Bond Yields
Weekly
20-year
1-year
Jan. 25
Source. Bloomberg.
0.7
0.8
0.9
1.0
1.1AA1 General Obligation over Treasury Ratio
1996 1999 2002 2005
Municipal Bond Yield Ratio
Weekly
20-year
Jan. 25
Source. Bloomberg.

III-13
and, in mid-January, cut its dividend on common stock in half, in response to the OFHEO’s determination that it was “significantly undercapitalized.” Fannie Mae’s stock price fell sharply on news of the dividend cut. In contrast to the hit to stock prices, agency debt spreads declined slightly, apparently reflecting reduced issuance and, as indicated by custody holdings at the FRBNY over the period, continued strong demand for agency securities from foreign official institutions. State and Local Government Finance Gross issuance of long-term municipal bonds in December about matched the robust pace for last year as a whole. Roughly three-quarters of the issuance was for new capital projects, most of which were related to education, housing, and transportation. Advance refundings also continued to be robust, as states and municipalities continued to take advantage of low long-term interest rates. The volume of short-term issuance was comparatively light in December, a development consistent with the improved budget situations in many states. Credit quality has also showed improvement in recent months, with upgrades of municipal bonds far outpacing downgrades. The ratio of municipal bond yields to comparable Treasury yields was little changed over the intermeeting period. Money and Bank Credit Based on partial data for January, M2 growth appears to have remained moderate in recent months, owing primarily to rising opportunity costs associated with monetary policy tightening. Growth of liquid deposits has been much slower than it was in the first half of 2004, likely as a result of higher short-term interest rates. By contrast, increasing rates have contributed to a pickup in the growth of small time deposits, whose yields closely track market rates. Currency was about flat in December, depressed in part by significant reflows of currency from overseas. Although growth of total bank credit slowed in December, most loan categories still expanded smartly. C&I loans posted their sixth consecutive month of positive growth in December. Real estate loans continued to expand at a solid pace, although home equity lending at banks decelerated sharply in December, perhaps owing in part to the effects of higher short-term interest rates. Data for early January suggest further gains in most loan categories.

III-14
Monetary Aggregates(Based on seasonally adjusted data*)
2004 2005 Level(billions of
dollars), Aggregate or component 2003 2004 Q3 Q4 Dec. Jan. Jan.
(e) (e)Aggregate
5.3 5.2 3.6 5.5 4.3 5.7 6,4484.7 5.7 4.2 3.3 5.3 7.2 9,484
3. Currency 5.9 5.5 7.5 5.1 .3 7.6 70213.9 10.0 6.1 8.5 6.3 5.5 4,205
5. Small time deposits -9.3 -.5 1.8 4.8 5.0 12.7 8226. Retail money market funds -11.6 -12.0 -11.4 -9.6 -3.9 -2.9 711
Components of M33.5 7.0 5.7 -1.3 7.3 10.3 3,0364.2 21.3 17.5 12.0 26.4 70.7 1,135
9. Institutional money -5.6 -5.8 -6.4 -12.5 -.6 -14.3 1,054 market funds10. RPs 14.1 1.3 -.3 -17.9 -16.9 -58.4 48511. Eurodollars 27.7 24.4 21.6 21.2 9.7 .3 362
Memo12. Monetary base 6.0 5.6 8.8 5.2 -.9 4.4 763
Selected managed liabilitiesat commercial banks13. Large time deposits, gross -1.1 14.7 16.9 9.6 19.5 57.0 1,25614. Net due to related foreign institutions 3.1 -10.6 -9.8 -4.1 20.1 25.0 6415. U.S. government deposits at commercial banks -.3 .2 -2.8 1.9 -.8 7.6 23
1. For the years shown, Q4-to-Q4 percent change. For the quarters shown, based on quarterly averages. 2. Sum of currency, liquid deposits (demand, other checkable, savings), small time deposits, retail money market funds, and nonbank traveler's checks. 3. Sum of M2, net large time deposits, institutional money market funds, RP liabilities of depository institutions, and Eurodollars held by U.S. addressees. 4. Nonbank traveler's checks not listed. 5. Sum of demand deposits, other checkable deposits, and savings deposits. 6. Sum of large time deposits, institutional money market funds, RP liabilities of depositoryinstitutions, and Eurodollars held by U.S. addressees. 7. Net of holdings of depository institutions, money market funds, U.S. government, and foreign banks and official institutions. 8. For the years shown, "average monthly change" is the Q4-to-Q4 dollar change divided by 12. For the quarters shown, it is the quarter-to-quarter dollar change divided by 3. e Estimated. * These data also reflect the effects of the annual seasonal factor review and are confidentialuntil their release, which is planned for February 3, 2005.
Percent change (annual rate)1
1. M22
2. M33
Components of M24
4. Liquid deposits5
7. M3 minus M26
8. Large time deposits, net7
Average monthly change (billions of dollars)8

III-15
Commercial Bank Credit(Percent change, annual rate, except as noted; seasonally adjusted)
Level,Type of credit 2003 2004 Q3 Q4 Nov. Dec. Dec. 2004
2004 2004 2004 2004 ($ billions)
Total 1. Adjusted1 5.9 8.8 4.9 6.4 9.2 3.8 6,514 2. Reported 5.6 8.3 5.4 6.2 7.3 4.1 6,680
Securities 3. Adjusted1 8.6 6.7 -7.7 2.2 11.2 2.6 1,739 4. Reported 7.3 5.1 -4.8 2.1 4.2 3.7 1,905 5. Treasury and agency 8.8 5.0 -4.0 -10.7 -2.8 3.3 1,150 6. Other2 5.0 5.2 -6.2 23.4 14.9 4.5 756
Loans3
7. Total 4.9 9.6 9.8 7.9 8.5 4.2 4,775 8. Business -9.4 .7 5.8 4.9 6.4 11.2 889 9. Real estate 11.1 13.6 8.0 12.8 11.6 10.6 2,538 10. Home equity 30.8 43.3 37.1 37.3 30.7 16.2 398 11. Other 8.8 9.5 3.4 8.6 8.2 9.6 2,139 12. Consumer 5.4 8.6 19.6 -1.7 -9.3 14.8 673 13. Adjusted4 5.8 6.0 12.4 3.0 .3 11.5 1,051 14. Other5 6.7 9.0 11.7 3.6 17.1 -37.6 675
Note. Data are adjusted to remove estimated effects of consolidation related to FIN 46 and for breaks caused byreclassifications. Monthly levels are pro rata averages of weekly (Wednesday) levels. Quarterly levels (not shown)are simple averages of monthly levels. Annual levels (not shown) are levels for the fourth quarter. Growth rates arepercentage changes in consecutive levels, annualized but not compounded. 1. Adjusted to remove effects of mark-to-market accounting rules (FIN 39 and FAS 115). 2. Includes private mortgage-backed securities, securities of corporations, state and local governments, foreigngovernments, and any trading account assets that are not Treasury or agency securities, including revaluation gainson derivative contracts. 3. Excludes interbank loans. 4. Includes an estimate of outstanding loans securitized by commercial banks. 5. Includes security loans and loans to farmers, state and local governments, and all others not elsewhere classified.Also includes lease financing receivables.

Appendix
Senior Loan Officer Opinion Survey on Bank Lending Practices The January 2005 Senior Loan Officer Opinion Survey on Bank Lending Practices addressed changes in the supply of, and demand for, bank loans to businesses and households over the past three months. The survey contained a special question on the reasons why nonbank investors have increased their participation in the commercial and industrial (C&I) loan market recently. In addition, the survey asked banks about changes over the past year in their terms on commercial real estate loans. Finally, banks were asked why the share of industry assets accounted for by residential real estate loans has increased over the past three years. This appendix is based on responses from fifty-five domestic banks and twenty foreign institutions. As was the case throughout 2004, domestic and foreign banks reported in the January 2005 survey that they had eased lending standards and terms for C&I loans and commercial real estate loans. Demand for C&I loans increased, on net, at domestic banks but was unchanged at foreign institutions. Demand for commercial real estate loans rose, on net, at both domestic and foreign banks in recent months. A small number of domestic banks eased standards on residential mortgages over the past three months, while standards and terms for consumer loans were about unchanged, on balance. Relatively large fractions of domestic banks reported weaker demand for both residential mortgages and consumer loans. C&I Lending In the January survey, domestic banks reported a further net easing of lending standards on C&I loans. One-fourth of domestic banks, on net, reported having eased their standards for large and middle-market firms over the past three months, about the same fraction as in recent surveys. Thirteen percent of these institutions also indicated that they had eased their lending standards for small firms, down from nearly 20 percent in the October survey. The share of U.S. branches and agencies of foreign banks that reported easier lending standards for C&I loans was 20 percent, a noticeable decline from the 35 percent net easing in the previous survey. Both domestic and foreign institutions indicated that they had continued easing lending terms on C&I loans over the past three months. On net, almost 50 percent of domestic banks trimmed spreads of loan rates over their cost of funds for large and middle-market borrowers, about the same fraction as in the previous survey. About one-fourth did so for small firms, down from nearly 40 percent in the October survey. More than half of foreign institutions reported having reduced spreads on their C&I loans in the January survey. In addition, large fractions of domestic and foreign respondents indicated that they had eased other terms by increasing the maximum size of loans, loosening covenant restrictions, or reducing the costs of credit lines. One bank commented that loan maturities had lengthened markedly, a claim consistent with both the Survey of Terms of Business Lending and data from LoanPricing Corporation.

III-A-2
Almost all domestic and foreign respondents that had eased their lending standards and terms over the past three months cited more aggressive competition from other banks or nonbank lenders as the most important reason. Large fractions of domestic banks also pointed to a more favorable or less uncertain economic outlook and a higher tolerance for risk as reasons for their move toward a less stringent lending posture. More than half of foreign respondents cited increased liquidity in the secondary market for these loans as a reason for easing. In recent surveys, respondent banks have reported that they had eased standards or terms in response to increased competition from other sources of business credit. This survey included a special question on why nonbank lenders have become more aggressive competitors. The most important reason, according to domestic banks, was that nonbanks have become more attracted to the senior status of loans in bankruptcy and restructuring proceedings. Increased liquidity in the secondary market was the main reason cited by foreign institutions and a close second among the reasons given by domestic banks. Domestic banks also pointed to the trend toward market-based pricing as a reason they considered important. On net, about 45 percent of domestic institutions reported an increase in demand for C&I loans from large and middle-market firms, up from about 25 percent in the October survey. Almost 30 percent, on net, indicated that demand from small firms had increased, about the same as in the previous survey. In addition, nearly 50 percent of domestic banks, on net, reported an increase in the number of inquiries from potential business borrowers, a larger fraction than in the October survey. In contrast, foreign institutions reported that demand for C&I loans was unchanged over the past three months, although the number of inquiries from potential business borrowers at these institutions rose, on net. Consistent with the growth of inventories seen late in 2004, greater need for inventory financing was the most-often-cited reason for increased demand for C&I loans at domestic banks. The second most important reason for increased demand noted in the January survey was an increase in merger and acquisition activity. As was the case in previous surveys, large fractions of the respondents experiencing stronger loan demand also pointed to their borrowers= increased financing needs for accounts receivable and for investment in plant and equipment. Commercial Real Estate Lending About one-fourth of domestic banks reported a net easing of lending standards on commercial real estate loans over the past three months, a slightly larger fraction than in the October survey. The net percentage of domestic banks that reported increased demand for such loans was 16 percent, a modest decline from the 23 percent in the previous survey. Of the thirteen foreign institutions in the survey that are active in the commercial real estate market, one indicated that it had eased standards, and two indicated that demand had increased.

III-A-3
For several years, the January survey has asked banks to report the changes over the past twelve months in various commercial real estate loan terms. Almost half of the domestic and foreign respondents indicated that they had reduced spreads on loans over the past year, compared with a small fraction that reported having tightened spreads in the January 2004 survey. About 25 percent of domestic banks also indicated that they had increased the maximum size of loan that they were willing to extend last year, a bit more than had done so during 2003. In addition, a modest fraction of domestic banks had eased limits on loan maturity over the past twelve months. By contrast, most foreign institutions reported that they had kept non-price loan terms unchanged, but one indicated that it had tightened several terms considerably. Domestic banks that had eased terms on commercial real estate loans gave reasons very similar to those provided by banks that had eased terms on C&I loans: more competition from other lenders (both bank and nonbank), improved conditions in the commercial real estate market, and a more favorable economic outlook. Lending to Households A few domestic banks, on net, eased credit standards on residential mortgage loans over the past three months. Nearly 30 percent of banks, on net, reported weaker demand for mortgages to purchase homes, about the same as in the October survey. Nevertheless, over the past three years the share of residential real estate loans in banks’ portfolios has risen noticeably. In response to a special question asking for the reasons behind this growth, about 75 percent of the banks noted that the share of new originations that were adjustable-rate loans, which are better suited to holding in banks’ portfolios, increased over this period. About two-thirds of the banks said that strong demand for residential mortgages had supported returns on them, thereby making such loans more profitable to hold. Half of the banks indicated that a widening of the spread between yields on residential mortgages and those on mortgage-backed securities had increased the attractiveness of the underlying loans. About one-quarter of the banks said their mortgage holdings had increased because a larger share of their originations did not conform to the standards set by the housing-related government-sponsored enterprises (GSEs). However, three-quarters of the banks that had reduced sales of mortgages to GSEs claimed that their capital was sufficient to support that growth, while a few banks reported limiting acquisitions of other assets as a result of the retained mortgages. Although standards and terms on credit card and other consumer loans were about unchanged, 12 percent of the respondents indicated that their willingness to make consumer installment loans had increased. On net, 27 percent of domestic respondents reported weaker demand for consumer loans in the January survey, about the same as in the previous survey.

III-A-4
1990 1991 1992 1993 1994 1995 1996 1997 1998 1999 2000 2001 2002 2003 2004 2005
-20
0
20
40
60
80
Percent
Large and mediumSmall
Net Percentage of Domestic Respondents Tightening Standards for C&I Loans
Measures of Supply and Demand for C&I Loans,by Size of Firm Seeking Loan
1990 1991 1992 1993 1994 1995 1996 1997 1998 1999 2000 2001 2002 2003 2004 2005-60
-40
-20
0
20
40
60
80
Percent
Net Percentage of Domestic Respondents Increasing Spreads of Loan Rates over Banks’ Costs of Funds
1991 1992 1993 1994 1995 1996 1997 1998 1999 2000 2001 2002 2003 2004 2005
-60
-40
-20
0
20
40
60
Percent
Net Percentage of Domestic Respondents Reporting Stronger Demand for C&I Loans

III-A-5
1996 1997 1998 1999 2000 2001 2002 2003 2004 2005
0
10
20
30
40
50
60
Percent
Net Percentage of Domestic Respondents Tightening Standards on Consumer Loans
Credit cards
Other consumer loans
Measures of Supply and Demand for Loans to Households
1991 1992 1993 1994 1995 1996 1997 1998 1999 2000 2001 2002 2003 2004 2005 -80
-60
-40
-20
0
20
40
60
80
Percent
Net Percentage of Domestic Respondents Reporting Stronger Demand for Loans to Households
Residential mortgages
Consumer loans
1990 1991 1992 1993 1994 1995 1996 1997 1998 1999 2000 2001 2002 2003 2004 2005
-10
0
10
20
30
40
Percent
Net Percentage of Domestic Respondents Tightening Standards for Mortgages to Individuals

International Developments

International Developments
U.S. International Transactions Trade in Goods and Services The U.S. international trade deficit widened to $60.3 billion in November from $56.0 billion in October (revised).
Net Trade in Goods and Services(Billions of dollars, seasonally adjusted)
Annual rate Monthly rate2003 2004 2004
Q2 Q3 Q4e Sept. Oct. Nov.Real NIPA1
Net exports of G&S -518.5 -580.3 -583.2 n.a. ... ... ...
Nominal BOPNet exports of G&S -496.5 -604.3 -621.4 -697.8 -50.9 -56.0 -60.3
Goods, net -547.6 -654.3 -666.9 -745.5 -55.0 -60.1 -64.1Services, net 51.0 50.0 45.6 47.7 4.1 4.1 3.8
1. Billions of chained (2000) dollars.e. BOP data are two months at an annual rate.Source. U.S. Department of Commerce, Bureaus of Economic Analysis and Census.n.a. Not available. ... Not applicable.
In November, the value of exports of goods and services plunged 2.3 percent, the first monthly decline since June. Exports of goods fell 3.8 percent in a broadly based retreat. Exports of capital goods fell particularly steeply, in part due to a decline in the volatile category of aircraft, but also due to falls in exports of computers, semiconductors, telecommunications products, and other capital goods. Services exports rose 1.4 percent, largely due to an increase in travel-related services. At an annual rate, the average value of exported goods and services in October and November was about ½ percent above the third-quarter level. Declines in exports of capital goods and automotive products were offset by increases in services, agricultural goods, industrial supplies, and consumer goods. The value of imported goods and services rose 1.3 percent in November, a pace less than half that recorded in October. Imports of goods rose just over 1 percent, with the gain more than accounted for by an increase in the value of imported oil, as non-oil imports edged down. A fall in industrial supplies led the overall decline in non-oil imports, although auto imports also fell steeply. Imports in the broad category of capital goods fell a bit, but the aggregate number masked strong gains in other capital goods and telecommunications products, which were offset by a steep decline in imports of aircraft,

IV-2
U.S. International Trade in Goods and Services
-750
-700
-650
-600
-550
-500
-450
-400
-350
-300
-250
-200
-150
-100
-50Nominal
BOP basis
RealNIPA basis
(2000$)
1997 1999 2001 2003 2005
Net Exports Bil$, s.a.a.r.
20
40
60
80
100
120
140
160
180
200
220
Machinery 2/
Industrialsupplies 1/
Consumer goods
Aircraft
1997 1999 2001 2003 20051. Excludes agriculture and gold.2. Excludes computers and semiconductors.
Selected Exports Bil$, s.a.a.r.
-4
-3
-2
-1
0
1
2
3Percentage points, s.a.a.r.
1997 1999 2001 2003 2005
Contribution of Net Exports to Real GDP Growth
-80
-60
-40
-20
0
20Net trade in computersand semiconductors
Net automotive tradewith Canada and Mexico
1997 1999 2001 2003 2005
Bil$, s.a.a.r.
120
140
160
180
200
220
240
260
280
300
320
340
360
380
400
50
70
90
110
130
150
170
190
210
230
250
270
290
Consumer goods
Machinery 2/
Industrialsupplies 1/
Automotive 3/ (overseas)
1. Excludes oil and gold.2. Excludes computers and semiconductors.3. Excludes Canada and Mexico.
1997 1999 2001 2003 2005
Selected Imports Bil$, s.a.a.r.

IV-3
U.S. Exports and Imports of Goods and Services(Billions of dollars, s.a.a.r., BOP basis)
Levels Change1
2004 2004 2004 2004Q3 Q4e Oct. Nov. Q3 Q4e Oct. Nov.
Exports of G&S 1158.5 1160.1 1173.5 1146.6 22.3 1.6 3.6 -26.9
Goods exports 818.4 814.4 830.2 798.6 21.2 -4.1 0.5 -31.6Gold 5.0 4.9 5.1 4.6 1.5 -0.1 -1.1 -0.5Other goods 813.5 809.5 825.0 794.0 19.7 56.5 1.6 -31.1
Aircraft & parts 51.9 51.8 53.5 50.0 4.2 -0.1 1.7 -3.5Computers & accessories 43.1 42.0 42.8 41.3 1.3 -1.1 -0.7 -1.5Semiconductors 46.3 46.3 46.5 46.1 -2.8 0.0 -1.0 -0.4Other capital goods 192.9 188.2 194.0 182.4 2.5 -4.7 0.4 -11.6
Automotive 92.4 89.8 91.9 87.7 6.8 -2.6 -0.7 -4.2to Canada 52.3 47.9 50.0 45.8 5.2 -4.5 -2.1 -4.2to Mexico 14.6 17.6 17.7 17.5 -1.4 3.0 1.6 -0.2to ROW 25.5 24.3 24.2 24.4 3.1 -1.1 -0.3 0.2
Agricultural 60.5 61.7 62.7 60.8 -2.2 1.2 -0.8 -1.9Ind supplies (ex. ag, gold) 190.2 194.6 198.6 190.7 6.6 4.5 5.9 -7.9Consumer goods 102.6 104.4 105.8 103.0 0.4 1.8 0.0 -2.8All other goods 33.6 30.6 29.3 32.0 2.8 -3.0 3.9 2.7
Services exports 340.0 345.7 343.4 348.1 1.1 5.7 3.1 4.7
Imports of G&S 1779.8 1857.9 1845.6 1870.2 39.3 78.0 64.6 24.6
Goods imports 1485.4 1559.8 1551.5 1568.1 33.8 74.5 62.0 16.6Petroleum 179.5 220.2 208.0 232.5 15.3 40.7 28.8 24.5Gold 4.0 4.5 4.9 4.1 0.7 0.5 0.6 -0.8Other goods 1301.8 1335.1 1338.6 1331.5 17.7 33.2 32.6 -7.1
Aircraft & parts 24.2 28.7 32.3 25.1 -0.2 4.5 5.9 -7.2Computers & accessories 91.3 90.6 91.1 90.1 3.6 -0.7 0.8 -1.0Semiconductors 27.5 26.2 27.1 25.2 0.2 -1.3 0.1 -1.9Other capital goods 207.9 211.2 206.9 215.6 6.7 3.3 -3.3 8.7
Automotive 231.3 230.0 232.6 227.4 2.9 -1.3 -1.0 -5.2from Canada 69.1 70.7 73.4 68.1 1.4 1.6 5.5 -5.2from Mexico 42.1 46.4 49.3 43.5 -2.7 4.4 3.2 -5.8from ROW 120.1 112.8 109.9 115.7 4.1 -7.3 -9.8 5.8
Ind supplies (ex. oil, gold) 240.6 243.6 248.2 239.1 16.6 3.1 5.7 -9.1Consumer goods 364.7 386.1 383.9 388.2 -9.9 21.3 20.0 4.3Foods, feeds, bev. 60.9 63.9 62.8 65.0 -1.6 3.1 3.2 2.1All other goods 53.5 54.7 53.6 55.8 -0.4 1.2 1.2 2.1
Services imports 294.5 298.1 294.1 302.1 5.5 3.6 2.5 8.0
Memo:Oil quantity (mb/d) 13.09 14.25 13.05 15.46 0.08 1.17 0.59 2.41Oil import price ($/bbl) 37.57 42.41 43.64 41.18 3.04 4.82 4.27 -2.46
1. Change from previous quarter or month. e. Average of two months.Source. U.S. Department of Commerce, Bureaus of Economic Analysis and Census.

IV-4
----------------------- BLS prices ---------------------
--------------------- NIPA prices ---------------------
Prices of U.S. Imports and Exports(Percentage change from previous period)
Annual rate Monthly rate2004 2004
Q2 Q3 Q4 Oct. Nov. Dec.
Merchandise imports 7.4 7.9 7.7 1.6 -0.2 -1.3Oil 43.2 57.1 37.3 11.3 -5.7 -11.5Non-oil 3.0 1.5 3.4 -0.1 0.9 0.5
Core goods* 4.3 2.4 4.5 0.0 1.1 0.6Cap. goods ex comp & semi 0.0 1.6 2.2 0.1 0.3 0.5Automotive products 1.4 1.7 3.2 0.4 0.2 0.2Consumer goods -0.5 -0.4 0.5 0.0 0.1 0.3Foods, feeds, beverages 7.8 3.3 10.3 1.2 0.2 1.0Industrial supplies ex oil 18.7 8.3 12.4 -0.7 4.0 1.3
Computers -8.6 -9.0 -8.5 -1.2 -0.3 -0.3Semiconductors -7.0 -4.4 -3.7 -0.9 0.2 -0.1
Merchandise exports 6.0 -0.1 3.8 0.6 0.3 0.2
Core goods* 6.6 0.6 4.9 0.7 0.4 0.2Cap. goods ex comp & semi 0.8 1.3 3.2 0.5 0.2 0.2Automotive products 1.3 0.9 1.2 0.2 0.1 0.1Consumer goods 1.1 2.3 0.7 0.0 0.1 0.3Agricultural products 17.5 -31.0 -10.7 -1.2 0.2 0.2Industrial supples ex ag 14.4 14.5 16.8 2.5 0.9 0.0
Computers 0.3 -7.6 -7.0 -0.8 -0.8 -0.2Semiconductors 2.1 -3.9 -2.2 -0.3 0.0 -0.3
Chain price indexImports of goods & services 6.4 5.1 n.a. ... ... ...
Non-oil merchandise 2.8 1.3 n.a. ... ... ...Core goods* 4.0 2.3 n.a. ... ... ...
Exports of goods & services 4.6 1.6 n.a. ... ... ...Total merchandise 5.3 1.2 n.a. ... ... ...
Core goods* 5.8 1.9 n.a. ... ... ...*/ Excludes computers and semiconductors.n.a. Not available. ... Not applicable.
5
1015
20
25
3035
40
45
5055
Spot West Texas Intermediate
Import unit value
1994 1995 1996 1997 1998 1999 2000 2001 2002 2003 2004 2005
Oil PricesDollars per barrel
IV-5
as well as in computers and semiconductors. Imports of consumer goods and foods increased, and services imports rose about 2 percent. At an annual rate, the average value of imported goods and services in October and November was almost 19 percent above the second-quarter level. A surge in oil imports fueled about half of the gain, with the remainder stemming importantly from gains in consumer goods and, to a lesser extent, capital goods. Imports of automotive products fell. Prices of Internationally Traded Goods Non-oil imports. In December, the prices of U.S. imports of non-oil goods and of core goods rose 0.5 and 0.6 percent, respectively. Within core goods, prices for every major category increased. The largest contribution came from industrial supplies, whose prices rose 1.3 percent, mostly because of higher prices for building materials and metals. For foods, feeds and beverages, prices increased 1.0 percent. Following a 0.3 percent increase in November, prices for capital goods (excluding computers and semiconductors) rose 0.5 percent. Prices for imported consumer goods, which had not increased from February through October, rose 0.3 percent in December, the second consecutive monthly increase. Import prices of computers and semiconductors declined in December. The average level of prices of imported core goods in the fourth quarter was 4.5 percent at an annual rate above the third-quarter level. The main contributions to the increase were from non-oil industrial supplies and foods. Both automotive products and, to a lesser extent, capital goods (excluding computers and semiconductors) also experienced price gains. Oil. The BLS price of imported oil fell 11.5 percent in December. The spot price of West Texas Intermediate (WTI), a light, low-sulfur crude oil, fell 10.6 percent in December—averaging about $43.30 per barrel. Since late December, the spot price has retraced much of the decline, due in part to decreased production by OPEC, supply disruptions in Norway and Canada, and increased violence in Iraq in the run-up to elections on January 30. In addition, strong world oil demand continues to provide upward pressure on prices. The spot price of WTI closed at $49.45 per barrel on January 25.

IV-6
Exports. In December, the prices of U.S. exports of total goods and of core goods both increased 0.2 percent. Much of December’s rise was due to higher prices for capital goods (excluding computers and semiconductors) and consumer goods, which increased 0.2 percent and 0.3 percent, respectively. After climbing 2.5 percent in October and 0.9 percent in November, prices for industrial supplies were unchanged in December. For both computers and semiconductors, export prices fell. The average level of prices of exported core goods in the fourth quarter was 4.9 percent at an annual rate above the third-quarter level. A large increase in prices for industrial supplies more than offset a large decline in the prices for exported agricultural products. Additional positive contributions came from both capital goods (excluding computers and semiconductors) and automotive products. Export prices for consumer goods increased slightly. U.S. International Financial Transactions Private foreign purchases of U.S. securities (line 4 of the Summary of U.S. International Transactions table) picked up sharply to $58 billion in November of last year, only a bit below the near-record monthly inflows recorded in April and June and well above the monthly average registered for the first ten months of 2004. Private inflows into U.S. securities through November amounted to $435 billion, above the $369 inflows recorded for all of 2003. The pickup in private foreign inflows in November was widespread across asset categories. Foreign private net purchases of U.S. Treasuries (line 4a) and equities (line 4d) recovered following considerable weakness since the summer. Purchases of agency bonds (line 4b) were strong for the second consecutive month; purchases in October and November accounted for nearly half of all agency bonds acquired by private foreigners through the first eleven months of 2004. Private purchases of corporate debt (line 4c) remained strong. Net foreign official inflows (line 1) slowed a bit to $20 billion in November, with sizable inflows recorded for Japan, China, and Korea offset in part by an outflow recorded for Norway. Foreign official inflows for the year through November amounted to $331 billion, compared with $245 billion recorded for 2003. Partial data from the Federal Reserve Bank of New York (FRBNY) indicate moderate further increases in

IV-7
official reserve assets in December and through mid-January, primarily reflecting further increases in holdings for China. However, the increase in China’s reserves held at FRBNY in the fourth quarter is well below the estimates that have circulated in financial markets of the increase in China’s total reserve holdings over this period. U.S. investors made large net purchases of foreign securities (line 5) in November. For the second month in row, U.S. investors primarily acquired foreign stocks (line 5a), but also made modest purchases of foreign bonds (line 5a). A series break in reported net purchases of foreign bonds makes it difficult to compare current transactions in foreign bonds with the sales recorded in previous quarters. The volatile banking sector (line 3) registered a very small net inflow in November and a cumulative outflow of $10 billion for the first eleven months of 2004. Balance of payments data indicate roughly offsetting direct investment inflows and outflows in both the second and third quarters. U.S. direct investment abroad (line 6) remained strong, in part reflecting retained earnings in advance of the partial tax holiday in effect this year. Foreign direct investment in the United States (line 7) also picked up in the third quarter. The statistical discrepancy was positive in the third quarter and for the first three quarters of 2004 taken together, indicating some combination of overreporting of the current account deficit or underreporting of net capital inflows.

IV-8
2003Q4 Q1 Q2 Q3 Oct. Nov.
Official financial flows 113.0 250.1 87.4 137.0 71.5 72.0 32.1 20.0 1. Change in foreign official assets in the U.S. (increase, +) 116.7 248.6 85.2 136.4 70.4 71.5 31.9 20.2 a. G-10 countries 30.7 114.7 46.6 96.8 46.2 20.1 1.9 1.4 b. OPEC countries -7.5 6.1 10.9 3.3 -2.1 3.2 5.1 1.4 c. All other countries 93.5 127.9 27.7 36.4 26.3 48.2 24.9 17.4 2. Change in U.S. official reserve assets (decrease, +) -3.7 1.5 2.2 .6 1.1 .4 .2 -.2
Private financial flows 457.2 295.6 81.3 1.6 93.4 81.3 … …Banks 3. Change in net foreign positions of banking offices in the U.S.1 116.8 64.7 101.8 -39.9 35.6 -27.9 20.7 1.3Securities2
4. Foreign net purchases of U.S. securities (+) 390.1 369.0 86.2 94.8 149.6 94.1 38.5 58.2 a. Treasury securities 101.5 114.0 4.4 42.9 63.2 1.0 3.7 8.2 b. Agency bonds 84.2 -10.1 1.6 1.9 33.3 5.8 15.9 17.4 c. Corporate and municipal bonds 145.7 224.7 56.6 44.2 49.5 81.8 14.7 19.5 d. Corporate stocks3 58.8 40.4 23.6 5.7 3.6 5.6 4.2 13.0 5. U.S. net acquisitions (-) of foreign securities 15.5 -90.5 -31.1 -7.1 -33.3 -20.5 -18.1 -19.7 a. Bonds 33.5 21.9 -3.9 11.9 8.3 -3.2 -4.5 -2.6 b. Stock purchases -14.8 -95.0 -24.4 -19.0 -28.9 -16.7 -13.6 -17.1 c. Stock swaps3 -3.2 -17.4 -2.8 .0 -12.7 -.6 .0 .0Other flows (quarterly data, s.a.) 6. U.S. direct investment (-) abroad -134.8 -173.8 -53.7 -47.6 -55.3 -43.5 … … 7. Foreign direct investment in U.S. 72.4 39.9 10.7 10.2 32.6 53.1 … … 8. Foreign holdings of U.S. currency 21.5 16.6 7.5 -1.8 8.8 2.6 … … 9. Other (inflow, + )4 -24.4 69.7 -40.1 -7.0 -44.6 23.4 … …U.S. current account balance (s.a.) -473.9 -530.7 -127.0 -147.2 -164.4 -164.7 … …Capital account balance (s.a.)5 -1.3 -3.1 -.3 -.4 -.3 -.4 … …Statistical discrepancy (s.a.) -95.0 -12.0 -41.4 8.9 -.2 11.8 … … NOTE. Data in lines 1 through 5 differ in timing and coverage from the balance of payments data published by the Departmentof Commerce. Details may not sum to totals because of rounding. 1. Changes in dollar-denominated positions of all depository institutions and bank holding companies plus certain transactions between broker-dealers and unaffiliated foreigners (particularly borrowing and lending under repurchase agreements). Includes changes in custody liabilities other than U.S. Treasury bills. 2. Includes commissions on securities transactions and therefore does not match exactly the data on U.S. international transactions published by the Department of Commerce. 3. Includes (4d) or represents (5c) stocks acquired through mergers. 4. Transactions by nonbanking concerns and other banking and official transactions not shown elsewhere plus amounts resulting from adjustments made by the Department of Commerce and revisions in lines 1 through 5 since publication of the quarterly data in the Survey of Current Business 5. Consists of transactions in nonproduced nonfinancial assets and capital transfers.n.a. Not available. ... Not applicable.
Summary of U.S. International Transactions(Billions of dollars, not seasonally adjusted except as noted)
200320022004

IV-9
Foreign Financial Markets The exchange value of the dollar against major foreign currencies was volatile during the intermeeting period, but ended the period little changed on a trade-weighted basis. The dollar’s bilateral moves were mixed, falling 2¼ and ½ percent against the yen and Canadian dollar, respectively, but rising 2 to 3 percent against the major European currencies. The nominal broad index of the dollar declined slightly on net. After depreciating against a broad range of currencies in the last weeks of December amid light trading conditions typical for the end of the calendar year, the dollar surprised many currency analysts in the first week of the new year by appreciating sharply. There was little consensus among market participants about the factors driving the gains in the dollar. Following the release of the December FOMC minutes and stronger-than-expected U.S. factory orders data, discussions centered on expected further increases in U.S. short-term interest rates and the relative strength of the U.S. economic outlook vis-à-vis Europe and Japan as positive factors for the dollar. However, the release of the much larger-than-expected U.S. trade deficit for November prompted a pause in the reported dominance of these factors in shaping market sentiment and at least temporarily halted the prevailing upward trend in the dollar. Comments by Treasury Secretary Snow in mid-January, which were initially interpreted as signaling an increased willingness by the
96
98
100
102
104
106
108
Daily
Major currencies
Broad
Other importanttrading partners
Oct Nov Dec Jan
FOMCDec.
Exchange Value of the DollarDecember 14, 2004 = 100

IV-10
Administration to engage in intervention operations, prompted the dollar to appreciate briefly. However the dollar subsequently more than reversed these gains after Secretary Snow corrected this interpretation and reiterated the government’s belief in the free market determination of exchange rates. The dollar was supported late in the period, in part, by comments by Federal Reserve officials which market participants interpreted as implying a somewhat faster rate of interest rate increases in the United States. The dollar’s relative weakness against the yen and Canadian dollar were due in part to currency-specific factors. The yen was supported early and again late in the period by evidence of strengthening capital expenditures by Japanese firms. The yen was also marginally supported against the dollar following comments by a high ranking ECB official who suggested that the euro had already adjusted fully against the dollar and that any further correction in the latter currency’s exchange value should be borne by Asian currencies. The Canadian dollar was supported against the dollar by news of stronger-than-expected Canadian job growth and an unexpected increase in the Canadian trade surplus for November. As had been widely expected, policymakers at the Bank of Canada decided to leave their policy rate unchanged at 2.5 percent on January 25.
Financial Indicators in Major Industrial Countries
Three-month rate Ten-year yield EquitiesPercentage Percentage
Jan. 26 point Jan. 26 point percentCountry (Percent) change (Percent) change change
Canada 2.54 .02 4.23 -.06 1.28
Japan .08 .00 1.34 -.02 4.12
Euro area 2.14 -.03 3.57 -.04 2.20
United Kingdom 4.79 .01 4.60 .09 2.81
Switzerland .70 -.02 2.24 .05 2.91
Australia 5.44 .03 5.36 .16 3.04
United States 2.66 .20 4.20 .06 -2.47
Memo:Weighted-averageforeign 1.94 -.01 3.64 -.05 n.a.
NOTE. Change is from December 13/14 to January 26 (10 a.m. EDT). n.a. Not available.

IV-11
Policy makers in the euro area and the United Kingdom also left their respective policy rates unchanged in decisions this period and Japan did not change its target range for reserves. Net movements in foreign-currency short-term interest rates were correspondingly small, as were movements in most foreign industrial economy benchmark government bond yields. Expectations for future monetary policy in Europe and Japan changed little on net, and continue to suggest little likelihood of policy tightening at least through the first half of 2005, and measures of inflation expectations in these currency regions remain low. Major equity indexes in Europe saw modest gains while Japanese equity prices outperformed global markets, led by price gains in shares of machinery and real estate firms. The rise in oil prices had little reported effect on foreign equity prices and implied volatilities on equity indexes remain at historical lows. On balance, the index of the dollar’s value against our other important trading partners fell about ¾ percent this period. The dollar depreciated a further 2½ and 2 percent, respectively, against the Korean won and Taiwan dollar despite reports of heightened dollar purchases by monetary authorities in these countries. The expected amount of appreciation of the Chinese reminbi against the dollar over the next twelve months implied by forward contracts fluctuated during the period amid conflicting statements by Chinese officials regarding the timing of a potential change in China’s currency peg. At the end of the period, these rates implied a 5 percent appreciation in the currency. The tsunamis in the Indian Ocean had little discernable effect on asset valuations in Indonesia and Thailand, where stock markets registered net gains of about 10 percent. Indeed, the currencies of these countries have appreciated modestly against the dollar since the December FOMC meeting, supported in part by the inflow of financial aid following the disaster. In Latin America, the Brazil real appreciated over 3 percent against the dollar on net. The central bank of Brazil increased its policy rate a total of 100 basis points in two decisions on December 15 and January 19. Equity prices in Brazil and Mexico saw their first substantial declines in several months as U.S. markets declined in early January. Although the Mexican stock market quickly more than reversed those losses, the Brazilian equity market did not and ended the intermeeting period 3 percent lower on net.

IV-12
Financial Indicators in Latin America, Asia, and Russia
Currency/ Short-term Dollar-denominated Equity US dollar interest rates1 bond spread2 prices
Percentage PercentagePercent Jan.25/26 point Jan.25/26 point Percent
Economy Jan. 26 change (Percent) change (Percent) change change
Mexico 11.26 -.29 8.70 .06 1.65 -.08 5.15
Brazil 2.68 -3.24 18.20 .77 4.13 .03 -2.76
Argentina 2.92 -1.65 n.a. n.a. 51.97 -.56 6.67
Chile 585.05 .35 2.92 .49 .54 -.02 -2.31
China 8.28 .00 n.a. n.a. .58 .03 -5.02
Korea 1031.45 -2.51 3.50 .15 ... ... 9.14
Taiwan 31.87 -1.92 1.38 .03 ... ... -1.26
Singapore 1.63 -1.04 1.63 .31 ... ... 4.83
Hong Kong 7.80 .29 .63 .21 ... ... -2.99
Malaysia 3.80 -.01 2.80 -.01 .44 -.02 2.94
Thailand 38.50 -2.61 2.32 .42 .48 -.10 8.76
Indonesia 9145.00 -1.72 7.42 .00 .83 -.15 12.52
Philippines 55.25 -1.65 6.25 -.81 4.35 -.31 10.96
Russia 28.02 .20 n.a. n.a. 2.09 -.18 10.88
NOTE. Change is from December 13/14 to January 25/26.1. One month interbank interest rate, except Chile: 30-day deposit rate; Korea: 1-week call rate.
No reliable short-term interest rates exist for China or Russia.2. Spread over similar maturity U.S. Treasury security yield. Mexico, Brazil, Argentina, Korea,
the Philippines and Russia: EMBI+ yield. Chile and China: Global bond yield. Malaysia: Eurobondyield. Thailand and Indonesia: Yankee bond yield. Taiwan, Singapore, and Hong Kong do not haveoutstanding sovereign bonds denominated in dollars.
n.a. Not available. ... Not applicable.

IV-13
Developments in Foreign Industrial Countries Indicators of economic activity in the major foreign industrial economies generally remained soft in the fourth quarter. While labor conditions continued to improve gradually in Japan, measures of industrial production, business confidence and household expenditures have all fallen. Euro-area data on balance remained sluggish: the latest readings on overall industrial production and retail sales in the euro area have both declined. Fourth-quarter GDP in the United Kingdom expanded strongly, with a brisk rise in the service sector. Likewise, indicators of Canadian domestic demand remained robust, but exports continued to slide, and GDP by industry was unchanged again in October. Headline rates of consumer price inflation finished the fourth quarter up a tad in the euro area and the United Kingdom, but down a bit in Canada. Inflation remains a bit above the ECB ceiling rate in the euro area. Deflation in Japanese core consumer prices increased slightly. In Japan, recent readings on economic activity have been weak. On average, industrial production for October and November was down 0.6 percent from the third-quarter level, depressed by weakness in electronics-related sectors. The all-industries index of output rebounded in November, but remained on track for a decline in the fourth quarter. Household expenditures were down nearly 2 percent in October and November on average compared with the third-quarter average, and new car registrations in the fourth quarter were roughly flat. Real exports were about flat in the fourth quarter, but imports increased, implying another negative contribution to growth from net exports. In particular, imports of vegetables rose markedly following a series of typhoons in Japan. On a more promising note, core machinery orders, a leading indicator of business investment, surged nearly 20 percent in November from the previous month, following several months of declines. The Bank of Japan’s Tankan index of business conditions posted a slight decline in December, with the level of the aggregate diffusion index for business sentiment among firms of all sizes and across all industries slipping to 1 from 2 in September. Survey respondents project a further decline in the index, to -3, for March. The index for large manufacturers decreased to 22, from 26 in September, marking the first fall in two years.

IV-14
Labor market conditions continued their gradual improvement, but deflation worsened a little. The unemployment rate declined to 4.5 percent in November, although employment fell. The job-offers-to-applicants ratio, a leading indicator of employment, rose to a fresh twelve-year high. Average nominal wages continued to fall through November, dragged down by an increase in the share of part-time workers in the workforce. Core consumer goods prices in the Tokyo area (which exclude fresh food but include energy) ticked down in December from the previous month and were down 0.4 percent from a year earlier. Wholesale price inflation eased a little in December.
Japanese Economic Indicators (Percent change from previous period except as noted, s.a.)
2004 Indicator
Q2 Q3 Q4 Sep. Oct. Nov. Dec.
Industrial production1 2.7 -.7 n.a. -.4 -1.3 1.7 n.a. All-industries index 1.8 -.2 n.a. .1 -.3 .3 n.a. Housing starts -4.4 6.1 n.a. 7.3 -5.3 -5.3 n.a. Machinery orders2 10.3 -8.4 n.a. -1.9 -3.1 19.9 n.a. Machinery shipments3 4.3 -1.6 n.a. .2 -.7 1.7 n.a. New car registrations -8.4 8.6 .2 2.1 -4.7 5.5 -.8 Unemployment rate4 4.6 4.8 n.a. 4.6 4.7 4.5 n.a. Job offers ratio5 .80 .83 n.a. .84 .88 .92 n.a. Business sentiment6 .0 2.0 1.0 . . . . . . . . . . . . CPI (core, Tokyo area)7 -.1 -.1 -.3 -.1 -.3 -.3 -.4 Wholesale prices7 1.0 1.7 2.0 1.8 2.0 2.0 1.9
1. Mining and manufacturing. 2. Private sector, excluding ships and electric power. 3. Excluding ships and railway vehicles. 4. Percent. 5. Level of indicator. 6. Tankan survey, diffusion index. 7. Percent change from year earlier, n.s.a. n.a. Not available. . . . Not applicable.
Japan’s Cabinet approved the fiscal budget for FY2005 (April 2005-March 2006) in late December. Expenditures will rise slightly relative to FY2004’s initial budget. Additional expenditures on social security and a 5 percent rise in debt-servicing costs will be largely offset by cuts in most other categories, including public works spending, which is slated to decline 3.6 percent. Tax revenues are projected to rise 5.4 percent, on the back of a recovering economy and the phasing out of past tax cuts, marking the first increase in tax revenues in four years. The budget will require ¥34.2 trillion in new bond issuance for

IV-15
FY2005, about ¥2.2 trillion less than in FY2004. All told, fiscal policy is expected to have a somewhat contractionary effect on GDP this year. Incoming data for the euro area appear to signal a limited pickup in growth from the third quarter. French consumption of manufactured products rose in both October and November to a level roughly 2 percent above the September level, consistent with a resurgence in household demand in the fourth quarter after the third quarter’s decline. German economic activity remained weak: based on an official preliminary estimate of 2004 annual GDP growth, German GDP in the fourth quarter appears to have grown at a 0.6 percent annual rate, only slightly above the 0.4 percent rate in the third quarter. GDP expenditure components are not yet available, but merchandise export data suggest renewed German export growth after the third quarter’s decline.
Euro-Area Economic Indicators (Percent change from previous period except as noted, s.a.)
2004 Indicator
Q2 Q3 Q4 Sep. Oct. Nov. Dec.
Industrial production1 1.0 .2 n.a. .7 -.6 -.5 n.a. Retail sales volume2 -.1 -.2 n.a. -.1 .4 -.0 n.a. Unemployment rate3 8.9 8.9 n.a. 8.9 8.9 8.9 n.a. Consumer confidence4 -14.7 -13.7 -13.3 -13.0 -14.0 -13.0 -13.0 Industrial confidence4 -4.7 -3.7 -3.3 -3.0 -3.0 -3.0 -4.0 Manufacturing orders, Germany 1.9 -.2 n.a. .7 1.0 -2.4 n.a. CPI5 2.3 2.2 2.3 2.1 2.4 2.2 2.4 Producer prices5 2.0 3.1 n.a. 3.3 4.0 3.6 n.a. M35 5.3 6.0 n.a. 6.0 5.8 6.0 n.a.
1. Excludes construction. 2. Excludes motor vehicles. 3. Percent. Euro-area standardized to ILO definition. Includes Eurostat estimates in some cases. 4. Diffusion index based on European Commission surveys in individual countries. 5. Eurostat harmonized definition. Percent change from year earlier. n.a. Not available.
The preliminary estimate of twelve-month consumer price inflation in the euro area rose to 2.4 percent in December. The ECB measure of twelve-month core inflation, excluding energy and unprocessed foods, rose back to 2 percent in December. Labor market conditions remained weak in the euro area, with the unemployment rate unchanged at 8.9 percent in November. The harmonized unemployment rate in Germany rose to 10 percent in December.

IV-16
Real GDP in the United Kingdom rose a much higher-than-expected 3 percent (s.a.a.r.) in the fourth quarter, according to the preliminary estimate. In contrast, industrial production is estimated to have fallen nearly 2½ percent. A fall in oil and gas extraction was mainly responsible for the contraction in production. The service sector, which accounts for around 72 percent of the economy, grew more than 3½ percent in the fourth quarter. Construction expanded just over 3 percent. Increases in house prices slowed sharply over the last several months of 2004, with house prices remaining almost flat over the fourth quarter. Household net mortgage borrowing in November fell about 8 percent from its October level and is now about 20 percent below its 2003 peak.
U.K. Economic Indicators (Percent change from previous period except as noted, s.a.)
2004 Indicator
Q2 Q3 Q4 Sep. Oct. Nov. Dec. Real GDP* 3.5 1.8 3.0 … … … … Industrial production 1.1 -1.3 n.a. -.3 -.2 .2 n.a. Retail sales volume1 2.0 .9 .4 1.0 -.6 .6 -1.0 Unemployment rate2 Claims-based 2.8 2.7 2.7 2.7 2.7 2.7 2.7 Labor force survey3 4.8 4.7 n.a. 4.7 4.7 n.a. n.a. Business confidence4 16.3 12.3 4.3 12.0 14.0 5.0 -6.0 Consumer confidence5 -4.3 -4.0 -.7 -3.0 -2.0 .0 .0 Consumer prices6 1.4 1.2 1.4 1.1 1.2 1.5 1.6 Producer input prices7 3.9 5.6 6.3 7.8 8.9 6.7 3.4 Average earnings7 4.2 3.8 n.a. 3.9 4.2 4.4 n.a.
* Preliminary estimate (s.a.a.r.) 1. Excludes motor vehicles. 2. Percent. 3. Three-month average centered on month shown. 4. Percentage of firms expecting output to increase in the next four months less percentage expecting output to decrease. 5. Average of the percentage balance from consumers’ expectations of their financial situation, general economic situation, unemployment, and savings over the next 12 months. 6. Consumer prices index (CPI), percent change from year earlier. 7. Percent change from year earlier. n.a. Not available. . . . Not applicable.
The labor market continued to be tight; the official-claims-based measure of the unemployment rate remained near its lowest point since 1975, and the labor-force-survey

IV-17
measure stayed near its all-time low. The twelve-month rate of consumer price inflation edged up in December, but stayed below the Bank of England’s 2 percent target. In Canada, external demand continued to weaken in the fourth quarter. In November, merchandise exports fell for the fifth consecutive month, and import growth paused following strong gains the previous several months. The manufacturing sector, which is heavily export-oriented, has seen a mixed performance, with shipments up but new orders down in November. Weakness in manufacturing was a leading cause of the zero growth in GDP by industry recorded in October. The sector may have rebounded somewhat in December, however, as a leading indicator of new orders jumped 1 percent, the largest rise in this indicator in six months.
Canadian Economic Indicators (Percent change from previous period except as noted, s.a.)
2004 Indicator
Q2 Q3 Q4 Sep. Oct. Nov. Dec.
GDP by industry 1.0 1.0 n.a. .0 .0 n.a. n.a.Industrial production 1.3 1.5 n.a. -.3 -.2 n.a. n.a.New manufacturing orders 5.1 1.4 n.a. -.8 -.3 -.5 n.a.Retail sales .6 1.6 n.a. .5 .7 -.4 n.a.Employment .5 .3 .5 .3 .2 .0 .2 Unemployment rate1 7.3 7.2 7.1 7.1 7.1 7.3 7.0 Consumer prices2 2.2 2.0 2.3 1.8 2.3 2.4 2.1 Core consumer prices2,3 1.7 1.7 1.5 1.5 1.5 1.5 1.5 Consumer attitudes (1991 = 100) 115.5 123.0 123.7 . . . . . . . . . . . .Business confidence (1991 = 100) 145.6 151.4 n.a. . . . . . . . . . . . .
1. Percent. 2. Percent change from year earlier, n.s.a. 3. Excluding the 8 most volatile components (fruits, vegetables, gasoline, fuel oil, natural gas, mortgage interest, inter-city transportation and tobacco). n.a. Not available. . . . Not applicable.
In contrast, domestic demand seems to have remained healthy throughout the fourth quarter. Housing starts in December continued their year-long vigor, marking 2004 as the strongest year for new home construction since 1987. Although retail sales slipped a bit in November, the dip came on the heels of a blistering advance in October, as gains in personal income supported consumer spending through much of 2004. The composite index of leading indicators turned up 0.2 percent in December, after being unchanged in November, which had marked the end of a four-month deceleration in the indicator.

IV-18
The labor market rebounded in December, after a dip in November, as total employment posted a strong gain, and the unemployment rate fell to 7 percent, its lowest point since May 2001. In 2004, total employment grew 1.4 percent, with most of the gains in full-time employment. In December, the twelve-month rate of headline CPI inflation dipped, as gasoline prices continued to decline. The twelve-month rate of core inflation, excluding the eight most volatile components, held steady at 1.5 percent in December.

IV-19
External Balances
(Billions of U.S. dollars, s.a.a.r.)
2004 Country and balance
Q2 Q3 Q4 Oct. Nov. Dec.
Japan Trade 116.5 102.7 105.7 93.9 113.3 109.8 Current account 171.7 167.9 n.a. 150.2 158.9 n.a.
Euro area Trade 112.4 64.4 n.a. 48.6 47.3 n.a. Current account 73.5 18.1 n.a. 21.0 6.2 n.a. Germany Trade 199.5 180.2 n.a. 186.0 182.6 n.a. Current account 126.2 40.3 n.a. 98.9 132.3 n.a. France Trade -.8 -2.5 n.a. -4.2 -2.6 n.a. Current account -.4 -1.1 n.a. -2.8 -.7 n.a. Italy Trade 1.2 -.1 n.a. -11.5 -2.7 n.a. Current account1 -30.0 21.1 n.a. 14.9 -31.7 n.a.
United Kingdom Trade -104.9 -106.8 n.a. -109.3 -102.5 n.a. Current account -42.0 -63.8 n.a. . . . . . . . . .
Canada Trade 55.6 51.0 n.a. 50.1 73.2 n.a. Current account 32.9 28.7 n.a. . . . . . . . . .
1. Not seasonally adjusted. n.a. Not available. . . . Not applicable.

IV-20
Consumer Price Inflation in Selected Industrial Countries(12-month change)
1997 1998 1999 2000 2001 2002 2003 2004-2
-1
0
1
2
3
4
5
JapanPercent
1997 1998 1999 2000 2001 2002 2003 2004-2
-1
0
1
2
3
4
5
FrancePercent
1997 1998 1999 2000 2001 2002 2003 2004-2
-1
0
1
2
3
4
5
ItalyPercent
1997 1998 1999 2000 2001 2002 2003 2004-2
-1
0
1
2
3
4
5
GermanyPercent
1997 1998 1999 2000 2001 2002 2003 2004-2
-1
0
1
2
3
4
5
United KingdomPercent
1997 1998 1999 2000 2001 2002 2003 2004-2
-1
0
1
2
3
4
5
CanadaPercent

IV-21
Industrial Production in Selected Industrial Countries
1997 1998 1999 2000 2001 2002 2003 200480
90
100
110
120
1301997=100Japan
1997 1998 1999 2000 2001 2002 2003 200480
90
100
110
120
130France
1997 1998 1999 2000 2001 2002 2003 200480
90
100
110
120
130Italy
1997 1998 1999 2000 2001 2002 2003 200480
90
100
110
120
1301997=100Germany
1997 1998 1999 2000 2001 2002 2003 200480
90
100
110
120
130United Kingdom
1997 1998 1999 2000 2001 2002 2003 200480
90
100
110
120
130Canada

IV-22
Economic Situation in Other Countries After having slowed in the past few quarters, incoming data on economic activity in the fourth quarter suggest that real GDP growth edged up in Latin America and emerging Asia on average. Consumer price inflation in many emerging market economies rose last year, partly due to higher oil prices. The Chinese economy continues to expand at a robust pace. Real GDP grew 11.2 percent (s.a.a.r.) in the fourth quarter, despite a steep fall in investment spending (staff estimate), as retail sales growth remained strong and the trade surplus widened. Twelve-month consumer price inflation dropped sharply to 3.2 percent in the fourth quarter, reflecting continued declines in food prices.
Chinese Economic Indicators (Percent change from previous period, s.a., except as noted)
2004 Indicator 2003 2004
Q3 Q4 Oct. Nov. Dec.
Real GDP1 10.0 9.5 10.1 11.2 … … … Industrial production 18.6 14.5 2.9 3.6 1.6 .7 .9 Consumer prices1 3.2 2.4 5.3 3.2 4.3 2.8 2.4 Trade balance2 25.5 31.9 44.1 67.2 25.9 89.4 86.4
1. Annual rate. Quarterly data estimated by staff from reported four-quarter growth rates. Annual data are Q4/Q4. 2. Billions of U.S. dollars, annual rate. Imports are c.i.f. . . . Not applicable.
Indicators for Hong Kong suggest continued rapid growth, with improvement in both external and domestic demand. Retail sales were up 3½ percent in October and November from the third-quarter level, and the trade deficit narrowed sharply over the same period owing to a surge in exports. The twelve-month change in the CPI remained slightly positive in December.

IV-23
Hong Kong Economic Indicators (Percent change from previous period, s.a., except as noted)
2004 Indicator 2003 2004
Q3 Q4 Oct. Nov. Dec.
Real GDP1 4.7 n.a. 7.8 n.a. … … … Unemployment rate2 7.9 6.9 6.8 6.5 6.7 6.7 6.5 Consumer prices3 -1.9 -.2 .8 .2 .2 .2 .2 Trade balance4 -8.5 n.a. -13.4 n.a. -7.5 -6.9 n.a.
1. Annual rate. Annual data are Q4/Q4. 2. Percent. Monthly data are averages of the current and previous two months. 3. Percent change from year-earlier period, except annual data, which are Dec./Dec. 4. Billions of U.S. dollars, annual rate. Imports are c.i.f. n.a. Not available. . . . Not applicable.
In Taiwan, both production and exports fell in the fourth quarter. However, forward-looking indicators are more positive, as orders for high-tech exports hit a new high in the fourth quarter. In addition, strong gains in imports of both consumer and capital goods suggest that domestic demand remained robust in the fourth quarter. Twelve-month consumer price inflation stayed around 1½ percent in December.
Taiwan Economic Indicators (Percent change from previous period, s.a., except as noted)
2004 Indicator 2003 2004
Q3 Q4 Oct. Nov. Dec.
Real GDP1 5.5 n.a. 4.5 n.a. … … … Unemployment rate2 5.0 4.5 4.4 4.2 4.2 4.2 4.2 Industrial production 7.1 9.8 -.2 -.8 -.4 -.4 -.9 Consumer prices3 -.1 1.6 2.9 1.8 2.4 1.5 1.6 Trade balance4 16.9 6.1 11.5 -7.0 -2.3 -2.6 -16.2 Current account5 29.3 n.a. 21.3 n.a. … … …
1. Annual rate. Annual data are Q4/Q4. 2. Percent. 3. Percent change from year-earlier period, except annual data, which are Dec./Dec. 4. Billions of U.S. dollars, annual rate. Imports are c.i.f. 5. Billions of U.S. dollars, n.s.a., annual rate. n.a. Not available. . . . Not applicable.
Incoming indicators for economic activity in Korea suggest that growth will remain subdued in the fourth quarter and heavily dependent on external demand. Both production and exports were up in October and November relative to the third quarter, but retail sales fell and both consumer and business sentiment remained weak. Activity

IV-24
in the service sector also has continued to contract. Twelve-month consumer price inflation dropped to 3 percent in December from November’s 3.3 percent, the lowest rate since last March, largely as a result of lower fuel price inflation. The Bank of Korea decided to keep interest rates constant at its meeting on January 13, noting that domestic demand remains sluggish while export growth is steady.
Korean Economic Indicators (Percent change from previous period, s.a., except as noted)
2004 Indicator 2003 2004
Q3 Q4 Oct. Nov. Dec.
Real GDP1 4.1 n.a. 2.6 n.a. … … … Industrial production 5.0 n.a. -.1 n.a. -.9 2.2 n.a. Unemployment rate2 3.4 3.5 3.6 3.5 3.5 3.5 3.6 Consumer prices3 3.4 3.0 4.3 3.4 3.8 3.3 3.0 Trade balance4 22.0 n.a. 42.4 n.a. 27.5 42.6 n.a. Current account5 11.9 n.a. 28.4 n.a. 28.8 35.3 n.a.
1. Annual rate. Annual data are Q4/Q4. 2. Percent. 3. Percent change from year-earlier period, except annual data, which are Dec./Dec. 4. Billions of U.S. dollars, annual rate. Imports are c.i.f. 5. Billions of U.S. dollars, n.s.a., annual rate. n.a. Not available. . . . Not applicable.
In the ASEAN region, recent performance has been mixed. In Singapore, industrial production expanded 6.6 percent in the fourth quarter. The strong fourth quarter performance was driven by a surge in the volatile biomedical production in December. In Malaysia, where anecdotal evidence suggests that fourth-quarter domestic demand was relatively strong, industrial production was also up. Elsewhere in the region, average production fell in the most recent months available. Trade data indicate that the ASEAN economies as a whole continued to run a trade surplus in the final months of last year, although country-specific surpluses, with the exception of Singapore, have recently been declining, as weak global demand for high-tech products appears to have been weighing down on export growth. Consumer price inflation remains elevated across the region relative to 2003. Nonetheless, the monetary authorities have been reluctant to increase interest rates, so as to avoid dampening domestic demand. The exception is in Thailand where the central bank increased its benchmark interest rate 25 basis points to 2 percent in December, the third rate increase since August 2004.

IV-25
On December 26, an earthquake off of the coast of Indonesia generated a massive tsunami that killed over 200,000 people in the region. While the ultimate economic effect of this disaster is not yet fully known, it is generally expected that it will have a small impact for several reasons. First, very few industrial plants in the ASEAN countries were affected. Second, although the human toll is large in absolute terms, as a percent of the countries’ aggregate population, it is not particularly large. Third, the negative effects of the disaster itself will be tempered by reconstruction activity and disaster financing relief.
ASEAN Economic Indicators: Growth (Percent change from previous period, s.a., except as noted)
2004 Indicator 2003 2004
Q3 Q4 Oct. Nov. Dec.
Real GDP1 Indonesia 4.2 n.a. 5.2 n.a. … … … Malaysia 6.6 n.a. 2.5 n.a. … … … Philippines 4.8 n.a. 5.9 n.a. … … … Singapore 4.9 n.a. -3.0 n.a. … … … Thailand 7.7 n.a. 6.9 n.a. … … …
Industrial production2 Indonesia3 3.9 n.a. -1.5 n.a. 11.0 -17.6 n.a. Malaysia 9.3 n.a. -.3 n.a. -.9 3.2 n.a. Philippines .0 n.a. 1.4 n.a. -3.6 1.6 n.a. Singapore 3.0 13.9 -1.0 6.6 4.2 -5.2 19.5 Thailand 12.3 n.a. .4 n.a. -.3 -.2 n.a.
1. Annual rate. Annual data are Q4/Q4. 2. Annual data are annual averages. 3. Staff estimate. n.a. Not available. . . . Not applicable.

IV-26
ASEAN Economic Indicators: Trade Balance (Billions of U.S. dollars, s.a.a.r.)
2004 Indicator 2003 2004
Q3 Q4 Oct. Nov. Dec.
Indonesia 28.5 n.a. 26.5 n.a. 28.0 22.2 n.a. Malaysia 21.4 n.a. 23.8 n.a. 24.4 17.3 n.a. Philippines -1.3 n.a. -.1 n.a. -1.6 1.9 n.a. Singapore 16.2 16.1 16.5 18.3 14.7 8.1 32.2 Thailand 3.8 n.a. 1.2 n.a. 8.7 1.2 n.a.
n.a. Not available.
ASEAN Economic Indicators: CPI Inflation (Percent change from year earlier, except as noted)
2004 Indicator 20031 20041
Q3 Q4 Oct. Nov. Dec.
Indonesia 5.2 6.4 6.7 6.3 6.2 6.2 6.4 Malaysia 1.2 2.1 1.5 2.1 2.1 2.2 2.1 Philippines 3.1 7.9 6.4 7.5 7.1 7.6 7.9 Singapore .8 1.5 1.7 1.7 2.0 1.8 1.5 Thailand 1.8 2.9 3.3 3.1 3.5 3.0 2.9
1. Dec./Dec. In Mexico, recent data releases suggest some pickup in economic activity after a soft performance in the third quarter. Industrial production edged up in November, and manufacturing exports registered a solid performance in recent months as a result of growing demand from the United States. Indicators of consumption and investment spending have continued to be strong, with a boom in consumer credit fueling retail sales. High oil revenues have continued to allow government spending to provide a significant stimulus to the economy. In an unexpected move intended to moderate inflation expectations at a key round of year-end salary negotiations, in mid-December the Bank of Mexico tightened policy for the ninth time during 2004. Consumer prices stood at 5.2 percent for year-end 2004, outside the upper limit of the 2 to 4 percent inflation target, as a result of high food and energy prices. However, inflation in December edged down compared with November, and it appears to have begun to trend downwards as some food prices have begun to fall. In a further effort to cut prices, the government announced in December that it would

IV-27
reduce the price of some regulated goods, such as domestic gas and electricity, and slash import tariffs on machinery and industrial equipment.
Mexican Economic Indicators (Percent change from previous period, s.a., except as noted)
2004 Indicator 2003 2004
Q3 Q4 Oct. Nov. Dec.
Real GDP1 2.0 n.a. 2.6 n.a. … … … Overall economic activity 1.4 n.a. .9 n.a. .8 .5 n.a. Industrial production -.7 n.a. .6 n.a. .1 .2 n.a. Unemployment rate2 3.3 3.8 3.8 3.7 3.5 3.7 3.8 Consumer prices3 4.0 5.2 4.8 5.3 5.4 5.4 5.2 Trade balance4 -5.6 -8.1 -9.4 -11.5 -7.9 -12.4 -14.1 Imports4 170.5 197.2 200.5 207.6 203.1 211.1 208.7 Exports4 164.9 189.1 191.1 196.2 195.2 198.7 194.7 Current account5 -8.7 n.a. -8.5 n.a. … … …
1. Annual rate. Annual data are Q4/Q4. 2. Percent; counts as unemployed those working one hour a week or less. 3. Percent change from year-earlier period, except annual data, which are Dec./Dec. 4. Billions of U.S. dollars, annual rate. 5. Billions of U.S. dollars, n.s.a., annual rate. n.a. Not available. . . . Not applicable.
In Brazil, data releases since the last Greenbook have pointed to a continued slowdown in economic activity over the fourth quarter from the robust growth seen over the first half of 2004. Industrial production, which had peaked in August, declined 0.4 percent in November. Some analysts nonetheless predict a rebound in industrial output in December, pointing in part to robust December vehicle sales, which were up 20 percent on a twelve-month basis. Inflation has been a major concern. December headline consumer price inflation was 0.8 percent (s.a.), bringing the twelve-month increase to 7.6 percent, well above the central bank’s 5.1 percent target for 2005. A rise in inflation in recent months reflects, in part, hikes in domestic prices of fuel in October and November by Petrobras, the government-controlled oil firm, which had last raised prices in June. Nevertheless, core inflation, which excludes energy and other administered prices and food, has also been edging up, and ended 2004 at 7½ percent on a twelve-month basis. As expected, the central bank on January 19 raised its policy rate 50 basis points for the fifth consecutive

IV-28
month, to 18¼ percent. The policy rate is up 225 basis points since the central bank began tightening in September.
Brazilian Economic Indicators (Percent change from previous period, s.a., except as noted)
2004 Indicator 2003 2004
Q3 Q4 Oct. Nov. Dec.
Real GDP1 .8 n.a. 4.2 n.a. … … … Industrial production .1 n.a. 2.4 n.a. .0 -.4 n.a. Unemployment rate2 12.4 11.5 11.2 11.3 10.9 11.4 11.5 Consumer prices3 9.3 7.6 6.9 7.2 6.9 7.2 7.6 Trade balance4 24.8 33.7 35.7 34.0 30.9 32.1 38.9 Current account5 4.0 n.a. 21.3 7.9 12.1 -2.9 14.5
1. Annual rate. Annual data are Q4/Q4. 2. Percent; break in October 2001 as a result of change in methodology. 3. Percent change from year-earlier period, except annual data, which are Dec./Dec. Price index is IPC-A. 4. Billions of U.S. dollars, annual rate. 5. Billions of U.S. dollars, n.s.a., annual rate. n.a. Not available. . . . Not applicable.
In Argentina, the economic recovery picked up steam in the third quarter, with real GDP growing at an annual rate of 12 percent, following a weak second quarter. Fourth-quarter indicators are consistent with continued strong growth, although at a more moderate pace. Industrial production in the fourth quarter was more than 2 percent above its third-quarter level, slightly less than its Q3 pace of increase. The trade surplus was nearly $13 billion in November; nominal exports have recently been supported by higher commodities prices. December consumer price inflation was 2.0 percent (s.a.) at a monthly rate, bringing the twelve-month increase to 6.2 percent, just below the central bank’s 2004 projection band of 7 to 11 percent. After more than three years in default, the Argentine government launched its debt swap on January 14 with the goal of restructuring $82 billion in defaulted bonds. The swap offer will remain open until February 25. The government reached a prior agreement with local pension funds to restructure the defaulted paper they hold, ensuring a minimum acceptance of some 17 percent.
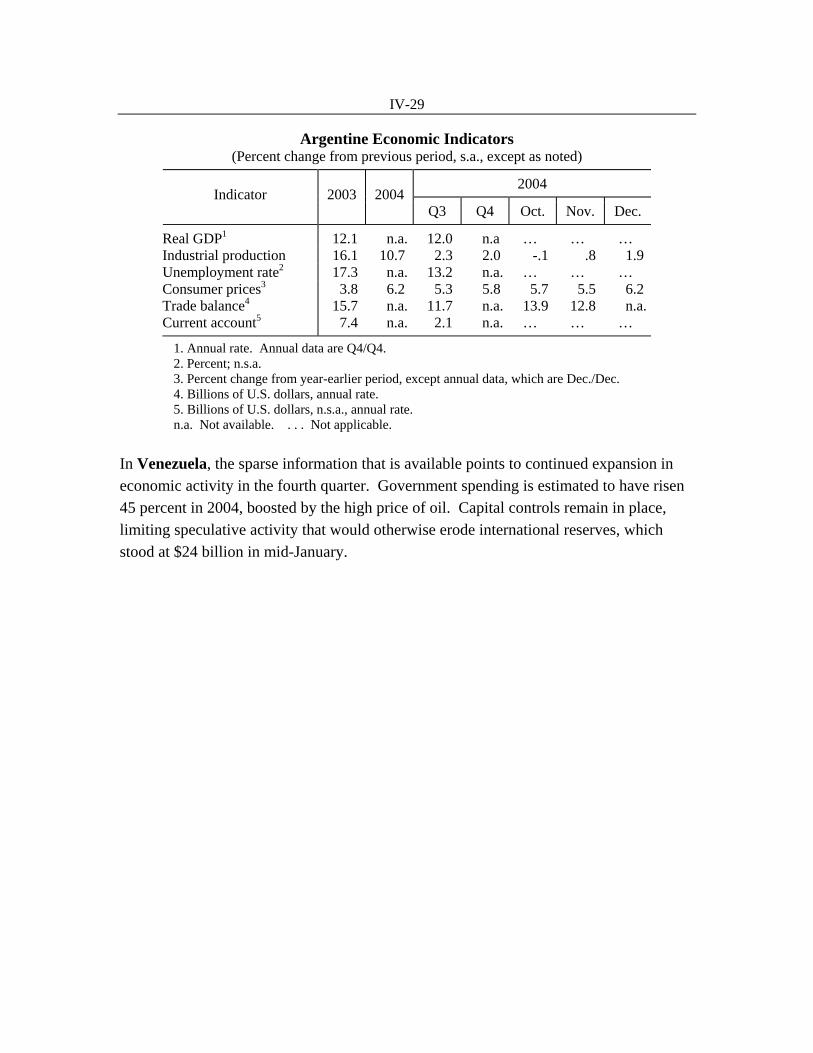
IV-29
Argentine Economic Indicators (Percent change from previous period, s.a., except as noted)
2004 Indicator 2003 2004
Q3 Q4 Oct. Nov. Dec.
Real GDP1 12.1 n.a. 12.0 n.a … … … Industrial production 16.1 10.7 2.3 2.0 -.1 .8 1.9 Unemployment rate2 17.3 n.a. 13.2 n.a. … … … Consumer prices3 3.8 6.2 5.3 5.8 5.7 5.5 6.2 Trade balance4 15.7 n.a. 11.7 n.a. 13.9 12.8 n.a. Current account5 7.4 n.a. 2.1 n.a. … … …
1. Annual rate. Annual data are Q4/Q4. 2. Percent; n.s.a. 3. Percent change from year-earlier period, except annual data, which are Dec./Dec. 4. Billions of U.S. dollars, annual rate. 5. Billions of U.S. dollars, n.s.a., annual rate. n.a. Not available. . . . Not applicable.
In Venezuela, the sparse information that is available points to continued expansion in economic activity in the fourth quarter. Government spending is estimated to have risen 45 percent in 2004, boosted by the high price of oil. Capital controls remain in place, limiting speculative activity that would otherwise erode international reserves, which stood at $24 billion in mid-January.

IV-30
Venezuelan Economic Indicators (Percent change from previous period, s.a., except as noted)
2004 Indicator 2003 2004
Q3 Q4 Oct. Nov. Dec.
Real GDP1 7.0 n.a. -.8 n.a. … … … Unemployment rate2 18.0 15.1 14.5 14.1 14.3 14.7 13.2 Consumer prices3 27.1 19.2 21.5 19.5 19.7 19.5 19.2 Non-oil trade balance4 -5.5 n.a. 23.7 n.a. n.a. n.a. n.a. Trade balance4 16.5 n.a. 53.5 n.a. n.a. n.a. n.a. Current account5 11.5 n.a. 16.4 n.a. … … …
1. Annual rate. Annual data are Q4/Q4. 2. Percent. 3. Percent change from year-earlier period, except annual data, which are Dec./Dec. 4. Billions of U.S. dollars, annual rate. 5. Billions of U.S. dollars, n.s.a., annual rate. n.a. Not available. . . . Not applicable.
In Russia, real GDP slid ½ percent in the third quarter, as the strong contribution by exports was not enough to offset surging imports and declining investment. While November indicators of economic activity were quite strong across a range of sectors, industrial production was flat in December, bringing full-year growth to 6 percent. Consumer price inflation edged down to 0.7 percent in December from 0.9 in November, although full-year inflation was 11.6 percent, well above the government’s 8-10 percent inflation projection. The government auctioned Yukos’ key production facility, Yuganskneftegaz, on December 19. Before the auction, Yukos’ management filed for Chapter 11 bankruptcy protection in Houston. The auction, however, took place as scheduled, and the winner was Baikal Finance Group, with a bid of $9.4 billion dollars, above the $8.7 billion minimum price but less than the amount of Yukos’ tax bill. There was some uncertainty over the winner’s identity for several days until state-owned Rosneft, which is in the process of merging with Gazprom, purchased the financing group, effectively re-nationalizing the facility. The bankruptcy filing severely complicated the Kremlin’s plan for merging Gazprom, Rosneft, and Yuganskneftegaz, with Russian officials saying that the Gazprom-Rosneft merger will take place as scheduled, but without Yuganskneftegaz.

IV-31
Russian Economic Indicators (Percent change from previous period, s.a., except as noted)
2004 Indicator 2003 2004
Q3 Q4 Oct. Nov. Dec.
Real GDP1 7.5 n.a. -.5 n.a. … … … Industrial production 6.7 6.0 .0 -.4 -.4 2.6 .0 Unemployment rate2 8.5 n.a. 7.7 n.a. 7.5 7.3 n.a. Consumer prices3 12.0 11.6 11.0 11.6 11.5 11.6 11.6 Trade balance4 59.9 n.a. 90.7 n.a. 101.4 102.9 n.a. Current account4 35.6 n.a. 64.2 n.a. … … …
1. Annual rate. Annual data are Q4/Q4. 2. Percent. 3. Percent change from year-earlier period, except annual data, which are Dec./Dec. 4. Billions of U.S. dollars, annual rate. n.a. Not available. . . . Not applicable.