Embed Size (px)
Citation preview

Content last modified 02/07/2013.
Prefatory Note The attached document represents the most complete and accurate version available based on original files from the FOMC Secretariat at the Board of Governors of the Federal Reserve System. Please note that some material may have been redacted from this document if that material was received on a confidential basis. Redacted material is indicated by occasional gaps in the text or by gray boxes around non-text content. All redacted passages are exempt from disclosure under applicable provisions of the Freedom of Information Act.

Class II FOMC - Restricted (FR)
Part 1 March 14, 2007
CURRENT ECONOMICAND FINANCIAL CONDITIONS
Summary and Outlook
Prepared for the Federal Open Market Committeeby the staff of the Board of Governors of the Federal Reserve System

Class II FOMC - Restricted (FR)
March 14, 2007
Summary and Outlook
Prepared for the Federal Open Market Committeeby the staff of the Board of Governors of the Federal Reserve System

Class II FOMC—Restricted (FR)
Domestic Developments
I-1
The incoming data continue to suggest that economic activity is expanding less rapidly than its potential. Indeed, a number of major indicators—orders and shipments, industrial production, and housing starts—have been to the soft side of our expectations. That said, labor demand appears to have slowed only modestly. After sifting through this information, we have lowered our forecast for the growth of real GDP in the current quarter to an annual rate of 1½ percent, ½ percentage point less than in the January Greenbook. Our second-quarter forecast for GDP growth remains at 2¼ percent. Our longer-run projection for real activity is also slightly weaker than in the January Greenbook. The housing contraction now seems likely to be a little deeper and last a little longer than we had earlier anticipated, in part because of tighter lending conditions in the subprime mortgage market. And although the recent weakness in business investment is difficult to reconcile with the decent fundamentals in the sector, it seemed prudent to build a touch more caution into our projection. Changes in our major conditioning assumptions are another small net negative for the economic outlook, as the damping effects of higher oil prices and a lower stock market more than offset the stimulus from slightly lower long-term interest rates. All told, we now expect real GDP to rise just a bit more than 2 percent in 2007 and 2¼ percent in 2008; the projections for both years are ¼ percentage point below those in the January Greenbook. With GDP growth running below trend over the forecast period, we project that the unemployment rate will reach 5.1 percent by the fourth quarter of 2008. The higher energy prices in this forecast will raise headline consumer price inflation in the near term. Nonetheless, with the incoming data on core inflation roughly in line with our expectations and with some easing of pressures on resource utilization anticipated in coming quarters, we project that core PCE inflation will hold steady at 2.2 percent this year and move down to 2.0 percent in 2008, the same as our January projection. Key Background Factors We continue to assume that the federal funds rate will remain at 5¼ percent through the middle of 2008, but we now have it edging down to 5 percent in the second half of the year—thereby returning to the assumptions used in the December 2006 Greenbook. Market participants have also revised down their expected path for policy and now expect the federal funds rate to be 4¼ percent at the end of 2008, ¾ percentage point below the

Class II FOMC -- Restricted (FR)
Key Background Factors Underlying the Baseline Staff Projection
2003 2004 2005 2006 2007 20080
1
2
3
4
5
6
7
0
1
2
3
4
5
6
7Percent
Federal Funds Rate
Quarterly average
Note. In each panel, shading represents the projection period.
Current Greenbook
January Greenbook
Market forecast
2003 2004 2005 2006 2007 20083
4
5
6
7
8
9
3
4
5
6
7
8
9Percent
Long-Term Interest Rates
Quarterly average
Baa corporate rate January GB
10-yearTreasury rate January GB
2003 2004 2005 2006 2007 200890
2302003:Q1=100, ratio scale
90
110
130
150
170
190
210
230Quarter-end
Equity Prices
Wilshire 5000
January GB
2003 2004 2005 2006 2007 200890
1702003:Q1=100, ratio scale
90
110
130
150
170Quarterly
House Prices
Note. The projection period begins in 2007:Q1.
OFHEO purchase-only index
January GB
2003 2004 2005 2006 2007 200816
32
48
64
80
16
32
48
64
80
Dollars per barrel
Crude Oil Prices
Quarterly average
West Texasintermediate
January GB
2003 2004 2005 2006 2007 200875
80
85
90
95
100
105
75
80
85
90
95
100
1052003:Q1=100
Broad Real Dollar
Quarterly average
January GB
I-2
Domestic Developments Class II FOMC—Restricted (FR) I-3
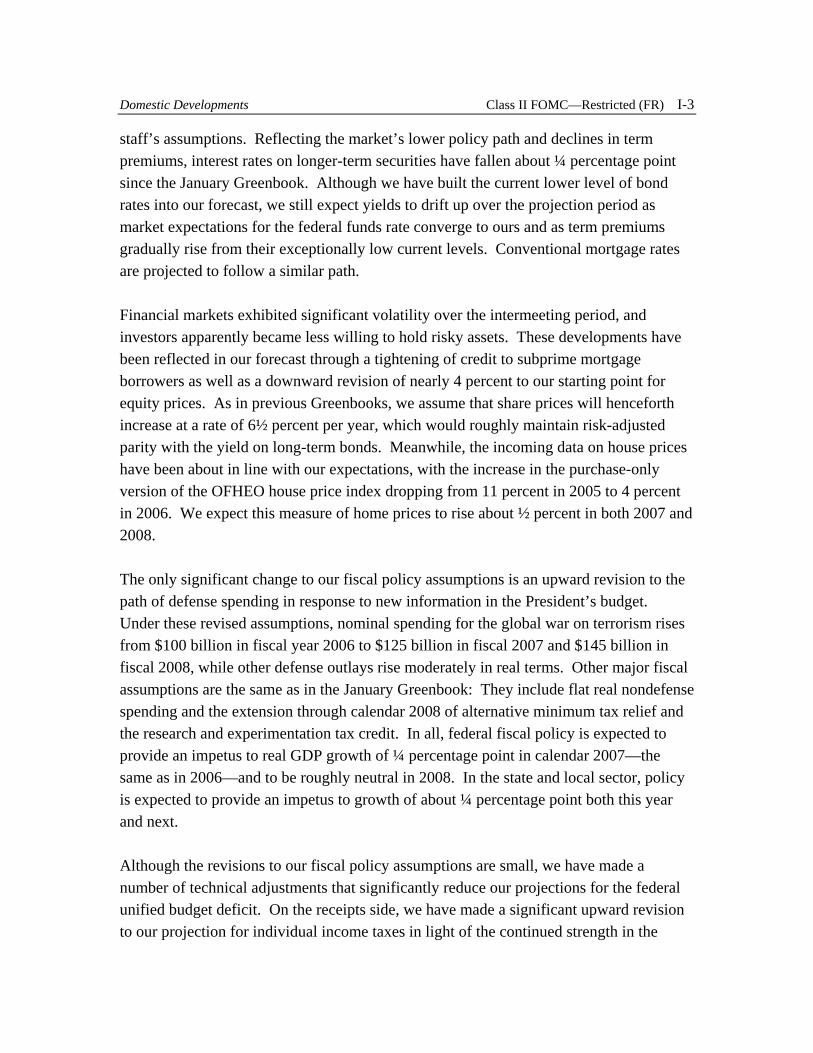
staff’s assumptions. Reflecting the market’s lower policy path and declines in term premiums, interest rates on longer-term securities have fallen about ¼ percentage point since the January Greenbook. Although we have built the current lower level of bond rates into our forecast, we still expect yields to drift up over the projection period as market expectations for the federal funds rate converge to ours and as term premiums gradually rise from their exceptionally low current levels. Conventional mortgage rates are projected to follow a similar path. Financial markets exhibited significant volatility over the intermeeting period, and investors apparently became less willing to hold risky assets. These developments have been reflected in our forecast through a tightening of credit to subprime mortgage borrowers as well as a downward revision of nearly 4 percent to our starting point for equity prices. As in previous Greenbooks, we assume that share prices will henceforth increase at a rate of 6½ percent per year, which would roughly maintain risk-adjusted parity with the yield on long-term bonds. Meanwhile, the incoming data on house prices have been about in line with our expectations, with the increase in the purchase-only version of the OFHEO house price index dropping from 11 percent in 2005 to 4 percent in 2006. We expect this measure of home prices to rise about ½ percent in both 2007 and 2008. The only significant change to our fiscal policy assumptions is an upward revision to the path of defense spending in response to new information in the President’s budget. Under these revised assumptions, nominal spending for the global war on terrorism rises from $100 billion in fiscal year 2006 to $125 billion in fiscal 2007 and $145 billion in fiscal 2008, while other defense outlays rise moderately in real terms. Other major fiscal assumptions are the same as in the January Greenbook: They include flat real nondefense spending and the extension through calendar 2008 of alternative minimum tax relief and the research and experimentation tax credit. In all, federal fiscal policy is expected to provide an impetus to real GDP growth of ¼ percentage point in calendar 2007—the same as in 2006—and to be roughly neutral in 2008. In the state and local sector, policy is expected to provide an impetus to growth of about ¼ percentage point both this year and next. Although the revisions to our fiscal policy assumptions are small, we have made a number of technical adjustments that significantly reduce our projections for the federal unified budget deficit. On the receipts side, we have made a significant upward revision to our projection for individual income taxes in light of the continued strength in the

I-4 Class II FOMC—Restricted (FR) Part 1: Summary and Outlook, March 14, 2007
incoming tax data. We have also revised down spending in a number of categories after reviewing the updated budget projections from the Administration and the Congressional Budget Office. We now expect the unified budget deficit to total $180 billion in fiscal 2007 and $243 billion in fiscal 2008, compared with projections of $232 billion and $269 billion, respectively, in the January Greenbook. In the foreign exchange markets, the nominal trade-weighted value of the dollar has fallen slightly on balance since the time of the January Greenbook; we continue to project that the broad real dollar will edge down over the next two years. We still expect foreign real GDP to increase 3½ percent in 2007 and 2008 after rising nearly 4 percent in 2006. The spot price of West Texas intermediate (WTI) crude oil now stands at $58 per barrel, $4 per barrel above its level at the time of the January Greenbook. Futures prices have also risen, and we have revised up our projection for WTI by the end of 2008 by $5 per barrel, to $66 per barrel. The recent increases in oil prices seem to be attributable mainly to indications that OPEC will exert greater restraint on production than seemed likely earlier, further supply disruptions in Iraq and Nigeria, and talk of stronger sanctions against Iran. In addition, cold weather in the United States boosted oil demand. Recent Developments and the Near-Term Outlook Real GDP is now estimated to have risen at an annual rate of 2¼ percent in the fourth quarter of 2006, well below the BEA’s advance estimate (which was released on the second day of the January FOMC meeting) but only a little below the projection in the January Greenbook. For the first quarter of this year, we expect real GDP to increase at an annual rate of 1½ percent, ½ percentage point below our January projection. Consumer spending is on track to post another sizable increase, and inventory investment should level off after plunging in the fourth quarter. But these positive influences are being partly offset by another steep contraction in residential construction, a second quarter of relatively weak business investment, a sharp downswing in the contribution of net exports, and a lull in defense spending. For the second quarter, we have marked down our outlook for growth in private demand, especially in housing and equipment spending; but with defense spending expected to rebound, we have left our GDP forecast at 2¼ percent. Labor demand has shown some tentative signs of deceleration. Private nonfarm employment posted a relatively meager increase of 58,000 in February and has risen 135,000 per month on average over the three months ending in February, compared with
Domestic Developments Class II FOMC—Restricted (FR) I-5
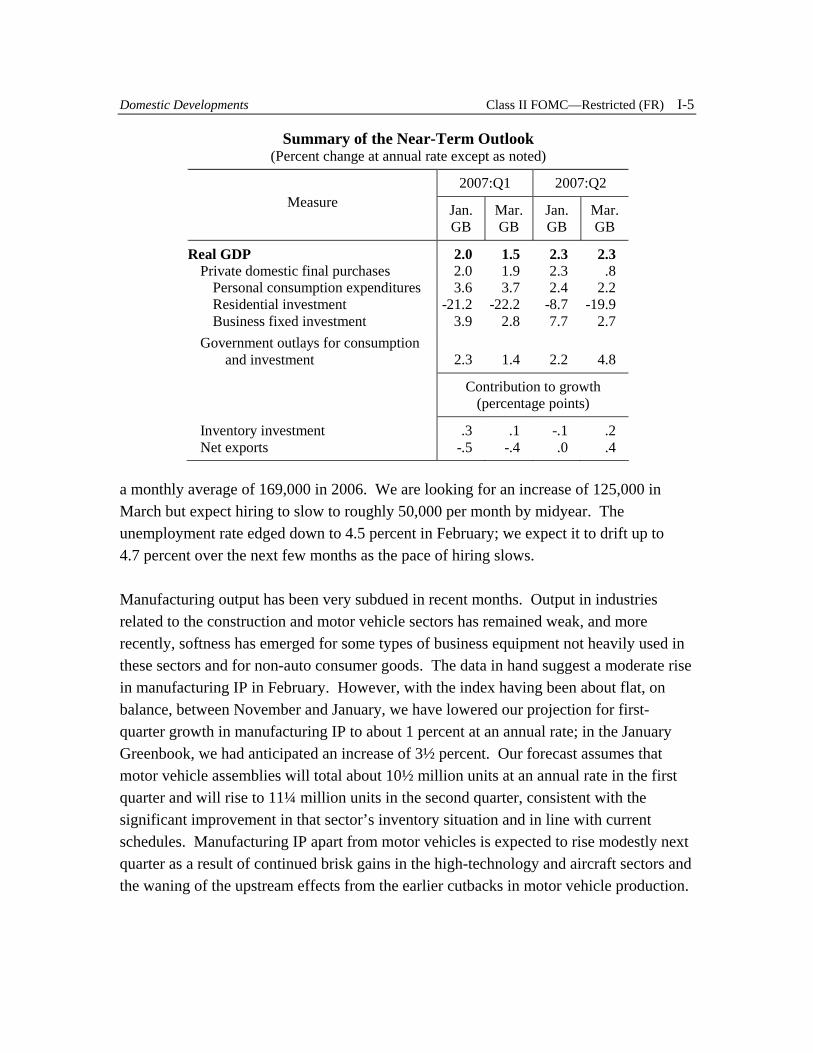
Summary of the Near-Term Outlook (Percent change at annual rate except as noted)
2007:Q1 2007:Q2 Measure Jan.
GB Mar. GB
Jan. GB
Mar. GB
Real GDP 2.0 1.5 2.3 2.3 Private domestic final purchases 2.0 1.9 2.3 .8 Personal consumption expenditures 3.6 3.7 2.4 2.2 Residential investment -21.2 -22.2 -8.7 -19.9 Business fixed investment 3.9 2.8 7.7 2.7 Government outlays for consumption and investment 2.3 1.4 2.2 4.8
Contribution to growth (percentage points)
Inventory investment .3 .1 -.1 .2 Net exports -.5 -.4 .0 .4
a monthly average of 169,000 in 2006. We are looking for an increase of 125,000 in March but expect hiring to slow to roughly 50,000 per month by midyear. The unemployment rate edged down to 4.5 percent in February; we expect it to drift up to 4.7 percent over the next few months as the pace of hiring slows. Manufacturing output has been very subdued in recent months. Output in industries related to the construction and motor vehicle sectors has remained weak, and more recently, softness has emerged for some types of business equipment not heavily used in these sectors and for non-auto consumer goods. The data in hand suggest a moderate rise in manufacturing IP in February. However, with the index having been about flat, on balance, between November and January, we have lowered our projection for first-quarter growth in manufacturing IP to about 1 percent at an annual rate; in the January Greenbook, we had anticipated an increase of 3½ percent. Our forecast assumes that motor vehicle assemblies will total about 10½ million units at an annual rate in the first quarter and will rise to 11¼ million units in the second quarter, consistent with the significant improvement in that sector’s inventory situation and in line with current schedules. Manufacturing IP apart from motor vehicles is expected to rise modestly next quarter as a result of continued brisk gains in the high-technology and aircraft sectors and the waning of the upstream effects from the earlier cutbacks in motor vehicle production.

I-6 Class II FOMC—Restricted (FR) Part 1: Summary and Outlook, March 14, 2007
Real consumer spending entered 2007 on a strong note and is projected to increase at an annual rate of 3¾ percent this quarter after having risen at a 4 percent pace in the fourth quarter. Sales of light vehicles in January and February were a little higher than they had been in the fourth quarter, and the report on retail sales in February suggests that the level of real outlays on other goods has been well maintained after the steep run-up in the fourth quarter. Also, after an unusually warm December, outlays for energy services rose sharply in January and, apparently, February. Our forecast for the second quarter has PCE growth dropping to 2¼ percent as the weather-related boost to energy expenditures disappears, real income growth steps down, and consumers retrench a bit after a period of spending growth that has, by our reckoning, outstripped the fundamentals. In the housing sector, the average pace of home sales in December and January was well within the range that has prevailed since last summer, and other broad indicators of housing demand held steady. However, we now think that sales may drift down a bit further in coming months, in part because of recent developments in the subprime mortgage market (refer to box on p. 8). Moreover, inventories of unsold homes remain high, and—even allowing for the influence of unseasonable weather—starts and permits were very low in January. Accordingly, we have trimmed our projection for single-family starts in the first quarter to an annual rate of just 1.13 million units, and we expect them to edge down further in the spring. Given this pattern of starts, real residential investment is projected to decrease at an annual rate of roughly 20 percent over the first half of the year—about the same as over the second half of 2006 and enough to shave more than 1 percentage point from real GDP growth in each quarter. Real investment in equipment and software (E&S) fell at an annual rate of 3½ percent in the fourth quarter and is projected to rise just 2½ percent in the current quarter. One bright spot is spending on computers, which apparently is getting a lift from the introduction of Microsoft’s Windows Vista operating system. Domestic purchases of aircraft also appear to have bounced back after a weak fourth quarter. But spending on communications equipment is likely to be flat in the near term, and, as expected, the tightening of emissions standards that took effect in January is crimping purchases of medium and heavy trucks, which had soared in 2006 in anticipation of the new regulations. In addition, the widespread weakness in shipments and orders for capital goods outside the high-tech and transportation areas around the turn of the year implies a significant deterioration in the near-term prospects for real outlays on this equipment; we now expect these outlays to decline at an annual rate of 7 percent in the first quarter (they fell at an annual rate of 5 percent in the fourth quarter) and to rise only a little in the

Domestic Developments Class II FOMC—Restricted (FR) I-7
second quarter. E&S growth in the second quarter will also be restrained by a further unwinding of the 2006 surge in truck purchases. Real business spending for nonresidential structures appears to have firmed after a weak fourth quarter, although growth is likely to fall far short of the large increases recorded over the first three quarters of 2006. On the basis of the data on construction put in place in January, real building outlays appear to be on track for a modest increase this quarter, and the recent upturn in architectural billings—which tend to lead construction spending by about six months—augurs well for activity a quarter or two ahead. Drilling and mining activity rose at an annual rate of about 4 percent in the fourth quarter, and the flattening in the number of drilling rigs in operation of late suggests that increases will remain fairly small in the first half of 2007. In the government sector, real federal expenditures on consumption and gross investment rose at an annual rate of 4½ percent in the fourth quarter, as a jump in defense spending was partly offset by a sharp decline in nondefense expenditures. Early indications suggest that defense spending, which can be volatile from quarter to quarter, dipped early in the year, leading us to expect that overall federal purchases will be little changed in the current quarter; federal purchases are projected to rise 8½ percent in the second quarter as defense purchases snap back. In the state and local sector, real purchases rose 2½ percent in the fourth quarter, only marginally less than the solid gains recorded, on average, over the first three quarters. Given the recent data for employment and construction, we expect spending to continue to expand at about this rate in the first half of 2007. We estimate that real nonfarm inventory investment fell from an annual rate of $53 billion in the third quarter of 2006 to $16 billion in the fourth quarter as a result of both a liquidation of motor vehicles stocks and a substantial downswing in accumulation outside of motor vehicles. More recently, overhangs in the motor vehicle industry have largely been eliminated. However, inventory-sales ratios in some other industries—for example, wood products and other construction supplies, fabricated metals, electrical equipment, and machinery—moved up around the turn of the year and have prompted production adjustments that, on our forecast of final sales, should hold non-auto inventory investment to modest proportions in the first half of 2007. Net exports are estimated to have added 1½ percentage points to real GDP growth in the fourth quarter, as real exports rose at an annual rate of more than 10 percent and imports turned down. Growth in real exports of goods and services is expected to moderate this

I-8 Class II FOMC—Restricted (FR) Part 1: Summary and Outlook, March 14, 2007
Nonprime Mortgage Markets Rising delinquencies on subprime mortgages and financial difficulties among subprime lenders have led to tighter lending standards on such loans. These tighter standards are likely to restrain homebuying and homebuilding in coming quarters. We estimate that loans to subprime borrowers—those with the lowest credit scores—account for about 13 percent of the value of total U.S. mortgage debt outstanding; loans to near-prime borrowers—those with somewhat better credit scores—account for an additional 6 percent to 10 percent. The two groups together are often called “nonprime,” and both may face diminished access to credit. According to data collected under the Home Mortgage Disclosure Act, nearly one-fourth of new loans used to purchase homes in 2005 (the most recent year for which these data are available) can be classified as nonprime. Our estimates indicate that nonprime mortgage originations trended up gradually from 1996 to 2003 (refer to figure on facing page). They accelerated sharply in the middle of 2004, just as prime mortgage originations began to stagnate, and they continued to rise rapidly in 2005 before easing some last year. Viewing the above-trend growth since 2004 as a rough measure of extra loans extended because of easier credit conditions, we estimate that originations were boosted by 750,000 loans in 2005 and 475,000 loans in 2006. The extra originations represented 10 percent of total home sales in 2005 and 7 percent of sales in 2006. Although we are not anticipating a widespread credit crunch, nonprime borrowers will find credit more difficult and expensive to obtain in 2007 and 2008 than they did over the past two years. By themselves, the tighter subprime lending standards led us to lower our projection of home sales and single-family starts by 3 percent, roughly half of last year’s increment to originations above the pre-2004 trend. This change reduced the projected growth of real GDP in 2007 by about 0.1 percentage point and had a negligible effect on growth in 2008. Of course, the contraction in mortgage lending could be even sharper. Nonprime lending could fall below its previous trend, and there could be spillover to the prime mortgage market. Simulations of the FRB/US model can provide a rough gauge of the effects on the economy of a more significant contraction in mortgage lending. According to this model, if reduced lending were to push housing sales and single-family starts an additional 10 percent below the staff’s current projection beginning in the second quarter of this year, real GDP growth would fall ¼ percentage point below baseline in 2007; again, the effect on growth in 2008 would be small. Under our standard Taylor rule, the nominal federal funds rate would be ¼ percentage point lower than baseline beginning in the third quarter of this year. The effects on economic activity would be amplified if the problems in mortgage markets led to higher risk spreads in other financial assets and appreciable declines in house prices.

Domestic Developments Class II FOMC—Restricted (FR) I-9
quarter and next, while real imports are expected to be pushed up in the first quarter by a bounceback in real oil imports and by a surge in computer purchases. As a result, the contribution from the external sector swings to a negative ½ percentage point in the current quarter before returning to positive territory in the second quarter. We have made no significant changes to our near-term forecast for core inflation. Taken together, the increases in core PCE prices in December and January were in line with our expectations, and we continue to project that core PCE prices will rise at an annual rate of 2¼ percent in both the first and second quarters of this year, the same as the increase over the four quarters of 2006. However, because energy prices are running higher than we had anticipated, we have raised our projection for overall PCE inflation to nearly 3 percent this quarter and next; in the January Greenbook, we had anticipated increases of about 2 percent in the first quarter and 2½ percent in the second. On the basis of the incoming data, we have lowered our first-quarter forecast for the increase in average hourly earnings by ¾ percentage point to an annual rate of 3¾ percent, a touch less than the increase over the four quarters of 2006. Similarly, the recently released information on hourly compensation in the nonfarm business sector in
1996 1997 1998 1999 2000 2001 2002 2003 2004 2005 2006
0
1
2
3
4
5
6
7
8Millions
Nonprime mortgages
Prime mortgages
Total mortgages
Home sales
Note. The data are quarterly and seasonally adjusted. The mortgage data were seasonally adjusted by the staff. Source. Staff estimates based on data collected under the Home Mortgage Disclosure Act and data from theCensus Bureau, the National Association of Realtors, LoanPerformance, and Inside Mortgage Finance.
Number of Homes Sold and Mortgages Originated

I-10 Class II FOMC—Restricted (FR) Part 1: Summary and Outlook, March 14, 2007
the second half of last year led us to revise down our forecast for compensation growth over the first half of this year.1 The Longer-Run Outlook for the Economy Our forecast has real GDP rising 2.1 percent in 2007, the same pace as in the second half of 2006. With the drag from residential investment coming to an end, real GDP growth is projected to pick up to 2.3 percent in 2008, slightly below the pace of potential. Household spending. Although consumer spending is likely to post a sizable increase in the current quarter, we continue to anticipate a marked slowing in coming quarters. In fact, our current projection—which has real PCE growth dropping from 3½ percent in 2006 to 2½ percent in both 2007 and 2008—is somewhat below the one in the January Greenbook. This revision reflects the lower stock market as well as a weaker picture for real disposable income in light of both a downward revision by the BEA to nominal wages and salaries in the second half of 2006 and the higher projected path of energy prices over the forecast period. Nonetheless, the broad contours of the PCE forecast are unchanged and continue to be shaped by the anticipated waning of wealth effects, which add just ¼ percentage point to real PCE growth in 2007 (after having added ¾ percentage point in 2006) and turn negative in 2008. Spending growth should also come under downward pressure as households adjust their consumption after a period in which spending seems to have outstripped the fundamentals. The personal saving rate fell to an average of negative 1 percent in 2006; we expect it to rise gradually from here and to reach ½ percent by the end of 2008. In the housing sector, we expect single-family starts to total 1.13 million units this year as homebuilders continue to work off excess inventories. By next year, those inventories should be in better shape; and with demand expected to be bolstered by steady increases in household incomes and by mortgage rates that are relatively low by historical norms, we project single-family starts to move up to 1.21 million units. In the multifamily sector, where construction has been relatively stable in recent years, starts are expected to
1 The reported rate of increase in the productivity and costs (P&C) measure of hourly compensation in
the third quarter of 2006 was revised down sharply to an annual rate of ½ percent. In the fourth quarter, the BEA incorporated an assumed $50 billion in bonus payments and stock options into its estimate of wage and salary accruals, which boosted the increase in hourly compensation in that quarter to an annual rate of 8¼ percent. The downward revision to our projection of compensation growth in the first half of 2007 reflects both the unwinding of these one-time payments and our sense that—adjusting for special factors and smoothing through the volatility in the data—the recent underlying pace of compensation gains has been a little slower than we were previously assuming.

Domestic Developments Class II FOMC—Restricted (FR) I-11
Projections of Real GDP (Percent change at annual rate from end of
preceding period except as noted)
Measure 2006: H2
2007: H1 2007 2008
Real GDP 2.1 1.9 2.1 2.3 Previous 2.3 2.2 2.3 2.5
Final sales 2.8 1.7 1.9 2.4 Previous 2.9 2.0 2.2 2.5
PCE 3.5 3.0 2.5 2.4 Previous 3.7 3.0 2.8 2.7
Residential investment -19.2 -21.1 -12.9 1.9 Previous -19.6 -15.2 -8.8 2.0
BFI 3.6 2.7 3.3 3.9 Previous 4.1 5.8 5.1 4.2
Government purchases 2.5 3.0 2.8 2.1 Previous 3.3 2.2 2.1 1.9
Exports 8.7 5.6 5.7 5.2 Previous 7.2 5.2 5.1 5.1
Imports 1.5 4.0 4.2 4.7 Previous 1.8 5.1 5.0 5.1
Contribution to growth (percentage points)
Inventory change -.6 .2 .2 -.1 Previous -.6 .1 .1 -.0
Net exports .7 -.0 -.1 -.2 Previous .5 -.2 -.2 -.3
be in the neighborhood of 350,000 units per year. Real residential investment is projected to rise 2 percent in 2008 after falling 13 percent in 2007. Business investment. We now expect overall real outlays for E&S to rise just 2¾ percent in 2007 before picking up to a 5 percent pace in 2008; in the January Greenbook, we had projected increases of more than 5 percent in both years. A good deal of the downward revision reflects near-term weakness in the demand for equipment outside the high-tech and transportation areas. We do not expect this demand to remain as weak as it has been, given the reasonably positive climate of business sentiment and favorable financial conditions. Even so, with growth in overall business output slower in

I-12 Class II FOMC—Restricted (FR) Part 1: Summary and Outlook, March 14, 2007
2007 and 2008 than it was in 2006, spending for equipment outside high-tech and transportation is likely to advance only modestly over the projection period—our forecast is for growth on the order of 1½ percent at an annual rate. We have also revised down our forecast for business purchases of motor vehicles to build in a bigger payback for the surge in truck purchases in 2006. Meanwhile, we project that real outlays for high-tech equipment and software will rise 9½ percent per year over the projection period—similar to the average pace in 2005 and 2006. We project that real outlays for nonresidential construction will rise nearly 5 percent in 2007 and 1½ percent in 2008 after having posted a double-digit increase in 2006. Outlays for drilling and mining structures appear to be stabilizing after a huge run-up; they are not expected to rise much further given our forecast of energy prices. Spending on nonresidential buildings should continue to move up, although gains in coming quarters should be limited by the below-trend growth in overall economic activity and by a projected sharp deceleration in employment. Although inventories are currently high relative to sales in some sectors, businesses apparently are moving promptly to address imbalances, and we assume they will continue to do so in coming quarters. Inventory investment is expected to be a roughly neutral influence on real GDP growth in the second half of 2007 and 2008. Government spending. Consistent with the adjustments to our fiscal assumptions noted above, we have raised the projected increase in real federal expenditures for consumption and investment to 3¼ percent in 2007 and 1½ percent in 2008; virtually all of the increase over this period is expected to be in defense purchases. Meanwhile, with state and local balance sheets in good shape, we expect real purchases in that sector to rise 2½ percent per year in 2007 and 2008, in line with the average increase since the mid-1990s. Net exports. We expect growth in real exports to slow from 9½ percent in 2006 to 5¾ percent in 2007 and 5¼ percent in 2008, in part because of the waning of the effects of earlier declines in the dollar. Meanwhile, growth in real imports is projected to step up from 3¼ percent in 2006 to 4¼ percent in 2007 and 4¾ percent in 2008. All told, real net exports are expected to have little effect on the growth of real GDP in 2007 after having added nearly ½ percentage point in 2006; they are expected to subtract a little less than ¼ percentage point from growth in 2008. (The International Developments section provides more detail on the outlook for the external sector.)

Domestic Developments Class II FOMC—Restricted (FR) I-13
Aggregate Supply, the Labor Market, and Inflation As before, we assume that potential real GDP is rising 2.6 percent in 2007 and will rise 2.5 percent in 2008. With the growth of actual output projected to run below that pace, pressures on resource utilization should ease over the next two years. Higher energy prices in this forecast boost overall inflation in 2007, but we have left our projections of core inflation essentially unchanged. Productivity and the labor market. Productivity in the nonfarm business sector rose only 1½ percent in 2006 as firms were slow to adjust their labor input to the reduced pace of output growth in the latter part of the year; this pattern of below-trend productivity growth is likely to continue in the first half of 2007. As noted above, however, we expect to see a significant downshift in hiring by midyear, with gains in private payroll employment dropping to just 25,000 per month in the second half of the year and remaining at about that level in 2008 while productivity growth picks up to an estimated trend rate of 2½ percent. The unemployment rate is expected to rise to 5.1 percent by the end of 2008 even as labor force participation continues to trend down. Wages and prices. The projection for core PCE price inflation is essentially unchanged. As in the previous Greenbook, the basic story features a modest lessening in inflation pressures as energy prices stabilize and their indirect effects fade, core nonfuel import prices decelerate, and pressures on resource utilization gradually ease. All in all, we expect core PCE prices to rise 2.2 percent this year and 2.0 percent in 2008. Given our forecast for energy prices, overall PCE inflation is projected to pick up to 2.5 percent in 2007 before dropping back to 2.0 percent in 2008. As for hourly compensation, the data for the employment cost index in the fourth quarter were roughly in line with our expectations, and we expect this measure to rise about 4 percent both this year and next.2 Meanwhile, we have lowered our forecast for growth in the P&C measure of hourly compensation in 2007 to about 4 percent, but this revision is mostly a consequence of the reversal of the bonus-related bump in compensation in the
2 We continue to assume that the Congress will pass legislation that raises the federal minimum wage
from its current level of $5.15 an hour to $5.85 an hour sixty days after the bill is signed into law, to $6.55 a year later, and to $7.25 a year after that. In the January Greenbook, we had expected the initial increase to occur in the second quarter, but we have modified our assumption in light of the slow progress to date on the legislation and now expect the initial increase to take place in the third quarter. In any event, we anticipate that the higher minimum wage will have only a small effect on hourly compensation growth—less than 0.1 percentage point in each year—because of the small number of workers whose wages will be affected by it.

I-14 Class II FOMC—Restricted (FR) Part 1: Summary and Outlook, March 14, 2007
Decomposition of Structural Labor Productivity Nonfarm Business Sector
(Percent change, Q4 to Q4, except as noted)
Measure 1974-95
1996-2000
2001-04 2005 2006 2007 2008
Structural labor productivity 1.5 2.5 3.0 2.5 2.6 2.5 2.4 Previous 1.5 2.5 3.0 2.5 2.6 2.5 2.5
Contributions1 Capital deepening .7 1.4 .6 .5 .7 .6 .6 Previous .7 1.4 .6 .5 .7 .6 .6 Multifactor productivity .5 .8 2.1 1.8 1.7 1.7 1.7 Previous .5 .8 2.1 1.8 1.7 1.7 1.7 Labor composition .3 .3 .3 .3 .2 .2 .2
MEMO Potential GDP 3.0 3.3 2.9 2.6 2.7 2.6 2.5 Previous 3.0 3.3 2.9 2.6 2.7 2.6 2.5
NOTE. Components may not sum to totals because of rounding. For multiyear periods, the percent change is the annual average from Q4 of the year preceding the first year shown to Q4 of the last year shown. 1. Percentage points.
The Outlook for the Labor Market
(Percent change, Q4 to Q4, except as noted)
Measure 2005 2006 2007 2008
Output per hour, nonfarm business 2.1 1.5 2.1 2.6 Previous 2.5 1.5 2.4 2.6 Nonfarm private payroll employment 2.0 1.8 .7 .3 Previous 1.6 1.5 .7 .4 Household survey employment 1.9 2.1 .4 .4 Previous 1.9 2.1 .4 .5 Labor force participation rate1 66.1 66.3 66.0 65.7 Previous 66.1 66.3 66.0 65.7 Civilian unemployment rate1 5.0 4.5 4.9 5.1 Previous 5.0 4.5 4.8 4.9 MEMO GDP gap2 .1 .5 -.0 -.2 Previous -.0 .4 .1 .1
1. Percent, average for the fourth quarter. 2. Actual less potential GDP in the fourth quarter of the year indicated as a percent of potential GDP. A negative number thus indicates that the economy is operating below potential.

Domestic Developments Class II FOMC—Restricted (FR) I-15
Inflation Projections (Percent change, Q4 to Q4, except as noted)
Measure 2005 2006 2007 2008
PCE chain-weighted price index 3.1 1.9 2.5 2.1 Previous 3.1 1.9 2.2 2.1
Food and beverages 2.1 2.3 3.1 2.2 Previous 2.1 2.3 2.9 2.2
Energy 21.2 -3.6 6.1 1.7 Previous 21.2 -3.9 1.8 2.2
Excluding food and energy 2.1 2.2 2.2 2.0 Previous 2.1 2.3 2.2 2.0
Consumer price index 3.7 1.9 2.8 2.2 Previous 3.7 2.0 2.4 2.2
Excluding food and energy 2.1 2.7 2.4 2.2 Previous 2.1 2.7 2.4 2.2
GDP chain-weighted price index 3.1 2.5 2.7 2.3 Previous 3.1 2.6 2.6 2.3
ECI for compensation of private industry workers1 2.9 3.2 3.9 3.9 Previous 2.9 3.2 4.0 4.0
Compensation per hour, nonfarm business sector 3.7 4.9 4.1 4.8 Previous 4.1 4.9 4.9 4.9
Prices of core nonfuel imports 2.2 2.7 2.0 1.1 Previous 2.2 2.9 1.5 1.0
1. December to December. fourth quarter of 2006. Given the slightly higher unemployment rate in this projection, we have edged down our forecast for the change in P&C compensation in 2008 by a tenth, to 4.8 percent. Financial Flows and Conditions Domestic nonfinancial debt expanded at an annual rate of 8 percent in the fourth quarter of 2006. We expect total debt growth to continue apace in the current quarter before slowing to 6 percent, on average, over the remainder of the projection period. The projected reduction in debt growth reflects a slowdown in borrowing by all sectors except the federal government.
I-16 Class II FOMC—Restricted (FR) Part 1: Summary and Outlook, March 14, 2007
Household debt decelerated in the fourth quarter to an annual rate of 6½ percent, the slowest pace since 1998. Growth of household debt is projected to moderate further over the next two years, reaching 5½ percent in 2008. Over the projection period, we expect that mortgage borrowing will be restrained by tepid home price appreciation, while growth of consumer credit will be held down by sluggish increases in spending on consumer durable goods. Although household loan performance has generally remained solid, delinquency rates on subprime variable-rate mortgages have continued to rise. Our forecast for continued low home price appreciation and higher mortgage rates is expected to weigh on household credit quality this year and next, although we do not expect the deterioration to be large enough to materially restrain aggregate consumer spending. Nonfinancial business debt is estimated to have increased at a robust annual rate of 11 percent in the fourth quarter of 2006, boosted by debt financing for an outsized volume of equity retirements associated with mergers and acquisitions and share repurchase programs. We expect that the growth of business debt will step down to an average pace of around 7 percent in 2007 and 2008 as M&A activity and repurchases fall back. Over the projection period, we view debt defaults as likely to increase from their extraordinarily low recent levels as profits flatten out and corporate leverage edges up toward a more typical level. Federal government debt expanded moderately in the fourth quarter, leaving the increase over 2006 as a whole at 4 percent; we expect it to expand at an average pace of about 5¼ percent in 2007 and 2008. In the state and local government sector, this quarter’s issuance of debt for advance refunding and new capital projects has been far less robust than it was in the fourth quarter of 2006. Over the forecast period, we expect long-term capital issuance to move up from its recent pace, but a reduction in opportunities for advance refunding should damp the rise in municipal borrowing. M2 expanded 5 percent in 2006, slower than the growth of nominal GDP because of a modest drag from the rise in opportunity costs. With opportunity costs expected to decline over the forecast period, M2 is projected to rise at an average pace of 5 percent in 2007 and 2008, a shade faster than the rate of growth projected for nominal GDP. Alternative Simulations In this section, we evaluate six alternatives to the staff forecast using simulations of the FRB/US model. The first two scenarios address the possibility that the weak tone of recent data on capital spending may be a signal that firms are more pessimistic than we

Domestic Developments Class II FOMC—Restricted (FR) I-17
believe—an adverse development that has the potential to trigger not only greater weakness in business investment but also a downturn in financial markets. In contrast, the third scenario allows for the possibility that we may have underestimated the persistence of the recent strength of consumer spending. The next two scenarios consider risks to the supply side—first, that we have misjudged the relative contributions of productivity and labor force growth to our projection of potential output and, second, that the labor market is less tight than we estimate. These scenarios all assume that monetary policy responds to the change in the outlook as suggested by an estimated version of the Taylor rule. In the final scenario, we assume that monetary policy follows a path implied by quotes from the futures market. Business pessimism. We have not interpreted the weak incoming data on capital spending as a sign that firms have significantly altered their expectations for the return on new investment, and so we have revised down the longer-run forecast for business spending only modestly. In this scenario, we instead assume that firms have become markedly more pessimistic about the future returns on investment. Specifically, we hold real business fixed investment about flat through the end of next year rather than, as in the baseline, projecting it to rise about 4 percent on average over the forecast period. With no growth in business spending, real GDP increases only 1¾ percent in both 2007 and 2008, causing the unemployment rate to move up to just under 5½ percent by the end of next year.3 Despite the additional slack in labor and product markets, inflation is a touch above baseline in part because the reduced pace of capital deepening restrains the rise in trend labor productivity and therefore boosts unit labor costs. With the monetary policy implications of weaker real activity outweighing those of faster inflation, the federal funds rate falls to less than 4½ percent by the end of next year—an outcome broadly similar to the one expected by market participants.
Business pessimism with spillovers. The fallout from increased business pessimism would be more pronounced if it had consequences beyond investment spending alone. This scenario builds on the previous one by assuming that firms also scale back their pace of hiring, causing private nonfarm payrolls to stagnate. In addition, we assume that weaker real activity prompts investors to reassess market risks; as a result, yield spreads on private securities over Treasuries increase almost 1½ percentage points, and corporate equity prices fall about 20 percent. The additional restraint from a weaker labor market and tighter financial conditions holds real GDP growth to only 1¼ percent per year on
3 The increase in the unemployment rate relative to baseline is tempered by the reduced pace of capital deepening, which holds down the growth of potential GDP.

I-18 Class II FOMC—Restricted (FR) Part 1: Summary and Outlook, March 14, 2007
Alternative Scenarios (Percent change, annual rate, from end of preceding period except as noted)
2007 2008 Measure and scenario 2006:
H2 H1 H2 H1 H2
Real GDP Greenbook baseline 2.1 1.9 2.3 2.3 2.3 Business pessimism . . . 1.6 1.8 1.7 1.7 Business pessimism with spillovers . . . 1.6 1.1 1.0 1.2 Stronger aggregate demand . . . 2.0 3.2 3.4 3.3 Slower productivity growth with stable participation . . . 2.0 2.3 2.2 2.1 Lower NAIRU . . . 2.0 2.5 2.5 2.6 Market-based federal funds rate . . . 1.9 2.4 2.6 2.8
Unemployment rate1 Greenbook baseline 4.5 4.7 4.9 5.0 5.1 Business pessimism . . . 4.7 5.0 5.2 5.4 Business pessimism with spillovers . . . 4.7 5.1 5.4 5.7 Stronger aggregate demand . . . 4.7 4.8 4.7 4.5 Slower productivity growth with stable participation . . . 4.7 4.9 5.0 5.1 Lower NAIRU . . . 4.7 4.9 4.9 5.0 Market-based federal funds rate . . . 4.7 4.9 4.9 5.0
Core PCE inflation Greenbook baseline 2.0 2.2 2.2 2.1 2.0 Business pessimism . . . 2.2 2.2 2.2 2.1 Business pessimism with spillovers . . . 2.2 2.3 2.2 2.1 Stronger aggregate demand . . . 2.2 2.2 2.1 2.0 Slower productivity growth with stable participation . . . 2.3 2.5 2.5 2.4 Lower NAIRU . . . 2.1 2.0 1.8 1.7 Market-based federal funds rate . . . 2.2 2.2 2.2 2.1
Federal funds rate1 Greenbook baseline 5.2 5.3 5.3 5.3 5.0 Business pessimism . . . 5.2 5.0 4.8 4.4 Business pessimism with spillovers . . . 5.2 4.7 4.2 3.6 Stronger aggregate demand . . . 5.3 5.7 6.3 6.5 Slower productivity growth with stable participation . . . 5.3 5.5 5.6 5.4 Lower NAIRU . . . 5.3 5.2 5.0 4.6 Market-based federal funds rate . . . 5.2 4.8 4.4 4.3
1. Percent, average for the final quarter of the period. . . . Not applicable.

Domestic Developments Class II FOMC—Restricted (FR) I-19
average over the forecast period, and the unemployment rate rises to 5¾ percent. Again, inflation runs slightly above baseline despite the additional economic slack because of the effects of slower productivity growth. Under these circumstances, monetary policy eases more substantially than in the previous scenario, and the federal funds rate falls to 3½ percent by the end of next year. Stronger aggregate demand. Consumer spending has been surprisingly robust in recent quarters given the fundamentals, and we may be underestimating the degree to which this strength will persist. In this scenario, the personal saving rate remains around negative 1 percent rather than rising to ½ percent as in the baseline. With real consumer outlays continuing to expand at almost a 4 percent annual rate on average, real GDP increases about 2½ percent this year and almost 3½ percent in 2008. Thus, aggregate spending eventually outstrips the growth in potential output, and the unemployment rate ends up at 4½ percent—½ percentage point below baseline. Monetary policy responds to increased resource utilization by raising the federal funds rate to 6½ percent by the end of next year, boosting bond yields and the exchange value of the dollar relative to baseline. The price effects of dollar appreciation, coupled with stable long-run inflation expectations, offset the effect of tight labor and product markets and leave inflation unchanged from baseline. Slower productivity growth with stable participation. Recent developments in labor and product markets seem consistent with our assessment that potential output is expanding about 2½ percent per year. However, we may be wrong about the specific mix of productivity and labor force assumptions underlying this assessment. In this scenario, we assume that structural labor productivity is rising only 2 percent per year—a pace in line with the estimates of some of our statistical models but ½ percentage point slower than we have assumed in the baseline. Offsetting this adjustment, we assume that trend labor force participation remains flat—a projection that contrasts with our baseline view that the trend is falling markedly because of demographic factors. Because these adjustments imply no revision to potential output, household income and corporate earnings, taken together, are largely unaffected. Real activity is thus about the same as in the baseline. However, core PCE inflation rises to 2½ percent this year and next because smaller productivity gains translate into more-rapid increases in trend unit labor costs. Monetary policy is somewhat tighter as a result. Lower NAIRU. Hourly compensation gains have remained moderate despite a labor market that, by the staff’s estimate, is fairly tight. This raises the possibility that we have

I-20 Class II FOMC—Restricted (FR) Part 1: Summary and Outlook, March 14, 2007
overstated the degree of tightness in the labor market. In this scenario, we assume that the NAIRU gradually declined to 4¼ percent over the past few years rather than having held steady at 5 percent as in the baseline. The additional slack in resource utilization causes core PCE inflation to fall to 1¾ percent by the end of next year, prompting an easing in monetary policy that eventually pushes the federal funds rate down to nearly 4½ percent. Lower interest rates, in turn, provide a mild stimulus to real activity. Market-based federal funds rate. Quotes from futures markets imply a path for the federal funds rate that falls 75 basis points below the staff’s assumed path by the end of 2008. The increased stimulus from such a lower path would boost real GDP growth to about 2¾ percent in 2008 and cause inflation to be a shade higher than in the baseline.

Domestic Developments Class II FOMC—Restricted (FR) I-21
Selected Greenbook Projections and70 Percent Confidence Intervals Derived from
Historical Forecast Errors and FRB/US Simulations
Measure 2007 2008
Real GDP(percent change, Q4 to Q4)Projection 2.1 2.3Confidence interval
Greenbook forecast errors .6–3.6 .8–3.8FRB/US stochastic simulations 1.0–3.3 .9–4.0
Civilian unemployment rate(percent, Q4)Projection 4.9 5.1Confidence interval
Greenbook forecast errors 4.4–5.4 4.2–6.0FRB/US stochastic simulations 4.6–5.1 4.5–5.5
PCE pricesexcluding food and energy(percent change, Q4 to Q4)Projection 2.2 2.0Confidence interval
Greenbook forecast errors 1.6–2.8 1.1–3.0FRB/US stochastic simulations 1.8–2.6 1.4–2.7
Federal funds rate(percent, Q4)Projection 5.2 5.0Confidence interval
FRB/US stochastic simulations 4.6–5.9 3.7–6.5
Note. Shocks underlying FRB/US stochastic simulations arerandomly drawn from the 1986-2005 set of model equation residuals.Intervals derived from Greenbook forecast errors are based on the1986-2005 set of Greenbook historical errors.

Greenbook baseline
Business pessimism
Business pessimism with spillovers
Stronger aggregate demand
Slower productivity growth with stable participation
Lower NAIRU
Market-based federal funds rate
2005 2006 2007 2008
-1
0
1
2
3
4
5
6
-1
0
1
2
3
4
5
64-quarter percent change
90 percent interval
70 percent interval
Real GDP
2005 2006 2007 2008
0.5
1.0
1.5
2.0
2.5
3.0
3.5
0.5
1.0
1.5
2.0
2.5
3.0
3.54-quarter percent change
PCE Prices excluding Food and Energy
2005 2006 2007 2008
2
3
4
5
6
7
8
2
3
4
5
6
7
8Percent
Federal Funds Rate
2005 2006 2007 2008
4.0
4.5
5.0
5.5
6.0
4.0
4.5
5.0
5.5
6.0Percent
Unemployment Rate
Class II FOMC - Restricted (FR)
Forecast Confidence Intervals and Alternative Scenarios under
the Assumption that Monetary Policy Follows an Estimated Taylor Rule
Confidence Intervals based on FRB/US Stochastic Simulations
I-22

Class II FOMC - Restricted (FR)
Evolution of the Staff Forecast
1.5
2.0
2.5
3.0
3.5
4.0
1.5
2.0
2.5
3.0
3.5
4.0
Percent, Q4/Q4
1/26 3/16 4/28 6/22 8/4 9/14 10/26 12/7 1/25 3/22 5/3 6/21 8/3 9/13 10/18 12/6 1/24 3/14 5/2 6/20 8/2 9/12 10/24 12/5
2006
2007 2008
Greenbook publication date 2005 2006 2007
Change in Real GDP
4.4
4.6
4.8
5.0
5.2
5.4
5.6
4.4
4.6
4.8
5.0
5.2
5.4
5.6
Percent, fourth quarter
1/26 3/16 4/28 6/22 8/4 9/14 10/26 12/7 1/25 3/22 5/3 6/21 8/3 9/13 10/18 12/6 1/24 3/14 5/2 6/20 8/2 9/12 10/24 12/5
Greenbook publication date 2005 2006 2007
2006
2007
2008
Unemployment Rate
1.0
1.5
2.0
2.5
3.0
1.0
1.5
2.0
2.5
3.0
Percent, Q4/Q4
1/26 3/16 4/28 6/22 8/4 9/14 10/26 12/7 1/25 3/22 5/3 6/21 8/3 9/13 10/18 12/6 1/24 3/14 5/2 6/20 8/2 9/12 10/24 12/5
Greenbook publication date
2005 2006 2007
2006
2007
2008
Change in PCE Prices excluding Food and Energy
I-23
Page 2 of 2

Cla
ss I
I FO
MC
Mar
ch 1
4, 2
007
Res
tric
ted
(FR
)C
hang
es in
GD
P, P
rice
s, a
nd U
nem
ploy
men
t(P
erce
nt, a
nnua
l rat
e ex
cept
as
note
d)
Nom
inal
GD
P
R
eal G
DP
PC
E p
rice
inde
x
C
ore
PCE
pri
ce in
dex
Une
mpl
oym
ent r
ate1
Inte
rval
01/2
4/07
03/1
4/07
01/2
4/07
03/1
4/07
01/2
4/07
03/1
4/07
01/2
4/07
03/1
4/07
01/2
4/07
03/1
4/07
Qua
rter
ly20
06:Q
19.
09.
05.
65.
62.
02.
02.
12.
14.
74.
7
Q2
5.9
5.9
2.6
2.6
4.0
4.0
2.7
2.7
4.7
4.7
Q
33.
83.
82.
02.
02.
42.
42.
22.
24.
74.
7
Q4
4.6
3.9
2.6
2.2
-.8
-.9
2.1
1.9
4.5
4.5
2007
:Q1
5.7
5.5
2.0
1.5
1.9
2.9
2.2
2.2
4.6
4.6
Q
24.
75.
12.
32.
32.
42.
82.
22.
24.
74.
7
Q3
4.7
4.3
2.4
2.3
2.4
2.2
2.2
2.2
4.8
4.8
Q
44.
74.
52.
52.
32.
22.
22.
12.
24.
84.
9
2008
:Q1
5.0
4.7
2.5
2.3
2.2
2.1
2.1
2.1
4.9
4.9
Q
24.
94.
72.
52.
32.
12.
12.
02.
14.
95.
0
Q3
4.8
4.6
2.5
2.3
2.0
2.0
2.0
2.0
4.9
5.0
Q
44.
74.
52.
52.
32.
02.
02.
02.
04.
95.
1
Tw
o-qu
arte
r2
2006
:Q2
7.5
7.5
4.1
4.1
3.0
3.0
2.4
2.4
-.3
-.3
Q
44.
23.
92.
32.
1.8
.72.
12.
0-.
2-.
2
2007
:Q2
5.2
5.3
2.2
1.9
2.2
2.9
2.2
2.2
.2.2
Q
44.
74.
42.
42.
32.
32.
22.
12.
2.1
.2
2008
:Q2
4.9
4.7
2.5
2.3
2.1
2.1
2.0
2.1
.1.1
Q
44.
74.
52.
52.
32.
02.
02.
02.
0.0
.1
Fou
r-qu
arte
r3
2005
:Q4
6.4
6.4
3.1
3.1
3.1
3.1
2.1
2.1
-.4
-.4
2006
:Q4
5.8
5.7
3.2
3.1
1.9
1.9
2.3
2.2
-.5
-.5
2007
:Q4
5.0
4.8
2.3
2.1
2.2
2.5
2.2
2.2
.4.4
2008
:Q4
4.8
4.6
2.5
2.3
2.1
2.1
2.0
2.0
.1.2
Ann
ual
2005
6.3
6.3
3.2
3.2
2.9
2.9
2.1
2.1
5.1
5.1
2006
6.4
6.3
3.3
3.3
2.8
2.8
2.2
2.2
4.6
4.6
2007
4.9
4.7
2.3
2.1
1.8
2.1
2.2
2.2
4.7
4.7
2008
4.8
4.6
2.5
2.3
2.2
2.2
2.1
2.1
4.9
5.0
1. L
evel
, exc
ept f
or tw
o-qu
arte
r an
d fo
ur-q
uart
er in
terv
als.
2. P
erce
nt c
hang
e fr
om tw
o qu
arte
rs e
arlie
r; f
or u
nem
ploy
men
t rat
e, c
hang
e is
in p
erce
ntag
e po
ints
. 3
. Per
cent
cha
nge
from
fou
r qu
arte
rs e
arlie
r; f
or u
nem
ploy
men
t rat
e, c
hang
e is
in p
erce
ntag
e po
ints
.
I-24

Cla
ss I
I FO
MC
Mar
ch 1
4, 2
007
Res
tric
ted
(FR
)C
hang
es in
Rea
l Gro
ss D
omes
tic
Pro
duct
and
Rel
ated
Ite
ms
(Per
cent
, ann
ual r
ate
exce
pt a
s no
ted)
2
006
20
07
200
8
Item
Q1
Q2
Q3
Q4
Q1
Q2
Q3
Q4
Q1
Q2
Q3
Q4
2006
1 20
071
2008
1
Rea
l GD
P
5.6
2.6
2.0
2.2
1.
52.
32.
32.
3
2.3
2.3
2.3
2.3
3.
12.
12.
3P
revi
ous
5.
62.
62.
02.
6
2.0
2.3
2.4
2.5
2.
52.
52.
52.
5
3.2
2.3
2.5
Fina
l sal
es
5.6
2.1
1.9
3.6
1.
42.
02.
31.
9
2.1
2.7
2.6
2.4
3.
31.
92.
4P
revi
ous
5.
62.
11.
93.
9
1.6
2.4
2.5
2.0
2.
22.
82.
72.
5
3.4
2.2
2.5
Priv
. dom
. fin
al p
urch
.
5.5
1.8
2.1
1.6
1.
9.8
1.8
2.1
2.
42.
52.
62.
7
2.7
1.7
2.6
Pre
viou
s
5.5
1.8
2.1
2.1
2.
02.
32.
52.
5
2.8
2.8
2.8
2.9
2.
82.
32.
8
Pers
onal
con
s. e
xpen
d.
4.8
2.6
2.8
4.1
3.
72.
22.
12.
1
2.3
2.4
2.5
2.5
3.
62.
52.
4P
revi
ous
4.
82.
62.
84.
6
3.6
2.4
2.5
2.6
2.
72.
72.
72.
7
3.7
2.8
2.7
Dur
able
s
19.8
-.1
6.4
4.3
6.
1.8
2.6
2.7
3.
03.
33.
83.
6
7.4
3.0
3.4
Non
dura
bles
5.
91.
41.
55.
9
3.3
2.3
2.2
2.2
2.
22.
32.
32.
3
3.7
2.5
2.3
Serv
ices
1.
63.
72.
83.
2
3.5
2.4
1.9
2.0
2.
22.
22.
42.
5
2.8
2.5
2.3
Res
iden
tial i
nves
tmen
t
-.3
-11.
1-1
8.7
-19.
7
-22.
2-1
9.9
-6.2
-1.6
-.
52.
12.
43.
6
-12.
8-1
2.9
1.9
Pre
viou
s
-.3
-11.
1-1
8.7
-20.
6
-21.
2-8
.7-2
.2-1
.6
-.7
2.2
2.7
4.1
-1
3.0
-8.8
2.0
Bus
ines
s fi
xed
inve
st.
13
.74.
410
.0-2
.5
2.8
2.7
3.9
3.9
4.
63.
83.
73.
4
6.2
3.3
3.9
Pre
viou
s
13.7
4.4
10.0
-1.4
3.
97.
74.
44.
2
4.9
4.0
4.0
4.0
6.
55.
14.
2E
quip
men
t & s
oftw
are
15
.6-1
.47.
7-3
.4
2.4
.83.
44.
1
5.8
4.9
5.0
4.7
4.
42.
75.
1P
revi
ous
15
.6-1
.47.
7-4
.1
3.4
8.5
4.5
4.7
6.
35.
25.
65.
9
4.2
5.2
5.7
Non
res.
str
uctu
res
8.
720
.315
.7-.
5
3.8
7.0
4.8
3.5
2.
21.
61.
0.6
10
.84.
81.
3P
revi
ous
8.
720
.315
.75.
0
5.3
6.0
4.3
3.1
1.
91.
5.7
.1
12.3
4.7
1.1
Net
exp
orts
2
-637
-624
-629
-584
-5
96-5
84-5
79-5
89
-602
-599
-601
-609
-6
18-5
87-6
03P
revi
ous2
-6
37-6
24-6
29-5
96
-610
-610
-609
-625
-6
42-6
43-6
46-6
57
-621
-613
-647
Exp
orts
14
.06.
26.
810
.6
5.2
6.1
5.8
5.5
5.
35.
25.
15.
1
9.4
5.7
5.2
Impo
rts
9.
11.
45.
6-2
.4
6.3
1.7
3.0
5.9
6.
53.
04.
05.
1
3.3
4.2
4.7
Gov
t. co
ns. &
inve
st.
4.
9.8
1.7
3.3
1.
44.
82.
82.
2
2.2
2.1
2.0
2.0
2.
72.
82.
1P
revi
ous
4.
9.8
1.7
4.9
2.
32.
22.
02.
0
2.0
2.0
1.8
1.8
3.
02.
11.
9Fe
dera
l
8.8
-4.5
1.3
4.4
-.
58.
53.
41.
7
1.6
1.6
1.5
1.5
2.
43.
21.
5D
efen
se
8.9
-2.0
-1.2
12.3
-2
.812
.85.
02.
5
2.4
2.3
2.2
2.1
4.
34.
22.
3N
onde
fens
e
8.5
-9.3
6.5
-10.
2
4.6
.0.0
.0
.0.0
.0.0
-1
.51.
1.0
Stat
e &
loca
l
2.7
4.0
1.9
2.6
2.
42.
62.
52.
5
2.5
2.5
2.3
2.3
2.
82.
52.
4
Cha
nge
in b
us. i
nven
tori
es2
41
5455
18
2127
2738
45
3427
23
4228
32P
revi
ous2
41
5455
20
3027
2235
44
3631
30
4329
35N
onfa
rm2
37
5253
16
2227
2739
46
3526
23
3929
33Fa
rm2
4
22
2
-01
11
1
11
1
31
1
1. C
hang
e fr
om f
ourt
h qu
arte
r of
pre
viou
s ye
ar to
fou
rth
quar
ter
of y
ear
indi
cate
d. 2
. Bill
ions
of
chai
ned
(200
0) d
olla
rs.
I-25

Cla
ss I
I FO
MC
Mar
ch 1
4, 2
007
Res
tric
ted
(FR
)C
hang
es in
Rea
l Gro
ss D
omes
tic
Pro
duct
and
Rel
ated
Ite
ms
(Per
cent
, ann
ual r
ate
exce
pt a
s no
ted)
Item
2000
1
20
011
2002
1
20
031
2004
1
20
051
2006
1
20
071
2008
1
Rea
l GD
P
2.2
.21.
93.
73.
43.
13.
12.
12.
3P
revi
ous
2.
2.2
1.9
3.7
3.4
3.1
3.2
2.3
2.5
Fina
l sal
es
2.9
1.5
.83.
73.
13.
23.
31.
92.
4P
revi
ous
2.
91.
5.8
3.7
3.1
3.2
3.4
2.2
2.5
Priv
. dom
. fin
al p
urch
.
4.3
1.0
1.1
4.1
4.4
3.6
2.7
1.7
2.6
Pre
viou
s
4.3
1.0
1.1
4.1
4.4
3.6
2.8
2.3
2.8
Pers
onal
con
s. e
xpen
d.
4.1
2.8
1.9
3.4
4.0
2.9
3.6
2.5
2.4
Pre
viou
s
4.1
2.8
1.9
3.4
4.0
2.9
3.7
2.8
2.7
Dur
able
s
4.7
10.8
1.2
8.3
5.6
2.5
7.4
3.0
3.4
Non
dura
bles
3.
01.
92.
13.
93.
84.
43.
72.
52.
3Se
rvic
es
4.5
1.6
1.9
2.2
3.7
2.3
2.8
2.5
2.3
Res
iden
tial i
nves
tmen
t
-1.9
1.4
7.0
11.7
6.1
9.0
-12.
8-1
2.9
1.9
Pre
viou
s
-1.9
1.4
7.0
11.7
6.1
9.0
-13.
0-8
.82.
0
Bus
ines
s fi
xed
inve
st.
7.
8-9
.6-6
.54.
96.
95.
66.
23.
33.
9P
revi
ous
7.
8-9
.6-6
.54.
96.
95.
66.
55.
14.
2E
quip
men
t & s
oftw
are
7.
5-9
.0-3
.46.
68.
37.
04.
42.
75.
1P
revi
ous
7.
5-9
.0-3
.46.
68.
37.
04.
25.
25.
7N
onre
s. s
truc
ture
s
8.8
-11.
1-1
4.9
.22.
71.
810
.84.
81.
3P
revi
ous
8.
8-1
1.1
-14.
9.2
2.7
1.8
12.3
4.7
1.1
Net
exp
orts
2
-379
-399
-471
-519
-591
-619
-618
-587
-603
Pre
viou
s2
-379
-399
-471
-519
-591
-619
-621
-613
-647
Exp
orts
6.
5-1
1.9
3.8
5.8
7.0
6.7
9.4
5.7
5.2
Impo
rts
11
.2-7
.69.
74.
810
.65.
23.
34.
24.
7
Gov
t. co
ns. &
inve
st.
.4
5.0
4.0
1.7
1.1
1.2
2.7
2.8
2.1
Pre
viou
s
.45.
04.
01.
71.
11.
23.
02.
11.
9Fe
dera
l
-2.2
6.4
7.8
5.5
2.3
2.1
2.4
3.2
1.5
Def
ense
-3
.56.
58.
47.
52.
51.
94.
34.
22.
3N
onde
fens
e
.36.
36.
81.
91.
82.
4-1
.51.
1.0
Stat
e &
loca
l
1.7
4.2
2.1
-.4
.4.8
2.8
2.5
2.4
Cha
nge
in b
us. i
nven
tori
es2
56
-32
1214
5320
4228
32P
revi
ous2
56
-32
1214
5320
4329
35N
onfa
rm2
58
-32
1514
4720
3929
33Fa
rm2
-1
0-2
06
03
11
1. C
hang
e fr
om f
ourt
h qu
arte
r of
pre
viou
s ye
ar to
fou
rth
quar
ter
of y
ear
indi
cate
d. 2
. Bill
ions
of
chai
ned
(200
0) d
olla
rs.
I-26

Cla
ss I
I FO
MC
Mar
ch 1
4, 2
007
Res
tric
ted
(FR
)C
ontr
ibut
ions
to
Cha
nges
in R
eal G
ross
Dom
esti
c P
rodu
ct(P
erce
ntag
e po
ints
, ann
ual r
ate
exce
pt a
s no
ted)
2
006
200
7
20
08
Item
Q1
Q2
Q3
Q4
Q1
Q2
Q3
Q4
Q1
Q2
Q3
Q4
2006
1 20
071
2008
1
Rea
l GD
P
5.6
2.6
2.0
2.2
1.
52.
32.
32.
3
2.3
2.3
2.3
2.3
3.
12.
12.
3P
revi
ous
5.
62.
62.
02.
6
2.0
2.3
2.4
2.5
2.
52.
52.
52.
5
3.2
2.3
2.5
Fina
l sal
es
5.6
2.1
1.9
3.6
1.
42.
02.
31.
9
2.1
2.7
2.6
2.4
3.
31.
92.
4P
revi
ous
5.
62.
11.
93.
8
1.7
2.4
2.5
2.0
2.
22.
82.
72.
5
3.4
2.2
2.5
Priv
. dom
. fin
al p
urch
.
4.7
1.5
1.8
1.4
1.
6.7
1.6
1.8
2.
12.
22.
22.
3
2.3
1.4
2.2
Pre
viou
s
4.7
1.5
1.8
1.8
1.
72.
02.
12.
2
2.4
2.4
2.4
2.5
2.
42.
02.
4
Pers
onal
con
s. e
xpen
d.
3.4
1.8
2.0
2.9
2.
61.
51.
51.
5
1.6
1.7
1.8
1.8
2.
51.
81.
7P
revi
ous
3.
41.
82.
03.
2
2.5
1.6
1.7
1.8
1.
91.
91.
91.
9
2.6
1.9
1.9
Dur
able
s
1.5
.0.5
.3
.5.1
.2.2
.2
.3.3
.3
.6.2
.3N
ondu
rabl
es
1.2
.3.3
1.2
.7
.5.4
.4
.5.5
.5.5
.7
.5.5
Serv
ices
.7
1.5
1.1
1.3
1.
51.
0.8
.8
.9.9
1.0
1.0
1.
21.
01.
0
Res
iden
tial i
nves
tmen
t
.0-.
7-1
.2-1
.2
-1.3
-1.1
-.3
-.1
.0
.1.1
.2
-.8
-.7
.1P
revi
ous
.0
-.7
-1.2
-1.3
-1
.2-.
4-.
1-.
1
.0.1
.1.2
-.
8-.
5.1
Bus
ines
s fi
xed
inve
st.
1.
4.5
1.0
-.3
.3
.3.4
.4
.5.4
.4.4
.6
.3.4
Pre
viou
s
1.4
.51.
0-.
2
.4.8
.5.4
.5
.4.4
.4
.7.5
.5E
quip
men
t & s
oftw
are
1.
1-.
1.6
-.3
.2
.1.2
.3
.4.3
.4.3
.3
.2.4
Pre
viou
s
1.1
-.1
.6-.
3
.2.6
.3.3
.5
.4.4
.4
.3.4
.4N
onre
s. s
truc
ture
s
.3.6
.5.0
.1
.2.2
.1
.1.1
.0.0
.3
.2.0
Pre
viou
s
.3.6
.5.2
.2
.2.1
.1
.1.1
.0.0
.4
.2.0
Net
exp
orts
.0
.4-.
21.
6
-.4
.4.2
-.3
-.
5.1
-.1
-.3
.4
-.1
-.2
Pre
viou
s
.0.4
-.2
1.1
-.
5.0
.0-.
5
-.6
.0-.
1-.
4
.3-.
2-.
3E
xpor
ts
1.4
.7.7
1.1
.6
.7.7
.6
.6.6
.6.6
1.
0.6
.6Im
port
s
-1.5
-.2
-.9
.4
-1.0
-.3
-.5
-1.0
-1
.1-.
5-.
7-.
8
-.6
-.7
-.8
Gov
t. co
ns. &
inve
st.
.9
.2.3
.6
.3.9
.5.4
.4
.4.4
.4
.5.5
.4P
revi
ous
.9
.2.3
.9
.4.4
.4.4
.4
.4.3
.4
.6.4
.4Fe
dera
l
.6-.
3.1
.3
.0.6
.2.1
.1
.1.1
.1
.2.2
.1D
efen
se
.4-.
1-.
1.5
-.
1.6
.2.1
.1
.1.1
.1
.2.2
.1N
onde
fens
e
.2-.
2.2
-.2
.1
.0.0
.0
.0.0
.0.0
.0
.0.0
Stat
e &
loca
l
.3.5
.2.3
.3
.3.3
.3
.3.3
.3.3
.3
.3.3
Cha
nge
in b
us. i
nven
tori
es
.0.4
.1-1
.3
.1.2
.0.4
.2
-.4
-.3
-.1
-.
2.2
-.1
Pre
viou
s
.0.4
.1-1
.2
.3-.
1-.
2.4
.3
-.3
-.2
.0
-.2
.1.0
Non
farm
.0
.5.1
-1.3
.2
.2.0
.4
.2-.
4-.
3-.
1
-.2
.2-.
1Fa
rm
.0-.
1.0
.0
-.1
.0.0
.0
.0.0
.0.0
.0
.0.0
1. C
hang
e fr
om f
ourt
h qu
arte
r of
pre
viou
s ye
ar to
fou
rth
quar
ter
of y
ear
indi
cate
d.
I-27

Cla
ss I
I FO
MC
Mar
ch 1
4, 2
007
Res
tric
ted
(FR
)C
hang
es in
Pri
ces
and
Cos
ts(P
erce
nt, a
nnua
l rat
e ex
cept
as
note
d)
2006
200
7
20
08
Item
Q1
Q2
Q3
Q4
Q1
Q2
Q3
Q4
Q1
Q2
Q3
Q4
2006
1 20
071
2008
1
GD
P ch
ain-
wt.
pric
e in
dex
3.3
3.3
1.9
1.6
3.9
2.7
2.0
2.1
2.4
2.3
2.2
2.1
2.5
2.7
2.3
Pre
viou
s3.
33.
31.
91.
93.
72.
42.
32.
22.
42.
32.
22.
12.
62.
62.
3PC
E c
hain
-wt.
pric
e in
dex
2.0
4.0
2.4
-.9
2.9
2.8
2.2
2.2
2.1
2.1
2.0
2.0
1.9
2.5
2.1
Pre
viou
s2.
04.
02.
4-.
81.
92.
42.
42.
22.
22.
12.
02.
01.
92.
22.
1E
nerg
y.1
29.7
3.7
-36.
010
.59.
91.
92.
32.
31.
91.
61.
3-3
.66.
11.
7P
revi
ous
.129
.73.
7-3
6.6
-5.7
3.2
6.1
4.0
3.2
2.3
1.9
1.4
-3.9
1.8
2.2
Food
2.7
1.7
2.9
1.9
4.1
3.4
2.6
2.4
2.3
2.3
2.2
2.2
2.3
3.1
2.2
Pre
viou
s2.
71.
72.
91.
83.
63.
12.
62.
42.
32.
22.
22.
22.
32.
92.
2E
x. f
ood
& e
nerg
y2.
12.
72.
21.
92.
22.
22.
22.
22.
12.
12.
02.
02.
22.
22.
0P
revi
ous
2.1
2.7
2.2
2.1
2.2
2.2
2.2
2.1
2.1
2.0
2.0
2.0
2.3
2.2
2.0
CPI
1.8
5.1
3.0
-2.0
3.3
3.2
2.3
2.3
2.3
2.2
2.2
2.1
1.9
2.8
2.2
Pre
viou
s2.
24.
93.
0-2
.12.
02.
62.
62.
42.
32.
22.
12.
12.
02.
42.
2E
x. f
ood
& e
nerg
y2.
43.
23.
21.
82.
42.
52.
42.
32.
32.
32.
22.
22.
72.
42.
2P
revi
ous
2.4
3.6
3.0
1.8
2.4
2.5
2.3
2.3
2.2
2.2
2.2
2.2
2.7
2.4
2.2
EC
I, h
ourl
y co
mpe
nsat
ion2
2.4
3.2
3.6
3.2
3.9
3.9
4.0
3.9
3.9
3.9
4.0
3.9
3.2
3.9
3.9
Pre
viou
s22.
43.
23.
63.
84.
04.
04.
04.
04.
04.
04.
04.
03.
24.
04.
0N
onfa
rm b
usin
ess
sect
orO
utpu
t per
hou
r3.
51.
2-.
51.
62.
01.
12.
62.
62.
62.
62.
62.
61.
52.
12.
6P
revi
ous
4.3
1.2
-.2
.91.
52.
52.
72.
82.
72.
62.
62.
51.
52.
42.
6C
ompe
nsat
ion
per
hour
12.9
-1.4
.68.
22.
24.
54.
84.
84.
84.
84.
94.
84.
94.
14.
8P
revi
ous
13.7
-1.2
3.1
4.6
4.9
4.9
4.9
4.9
4.9
5.0
4.8
4.8
4.9
4.9
4.9
Uni
t lab
or c
osts
9.1
-2.5
1.1
6.5
.33.
42.
12.
12.
22.
22.
32.
23.
42.
02.
2P
revi
ous
9.0
-2.4
3.2
3.7
3.3
2.3
2.2
2.0
2.1
2.3
2.1
2.2
3.3
2.4
2.2
1. C
hang
e fr
om f
ourt
h qu
arte
r of
pre
viou
s ye
ar to
fou
rth
quar
ter
of y
ear
indi
cate
d. 2
. Pri
vate
-ind
ustr
y w
orke
rs.
I-28

Cla
ss I
I FO
MC
Mar
ch 1
4, 2
007
Res
tric
ted
(FR
)O
ther
Mac
roec
onom
ic I
ndic
ator
s
20
06
200
7
200
8
Item
Q1
Q2
Q3
Q4
Q1
Q2
Q3
Q4
Q1
Q2
Q3
Q4
2006
1 20
071
2008
1
Em
ploy
men
t and
pro
duct
ion
Non
farm
pay
roll
empl
oym
ent2
.7.5
.5.5
.5.3
.1.1
.2.1
.1.1
2.3
1.1
.6U
nem
ploy
men
t rat
e34.
74.
74.
74.
54.
64.
74.
84.
94.
95.
05.
05.
14.
54.
95.
1P
revi
ous3
4.7
4.7
4.7
4.5
4.6
4.7
4.8
4.8
4.9
4.9
4.9
4.9
4.5
4.8
4.9
GD
P ga
p4.8
.8.6
.5.2
.1.1
.0.0
-.1
-.1
-.2
.5.0
-.2
Pre
viou
s4.7
.6.5
.4.3
.2.2
.1.1
.1.1
.1.4
.1.1
Indu
stri
al p
rodu
ctio
n55.
06.
54.
0-.
81.
82.
63.
43.
13.
33.
03.
43.
93.
72.
73.
4P
revi
ous5
5.0
6.5
4.0
-.5
2.8
3.4
3.2
3.4
4.0
3.4
3.5
3.6
3.7
3.2
3.6
Man
ufac
turi
ng in
dust
r. p
rod.
55.
55.
54.
4-1
.7.9
3.5
3.8
3.3
3.6
3.6
3.6
3.9
3.4
2.8
3.7
Pre
viou
s55.
55.
54.
4-1
.43.
43.
73.
53.
64.
54.
03.
63.
73.
53.
54.
0C
apac
ity u
tiliz
atio
n ra
te -
mfg
.380
.180
.680
.980
.179
.880
.080
.380
.480
.580
.780
.881
.080
.180
.481
.0P
revi
ous3
80.1
80.6
80.9
80.2
80.3
80.5
80.7
81.0
81.2
81.3
81.3
81.4
80.2
81.0
81.4
Hou
sing
sta
rts6
2.1
1.9
1.7
1.6
1.4
1.4
1.5
1.5
1.5
1.5
1.6
1.6
1.8
1.5
1.6
Lig
ht m
otor
veh
icle
sal
es6
16.9
16.3
16.6
16.3
16.6
16.5
16.5
16.4
16.4
16.4
16.3
16.3
16.5
16.5
16.4
Inco
me
and
savi
ngN
omin
al G
DP5
9.0
5.9
3.8
3.9
5.5
5.1
4.3
4.5
4.7
4.7
4.6
4.5
5.7
4.8
4.6
Rea
l dis
posa
ble
pers
. inc
ome5
4.6
-1.5
3.2
5.3
6.0
.63.
23.
24.
12.
63.
83.
42.
93.
23.
5P
revi
ous5
4.6
-1.5
4.1
6.5
5.0
3.0
3.3
3.4
4.1
3.2
3.5
3.4
3.4
3.7
3.5
Pers
onal
sav
ing
rate
3-.
3-1
.4-1
.4-1
.2-.
6-1
.0-.
7-.
4.0
.1.4
.6-1
.2-.
4.6
Pre
viou
s3-.
3-1
.4-1
.2-.
7-.
4-.
2.0
.2.5
.6.8
1.0
-.7
.21.
0
Cor
pora
te p
rofi
ts7
60.8
5.9
16.4
7.1
.1-1
.9-5
.4-3
.6.2
.3-1
.3-1
.220
.7-2
.7-.
5Pr
ofit
shar
e of
GN
P312
.012
.012
.412
.512
.312
.111
.811
.611
.511
.411
.211
.112
.511
.611
.1
Net
fed
eral
sav
ing8
-147
-163
-173
-131
-181
-174
-190
-208
-235
-226
-237
-251
-153
-188
-237
Net
sta
te &
loca
l sav
ing8
1326
-10
-16
110
-11
-11
-16
-15
-24
-29
3-3
-21
Gro
ss n
atio
nal s
avin
g ra
te3
14.4
13.5
13.3
14.2
13.5
13.4
13.1
13.0
13.0
13.0
13.0
12.9
14.2
13.0
12.9
Net
nat
iona
l sav
ing
rate
32.
91.
91.
72.
42.
62.
01.
81.
61.
61.
61.
61.
52.
41.
61.
5
1. C
hang
e fr
om f
ourt
h qu
arte
r of
pre
viou
s ye
ar to
fou
rth
quar
ter
of y
ear
indi
cate
d, u
nles
s ot
herw
ise
indi
cate
d. 2
. Cha
nge,
mill
ions
. 3
. Per
cent
, ann
ual v
alue
s ar
e fo
r th
e fo
urth
qua
rter
of
the
year
indi
cate
d. 4
. Per
cent
dif
fere
nce
betw
een
actu
al a
nd p
oten
tial G
DP;
a n
egat
ive
num
ber
indi
cate
s th
at th
e ec
onom
y is
ope
ratin
g be
low
pot
entia
l. (
In p
revi
ous
Gre
enbo
oks,
we
expr
esse
d th
e G
DP
gap
with
the
oppo
site
sig
n, s
o th
at a
pos
itive
num
ber
indi
cate
d th
at a
ctua
l out
put f
ell s
hort
of
pote
ntia
l.)
A
nnua
l val
ues
are
for
the
four
th q
uart
er o
f th
e ye
ar in
dica
ted.
5. P
erce
nt c
hang
e, a
nnua
l rat
e. 6
. Lev
el, m
illio
ns, a
nnua
l val
ues
are
annu
al a
vera
ges.
7. P
erce
nt c
hang
e, a
nnua
l rat
e, w
ith in
vent
ory
valu
atio
n an
d ca
pita
l con
sum
ptio
n ad
just
men
ts.
8. B
illio
ns o
f do
llars
, ann
ual v
alue
s ar
e an
nual
ave
rage
s.
I-29

Cla
ss I
I F
OM
CM
arch
14,
200
7R
estr
icte
d (F
R)
Staf
f P
roje
ctio
ns o
f F
eder
al S
ecto
r A
ccou
nts
and
Rel
ated
Ite
ms
(Bill
ions
of
dolla
rs e
xcep
t as
note
d)
Fisc
al y
ear
2006
2007
2008
Item
2005
a20
06a
2007
2008
Q1a
Q2a
Q3a
Q4
Q1
Q2
Q3
Q4
Q1
Q2
Q3
Q4
Uni
fied
bud
get
Not
sea
sona
lly a
djus
ted
Rec
eipt
s121
5424
0725
5926
63
507
772
597
574
533
844
609
599
547
879
638
621
Out
lays
124
7226
5527
4029
07
691
676
639
654
716
701
669
729
739
726
714
764
Surp
lus/
defi
cit1
-318
-248
-180
-243
-1
8496
-42
-80
-183
143
-60
-129
-192
153
-75
-143
P
revi
ous
-3
19-2
48-2
32-2
69
-184
96-4
2-8
0-2
0912
5-6
7-1
33-1
9214
1-8
5-1
49
On-
budg
et
-494
-435
-372
-445
-2
1611
-60
-142
-211
55-7
4-1
97-2
1758
-90
-216
O
ff-b
udge
t
17
518
619
120
2
3285
1962
2889
1468
2595
1473
Mea
ns o
f fi
nanc
ing
B
orro
win
g
297
237
190
260
15
6-7
543
5916
7-1
1680
114
181
-120
8513
3
Cas
h de
crea
se
1
-16
125
28
-38
-621
20-2
0-1
015
15-2
50
10
Oth
er2
2128
-21
-22
-1
165
0-4
-7-1
0-0
-4-7
-10
-0
Cas
h op
erat
ing
bala
nce,
end
of
peri
od
36
5240
35
846
5231
1131
4025
1035
3525
NIP
A f
eder
al s
ecto
r
Se
ason
ally
adj
uste
d an
nual
rat
es
Rec
eipt
s
21
7424
8026
2727
31
2491
2523
2557
2584
2618
2642
2667
2691
2719
2743
2771
2798
Exp
endi
ture
s
2509
2667
2797
2957
26
3826
8627
3027
1427
9928
1628
5728
9929
5329
7030
0830
49
Con
sum
ptio
n ex
pend
iture
s
758
797
840
890
80
480
280
981
783
085
186
287
088
989
690
491
2
D
efen
se
50
953
357
060
9
538
538
539
553
559
578
588
594
608
614
620
626
Non
defe
nse
24
926
427
028
1
266
265
270
264
271
272
274
275
281
282
284
285
O
ther
spe
ndin
g
1751
1870
1957
2068
18
3418
8419
2118
9719
6919
6619
9520
2920
6520
7321
0421
37C
urre
nt a
ccou
nt s
urpl
us
-3
35-1
87-1
69-2
26
-147
-163
-173
-131
-181
-174
-190
-208
-235
-226
-237
-251
Gro
ss in
vest
men
t
107
117
124
132
11
811
711
812
012
112
612
913
013
113
213
313
4G
ross
sav
ing
less
gro
ss
i
nves
tmen
t3-3
44-2
01-1
86-2
45
-163
-177
-186
-145
-196
-193
-209
-227
-254
-245
-255
-270
Fis
cal i
ndic
ator
s4H
igh-
empl
oym
ent (
HE
B)
sur
plus
/def
icit
-3
40-2
25-2
03-2
44
-193
-210
-214
-173
-215
-206
-218
-232
-253
-242
-249
-261
Cha
nge
in H
EB
, per
cent
of
pote
ntia
l GD
P
-0
.3-1
.0-0
.30.
2
-0.7
0.1
0.0
-0.3
0.3
-0.1
0.1
0.1
0.1
-0.1
0.0
0.1
Fisc
al im
petu
s (F
I),
per
cent
of
GD
P
0.
20.
30.
30.
1
0.2
-0.0
0.0
0.1
0.1
0.1
0.0
0.1
-0.0
0.0
0.0
0.0
P
revi
ous
0.
20.
30.
30.
1
0.2
-0.0
0.0
0.1
0.1
-0.0
-0.0
0.0
0.0
0.0
0.0
0.0
1
. Bud
get r
ecei
pts,
out
lays
, and
sur
plus
/def
icit
incl
ude
corr
espo
ndin
g so
cial
sec
urity
(O
ASD
I) c
ateg
orie
s. T
he O
ASD
I su
rplu
s an
d th
e Po
stal
Ser
vice
sur
plus
are
exc
lude
d fr
om th
e on
-bud
get
s
urpl
us a
nd s
how
n se
para
tely
as
off-
budg
et, a
s cl
assi
fied
und
er c
urre
nt la
w.
2
. Oth
er m
eans
of
fina
ncin
g ar
e ch
ecks
issu
ed le
ss c
heck
s pa
id, a
ccru
ed it
ems,
and
cha
nges
in o
ther
fin
anci
al a
sset
s an
d lia
bilit
ies.
3
. Gro
ss s
avin
g is
the
curr
ent a
ccou
nt s
urpl
us p
lus
cons
umpt
ion
of f
ixed
cap
ital o
f th
e ge
nera
l gov
ernm
ent a
s w
ell a
s go
vern
men
t ent
erpr
ises
.
4. H
EB
is g
ross
sav
ing
less
gro
ss in
vest
men
t (N
IPA
) of
the
fede
ral g
over
nmen
t in
curr
ent d
olla
rs, w
ith c
yclic
ally
sen
sitiv
e re
ceip
ts a
nd o
utla
ys a
djus
ted
to th
e st
aff’
s m
easu
re o
f po
tent
ial o
utpu
t and
the
NA
IRU
. Qua
rter
ly f
igur
es f
or c
hang
e in
HE
B a
nd F
I ar
e no
t at a
nnua
l rat
es.
The
sig
n on
Cha
nge
in H
EB
, as
a pe
rcen
t of
nom
inal
pot
entia
l GD
P, is
rev
erse
d. F
I is
the
wei
ghte
d di
ffer
ence
of
disc
retio
nary
chan
ges
in f
eder
al s
pend
ing
and
taxe
s in
cha
ined
(20
00)
dolla
rs, s
cale
d by
rea
l GD
P. T
he a
nnua
l FI
estim
ates
are
on
a ca
lend
ar y
ear
basi
s. A
lso,
for
FI
and
the
chan
ge in
HE
B, p
ositi
ve v
alue
s in
dica
teag
greg
ate
dem
and
stim
ulus
.
a--
Act
ual
I-30

Cla
ss I
I F
OM
CC
hang
e in
Deb
t of
the
Dom
esti
c N
onfi
nanc
ial S
ecto
rsM
arch
14,
200
7 R
estr
icte
d (F
R)
(Per
cent
)
Hou
seho
lds
Mem
o:H
ome
Con
sum
erSt
ate
and
loca
lFe
dera
lN
omin
alPe
riod
1T
otal
Tot
alm
ortg
ages
cred
itB
usin
ess
gove
rnm
ents
gove
rnm
ent
GD
P
Yea
r20
016.
39.
310
.18.
66.
08.
8-.
22.
720
027.
210
.612
.95.
92.
511
.07.
63.
620
038.
211
.614
.45.
22.
78.
310
.95.
920
049.
011
.614
.25.
55.
87.
49.
06.
7
2005
9.4
11.7
13.8
4.2
7.3
10.2
7.0
6.4
2006
7.9
8.6
8.9
4.8
9.1
8.2
3.9
5.7
2007
6.5
5.9
5.8
4.2
7.9
7.5
5.0
4.8
2008
6.0
5.4
5.7
3.1
6.7
7.3
5.4
4.6
Qua
rter
2006
:19.
59.
710
.92.
49.
63.
311
.39.
02
6.8
9.4
9.4
6.4
8.3
6.7
-2.4
5.9
36.
57.
57.
85.
56.
58.
23.
33.
84
7.9
6.6
6.4
4.5
10.9
13.5
3.3
3.9
2007
:17.
86.
05.
94.
78.
66.
411
.85.
52
4.6
5.8
5.7
4.4
7.9
7.7
-5.6
5.1
36.
55.
65.
63.
97.
67.
66.
24.
34
6.4
5.5
5.6
3.6
6.9
7.4
7.5
4.5
2008
:17.
05.
35.
63.
26.
47.
312
.34.
72
4.0
5.3
5.5
3.1
6.7
7.2
-5.6
4.7
36.
05.
35.
53.
06.
67.
16.
34.
64
6.3
5.2
5.5
3.0
6.6
6.9
8.6
4.5
N
ote.
Qua
rter
ly d
ata
are
at s
easo
nally
adj
uste
d an
nual
rat
es.
1.
Dat
a af
ter
2006
:Q4
are
staf
f pr
ojec
tions
. Cha
nges
are
mea
sure
d fr
om e
nd o
f th
e pr
eced
ing
peri
od to
end
of
peri
od in
dica
ted
exce
pt f
or a
nnua
l nom
inal
GD
P gr
owth
, whi
ch is
cal
cula
ted
from
Q4
to Q
4.
2.6.
3 F
OF
I-31

Cla
ss I
I F
OM
CF
low
of
Fun
ds P
roje
ctio
ns:
Hig
hlig
hts
Mar
ch 1
4, 2
007
Res
tric
ted
(FR
)(B
illio
ns o
f do
llars
at s
easo
nally
adj
uste
d an
nual
rat
es e
xcep
t as
note
d)
2006
2007
2008
Cat
egor
y20
0520
0620
0720
08Q
3 Q
4 Q
1 Q
2 Q
3 Q
4 Q
1 Q
2 Q
3 Q
4
Dom
esti
c no
nfin
anci
al s
ecto
rsN
et f
unds
rai
sed
T
otal
1915
.514
98.2
1473
.215
89.1
1269
.915
15.0
1725
.792
3.0
1602
.216
42.1
1898
.110
16.9
1649
.317
92.2
Net
equ
ity is
suan
ce-3
63.4
-602
.1-3
89.0
-232
.0-5
35.2
-701
.2-5
20.0
-432
.0-3
12.0
-292
.0-2
32.0
-232
.0-2
32.0
-232
.0
N
et d
ebt i
ssua
nce
2278
.821
00.3
1862
.218
21.1
1805
.122
16.2
2245
.713
55.0
1914
.219
34.1
2130
.112
48.9
1881
.320
24.2
Bor
row
ing
indi
cato
rs
Deb
t (pe
rcen
t of
GD
P) 1
204.
420
8.8
213.
621
6.9
209.
621
1.3
212.
621
3.2
213.
921
5.0
216.
121
6.6
216.
821
7.8
B
orro
win
g (p
erce
nt o
f G
DP)
18.3
15.9
13.4
12.6
13.5
16.5
16.5
9.8
13.7
13.7
14.9
8.7
12.9
13.7
H
ouse
hold
s
Net
bor
row
ing
212
38.8
1012
.075
2.2
731.
492
8.4
838.
077
3.0
755.
474
2.0
738.
572
4.8
726.
873
4.6
739.
5
H
ome
mor
tgag
es10
74.9
792.
556
3.8
579.
272
8.1
611.
756
9.7
560.
256
0.2
565.
056
9.7
574.
558
3.9
588.
7
C
onsu
mer
cre
dit
94.3
111.
110
2.0
78.9
131.
310
7.3
114.
110
7.7
96.6
89.5
82.2
79.5
77.2
76.8
D
ebt/D
PI (
perc
ent)
312
3.8
129.
313
1.2
131.
413
0.4
131.
313
0.5
131.
313
1.4
131.
513
1.3
131.
513
1.3
131.
3
B
usin
ess
F
inan
cing
gap
4-1
38.6
43.0
29.2
133.
148
.354
.2-1
8.7
3.6
44.3
87.8
117.
212
3.1
137.
015
4.9
N
et e
quity
issu
ance
-363
.4-6
02.1
-389
.0-2
32.0
-535
.2-7
01.2
-520
.0-4
32.0
-312
.0-2
92.0
-232
.0-2
32.0
-232
.0-2
32.0
C
redi
t mar
ket b
orro
win
g56
1.8
753.
471
4.8
653.
656
0.1
958.
076
9.5
723.
570
8.2
658.
061
7.9
663.
066
1.2
672.
2
S
tate
and
loca
l gov
ernm
ents
N
et b
orro
win
g17
1.4
151.
615
0.2
157.
715
6.6
262.
112
7.7
157.
715
7.7
157.
715
7.7
157.
715
7.7
157.
7
Cur
rent
sur
plus
520
3.8
211.
318
1.9
171.
721
0.2
168.
519
2.3
184.
017
4.7
176.
817
3.7
176.
916
9.5
166.
8
F
eder
al g
over
nmen
t
Net
bor
row
ing
306.
918
3.4
245.
127
8.4
160.
015
8.2
575.
5-2
81.6
306.
338
0.0
629.
8-2
98.6
327.
845
4.8
N
et b
orro
win
g (n
.s.a
.)30
6.9
183.
424
5.1
278.
443
.458
.716
7.1
-116
.179
.911
4.1
180.
7-1
20.4
85.3
132.
8
Uni
fied
def
icit
(n.s
.a.)
321.
820
9.2
229.
225
6.9
41.7
80.4
183.
0-1
43.2
60.1
129.
319
1.7
-152
.775
.214
2.7
Dep
osit
ory
inst
itut
ions
Fund
s su
pplie
d81
4.1
758.
150
7.9
334.
040
9.1
616.
166
5.8
579.
566
7.1
119.
383
.051
2.1
368.
237
2.9
N
ote.
Dat
a af
ter
2006
:Q4
are
staf
f pr
ojec
tions
.
1. A
vera
ge d
ebt l
evel
s in
the
peri
od (
com
pute
d as
the
aver
age
of p
erio
d-en
d de
bt p
ositi
ons)
div
ided
by
nom
inal
GD
P.
2. I
nclu
des
chan
ge in
liab
ilitie
s no
t sho
wn
in h
ome
mor
tgag
es a
nd c
onsu
mer
cre
dit.
3.
Ave
rage
deb
t lev
els
in th
e pe
riod
(co
mpu
ted
as th
e av
erag
e of
per
iod-
end
debt
pos
ition
s) d
ivid
ed b
y di
spos
able
per
sona
l inc
ome.
4.
For
cor
pora
tions
, exc
ess
of c
apita
l exp
endi
ture
s ov
er U
.S. i
nter
nal f
unds
.
5. N
IPA
sta
te a
nd lo
cal g
over
nmen
t sav
ing
plus
con
sum
ptio
n of
fix
ed c
apita
l and
net
cap
ital t
rans
fers
.
n.s.
a. N
ot s
easo
nally
adj
uste
d.
2.6.
4 F
OF
I-32

Class II FOMC—Restricted (FR)
International Developments
I-33
Global equity and high-risk bond markets sold off in late February and early March amid concerns about the durability of economic expansion in the United States and abroad. Following a brief period in which markets stabilized and then reversed some of their previous losses, major equity indexes dropped sharply again on March 13 and 14. A further correction remains a downside risk to our forecast for continued solid growth abroad. Despite the recent choppiness in financial markets, data on foreign production and spending have been strong and have led us to adjust our near-term projection for total foreign real GDP growth up a touch from the January Greenbook forecast. Growth in emerging-market economies is expected to average 4¾ percent at an annual rate over most of the forecast period, and expansion in the advanced foreign economies is projected to proceed at a pace of about 2½ percent. Our near-term forecast for foreign CPI inflation is slightly above that in the January Greenbook, in keeping with a higher projected path for oil prices. Foreign inflation is likely to edge up in the first half of this year but should recede later in the projection period because of tighter monetary policy and decelerating non-oil commodity prices.
Summary of Staff Projections (Percent change from end of previous period, s.a.a.r.)
2006 Projection
2007 Indicator H1 Q3
2006: Q4 Q1 Q2 H2
2008
Foreign output 4.5 3.2 3.6 3.4 3.5 3.5 3.5 January GB 4.4 3.3 3.5 3.3 3.4 3.4 3.5
Foreign CPI 2.4 1.8 1.8 2.3 2.3 2.3 2.2 January GB 2.4 1.8 1.5 2.1 2.0 2.1 2.1
Note. Changes for years are measured as Q4/Q4; for half-years, Q2/Q4 or Q4/Q2.
The spot price of West Texas intermediate (WTI) crude oil has moved up since the time of the January Greenbook, to about $58 per barrel, amid supply concerns and weather-related increases in demand. Futures price for contracts maturing in 2007 and 2008 have risen about $5 per barrel.

I-34 Class II FOMC—Restricted (FR) Part 1: Summary and Outlook, March 14, 2007
The nominal trade-weighted exchange value of the dollar has fallen about ¾ percent on balance since the January FOMC meeting. We continue to project that the broad real dollar will depreciate slightly over the forecast period, given the need to finance the large and growing U.S. current account deficit. Net exports are expected to subtract ½ percentage point from U.S. real GDP growth in the first quarter after contributing 1½ percentage points to fourth-quarter growth. In the second quarter, the contribution from real net exports is projected to swing into positive territory, but thereafter net exports should subtract a little less than ¼ percentage point (a.r.) on average from the growth of real GDP for the rest of the forecast period. According to data released on March 14, the U.S. current account deficit narrowed in the fourth quarter, from $918 billion at an annual rate in the third quarter to $783 billion, resulting in a total deficit of $857 billion for 2006.1 The quarterly decrease reflects a narrowing in the trade gap along with a swing of the investment income balance into positive territory. The deficit is expected to grow to about $960 billion, about 6½ percent of GDP, by the end of the forecast period. Oil Prices The spot price of West Texas intermediate (WTI) crude oil closed at $57.94 per barrel on March 13, for an increase of about $4 per barrel since the time of the January Greenbook. In line with NYMEX futures prices, our projected path of oil prices climbs gradually to above $66 per barrel by the end of 2008, as global demand is expected to keep spare production capacity limited. Relative to the January Greenbook, our forecast for the spot price averages about $5 per barrel higher in the second half of 2007 and in 2008. However, this projection is still about $4 per barrel below our December Greenbook forecast. The increase in oil prices since the time of the January Greenbook appears to have resulted from both supply and demand factors. OPEC members’ compliance with announced production cuts had appeared doubtful in January, but lately the cartel, led by Saudi Arabia, has followed through on the majority of its proposed reductions, pushing up prices. In addition, long-running supply problems in Iraq and Nigeria have recently worsened. Concerns have heightened over the dependability of oil exports from Iran, because of increasing international pressure related to its nuclear program. Near-term oil prices have been further supported by a boost in U.S. oil demand stemming from the shift
1 These data arrived too late to be shown in the Greensheets at the end of this section.

International Developments Class II FOMC—Restricted (FR) I-35
from an unseasonably warm January to a frigid February, which contributed to a steep runoff in domestic petroleum inventories. International Financial Markets Volatility of global financial asset prices rose markedly at the end of February. Although the initial bout of financial market volatility on February 27 followed a 9 percent drop in Chinese equity prices, worries that the U.S. economy may be slowing also weighed on asset prices. Worsening problems in the sub-prime mortgage market aggravated concerns about the continuing slump in residential investment and about various weaker-than-expected data releases (such as durable goods orders and retail sales). On balance over the intermeeting period, equity prices declined 2-6 percent in Europe and 3 percent in Japan. Major Latin American stock indexes fell 2-3 percent. However, Chinese equity prices partially bounced back and were up 4 percent on net over the intermeeting period. Stock prices also moved up in Korea and Thailand. Flight-to-quality flows helped reduce nominal yields on long-term government bonds about 20 basis points on net in the euro area, the United Kingdom, and Canada, a little less than a half as much as the amount U.S. yields fell over the intermeeting period. Japanese yields fell 12 basis points. Yields on inflation-protected government securities in the euro area declined almost as much as did nominal yields over the intermeeting period, implying little net change in inflation compensation. Both the Bank of Japan and the ECB raised policy interest rates ¼ percentage point during the period, bringing rates to ½ percent and 3¾ percent, respectively. Emerging-market sovereign risk spreads, which were near record lows in the first few weeks of February, widened over the intermeeting period, with the EMBI+ spread up 20 basis points on net. Since the January FOMC meeting, the nominal trade-weighted exchange value of the dollar has declined 1¼ percent against the major foreign currencies but is unchanged on average against the currencies of the United States’ other important trading partners. All told, and taking aggregate price movements here and abroad into account, the starting point of the forecast path of the broad real dollar is little changed from the January Greenbook. We assume that the dollar will depreciate at an annual rate of about ½ percent for the rest of the forecast period.
I-36 Class II FOMC—Restricted (FR) Part 1: Summary and Outlook, March 14, 2007
Since the January FOMC meeting, the dollar has depreciated 3¾ percent on balance against the Japanese yen and 2¼ percent against the Swiss franc, two currencies that have been popularly identified as currencies involved in financing global carry trades. Over the intermeeting period, the dollar also depreciated 1½ percent on net against the euro, ½ percent against the Canadian dollar and a bit less against the Chinese renminbi, but it appreciated almost 2 percent against the British pound and about 1¼ percent against the Mexican peso.
. The Desk did not intervene during
the period for the accounts of the System or the Treasury. Advanced Foreign Economies We expect that average real GDP growth in the advanced foreign economies firmed to 2¾ percent in the current quarter, but growth is projected to edge back down to about 2½ percent for the rest of the forecast period. This flat contour masks some sizable fluctuations over time in particular economies. In Japan, real GDP growth is expected to step down from the upwardly-revised and investment-driven 5½ percent pace of the fourth quarter to 3¾ percent in the first quarter and to slow further to 1¾ percent in the second half of this year and next, which is closer to its long-run potential rate of growth. In contrast, we project that Canadian GDP growth will double to 3 percent in the current quarter as inventory investment rebounds from its very low fourth-quarter level and final domestic demand remains strong. However, the rate of euro-area expansion is forecast to drop to around 1½ percent as the recent surge in export growth slows and German consumption spending is restrained by the January hike in the German value-added tax (VAT). In the second quarter, euro-area growth is projected to recover to around 2¼ percent. The overall forecast for real GDP growth in the advanced economies is ½ percentage point stronger in the first quarter and slightly stronger in subsequent quarters compared with the previous Greenbook. In Japan, the strength in fourth-quarter growth, a surge in household spending in January, and a sharp decline in imports in the first two months of the year have led us to raise our projection for real GDP growth in the first quarter around 2 percentage points above the January Greenbook forecast. In Canada, the near-term outlook has been revised up because of the swing in inventory investment and the continuing positive data on employment growth. The projected rate of euro-area growth has been revised up slightly in response to strong data, which suggest that domestic

International Developments Class II FOMC—Restricted (FR) I-37
demand growth will be more robust than we had assumed over the next two years, and our assessment that the effects of the German VAT hike will be more limited than we previously thought. Four-quarter consumer price inflation rate in the advanced foreign economies is expected to move lower in the near term, but we project inflation will return to an annual rate of 1½ percent for the most of the rest of the forecast period. This forecast is little changed compared with the January Greenbook. The upward revision to the path of oil prices raised our projected rate of inflation in most industrial countries. However, in Germany and the United Kingdom, the effect of higher oil prices is more than offset by recent weak price data. Emerging-Market Economies Economic activity in the emerging-market economies is expected to slow in the current quarter to an annual rate of about 4½ percent. The pace of economic expansion is projected to edge up thereafter, reaching 4¾ percent in 2008. Higher projected oil prices and a lower path for U.S. real GDP prompted us to decrease our forecast for growth in the emerging-market economies this year and next by about ¼ percentage point. In emerging Asia, real GDP growth is estimated to continue moving down in the first quarter, to an annual rate of 5¾ percent. After picking up in the fourth quarter of last year, growth of Chinese real GDP is expected to moderate this year. Next year, it is projected to edge up, in part as the effect of the numerous administrative measures taken to cool investment spending diminishes. We do not think that recent stock price gyrations will dent the rapid pace of Chinese expansion. In the rest of the region, growth is expected to benefit from a moderate improvement in global high-tech demand. Latin American growth is estimated to decline further to an annual rate of a bit less than 3 percent in the current quarter, as a pickup in Mexican and Colombian growth is more than offset by slower growth in the rest of the region. After falling in the fourth quarter of last year, output growth in Mexico is expected to rise gradually over the forecast period, in line with the projected recovery in U.S. manufacturing production. Relative to the January outlook, a downward revision to U.S. manufacturing production in the first quarter prompted us to reduce Mexican growth in the near-term. Growth in South America is also projected to edge down, as the stimulative effect of past increases in commodity prices is expected to wane.

I-38 Class II FOMC—Restricted (FR) Part 1: Summary and Outlook, March 14, 2007
Four-quarter consumer price inflation in the emerging-market economies was about 3 percent last year and is projected to remain near this rate in 2007 and 2008. In emerging Asia, inflation is expected to rise from about 2¼ percent last year to near 2¾ percent this year and to fall back a bit next year, in line with the evolution of fuel prices. In contrast, after rising to 4¼ percent last year in response to an increase in Mexican food prices, consumer price inflation in Latin America is projected to decline to a four-quarter rate of 4 percent this year and 3¾ percent next year. Our forecast for inflation in the emerging-market economies is a bit higher than that in the January Greenbook, reflecting the higher level of oil prices throughout the forecast period. Prices of Internationally Traded Goods U.S. core import price inflation slowed to an annual rate of 1¼ percent in the fourth quarter. Prices of imported industrial supplies and materials decelerated sharply, as commodity price inflation slowed and oil prices declined, pulling down prices of related products. We project that core import price inflation will move back up to 2¾ percent in the first quarter, as prices for imported foods, capital goods (excluding computers and semiconductors), and non-fuel industrial supplies accelerated in January and February on average. This projection is up ¾ percentage point from the previous Greenbook because the import price data for January and February were, on average, slightly higher than expected. Beyond the current quarter, the waning effect of previous increases in commodity prices and—in line with futures markets—a projected decline in commodity prices later this year and next are expected to put downward pressure on core import price inflation. Core import price inflation is expected to be about 2 percent in the second quarter and to move down to about 1 percent by the end of the forecast period. With the dollar nearly flat in our projection, it exerts little effect on core import prices. Core export price inflation dropped to just ¼ percent at an annual rate in the fourth quarter; this rate was slightly below our expectations. Prices of exported foods spiked up, but that were offset by prices of exported industrial supplies, particularly fuels, which fell sharply after rising at double-digit rates in the two previous quarters. We project that core export price inflation will snap back in the current quarter to about 6¼ percent. Prices of exported core goods moved up sharply in January and February, with significant increases in prices of exported foods—especially corn and soybeans—and non-fuel industrial supplies. The unexpectedly rapid increases in core export prices pushed the projection up 2¼ percentage points from the previous Greenbook.

International Developments Class II FOMC—Restricted (FR) I-39
Staff Projections of Selected Trade Prices
(Percent change from end of previous period excepted as noted; s.a.a.r.)
2006 Projection
2007 Indicator H1 Q3
2006: Q4 Q1 Q2 H2
2008
Exports Core goods 5.3 5.8 0.3 6.2 3.1 1.7 1.1 January GB 5.3 5.8 1.0 4.0 2.7 1.4 1.0
Imports Core goods 2.7 4.3 1.3 2.8 2.1 1.5 1.1 January GB 2.7 4.3 1.7 2.0 1.6 1.3 1.0
Oil (dollars per barrel) 63.75 66.55 55.34 53.72 55.35 59.60 61.31 January GB 63.75 66.55 55.43 50.08 51.39 54.48 55.97
NOTE. Prices for core exports exclude computers and semiconductors. Prices for core imports exclude computers, semiconductors, oil, and natural gas. Both price series are on a NIPA chain-weighted basis. The price of imported oil for multiquarter periods is the price for the final quarter of the period. Imported oil includes both crude oil and refined products.
We project that core export price inflation will trend down quickly over the next few quarters, falling to about 3 percent in the second quarter and leveling out at close to a 1 percent rate next year. This trajectory is driven by the projected decline in commodity prices mentioned earlier, with prices of agricultural exports showing a notable deceleration. Our projection has been revised up slightly over the rest of this year, as a result of a higher projected path for metals prices. Trade in Goods and Services Reflecting the December trade data and fourth-quarter NIPA release, we now estimate that real net exports added about 1½ percentage points to U.S. real GDP growth in the fourth quarter, somewhat more than in the January Greenbook. The January trade data and other information suggest that in the current quarter, the contribution should turn negative, subtracting about ½ percentage point, as imports rebound and export growth steps down. Smoothing through the quarterly swings induced by oil imports, net exports are projected to have little effect on U.S. growth in 2007 as a whole and to subtract a little

I-40 Class II FOMC—Restricted (FR) Part 1: Summary and Outlook, March 14, 2007
less than ¼ percentage point in 2008. This contribution is slightly less negative than in the previous Greenbook; it reflects both a higher forecast for the growth of exports in 2007 and a downward revision to import growth, given the lower projection for U.S. GDP growth. After declining 2½ percent in the fourth quarter, real imports of goods and services are projected to increase in the current quarter at an annual rate of 6¼ percent. The increase in imports is expected to be supported by renewed growth of imports of oil and high-tech goods—especially computers—following steep declines in the fourth quarter. In contrast, imports of core goods are expected to decelerate slightly, given weak core imports in the January trade data, and growth of imported services is expected to move down markedly from its strong fourth-quarter pace. In the second quarter we expect real import growth to fall back to 1¾ percent, largely because of a fall in real oil imports stemming from a quirky oil seasonal factor, even as core import growth rebounds to a rate more in line with U.S. income growth and relative prices. We have revised down our projection of second-quarter import growth by 1¾ percentage points since the previous Greenbook, largely because of slower projected growth of imports of computers and oil following stronger projected growth in the current quarter.
Staff Projections for Trade in Goods and Services (Percent change from end of previous period, s.a.a.r.)
2006 Projection
2007Measure H1 Q3 2006:
Q4 Q1 Q2 H2 2008
Real exports 10.0 6.8 10.6 5.2 6.1 5.7 5.2 January GB 10.0 6.8 7.5 5.3 5.2 4.9 5.1
Real imports 5.2 5.6 -2.4 6.3 1.7 4.4 4.7 January GB 5.2 5.6 -1.8 6.7 3.5 4.9 5.1
NOTE. Changes for years are measured as Q4/Q4; for half-years, Q2/Q4 or Q4/Q2.
We expect real imports to increase at a 4½ percent rate in the second half of 2007 and at a rate of 4¾ percent rate in 2008, as a pickup in the growth of imports of core goods more than offsets a slight decline in real oil imports. The acceleration in core imports reflects the projected near-term firming of U.S. GDP growth and slowing core import price inflation. Imports of services are expected to grow 3½ percent in the second half of 2007 and 2008. Imports of computers and semiconductors are expected to grow in line with

International Developments Class II FOMC—Restricted (FR) I-41
their historical pace. Since the January Greenbook, we have revised down our projection for real import growth in the second half of 2007 and 2008 by ½ percentage point, in line with the lower projected path of U.S. GDP growth. In addition, we now expect higher domestic energy production to lower oil imports slightly over the forecast period. Real exports of goods and services are projected to increase 5¼ percent in the current quarter, following growth of 10½ percent in the fourth quarter. Growth in the fourth quarter had been boosted by exceptionally strong exports of core goods, particularly aircraft, and services. In the current quarter, in line with the January trade data, we expect both exports of core goods and of services to decelerate to a pace more in line with foreign GDP growth and recent developments in relative prices. Real export growth is expected to move up to 6 percent in the second quarter, as services exports accelerate a bit, and then to move down through the remainder of the forecast period. Exports of core goods and services slow, as the lagged effect of dollar depreciation in 2006 fades and the dollar flattens out going forward. Exports of computers and semiconductors are expected to grow steadily over the forecast period. Since the January Greenbook, we have increased our forecast for real export growth in 2007 by ½ percentage point. Exports of core goods exhibited exceptional growth throughout 2006, with capital goods showing particular strength. With foreign GDP projected to continue growing steadily, we have decided to carry some of this strength forward through 2007 and have marked up our forecast for core exports accordingly. Alternative Simulations
Our baseline forecast projects that U.S. core PCE inflation will edge down to 2 percent by the end of 2008, but it is possible that various shocks—including ones that originate in the external sector—may push inflation higher. To assess this risk, our first alternative simulation uses the FRB/Global model to examine the effects of a broad-based increase in consumption and investment demand in major U.S. trading partners. The stronger foreign economic outlook generates some endogenous depreciation of the dollar, but we also consider a scenario that increases the magnitude of the dollar’s depreciation by incorporating shocks to the risk premium. In the first scenario, the shock is calibrated to raise consumption and investment spending in our major trading partners 1 percentage point per year above baseline (in the absence of endogenous adjustments) and to begin in 2007:Q2. The rise in foreign spending stimulates U.S. real exports directly and boosts real net exports indirectly through a

I-42 Class II FOMC—Restricted (FR) Part 1: Summary and Outlook, March 14, 2007
modest depreciation of the dollar. Relative to baseline, U.S. GDP growth rises 0.2 percentage point in the second half of this year and about 0.3 percentage point in 2008. Core PCE inflation is about 0.2 percentage point higher than baseline in 2008. The rise in core PCE prices higher import prices due to dollar depreciation, the effects of the stimulus to aggregate demand on domestic prices, and higher oil prices due to stronger world demand. These developments induce a substantial policy response, with the federal funds rate rising about ¾ percentage point above baseline by the second half of 2008. Although the nominal trade balance deteriorates initially due to J-curve effects, it improves markedly beyond our current forecast horizon (for example, the trade balance as a share of GDP rises 0.4 percentage point above baseline by end-2009). In the second scenario, the foreign demand shock is accompanied by a risk-premium shock that causes the broad real dollar to depreciate 10 percent by the end of the forecast period (compared with only about 4 percent in the first scenario). The larger depreciation of the dollar induces a more pronounced rise in U.S. GDP growth than in the first scenario, with U.S. output growth rising 0.9 percentage point above baseline in the second half of 2007 and about 0.8 percentage point higher in 2008. Core PCE inflation also rises noticeably more than in the first scenario. Finally, the combined shocks contribute to a sizable improvement of the trade balance of about 0.6 percentage point of GDP by the end of the forecast period (and nearly 1.0 percentage point of GDP by end-2009).

International Developments Class II FOMC—Restricted (FR) I-43
Alternative Simulations: Stronger Foreign Demand and Dollar Depreciation
(Percent change from previous period, annual rate)
2007 2008 Indicator and simulation
H1 H2 H1 H2
U.S. real GDP Baseline 1.9 2.3 2.3 2.3 Stronger foreign demand 1.9 2.5 2.6 2.6 Additional dollar depreciation 1.9 3.2 3.2 3.0
U.S. PCE prices excluding food and energy Baseline 2.2 2.2 2.1 2.0 Stronger foreign demand 2.2 2.3 2.3 2.2 Additional dollar depreciation 2.4 2.4 2.3 2.3
U.S. trade balance (percent of GDP) Baseline -5.1 -5.1 -5.2 -5.1 Stronger foreign demand -5.2 -5.3 -5.3 -5.0 Additional dollar depreciation -5.4 -5.3 -5.0 -4.5
Note. H1 is Q2/Q4; H2 is Q4/Q2. The federal funds rate is adjusted according to a Taylor rule.

Evolution of the Staff Forecast
-8.0
-7.5
-7.0
-6.5
-6.0
-5.5
Class II FOMC -- Restricted (FR)
2006
2007
2008
Greenbook publication date
Current Account BalancePercent of GDP
1/26 3/16 4/28 6/22 8/4 9/14 10/26 12/7 1/25 3/22 5/3 6/21 8/3 9/1310/18 12/6 1/24 3/14 5/2 6/20 8/2 9/12 10/24 12/53/142005 2006 2007
2.5
3.0
3.5
4.0
2006
20072008
Greenbook publication date
Foreign Real GDPPercent change, Q4/Q4
1/26 3/16 4/28 6/22 8/4 9/14 10/26 12/7 1/25 3/22 5/3 6/21 8/3 9/1310/18 12/6 1/24 3/14 5/2 6/20 8/2 9/12 10/24 12/53/142005 2006 2007
-1
0
1
2
3
4
5
2006
2007
2008
Greenbook publication date*Prices for merchandise imports excluding computers, semiconductors, oil, and natural gas.
Core Import Prices*Percent change, Q4/Q4
1/26 3/16 4/28 6/22 8/4 9/14 10/26 12/7 1/25 3/22 5/3 6/21 8/3 9/1310/18 12/6 1/24 3/14 5/2 6/20 8/2 9/12 10/24 12/53/142005 2006 2007
I-44

Class II FOMC March 14, 2007
Restricted (FR)
OUTLOOK FOR FOREIGN REAL GDP AND CONSUMER PRICES: SELECTED COUNTRIES
(Percent, Q4 to Q4)
___________________________________________________________________________________________________
-----Projected----
Measure and country 2000 2001 2002 2003 2004 2005 2006 2007 2008
___________________________________________________________________________________________________
REAL GDP (1)
------------
Total foreign 4.2 0.3 3.1 3.0 3.8 3.7 3.9 3.5 3.5
Advanced Foreign Economies 3.6 0.9 2.5 1.8 2.6 2.6 2.7 2.7 2.5
of which:
Canada 4.1 1.3 3.5 1.5 3.7 2.8 2.3 2.9 2.8
Japan 3.1 -1.7 2.0 2.4 1.1 2.8 2.5 2.4 1.7
United Kingdom 3.1 2.0 2.3 3.3 2.6 2.0 3.0 2.8 2.5
Euro Area (2) 3.3 1.1 1.1 1.0 1.5 1.8 3.3 2.1 2.0
Germany 2.3 1.1 0.0 0.2 0.2 1.7 3.7 2.0 2.1
Emerging Market Economies 5.2 -0.4 3.9 4.8 5.6 5.3 5.6 4.6 4.8
Asia 5.8 1.0 6.2 6.8 6.0 7.4 6.6 5.9 6.1
Korea 4.3 4.7 7.8 4.2 2.9 5.3 4.0 4.2 4.4
China 7.8 7.1 8.5 10.1 9.6 9.9 10.4 8.7 9.0
Latin America 4.4 -1.3 1.5 2.4 5.2 3.0 4.7 3.4 3.5
Mexico 4.8 -1.3 2.0 2.1 4.8 2.5 4.3 3.1 3.4
Brazil 3.8 -1.0 4.1 0.9 4.7 1.5 3.7 3.5 3.5
CONSUMER PRICES (3)
-------------------
Advanced Foreign Economies 1.9 0.9 2.1 1.3 1.8 1.5 1.3 1.5 1.6
of which:
Canada 3.1 1.1 3.8 1.7 2.3 2.3 1.3 1.8 2.0
Japan -0.5 -1.1 -0.5 -0.3 0.5 -1.0 0.3 0.3 0.5
United Kingdom (4) 0.9 1.1 1.5 1.3 1.4 2.1 2.7 1.7 1.8
Euro Area (2) 2.5 2.1 2.3 2.0 2.3 2.3 1.8 2.0 1.7
Germany 1.7 1.5 1.2 1.1 2.1 2.2 1.3 2.1 1.6
Emerging Market Economies 4.1 2.8 2.9 3.1 3.9 3.0 2.9 3.1 2.8
Asia 1.8 1.2 0.8 2.2 3.2 2.6 2.3 2.7 2.4
Korea 2.5 3.3 3.3 3.5 3.4 2.5 2.1 2.4 2.7
China 1.0 -0.1 -0.5 2.7 3.3 1.4 2.1 2.6 2.1
Latin America 8.4 5.3 6.4 4.9 5.7 3.8 4.2 4.0 3.7
Mexico 8.7 5.1 5.2 3.9 5.3 3.1 4.1 3.8 3.5
Brazil 6.4 7.5 10.7 11.5 7.2 6.1 3.2 4.0 3.5
___________________________________________________________________________________________________
1. Foreign GDP aggregates calculated using shares of U.S. exports.
2. Harmonized data for euro area from Eurostat.
3. Foreign CPI aggregates calculated using shares of U.S. non-oil imports.
4. CPI excluding mortgage interest payments, which is the targeted inflation rate.
I-45

Class II FOMC March 14, 2007
Restricted (FR)
OUTLOOK FOR FOREIGN REAL GDP AND CONSUMER PRICES: SELECTED COUNTRIES
(Percent changes)
______________________________________________________________________________________________________________
-------------------- Projected ------------------------
2006 2007 2008
----------------------- ----------------------- -----------------------
Measure and country Q1 Q2 Q3 Q4 Q1 Q2 Q3 Q4 Q1 Q2 Q3 Q4
______________________________________________________________________________________________________________
REAL GDP (1) -------------------- Quarterly changes at an annual rate ------------------
------------
Total foreign 4.7 4.2 3.2 3.6 3.4 3.5 3.5 3.5 3.4 3.5 3.5 3.4
Advanced Foreign Economies 3.4 2.6 2.1 2.6 2.8 2.6 2.7 2.6 2.4 2.5 2.5 2.4
of which:
Canada 3.8 2.0 2.0 1.4 3.0 2.7 3.0 2.8 2.7 2.9 3.0 2.8
Japan 2.9 1.3 0.5 5.5 3.7 2.2 1.9 1.8 1.7 1.7 1.7 1.6
United Kingdom 3.0 3.0 2.7 3.1 2.9 2.9 2.9 2.7 2.5 2.5 2.5 2.5
Euro Area (2) 3.3 3.9 2.3 3.6 1.6 2.3 2.2 2.2 2.1 2.1 2.0 1.9
Germany 3.4 4.8 3.2 3.5 0.6 2.5 2.6 2.5 2.4 2.2 2.0 1.9
Emerging Market Economies 6.6 6.4 4.7 5.0 4.4 4.7 4.8 4.7 4.8 4.8 4.8 4.8
Asia 7.3 6.5 6.4 6.3 5.7 5.9 5.9 5.9 6.1 6.1 6.2 6.2
Korea 4.9 3.4 4.4 3.4 4.0 4.2 4.3 4.3 4.4 4.4 4.5 4.5
China 12.2 12.2 7.3 9.9 8.9 8.7 8.7 8.7 8.9 8.9 9.0 9.2
Latin America 6.4 5.9 3.4 3.2 2.9 3.5 3.6 3.5 3.5 3.5 3.5 3.5
Mexico 7.0 5.6 2.7 1.9 2.4 3.3 3.4 3.4 3.4 3.4 3.4 3.4
Brazil 4.9 2.6 3.1 4.4 3.5 3.5 3.5 3.5 3.5 3.5 3.5 3.5
CONSUMER PRICES (3)
------------------- --------------------------- Four-quarter changes --------------------------
Advanced Foreign Economies 1.8 2.0 1.6 1.3 1.3 1.1 1.2 1.5 1.6 1.6 1.6 1.6
of which:
Canada 2.5 2.6 1.6 1.3 1.1 0.9 1.4 1.8 2.0 2.0 2.0 2.0
Japan -0.2 0.2 0.6 0.3 0.1 0.1 -0.1 0.3 0.3 0.4 0.4 0.5
United Kingdom (4) 2.0 2.2 2.4 2.7 2.6 2.2 1.9 1.7 1.9 1.9 1.8 1.8
Euro Area (2) 2.3 2.5 2.1 1.8 1.9 1.7 1.7 2.0 1.9 1.8 1.8 1.7
Germany 2.1 2.1 1.6 1.3 2.0 1.8 1.9 2.1 1.8 1.7 1.6 1.6
Emerging Market Economies 3.0 2.9 2.7 2.9 3.1 3.1 3.2 3.1 3.0 2.9 2.9 2.8
Asia 2.4 2.6 2.1 2.3 2.7 2.5 2.8 2.7 2.6 2.5 2.4 2.4
Korea 2.1 2.3 2.5 2.1 2.0 1.8 1.7 2.4 2.8 3.0 2.9 2.7
China 1.2 1.4 1.2 2.1 2.6 2.6 3.0 2.6 2.3 2.2 2.1 2.1
Latin America 4.2 3.5 3.8 4.2 4.3 4.6 4.4 4.0 3.8 3.7 3.7 3.7
Mexico 3.7 3.1 3.5 4.1 4.1 4.5 4.2 3.8 3.6 3.5 3.5 3.5
Brazil 5.6 4.3 3.8 3.2 3.1 3.5 4.1 4.0 3.6 3.5 3.5 3.5
______________________________________________________________________________________________________________
1. Foreign GDP aggregates calculated using shares of U.S. exports.
2. Harmonized data for euro area from Eurostat.
3. Foreign CPI aggregates calculated using shares of U.S. non-oil imports.
4. CPI excluding mortgage interest payments, which is the targeted inflation rate.
I-46

Class II FOMC March 14, 2007
Restricted (FR)
OUTLOOK FOR U.S. INTERNATIONAL TRANSACTIONS
________________________________________________________________________________________________________________
------ Projected ------
2000 2001 2002 2003 2004 2005 2006 2007 2008
________________________________________________________________________________________________________________
NIPA REAL EXPORTS and IMPORTS
Percentage point contribution to GDP growth, Q4/Q4
Net Goods & Services -0.9 -0.2 -0.9 -0.1 -0.8 -0.1 0.4 -0.1 -0.2
Exports of G&S 0.7 -1.3 0.4 0.6 0.7 0.7 1.0 0.6 0.6
Imports of G&S -1.6 1.1 -1.3 -0.7 -1.5 -0.8 -0.6 -0.7 -0.8
Percentage change, Q4/Q4
Exports of G&S 6.5 -11.9 3.8 5.8 7.0 6.7 9.4 5.7 5.2
Services 1.8 -8.9 10.2 3.0 7.1 3.1 7.4 5.7 4.9
Computers 22.7 -23.5 -1.1 11.3 6.4 14.1 8.2 14.2 14.4
Semiconductors 27.6 -34.6 10.1 38.3 -6.3 17.2 1.1 17.0 17.0
Core Goods 1/ 5.9 -10.2 0.6 4.9 8.0 7.5 10.8 4.7 4.3
Imports of G&S 11.2 -7.6 9.7 4.8 10.6 5.2 3.3 4.2 4.7
Services 10.6 -5.9 8.8 2.2 7.6 1.9 5.1 3.6 3.5
Oil 13.3 3.7 3.8 1.2 9.6 0.9 -9.7 3.4 -1.3
Natural Gas 37.3 -6.5 19.5 1.3 6.6 11.9 -17.5 5.5 5.2
Computers 13.9 -13.6 13.2 17.0 22.5 11.8 13.6 18.5 17.5
Semiconductors 22.8 -51.1 11.0 -0.1 9.3 7.5 -0.4 17.0 17.0
Core Goods 2/ 10.3 -6.5 10.0 5.2 10.7 6.2 5.7 3.3 5.0
Billions of Chained 2000 Dollars
Net Goods & Services -379.5 -399.1 -471.3 -518.9 -590.9 -619.2 -618.3 -587.1 -602.6
Exports of G&S 1096.3 1036.7 1013.3 1026.1 1120.4 1196.1 1302.8 1390.2 1465.3
Imports of G&S 1475.8 1435.8 1484.6 1545.0 1711.3 1815.3 1921.1 1977.3 2068.0
________________________________________________________________________________________________________________
Billions of dollars
US CURRENT ACCOUNT BALANCE -415.2 -389.0 -472.4 -527.5 -665.3 -791.5 -855.3 -848.3 -925.4
Current Acct as Percent of GDP -4.2 -3.8 -4.5 -4.8 -5.7 -6.4 -6.5 -6.1 -6.4
Net Goods & Services (BOP) -377.6 -362.8 -421.1 -494.9 -611.3 -716.7 -765.3 -711.3 -747.0
Investment Income, Net 25.7 30.3 17.8 42.3 33.6 17.6 0.5 -36.5 -76.7
Direct, Net 94.9 115.9 102.4 112.8 123.9 134.4 151.5 155.6 173.5
Portfolio, Net -69.2 -85.5 -84.6 -70.5 -90.2 -116.8 -150.9 -192.1 -250.2
Other Income & Transfers,Net -63.3 -56.5 -69.2 -74.9 -87.6 -92.4 -90.6 -100.5 -101.7
________________________________________________________________________________________________________________
1. Merchandise exports excluding computers and semiconductors.
2. Merchandise imports excluding oil, natural gas, computers, and semiconductors.
I-47

Class II FOMC March 14, 2007
Restricted (FR)
OUTLOOK FOR U.S. INTERNATIONAL TRANSACTIONS
___________________________________________________________________________________________________________________________
2003 2004 2005
---------------------------- ---------------------------- ---------------------------
Q1 Q2 Q3 Q4 Q1 Q2 Q3 Q4 Q1 Q2 Q3 Q4
___________________________________________________________________________________________________________________________
NIPA REAL EXPORTS and IMPORTS
Percentage point contribution to GDP growth
Net Goods & Services 0.2 -0.7 0.5 -0.5 -0.7 -1.6 -0.2 -0.8 -0.2 0.7 -0.1 -1.1
Exports of G&S -0.5 -0.2 1.0 1.8 0.7 0.6 0.5 1.0 0.5 0.9 0.3 1.0
Imports of G&S 0.7 -0.6 -0.5 -2.3 -1.4 -2.2 -0.7 -1.8 -0.6 -0.2 -0.4 -2.0
Percentage change from previous period, s.a.a.r.
Exports of G&S -5.3 -1.7 11.4 20.8 7.2 6.2 4.8 9.9 4.7 9.4 3.2 9.6
Services -20.0 -2.8 17.5 23.1 7.5 5.6 -2.8 19.2 2.9 2.0 2.1 5.5
Computers -2.3 -5.2 34.7 23.2 -5.8 -3.1 20.7 16.5 13.6 21.9 17.8 3.9
Semiconductors 37.4 30.9 44.6 40.7 11.5 -7.8 -19.1 -7.2 -7.7 21.3 26.3 33.6
Core Goods 1/ 0.2 -2.9 5.2 18.3 7.7 8.2 9.7 6.4 5.8 11.9 1.8 10.7
Imports of G&S -5.0 4.1 3.8 17.6 10.2 16.0 4.4 12.0 4.1 1.4 2.5 13.2
Services -10.6 -15.7 21.2 19.6 10.9 7.6 3.1 9.0 -0.2 -1.5 1.2 8.3
Oil -9.7 12.4 -6.0 9.9 37.2 -22.9 -6.4 45.5 7.0 -21.2 -12.5 40.5
Natural Gas -45.9 72.5 66.4 -32.1 16.2 72.0 43.7 -55.1 23.0 12.3 109.8 -45.9
Computers 11.4 10.7 11.1 36.9 21.1 30.2 27.5 11.9 9.2 9.4 19.6 9.3
Semiconductors -6.3 1.1 -4.2 9.7 43.3 19.6 3.8 -19.9 -7.4 8.4 15.6 14.9
Core Goods 2/ -3.1 7.2 -0.1 18.1 5.3 23.2 4.2 11.0 4.4 5.8 2.7 12.3
Billions of Chained 2000 Dollars, s.a.a.r.
Net Goods & Services -507.2 -526.9 -513.8 -527.8 -548.5 -593.9 -599.4 -621.9 -626.4 -606.1 -607.6 -636.6
Exports of G&S 1003.3 999.0 1026.3 1075.8 1094.8 1111.3 1124.3 1151.3 1164.5 1191.0 1200.5 1228.4
Imports of G&S 1510.5 1525.9 1540.0 1603.6 1643.2 1705.2 1723.7 1773.1 1790.9 1797.1 1808.1 1865.0
___________________________________________________________________________________________________________________________
Billions of dollars, s.a.a.r.
US CURRENT ACCOUNT BALANCE -548.7 -524.4 -526.2 -510.8 -583.3 -667.1 -665.3 -745.4 -766.9 -773.0 -733.7 -892.4
Current Account as % of GDP -5.1 -4.8 -4.7 -4.6 -5.1 -5.7 -5.6 -6.2 -6.3 -6.3 -5.8 -7.0
Net Goods & Services (BOP) -496.9 -492.9 -491.9 -497.9 -544.6 -605.6 -626.7 -668.3 -672.4 -688.2 -727.2 -779.1
Investment Income, Net 24.4 41.7 39.2 63.8 57.3 28.2 33.4 15.6 20.7 14.2 37.9 -2.3
Direct, Net 97.2 108.4 109.3 136.3 130.4 113.4 122.8 128.8 121.4 124.2 161.5 130.6
Portfolio, Net -72.7 -66.6 -70.1 -72.5 -73.1 -85.2 -89.4 -113.2 -100.7 -110.0 -123.6 -132.9
Other Inc. & Transfers, Net -76.2 -73.2 -73.5 -76.7 -96.1 -89.7 -72.0 -92.7 -115.1 -99.0 -44.3 -111.0
___________________________________________________________________________________________________________________________
1. Merchandise exports excluding computers and semiconductors.
2. Merchandise imports excluding oil, natural gas, computers, and semiconductors.
I-48

Class II FOMC March 14, 2007
Restricted (FR)
OUTLOOK FOR U.S. INTERNATIONAL TRANSACTIONS
___________________________________________________________________________________________________________________________
------------------------- Projected ----------------------------
2006 2007 2008
---------------------------- ---------------------------- ---------------------------
Q1 Q2 Q3 Q4 Q1 Q2 Q3 Q4 Q1 Q2 Q3 Q4
___________________________________________________________________________________________________________________________
NIPA REAL EXPORTS and IMPORTS
Percentage point contribution to GDP growth
Net Goods & Services -0.0 0.4 -0.2 1.6 -0.4 0.4 0.2 -0.3 -0.5 0.1 -0.1 -0.3
Exports of G&S 1.4 0.7 0.7 1.1 0.6 0.7 0.7 0.6 0.6 0.6 0.6 0.6
Imports of G&S -1.5 -0.2 -0.9 0.4 -1.0 -0.3 -0.5 -1.0 -1.1 -0.5 -0.7 -0.8
Percentage change from previous period, s.a.a.r.
Exports of G&S 14.0 6.2 6.8 10.6 5.2 6.1 5.8 5.5 5.3 5.2 5.1 5.1
Services 6.7 6.7 0.8 16.1 3.8 6.7 6.4 6.0 5.4 5.0 4.7 4.5
Computers 9.8 12.0 -0.1 11.6 13.7 14.4 14.4 14.4 14.4 14.4 14.4 14.4
Semiconductors 15.7 29.9 -12.4 -20.6 17.0 17.0 17.0 17.0 17.0 17.0 17.0 17.0
Core Goods 1/ 17.8 4.4 11.4 10.1 4.9 4.9 4.6 4.4 4.3 4.3 4.3 4.3
Imports of G&S 9.1 1.4 5.6 -2.4 6.3 1.7 3.0 5.9 6.5 3.0 4.0 5.1
Services 7.4 9.9 -2.6 6.3 3.5 3.8 3.7 3.5 3.4 3.5 7.9 -0.8
Oil -4.8 -18.3 7.1 -20.2 30.3 -12.7 -12.6 14.8 16.3 -15.2 -13.2 10.9
Natural Gas -24.6 42.1 -26.4 -41.2 -13.6 41.9 23.7 -18.2 -4.4 39.2 20.3 -23.6
Computers 34.3 17.0 18.4 -10.4 48.7 -3.9 17.5 17.5 17.5 17.5 17.5 17.5
Semiconductors 3.6 -1.3 21.6 -20.8 17.0 17.0 17.0 17.0 17.0 17.0 17.0 17.0
Core Goods 2/ 12.4 2.4 6.9 1.5 0.8 3.6 4.4 4.5 4.7 5.0 5.2 5.2
Billions of Chained 2000 Dollars, s.a.a.r.
Net Goods & Services -636.6 -624.2 -628.8 -583.7 -596.4 -584.2 -578.9 -588.8 -602.0 -598.9 -600.9 -608.7
Exports of G&S 1269.3 1288.5 1310.0 1343.3 1360.5 1380.7 1400.3 1419.3 1437.8 1456.2 1474.5 1492.8
Imports of G&S 1905.9 1912.7 1938.8 1927.0 1956.8 1964.9 1979.3 2008.1 2039.9 2055.1 2075.4 2101.5
___________________________________________________________________________________________________________________________
Billions of dollars, s.a.a.r.
US CURRENT ACCOUNT BALANCE -854.8 -870.6 -906.5 -789.5 -819.5 -830.3 -849.6 -893.8 -913.2 -914.1 -924.2 -950.2
Current Account as % of GDP -6.6 -6.6 -6.8 -5.9 -6.0 -6.0 -6.1 -6.3 -6.4 -6.3 -6.3 -6.4
Net Goods & Services (BOP) -766.6 -774.5 -805.6 -714.4 -710.0 -701.0 -707.9 -726.4 -749.4 -742.2 -743.2 -753.2
Investment Income, Net -3.6 -2.1 -8.7 16.5 -12.6 -31.0 -41.8 -60.5 -63.8 -71.9 -81.0 -90.1
Direct, Net 137.2 152.2 143.2 173.3 157.5 153.0 157.7 154.3 164.9 170.4 176.7 182.1
Portfolio, Net -140.8 -154.4 -151.9 -156.8 -170.1 -184.1 -199.5 -214.7 -228.7 -242.4 -257.6 -272.1
Other Inc. & Transfers, Net -84.7 -93.9 -92.3 -91.6 -96.9 -98.3 -100.0 -107.0 -100.0 -100.0 -100.0 -107.0
___________________________________________________________________________________________________________________________
1. Merchandise exports excluding computers and semiconductors.
2. Merchandise imports excluding oil, natural gas, computers, and semiconductors.
Last Page
I-49