Embed Size (px)
Citation preview
FOOD AID AND POVERTY ALLEVIATION IN MOZAMBIQUE: THE POTENTIAL FOR SELF-TARGETING WITH YELLOW MAIZE
Paul Dorosh Carlo del Ninno David E. Sahn
L IST OF T.4RLUS
2. THE MULTI-MARKET MODE!-
Model S t r u c t u r e Model Parameters P o v e r t y L i n e
3 . THE DATA AND DESCRIPT IK STTTISTTCS
4 . POLICY SIMULATIONS
Changes i n Food A i d I m p o r t s : S e c t o r a l Leve l Outcomes S e n s i t i v i t y A n a l y s i s
Impact on Consumption P a t t e r n s and C a l o r i e I n t a k e o f Poor Households, and Leve l o f P o v e r t y
Coun te rva lue Funds and t h e Cost o f t h e Subs idy
5. CONCLUSIONS
Appendix 1 - Equat ions o f t h e Mozambique M u l t i - M a r k e t Model
Appendix 2 - Base Data and Model Parameters
REFERENCES
L I S T OF TABLES
D i s t r i b u t i o n o f Average Budget Shares by Per C a p i t a E x p e n d i t u r e Q u i n t i l e s and Pover t y C l a s s i f i c a t i o n
Percentage o f Households Consuming Commodity Groups by Per C a p i t a E x p e n d i t u r e Q u i n t i l e and Pover t y C l a s s i f i c a t i o n
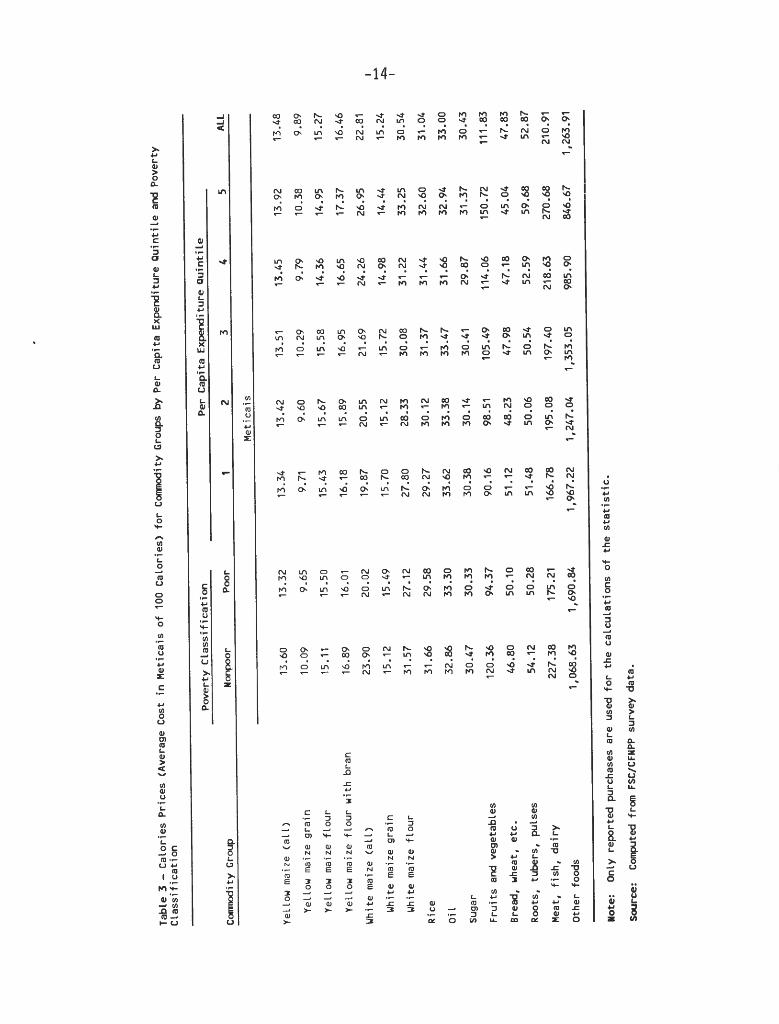
C a l o r i e s P r i c e s (Average Cost i n M e t i c a i s o f 100 C a l o r i e s ) f o r Commodi t y Groups by Per C a p i t a Expend i tu re Q u i n t i 1 e and P o v e r t y C l a s s i f i c a t i on
D i s t r i b u t i o n o f Average C a l o r i e Shares o f Commodity Groups by Per C a p i t a E x p e n d i t u r e Q u i n t i l e and P o v e r t y C l a s s i f i c a t i o n
I n c r e a s e d Ye1 1 ow Maize Impor t s ; Simul a t i o n R e s u l t s
Impact o f Changes i n Impor t s on Budget and C a l o r i e Shares, and C a l o r i e Consumption o f t h e Poor
P o v e r t y Leve l and Depth f o r A1 t e r n a t i v e Pol i c y S i m u l a t i o n s
B e n e f i t s and Costs o f I nc reased Food A i d t o Maputo
APPENDIX TABLES
Household E x p e n d i t u r e Shares
Per C a p i t a Consumption o f S t a p l e s
Base Data T a b l e on Supp ly and Demand, 1991
Urban Nonpoor Demand E l a s t i c i t i e s
Urban Poor and Rura l Demand E l a s t i c i t i e s
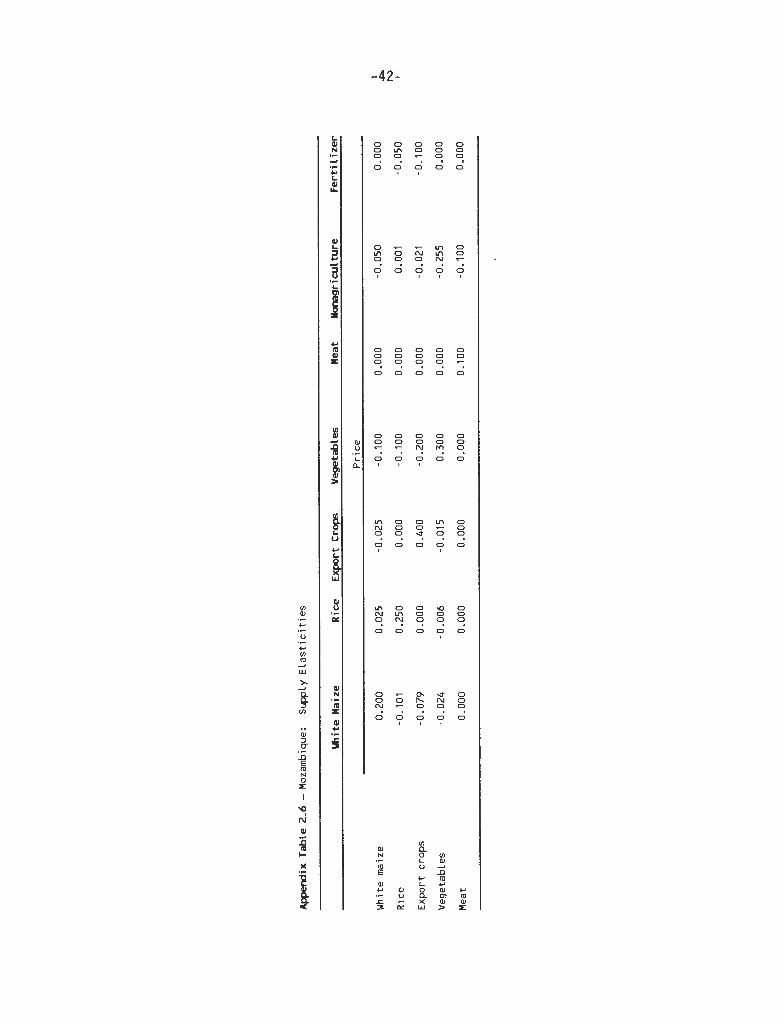
Supp ly E l a s t i c i t i e s
1. INTRODUCTION
Food a i d has p layed an ins t rumenta l r o l e i n p r o v i d i n g f o r t h e we l f a re o f the poor i n war t o r n Mozambique, one o f t h e poores t coun t r i es i n t h e wor ld . Th is i s e s p e c i a l l y t h e case i n Maputo, t h e c a p i t a l , where c i v i l c o n f l i c t r e s u l t e d i n t h e p rov i s i on , and subsequent s a l e o f food a i d be ing i t s l i f e l i n e f o r s u r v i v a l .' By f a r , t h e most impor tan t food a i d commodity des t ined f o r Maputo i s ye1 low maize g ra in , v i r t u a l l y a l l o f which i s supp l ied by the Un i ted S ta tes P.L. 480 program. I n theory , t h i s y e l l o w maize g r a i n i s supposed t o be d i s t r i b u t e d through t he government's food r a t i o n i n g system,' a l though i n p r a c t i c e , a l a r g e share i s leaked and f i n d s i t s way t o t h e p a r a l l e l market a t p r i c e s determined by supply and demand (Sahn and Desai 1993). A1 though y e l l o w maize supply i n Maputo de r i ves e n t i r e l y f rom impor ts , t h e f a c t i s t h a t y e l l o w maize g r a i n behaves e s s e n t i a l l y as a nontraded commodity. I n t h e short-term, where t a s t e s and preferences a re q u i t e s tab le , t h e l e v e l o f impor ts determines t h e p r i c e o f t h e product .
There a re growing pressures t o reduce t he l e v e l o f y e l l o w maize food a i d impor ts i n t o Maputo, and t o ensure t h a t whatever i s marketed, i s s o l d a t a p r i c e t h a t r e f l e c t s t h e wo r l d market p r i c e o f y e l l o w g r a i n p l us t r a n s p o r t cos ts t o Maputo. Th i s de r i ves f rom the percep t ion t h a t w i t h peace, t he need f o r food a i d i s d im in ish ing , supposedly as p roduc t ion increases and market ing cos ts dec l i n e . Likewise, t h e r e i s a concern t h a t food a i d d i s t r i b u t e d i n t h e urban market i s bo th a d i s i n c e n t i v e t o r u r a l producers, and n o t w e l l t a rge ted t o poor households. Food a i d d i s t r i b u t i o n i n t h e c i t i e s i s thus seen as a b l u n t ins t rument f o r pove r t y a1 l e v i a t i o n , a t h r e a t t o t h e resurgence o f a heal t h y a g r i c u l t u r e , and an impediment t o r a i s i n g incomes o f t h e r u r a l poor.
The arguments aga ins t cont inued h igh l e v e l s o f food a i d sa les i n Maputo have i n t e n s i f i e d g i ven events i n 1993, a year o f unprecedented l e v e l s o f emergency drought r e 1 i e f ye1 low maize food a i d i n f l o w s i n t o bo th urban and r u r a l areas o f Mozambique. The heightened concern over t h e p o s s i b l e d i s i n c e n t i v e e f f e c t o f t h e commercial d i s t r i b u t i o n o f y e l l o w maize g r a i n has emanated from a f a i l u r e t o d i s t i n g u i s h between such a program o f sa les o f food a id , and t h e emergency d i s t r i b u t i o n o f food a i d i n r u r a l areas i n response t o t h e severe drought o f 1992, an e f f o r t t h a t was u n f o r t u n a t e l y mismanaged.
I n a d d i t i o n t o t h e commercial food a i d program i n Maputo, and Bei ra , t he re i s a f r e e food a i d emergency d i s t r i b u t i o n program i n r u r a l areas t h a t i s operated as a separate e f f o r t , and w i l l n o t be t h e sub jec t o f t h e d i scuss ion i n t h i s paper.
For a d e s c r i p t i o n o f t h e r a t i o n system, see Alderman, Sahn, and Arulpragasam (1991).
More speci f i cal l y , t h e problem with t h e emergency d i s t r i b u t i o n program stemmed from t h e f a c t t h a t much of t he emergency food a id , p a r t i c u l a r l y t h a t des t ined f o r ru ra l a r eas , a r r ived l a t e , a f t e r t h e successful white maize harvest i n e a r l y 1993.3 Thus, much of t h e yellow maize food a id ended up f o r s a l e i n ru ra l markets i n mid-1993, while post-harvest market p r i ce s f o r white maize were low. The emergency yellow maize food a id des t ined f o r ru ra l a r eas flowed back t o Maputo. Subsequent shipments of yellow maize food a id f o r Maputo t h e r e a f t e r remained in s to rage , only t o d e t e r i o r a t e in q u a l i t y .
Although i t i s c l e a r t h a t emergency food a id d i s t r i b u t i o n in ru ra l a reas t h a t continued even a f t e r t h e 1993 harves t was i l l - t imed and excess ive , we argue t h a t such events should not be confused with a nonemergency, commercial s a l e s program of yellow maize food a id in Maputo. In f a c t we wi l l show t h a t t h e r e i s every reason f o r caut ion in reducing 1 eve1 s of ye1 1 ow maize food a id suppl ied t o Maputo ( a s opposed t o ru ra l a r eas and o the r urban c e n t e r s ) , owing t o t h e s e l f - t a r g e t i n g a t t r i b u t e s of t h e commodity.
The a n a l y s i s i n t h i s paper i s based on d a t a f o r t h e period Apr i l , 1991 t o March, 1992, a period in which the white maize harves t of 327 thousand tons in 1991/92 was t y p i c a l of those in Mozambique s ince t h e onse t of communal violence in t h e mid-1980s. The period analyzed predates t h e f a i l u r e of t h e 1992/93 harves t i n e a r l y 1992. Furthermore, dramatic changes i n t h e country were once again t o occur by mid-1993, owing t o t h e end of t h e c i v i l war, t h e successful harves t t h a t followed t h e 1992 drought, and i l l - t imed , post-harvest d e l i v e r i e s of food a i d t o r u r a l a r eas . So, while t h e concept of " t y p i c a l " circumstances i s d i f f i c u l t t o de f ine in t h e uns tab le and r ap id ly changing p o l i t i c a l , economic and c l i m a t i c environment c h a r a c t e r i s t i c of Mozambique, several major themes of t he 199111992 a n a l y s i s apply t o t he cu r r en t and l i k e l y f u t u r e s i t u a t i o n s .
To address t h e i s sue on t h e r o l e and e f f ec t iveness of food a i d in poverty a l l e v i a t i o n in Maputo, and whether t he re a r e any d e l e t e r i o u s e f f e c t s on t h e ru ra l poor of using food a id t o a l l e v i a t e urban poverty, we develop a mu1 ti-market s imula t ion model. We employ household survey da t a t o es t imate demand parameters and a poverty l i n e . Then, applying the model t o da ta on individual households, we s imula te t h e e f f e c t s of changes i n l e v e l s of food a id on c a l o r i e consumption and var ious poverty measures.
The s t r u c t u r e of t h e mu1 ti-market model i s out1 ined in Sect ion 2. The model includes equat ions f o r p r i c e s , production, consumpti on and t r a d e f o r seven a g r i c u l t u r a l - commodi t i e s and "nonfood. " Households a r e disaggregated i n t o th ree groups: Maputo poor, Maputo nonpoor, and ru ra l households in Mozambique's t h ree southernmost provinces. In addi t ion t o present ing the model i t s e l f , we a l so d e t a i l i n Sect ion 2 t h e methodology f o r a r r i v i n g a t , and es t imates of demand parameters. Furthermore, t h e approach used t o de r ive the poverty l i n e , and s imula te how exogenous pol icy changes a f f e c t t h e leve l of poverty, i s presented.
White maize production in 1993194 i s est imated a t 533 thousand tons , 48 percent g r e a t e r than t h e average harvest from 1982/83 t o 1991192.
In Section 3, we discuss the Maputo household survey and some descriptive information on food consumption patterns and calorie intake in Maputo. We present the data by expenditure quintile, as well as distinguishing between the poor and nonpoor, following the methodology described in Section 2.
Results of simulations are given in Section 4. First, we present simulation results of the mu1 ti-market model showing the effects of changes in yellow maize food aid on prices, production, consumption and incomes. Next, the model is applied to the data on individual households to estimate the impacts of food aid pol icy changes on cal ori e consumption of poor households and various poverty measures. A cost benefit analysis of the subsidy through yellow maize imports is also presented.
Finally, in Section 5 we present some concluding comments. These are designed to guide policy-makers and to suggest avenues for future research.
2. THE MULTI-MARKET MODEL
The analysis of the impact of pol icy and external shocks on agricultural commodities invol ves consideration of supply, demand, trade and incomes. While this analysis i s sometimes done separately for individual commodities, there are often important interactions between commodities on both the supply and demand side that make it important to conduct the analysis in a multi-commodity framework. The mu1 ti-market model summarized here (equations are given in Appendix 1) is designed to capture the major interactions across commodity markets and thus provide an appropriate analytical framework for Mozambican agricultural and food p01icy.~ The data employed to construct the model and derive the model parameters are discussed in Appendix 2.
MODEL STRUCTURE
Eight commodities are included in the model : yellow maize, white maize, rice, wheat, export crops and vegetables (including fruits, roots and tubers, and pulses), meat (including fish and other food not 1 isted above), and nonagricultu- re. All are produced domestically except yellow maize and wheat, and a1 1 are traded internationally, although trade in vegetables and meat is very small and is fixed exogenously in the model. Households are divided into three groups: Maputo nonpoor, Maputo poor, and "ruraln (the rest of the population of the three southern provinces of Maputo, Inhambane, and Gaza).
The model determines the 1 eve1 of domestic production of agricultural commodities given rural prices; no~agri cul tural production is fixed exogenously. Rural prices are 1 inked to urban consumer prices by a fixed marketing margin.5
Consumption of both urban and rural households is a function of household income and consumer prices. (For rural households, the consumer price is equal to the producer price). Nonagricultural output is fixed and nonaericultural income varies with the price of nonagricultural goods in the model. Agricul- tural incomes are determined by quantities produced and their prices.
* See Braverman and Hammer (1986) for a formal presentation of a mu1 ti-market model in another African context. Further detail s concerning the model construction are a1 so found in Dorosh and Bernier (1993).
The marketing margin is fixed as a constant percentage markup between rural and Maputo prices.
6 An alternate assumption would be to fix non-agricultural income in real terms, with the overall price level used as the deflator.
The method by which p r i c e s a re ob ta ined v a r i e s accord ing t o whether t h e commodity i s t r a d e d o r nontraded. For t r aded goods, t h e domest ic p r i c e l e v e l i s determined by w o r l d p r i c e s and t h e exchange r a t e . Net impor ts a d j u s t so t h a t t o t a l supp ly equal s demand.' For nontraded goods, (vegetab les and meat), n e t impor ts a re s e t t o t h e base l e v e l o f impor ts , and t h e model so lves f o r t h e consumer p r i c e t h a t c l e a r s t h e market, equa t ing supply and demand.
For t r a d e d goods, consumer p r i c e s a re l i n k e d t o border p r i c e s by t h e exchange r a t e , t a r i f f s , marke t ing cos t s and, i n cases where t h e o f f i c i a l consumer p r i c e i s f i x e d , r e n t s . For commodit ies where t h e l e v e l o f n e t impor ts i s no t f i x e d , r e n t s a re ze ro and t h e consumer p r i c e i s determined by t h e border p r i c e . The l e v e l o f n e t impo r t s a d j u s t s t o equate supply and demand. For y e l l o w maize, which i s impor ted i n f i x e d amounts under f o r e i g n a i d agreements, t h e q u a n t i t y o f n e t impor ts i s f i x e d , t h e consumer p r i c e a d j u s t s t o equate supply and demand and r e n t s a re earned by those ab le t o buy a t t h e o f f i c i a l border p r i c e and s e l l a t t h e market c l e a r i n g p r i c e .
The numeraire o f t h e model i s t h e p r i c e index o f nontraded goods, PIT, which i s computed f rom t h e p r i c e o f nontraded a g r i c u l t u r e (vegetab les and meat) and nont raded nonag r i cu l t u r a l goods. The exchange r a t e ad jus t s so t h a t exogenous f o re i gn c a p i t a l i n f l o w s equal t h e excess o f impor t demand over expo r t supply. Given t h e f i x e d p r i c e index o f nontraded goods, PNT, t h e nominal exchange r a t e i s e q u i v a l e n t t o t h e r e a l exchange r a t e .
MODEL PARAMETERS
Three major s e t s o f parameters i n f l u e n c e t h e behav ior o f t h e model : supply e l a s t i c i t i e s , own- and c ross -p r i ce e l a s t i c i t i e s o f demand, and income e l a s t i c i -
' World p r i c e s a re themselves endogenous, depending on t h e choice of e l a s t i c i t y o f expo r t supp ly parameter. An expo r t supply f u n c t i o n f rom t h e r e s t o f w o r l d i s inc luded , w i t h Mozambique's impor t p r i c e (PI,) p o s i t i v e l y r e l a t e d t o
t he l e v e l o f i t s impor ts (M,), r e f l e c t i n g h i ghe r marke t ing c o s t s assoc ia ted w i t h smuggling l a r g e r q u a n t i t i e s o f goods across borders :
M, = MO, * (1 + q + [PW,/PWO, - 11 )
For goods which a re t r aded f r e e l y on i n t e r n a t i o n a l markets, such as expo r t goods and r i c e , t h e e l a s t i c i t y o f expo r t supply < i s made very l a rge , so t h a t t h e wo r l d p r i c e i s e s s e n t i a l l y f i x e d . For goods such as w h i t e maize which i s t raded across 1 and borders, t h i s e l a s t i c i t y may be 1 ess than i n f i n i t y , b u t s t i l l g r e a t e r than zero. I n a l l t h e s imu la t i ons presented i n Sec t ion 3, €7 i s made very l a r g e and w o r l d p r i c e s a re exogenous.
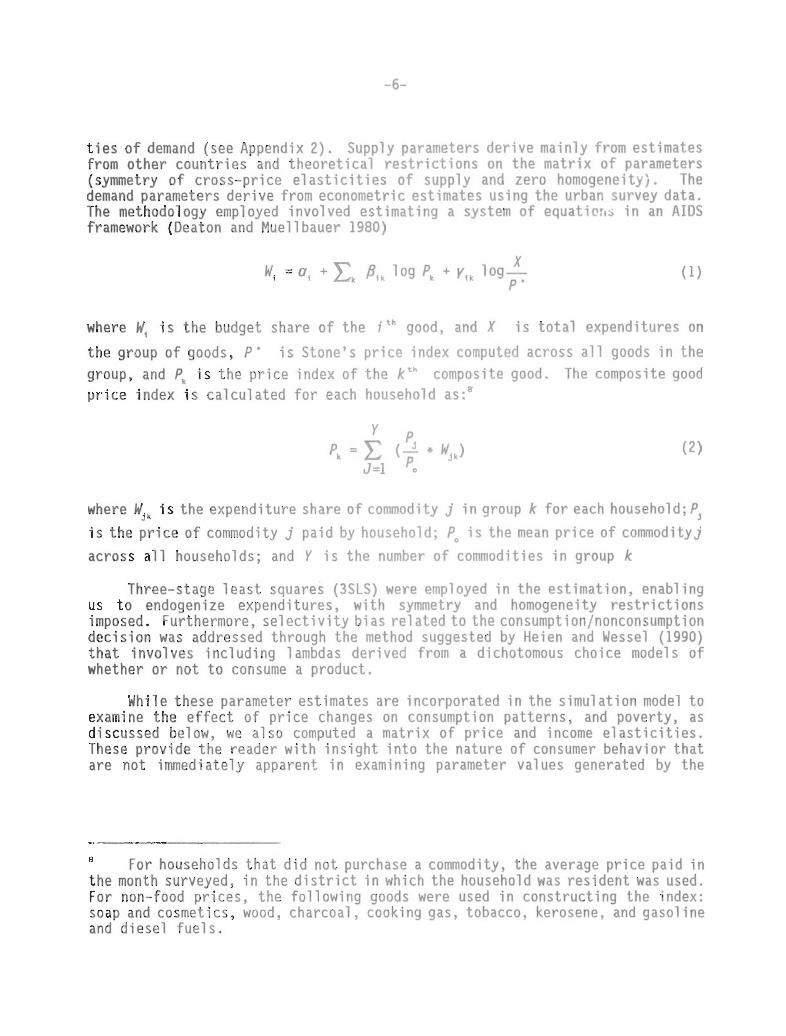
ties of demand (see Appendix 2). Supply ~ a r ~ m s t s r s dprivp mainly from estimates from other countries and theoretics' rpstrictions on the matrix of parameters (symmetry of cross-pri ce el ast i ci t i es o f supply and zero homogen~i t:~.; . The demand parameters derive from econo~strir: e s t i m a t ~ s using the urbat: Yrjrvey data. The methodology employed involved estimatina a system of quat tip^^, in an AIDS framework (Deaton and Muellbauer 1980)
where W, is the budget share of t h e i th pond, and Y is total ~xpenditlrres on
the group of goods, P is Stonc's p r ; c ~ S n d ~ , : C C ) M D U ~ P ~ across 21 1 CJI)O~S in the group, and P, is the price index of t h e k t h com~osi t e ~ o o d . The compnsi te good price index is calculated for each h ~ t l s ~ h o l d as:'
where W,, is the expenditure share o f cornrnndi+,y j i n o r o u ~ k for each household; P,
is the price of commodity j paid by h o u s s 4 ~ l d : 6 i q thmmoan price of comrnodityj across all households; and Y is the ntlmber of cormodities in group k
Three-stage least squares (3SLY) w q w emnl o y ~ d in the estimation, enabl ing us to endogenize expenditures, with symmetry and homogeneity restrictions imposed. Furthermore, selectivity bias related tothe consum~tion/nonconsurnption decision was addressed through the method suqgested by Yeien and Wessel (1990) that involves including lambdas derived from a dichotomous choice models of whether or not to consume a product.
While these parameter estimates are incorporated in the simulation model to examine the effect of price changes on consumption patterns, and poverty, as discussed below, we also computed a matrix of price and income elasticities. These provide the reader with insight into the nature of consumer behavior that are not immediately apparent in examining parameter values generated by the
8 For households that did not purchase a commodity, the average price paid in the month surveyed, in the district in which the household was resident was used. For non-food prices, the following goods were used in constructing the index: soap and cosmetics, wood, charcoal, cooking gas, tobacco, kerosene, and gas01 ine and diesel fuels.
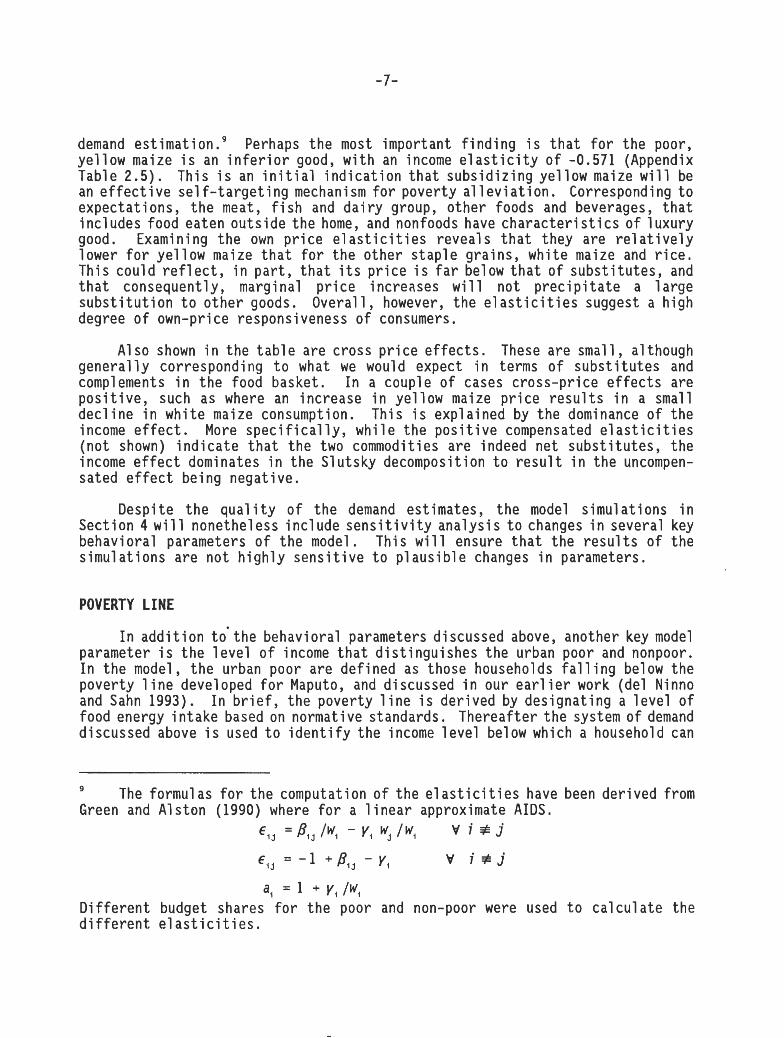
demand estimation.' Perhaps the most important f i n d i n g i s t h a t f o r the poor, ye l low maize i s an i n f e r i o r good, w i t h an income e l a s t i c i t y o f -0.571 (Appendix Table 2.5). This i s an i n i t i a l i n d i c a t i o n t h a t subs id iz ing ye l low maize w i l l be an e f f e c t i v e s e l f - t a r g e t i n g mechanism fo r pover ty a l l e v i a t i o n . Corresponding t o expectat ions, t he meat, f i s h and d a i r y group, o ther foods and beverages, t h a t inc ludes food eaten outs ide the home, and nonfoods have c h a r a c t e r i s t i c s o f l uxu ry good. Examining the own p r i c e e l a s t i c i t i e s reveals t h a t they are r e l a t i v e l y lower f o r ye l l ow maize t h a t f o r t he o ther s tap le gra ins, wh i te maize and r i c e . This could r e f l e c t , i n pa r t , t h a t i t s p r i c e i s f a r below t h a t o f subs t i tu tes , and t h a t consequently, marginal p r i c e increases w i 11 no t p r e c i p i t a t e a 1 arge s u b s t i t u t i o n t o o the r goods. Overal l , however, the e l a s t i c i t i e s suggest a h igh degree o f own-pri ce responsiveness o f consumers.
Also shown i n the t a b l e are cross p r i c e e f f e c t s . These are small, although genera l l y corresponding t o what we would expect i n terms o f subs t i t u tes and complements i n t he food basket. I n a couple o f cases cross-pr ice e f f e c t s are p o s i t i v e , such as where an increase i n ye l low maize p r i c e r e s u l t s i n a small dec l i ne i n wh i te maize consumption. This i s explained by the dominance o f the income e f f e c t . More s p e c i f i c a l l y , wh i l e the p o s i t i v e compensated e l a s t i c i t i e s (no t shown) i n d i c a t e t h a t t he two commodities are indeed net subs t i tu tes , the income e f f e c t dominates i n t he S lu tsky decomposition t o r e s u l t i n t he uncompen- sated e f f e c t being negat ive.
Despite t h e q u a l i t y o f the demand estimates, the model s imulat ions i n Sect ion 4 w i l l nonetheless inc lude s e n s i t i v i t y analys is t o changes i n several key behavioral parameters o f the model. This w i l l ensure t h a t the r e s u l t s o f t he s imulat ions are n o t h i g h l y s e n s i t i v e t o p laus ib le changes i n parameters.
POVERTY LINE
I n a d d i t i o n t o ' t h e behavioral parameters discussed above, another key model parameter i s t he 1 evel o f income t h a t d is t ingu ishes the urban poor and nonpoor. I n the model, t he urban poor are de f ined as those households f a l l i n g below the pover ty 1 i n e developed f o r Maputo, and discussed i n our ea r l i e r work (del Ninno and Sahn 1993). I n b r i e f , the pover ty 1 i n e i s der ived by designat ing a l e v e l o f food energy i n t a k e based on normative standards. Thereaf ter the system o f demand discussed above i s used t o i d e n t i f y the income 1 evel below which a household can
The formulas f o r t he computation o f t he e l a s t i c i t i e s have been der ived from Green and A1 ston (1990) where f o r a 1 inear approximate A IDS.
E t j = Bid /w, - Y, Wj / w , v i + j
a, = 1 + v, l w , D i f f e r e n t budget shares f o r the poor and non-poor were used t o ca l cu la te the d i f f e r e n t e l a s t i c i t i e s .
be expected not to achieve this level of cons~mption.'~'" The method for setting the poverty 1 ine has a number of advantages (Ravall ion 1993). For example, it is not necessary to determine the basic needs for nonfood goods. Instead, the approach employed automatically includes an allowance for nonfood consumption. Similarly, estimating the empirical relationship between calories and i ncome (proxi ed by consumption expenditures) provides a unique poverty 1 i ne that can be framed in larger welfarist terms, where the poverty line represents the point on the consumer's cost function that corresponds to a reference utility 1 evel . 12
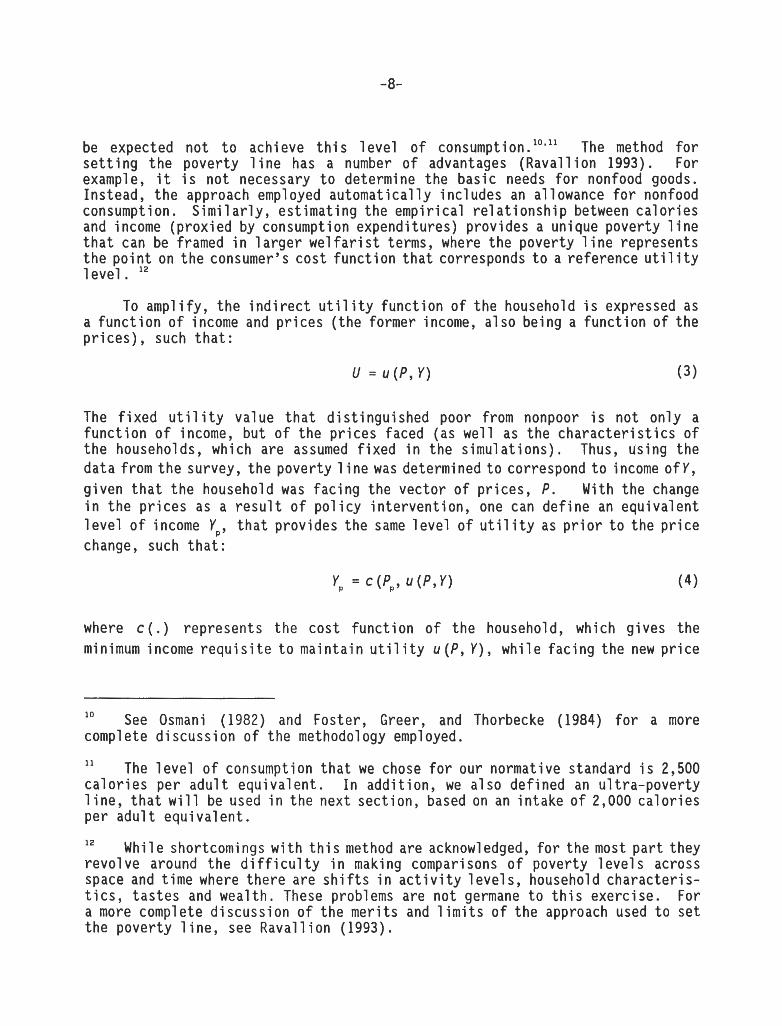
To amp1 ify, the indirect util ity function of the household is expressed as a function of income and prices (the former income, also being a function of the prices), such that:
U = u (P, Y) ( 3 )
The fixed utility value that distinguished poor from nonpoor is not only a function of income, but of the prices faced (as well as the characteristics of the households, which are assumed fixed in the simulations). Thus, using the data from the survey, the poverty 1 ine was determined to correspond to income of Y,
in the prices as a result of level of income Yp, that prov change, such that:
pol icy intervention, .one ides the same level of uti
given that the household was facing the vector of prices, P. With the change can define an equivalent lity as prior to the price
where c ( . ) represents the cost function of the household, which gives the minimum income requisite to maintain utility u(P, Y), while facing the new price
lo See Osmani (1982) and Foster, Greer, and Thorbecke (1984) for a more complete discussion of the method01 ogy employed. 11 The level of consumption that we chose for our normative standard is 2,500 calories per adult equivalent . In addition, we a1 so defined an ul tra-poverty 1 ine, that will be used in the next section, based on an intake of 2,000 calories per adul t equivalent .
While shortcomings with this method are acknowledged, for the most part they rev01 ve around the difficulty in making comparisons of poverty 1 evel s across space and time where there are shifts in activity levels, household characteris- tics, tastes and wealth. These problems are not germane to this exercise. For a more complete discussion of the merits and limits of the approach used to set the poverty line, see Ravallion (1993).
vec tor Pp. Thus, we de f i ne the equivalent income as t h a t which would enable the household t o reach the same l e v e l o f u t i l i t y a f t e r the p r i c e change t h a t t he household faced p r i o r t o i n te rven t i on .
I n t he s imulat ions, we employ the demand model t o est imate the equivalent income a t d i f f e r e n t values o f P, whi,ch are a lso endogenized i n the model. O r i n o ther words, we est imate a new l e v e l o f income t h a t w i l l enable the household t o achieve the same l e v e l o f money me t r i c u t i l i t y p r i o r t o p o l i c y change t h a t generates a new vec tor o f p r ices . Furthermore, recogniz ing t h a t Y = f ( P ) , t he model a lso ad jus ts the vec tor o f nominal household incomes i n con junc t ion w i t h a r r i v i n g a t new l e v e l s o f equivalent incomes t h a t correspond t o the p o l i c y changes model ed.
3. THE DATA AND DESCRIPTIVE STATISTICS
The base data for the model consist of estimated levels of consumption expenditures by households, production, trade and prices for the eight commodities included. Household expenditure estimates (e.g., volumes and quantities) in urban areas are derived from the 1991-92 Food Security Depart- ment/Cornell Food and Nutrition Policy Program integrated survey of 1816 households in Maputo. Data on expenditures and incomes for rural households are considerably less certain, and are derived from sectoral level data on production and producer prices, as well as the data on expenditure patterns of the urban poor. Details are given in Appendix 2.
Concerning the integrated household survey, it was conducted over a seven month period, October 1991 to April 1992. The multipurpose survey was designed to coll ect detailed information on household structure, consumption, prices, incomes, labor market activities, morbidity, child nutrition and feeding practices and housing characteristics. The sampl e was a sel f-weighted random sample of households in greater Maputo (including Maputo City, Matola, and Inhaca) .
Budget shares by expenditure quintile, and for the poor and nonpoor in Maputo are shown in Table 1. The results indicate that among the staple grains, the commodity group of bread and related products has the highest budget share overall, 8.2 percent. Rice is next important, with the budget share of 7.8 percent. Yellow maize grain's budget share is 6.1 percent, roughly twice that of white maize. Within the yellow maize group, flour without bran has the largest budget share, comprising nearly the sum of grain and flour with bran.
Examining these data by per capita expenditure quintiles yields a number of important findings. First, the shares of yellow maize products, both individual- ly and in combination, fall rapidly across the expenditure quintiles. For example, for households in the bottom quintile of the expenditure distribution, yellow maize products comprise 13.7 percent of the household budget. In contrast, ye1 1 ow maize products comprise only 1.2 percent of total expenditures for those in the highest quintile. The rate of decl ine in budget shares is roughly proportional for a1 1 ye1 low maize commodities.
The pattern of changes in budget shares for white maize products differs from yellow maize. In both cases, the budget share increases between the first and second quintile, suggesting that for the poor, white maize products are 1 uxury goods. Across the other quintiles the budget shares fa1 1, a1 though more precipitously for grain than flour.
Rice and bread budget shares across expenditure quinti les move in an almost identical way. Like white maize products, they both display characteristics of 1 uxury goods in the 1 ower expenditure qui nti 1 e. However, unl i ke white maize,
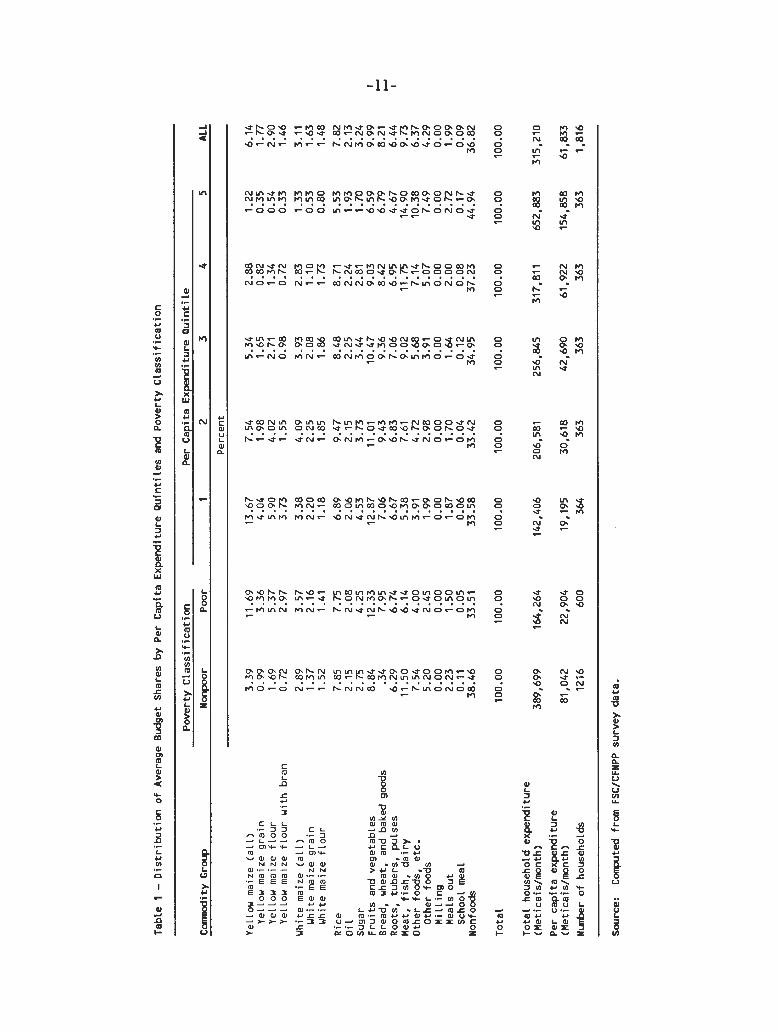
their budget shares are relatively stable until the fifth quintile, when they eventually fall.
The budget shares tell a number of other interesting stories. For example, the data suggest a 1 arge number of luxury goods, including the meat fish, and dairy group with its rapidly increasing budget share across the quintiles. But without doubt, the most interesting story in the budget share data is that while there is little decline in the food share across the expenditure quintiles, there is a dramatic change in the composition of food and nonfood expenditure. The high value that household's place on diversity, qual ity and convenience in the diet is manifest.
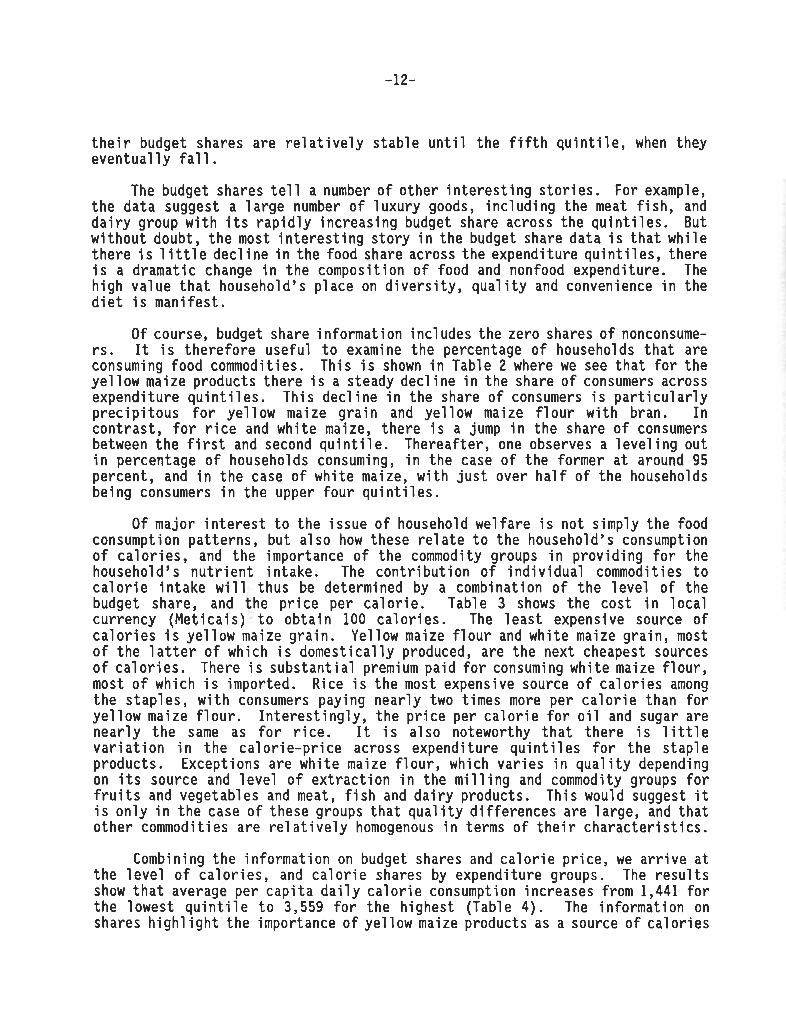
Of course., budget share information incl udes the zero shares of nonconsume- rs. It is therefore useful to examine the percentage of households that are consuming food commodities. This is shown in Table 2 where we see that for the yellow maize products there is a steady decline in the share of consumers across expenditure quinti les. This decl ine in the share of consumers is particularly precipitous for yellow maize grain and yellow maize flour with bran. In contrast, for rice and white maize, there is a jump in the share of consumers between the first and second quintile. Thereafter, one observes a level ing out in percentage of households consuming, in the case of the former at around 95 percent, and in the case of white maize, with just over half of the households being consumers in the upper four quintiles.
Of major interest to the issue of household welfare is not simply the food consumpti on patterns, but a1 so how these re1 ate to the household's consumpti on of calories, and the importance of the commodity groups in providing for the household's nutrient intake. The contribution of individual commodities to calorie intake will thus be determined by a combination of the level of the budget share, and the price per calorie. Table 3 shows the cost in local currency (Meticais) to obtain 100 calories. The least expensive source of calories is yellow maize grain. Yellow maize flour and white maize grain, most of the latter of which is domestically produced, are the next cheapest sources of calories. There is substantial premium paid for consuming white maize flour, most of which is imported. Rice is the most expensive source of calories among the staples, with consumers paying nearly two times more per calorie than for yellow maize flour. Interestingly, the price per calorie for oil and sugar are nearly the same as for rice. It is also noteworthy that there is little variation in the cal orie-price across expenditure quintil es for the staple products. Exceptions are white maize flour, which varies in qual i ty depending on its source and level of extraction in the mil 1 ing and commodity groups for fruits and vegetables and meat, fish and dairy products. This would suggest it is only in the case of these groups that qual ity differences are large, and that other commodities are relatively homogenous in terms of their characteristics.
Combining the information on budget shares and calorie price, we arrive at the level of calories, and calorie shares by expenditure groups. The results show that average per capita daily calorie consumption increases from 1,441 for the lowest quintile to 3,559 for the highest (Table 4). The information on shares high1 ight the importance of yellow maize products as a source of calories
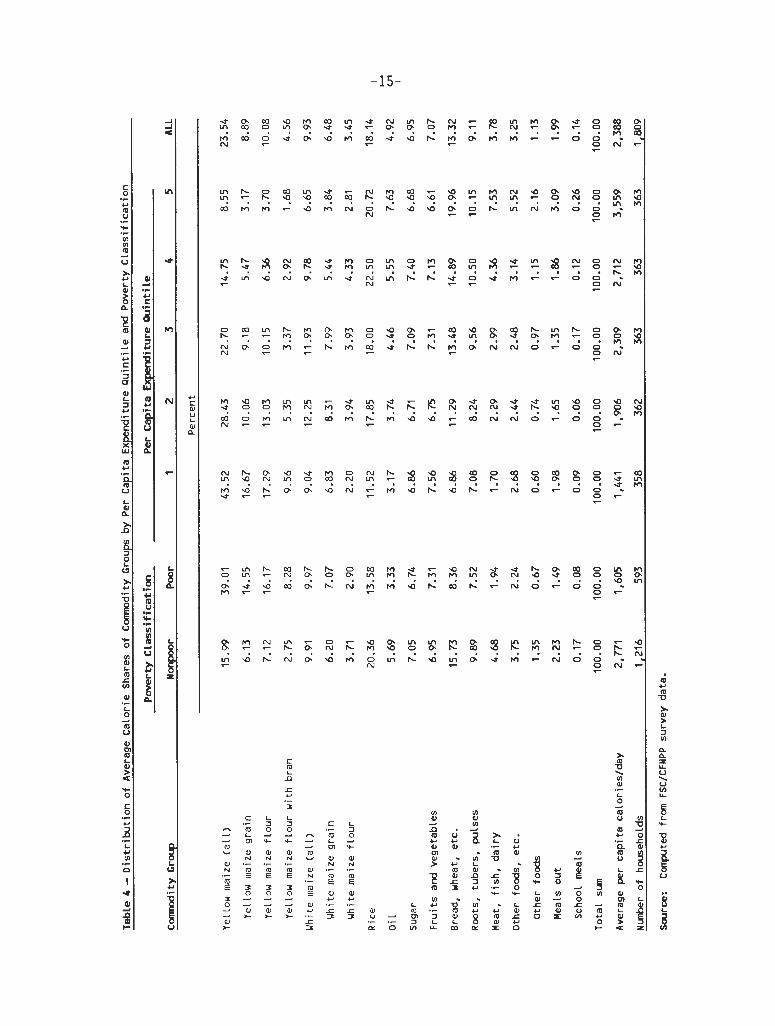
f o r t h e lowes t expend i tu re q u i n t i l e . S p e c i f i c a l l y , these products comprise 43.5 percen t o f t h e t o t a l c a l o r i e consumption o f these households. The combinat ion o f w h i t e and y e l l o w maize comprise over h a l f t h e bottom q u i n t i l e ' s c a l o r i e i n t a k e . As incomes r i s e , t h e share o f c a l o r i e s f rom y e l l o w maize products f a l l s d rama t i ca l l y , t o l e s s than 10 percen t f o r t he h ighes t q u i n t i l e . I n con t ras t , t he importance o f r i c e and bread r i s e s markedly, making them t h e p r imary c a l o r i e sources o f t h e r i c h . A lso g a i n i n g i n importance i s t h e share o f c a l o r i e s f rom meat, f i s h and d a i r y , r i s i n g f rom j u s t 1.7 percent i n t h e lowest q u i n t i l e , t o 7.5 percen t i n t h e upper q u i n t i l e .
4 . POLICY SIMULATIONS
In t h i s section, we examine the effects of changes in food aid imports of yellow maize to Maputo. The analysis begins a t the sectoral level , using the multi-market model presented above to estimate changes in prices, production, aggregate consumption, and trade of major food commodities given changes in yellow maize imports. Changes in aggregate incomes of the three households groups, the urban poor, urban nonpoor, and rural households are derived from the model. We include a sensi t ivi ty analysis of the robustness of the resul ts under a variety of assumptions regarding model specification and parameter estimates.
While modeling the effect of pol icy change on production and consumption a t the'sectoral level, as well as the aggregate incomes of the three classes of households in the model i s of interest , we next extend the analysis to the individual household 1 eve1 . In particular, we take the new price vector derived from the mu1 ti-market model, as we1 1 as the new aggregate income of the poor, and determine for each household below the poverty 1 ine what the i r new level of calorie consumption and pattern of expenditures would be. That i s , we ask the question: how would the calorie consumption and budget shares of each household below the poverty 1 ine change i f the prices and incomes changed according to the model simulations? We further determine how the head count and depth of poverty measures change in the population as a resul t of the price sh i f t s and aggregate income changes derived from the model.
CHANGES I N FOOD A ID IMPORTS: SECTORAL LEVEL OUTCOMES
In Simulation l A , yellow maize imports destined for the Maputo market are increased by 15 percent over the base 1991 level. I t i s assumed that these imports are funded through additional foreign aid inflows. Spending of the counterval ue funds generated through sales of the yellow maize imports i s not taken into account here.
The price of ye1 low maize fa1 1 s sharply as the 15 percent increase in ye1 low maize supply i s sold on the Maputo market (Table 5). The demand parameters indicate that in contrast t o the urban poor, the urban nonpoor households are not very responsive to price changes, ( i .e., the i r demand i s price inel a s t i c ) , so the increased supply of yellow maize must be consumed almost entirely by the urban poor. The ye1 1 ow maize market cl ears with a 37.1 percent decrease in the ye1 1 ow maize price and a 28.7 percent increase in ye1 low maize consumption by the urban poor.
Changes in the yellow maize price affect markets for other commodities as we1 1 , by increasing the demand f o r wheat, meat and nonagricul t u r a l goods and lowering demand for substi tutes for yellow maize: white maize, r ice , and vegetables, roots and pul ses. Prices of nontradabl e vegetables, roots and pulses tend to f a l l because of reduced demand, thus shift ing production incentives away
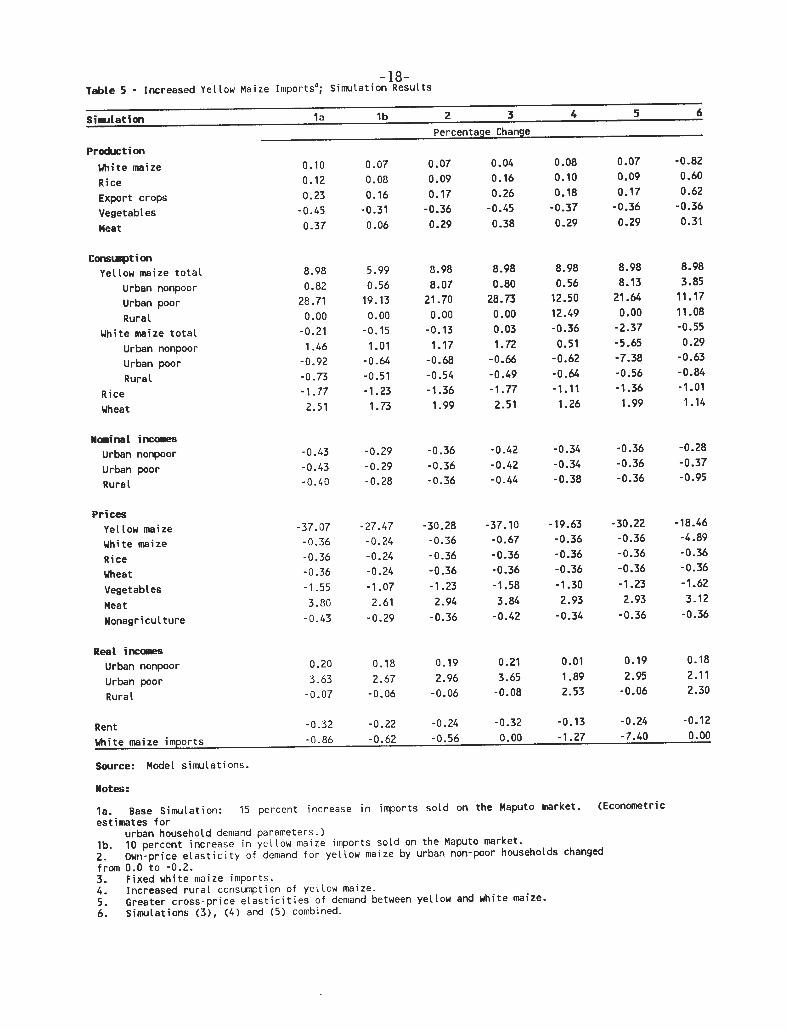
from these goods, and towards tradable agr icul tura l commodities and nonagricul- tura l production. Production of white maize, r i c e and export crops r i s e s s l i gh t l y (0.1 t o 0.2 percent) , while production of vegetables, roots and pulses f a l l s by 0.5 percent.
This gain in production takes place in s p i t e of a small appreciation of the real exchange r a t e (a reduction in the pr ice of tradables re1 a t ive t o nontradabl- e s ) . Because the cost of the incremental ye1 low maize imports i s small on a macroeconomic scal e , 2.1 mi 11 ion do1 1 a r s , l3 the real exchange r a t e appreciates by only 0.4 percent. (Although the price of vegetables, roots and pulses f a l l s , t h i s i s outweighed by an increase in the prices of other nontradable goods such as nonagricul tu ra l goods and meat .)
The increase in yellow maize imports t h u s has l i t t l e e f f ec t on the white maize market. The 37.1 percent decrease in the yellow maize pr ice , in i t s e l f , leads t o only a 0.9 percent decrease in demand fo r white maize by the urban poor (and a 1.5 percent increase in demand by the urban nonpoor) .I4 The small real exchange r a t e appreciation only s l i gh t l y lowers white maize pr ices r e l a t i ve t o pr ices of nontradable goods in general. B u t the decline in the price of vegetables, roots and pulses as demand s h i f t s towards yellow maize outweighs the e f f ec t s of the real exchange r a t e appreciation and actual ly leads t o a s l i gh t increase in incentives f o r production of white maize. White maize imports fa1 1 by 0.9 percent.
The net e f f ec t of the changes in prices and agr icul tura l production i s t o increase aggregate real incomes of the urban poor by 3.6 percent, mainly because of lower food pr ices . Aggregate real incomes of the urban nonpoor increase only s l i g h t l y s ince these households consume r e l a t i ve ly 1 i t t l e yellow maize. Because the terms of t rade s h i f t s against rural households as the prices of vegetables, roots and pulses, and gra ins f a l l , real incomes of rural households f a l l very s l igh t ly (-0.1 percent) .
Reducing the change in yellow maize imports t o only 10 percent, (Simulation l b ) , shows t ha t the model i s nearly 1 inear f o r small changes in imports. Real incomes of the urban poor r i s e only 2.67 percent, 74 percent of the r i s e in Simulation l a .
Sens i t iv i ty Analysis
The 15 percent increase in yellow maize imports i s equal t o 11,500 tons of yellow maize, valued a t $182.6 per ton c . i . f .
14 Unlike the poor, f o r the urban non-poor, yellow maize i s not a net subs t i tu te f o r white maize. The low magnitude of the posit ive compensated e l a s t i c i t y i s o f f s e t by the income e f f ec t , so the uncompensated cross-price e l a s t i c i t y of white maize demand with respect t o the price of yellow maize i s s l i g h t l y negative.
A key parameter determining the ex ten t o f a f a l l i n ye l l ow maize p r i ces w i t h add i t i ona l imports i s t h e own-price e l a s t i c i t y o f demand f o r ye l low maize by urban households. A1 though t h i s parameter i s e m p i r i c a l l y estimated, we nonetheless perform s e n s i t i v i t y ana lys is i n Simulat ion 2 where we change the own- p r i c e e l a s t i c i t y o f demand f o r ye1 low maize - by the urban nonpoor from 0.0 i n Simulat ion 1 t o -0.2, w i t h the e l a s t i c i t y f o r t he poor remaining a t -0.55 as i n S imula t ion 1 .'"s demand f o r ye1 low maize by the nonpoor becomes p r i ce - responsive, t h e i r consumption o f ye l l ow maize r i s e s by 8.1 percent w i t h the increase i n ye l l ow maize supply. Consumption o f ye l l ow maize by the poor thus r i s e s l e s s (by 21.7 percent instead o f 28.7 percent as i n Simulat ion 1) and the p r i c e o f ye l l ow maize f a l l s l e s s s teep ly (-30.3 percent versus -37.1 percent i n Simulat ion l a ) . Since t h e ye l l ow maize i s l e s s e f f e c t i v e l y targeted, r e a l incomes o f t he urban poor r i s e by 3.0 percent (compared w i t h 3.6 percent i n Simulat ion l a ) . E f f e c t s on supply and r u r a l incomes are dampened s ince the f a l l i n ye1 low maize p r i c e s and the r e s u l t i n g s h i f t i n demand away from nontraded food crops are smal ler.
I n Simulat ion 3 we assume t h a t whi te maize imports a re f i x e d i n t he shor t run (due t o problems i n in fo rmat ion f lows o r o ther market imperfect ions) . Under such a scenario, any decl i n e i n wh i te maize demand would a f f e c t domestic demand, and thus pr ices , n o t t he l e v e l o f imports. A1 though a f i x e d l e v e l o f whi te maize imports i s a h i g h l y u n l i k e l y scenario, nonetheless, once again we simulate an extreme, worst case scenario f o r farmers. The wh i te maize p r i c e i s 0.3 percent lower than i n Simulat ion l a as imports are no t permi t ted t o f a l l w i t h the decrease i n demand. Product ion o f whi te maize increases by 0.04 percent compared w i t h a 0.10 percent increase i n Simulat ion la , although the n e t e f f e c t on r u r a l income i s n e g l i g i b l e .
A l l o f t h e above s imulat ions have assumed t h a t ye l l ow maize so ld i n Maputo i s consumed on ly by urban households and does no t f i n d i t s way i n t o r u r a l markets. I n Simulat ion 4, we show t h e e f f e c t s o f ye l l ow maize being suppl ied throughout t he reg ion so t h a t t he same p r i c e holds f o r a l l consumers. This extreme assumption provides an upper bound f o r t he magnitude o f the e f f e c t s o f leakages outs ide the Maputo market, no t on ly because i t assumes out f lows o f a i d from Maputo t o the countryside, bu t t h a t t he ye l l ow maize marketed i s so ld i n r u r a l areas a t the same p r i c e as i n Maputo. I n r e a l i t y , even i f there were market f lows t o the countryside, p r i ces i n r u r a l markets would be h igher than i n Maputo due t o t h e l a r g e t ranspor t and o ther marketing cos ts .
l5 The income e l a s t i c i t y o f demand f o r ye l l ow maize i s a lso adjusted upward t o -1.345 so as t o mainta in homogeneity o f degree 0 i n p r i c e s and incomes. Engel's Law ( the sum o f t he income e l a s t i c i t i e s weighted by the budget shares must equal u n i t y ) i s s a t i s f i e d by reducing the income e l a s t i c i t y o f non-food from 1.338 t o 1.321. F i n a l l y , zero homogeneity i n p r i ces and incomes f o r non-foods i s s a t i s f i e d by reducing the own-price e l a s t i c i t y from -0.975 t o -0.950. With these adjustment, symmetry o f the cross-pr ice e f f e c t s i s no longer maintained, however.
The r e s u l t s o f such a scenario would be t h a t consumption o f ye l l ow maize r i s e s by 12.5 percent f o r both urban and r u r a l households. Real incomes increase by 2.5 percent f o r r u r a l households, bu t t h e 1.9 percent ga in f o r urban poor households i s s u b s t a n t i a l l y l e s s than i n Simulat ion 1 (3.6 percent) .
Another key parameter i n f l u e n c i n g the impact o f a subsidy on ye l l ow maize on t h e demand and p r i c e o f wh i te maize i s the cross-pr ice e l a s t i c i t i e s between ye1 1 ow and wh i te maize. For Simulat ion 5, t he adjusted own-price e l a s t i c i t i e s o f demand f o r ye l l ow maize from Simulat ion 2 are used, and the cross-pr ice e l a s t i c i t y o f demand f o r wh i te maize w i t h respect t o a change i n t h e ye1 low maize p r i c e i s increased from -0.046 t o 0.150 f o r t he urban nonpoor and from 0.004 t o 0.200 f o r t h e urban poor.I6
White maize demand now f a l l s by 2.4 percent and wh i te maize imports f a l l by 7.4 percent as urban consumers s u b s t i t u t e towards ye1 1 ow maize. The s p i l l over e f f e c t s o f increased ye l l ow maize imports on the wh i te maize market are s t i l l small however, ma in ly because Maputo accounts f o r o n l y a small share (11 percent) o f na t i ona l consumption and 33 percent o f reg iona l consumption o f wh i te maize. A 10 percent decrease i n Maputo's demand f o r wh i te maize would on l y represent a 3.3 percent decl i n e i n t he reg ion 's demand f o r wh i te maize." Moreover, because the wh i te maize p r i c e remains t i e d t o wor ld p r ices , domestic p roduc t ion o f wh i te maize i s almost unchanged. The change i n consumption o f ye l l ow maize and r e a l incomes o f t h e urban poor are e s s e n t i a l l y i d e n t i c a l t o those i n Simulat ion 2.
F i n a l l y , S imu la t ion 6 shows t h e combined e f f e c t s o f f i x i n g wh i te maize imports (S imu la t ion 3) , a l l ow ing t h e add i t i ona l ye l l ow maize imports t o be so ld i n r u r a l areas (S imu la t ion 4) , and us ing t h e new parameters from Simulat ion 5, i n order t o se t an upper bound on p o t e n t i a l d i s i n c e n t i v e e f f e c t s on wh i te maize. White maize p r i c e s f a l l 4.9 percent and wh i te maize produc t ion f a l l s by 0.82 percent. Consumption o f ye l l ow maize by the urban poor and r u r a l households increases by 11.2 and 11.1 percent, r espec t i ve l y , and the 21.0 percent drop i n
l6 Adjustments t o o the r parameters are a lso made t o ma in ta in symmetry o f the cross-pr ice e f f e c t s and t o s a t i s f y Engel's Law. The new e l a s t i c i t i e s are as f o l 1 ows :
Urban Poor Urban Non-Poor Rural eD (wmz,ymz) 0.200 0.150 0.200
fly (non -agr i c ) 1.463 1.361 1.463
l7 The model here assumes t h a t Maputo i s f u l l y i n teg ra ted on ly w i t h the Southern reg ion o f Mozambique. I f wh i te maize from o the r regions o f Mozambique a1 so fed i n t o t he Maputo market, t he e f f e c t s o f changes i n Maputo demand on wh i te maize produc t ion would be even smal le r .
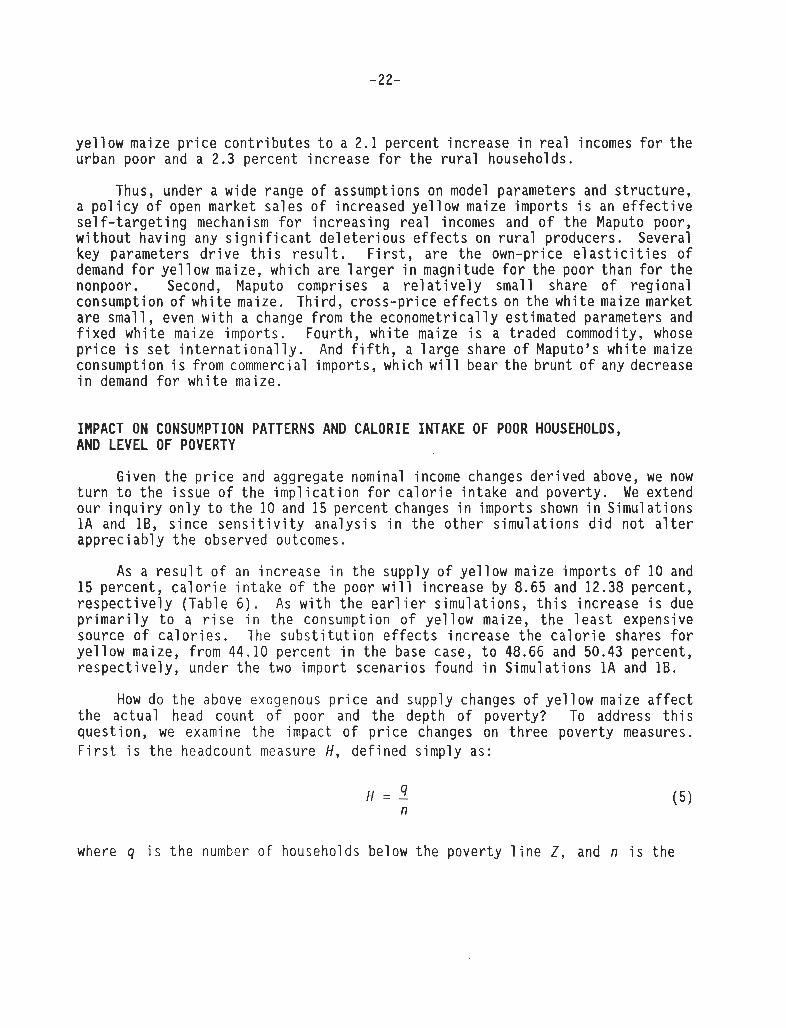
ye1 l ow maize p r i c e c o n t r i b u t e s t o a 2.1 percen t inc rease i n r e a l incomes f o r t h e urban poor and a 2.3 percen t inc rease f o r t h e r u r a l households.
Thus, under a wide range o f assumptions on model parameters and s t r u c t u r e , a p o l i c y o f open market sa l es o f increased ye1 1 ow maize impor ts i s an e f f e c t i v e s e l f - t a r g e t i n g mechanism f o r i nc reas ing r e a l incomes and o f t h e Maputo poor, w i t h o u t hav ing any s i g n i f i c a n t d e l e t e r i o u s e f f e c t s on r u r a l producers. Several key parameters d r i v e t h i s r e s u l t . F i r s t , a re t h e own-price e l a s t i c i t i e s o f demand f o r ye1 1 ow maize, which a re 1 a rger i n magni tude f o r t h e poor than f o r t h e nonpoor. Second, Maputo comprises a r e1 a t i v e l y smal l share o f r eg iona l consumption o f w h i t e maize. Th i r d , c ross -p r i ce e f f e c t s on t h e w h i t e maize market a re smal l , even w i t h a change f rom t h e econome t r i ca l l y es t imated parameters and f i x e d w h i t e maize impor ts . Four th , w h i t e maize i s a t r aded commodity, whose p r i c e i s s e t i n t e r n a t i o n a l l y . And f i f t h , a l a r g e share o f Maputo's w h i t e maize consumption i s f rom commercial impor ts , which w i 11 bear t h e b r u n t o f any decrease i n demand f o r w h i t e maize.
IMPACT ON CONSUMPTION PATTERNS AND CALORIE INTAKE OF POOR HOUSEHOLDS, AND LEVEL OF POVERTY
Given t h e p r i c e and aggregate nominal income changes d e r i v e d above, we now t u r n t o t h e i s sue o f t h e i m p l i c a t i o n f o r c a l o r i e i n t a k e and pover ty . We extend our i n q u i r y o n l y t o t h e 10 and 15 percen t changes i n impor ts shown i n S imu la t ions 1A and lB, s i n c e s e n s i t i v i t y ana l ys i s i n t h e o t h e r s imu la t i ons d i d n o t a l t e r app rec i ab l y t h e observed outcomes.
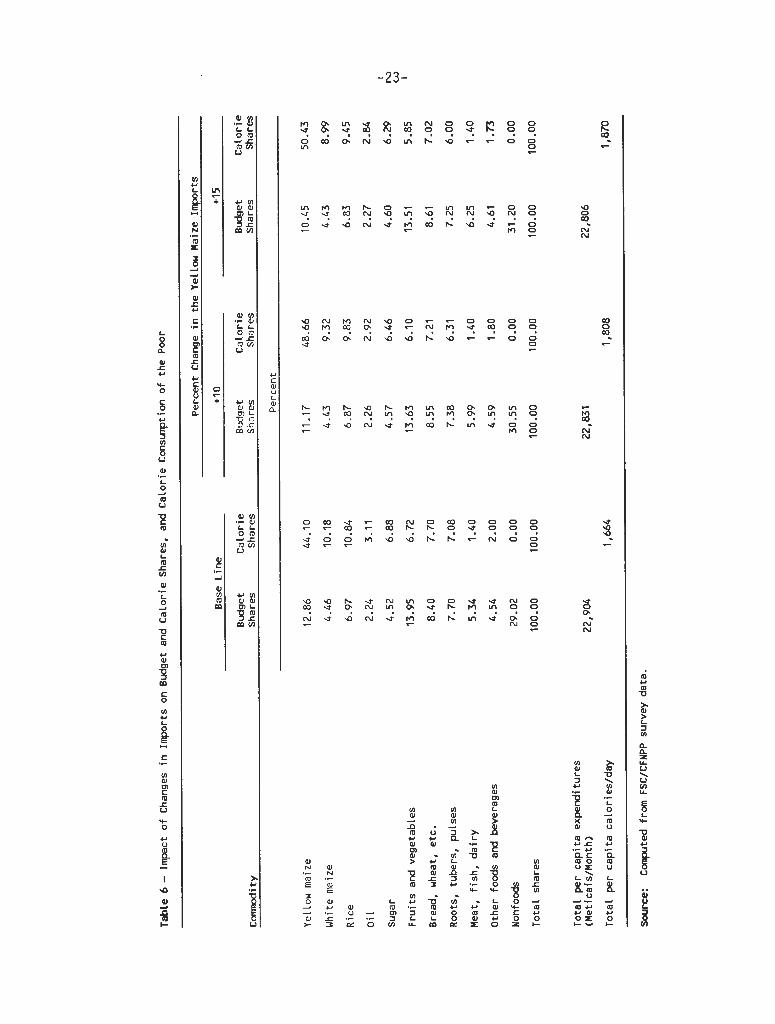
As a r e s u l t o f an inc rease i n t h e supply o f y e l l o w maize impor ts o f 10 and 15 percent , c a l o r i e i n t a k e o f t h e poor w i l l i nc rease by 8.65 and 12.38 percent , r e s p e c t i v e l y (Table 6 ) . As w i t h t h e e a r l i e r s imu la t i ons , t h i s inc rease i s due p r i m a r i l y t o a r i s e i n t h e consumption o f y e l l o w maize, t h e l e a s t expensive source o f c a l o r i e s . The s u b s t i t u t i o n e f f e c t s inc rease t h e c a l o r i e shares f o r y e l l o w maize, f rom 44.10 percen t i n t h e base case, t o 48.66 and 50.43 percent , r e s p e c t i v e l y , under t h e two impor t scenar ios found i n S imu la t ions 1A and 1B.
How do t h e above exogenous p r i c e and supply changes o f y e l l o w maize a f f e c t t he ac tua l head count o f poor and t h e depth o f pover ty? To address t h i s quest ion, we examine t he impact o f p r i c e changes on t h r e e pove r t y measures. F i r s t i s t h e headcount measure H, def ined s imp ly as:
where 9 i s t h e number o f households below t h e pove r t y l i n e Z, and n i s t h e
number of households in the population. In addition, we estimate the poverty gap index, PG, defined as follows:
1 q z - Y , p = - + C '-r 1 " i l
where Y, is the income of persons or household i, Z is the poverty line, n is the total number of individuals or households, and q is the number of individuals below the poverty line. Furthermore, we employ the Foster-Greer- Thorbecke P, measure which is as follows:
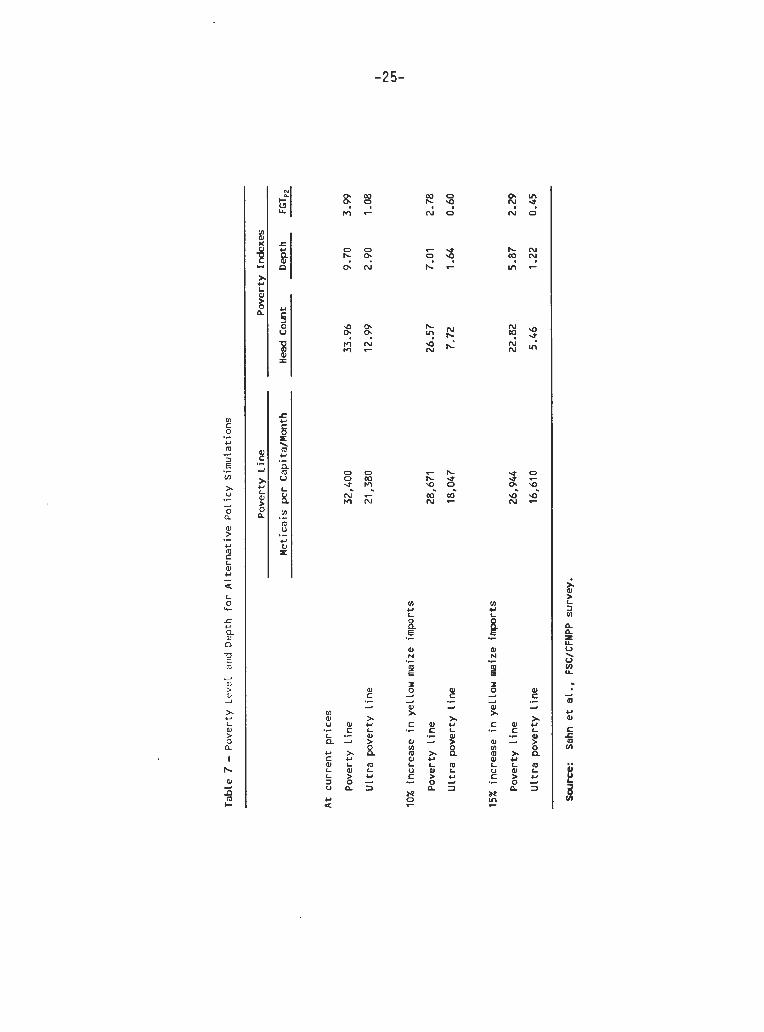
In order to examine how these three indexes are affected by a change in supply and prices, we go back to our money metric measure of utility that we used to construct our original poverty 1 ine for the survey population. Given the sets of prices that prevailed at the time of the survey, and used in the baseline s imul at i on, the poverty 1 i ne and ul tra-poverty 1 i ne, based on the 1 evel of income needed to consume the normative calorie intakes of 2,500 and 2,000 per capita, are Meticais 32,400 and 21,380 per capita per month, respectively (del Ninno and Sahn 1993).
Prior to intervention (the base case), 33.96 percent of the households are be1 ow the poverty 1 i ne, and 12.99 percent are cl assi fied as ul tra-poor (Tab1 e 7). The average depth of poverty is 9.7 percent. A 20 percent decl ine in the price of yellow maize reduces the head count of the poor to 29.0 percent, and the poverty gap index to 8.81 percent. The share of the ultra poor decl i nes by an even greater percentage, from 12.99 to 8.82 percent of the population. This drop in the share and depth of poverty, once again, is attributable to a decline in the prices, which reduces the corresponding level of income required to achieve the normative calorie consumption levels.
Similarly, we find that a 15 percent increase in yellow maize imports will reduce the number of poor from 33.96 to 22.82 percent of the population, reflecting a 16.84 percent decline in the level of income required to be classified as poor. But even more dramatic is the decline in the share of ultra- poor, fall ing from 12.99 percent to 5.46 percent of the population while the ultra-poverty gap fall to just 1.22 from 5.87 percent. This reflects a 22.31 percent fall in the ultra-poverty 1 ine.
COUNTERVALUE FUNDS AND THE COST OF THE SUBSIDY
Until recently yellow maize has been sold to consignees at below market clearing 1 evel s in a misguided attempt to subsidize consumers. The government has sacrificed potential revenues from countervalue funds by selling at a low
price ye t the subsidy has not reached the intended consumers. Results from the 1991/92 DSA/Cornell household survey of Maputo show, however, t ha t most yellow maize was purchased in the open market (dumbanenge) a t an average price of 414.2 Mt/kg, 50.6 percent above the o f f i c i a l NSA price of 275 Mt/kg.
Sel l ing yellow maize a t a market clearing price would thus increase government revenues from countervalue funds. Paradoxically, there i s a tradeoff between potential counterval ue funds and the level of maize imports. As ye1 low maize imports increase, the open market price ( the price paid by consignees) fa1 1 s , reducing potenti a1 countervalue funds.
Table 8 shows the e f f ec t s of changes in the level of yellow maize imports on t he imp1 i c i t subsidy t o ye1 low maize consumers, potential counterval ue funds and the marginal costs and benefi ts . Costs a re measured in two ways. The f i r s t measure i s simply the c. i . f . value of the ye1 1 ow maize imports. The second measure of costs i s the net f inancial cost t o the government of using yellow maize food aid t o reduce urban poverty, equal t o the difference between the c . i . f value of ye1 low maize imports (plus any government costs associated with the sa le of the ye1 low maize t o consignees) and the countervalue funds generated. Two measures of benefi ts are used, as we1 1 : the change in real incomes of the t a rge t group ( the urban poor) and the change in the number of people below the poverty l ine .
Assuming a 30 percent marketing markup between c . i . f . and r e t a i l and a para1 l e l market exchange r a t e of 2200 meticai s/doll a r , the observed market price of yellow maize (414.2 Mt/kg) i s 16.9 percent below the border price of yellow maize a t the r e t a i l level (498 Mt/kg). With a 15 percent increase in yellow maize sold in Maputo (Simulation l a ) , the market price f a l l s by 18.5 percent t o level 47.7 percent be1 ow the border price. Potential counterval ue funds are now 34.1 b i l l ion Meticais, a decrease of 6.8 b i l l ion Meticais from the base level potent i a1 counterval ue funds. The decrease in potential counterval ue funds occurs despi te an increase in maize sold because with a pr ice- inelas t ic demand, the percentage f a l l in market price (-18.5 percent) i s greater than the percentage increase in to ta l sa les in Maputo (15.0 percent). The 15 percent increase in imports (11,500 tons) has a CIF value of 4.4 b i l l ion meticais (2.1 million do l l a r s ) . With the marginal increase in real incomes of urban poor households equal t o 5.9 b i l l ion meticais, the marginal benefi t / co s t r a t i o i s 1.34. In terms of the number of people below the poverty l ine , the marginal benefi t cost r a t i o i s 79.6 thousand people 1 i f t ed out of poverty per mill ion do l l a r s ( c . i . f . ) of yellow maize food a id .
In terms of the f inancial cost t o the government, the marginal cost of the 15 percent increase in yellow maize sold in Maputo i s 6.75 b i l l ion meticais, as the potential countervalue funds f a l l from 40.81 b i l l ion meticais h i s to r ica l ly t o only 34.06 b i l l ion meticais with higher yellow maize sa les . The drop in to ta l countervalue funds occurs because the government receives l e s s money on a l l i t s sa les of yellow maize, not jus t on the additional 15 percent. In terms of real incomes, the marginal benefi ts t o urban poor households of 5.90 b i l l ion meticais a re equal t o 87 percent of the f inancial cost t o the government. In terms of the
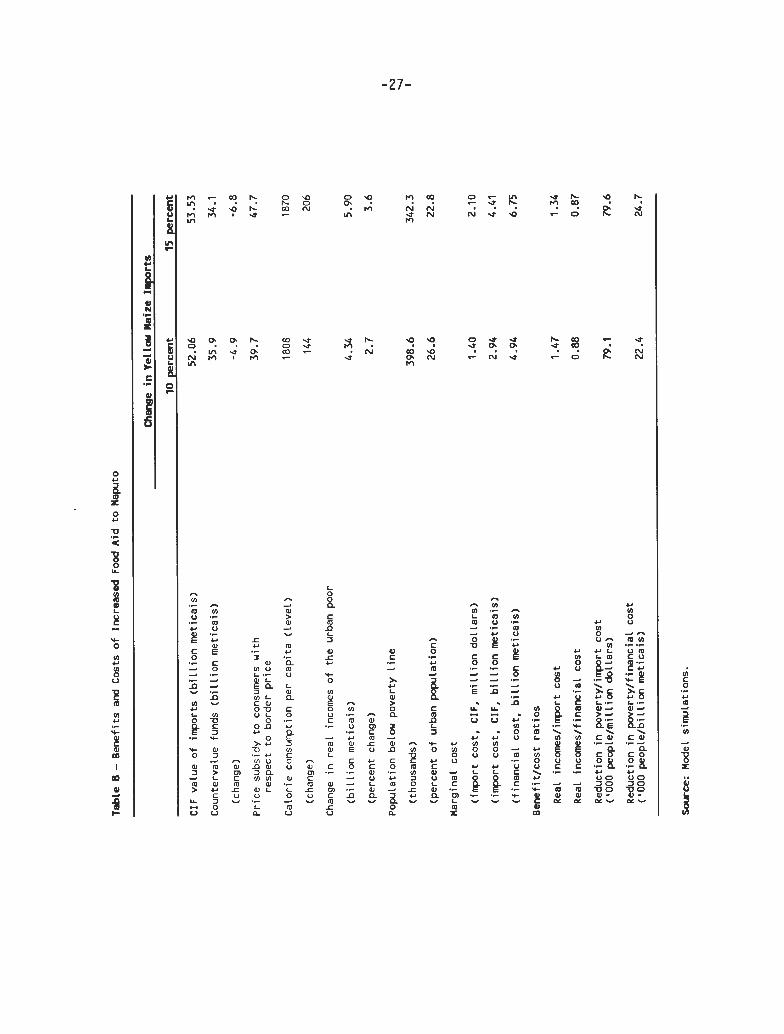
number of the poor, the marginal benefit cost r a t i o i s 24.7 thousand fewer people below the poverty 1 ine per b i l l ion meticais of foregone countervalue funds.
Thus, reducing the amount of yellow maize sold actually increases the counterval ue funds generated. I f the government's objective were t o maximize countervalue revenues, i t would act as a monopol i s t and lower imports of ye1 low maize unt i l the marginal revenue from countervalue funds was equal t o the marginal cos t ( the c . i . f . price) .I8 Of course, the actual objectives of food aid policy of the Mozambican government are a mix of poverty a l levia t ion and generation of revenues. Nonetheless, the loss of these potential countervalue revenues represents a real opportunity cost of the policy.
l8 AS long as the price e l a s t i c i t y of demand i s l e s s than 1 in absolute magnitude, there i s no maximum solution. In practice, as supply decreases and the price r i s e s , demand becomes more price el a s t i c ( the absolute magnitude of the price e l a s t i c i t y increases). The econometric analysis provides estimates only fo r a small portion of the demand curve and do not give an indication of the overall e l a s t i c i t y fo r a large change in quantity or price.
5. CONCLUSIONS
I n t h i s paper we have shown the p o s s i b i l i t i e s o f us ing food a i d as an e f f e c t i v e means o f pover ty a1 1 e v i a t i o n i n Maputo. S p e c i f i c a l l y , t he simulat ions, based on a mult i -market model constructed using data on supply and demand l e v e l s i n 1991/1992 and parameter est imates o f a system o f consumer demand from a survey du r ing the same per iod, show t h a t ye l low maize i s s e l f - t a r g e t i n g and t h a t poor consumers are responsive t o changes i n the p r i c e o f ye l low maize. The simul a t i ons based on these parameters i n d i c a t e the importance and e f f i c a c y o f cont inuing, and even increas ing the quan t i t y o f food a i d imports so ld i n the Maputo market above the l e v e l s o f 1991/92 as a means o f r a i s i n g c a l o r i e in take, reducing the number o f poor, and narrowing the pover ty gap.
For tunate ly , the economic and pol i t i c a l s i t u a t i o n i n Mozambique improved g r e a t l y i n 1993 as a r e s u l t o f an end t o the long c i v i l war and good r a i n s t h a t con t r i bu ted t o the l a r g e s t wh i te maize harvest i n over a decade. How does the ana lys is us ing 1991192 data apply t o the s i t u a t i o n i n 1993 and beyond? Have the momentous changes i n Mozambique e l iminated the need f o r food a i d sales i n Maputo?
I n f a c t , t he major r e s u l t s o f t h i s analys is s t i l l apply t o the cur ren t s i t u a t i o n and are re levan t f o r f u t u r e po l i c y . I n p a r t i c u l a r , th ree major lessons emerge from the ana lys is t h a t have relevance i n s p i t e o f f l u c t u a t i o n s i n l e v e l s o f harvest, wor ld p r i ces o r food a i d d e l i v e r i e s t o r u r a l areas.
F i r s t , open market sales o f ye l low maize i n Maputo are l i k e l y t o remain an e f f e c t i v e sel f - t a r g e t i n g mechanism f o r reducing urban pover ty . The preference f o r s tap les o ther than ye l l ow maize shown by urban consumers i n Maputo i s a s t rong one. For h igher income consumers a change i n y e l l ow maize p r i ces brought about by a change i n ye l l ow maize supply has l i t t l e e f f e c t on q u a n t i t y o f ye l low maize demanded. But f o r the Maputo poor, changes i n ye1 low maize p r i ces 1 ead t o g rea te r changes i n quan t i t y demanded and, because ye l l ow maize comprises a l a rge share o f t h e i r consumption basket, a s i g n i f i c a n t e f f e c t on t h e i r r e a l incomes. O f course, over t ime, there i s the prospect t h a t there w i l l be changes i n tas tes and preferences t h a t w i 11 d imin ish these sel f - t a r g e t i n g a t t r i b u t e s o f ye l low maize products. This i s indeed possible, a1 though, determinable, and should no t be a de te r ren t t o b o l s t e r i n g o r a t l e a s t ma in ta in ing the food a i d program i n Maputo i n the short-term, espec ia l l y u n t i l economic s t a b i l i t y and growth i s res tored t o a war - ta t te red economy.
Second, marginal changes i n the l e v e l o f ye l low maize sales i n Maputo v i s A v i s t he l e v e l s o f 1991192 are u n l i k e l y t o have major e f f e c t s on r u r a l p r i c e incent ives . This i s because i n normal years a l a rge share o f whi te maize consumed i n Maputo i s 1 i ke ly t o be imported from Swaziland and the Republic o f South A f r i ca , espec ia l l y i n the form o f f l o u r . Even i f the cross-pr ice e f f e c t s o f lower ing ye l l ow maize imports depressed demand, g iven the magnitude o f the e l a s t i c i t i e s , i t i s near ly inconceivable t h a t the dec l ine i n demand would be so
l a r g e as t o reduce impor ts t o ze ro and l e a d t o a l a r g e drop i n t h e p r i c e o f w h i t e maize.
But even i f inc reased domest ic p roduc t i on rep1 aced impor ted w h i t e maize, t h e s i m u l a t i o n s show t h a t t h e d e c l i n e i n w h i t e maize p r i c e i s l i k e l y t o be smal l . The urban poor ' s budget shares t o w h i t e maize p roduc ts i s t r i v i a l r e l a t i v e t o aggregate domest ic supply, so t h e r e i s 1 i t t l e sector -wide impact o f a dec l i n e i n t h e i r demand f o r w h i t e maize. Conversely, t h e urban nonpoor who consume w h i t e maize a re n o t o n l y smal l consumers o f y e l l o w maize, b u t n o t n e a r l y as p r i c e respons ive. Thus, t h e i r demand f o r wh i t e maize a l s o changes l i t t l e . F i n a l l y , i t i s a1 so t h e case t h a t t h e areas prox imate t o Maputo a re n o t major maize p roduc ing reg ions . As l ong as t h e y e l l o w maize food a i d i s i n i t i a l l y s o l d i n Maputo, t h e p o t e n t i a l f o r s u b s t a n t i a l amounts o f y e l l o w maize t o be t r anspo r t ed and marketed i n produc ing areas i s n o t i n t h e rea lm o f f i n a n c i a l f e a s i b i l i t y .
Th i r d , because t h e urban poor a re l i k e l y t o be d i s p r o p o r t i o n a t e l y a f f e c t e d by changes i n y e l l ow maize impor ts , s t r i c t adherence t o impor t p a r i t y p r i c i n g f o r y e l l o w maize food a i d sa les t o Maputo a re n o t n e c e s s a r i l y j u s t i f i e d . The ga ins t o t h e government f rom h ighe r sa les p r i c e s o f y e l l o w maize and t h e p o s i t i v e , bu t a rguab ly smal l ga i ns t o producers o f w h i t e maize i n southern r eg ions supp ly ing Maputo must be weighed aga ins t t h e e f f e c t s o f h i ghe r consumer p r i c e s o f y e l l o w maize i n Maputo and s u b s t a n t i a l dec l i nes i n r e a l incomes o f t h e Maputo poor.
The above b e n e f i t s o f supp ly ing y e l l o w maize food a i d t o Maputo do n o t n e c e s s a r i l y app l y t o o t h e r urban cen te rs i n Mozambique and almost c e r t a i n l y do n o t app ly t o r u r a l areas i n post-war Mozambique i n years o f normal harvest . Demand c h a r a c t e r i s t i c s o f non-Maputo households a re n o t n e c e s s a r i l y t h e same as those i n Maputo. I n i s o l a t e d markets, impacts o f s u b s t i t u t i o n e f f e c t s on p r i c e s may be l a r g e r as f l ows o f w h i t e maize and o t h e r commodit ies f rom ou t s i de t h e r e g i o n a re l i m i t e d . Addressing these is-sues f u l l y would r e q u i r e da ta on r u r a l household incomes and expend i tu re pa t t e rns , as we1 1 as i n f o r m a t i o n on market f l o w s o f commodit ies, a h i g h p r i o r i t y f o r f u r t h e r da ta c o l l e c t i o n e f f o r t s .
I n sum, we have a c l e a r case i n Mozambique o f food a i d be ing an app rop r i a t e i ns t r umen t f o r pove r t y a l l e v i a t i o n i n t h e c a p i t a l c i t y , Maputo. The convent iona l wisdom o f reduc ing ye1 low maize impor ts and ma in ta i n i ng commercial food a i d sa les a t impo r t p a r i t y should be re-examined i n l i g h t o f t h e r e s u l t s o f t h i s paper.
APPENDIX 1 : EQUATIONS OF THE MOZAMBIQUE MULTI-MARKET MODEL
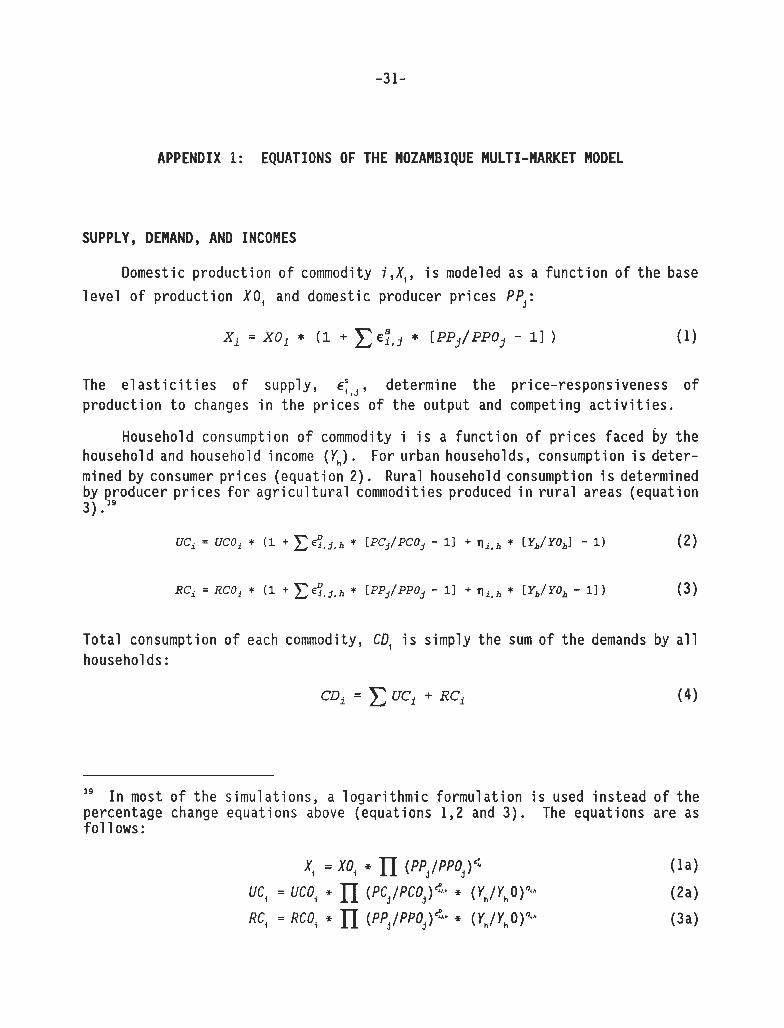
SUPPLY, DEMAND, AND INCOMES
Domestic product ion o f commodity i,X,, i s modeled as a func t i on o f t he base
l e v e l o f p roduct ion XO, and domestic producer p r i ces PP,:
The e l a s t i c i t i e s o f supply, E;,~, determine the p r i ce-responsi veness o f product ion t o changes i n the p r i ces o f the output and competing a c t i v i t i e s .
Household consumption o f commodity i i s a func t i on o f p r i ces faced by the household and household income (Y,) . For urban households, consumption i s deter- mined by consumer p r i c e s (equat ion 2). Rural household consumption i s determined by producer p r i c e s f o r a g r i c u l t u r a l commodities produced i n r u r a l areas (equation 3 ) . l9
Tota l consumption o f each commodity, CD, i s simply the sum o f t he demands by a l l households:
l9 I n most o f the s imulat ions, a l oga r i t hm ic fo rmula t ion i s used ins tead o f the percentage change equations above (equations 1,2 and 3) . The equations are as fo l lows:
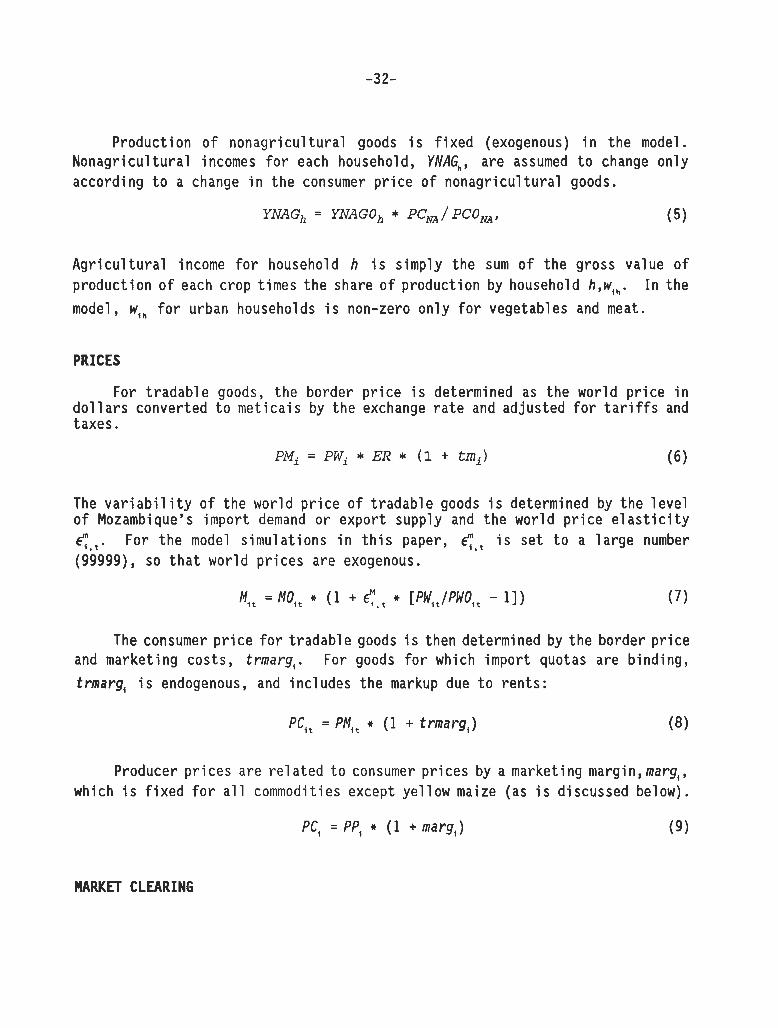
Product ion o f nonagr icu l t u r a l goods i s f i x e d (exogenous) i n t he model . Nonagr icu l tu ra l incomes f o r each household, YNAG,, are assumed t o change on ly according t o a change i n the consumer p r i c e o f nonagricul t u r a l goods.
A g r i c u l t u r a l income f o r household h i s simply the sum o f the gross value o f p roduct ion o f each crop times the share o f product ion by household h,w,,. I n the
model, w,, f o r urban households i s non-zero on l y f o r vegetables and meat.
PRICES
For t radab le goods, the border p r i c e i s determined as the wor ld p r i c e i n d o l l a r s converted t o me t i ca i s by the exchange r a t e and adjusted f o r t a r i f f s and taxes.
The v a r i a b i l i t y o f t he wor ld p r i c e o f t radab le goods i s determined by the l e v e l o f Mozambique's import demand o r expor t supply and the wor ld p r i c e e l a s t i c i t y
. For the model s imulat ions i n t h i s paper, <,, i s se t t o a l a r g e number (99999), so t h a t wor ld p r i c e s are exogenous.
The consumer p r i c e f o r t radab le goods i s then determined by the border p r i c e and market ing costs, trmarg,. For goods f o r which import quotas are binding,
trmarg, i s endogenous, and inc ludes the markup due t o ren ts :
PC,, = PM,, * (1 + trmarg,) (8)
Producer p r i c e s are re1 ated t o consumer p r i ces by a market ing margin, marg, , which i s f i x e d f o r a l l commodities except ye l low maize (as i s discussed below).
PC, = PP, + (1 + marg,) (9)
MARKET CLEARING
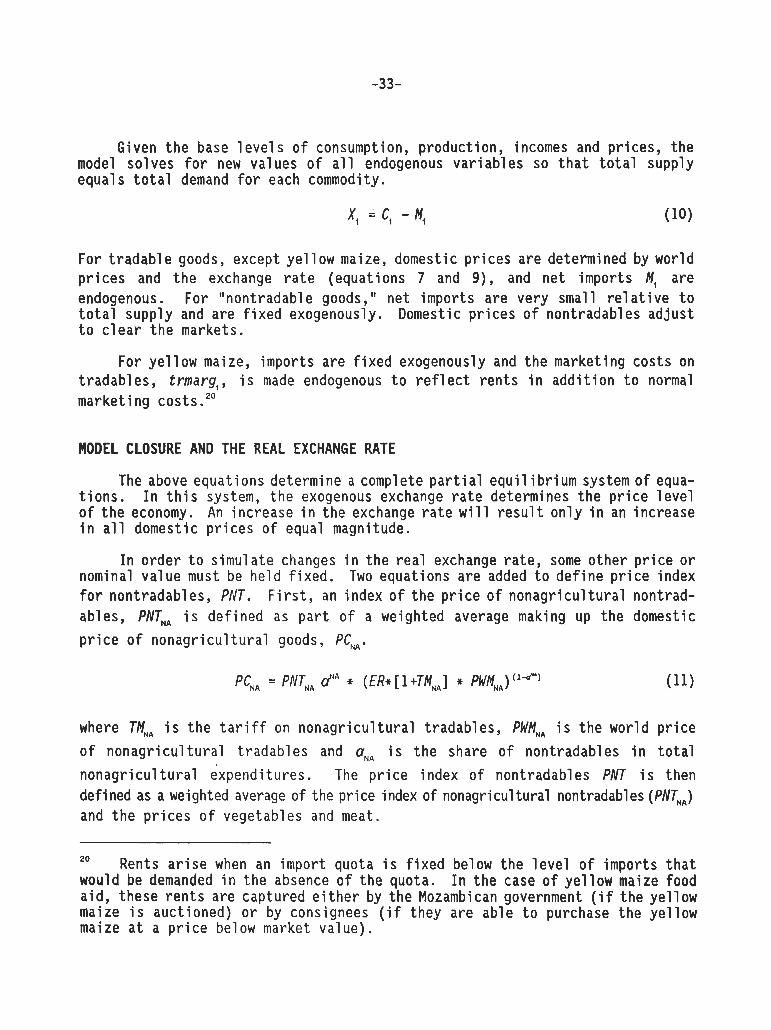
Given the base l e v e l s o f consumption, product ion, incomes and pr ices , the model so lves f o r new values o f a l l endogenous var iab les so t h a t t o t a l supply equals t o t a l demand f o r each commodity.
For t radab le goods, except ye1 1 ow maize, domestic p r i ces are determined by world p r i c e s and t h e exchange r a t e (equations 7 and 9), and ne t imports M, are endogenous. For "nontradable goods," ne t imports are very small r e l a t i v e t o t o t a l supply and are f i x e d exogenously. Domestic p r i c e s o f nontradabl es adjust t o c l e a r t h e markets.
For ye l l ow maize, imports are f i x e d exogenously and t h e market ing costs on t radables, trmarg,, i s made endogenous t o r e f l e c t r e n t s i n add i t i on t o normal market ing costs.20
MODEL CLOSURE AND THE REAL EXCHANGE RATE
The above equations determine a complete p a r t i a l equi 1 i b r i um system o f equa- t i ons . I n t h i s system, the exogenous exchange r a t e determines t h e p r i c e l e v e l o f t he economy. An increase i n the exchange r a t e w i l l r e s u l t on ly i n an increase i n a l l domestic p r i c e s o f equal magnitude.
I n o rder t o s imulate changes i n t he r e a l exchange ra te , some o ther p r i c e o r nominal va lue must be he ld f i xed . Two equations are added t o de f i ne p r i c e index f o r nontradables, PNT. F i r s t , an index o f the p r i c e o f nonagricul t u r a l nontrad-
ables, PNT,,, i s def ined as p a r t o f a weighted average making up the domestic
p r i c e o f nonagr icu l t u r a l goods, PC,,.
PC,, = PNT,, #A * (ER* [ I +TM,,] * P Y A ) (l-')
where TM,, i s t h e t a r i f f on nonagr i cu l t u ra l t radables, PWM,, i s t he wor ld p r i c e
o f nonagr i cu l t u ra l t radables and a,, i s t he share o f nontradables i n t o t a l
nonagr icu l t u r a l expenditures. The p r i c e index o f nontradables PNT i s then defined as a weighted average o f the pr ice index o f nonagricul t u ra l nontradables (PNT,,) and t h e p r i c e s o f vegetables and meat.
20 Rents a r i s e when an import quota i s f i x e d below the l e v e l o f imports t h a t would be demanded i n the absence o f the quota. I n the case o f ye l low maize food a id, these r e n t s are captured e i t h e r by the Mozambican government ( i f the ye1 1 ow maize i s auct ioned) o r by consignees ( i f they are able t o purchase the ye l low maize a t a p r i c e below market value).
PNT = P N T ~ ~ * PCw (1 -r-m ( -9s ) * PC(,,,)
By f i x i n g t h e domestic p r i c e o f nontradables, PNT, a change i n the nominal exchange r a t e r e s u l t s i n a change i n the r e a l exchange r a t e o f t he same propor t ion .
F i n a l l y , an equat ion i s added t h a t determines the 1 eve1 o f t he r e a l exchange r a t e g iven a change i n f o r e i g n savings and a f i x e d p r i c e o f nontradables.
ER =,FRO + CHFSAV + ( 1 - / 3 ) / (X * - PmM [ l + c ] ) (13)
where t h e change i n f o r e i g n savings (CHFSAV) i s equal t o t he change i n the t rade balance (PmM - X) . P i s the income e l a s t i c i t y o f demand f o r imports, ex i s the
expor t supply e l a s t i c i t y and $' i s the import p r i c e e l a s t i c i t y o f demand (Dorosh and Bernier , 1993).
APPENDIX 2: BASE DATA AND MODEL PARAMETERS
HOUSEHOLD EXPENDITURES AND INCOMES
Base da ta f o r expendi tures o f urban households d e r i v e d i r e c t l y f rom the 1991-92 FSC/CFNPP household survey o f Maputo as t h e product o f pe r c a p i t a values and quant i t i esZ1 and an assumed popul a t i on o f 1.5 m i 11 ion . A pover ty 1 i ne o f 31,904 M e t i c a i s p e r cap i t a , ( de l Ninno and Sahn, l993) , i s used t o d i s t i n g u i s h between r i c h and poor households. I n c o n s t r u c t i n g t h e base da ta f o r t h e m u l t i - market model, we used average p r i c e s f o r a l l Maputo r a t h e r than household s p e c i f i c p r i c e s f o r r i c h and poor households.
Q u a n t i t i e s consumed by r u r a l households a re cons iderab ly l e s s c e r t a i n . Consumption o f w h i t e maize and r i c e a re based on est imates f o r r u r a l p roduc t ion l e s s market ings (assumed t o be zero f o r wh i t e maize). Per c a p i t a r u r a l consumption o f wheat p roduc ts and y e l l o w maize i s assumed t o equal t h a t f o r t h e urban poor. Nonfood expendi tures a re est imated as 25 percent o f t o t a l expendi tures. Other food, bo th vegetabl es ( i n c l u d i ng pu l ses and r o o t s ) and meat, a re t h e r e s i d u a l i tem, w i t h t h e share o f meat i n o the r food equal t o i t s share f o r t h e urban poor (25 pe rcen t ) . I n general , r u r a l consumpti on i s valued a t t he
22 producer p r i c e . Rural incomes a re est imated as t h e va lue o f own-production o f food, p roduc t i on o f expor t crops (main ly cashew, bu t small amounts o f co t t on and copra) , and nonagr icu l t u r a l incomes ' (assumed t o equal 30 percent o f t o t a l incomes). Rural sav ings a re assumed t o be zero.
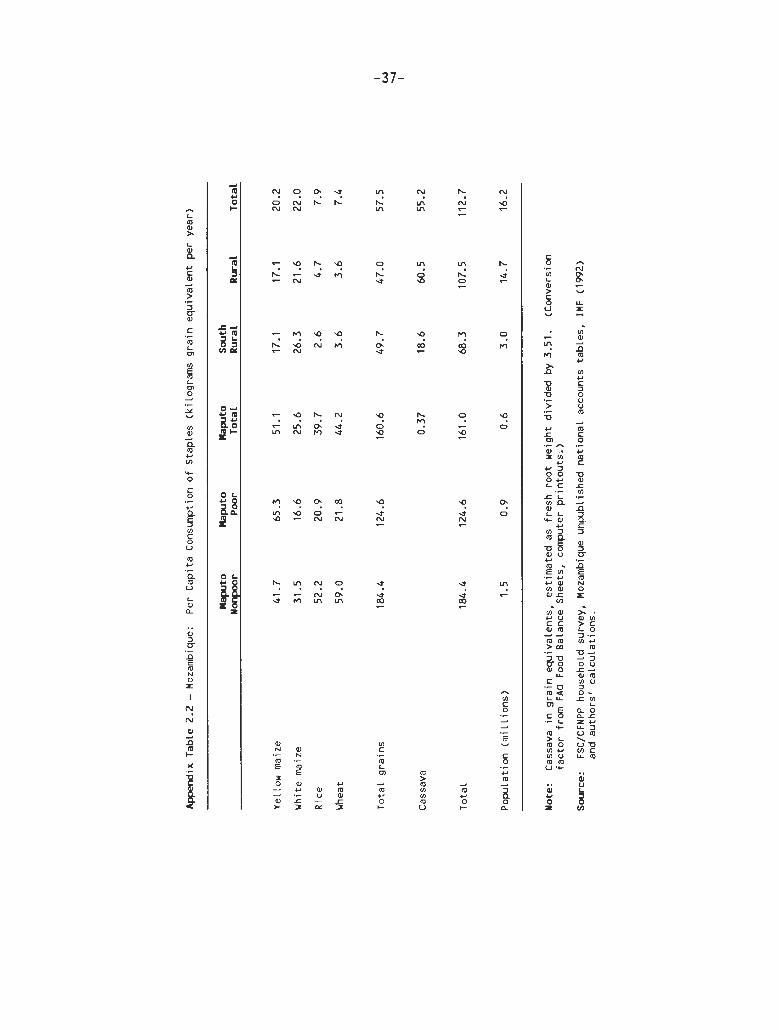
The r e s u l t i n g household expendi ture shares a re g iven i n Appendix Table 2.1. Incomes o f r u r a l households a re est imated a t 51,400 m e t i c a i s pe r person, l e s s than 20 percen t o f p e r c a p i t a incomes o f t h e urban poor i n t h e Maputo survey. The very low f i g u r e f o r t h e r u r a l poor i s i n p a r t exp la ined by t h e lower food p r i c e s i n r u r a l , areas (which determine t h e va lue o f food consumed from own- p roduc t ion , a major source o f imputed incomes). As shown i n Appendix Table 2.2, t he es t imated p e r c a p i t a consumption o f major g r a i n s tap les and cassava i n r u r a l areas i s over ha1 f t h a t o f t h e urban poor. Consumption o f groundnuts and beans, major crops (a long w i t h w h i t e maize) i n t h e farming systems o f t he reg ion , 1 i k e l y accounts f o r a s i g n i f i c a n t share o f c a l o r i e s f o r r u r a l households t o compensate f o r t h e low g r a i n consumption. Nonetheless, even though t h e est imates o f t he va lue o f expend i tu res may ove rs ta te t h e gap i n incomes between r u r a l and urban households, t h e r e i s near un i ve rsa l agreement t h a t i n f a c t r u r a l households a re
2 1 Q u a n t i t i e s consumed o f f l o u r , bread and pas ta a re conver ted t o g r a i n equi va l en ts . 22 Rural consumption o f impor ted goods i s va lued a t t h e urban (c. i . f. ) p r i c e p l u s a 100 percen t marke t ing margin.
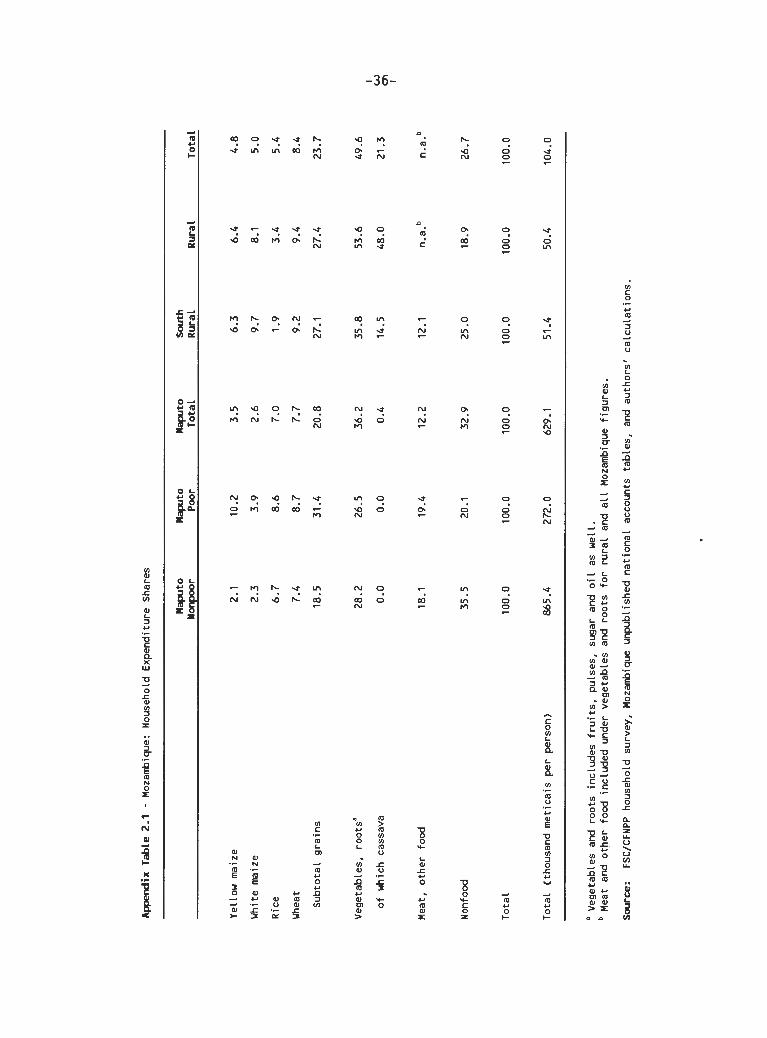
considerably poorer than their urban countervalues, a fact reflected in the expenditure estimates.
COMMODITY FLOWS
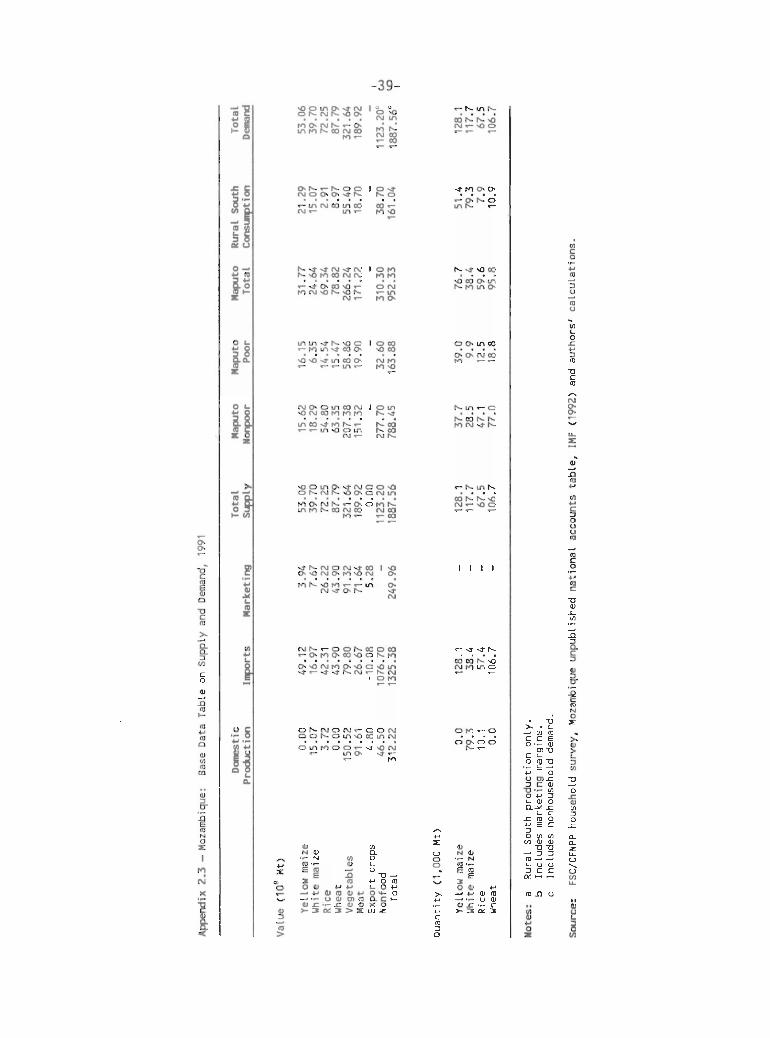
Production, trade, and total consumption of each commodity are given in Appendix Table 2.3. Production data are Ministry of Agriculture estimates; producer prices are from unpubl i shed national accounts worksheets from the Ministry of Plan.23 Import data for grains are taken from unpublished Ministry of Commerce data on import arrivals by port. The value of imports of other food is estimated to be 0.3 times the value of grain imports.
MODEL PARAMETERS
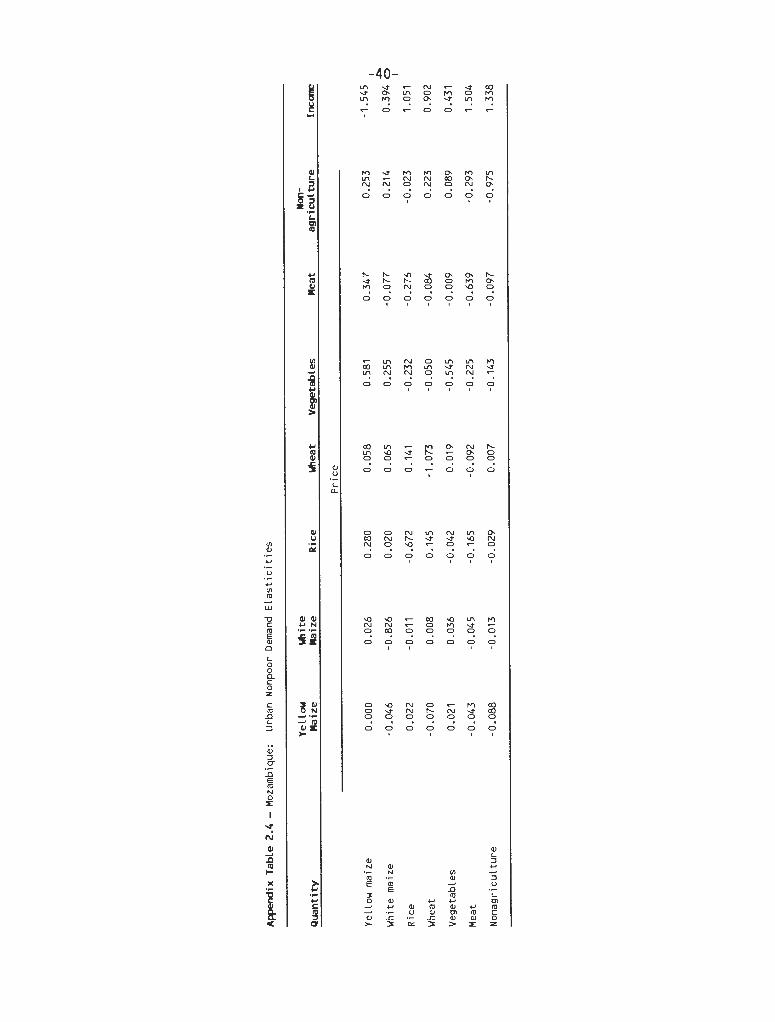
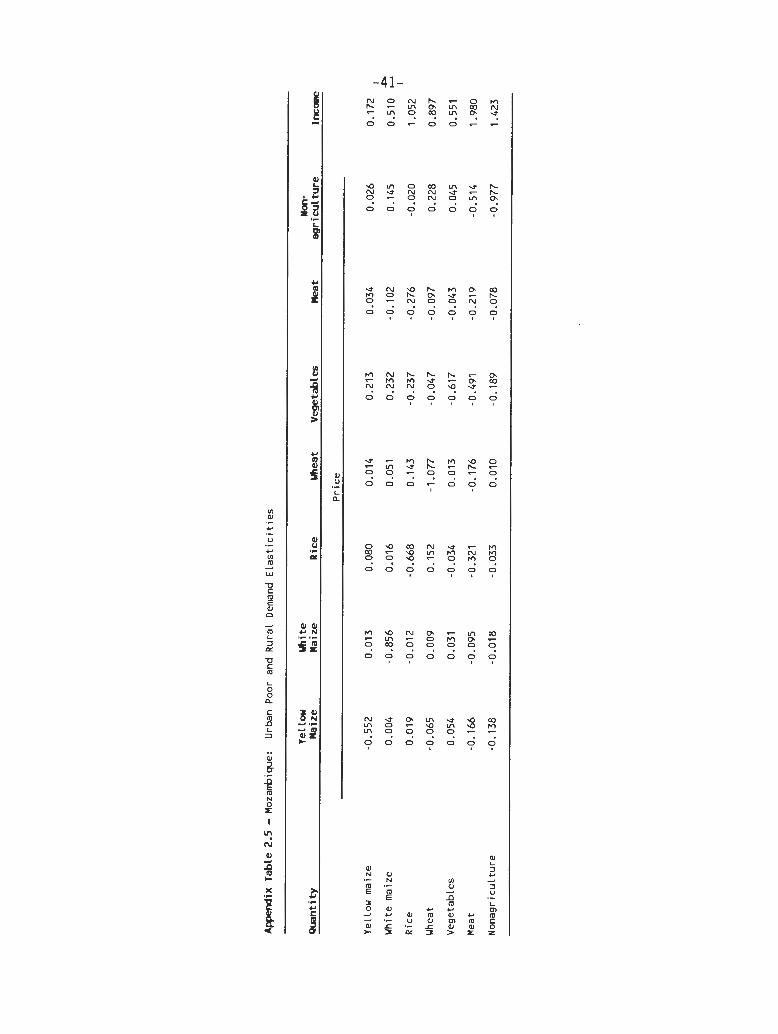
Three major sets of parameters influence the behavior of the model : own- and cross- price elasticities of demand, income elasticities of demand and supply el astici ties. The urban demand parameters derive from econometric estimates described in Section 4. Rural demand parameters are equal to those for the urban poor, except for the expenditure elasticity of nonfood which is calculated using the expenditure elasticities for the other food commodities and the estimated budget shares for the rural poor, in accordance with Engel 's Law (Appendix Tables 2.4 and 2.5).24
Due to a paucity of data on supply response in Mozambique agriculture, the matrix of supply elasticities is mainly based on data from other countries and restrictions from economic theory. For white maize, the own-price elasticity of supply is estimated to be 0.2. Own-price elasticities of supply of other commodities are chosen to be low in accordance with estimates for other countries (Rao 1989). Own-price elasticities of supply for rice, export crops, and other agriculture are assumed to be 0.25, 0.40, and 0.20, respectively. Cross-price elasticities were chosen so as to respect symmetry of cross-price effects and zero-homogeneity in all prices. The matrix of supply elasticities is shown in Appendix Table 2.6.
23 The exception is cassava, for which the average Nampula price (115 Mt/kg) rather than the official price (225 Mt/kg) as in the national accounts was used to value production of the family sector.
24 The expenditure elasticity of demand for non-foods by rural households is thus 1.602, compared to 1.423 for the urban poor.
REFERENCES
Alderman, Haro ld , David E. Sahn, and Jehan A ru l pragasam. 1991. "Food Subs id ies and Exchange Rate D i s t o r t i o n s i n Mozambique." Food Policy. October.
Braverman, Av i shay, and J e f f r e y S. Hammer. 1986. "Mu1 t imarket Ana lys i s o f A g r i c u l t u r a l P r i c i n g P o l i c i e s i n Senegal." I n Agricultural Household Models: Extensions, Applications, and Policy. Ed i t ed by I n d e r j i t Singh, Lyn Squ i re , and John St rauss. Ba l t imore , MD. : Johns Hopkins U n i v e r s i t y Press.
Deaton, Angus, and John Muel l bauer. 1990. "An Almost I d e a l Demand System." American Economic Review. 70: 312-326.
d e l Ninno, Car lo , and David E. Sahn. 1993. "The Determinants o f Pover ty and Income D i s t r i b u t i o n i n Mozambique." Washington, DC: CFNPP. Photocopy.
Dorosh, Paul , and Ren6 Be rn i e r . 1993. " A g r i c u l t u r a l and Food P o l i c y Issues i n Mozambique: A Mu1 t i -Ma rke t Ana lys is . " Washington, DC: CFNPP. Photocopy.
Green, Rechard, and J u l i an A1 s ton. 1990. " E l a s t i c i t i e s i n AIDS Models." American Journal of Agricultural Economics: 442-445.
Fos te r , J., Joe l Greer, and E r i k Thorbecke. 1984. "A Class o f Decomposable Pover ty Measures." Econometrica. 52(3): 761-766.
Heien, D., and C . Wessels. 1990. "Demand Systems Es t ima t i on w i t h Microdata: A Censored Regression Approach." Journal of Business and Economic Statistics. 8(3 ) : 365-371.
I n t e r n a t i o n a l Monetary Fund. 1992. Republic of Mozambique - Statistical Annex. Washington, DC: IMF.
Osmani, S. 1982. Economic Inegua7ity and Group We7fare. New York: Oxford U n i v e r s i t y Press.
R a v a l l i o n , Ma r t i n . 1993. "Pover ty Comparisons." Washington, DC: The World Bank. D r a f t .
Rava l l i on , Ma r t i n , and Benin B idan i . 1992. "How Robust i s a Pover ty P r o f i l e . " Washington, DC: The World Bank. Photocopy.
Sahn, Dav id E., and J a i k i s h a n Desai . 1993. "The Emergence o f P a r a l l e l Markets i n a T r a n s i t i o n Economy: The Case o f Mozambique." Washington, DC: CFNPP. Photocopy.