Embed Size (px)
Citation preview

www.harriswilliams.com
Member FINRA/SIPC
Food & Beverage Industry Update
8/26/2011

Boston
Phone: +1 (617) 482-7501
Fax: +1 (617) 482-7503
Cleveland
Phone: +1 (216) 222-9870
Fax: +1 (216) 222-0158
London
Phone: +44 203 170 8838
Fax: +44 207 681 1907
Minneapolis
Phone: +1 (612) 359-2700
Fax: +1 (612) 359-2701
Philadelphia
Phone: +1 (267) 675-5900
Fax: +1 (267) 675-5901
Richmond
Phone: +1 (804) 648-0072
Fax: +1 (804) 648-0073
San Francisco
Phone: +1 (415) 288-4260
Fax: +1 (415) 288-4269
Announced Target Buyer1/0/1900 0 0
8/22/2011 Pearson's Candy Company Brynwood Partners
8/17/2011 Mary of Puddin Hill, Inc. Legends Food Corporation
8/15/2011 Dean Foods Company, Dairy-Processing OpenGate Capital
8/12/2011 Clearwater Seafoods Income Fund Cooke Aquaculture, Inc.
8/12/2011 The C.F. Sauer Company Inc., Margarine Assets Bunge North America, Inc.
8/10/2011 TRAC Microbiology Inc. Covance Inc.
8/9/2011 George Greer Co., Inc. Snyder's-Lance, Inc.
8/9/2011 Sara Lee Corp., Dough Business Ralcorp Holdings Inc.
8/8/2011 MD Drinks, Inc. Sunsweet Growers, Inc.
8/8/2011 Progressive Holdings, LLC Xylitol Canada Inc.
Food & Beverage
Industry Update
8/26/2011
Net Debt /
Industry Segment 3 Month 1 Year 3 Month 1 Year Fwd PE LTM PE EV/EBITDA EBITDA
Food and Beverage
Branded Processed Foods (9.7%) 13.1% 6.8% (4.8%) 14.8x 16.2x 10.1x 1.7x
Private Label Foods (13.7%) 7.3% 3.1% (16.0%) 17.0x 20.9x 9.7x 2.6x
Natural / Organic Foods (14.1%) 39.4% 11.8% (4.7%) 20.0x 28.3x 12.1x 1.8x
Baked Goods / Snack Foods (9.3%) 8.0% (8.8%) 12.2% 17.0x 17.9x 8.0x 2.2x
Dairy (11.9%) 20.8% (6.8%) 1.7% 14.7x 14.6x 9.7x 1.6x
Non-Alcholic Beverages (5.5%) 17.2% 0.4% 22.4% 16.3x 16.5x 11.9x 1.1x
Alcoholic Beverages (8.5%) 7.8% (8.2%) (6.4%) 13.5x 15.9x 9.8x 2.3x
Inputs
Protein Processing (8.2%) (0.6%) (4.2%) (2.5%) 10.4x 7.3x 5.3x 1.5x
Fruit and Vegetable (24.5%) (7.9%) (17.5%) (14.9%) 9.3x 13.9x 6.4x 2.8x
Ingredients / Flavors (15.2%) 15.6% (9.3%) (4.3%) 12.7x 14.7x 9.5x 1.8x
Agribusiness (12.6%) 15.4% (18.7%) (24.1%) 9.4x 11.2x 7.2x 2.0x
Consumer
Food Retail (12.8%) (5.4%) (10.2%) (6.7%) 12.1x 13.7x 5.5x 1.8x
Foodservice / Distribution (14.4%) 0.7% (11.6%) (5.7%) 12.4x 17.3x 7.9x 1.3x
Fast Food (10.3%) 14.2% (9.3%) 14.1% 15.3x 17.1x 9.3x 2.5x
Casual Dining (14.3%) 12.8% (13.3%) (0.4%) 14.3x 14.7x 7.2x 0.8x
Overall Median* (11.3%) 8.0% (7.0%) (4.7%) 14.0x 15.8x 8.3x 1.9x
*Fast Food and Casual Dining excluded from overall median calculation.
Stock Price % Change EV/EBITDA % Change Current Valuation Stats
Quarterly M&A ActivityLast 10 Deals Announced
LTM Deal Statistics
Key Trading
Statistics1
Announced
Food and
Beverage
M&A1
Contacts
For more information regarding our food and beverage experience, please contact Glenn Gurtcheff, Tim Alexander, Jeff
Cleveland, or Ryan Budlong at +1 (612) 359-2700 or *[email protected].
Aggregate Number Transaction Multiples
Value ($bn) of Deals EV / Revenue EV / EBITDA
$17.9 183 1.00x 8.3x
43
58 58
49
5557
46 47 47 48 47
35
25
36
22
3436
46 47
25
33
49
27
2
11
5
9
1211
15
8 73
6
5
5
2
3
4
7
57
13
6
7
5
0
10
20
30
40
50
60
70
80
Q1
06
Q2
06
Q3
06
Q4
06
Q1
07
Q2
07
Q3
07
Q4
07
Q1
08
Q2
08
Q3
08
Q4
08
Q1
09
Q2
09
Q3
09
Q4
09
Q1
10
Q2
10
Q3
10
Q4
10
Q1
11
Q2
11
Q3
11
Nu
mb
er o
f T
ra
nsa
cti
on
s__
PEG Acquirer Strategic AcquirerNote: Transaction statistics based on publically available information.
2 of 13
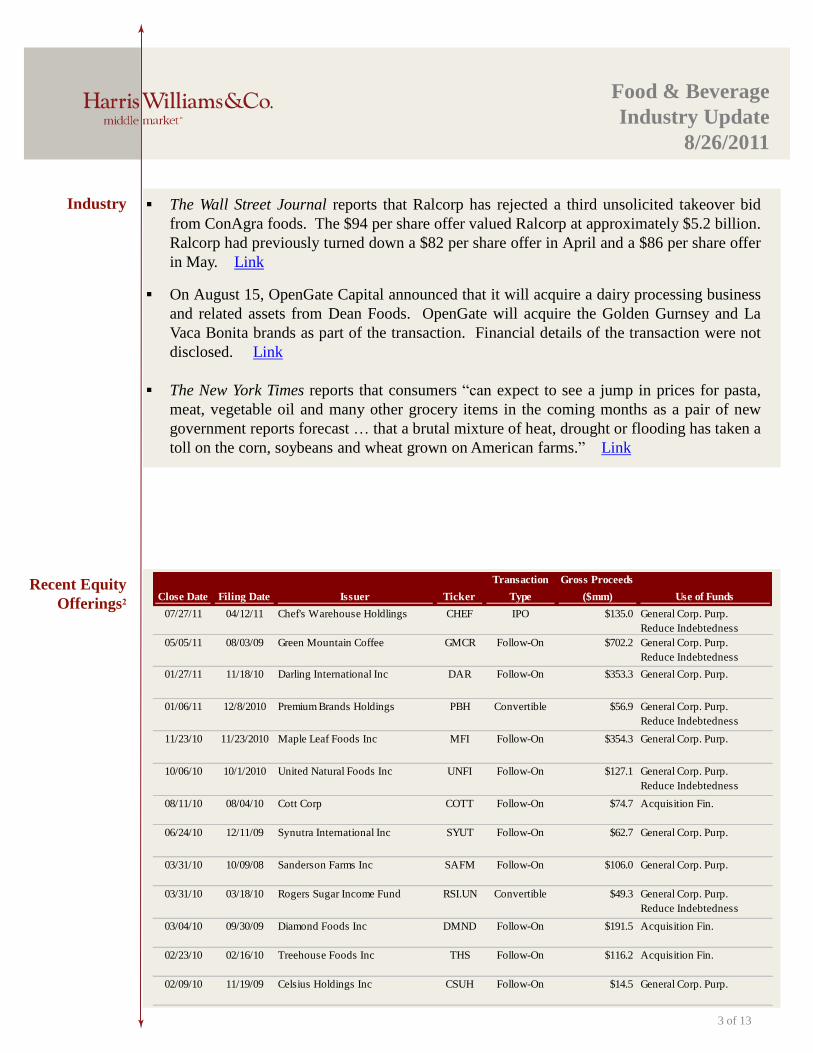
The Wall Street Journal reports that Ralcorp has rejected a third unsolicited takeover bid
from ConAgra foods. The $94 per share offer valued Ralcorp at approximately $5.2 billion.
Ralcorp had previously turned down a $82 per share offer in April and a $86 per share offer
in May. Link
On August 15, OpenGate Capital announced that it will acquire a dairy processing business
and related assets from Dean Foods. OpenGate will acquire the Golden Gurnsey and La
Vaca Bonita brands as part of the transaction. Financial details of the transaction were not
disclosed. Link
The New York Times reports that consumers “can expect to see a jump in prices for pasta,
meat, vegetable oil and many other grocery items in the coming months as a pair of new
government reports forecast … that a brutal mixture of heat, drought or flooding has taken a
toll on the corn, soybeans and wheat grown on American farms.” Link
Industry
Recent Equity
Offerings2Close Date Filing Date Issuer Ticker
Transaction
Type
Gross Proceeds
($mm) Use of Funds
07/27/11 04/12/11 Chef's Warehouse Holdlings CHEF IPO $135.0 General Corp. Purp.
Reduce Indebtedness
05/05/11 08/03/09 Green Mountain Coffee GMCR Follow-On $702.2 General Corp. Purp.
Reduce Indebtedness
01/27/11 11/18/10 Darling International Inc DAR Follow-On $353.3 General Corp. Purp.
01/06/11 12/8/2010 Premium Brands Holdings PBH Convertible $56.9 General Corp. Purp.
Reduce Indebtedness
11/23/10 11/23/2010 Maple Leaf Foods Inc MFI Follow-On $354.3 General Corp. Purp.
10/06/10 10/1/2010 United Natural Foods Inc UNFI Follow-On $127.1 General Corp. Purp.
Reduce Indebtedness
08/11/10 08/04/10 Cott Corp COTT Follow-On $74.7 Acquisition Fin.
06/24/10 12/11/09 Synutra International Inc SYUT Follow-On $62.7 General Corp. Purp.
03/31/10 10/09/08 Sanderson Farms Inc SAFM Follow-On $106.0 General Corp. Purp.
03/31/10 03/18/10 Rogers Sugar Income Fund RSI.UN Convertible $49.3 General Corp. Purp.
Reduce Indebtedness
03/04/10 09/30/09 Diamond Foods Inc DMND Follow-On $191.5 Acquisition Fin.
02/23/10 02/16/10 Treehouse Foods Inc THS Follow-On $116.2 Acquisition Fin.
02/09/10 11/19/09 Celsius Holdings Inc CSUH Follow-On $14.5 General Corp. Purp.
3 of 13
Food & Beverage
Industry Update
8/26/2011

Quarterly Loan Volume Average Spread on Food and Beverage Loans
Credit Statistics* Average Secondary Spreads
$0
$2
$4
$6
$8
$10
$12
2Q05 4Q05 2Q06 4Q06 2Q07 4Q07 2Q08 4Q08 2Q09 4Q09 2Q10 4Q10 2Q11
Lo
an
Vo
lum
e b
y Q
ua
rte
r (
$ i
n b
illi
on
s)_
__
Pro Rata Institutional
L + 0
L + 100
L + 200
L + 300
L + 400
L + 500
2005 2006 2007 2008 2009 2010 1H11
Av
era
ge S
prea
d O
ver L
IBO
R_
_
Revolving Credit / Term Loan A Weighted-Average Institutional
0.0x
2.0x
4.0x
6.0x
Debt/EBITDA Senior
Debt/EBITDA
EBITDA/Cash
Interest
EBITDA -
Capex/Cash
Interest
EB
ITD
A M
ult
iple
2005 2006 2007 2008 2009 2010 2011
Food and
Beverage Loan
Activity3
Recent Debt
Offerings4
L + 0
L + 200
L + 400
L + 600
L + 800
L + 1000A
vera
ge S
prea
d O
ver L
IBO
R
Date Effective Borrower Name Description Tranche Amount Type Rating Spread
07/29/11 DeLong Co Inc Grain and field beans $200,000,000 Revolver/Line >= 1 Yr. NR / NR N/A
07/29/11 JM Smucker Canned fruits and vegetables 1,000,000,000 Revolver/Line >= 1 Yr. NR / NR 125
07/26/11 Helena Chemical Co Farm supplies 250,000,000 Revolver/Line >= 1 Yr. NR / NR 120
07/22/11 Gold Coast Beverage Beer and ale 200,000,000 Revolver/Line >= 1 Yr. NR / NR 115
07/20/11 Seneca Foods Corp Canned fruits and vegetables 350,000,000 Revolver/Line >= 1 Yr. NR / NR 150
07/10/11 Chiquita Brands International Fruits and tree nuts 330,000,000 Term Loan B- / Caa1 300
07/10/11 Chiquita Brands International Fruits and tree nuts 150,000,000 Revolver/Line >= 1 Yr. B- / Caa1 275
07/08/11 Dole Food Co Inc Canned fruits and vegetables 315,000,000 Term Loan B B- / B3 375
07/08/11 Dole Food Co Inc Canned fruits and vegetables 585,000,000 Term Loan C B- / B3 375
07/08/11 Dole Food Co Inc Canned fruits and vegetables 350,000,000 Revolver/Line >= 1 Yr. B- / B3 200
07/08/11 Golden State Foods Sausages and other prepared meats 135,000,000 Revolver/Line >= 1 Yr. NR / NR 200
07/08/11 Golden State Foods Sausages and other prepared meats 160,000,000 Term Loan A NR / NR 200
07/08/11 Golden State Foods Sausages and other prepared meats 40,000,000 Delay Draw Term Loan NR / NR 200
07/08/11 Kehe Food Distributors Inc Groceries and related products 300,000,000 Revolver/Line >= 1 Yr. NR / NR 225
07/07/11 Columbus Acquisitions Corp Potato chips and similar snacks 15,000,000 Revolver/Line >= 1 Yr. NR / NR 375
07/07/11 Columbus Acquisitions Corp Potato chips and similar snacks 57,000,000 Term Loan A NR / NR 375
07/07/11 Mercon Coffee Corp Groceries and related products 240,000,000 Revolver/Line >= 1 Yr. NR / NR 288
4 of 13
Food & Beverage
Industry Update
8/26/2011
*2011 data not available for EBITDA – Capex/Cash Interest

Price at As a % of Market Cash & Enterprise P/E
($ in millions, except per share data) Ticker 8/19/11 52-wk High Cap Debt Equiv. Value (EV) Revenue EBITDA 1 Year 3 Years Gross EBITDA Multiple Revenue EBITDA Revenue EBITDA
Food and Beverage
Branded Processed Foods
Campbell Soup Co. CPB $30.03 79.9% $9,640 $3,105 $449 $12,296 $7,630 $1,566 (0.7%) (0.7%) 40.3% 20.5% 12.4x 1.61x 7.9x 1.58x 8.2x
ConAgra Foods, Inc. CAG 23.28 87.5% 9,652 3,246 972 11,925 12,303 1,714 2.4% 3.0% 23.9% 13.9% 12.3x 0.97x 7.0x 0.93x 7.2x
Delattre Levivier Maroc S.A. DLM 69.96 81.0% 44 25 2 67 67 2 (0.5%) 33.3% 41.4% 3.4% NA 1.00x 29.4x NA NA
General Mills, Inc. GIS 35.81 89.5% 23,155 6,907 620 29,442 14,880 3,234 1.7% 2.9% 40.0% 21.7% 13.3x 1.98x 9.1x 1.79x 8.7x
Hershey Co. HSY 55.12 92.7% 12,536 1,851 790 13,596 5,919 1,247 7.0% 5.7% 42.6% 21.1% 20.9x 2.30x 10.9x 2.19x 10.2x
H. J. Heinz Company HNZ 51.85 94.3% 16,684 4,752 763 20,673 10,707 1,947 2.0% 2.7% 36.9% 18.2% 16.9x 1.93x 10.6x 1.76x 9.7x
Hormel Foods Corp. HRL 27.70 90.8% 7,402 600 965 7,037 7,674 848 14.9% 6.2% 17.5% 11.1% 16.2x 0.92x 8.3x 0.88x 8.6x
Kellogg Company K 52.26 90.6% 18,918 6,055 457 24,516 12,888 2,459 2.6% 1.3% 42.4% 19.1% 15.7x 1.90x 10.0x 1.80x 10.0x
Kraft Foods Inc. KFT 33.45 92.1% 59,076 29,654 2,350 86,380 52,087 8,407 19.6% 9.4% 35.8% 16.1% 19.1x 1.66x 10.3x 1.55x 9.2x
McCormick & Co. Inc. MKC 44.29 86.4% 5,865 991 66 6,790 3,441 629 4.9% 3.9% 42.4% 18.3% 15.4x 1.97x 10.8x 1.79x 9.9x
Nestlé S.A. NESN 61.19 84.6% 189,203 21,513 18,471 192,246 111,969 17,889 23.3% 10.2% 57.2% 16.0% 18.5x 1.72x 10.7x NA NA
Sara Lee Corp. SLE 17.25 85.1% 10,093 3,001 2,134 10,960 8,681 1,196 (19.6%) (7.4%) 32.4% 13.8% 31.9x 1.26x 9.2x 1.27x 8.8x
The Hain Celestial Group, Inc. HAIN 28.82 77.4% 1,252 237 26 1,464 1,061 120 11.3% 2.0% 27.9% 11.4% 25.8x 1.38x 12.2x 1.24x 10.6x
The J. M. Smucker Company SJM 67.82 84.5% 7,757 1,625 102 9,280 4,967 1,113 8.0% 23.7% 37.8% 22.4% 16.2x 1.87x 8.3x 1.65x 8.1x
Mean 5.5% 6.9% 37.0% 16.2% 18.0x 1.60x 11.0x 1.53x 9.1x
Median 3.8% 3.5% 38.9% 17.2% 16.2x 1.69x 10.1x 1.62x 9.0x
Private Label Foods
Flowers Foods, Inc. FLO $18.30 79.1% $2,496 $122 $9 $2,610 $2,754 $295 6.7% 8.3% 48.0% 10.7% 19.0x 0.95x 8.8x 0.89x 8.1x
Grupo Bimbo, S.A.B. de C.V. BIMBO A 1.95 84.0% 9,189 3,164 779 11,573 10,182 1,222 12.3% 11.1% 52.0% 12.0% 22.0x 1.14x 9.5x 0.98x 7.9x
Snyder's-Lance, Inc. LNCE 19.87 81.9% 1,344 261 11 1,594 1,324 113 43.4% 18.5% 36.6% 8.5% NM 1.20x 14.1x 1.00x 9.3x
Ralcorp Holdings Inc. RAH 81.62 89.3% 4,500 2,358 58 6,800 4,647 789 19.1% 22.0% 26.8% 17.0% 20.2x 1.46x 8.6x 1.37x 7.8x
Seneca Foods Corp. SENE.B 20.78 69.8% 242 211 9 444 1,234 35 (2.8%) 3.6% 6.0% 2.9% NM 0.36x 12.5x 0.34x 7.1x
Treehouse Foods, Inc. THS 51.10 82.9% 1,833 942 2 2,772 1,960 278 20.5% 12.7% 24.2% 14.2% 21.6x 1.41x 10.0x 1.29x 8.6x
Mean 16.5% 12.7% 32.3% 10.9% 20.7x 1.09x 10.6x 0.98x 8.2x
Median 15.7% 11.9% 31.7% 11.4% 20.9x 1.17x 9.7x 0.99x 8.0x
Natural / Organic Foods
Hansen Natural Corporation HANS $79.51 94.7% $7,045 $1 $699 $6,346 $1,519 $422 26.3% 15.4% 52.2% 27.8% 29.1x 4.18x 15.0x 3.59x 12.8x
SunOpta Inc. TSX:SOY 4.72 51.8% 310 168 6 473 1,000 57 16.0% 2.3% 14.1% 5.7% 28.3x 0.47x 8.3x 0.43x 6.6x
The Hain Celestial Group, Inc. HAIN 28.82 77.4% 1,252 237 26 1,464 1,061 120 11.3% 2.0% 27.9% 11.4% 25.8x 1.38x 12.2x 1.24x 10.6x
United Natural Foods, Inc. UNFI 36.88 80.1% 1,788 228 24 1,992 4,360 164 20.4% 11.3% 18.2% 3.8% 22.3x 0.46x 12.1x 0.40x 10.3x
Whole Foods Market, Inc. WFM 56.83 83.6% 10,069 18 537 9,551 9,851 823 12.7% 7.6% 35.0% 8.4% 30.8x 0.97x 11.6x 0.86x 10.3x
Mean 17.3% 7.7% 29.5% 11.4% 27.3x 1.49x 11.8x 1.30x 10.1x
Median 16.0% 7.6% 27.9% 8.4% 28.3x 0.97x 12.1x 0.86x 10.3x
Baked Goods / Snack Foods
ARYZTA AG YZA $45.47 80.8% $3,765 $2,115 $523 $5,358 $4,808 $564 14.1% 13.9% 27.8% 11.7% 10.4x 1.11x 9.5x NA NA
Associated British Foods plc ABF 16.88 85.2% 13,311 2,799 614 15,496 17,185 2,006 16.6% 5.9% 24.8% 11.7% 14.9x 0.90x 7.7x NA NA
Diamond Foods, Inc. DMND 71.68 90.3% 1,579 572 2 2,149 910 135 47.4% 19.7% 26.1% 14.8% 33.3x 2.36x 15.9x 1.57x 9.9x
Flowers Foods, Inc. FLO 18.30 79.1% 2,496 122 9 2,610 2,754 295 6.7% 8.3% 48.0% 10.7% 19.0x 0.95x 8.8x 0.89x 8.1x
George Weston Limited WN 66.23 76.1% 8,550 8,083 3,498 13,135 32,692 2,260 4.9% 4.1% 25.8% 6.9% 16.3x 0.40x 5.8x 0.40x 4.9x
Golden Enterprises Inc. GLDC 3.40 86.5% 40 6 0 45 131 8 2.0% 4.9% 47.2% 6.3% 13.1x 0.35x 5.5x NA NA
Grupo Bimbo, S.A.B. de C.V. BIMBO A 1.95 84.0% 9,189 3,164 779 11,573 10,182 1,222 12.3% 11.1% 52.0% 12.0% 22.0x 1.14x 9.5x 0.98x 7.9x
J&J Snack Foods Corp. JJSF 48.13 86.6% 899 1 105 794 725 108 6.8% 5.7% 31.7% 14.9% 16.3x 1.10x 7.4x 1.01x 7.0x
John B Sanfilippo & Son Inc. JBSS 7.03 46.3% 75 136 1 210 649 30 18.6% 6.4% 12.7% 4.7% 22.7x 0.32x 6.9x NA NA
Lancaster Colony Corporation LANC 54.40 84.1% 1,493 0 132 1,361 1,090 166 3.2% 3.6% 22.2% 15.3% 14.2x 1.25x 8.2x 1.19x 7.7x
Penford Corporation PENX 5.66 71.2% 64 69 0 133 295 18 12.5% (8.3%) 10.2% 6.0% NM 0.45x 7.5x 0.43x 4.3x
Ralcorp Holdings Inc. RAH 81.62 89.3% 4,500 2,358 58 6,800 4,647 789 19.1% 22.0% 26.8% 17.0% 20.2x 1.46x 8.6x 1.37x 7.8x
Inventure Foods, Inc. SNAK 3.95 80.6% 72 26 1 97 148 12 19.1% 11.6% 20.3% 7.8% 17.9x 0.65x 8.4x 0.59x 6.9x
Mean 14.1% 7.9% 29.0% 10.7% 19.1x 0.94x 8.4x 0.94x 7.2x
Median 12.4% 6.1% 26.0% 11.2% 17.9x 0.92x 8.0x 0.98x 7.7x
Last Twelve Months (LTM) EV / LTM EV / 2011ERevenue Growth LTM Margins
Food & Beverage
Industry Update
8/26/2011Trading Statistics Detail1
5 of 13
Member FINRA/SIPC
Member FINRA/SIPC
Trading Statistics Detail (continued)1
6 of 13
Price at As a % of Market Cash & Enterprise P/E
($ in millions, except per share data) Ticker 8/19/11 52-wk High Cap Debt Equiv. Value (EV) Revenue EBITDA 1 Year 3 Years Gross EBITDA Multiple Revenue EBITDA Revenue EBITDA
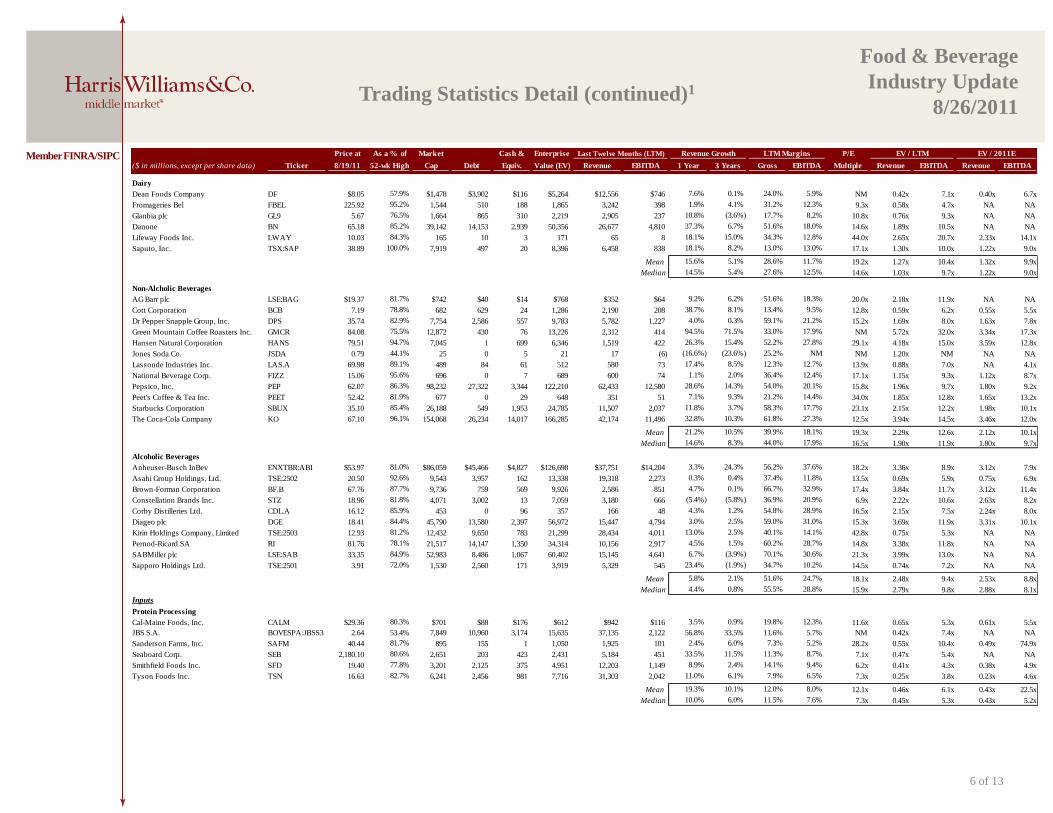
Dairy
Dean Foods Company DF $8.05 57.9% $1,478 $3,902 $116 $5,264 $12,556 $746 7.6% 0.1% 24.0% 5.9% NM 0.42x 7.1x 0.40x 6.7x
Fromageries Bel FBEL 225.92 95.2% 1,544 510 188 1,865 3,242 398 1.9% 4.1% 31.2% 12.3% 9.3x 0.58x 4.7x NA NA
Glanbia plc GL9 5.67 76.5% 1,664 865 310 2,219 2,905 237 10.8% (3.6%) 17.7% 8.2% 10.8x 0.76x 9.3x NA NA
Danone BN 65.18 85.2% 39,142 14,153 2,939 50,356 26,677 4,810 37.3% 6.7% 51.6% 18.0% 14.6x 1.89x 10.5x NA NA
Lifeway Foods Inc. LWAY 10.03 84.3% 165 10 3 171 65 8 18.1% 15.0% 34.3% 12.8% 44.0x 2.65x 20.7x 2.33x 14.1x
Saputo, Inc. TSX:SAP 38.89 100.0% 7,919 497 20 8,396 6,458 838 18.1% 8.2% 13.0% 13.0% 17.1x 1.30x 10.0x 1.22x 9.0x
Mean 15.6% 5.1% 28.6% 11.7% 19.2x 1.27x 10.4x 1.32x 9.9x
Median 14.5% 5.4% 27.6% 12.5% 14.6x 1.03x 9.7x 1.22x 9.0x
Non-Alcholic Beverages
AG Barr plc LSE:BAG $19.37 81.7% $742 $40 $14 $768 $352 $64 9.2% 6.2% 51.6% 18.3% 20.0x 2.18x 11.9x NA NA
Cott Corporation BCB 7.19 78.8% 682 629 24 1,286 2,190 208 38.7% 8.1% 13.4% 9.5% 12.8x 0.59x 6.2x 0.55x 5.5x
Dr Pepper Snapple Group, Inc. DPS 35.74 82.9% 7,754 2,586 557 9,783 5,782 1,227 4.0% 0.3% 59.1% 21.2% 15.2x 1.69x 8.0x 1.63x 7.8x
Green Mountain Coffee Roasters Inc. GMCR 84.08 75.5% 12,872 430 76 13,226 2,312 414 94.5% 71.5% 33.0% 17.9% NM 5.72x 32.0x 3.34x 17.3x
Hansen Natural Corporation HANS 79.51 94.7% 7,045 1 699 6,346 1,519 422 26.3% 15.4% 52.2% 27.8% 29.1x 4.18x 15.0x 3.59x 12.8x
Jones Soda Co. JSDA 0.79 44.1% 25 0 5 21 17 (6) (16.6%) (23.6%) 25.2% NM NM 1.20x NM NA NA
Lassonde Industries Inc. LAS.A 69.98 89.1% 489 84 61 512 580 73 17.4% 8.5% 12.3% 12.7% 13.9x 0.88x 7.0x NA 4.1x
National Beverage Corp. FIZZ 15.06 95.6% 696 0 7 689 600 74 1.1% 2.0% 36.4% 12.4% 17.1x 1.15x 9.3x 1.12x 8.7x
Pepsico, Inc. PEP 62.07 86.3% 98,232 27,322 3,344 122,210 62,433 12,580 28.6% 14.3% 54.0% 20.1% 15.8x 1.96x 9.7x 1.80x 9.2x
Peet's Coffee & Tea Inc. PEET 52.42 81.9% 677 0 29 648 351 51 7.1% 9.3% 21.2% 14.4% 34.0x 1.85x 12.8x 1.65x 13.2x
Starbucks Corporation SBUX 35.10 85.4% 26,188 549 1,953 24,785 11,507 2,037 11.8% 3.7% 58.3% 17.7% 23.1x 2.15x 12.2x 1.98x 10.1x
The Coca-Cola Company KO 67.10 96.1% 154,068 26,234 14,017 166,285 42,174 11,496 32.8% 10.3% 61.8% 27.3% 12.5x 3.94x 14.5x 3.46x 12.0x
Mean 21.2% 10.5% 39.9% 18.1% 19.3x 2.29x 12.6x 2.12x 10.1x
Median 14.6% 8.3% 44.0% 17.9% 16.5x 1.90x 11.9x 1.80x 9.7x
Alcoholic Beverages
Anheuser-Busch InBev ENXTBR:ABI $53.97 81.0% $86,059 $45,466 $4,827 $126,698 $37,751 $14,204 3.3% 24.3% 56.2% 37.6% 18.2x 3.36x 8.9x 3.12x 7.9x
Asahi Group Holdings, Ltd. TSE:2502 20.50 92.6% 9,543 3,957 162 13,338 19,318 2,273 0.3% 0.4% 37.4% 11.8% 13.5x 0.69x 5.9x 0.75x 6.9x
Brown-Forman Corporation BF.B 67.76 87.7% 9,736 759 569 9,926 2,586 851 4.7% 0.1% 66.7% 32.9% 17.4x 3.84x 11.7x 3.12x 11.4x
Constellation Brands Inc. STZ 18.96 81.8% 4,071 3,002 13 7,059 3,180 666 (5.4%) (5.8%) 36.9% 20.9% 6.9x 2.22x 10.6x 2.63x 8.2x
Corby Distilleries Ltd. CDL.A 16.12 85.9% 453 0 96 357 166 48 4.3% 1.2% 54.8% 28.9% 16.5x 2.15x 7.5x 2.24x 8.0x
Diageo plc DGE 18.41 84.4% 45,790 13,580 2,397 56,972 15,447 4,794 3.0% 2.5% 59.0% 31.0% 15.3x 3.69x 11.9x 3.31x 10.1x
Kirin Holdings Company, Limited TSE:2503 12.93 81.2% 12,432 9,650 783 21,299 28,434 4,011 13.0% 2.5% 40.1% 14.1% 42.8x 0.75x 5.3x NA NA
Pernod-Ricard SA RI 81.76 78.1% 21,517 14,147 1,350 34,314 10,156 2,917 4.5% 1.5% 60.2% 28.7% 14.8x 3.38x 11.8x NA NA
SABMiller plc LSE:SAB 33.35 84.9% 52,983 8,486 1,067 60,402 15,145 4,641 6.7% (3.9%) 70.1% 30.6% 21.3x 3.99x 13.0x NA NA
Sapporo Holdings Ltd. TSE:2501 3.91 72.0% 1,530 2,560 171 3,919 5,329 545 23.4% (1.9%) 34.7% 10.2% 14.5x 0.74x 7.2x NA NA
Mean 5.8% 2.1% 51.6% 24.7% 18.1x 2.48x 9.4x 2.53x 8.8x
Median 4.4% 0.8% 55.5% 28.8% 15.9x 2.79x 9.8x 2.88x 8.1x
Inputs
Protein Processing
Cal-Maine Foods, Inc. CALM $29.36 80.3% $701 $88 $176 $612 $942 $116 3.5% 0.9% 19.8% 12.3% 11.6x 0.65x 5.3x 0.61x 5.5x
JBS S.A. BOVESPA:JBSS3 2.64 53.4% 7,849 10,960 3,174 15,635 37,135 2,122 56.8% 33.5% 11.6% 5.7% NM 0.42x 7.4x NA NA
Sanderson Farms, Inc. SAFM 40.44 81.7% 895 155 1 1,050 1,925 101 2.4% 6.0% 7.3% 5.2% 28.2x 0.55x 10.4x 0.49x 74.9x
Seaboard Corp. SEB 2,180.10 80.6% 2,651 203 423 2,431 5,184 451 33.5% 11.5% 11.3% 8.7% 7.1x 0.47x 5.4x NA NA
Smithfield Foods Inc. SFD 19.40 77.8% 3,201 2,125 375 4,951 12,203 1,149 8.9% 2.4% 14.1% 9.4% 6.2x 0.41x 4.3x 0.38x 4.9x
Tyson Foods Inc. TSN 16.63 82.7% 6,241 2,456 981 7,716 31,303 2,042 11.0% 6.1% 7.9% 6.5% 7.3x 0.25x 3.8x 0.23x 4.6x
Mean 19.3% 10.1% 12.0% 8.0% 12.1x 0.46x 6.1x 0.43x 22.5x
Median 10.0% 6.0% 11.5% 7.6% 7.3x 0.45x 5.3x 0.43x 5.2x
Last Twelve Months (LTM) EV / LTMRevenue Growth LTM Margins EV / 2011E
Food & Beverage
Industry Update
8/26/2011
Member FINRA/SIPC
7 of 13
Price at As a % of Market Cash & Enterprise P/E
($ in millions, except per share data) Ticker 8/19/11 52-wk High Cap Debt Equiv. Value (EV) Revenue EBITDA 1 Year 3 Years Gross EBITDA Multiple Revenue EBITDA Revenue EBITDA
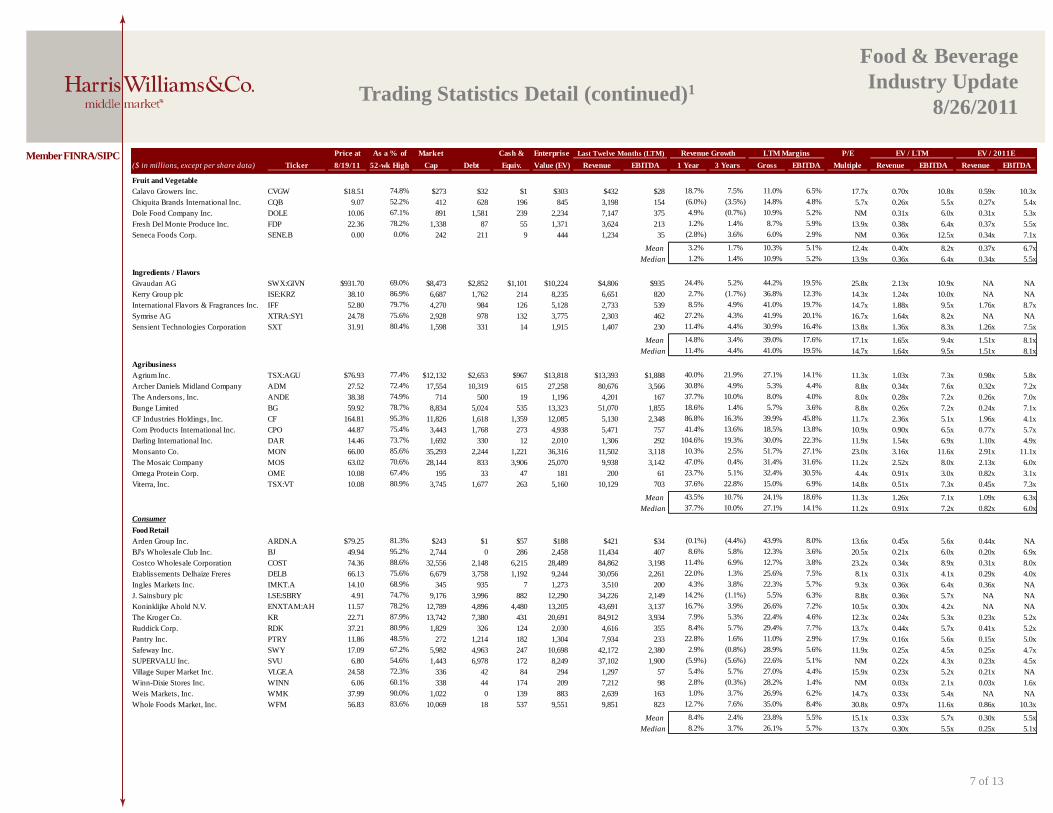
Fruit and Vegetable
Calavo Growers Inc. CVGW $18.51 74.8% $273 $32 $1 $303 $432 $28 18.7% 7.5% 11.0% 6.5% 17.7x 0.70x 10.8x 0.59x 10.3x
Chiquita Brands International Inc. CQB 9.07 52.2% 412 628 196 845 3,198 154 (6.0%) (3.5%) 14.8% 4.8% 5.7x 0.26x 5.5x 0.27x 5.4x
Dole Food Company Inc. DOLE 10.06 67.1% 891 1,581 239 2,234 7,147 375 4.9% (0.7%) 10.9% 5.2% NM 0.31x 6.0x 0.31x 5.3x
Fresh Del Monte Produce Inc. FDP 22.36 78.2% 1,338 87 55 1,371 3,624 213 1.2% 1.4% 8.7% 5.9% 13.9x 0.38x 6.4x 0.37x 5.5x
Seneca Foods Corp. SENE.B 0.00 0.0% 242 211 9 444 1,234 35 (2.8%) 3.6% 6.0% 2.9% NM 0.36x 12.5x 0.34x 7.1x
Mean 3.2% 1.7% 10.3% 5.1% 12.4x 0.40x 8.2x 0.37x 6.7x
Median 1.2% 1.4% 10.9% 5.2% 13.9x 0.36x 6.4x 0.34x 5.5x
Ingredients / Flavors
Givaudan AG SWX:GIVN $931.70 69.0% $8,473 $2,852 $1,101 $10,224 $4,806 $935 24.4% 5.2% 44.2% 19.5% 25.8x 2.13x 10.9x NA NA
Kerry Group plc ISE:KRZ 38.10 86.9% 6,687 1,762 214 8,235 6,651 820 2.7% (1.7%) 36.8% 12.3% 14.3x 1.24x 10.0x NA NA
International Flavors & Fragrances Inc. IFF 52.80 79.7% 4,270 984 126 5,128 2,733 539 8.5% 4.9% 41.0% 19.7% 14.7x 1.88x 9.5x 1.76x 8.7x
Symrise AG XTRA:SY1 24.78 75.6% 2,928 978 132 3,775 2,303 462 27.2% 4.3% 41.9% 20.1% 16.7x 1.64x 8.2x NA NA
Sensient Technologies Corporation SXT 31.91 80.4% 1,598 331 14 1,915 1,407 230 11.4% 4.4% 30.9% 16.4% 13.8x 1.36x 8.3x 1.26x 7.5x
Mean 14.8% 3.4% 39.0% 17.6% 17.1x 1.65x 9.4x 1.51x 8.1x
Median 11.4% 4.4% 41.0% 19.5% 14.7x 1.64x 9.5x 1.51x 8.1x
Agribusiness
Agrium Inc. TSX:AGU $76.93 77.4% $12,132 $2,653 $967 $13,818 $13,393 $1,888 40.0% 21.9% 27.1% 14.1% 11.3x 1.03x 7.3x 0.98x 5.8x
Archer Daniels Midland Company ADM 27.52 72.4% 17,554 10,319 615 27,258 80,676 3,566 30.8% 4.9% 5.3% 4.4% 8.8x 0.34x 7.6x 0.32x 7.2x
The Andersons, Inc. ANDE 38.38 74.9% 714 500 19 1,196 4,201 167 37.7% 10.0% 8.0% 4.0% 8.0x 0.28x 7.2x 0.26x 7.0x
Bunge Limited BG 59.92 78.7% 8,834 5,024 535 13,323 51,070 1,855 18.6% 1.4% 5.7% 3.6% 8.8x 0.26x 7.2x 0.24x 7.1x
CF Industries Holdings, Inc. CF 164.81 95.3% 11,826 1,618 1,359 12,085 5,130 2,348 86.8% 16.3% 39.9% 45.8% 11.7x 2.36x 5.1x 1.96x 4.1x
Corn Products International Inc. CPO 44.87 75.4% 3,443 1,768 273 4,938 5,471 757 41.4% 13.6% 18.5% 13.8% 10.9x 0.90x 6.5x 0.77x 5.7x
Darling International Inc. DAR 14.46 73.7% 1,692 330 12 2,010 1,306 292 104.6% 19.3% 30.0% 22.3% 11.9x 1.54x 6.9x 1.10x 4.9x
Monsanto Co. MON 66.00 85.6% 35,293 2,244 1,221 36,316 11,502 3,118 10.3% 2.5% 51.7% 27.1% 23.0x 3.16x 11.6x 2.91x 11.1x
The Mosaic Company MOS 63.02 70.6% 28,144 833 3,906 25,070 9,938 3,142 47.0% 0.4% 31.4% 31.6% 11.2x 2.52x 8.0x 2.13x 6.0x
Omega Protein Corp. OME 10.08 67.4% 195 33 47 181 200 61 23.7% 5.1% 32.4% 30.5% 4.4x 0.91x 3.0x 0.82x 3.1x
Viterra, Inc. TSX:VT 10.08 80.9% 3,745 1,677 263 5,160 10,129 703 37.6% 22.8% 15.0% 6.9% 14.8x 0.51x 7.3x 0.45x 7.3x
Mean 43.5% 10.7% 24.1% 18.6% 11.3x 1.26x 7.1x 1.09x 6.3x
Median 37.7% 10.0% 27.1% 14.1% 11.2x 0.91x 7.2x 0.82x 6.0x
Consumer
Food Retail
Arden Group Inc. ARDN.A $79.25 81.3% $243 $1 $57 $188 $421 $34 (0.1%) (4.4%) 43.9% 8.0% 13.6x 0.45x 5.6x 0.44x NA
BJ's Wholesale Club Inc. BJ 49.94 95.2% 2,744 0 286 2,458 11,434 407 8.6% 5.8% 12.3% 3.6% 20.5x 0.21x 6.0x 0.20x 6.9x
Costco Wholesale Corporation COST 74.36 88.6% 32,556 2,148 6,215 28,489 84,862 3,198 11.4% 6.9% 12.7% 3.8% 23.2x 0.34x 8.9x 0.31x 8.0x
Etablissements Delhaize Freres DELB 66.13 75.6% 6,679 3,758 1,192 9,244 30,056 2,261 22.0% 1.3% 25.6% 7.5% 8.1x 0.31x 4.1x 0.29x 4.0x
Ingles Markets Inc. IMKT.A 14.10 68.9% 345 935 7 1,273 3,510 200 4.3% 3.8% 22.3% 5.7% 9.3x 0.36x 6.4x 0.36x NA
J. Sainsbury plc LSE:SBRY 4.91 74.7% 9,176 3,996 882 12,290 34,226 2,149 14.2% (1.1%) 5.5% 6.3% 8.8x 0.36x 5.7x NA NA
Koninklijke Ahold N.V. ENXTAM:AH 11.57 78.2% 12,789 4,896 4,480 13,205 43,691 3,137 16.7% 3.9% 26.6% 7.2% 10.5x 0.30x 4.2x NA NA
The Kroger Co. KR 22.71 87.9% 13,742 7,380 431 20,691 84,912 3,934 7.9% 5.3% 22.4% 4.6% 12.3x 0.24x 5.3x 0.23x 5.2x
Ruddick Corp. RDK 37.21 80.9% 1,829 326 124 2,030 4,616 355 8.4% 5.7% 29.4% 7.7% 13.7x 0.44x 5.7x 0.41x 5.2x
Pantry Inc. PTRY 11.86 48.5% 272 1,214 182 1,304 7,934 233 22.8% 1.6% 11.0% 2.9% 17.9x 0.16x 5.6x 0.15x 5.0x
Safeway Inc. SWY 17.09 67.2% 5,982 4,963 247 10,698 42,172 2,380 2.9% (0.8%) 28.9% 5.6% 11.9x 0.25x 4.5x 0.25x 4.7x
SUPERVALU Inc. SVU 6.80 54.6% 1,443 6,978 172 8,249 37,102 1,900 (5.9%) (5.6%) 22.6% 5.1% NM 0.22x 4.3x 0.23x 4.5x
Village Super Market Inc. VLGE.A 24.58 72.3% 336 42 84 294 1,297 57 5.4% 5.7% 27.0% 4.4% 15.9x 0.23x 5.2x 0.21x NA
Winn-Dixie Stores Inc. WINN 6.06 60.1% 338 44 174 209 7,212 98 2.8% (0.3%) 28.2% 1.4% NM 0.03x 2.1x 0.03x 1.6x
Weis Markets, Inc. WMK 37.99 90.0% 1,022 0 139 883 2,639 163 1.0% 3.7% 26.9% 6.2% 14.7x 0.33x 5.4x NA NA
Whole Foods Market, Inc. WFM 56.83 83.6% 10,069 18 537 9,551 9,851 823 12.7% 7.6% 35.0% 8.4% 30.8x 0.97x 11.6x 0.86x 10.3x
Mean 8.4% 2.4% 23.8% 5.5% 15.1x 0.33x 5.7x 0.30x 5.5x
Median 8.2% 3.7% 26.1% 5.7% 13.7x 0.30x 5.5x 0.25x 5.1x
LTM Margins EV / LTM EV / 2011ELast Twelve Months (LTM) Revenue Growth
Food & Beverage
Industry Update
8/26/2011Trading Statistics Detail (continued)1

Member FINRA/SIPC
8 of 13
Price at As a % of Market Cash & Enterprise P/E
($ in millions, except per share data) Ticker 8/19/11 52-wk High Cap Debt Equiv. Value (EV) Revenue EBITDA 1 Year 3 Years Gross EBITDA Multiple Revenue EBITDA Revenue EBITDA
Foodservice / Distribution
Core-Mark Holding Company, Inc. CORE $33.34 86.2% $380 $96 $19 $457 $5,732 $55 9.3% 9.7% 7.0% 1.0% 20.9x 0.08x 8.2x 0.05x 5.4x
Nash Finch Co. NAFC 29.65 66.0% 360 320 1 679 4,857 133 (6.4%) 2.8% 8.1% 2.7% 7.8x 0.14x 5.1x 0.13x NA
Sysco Corp. SYY 27.00 82.4% 15,754 2,669 640 17,783 39,323 2,334 5.6% 1.6% 18.6% 5.9% 13.8x 0.45x 7.6x 0.43x 7.2x
United Natural Foods, Inc. UNFI 36.88 80.1% 1,788 228 24 1,992 4,360 164 20.4% 11.3% 18.2% 3.8% 22.3x 0.46x 12.1x 0.40x 10.3x
Mean 7.2% 6.4% 13.0% 3.4% 16.2x 0.28x 8.3x 0.25x 7.6x
Median 7.5% 6.3% 13.2% 3.2% 17.3x 0.30x 7.9x 0.27x 7.2x
Fast Food
Domino's Pizza, Inc. DPZ $25.02 87.1% $1,521 $1,452 $79 $2,894 $1,601 $274 6.1% 3.2% 28.3% 17.1% 16.6x 1.81x 10.6x 1.70x 10.0x
Jack in the Box Inc. JACK 18.82 76.8% 873 448 12 1,308 2,252 170 (1.0%) (0.3%) 14.5% 7.5% 15.8x 0.58x 7.7x 0.62x 5.8x
McDonald's Corp. MCD 87.23 97.4% 90,000 12,283 2,073 100,210 25,536 9,110 8.3% 3.0% 39.7% 35.7% 17.7x 3.92x 11.0x 3.62x 9.9x
Sonic Corp. SONC 9.08 76.6% 562 571 39 1,094 550 129 (3.2%) (11.8%) 52.0% 23.5% NM 1.99x 8.5x 1.96x 8.0x
The Wendy's Company WEN 4.57 81.3% 1,810 1,355 492 2,673 3,429 347 14.4% 39.6% 23.0% 10.1% NM 0.78x 7.7x 1.03x 7.8x
Yum! Brands, Inc. YUM 49.41 85.6% 22,947 3,288 955 25,280 11,665 2,488 5.5% 2.3% 27.4% 21.3% 19.8x 2.17x 10.2x 2.01x 9.1x
Mean 5.0% 6.0% 30.8% 19.2% 17.5x 1.87x 9.3x 1.82x 8.4x
Median 5.8% 2.7% 27.8% 19.2% 17.1x 1.90x 9.3x 1.83x 8.6x
Casual Dining
Biglari Holdings Inc. BH $320.08 68.9% $459 $166 $134 $490 $705 $81 5.1% 4.3% 24.0% 11.5% 13.5x 0.70x 6.1x NA NA
Bob Evans Farms Inc. BOBE 28.84 78.0% 876 136 60 952 1,670 197 (2.4%) (1.6%) 36.7% 11.8% 14.7x 0.57x 4.8x 0.56x 4.5x
Brinker International Inc. NYSE:EAT 22.30 83.2% 1,891 525 82 2,334 2,761 344 (3.4%) (10.6%) 17.3% 12.5% 14.6x 0.85x 6.8x 0.83x 6.4x
Buffalo Wild Wings Inc. BWLD 56.62 81.4% 1,039 0 86 953 682 110 18.4% 22.7% 27.4% 16.1% 23.5x 1.40x 8.7x 1.13x 6.9x
Chipotle Mexican Grill, Inc. CMG 279.37 82.8% 8,757 4 385 8,376 2,040 389 23.5% 18.7% 37.2% 19.1% 46.2x 4.11x 21.5x 3.39x 17.1x
Darden Restaurants, Inc. DRI 44.95 83.5% 6,050 1,672 74 7,648 7,500 1,055 5.4% 4.2% 24.0% 14.1% 13.2x 1.02x 7.2x 0.96x 6.6x
Panera Bread Co. PNRA 102.45 76.8% 3,117 0 230 2,888 1,673 281 15.9% 11.7% 35.0% 16.8% 24.3x 1.73x 10.3x 1.50x 8.9x
P.F. Chang's China Bistro, Inc. PFCB 27.95 52.4% 624 1 59 566 1,248 140 0.6% 2.4% 17.9% 11.2% 14.3x 0.45x 4.1x 0.45x 4.3x
The Cheesecake Factory Incorporated CAKE 25.91 76.0% 1,460 53 59 1,454 1,685 198 3.6% 2.1% 42.5% 11.8% 17.4x 0.86x 7.3x 0.80x 6.4x
Mean 7.4% 6.0% 29.1% 13.9% 20.2x 1.30x 8.5x 1.20x 7.7x
Median 5.1% 4.2% 27.4% 12.5% 14.7x 0.86x 7.2x 0.89x 6.5x
Last Twelve Months (LTM) Revenue Growth LTM Margins EV / LTM EV / 2011E
Food & Beverage
Industry Update
8/26/2011Trading Statistics Detail (continued)1

Food and
Beverage
Industry Stock
Performance1
Commodity
Price Indices5
40
60
80
100
120
140
160
Aug-07 Feb-08 Aug-08 Feb-09 Aug-09 Feb-10 Aug-10 Feb-11 Aug-11
Ind
ex
Dow Jones Beverage Index Dow Jones Food Products Index S&P 500 Index
0
50
100
150
200
250
300
Jul-07 Jan-08 Jul-08 Jan-09 Jul-09 Jan-10 Jul-10 Jan-11 Jul-11
Ind
ex
Corn Wheat Soybeans Crude Oil
Corn:
104.5%
Soybeans:
60.1%
Crude Oil:
46.4%
Wheat:
27.5%
Beverage:
20.5%
Food:
(0.8%)
S&P 500:
(22.3%)
9 of 13
Food & Beverage
Industry Update
8/26/2011

Median Food and Bev. Transaction Multiples Announced Food and Bev. TransactionsNorth American
Food and
Beverage M&A
Trends1
Recent North
American Food
and Beverage
M&A1
10.9x
14.3x
11.0x 10.5x
9.9x
8.8x 8.3x
9.7x
0.00x
0.25x
0.50x
0.75x
1.00x
1.25x
1.50x
1.75x
0x
2x
4x
6x
8x
10x
12x
14x
16x
2004 2005 2006 2007 2008 2009 2010 2011
EV
/ LT
M S
ale
s Mu
ltiple_
_
EV
/ L
TM
EB
ITD
A M
ult
iple
__
EV / LTM EBITDA EV / LTM Sales
$25.5
$4.5
$12.0
$25.5
$110.2
$9.3
$67.2
$5.0
0
50
100
150
200
250
300
$0
$20
$40
$60
$80
$100
$120
2004 2005 2006 2007 2008 2009 2010 2011
Nu
mb
er o
f Tra
nsa
ctio
ns_
_
Ag
greg
ate
Tra
nsa
cti
on
Va
lue (
$ i
n b
illi
on
s)
Aggregate Deal Value # of deals
Enterprise Enterprise Value Private Equity
Announced Target Seller Buyer Value ($mm) Sales EBITDA EBIT Involvement
8/22/2011 Pearson's Candy Company - Brynwood Partners - - - - P
8/17/2011 Mary of Puddin Hill, Inc. - Legends Food Corporation - - - -
8/15/2011 Dean Foods Company, Dairy-Processing Dean Foods Company OpenGate Capital - - - - P
8/12/2011 Clearwater Seafoods Income Fund - Cooke Aquaculture, Inc. - - - -
8/12/2011 The C.F. Sauer Company Inc., Margarine Assets The C.F. Sauer Company Inc. Bunge North America, Inc. - - - -
8/10/2011 TRAC Microbiology Inc. - Covance Inc. - - - -
8/9/2011 George Greer Co., Inc. - Snyder's-Lance, Inc. - - - -
8/9/2011 Sara Lee Corp., Dough Business Sara Lee Corp. Ralcorp Holdings Inc. $545.0 - - -
8/8/2011 MD Drinks, Inc. - Sunsweet Growers, Inc. - - - -
8/8/2011 Progressive Holdings, LLC - Xylitol Canada Inc. $0.4 - - -
8/5/2011 Juice Heads, Inc. - SunOpta $2.5 0.25x - -
8/4/2011 Piller Sausages & Delicatessens Ltd. - Premium Brands Holdings Corporation $115.9 0.63x - -
8/4/2011 MaMa Rosa's LLC InvestAmerica Investment Advisors Huntsman Gay Global Capital, LLC - - - - P
8/3/2011 Landmark Vineyards - FIJI Water Company LLC - - - -
8/3/2011 Glutino Food Group Claridge, Inc. Smart Balance, Inc $65.9 1.18x - - P
8/3/2011 English River Pellets, Inc. - Archer Daniels Midland Company - - - -
7/28/2011 Harim USA Ltd. - Harim Holdings Co.,Ltd. $17.5 - - -
7/27/2011 Natures Prime Organic Foods Inc. - Kensington Energy Corp. - - - -
7/26/2011 Greenfield Wine Company - Vintage Wine Estates Inc. - - - -
7/26/2011 Allen Family Foods, Inc. - Harim USA Ltd. $48.0 1.06x - -
7/25/2011 GRAN NEVADA Beverages, Inc. - NuVim Inc. - - - -
7/25/2011 Bojangles' Holdings, Inc. Falfurrias Capital Partners Advent International - - - - P
7/22/2011 Allens, Inc. - Seneca Foods Corp. - - - -
7/21/2011 Fresherized Foods, Inc. - MegaMex Foods - - - -
7/21/2011 Buff Water, Inc. - The Kiley Group, Inc. - - - -
7/15/2011 Kansas City Sausage Company - AgFeed Industries, Inc. - - - -
7/11/2011 MacPhail Family Wines - The Hess Collection Winery - - - -
7/7/2011 White Stone Meat Packing Company - J&R Natural Meats - - - -
7/6/2011 Vaughan Foods Inc. Hillson Financial Management, Inc. Reser's Fine Foods, Inc. $27.0 0.28x 17.3x - P
7/6/2011 Rupari Food Services, Inc. - Wind Point Partners - - - - P
7/2/2011 Minardi Baking Co., Inc. - Anthony and Sons - - - -
7/1/2011 Golden Brands - AarhusKarlshamn AB - - - -
6/29/2011 Tzetzo Bros., Inc. - Wythe Will Tzetzo - - - -
6/28/2011 Edna Valley Vineyard Paragon Vineyard Company E. &. J. Gallo Winery, Inc. - - - -
6/28/2011 Contessa Premium Foods, Inc. - Sun Capital Partners, Inc. $51.0 - - - P
6/23/2011 Pelican Brands - Paddington Corp. - - - -
6/20/2011 Buff Water, Inc - The Kiley Group, Inc. - - - -
6/17/2011 Clement Pappas & Co., Inc. - Lassonde Industries Inc. $481.5 1.23x 8.0x -
6/13/2011 Naumes Concentrates, Inc. - Sun-Rype Products Ltd. - - - -
6/9/2011 Allen Family Foods, Inc. - Seaford Milling Company - - - -
6/6/2011 Cattleman's Choice Loomix, LLC - ADM Alliance Nutrition - - - -
6/6/2011 Stumptown Coffee Roasters Inc. - TSG Consumer Partners - - - - P
6/6/2011 WheyUp, LLC - Shadow Beverages - - - -
6/2/2011 White Apron, Inc. Arbor Private Investment Company U.S. Foodservice, Inc. - - - - P
6/1/2011 Barber Foods, Inc. - AdvancePierre Foods - - - -
6/1/2011 Wenner Bread Products, Inc. - Frontenac Company - - - - P
5/27/2011 Quality Foods Cooperative Incorporated - H.T. Hackney Company - - - -
5/26/2011 Renaissance Food Group, LLC The Really Cool Food Company Calavo Growers Inc. - - - -
5/26/2011 International Mineral Technologies, LLC TETRA Technologies Inc. Agrium Inc. - - - -
5/20/2011 Great Western Meats, Inc. - U.S. Foodservice, Inc. - - - -
5/19/2011 Pita King Bakery Ltd. - Kronos Products, Inc. - - - -
10 of 13
Food & Beverage
Industry Update
8/26/2011

Recent North
American Food
and Beverage
M&A1
(continued)
Enterprise Enterprise Value Private Equity
Announced Target Seller Buyer Value ($mm) Sales EBITDA EBIT Involvement
5/17/2011 The Hartz Mountain Corporation Sumitomo Corporation of America Uni-Charm Corp. - - - -
5/17/2011 Big Save, Inc. - QSI, Inc. - - - -
5/16/2011 Rowland Coffee Roasters, Inc. - The J. M. Smucker Company $360.0 - - -
5/12/2011 Border Foods, Inc. Ares Capital Corp. Mizkan Americas, Inc. - - - - P
5/10/2011 Crispers Restaurants, LLC Publix Super Markets Inc. Healthy Food Concepts LLC - - - -
5/9/2011 Caritas Ranch Bar-B-Q, Co. - Precious Metals Exchange Corp. - - - -
5/6/2011 PACA Foods, Inc. - Medallion Capital, Inc. - - - - P
5/6/2011 Idaho Pacific Holdings, Inc. Otter Tail Corporation Novacap Investments, Inc. $87.0 - - - P
5/5/2011 Aidells Sausage Company, Inc. Encore Consumer; Geolo Capital Sara Lee Corp. $87.0 - - - P
5/5/2011 Sweet Leaf Tea Company Catterton Partners Nestlé Waters North America Inc. - - - - P
5/3/2011 Cerniglia Products, Inc. - U.S. Foodservice, Inc. - - - -
4/28/2011 Buena Vista Winery, Inc. Eight Estates Fine Wines, LLC Boisset Family Estates - - - -
4/28/2011 Gary Farrell Wines, Inc. Eight Estates Fine Wines, LLC Vincraft Group - - - -
4/28/2011 Sonoma-Loeb Wines - Chappellet Winery, Inc. - - - -
4/27/2011 Winn-Dixie Stores, Inc., Beverage Facility Winn-Dixie Stores Inc. Polar Beverages, Inc. - - - -
4/27/2011 Wilson Farms, Inc. Bruckmann, Rosser, Sherrill & Co. 7-Eleven, Inc. - - - - P
4/27/2011 Premium Standard Farms LLC Premium Standard Farms, LLC Cargill, Incorporated $33.0 - - -
4/26/2011 American Dehydrated Foods, Inc., Assets American Dehydrated Foods Inc. Kemin Industries, Inc. - - - -
4/26/2011 NEXT Proteins, Inc. - GarMark Advisors - - - - P
4/26/2011 Marin French Cheese Co. - Laiteries Hubert Triballat SA - - - -
4/26/2011 Le Jardin Mobile Inc. - Groupe Épicia - - - -
4/25/2011 Spence & Co. Ltd. - Alliance Select Foods $8.5 0.75x - -
4/24/2011 Albuquerque Tortilla Company, Inc. - Gruma S.A.B. de CV $8.8 0.63x - -
4/18/2011 Urban Processing, LLC - Mariani Packing Co., Inc. - - - -
4/14/2011 Westernmost Vineyard in Sta Rita Hills - Hillside Road, LLC - - - -
4/14/2011 Okami, Inc. - Fuji Food Products, Inc. - - - -
4/13/2011 BioSan Laboratories, Inc. - The Riverside Company - - - - P
4/12/2011 Paw4mance Pet Products, Inc. - Cody Ventures Corporation - - - -
4/11/2011 Majestic Liquor Stores, Inc. - Centennial Fine Wine and Spirits - - - -
4/10/2011 Tasty Baking Co. (NasdaqGM:TSTY) - Flowers Bakeries, LLC $143.8 0.84x NM NM
4/8/2011 Zeigler Beverage Company Clearview Capital LiDestri Foods, Inc. - - - - P
4/7/2011 Betz Family Winery LLC - Steve and Bridget Griessel - - - -
4/7/2011 Kluge Estate Winery & Vineyards Farm Credit Of The Virginias Donald Trump and Sal Cangiano $8.1 - - -
4/5/2011 Procter & Gamble Co., Pringles Business Procter & Gamble Co. (NYSE:PG) Diamond Foods, Inc. $2,517.6 - - -
4/1/2011 Maple Leaf Foods Inc., Nova Scotia Facility Maple Leaf Foods Inc. (TSX:MFI) Maple Lodge Farms Ltd. - - - -
3/29/2011 Iron City Brewing Company Unified Growth Partners, L.P. Uni-World Capital, L.P. - - - - P
3/28/2011 Global Reliance Inc. - Himalya International Ltd. - - - -
3/28/2011 Epic Nutrition, LLC - Blue Gold Beverages Inc. - - - -
3/23/2011 Dietrich's Specialty Processing LLC - SensoryEffects Flavor Co. - - - - P
3/22/2011 Collins Brothers, Inc. - Access Value Investors LLC - - - - P
3/22/2011 The Skor Food Group Inc. - Colabor Group Inc. $35.6 0.22x 6.7x 8.6x
3/21/2011 Skinny Girl Cocktails, LLC - Beam Global Spirits & Wine - - - -
3/21/2011 Honey, Don't Cough LLC - HelloLife, LLC - - - -
3/15/2011 Choctal, Inc. - SheerBliss Ice Cream, LLC - - - -
3/11/2011 Vitarich Laboratories, Inc. Argan, Inc. NBTY, Inc. $3.1 - - -
3/8/2011 Coffee Distributing Corp. - Compass Group USA, Inc. - - - -
3/8/2011 Omnifrio Beverage Company, LLC - Primo Water Corporation $12.3 - - -
3/1/2011 Honest Tea, Inc. Inventages Venture Capital Investment The Coca-Cola Company - - - - P
3/1/2011 Fetzer Vineyards Brown-Forman Corporation Vina Concha y Toro S.A. $238.0 1.53x - -
3/1/2011 Vietti Foods Company, Inc. Choice Food Group, Inc. Zwanenberg Food Group - - - -
2/28/2011 Mom's Food Products Inc. - Landshire, Inc. - - - -
2/18/2011 Greenfield Farms Grassfed Beef, Inc. - Sweet Spot Games, Inc. - - - -
2/18/2011 Unifeed Hi-Pro, Inc. Viterra, Inc. Circle S Feeds, Inc. - - - -
2/16/2011 Henry's Farmers Market Smart & Final Stores Corporation Sprouts Farmers Market - - - -
2/14/2011 Canada Bread Company, Sandwich Operations Canada Bread Company Ltd. Premium Brands Holdings - - - -
2/10/2011 Middle Bay Properties Inc. Theanon Charitable Foundation AgriMarine Holdings Inc. $2.8 - - -
1/20/2011 Celebration Foods, Incorporated FOCUS Brands, Inc. Rich Products Corporation - - - -
1/18/2011 Fitz's Bottling Company, LLC - FBCMO, LLC - - - -
1/11/2011 King Brewery Inc. - Beer Barons Inc. - - - -
1/11/2011 Discovery Foods Freidman, Fleisher & Lowe Windsor Quality Food - - - - P
1/9/2011 Crumbs Bake Shop, Inc. - 57th Street General $108.3 - - -
1/4/2011 Pacific Rim Winemakers, Inc. - Banfi Products Corporation - - - -
12/29/2010 Pacific Farms USA, LP - Beaverton Foods, Inc. - - - -
12/28/2010 Boreal Water Collection, Inc. - Global Biotech Corp. - - - -
12/22/2010 Main Street Ingredients, LLC - Agropur Cooperative - - - -
12/15/2010 Liberté Natural Foods, Inc. Pineridge Foods, Inc. Yoplait France SA - - - -
12/14/2010 Stranahan's Colorado Whiskey LLC - Proximo Spirits, Inc. $3.1 - - -
12/13/2010 Weber-Stephen Products LLC - BDT Capital Partners - - - - P
12/13/2010 Fresh Food Concepts, Inc. Swander Pace Capital Westbury Partners; Centerfield Capital - - - - P
12/11/2010 Seafood Hawaii Inc. - Kanmonkai Co., Ltd. $1.1 - - -
12/10/2010 Viking Seafoods, Inc. - High Liner Foods Inc. $31.5 - - -
12/10/2010 Atkins Nutritionals Holdings, Inc. North Castle Partners, LLC Roark Capital Group - - - - P
12/10/2010 Ledyard Company - Performance Food Group - - - -
11/25/2010 Del Monte Foods - KKR, Vestar, and Centerview $4,985.2 1.34x 8.3x 9.8x P
11/24/2010 YoCream International Columbia Ventures Corporation Danone $103.0 1.87x 9.5x 10.6x P
11/22/2010 National Provisions Inc. (National Deli) Arbor Private Investment Company River Associates Investments - - - - P
11/18/2010 Dean Foods Co., Mountain High Yogurt Business Dean Foods Co. (NYSE:DF) Yoplait USA, Inc. - - - -
11 of 13
Food & Beverage
Industry Update
8/26/2011

August 2011
Date Company Description
8/30/2011 Winn-Dixie Stores Inc. (NasdaqGS:WINN) Earnings Call
8/31/2011 Brown-Forman Corporation (NYSE:BF.B) Earnings Call
September 2011
Date Company Description
9/2/2011 Campbell Soup Co. (NYSE:CPB) Expected Earnings Release Date
9/2/2011 Pernod-Ricard SA (ENXTPA:RI) Expected Earnings Release Date
9/2/2011 Calavo Growers Inc. (NasdaqGS:CVGW) Expected Earnings Release Date
9/8/2011 Smithfield Foods Inc. (NYSE:SFD) Earnings Call
9/8/2011 United Natural Foods, Inc. (NasdaqGS:UNFI) Earnings Call
9/8/2011 Viterra, Inc. (TSX:VT) Expected Earnings Release Date
9/11/2011 National Beverage Corp. (NasdaqGS:FIZZ) Expected Earnings Release Date
9/13/2011 The Kroger Co. (NYSE:KR) Expected Earnings Release Date
9/15/2011 Diamond Foods, Inc. (NasdaqGS:DMND) Earnings Call
9/20/2011 ConAgra Foods, Inc. (NYSE:CAG) Expected Earnings Release Date
9/20/2011 Darden Restaurants, Inc. (NYSE:DRI) Expected Earnings Release Date
9/24/2011 General Mills, Inc. (NYSE:GIS) Expected Earnings Release Date
9/26/2011 ARYZTA AG (ISE:YZA) Expected Earnings Release Date
9/27/2011 AG Barr plc (LSE:BAG) Expected Earnings Release Date
9/29/2011 The Mosaic Company (NYSE:MOS) Earnings Call
9/29/2011 Golden Enterprises Inc. (NasdaqGM:GLDC) Expected Earnings Release Date
9/30/2011 Cal-Maine Foods, Inc. (NasdaqGS:CALM) Expected Earnings Release Date
9/30/2011 McCormick & Co. Inc. (NYSE:MKC) Expected Earnings Release Date
PEG Investments by Segment PEG Investments and ExitsAnnounced
Private Equity
Activity1
Earnings Call
Calendar1
Food and Beverage
Industry Segment
Number of
Companies
Processed Foods 98
Baked Goods / Snack Foods 131
Natural / Organic Foods 61
Dairy 36
Non-Alcoholic Beverages 66
Alcoholic Beverages 57
Protein Processing 120
Fruit and Vegetable 28
Ingredients / Flavors 36
Agribusiness 71
Food Retail 84
Foodservice / Distribution 35
Fast Food 65
Casual Dining 267
26
16
28
36
27
46
21
14
32
16
5
7
13
15
2726
27
17
34
13
0
5
10
15
20
25
30
35
40
45
50
2002 2003 2004 2005 2006 2007 2008 2009 2010 2011
Nu
mb
er o
f In
vest
men
ts'
Number of Investments Number of Exits
12 of 13
Food & Beverage
Industry Update
8/26/2011

Sources:
1. Capital IQ
2. Thomson Financial
3. S&P
4. Reuters
5. IMF
Harris Williams & Co. (www.harriswilliams.com), a member of The PNC Financial Services Group, Inc. (NYSE:PNC),
is the premier middle market advisor with a two-decade legacy of sell side excellence serving clients worldwide. The
firm is focused exclusively on the middle market providing sell side and acquisition advisory, restructuring advisory,
board advisory, private placements and capital markets advisory services.
Investment banking services are provided by Harris Williams LLC, a registered broker-dealer and member of FINRA
and SIPC, and Harris Williams & Co. Ltd, an Appointed Representative of Sturgeon Ventures LLP, which is Authorised
and Regulated by the Financial Services Authority. Harris Williams & Co. is a trade name under which Harris Williams
LLC and Harris Williams & Co. Ltd conduct business in the U.S. and Europe, respectively.
THIS REPORT MAY CONTAIN REFERENCES TO REGISTERED TRADEMARKS, SERVICE MARKS
AND COPYRIGHTS OWNED BY THIRD-PARTY INFORMATION PROVIDERS. NONE OF THE THIRD-
PARTY INFORMATION PROVIDERS IS ENDORSING THE OFFERING OF, AND SHALL NOT IN ANY
WAY BE DEEMED AN ISSUER OR UNDERWRITER OF, THE SECURITIES, FINANCIAL
INSTRUMENTS OR OTHER INVESTMENTS DISCUSSED IN THIS REPORT, AND SHALL NOT HAVE
ANY LIABILITY OR RESPONSIBILITY FOR ANY STATEMENTS MADE IN THE REPORT OR FOR ANY
FINANCIAL STATEMENTS, FINANCIAL PROJECTIONS OR OTHER FINANCIAL INFORMATION
CONTAINED OR ATTACHED AS AN EXHIBIT TO THE REPORT. FOR MORE INFORMATION ABOUT
THE MATERIALS PROVIDED BY SUCH THIRD PARTIES, PLEASE CONTACT US AT +1 (804) 648-0072.
The information and views contained in this report were prepared by Harris Williams & Co. (“Harris Williams”). It is
not a research report, as such term is defined by applicable law and regulations, and is provided for informational
purposes only. It is not to be construed as an offer to buy or sell or a solicitation of an offer to buy or sell any financial
instruments or to participate in any particular trading strategy. The information contained herein is believed by Harris
Williams to be reliable, but Harris Williams makes no representation as to the accuracy or completeness of such
information. Harris Williams and/or its affiliates may be market makers or specialists in, act as advisers or lenders to,
have positions in and effect transactions in securities of companies mentioned herein and also may provide, may have
provided, or may seek to provide investment banking services for those companies. In addition, Harris Williams and/or
its affiliates or their respective officers, directors and employees may hold long or short positions in the securities,
options thereon or other related financial products of companies discussed herein. Opinions, estimates and projections
in this report constitute Harris Williams’ judgment and are subject to change without notice. The financial instruments
discussed in this report may not be suitable for all investors, and investors must make their own investment decisions
using their own independent advisors as they believe necessary and based upon their specific financial situations and
investment objectives. Also, past performance is not necessarily indicative of future results. No part of this material may
be copied or duplicated in any form or by any means, or redistributed, without Harris Williams’ prior written consent.
Copyright© 2011 Harris Williams & Co., all rights reserved.
13 of 13
Food & Beverage
Industry Update
8/26/2011