Embed Size (px)
Citation preview

THE ST ATE 0 F
1949
CON
NiO.S PROo
0
RI v rE'S
ERES GRASSE-
ACEI-FES LIVES1
-> >,>
U
R , Z
T S
Washington, D. C., U. S. A.F E k TEL') PEST
October 1949trs I'DAS
C H ;OL ES
N
T \if ES--TS -: V S
An FATs
Food and Agriculture
A SUR VEY OF
World Conditionsand Prospects

Food 'and Agriculture Ognization of the United Nations
Australia
Austria
Belgium
Bolivia
Brazil
Burma
Canada
Ceylon
Chile
China
Colombia
Costa Rica
Cuba
Czechoslovakia
Denmark
Dominican Republic
Ecuador
Egypt
El Salvador
Ethiopia
Director-General: NORMS E. DODD
Deputy Director-General: SIR HERBERT BROADLEY, K.B.E.
MEMBER NATIONS
Finland Norway
France Pakistan
Greece Panama
Guatemala Paraguay
Haiti Peru
Honduras Philippine Republic
Hungary Poland
Iceland Portugal
India Saudi Arabia
Iraq Switzerland
Ireland Syria
Italy
Lebr.uon TrIr/r.sy
Union of South Africa
i',1:;(yarg 1.13-f; 7'711,. .(77.-_
s'L'-`11,20
137
ew Zef-land e,2t(-r.nela
;a

THE STATE OF
A SURVEY OFood and Agriculture
World Conditionsand Prospects
WASHINGTON, D. C., U.S.A. October 1949
FOOD AND AGRICULTURE ORGANIZATION OF THE UNITED NATIONS

ill
CO T TENTS
BASIC ISSUES 1
By NORRIS E. DODD, Director-General
INDICATORS OF THE WORLD SITUATION 7Supplies 7Production 9International Trade 11Recent Changes in United States Trade 13Trade Agreements 15
PRICES AND PURCHASING POWER 16Prices and the Terms of Trade 16Prices of Farm Products and Purchasing Power of Farm In-
comes 19Europe 19United States and Canada 21Latin America 23Southern British Dominions 23
Retail Prices, Consumer Purchasing Power, and Food Subsidies 23Retail Prices 23The Purchasing Power of Earnings 25Food Subsidies 25
CONSUMPTION AND NUTRITIONAL LEVELS 27Far East 28Europe 30United States, Canada, Australia, and New Zealand 31Latin America 32Africa 33Near East 33
Inequalities in World Food Distribution 34Conclusions 35
PROSPECTS FOR 1950/51 37Production 37Internal Demand 40External Demand and Supplies 40

APPENDICES
A. AGRICULTURAL PRODUCTS FOODS 47Grains 47
Review of 1948/49 Season 47Outlook for 1949/50 49Outlook for 1950/51 51Long-term Trends in Grain Production and Trade 54
Rice 57Current Position 58Long-term Trends and Future Outlook 61
Sugar 63Long-term Trends 66
Fats and Oils 68Long-term Trends and Outlook for 1950/51 73
Livestock Products 76Production and Feed 76Trade 77Prospects for 1950/51 80
Citrus and Dried Fruits 83Citrus Fruits 83
Outlook 85Dried Fruits 87
B. AGRICULTURAL PRODUCTS FIBERS 89Production 89Consumption 90Trade and Prices 95World Trade in Textiles 98Textiles Consumption 100Outlook for 1949/50 and 1950/51 101
C. FISHERIES PRODUCTS 104Trends in Quantity Produced 104Whaling 109Changes in Output of End Products 109International Trade 110Trends in Prices and Marketing Conditions 111
D. FOREST PRODUCTS 113Sawn Lumber 115
Europe 115U.S.S.R. 117United States and Canada 117
iv

Far East and Oceania 119Latin America 119Africa 119
Plywood 119Pitprops 121Railway Sleepers (Ties) 121Wood Pulp and Pulp Products 123
Dissolving Pulp 125Fiberboards 125
E. AGRICULTURAL REQUISITES 127Fertilizers 127
Nitrogen 127Phosphates 128Potash 129Fertilizer Use 129
Pesticides 131Farm Machinery 133
Production and Overseas Trade 1351949 Situation 136Future Prospects 137

BASIC ISSUKS
IN THIS, MY SECOND REPORT on the State of Food and Agriculture, an attempt ismade to appraise the current situation against the background of longer-term trendsand to focus attention on a very few broad issues which will require consideration andaction by governments.
We are now about to enter the fifth agricultural season since the termination ofhostilities. Looking back over the postwar years, it appears that the 1948 harvests inthe Northern Hemisphere have marked a definite turning point which brought to anend the period of acute shortage of foodstuffs and agricultural raw materials availablefor export. Thc 1949 harvest in this hemisphere is likely to be slightly smaller thanthat of 1948 but will not cause a return of shortages.
Looking back over the past ten years, it is apparent that World War II causedmore serious and more widespread damage to agriculture than World War I. Therewere serious setbacks throughout Europe, in the European regions of the U.S.S.R.,and in large areas of the Far East. As in World War I, Canada, Cuba, the UnitedStates, and some other countries greatly expanded agricultural production. Untillate in 1948 these countries were repeatedly urged to produce more and more forexport; they introduced special measures to stimulate output and to restrict internalconsumption. These appeals are no longer made. Agriculture in war damaged areas,notably Europe and the U.S.S.R., is recovering rapidly. Deficit countries, eventhose receiving United States foreign aid, do not have dollars enough to buy as muchof certain commodities as the hard-currency countries are offering for export.
Looking back fifty years over the first half of the twentieth century, the trendsare still more instructive. There have been two major wars and the world's worsteconomic depression. Much energy has been wasted, much wealth has been destroyed.Yet, in the more advanced countries, containing about one-quarter of the world'spopulation, the individual consumer can buy far more than his father or mother could
buy in 1900; there have been great technical developments both in manufacturing andin farming. Consumers have diversified their diets and agriculture has responded tothis demand. The output of sugar, fats, fish, livestock products, fruits and vegetables,has been enormously expanded, partly in the temperate zone and partly in tropicaland subtropical regions.
1

Three-quarters of the world's population has been little affected by these greatchanges. People in the majority of underdeveloped countries live as poorly today astheir parents and grandparents lived. In a few of these countries, it is true, there hasbeen some improvement in the food supply; the consumption of sugar appears to haveincreased most. But there is no evidence that the gap in living standards between the
rich and poor countries is being narrowed. The contrary is true, because once acountry has attained a certain level of wealth, it accumulates further capital withoutmuch effort and cumulatively adds to its prosperity.
Governments must now face squarely the issue of poverty and malnutrition. Onmy recent tour of the Near East and the Far East I saw human misery at first hand. I
saw how little food the great majority of these people eat, how inadequate theirhousing, how exhausting their daily toil. I saw how easily a start could be madetoward bettering material conditions in these areas and how comparatively simplechanges could lighten the toil and improve the food supply.
Progress is, of course, being made. Since the end of the war, agricultural produc-t
tion in the underdeveloped countries has been recovering and expanding. In the FarEast it is nearly back to prewar and in other underdeveloped areas well above theprewar level, but in neither has it increased as rapidly as the population during thepast ten years. In the few cases where per caput food consumption has increased, theincrease has been brought about by a reduction of exports.
If living standards are to be raised, food supplies must increase more rapidlythan population. Since population growth varies, according to country, from 1 percentto 2.5 percent per annum, food supplies need to be increased by at least 2 to 3.5percent per annum. FAO has no evidence that such an expansion is being planned,and this is not surprising in view of the pitifully inadequate resources in technicalknowledge and material equipment of the underdeveloped countries. In changing thissituation the Technical Assistance Program, proposed by President Truman andaccepted in principle by the Economic and Social Council of the United Nations, mayplay a decisive part. Under this program technical knowledge can be purveyed tounderdeveloped countries on a scale heretofore impossible. Moreover, the way can bepaved for the introduction into these countries of the equipment needed for moremodern agriculture and for a diversity of industries.
Many a farmer in the underdeveloped countries has nothing to work with but asmall patch of soil, a wooden plow, one or two hoes, spades and sickles, a smallsupply of none-too-good seed saved from the last harvest, and, if he is lucky, apart interest in the ownership of a water-buffalo. This is a far cry from thefarmer in the highly developed country who has a tractor, truck, and other com-plex and efficient machines, barn and workshops, fertilizers, insecticides, seed ofthe best known varieties of plants, good breeds of livestock, news and marketreports by radio, and a research station and extension service not many milesaway.
2

The one cannot catch up with the other quickly; it will take manv years of step-by-step progress. Yet great advances in production can be made by compara-tively elementary improvementsbetter hand tools, better-bred seed, the use ofcrop rotation, a little fertilizer if possible, some insecticide and a hand duster,means of reducing the worst animal disease ravages, maybe a simple pump forirrigation. And most important of all, sound advice and assistance from anextension worker or someone else near at hand who knows about the practicalapplication of modern developments in agricultural science.
In many cases, such improvements as those could increase production 10 or 20or 50 percent in a relatively short time and so provide more and better food formillions of hungry human beings. They are the first steps. The bigger develop-ments in farm mechanization and other large-scale advances will follow. Butsome of them, such as projects for irrigation, soil conservation, reforestation,and land settlement will necessarily go along side by side with the elementaryimprovements.'
The 1949 Conference of FAO has been assigned the task of stating how theTechnical Assistance Program should be carried forward in food and agriculture.This tool, if rightly used, can begin to narrow the gap between the rich and poorpeoples. The amount of money likely to be available seems small compared with thecosts of military preparedness. It is small, even when compared to government ex-penditure on agriculture within a single advanced country such as the United States.But it can pay immeasurable dividends in human well-being.
Big plans must be drawn and set in motion while the more modest program goesalong. There are dams to build, irrigation systems to construct, fertilizer plants toerect, railroads to extend. This means foreign investment in economic development toreinforce technical assistance. The low-income countries have had, relative to theirneeds, only a small share of postwar loans and grants. They should receive a largershare of available funds if their productivity is to be increased. A very rough esti-mate places their needs of foreign capital over the next few years at about $4,000million per annum to supplement the $13,000 million which the underdevelopedcountries would need to raise themselves. (Of the combined amount, the share goingto agriculture would need to be substantially larger than that now envisaged in mostgovernments' plans )
A flow of international funds on this scale should be entirely feasible, but it willprobably require better institutional arrangements relating to private capital and topublic international capital. National and international action by governments canaccomplish this. Technical assistance, coupled with international investment, will makean invincible combination for overcoming step by step the poverty of the world's 1,600
million disadvantaged people.
The second basic issue governments must face lies in the field of national tradein agricultural products. Before World War II, the movement of goods from country
lUnited Nations, Technical Assistance for Economic Development, May 1949, p. 138.
3

to country was increasingly beset by man-made obstacles, but it is many times moredifficult today. The multilateral system has, for the time being, altogether brokendown; goods that cannot flow through channels once considered normal now have toflow in other channels or fail to move at all. Many people fear, in my opinion justi-fiably, the early accumulation of surpluses in some countries while shortages persist inothers. It is sometimes argued that international trade problems almost exclusivelyconcern the advanced countries and that FAO should not spend too much time onthem. This view cannot be accepted: It is to the advantage of all nations that specializa-
tion of function be maintained. More than half the exports of underdeveloped coun-tries are agricultural products; the prices and other conditions under which theseproducts are sold powerfully influence these countries' opportunities for economicdevelopment. For these reasons, governments have an immediate and corporate re-sponsibility to take action which will prevent serious log-jams in international tradeand will result in an increased volume of goods exchanged.
International trade in farm products, as in other products, has been recoveringsteadily since the war, but there are signs of trouble ahead. In 1948, because of a
dollar shortage, many Latin American countries began to curtail their imports, in-cluding some food items, and European countries are now doing the same. Whilethese difficulties persist, North America and other hard-currency areas may havemore goods available for export than the rest of the world can afford to buy. Anotherfactor is the avowed intention of all the underdeveloped countries to reduce such foodimports as they now have and to increase their agricultural exports. This could not beaccomplished easily or quickly, for insofar as it occurs it might create widespreadsurpluses. The international trade problem therefore has two aspects, one concerningsurpluses of dollar goods and the other, perhaps a little less immediate, concerninggeneral surpluses irrespective of dollar difficulties.
Remedies for the dollar shortage are only indirectly the responsibility of FAO.Nevertheless, in proposing action in our own field, we have to reckon with the prob-ability that dollar shortage will persist in some degree for a considerable time. Gov-ernments have to ask themselves whether they can take any action regarding tradein agricultural products which would contribute, if only in a modest way, towardalleviating this problem. It should be possible to build some form of bridge betweenthe dollar and non-dollar world, over which certain quantities of farm products couldmove, additional to those moving under existing international arrangements. TheUnited States, faced with a shrinking demand for its exports, could feasibly, though atgreat expense, reorient its agriculture and avoid producing any substantial quantitiesfor export at all. Neighboring countries, much more dependent on agricultural ex-ports, would find it harder to do the same. But easy or hard. I would not willinglycountenance such policies o f restriction, often politely termed "readjustment," exceptas a last resort after we have all made strenuous efforts to get food moving and keepit moving Across the frontiers.
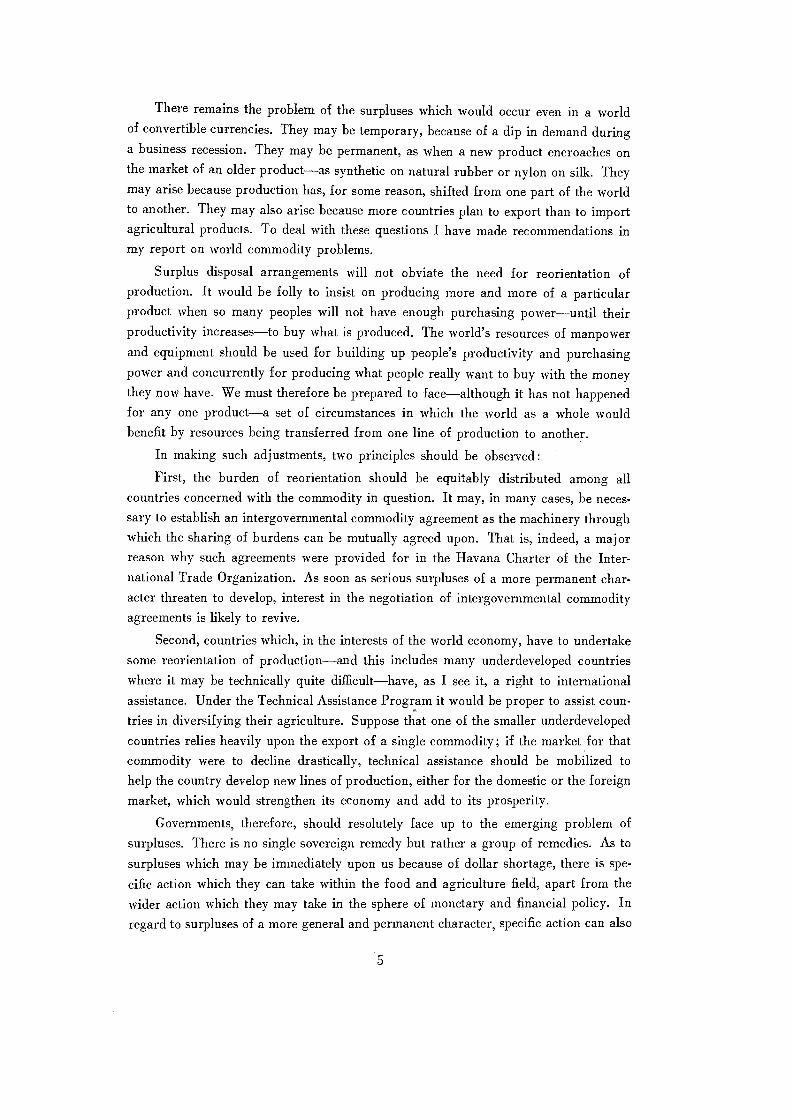
There remains the problem of the surpluses which would occur even in a worldof convertible currencies. They may be temporary, because of a dip in demand duringa business recession. They may be permanent, as when a new product encroaches onthe market of an older productas synthetic on natural rubber or nylon on silk. Theymay arise because production has, for some reason, shifted from one part of the worldto another. They may also arise because more countries plan to export than to importagricultural products. To deal with these questions I have made recommendations inmy report on world commodity problems.
Surplus disposal arrangements will not obviate the need for reorientation ofproduction. It would be folly to insist on producing more and more of a particularproduct when so many peoples will not have enough purchasing poweruntil theirproductivity increasesto buy what is produced. The Nyorld's resources of manpowerand equipment should be used for building up people's productivity and purchasingpower and concurrently for producing what people really want to buy with the moneythey now have. We must therefore be prepared to facealthough it has not happenedfor any one producta set of circumstances in which the Nyorld as a whole wouldbenefit by resources being transferred from one line of production to another.
In making such adjustments, two principles should be observed:
First, the burden of reorientation should be equitably distributed among allcountries concerned with the commodity in question. It may, in many cases, be neces-sary to establish an intergovernmental commodity agreement as the machinery throughwhich the sharing of burdens can be mutually agreed upon. That is, indeed, a majorreason why such agreements were provided for in the Havana Charter of the Inter-national Trade Organization. As soon as serious surpluses of a more permanent char-acter threaten to develop, interest in the negotiation of intergovernmental commodityagreements is likely to revive.
Second, countries which, in the interests of the world economy, have to undertakesome reorientation of productionand this includes many underdeveloped countrieswhere it may be technically quite difficulthave, as I see it, a right to internationalassistance. Under the Technical Assistance Program it would be proper to assist coun-tries in diversifying their agriculture. Suppose that one of the smaller underdevelopedcountries relies heavily upon the export of a single commodity; if the market for thatcommodity were to decline drastically, technical assistance should be mobilized tohelp the country develop new lines of production, either for the domestic or the foreignmarket, which would strengthen its economy and add to its prosperity.
Governments, therefore, should resolutely face up to the emerging problem ofsurpluses. There is no single sovereign remedy but rather a group of remedies. As tosurpluses which may be immediately upon us because of dollar shortage, there is spe-
cific action which they can take within the food and agriculture field, apart from thewider action which they may take in the sphere of monetary and financial policy. Inregard to surpluses of a more general and permanent character, specific action can also
5

be taken; but, in addition, by making use of intergovernmental commodity agree-
rnents and the proposed Tec,hnical Assistance Program, productive resources can beredirected with a minimum of hardship and with substantial ultimate benfit to all.
At the end of the war governments solemnly undertook to attack joint problemswith joint action. In the four annual sessions of the FAO Conference we have ex-changed ideas, discussed issues, and measured the dimensions of many problems. Ofthe fifth session I ask action. We must make great decisions commensurate with theworld's great needs.
6
Director General
WASHINGTON
September 1949

1. Indicators of the World Situation
SUPPLIESIN EVERY MAJOR REGION of the world except the United States and Canada the supplyof food in 1948/49 is larger than in the previous year. Although improving, it isstill below prewar in Europe and the Far East.
The supply of textiles, lumber, and wood pulp shows an increase over the previousyear in all regions except North America and the Far East, where textile supplies de-clined for several reasons. These included a shortage of raw cotton in India, war inChina, and Japan's difficulties in exporting textiles for dollars.
World population continues to grow on most continents at an average rate ofabout 1 percent per annum, but in Latin America at an average rate of more than2 percent a year. Therefore, when available supplies are cakulated on a per caputbasis, as is done in Table 2, the situation appears much less satisfactory.
Compared with 1947/48, this last season has shown a notable increase in the percaput supply of both crop and livestock products in Europe and of crop products inAfrica and the Near East. But per caput total food supply is still below the prewarlevel everywhere, except in the Western Hemisphere, and everywhere, except in NorthAmerica, the consumption of livestock products has fallen more than the consumptionof crop products. Food consumption is studied in more detail in Chapter 3.
The per caput textile supply is above the prewar level only in North America andOceania. The recent fall in North American supplies represents a recession from anexceptionally high level in the previous year. Supplies continue very low in the FarEast, largely because of the slow recovery of Japanese exports.
With forest products as with food, only the Western Hemisphere has a higherper caput consumption than prewar. Supplies in the Far East and Europe remainvery low and improve slowly.
'All indices for 1948/49 or 1949 in this chapter are tentative and provisional and should beused only as general indicators of the situation. Index numbers for 1947/48 published in the Stateof Food and Agriculture, 1948, have been considerably revised on the basis of the latest informa-tion available. The term "available supplies" means production plus imports minus exports and,in the case of foodstuffs, minus seed, waste, and quantities used for industrial purposes. Availablesupplies of textiles means production plus imports minus exports of fibers, plus imports minusexports of yarn and manufactures, both on a fiber-weight basis. Not enough is known about changesin stocks, except in one or two components of the cereals group, for any allowance to be possibleunder this item.
7

TABLE 1.SUPPLIES OF FOOD, TEXTILES, AND FOREST PRODUCTS AVAILABLE FOR CONSUMPTION IN1947/48 AND 1948/49
Area
Far EastEurope (excl. U.S.S.R.)United States and CanadaLatin AmericaAustralia and New ZealandAfrica and Near EastWORLD AVERAGE (excl.
U.S.S.R.)
Food'I
Textiles'1947/48' 1948/49'1 1947/481 I 1948/49
1934-38 -= 100
98 102
8
7191
16511710896
6895
15512013499
103 101
Forest products'1947/48 I 1948/49
( 1937 100. )
6870
144136102)02
6771
141139109103
105 107
'Based on data for 52 countries covering 77 percent of the world's population. For description ofmethods of calculation of the food index numbers, see Appendix to the Sta.te of Food and Agriculture, 194S.
"Index numbers on tonnage basis; including supplies of cotton, wool, and rayon textiles available fordomestic consumption.
'Based on total roundwood supplies.4Revised figures in Tables 1-4.'Preliminary figures in Tables 1-4.°Base period is 1935-39 for U.S. and Canada food indices in Tables 1-4.',Base period in Australia is 1936 137-1938/39 and in New Zealand 1935-39 for food indices in
Tables 1-4.'Includes only Algeria, Egypt, French Morocco, Madagascar, Tunisia, Turkey, and Union of South
Africa for food indices in Tables 1-4.
TABLE 2.SUPPLIES OF FOOD, TEXTILES, AND FOREST PRODUCTS AVAILABLE PER CAPUT IN 1947/48AND 1948/49
1Based on data for 52 countries coverit g 77 percent of the world's population. For description ofmethods of calculation of the food index numbers, see Appendix to the State of Food and Agriculture, 1948.
"Index numbers on tonnage basis; including supplies of cotton, wool, and rayon textiles available fordomestic consumption.
'Based on total roundwood supplies."Revised figures in Tables 1-4.'Preliminary figures in Tables 1-4."Base period is 1935-39 for U.S. and Canada food indices in Tables 1-4."'Base period in Australia is 1936/37-1938/39 and in New Zealand 1935-39 for food indices in
Tables 1-4.'Includes only Algeria, Egypt, French Morocco, Madagascar, Tunisia, Turkey, and Union of South
Africa for food indices in Tables 1-4.
Area
Food'Textiles'
Forestproducts'1947/48k 1948/49
Total CropsAnimalprod-ucts
Total CropsAnimalprod-ucts
1947/48k 1948/49 1947/48 1948/49
1934-38 =-- 100 (1937 =1 100)
Far East 85 87 83 88 90 86 72 69 62 61Europe (excl.
U.S.S.R.) 78 90 68 84 98 72 92 95 68 69United States and
Canada ______ 0110 '103 '115 '109 '103 1113 147 136 128 125Latin America 100 112 93 102 115 93 97 97 110 109Australia and
New Zealand 297 '104 295 797 "105 795 100 120 89 96Africa and Near
East 88 687 s89 895 899 590 88 88 89 90WORLD AVERAGE
(excl. U.S.S.R.) 89 90 86 92 94 89 94 92 81 83
9382
'124123
'110'106
9689
124127'111'116

PRODUCTIONFood production showed great improvement in 1948/49 in every region except
Australia and New Zealand.2 Europe, Africa, and North America, on account of theirexcellent 1948 harvests, showed the biggest advance over the previous season.
The outlook for the 1949 cereal harvest in the United States and Canada suggestsa drop of some 10 percent in crop production (estimated as of 1 August) not entirelycompensated by expected increases in output of meat, milk, poultry, and eggs in1949/50. In Europe, the 1949 cereal harvests may average some 5 percent below1948, good crops in Northern and Eastern Europe being counterbalanced by not suchgood ones in Western and Southern Europe. Potatoes may be considerably belowlast year, but sugar outturn may be above. Supplies of livestock products shoulddefinitely- increase, reflecting the good feed supplies of the past twelve months. In theFar East, fragmentary reports indicate fair to satisfactory crop conditions, with im-provements over 1948 in India, Pakistan, and Thailand, but in the Philippines therewas some loss of rice production, caused by army worm infestation. In the SouthernHemisphere, winter sowings in Australia and Argentina are believed to be larger thanin 1948, but South African sowings have been adversely affected by drought.
Fiber production in 1943/49 showed a big improvement over the previous yearexcept in the Far East, and apart from that region all others now have a larger pro-duction than prewar. This expansion is expected to continue in 1949/50 in mostregions.
For forest products, there has been no great change during the past year, a slightimprovement in Europe being offset by a fall in production in North America. Europeand the Far East are still producing less than before the war.
The volume of food and fiber production is no longer influenced so strongly asformerly by changes in market prices. A large number of governments noNv guaranteeprices to farmers through a variety of procedures, all of which give the farmer agreater degree of security, thereby stimulating or stabilizing production. Some pricesare fixed for as much as three or four years ahead, some only for the next season,some vary automatically according to a formula relating them to the prices of otherproducts. As shown in Chapter 2, agricultural prices in a few countries have continuedto increase during the past year, in many they are stabilized at a favorable level, whilein some they have trended downward.
If governmental programs can stimulate agricultural production, a lack of effec-tive government can have the opposite effect. In the Far East, for example, politicaldisturbances continue to hinder agricultural recovery and progress. In Burma, China,Indo-China, and Indonesia, political and military conflicts have tended to reduce out-put in many areas to what the farmers need for themselves. They have reduced theirmarketing to the city or for export, either because transportation has become disruptedor because, as a consequence of inflation, they no longer care to hold money. Otherareas where agriculture is similarly affected by political disturbances are the Near Eastand Greece.
'The index number of production includes quantities produced for seed and industrial uses andcannot therefore be compared, even for the whole world (where exports and imports cancel eachother), with the index number of available supplies. Since the index number excludes feed (toavoid double counting) it follows that an exceptionally good harvest of feed crops does not showup in the index number until it appears as additional meat, milk, and eggs, which may be one oreven two years later. This, for example, will occur with respect to the record United States maizecrop of 1948.
9

Chart 1.Production, Exports, and Imports of Food by Regions(Measured in Prewar "World" Prices)
Thousand million gold francs45
40
30
20
10
1
234
.
'/7 rti, rf, "/.1 / VAIAr 'Ì Ar A_ A - ...f I' AA
PRODUCTIONDISAPPEARANCE
FAO Chart Ho. 297
FAR EAST EUROPE U.S.A. & LATINCANADA AMERICA
10
OCEANIA AFRICA NEAR
EAST

Availability of farm requisites has an important influence upon the level of pro-duction, at least in the agriculturally advanced countries. During the last four yearssuppliers have been expanding output in an endeavor to catch up with a keen demand.Fertilizer production and consumption have surpassed prewar levels almost every-where and are still rising. The supply of pesticides certainly- is more effective intoxicity than before the war. The supply of farm machinery, although still of interestpredominantly in North America and Europe, is far above prewar and still rising. Fora more detailed discussion of the situation regarding these requisites, see Appendix E.
Chart 1 shows the level of production, exports, and imports in each of the mainregions in 1948/49 compared with prewar. It indicates strikingly the overwhelmingimportance of domestic production compared with international trade in determiningconsumption levels. In the Far East and Europe, for example, the fall in productionrather than any change in the volume of international trade mainly accounts for thefall in consumption. In North America, the increase in production has been sufficientto provide both for a larger consumption and for a larger export. In the remainingthree regions consumption levels depend entirely upon the volume of production andexports, since food imports are negligible.
INTERNATIONAL TRADEFood exports from all regions except Latin America were higher in 1948/49
than in the previous year. Exports from the countries of the Far East and from Eu-rope, principally Eastern Europe, were still very low by comparison with prewar.
Food imports in 1948/49 likewise surpassed those of 1947/48 in all regionsexcept Latin America, where import restrictions were introduced to conserve dwin-dling reserves of dollars and of gold. Imports of food into Australia, New Zealand,Africa, and the Near East show a large proportionate increase, but in absolute termsthe quantities are negligible.
A number of elements in the world trade in foodstuffs remain remarkably con-stant. For example, Europe's net excess of food imports over food exports remains atalmost exactly the prewar levelvalued at constant (prewar) prices. Likewise thelevel of exports of Latin America and of Australia and New Zealand remains roughlyunchanged. Meantime, there has been a substantial fall in exports from the Far East
TABLE 3,--VOLUME 01, PRODUCTION OF FOOD, FIBERS, ANO FOREST PRODUCTS, 1947/48 AND 1948/49
Area
1934-38 ==.- 100
Ear East _______ ___________ ______ 92 95 69 62Europe (excl. U.S.S.R.) 79 89 95 119United States and Canada 128 138 105 129Latin America 114 118 107 120Australia and New Zealand 109 106 106 112Africa and Near East 101 116 85 107
Womm AVERAGE (CX6).U.S.S.R.) ___________ _ _____ 97 104 87 97
'See footnote 1 to Table I.2Index numbers on tonnage basis; i eludes cotton, wool (clean basis), Taw silk, rayon, nylon, fiar,
hemp, :lute, abaca, sisal, and henequen."Lumber and wood pulp only. Index numbers constructed by giving a standard of lumber (4.672m2)
the same weight as a metric ton of wood pulp.4in many areas production in 1937 was definitely higher than the 1934-38 average. 1937 is used as a
base since it is the year for which the most complete data are available.
Forest products'1948 1949
( 1937 =- 1004 )
95 9469 72
145 139191 190183 184158 158
11
1947/48 1 1948/49 1947/48 1 1948/49/Food' Fibers'

TABLE 4.VoLume OF INTERNATIONAL TRADE IN FOOD, FIBEIIS, AND FOREST PRODUCTS, 1947/48 AND1918/49
WORLD AVERAGE
Area
Area
Far EastEurope (excl. U.S.S.R.)United States and Canada.Latin AmericaAustralia and New ZealandAfricaNear East
Far EastEurope (excl. U.S.S.R.) _United States and CanadaLatin AmericaAustralia and New Zealand_Africa and Near EastWORLD AVERAGE (excl.
(excl. U.S.S.R.)
Fibers'Exports I Imports
1947/4811948/491 1947/4811948/49
52 35121 19044 91
118 100123 126102 116
73 80
12
Food'Exports Imports
1947/48 1 1948/49 1947/48 1 1948/49
( 1934-38 = 100 )
228 235 61 7340 53 80 85
274 290 90 99102 102 127 111
99 109 128 150872 '89 98 12570 78 131 15989 98 81 87
Forest products'Exports I
Imports1947 1 1948 I 1947 1 1948
( 1934-38 = 100 ) ( 1937 -= 100
47 52 4 4 26 2069 81 50 55 47 50
148 140 133 124 119 122133 183 145 143 104 86219 175 31 35 56 62340 440 70 70 132 138
73 81 79 79 71 72
iThe index number for world exports is unsatisfactory since the prewar figure on which it is based isbelieved to omit the exports of a number of small territories, the inclusion of which would reduce the indicesfor the world average in 1947/48 and 1948/49 by some 10 points and make them more comparable withthe index numbers of imports. The latter are a more reliable guide to the change in the quantum of inter-national trade in foodstuffs.
2Food index numbers also include exports and imports of grains, sugar, and vegetable oils for countrieaother than those covered by food balance sheets.
3Index numbers also include exports and imports of grains, sugar, citrus fruit, and fats and oils forcountries other than those covered by food balance sheets.
*Index numbers on tonnage basis: Includes wool (clean basis), cotton, raw silk, rayon, jute, alpaca,sisal, and henequen.
',Lumber and wood pulp only. Index numbers constructed by giving a standard of lumber (4.672m3)the panic weight as a metric ton of wood pulp.
and Africa (and the U.S.S.R.), which has been replaced in large part by the expan-sion of exports from North America.
Fiber exports showed a considerable recovery in 1948/49, especially those ofcotton from the United States. Exports from the Far Eastern region fell somewhat,mainly because of decreased shipments of cotton and jute from the subcontinent ofIndia. Fiber imports increased everywhere except in North America and Oceania, themost important quantitative gains being in Europe. Further expansion in imports isexpected in Europe, Asia, and Africa.
Forest products exports from North America declined slightly and increasedfrom European countries, the former being caused by a sharp reduction in Europe'simports from North America on account of the dollar shortage. Imports of forestproducts into North American and European countries rose slightly. In 1949 the ex-port trends of 1948 appear to be continuing, but there is a marked drop in UnitedStates purchases from Scandinavia and Canada.

RECENT CHANGES IN UNITED STATES TRADE
Because the special difficulties which have developed in international trade inrecent months are largely- related to changes in the volume and direction of UnitedStates trade and particularly to a fall in imports of certain primary products, a briefsummary of the data is given in accompanying tables.
An increase in such items as sugar and coffee counterbalanced the decrease invegetable oils and cocoa. During this period the total United States import of crudeand manufactured foodstuffs amounted in value to $1,024 million, compared with$975 million in the corresponding period of the previous year.
United States imports of all crude materials declined from a value of $1,084 mil-lion in the first five months of 1948 to $956 million in the same period of 1949. Thechief elements in this decline were svool, mainly from Argentina and Uruguay but alsofrom Australia and New Zealand, and paper products, mainly from Canada andScandinavia.
Imports from Europe. Africa, and Oceania declined as between the two periods,but the European decline was largely owing to decreases from Spain and the EasternEuropean countries. United States imports from the ERP countries were higher, aswere imports from Asia. Among the ERP countries, the United States took morefrom Belgium, Netherlands, and Norway but less from the United Kingdom, Sweden,and Italy than in the corresponding period of 1948.
ECA appropriations now represent the major part of United States governmentforeign aid. Some two-thirds of the authorizations were spent in the United States.During the fifteen months from 3 April 1948 to 1 July 1949, ECA authorized an
expenditure of $5,900 million, of which $2,700 million was for food and agriculturalitems, $2,700 million for industrial goods. and $500 million for freight costs. Theprincipal food and agricultural items are shown in Table 7.
Through this aid the flow of food and agricultural products to Europe has beenmaintained during a difficult period when a sudden diminution in the supply wouldhave had far-reaching consequences. At the same time, the position of most import-ing countries not benefiting from U. S. foreign aid has remained difficult. One conse-quence of the ECA program has been to maintain food export prices at comparativelyhigh levels.
United States exports, which had been diminishing gradually during 1948, rosesharply in the first half of 1949, while imports declined to the lowest level since 1947.
The balance of visible trade was $700 million larger than in the previous sixmonths. The last half of 1948 appears in retrospect as an exceptional period, butmany soft-currency countries took it as normal in framing their plans. Since UnitedStates government aid is not sufficient to finance a balance of the present magnitudeand since other countries have few reserves left which would enable them to cover anysubstantial part by transfers of gold or other capital, steps must be taken to narrowthe gap. Restrictions on imports from the United States will affect sugar, tobacco,cotton, forest products, and, to a lesser extent, wheat.
13

TABLE 5.UNITED STATES IMPORTS OF SELECTED FOODSTUFFSAND TOBACCO FOR CONSUMPTION
SOUROE : U. S. Department of Commerce, Foreign. Cotntnerce TVeekly.U. S. Department of Agriculture, Foreign Agricultural Trade.
TABLE 6.UNITED STATES IMPORTS OF SELECTED CRUDE MATERIALS
SouncrE: ECA Press Release, 13 July 1949.
TABLE 8.UNITED STATES VISIBLE TRADE, 1948 AND JANUARY-JUNE1949
Exports (incl. re-exports)General importsBALANCE
14
6,5443,520
+3,024
SOURCE : U. S. Department of Commerce, Foreign Convuterce Weekly.
TABLE 7.ECA-AuTHottizED EXPENDITURES ON SELECTED PRODUCTS:APRIL 1948-Juts 1949
1948 1949Jan.-June 1 July-Dec. Jan.-June
(-- Million U. S. dollars
6,0923,603
+2,489
6,5963,388
+3,208
SOITRCD: U. S. Department of Commerce, Foreign Commerce Weekly.
ItemJanuary -June
1948 1949
( _ Million U. S. dollars _)
Coffee 354 367Cocoa 87 68Sugar 156 210Vegetable oils 130 74Fish 49 53Fruits, vegetables, and nuts 115 105Tobacco 39 37TOTAL 930 914
ItemJanuary -June
1948 I 1949
L... Million U. S. dollars
Hides and skins 68 35Wool 179 97Jute burlaps 63 56Paper and paper products 378 332Crude rubber 143 130Tin____________ _________________ 78 107Diamonds 27 16TOTAL 936 773
(___ Milliorz U. S. dollars )
Bread grains 958Fats and oils 254Sugar 157Coarse grains 152Meat and dairy products 221Cotton 542Tobacco 142
TRADE AGREEMENTS
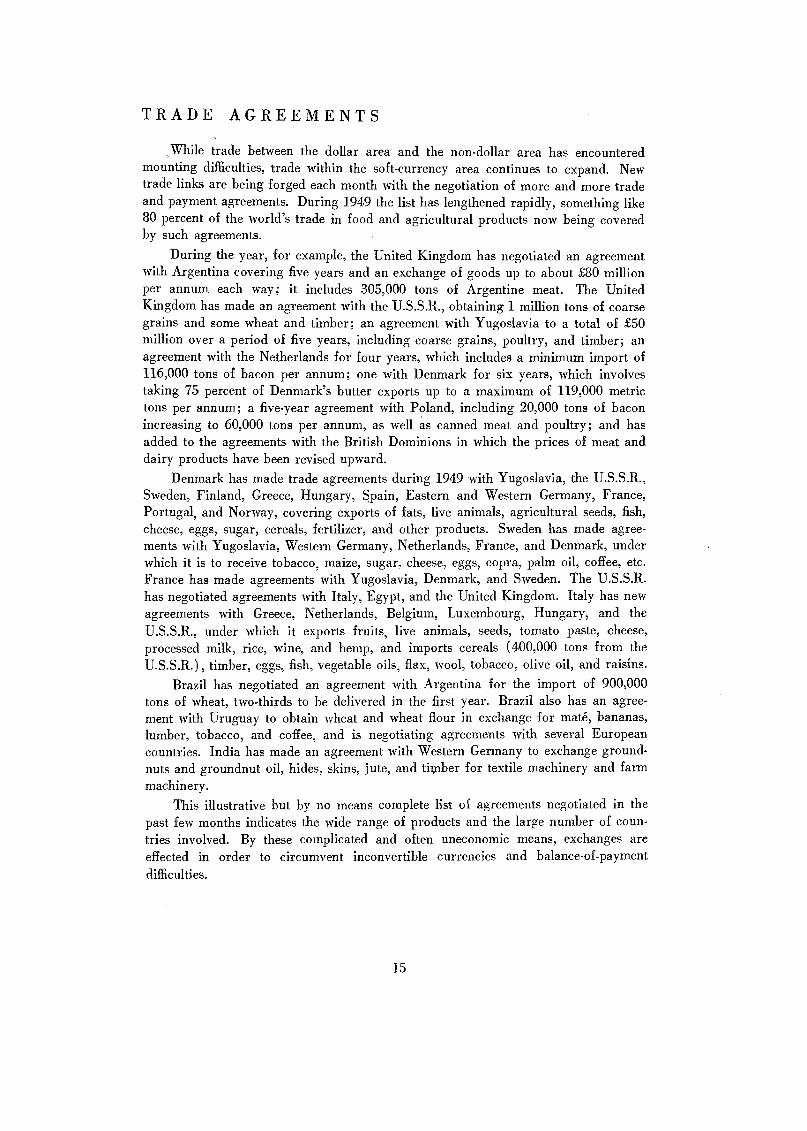
While trade between the dollar area and the non-dollar area has encounteredmounting difficulties, trade within the soft-currency area continues to expand. Newtrade links are being forged each month with the negotiation of more and more tradeand payment agreements. During 1949 the list has lengthened rapidly, something like80 percent of the world's trade in food and agricultural products now being coveredby such agreements.
During the year, for example, the United Kingdom has negotiated an agreementwith Argentina covering five years and an exchange of goods up to about £80 millionper annum each way; it includes 305,000 tons of Argentine meat. The UnitedKingdom has made an agreement with the U.S.S.R., obtaining 1 million tons of coarsegrains and some wheat and timber; an agreement with Yugoslavia to a total of £50million over a period of five years, including coarse grains, poultry, and timber; anagreement with the Netherlands for four years, which includes a minimum import of116,000 tons of bacon per annum; one with Denmark for six years, which involvestaking 75 percent of Denmark's butter exports up to a maximum of 119,000 metrictons per annum; a five-year agreement with Poland, including 20,000 tons of baconincreasing to 60,000 tons per annum, as well as canned meat and poultry; and hasadded to the agreements with the British Dominions in which the prices of meat anddairy products have been revised upward.
Denmark has made trade agreements during 1949 with Yugoslavia, the U.S.S.R.,Sweden, Finland, Greece, Hungary, Spain, Eastern and Western Germany, France,Portugal, and Norway, covering exports of fats, live animals, agricultural seeds, fish,cheese, eggs, sugar, cereals, fertilizer, and other products. Sweden has made agree-ments with Yugoslavia, Western Germany, Netherlands, France, and Denrnark, underwhich it is to receive tobacco, maize, sugar, cheese, eggs, copra, palm oil, coffee, etc.France has made agreements with Yugoslavia, Denmark, and Sweden. The U.S.S.R.has negotiated agreements with Italy, Egypt, and the United Kingdom. Italy has newagreements with Greece, Netherlands, Belgium, Luxembourg, Hungary, and theU.S.S.R., under which it exports fruits, live animals, seeds, tomato paste, cheese,processed milk, rice, wine, and hemp, and imports cereals (400,000 tons from theU.S.S.R.), timber, eggs, fish, vegetable oils, flax, wool, tobacco, olive oil, and raisins.
Brazil has negotiated an agreement with Argentina for the import of 900,000tons of wheat, two-thirds to be delivered in the first year. Brazil also has an agree.ment with Uruguay to obtain wheat and wheat flour in exchange for maté, bananas,lumber, tobacco, and coffee, and is negotiating agreements with several Europeancountries. India has made an agreement with Western Germany to exchange ground.nuts and groundnut oil, hides. skins, jute, and timber for textile machinery and farmmachinery.
This illustrative but by no means complete list of agreements negotiated in thepast few months indicates the wide range of products and the large number of coun-tries involved. By these complicated and often uneconomic means, exchanges areeffected in order to circumvent inconvertible currencies and balance-of-paymentdifficulties.
15

2. -)rices and Purchasing Power
PRICES AND THE TERMS OF TRADE
A CLEAR PICTURE of current price movements in agricultural products is difficult toput together. There are a fe,,v items for which market quotations still exist, mainly inthe United States; Table 9 shows recent trends in some of these products.
Prices of most of the staple foodstuffs, several of which fell heavily in the latterhalf of 1948, have not shown any further appreciable decline in the first half of 1949.However, cocoa and rubber prices did continue to drop, as did those of soybean oiland some other products not mentioned in this brief table.
In most other parts of the world, because trade is carried on under a large num-ber of bilateral agreements, and because of currency difficulties, a single product maybe sold at different prices in different markets. For example. in 1948 the UnitedKingdom was paying $80 per metric ton for wheat c.i.f. Callada, $119 to the UnitedStates, $123 to Australia, and $140 to Argentina. For eggs in U.S. cents per dozen,U.K. was paying Australia 44, Canada 56, Denmark 59. For meat and bacon Canadawas being paid twice as much as Argentina. For butter and cheese U.K. was payingDenmark 50 percent and 100 percent more, respectively, than Australia and NewZealand.' Further details of these prices are given in Appendix A-5.
It is illusory to speak any more of "the price" of a particular product, since thereis no free market, or, if there is one, it usually deals in a comparatively small pro-portion of the quantity traded internationally. Even larger differences can be foundbetween the internal prices for any particular product, owing to the fact that almostall governmens have price-support programs covering a range of agricultural productswhich they use as an instrument of national policy to encourage or discourage par-ticular branches of production.
Another feature which complicates the price picture is that, during the past tenyears, prices of some products have risen much more steeply than others. Thus, com-paring 1948 with prewar, the following commodities have increased threefold orfourfold in price: cocoa, coffee, linseed oil, copra, rice, cotton, wool, jute, hard fibers.By contrast, the following have increased a little more or less than twofold: cereals,sugar, meat, dairy products, lard, eggs, rubber, and bananas. Although, for any oneproduct, the ratio of the postwar to the prewar price differs considerably from onemarket to another, it appears generally that prices of tropical products have increasedmuch more than those of temperate zone products.
'United Nations, Economic Survey of Europe in 1948 (Geneva: 1949).
16

TABLE 9.AVERAGE PRICE QUOTATIONS FOR SELECTED FOODSTUFFS AND RAW MATERIALS IN THEUNITED STATES
Commodity
WheatNo. 1 Dark North-ern Spring (Minneapolis)
Maize No. 3 Yellow (Chi-cago)
Sugar-96 deg. centrifugal(New York)
Linseed oil (New York)CoffeeSantos No. 4
(New York)CocoaAccra (New York)Cotton Middling 15/16"
average for 10 marketsWool Raw Territory 64's,
70's, 80's scoured (Boston)TimberDouglas fir, dimen-
sion No. 1 Common 2" x4" x 16"
RubberSmoked sheets(New York)
1947 I 1948 I 1949Jan. I Jan. I July I Jan. I Feb. March I Apr. I May I June
1938 = 100
234 333 253
242 493 389
203 200 196402 371 320
345 341 344493 830 847
354 391 378
164 178 210
238 308 341
168 149 166
SOURCE: U. S. Department of Com erce, Surrey of Current Business.
These differences in the price trends of agricultural products have had a greatdeal of influence on the prosperity of the exporting countries. A country which de-pends on the export of a product that has risen steeply in price is obviously in a muchbetter position and has better terms of trade than one whose principal exports haverisen comparatively little. For example, the export price indices for Brazil, Ecuador,most of Central America and West Africa in 1947/48 were over 300 (1937 =- 100),whereas the export price indices of Bolivia, Chile, Cuba, Jamaica, Indonesia, andMalaya, to quote but a feNv examples, were less than double prewar.
Another factor influencing the terms of trade has been the type of manufacturesimported. Here again, there has been considerable variation in the price increasesrecorded for different products; textiles, copper manufactures, industrial chemicalshave risen most of all. The high price of textiles has been particularly adverse to theterms of trade of underdeveloped countries, for most of which textiles are a majoritem of import. If the price of textiles had risen during the past ten years by nohigher percentage than the prices of the exports of the underdeveloped countries, theycould have financed the import of 33 percent more capital goods in 1947 than theyactually imported.2 (Since 1947, textiles prices have declined but still are higherrelative to prewar than many other manufactures.)
Broadly speaking, countries which exported crude materials were, in 1947 and1948, in a slightly improved position for the purchase of, for example, United Statesfinished and semifinished manufactures, whereas countries which exported crudefoodstuffs (prices of which have risen much more than those of crude materials) hadmuch more favorable terms of trade in relation to United States manufactures. Out of44 countries studied by the United Nations secretariat, 20 had improved their termsof trade as compared with prewar, for 6 the result was inconclusive, and for 18 theterms of trade had worsened. It should be added that the 20 included some of the
2United Nations, Postwar Price Relations in Trade Between Underdeveloped and IndustrializedCountries, February 1949.
17
247 246 247 246 245 249
258 228 238 247 243 243
197 194 197 194 201 205316 316 316 316 316 302
347 344 340 330 347 349507 395 352 378 361 356
362 362 363 366 365 364
256 256 256 256 254 254
301 308 310 310 310 307
132 127 131 127 123 113

larger countries, such as Argentina and Brazil, whereas the 18 included mainly smallcountries and small colonial territories. While these calculations are now out of date,they do illustrate the danger of making generalizations about movements in terms oftrade. Experience of different countries has been highly diverse.
Taking the underdeveloped countries as a whole, it has been calculated in theUN survey that the terms of trade since the war, although better than just before thewar, were nevertheless more unfavorable than in 1913. Indeed, if the ratio were nowas favorable to them as it was before World War I, their receipts from exports, whichnow are calculated to be about $15,000 million, would be of the order of $17,500 to$18,000 million. The long-term deterioration in trade adds up to an amount equiva-lent to a very substantial volume of foreign investment.
The terms of trade of the United Kingdom, other European countries, and theUnited States can be seen in Table 10.
TABLE M.TERMS OF TRADE (UNIT VALUES OF IMPORTS DIVIDEDBY UNIT VALUES OF EXPORTS)
SOURCE : United Nations, BC0710MiC Survey of Europe in 1948(Geneva, 1949). United States Foreign Commerce Weekly. LondonEconomice, 6 August 1949.
European countries other than the United Kingdom sold their exports for somuch higher prices than the United Kingdom that although they also paid higherprices for their imports, their terms of trade were comparatively favorable and be-came worse than prewar only in the second half of 1948. Since United States exportprices of manufactures have changed little while export prices of foodstuffs and rawmaterials from the United States and other sources have fallen significantly during thefirst half of 1949, it follows that the terms of trade of European countries importingpredominantly food and raw materials may have improved in recent months, whilethe terms for countries importing predominantly manufactures (machinery andvehicles) may have deteriorated. (No 1949 data are yet available on prices of Euro-pean exports.)
The United Kingdom has bought its imports at relatively lower prices than othercountries, partly because these imports consist in large part of commodities whichhave gone up relatively little in price and partly because of long-term contracts. Yet,because the prices of U.K.'s exports are low in relation to those of continental Europe,its terms of trade have been much more unfavorable. A slight improvement in Mayand June 1949 because of a dip in the prices of food imports is believed to be onlytemporary.
United States terms of trade slowly continue to Nvorsen. Export prices of food-stuffs and raw materials have fallen considerably in recent -months while prices ofimported raw materials have risen slightly.
Piecing to2ether the story from these various countries, it appears that as com-pared with prewar the terms of trade have moved against the majority of advancedcountries (United States and Europe) and hence in favor of the underdeveloped
18
Region 1947 1948 I 1949
1938 100
United Kingdom 116 117 (Jan.-June) 120Other Europe 89 104Total Europe 102 110
(. 1936-33 = 100 )
United States _..... 112 117 (Jan.-May) 120

countries, though there are great differences within this latter group. The terms oftrade should continue favorable to the majority of underdeveloped countries thatexport food and raw materials principally to Europe because Europe's demand forsupplies from soft-currency countries will remain keen. By contrast, the terms maydeteriorate somewhat for those whose primary products are marketed principally inthe United States.
PRICES OF FARM PRODUCTS ANDPURCHASING POWER OF FARM INCOMES
For the world as a whole, the past year marks a change in the general upwardtrend of farm prices and the rise in farm prosperity which persisted during the warand the first postwar years. In general, this change has taken the form of a levelingoff rather than a precipitous decline. Such downward movement as can be noted hasoccurred mainly in the dollar area and in European countries experiencing deflation.It has been offset by the larger volume of farm produce sold in 1948/49. The positionof farmers relative to other sectors of the population remains much more favorable inmost countries than before the war.
EUROPEThe favorable harvest of 1948 might have been expected to bring about some de-
cline in the prices of agricultural products. In some countries this has happened. Inmany others, however, government price-support programs for farm products tookforms which guaranteed certain prices, irrespective of the quantities marketed. In afew countries agricultural prices were even adjusted uPward in 194.8/49 because ofincreases in production costs. Owing to the good harvest, farmers' gross income in1948/49 reached a bigh level even in countries where agricultural prices declined.
During the war, agricultural prices rose much more steeply than those of mostmanufactured products and this differential was maintained throughout the postwarperiod of acute food shortage. During the past twelve months the differential has be-gun to narrow somewhat in certain countries; only in Norway has it widened.
Farm workers' wages remain high. In twelve countries for which information isavailable, the gap between farm wages and industrial wages has narrowed consider-ably during and since the war, especially in Norway and Denmark." During the pastyear agricultural wages have been adjusted upwards in a few countries.
The purchasing power of farm products and farm..wages did not vary appreciablyin 1948/49 from the previous year. Some decline may be noted in four countries,some increase in two or three, and little material change in the remainder.1
European countries may- be classified into groups as regards price movements--those with relatively free economies and those with government price supports andcontrols exercised to a g,reater or lesser degree.
The first group of countries includes Finland, Hungary, Austria, Italy, France,and Belgium, in which an inflationary situation persisted until a year ago. A moreample supply of farm products, following- the 1948 bat-vest, brought about a declinein agricultural prices in all of these countries (more sharply in livestock products thanin crops) although in some the price fall was temporarily delayed by derationing and
3[Inited Nations, Economic Survey ol Europe in 1948, page 36.4Statistical data on this subject is scanty, Indices for prices paid by farmers and prices re-
ceived by farmers exist for only three European countries, prices received by farmers and pricesof finished goods arc available in another three and, in the rest, only the index of agriculturalprices and (he index of general wholesale prices.
19

Chart 2.Ratio of Prices Received to Prices Paid by Farmers(Prewar =: 1001)
120 140 -
-noFrance
130
100 120
90 110
150
140
130
120
1101947
Denmark
Switzerland -
1948 1949
20
1947 1948 1949
Mexico1
Costa Rica
1947 1948 1949
90 110
1Prewar is 1937 or 1937/38 except in France, 3reland, Italy, and Venezuela (1938); Norway1947 1948 1949 1947 1948 1949
(1038/39); Mexico and Switzerland (1939). For the following countries indices are available of price:3received by farmers: Denmark. Norway. Netherlands, Switzerland, U.K., Callada, U.S.A., Union of SouthAfrica, for ll/e rest, indices of agricultural wholesale prices. For tho following countries indices areavailable of prices paid by farmers: Norway, Switzerland, Canada, and U.S.A.; for the following, indicesof finished goods: Belgium, Denmark, Finland, Hungary, Ireland, Netherlands, and U.K.; for the rest, onlyindices of general wholesale prices.
4.411.1
ttt,
Union ofS. Africa
-. \./.-\,..t/
///
//,'.-Australia
,
--- ...-
..
r--..----- Ireland
.....----..,._ CzAchoslovakia...- ,
--Netherlandsi- s-,\
r
1947 1948 1949
801947 1948 1949
1947 1948 1949
-Venezuela
.0*
Chile
947 1948 1949
1947 1948 1949
150
140
130
120
110
100
130
120
110
100
90
80
140
130
120
110
100
130
120
130
120
110
100
160
150
140
130
120
110
100
110
100
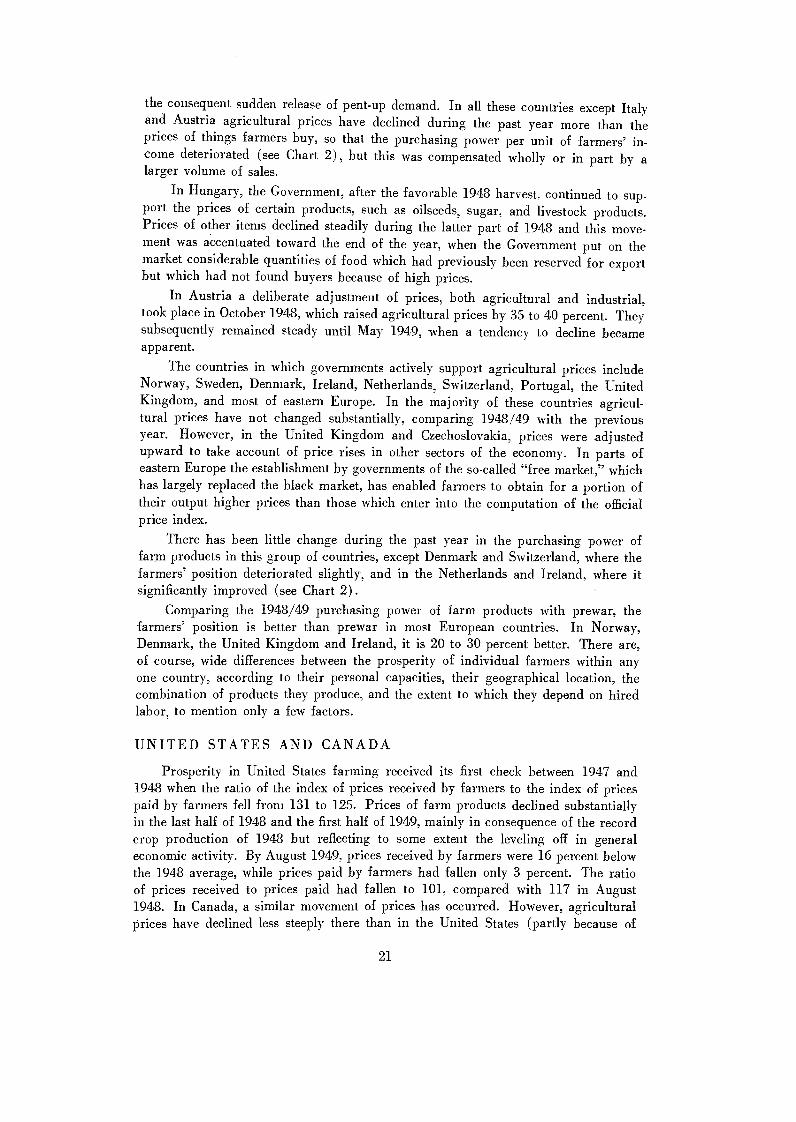
the consequent sudden release of pent-up demand. In all these countries except Italyand Austria agricultural prices have declined during the past year more than theprices of things farmers buy, so that the purchasing power per unit of farmers' in-come deteriorated (see Chart 2), but this was compensated wholly or in part by alarger volume of sales.
In Hungary, the Govermnent, after the favorable 1948 harvest, continued to sup-port the prices of certain products, such as oilseeds, sugar, and livestock products.Prices of other items declined steadily during the latter part of 1948 and this move-ment was accentuated toward the end of the year, when the Government put on themarket considerable quantities of food which had previously been reserved for exportbut which had not found buyers because of high prices.
In Austria a deliberate adjustment of prices, both agricultural and industrial,took place in October 1948, which raised agricultural prices by 35 to 40 percent. Theysubsequently remained steady until May 1949, when a tendency to decline becameapparent.
The countries in which governments actively support agricultural prices includeNorway, Sweden, Denmark, Ireland, Netherlands, Switzerland, Portugal, the UnitedKingdom, and most of eastern Europe. In the majority of these countries agricul-tural prices have not changed substantially. comparing 1948/49 with the previousyear. However, in the United Kingdom and Czechoslovakia, prices were adjustedupward to take account of price rises in other sectors of the economy. In parts ofeastern Europe the establishment by governments of the so-called "free market," whichhas largely replaced the black market, has enabled farmers to obtain for a portion oftheir output higher prices than those which enter into the computation of the officialprice index.
There has been little change during the past year in the purchasing power offarm products in this group of countries, except Denmark and Switzerland, where thefarmers' position deteriorated slightly, and in the Netherlands and Ireland, where itsignificantly improved (see Chart 2).
Comparing the 1948/49 purchasing power of farm products with prewar, thefarmers' position is better than prewar in most European countries. In Norway,Denmark, the United Kingdom and Ireland, it is 20 to 30 percent better. There are,of course, wide differences between the prosperity of individual farmers within anyone country, according to their personal capacities, their geographical location, thecombination of products they produce, and the extent to which they depend on hiredlabor, to mention only a few factors.
UNITED STATES AND CANADA
Prosperity in United States farming received its first check between 1947 and1948 when the ratio of the index of prices received by farmers to the index of pricespaid by farmers fell from 131 to 125. Prices of farm products declined substantiallyin the last half of 1948 and the first half of 1949, mainly in consequence of the recordcrop production of 1948 but reflecting to some extent the leveling off in generaleconomic activity. By August 1949, prices received by farmers were 16 percent belowthe 1948 average, while prices paid by farmers had fallen only 3 percent. The ratioof prices received to prices paid had fallen to 101, compared with 117 in August1948. In Canada, a similar movement of prices has occurred. However, agriculturalprices have declined less steeply there than in the United States (partly because of
21

TABLE H.-PRICES OF FARM PRODUCTS'(1937 = 100)
22
1For the following countries an index of prices received by farmers is available: Denmark, Norway,Netherlands, Switzerland, United Kingdom, Canada, U.S.A., Union of South Africa. For the remainder, theindices of agricultural wholesale prices aro given.
2Inclu ding fod der. 81938 = 100. 4August-December.GBase: Reichsmark prices, March 1938 = 100. Divide by 1.5 to obtain schilling price index.°Lisbon. 11 July 1937-30 June 1938 = 100. 81 April 1938-31 March 1939 = 100.°August 1939 100. "Annual figures, 12 months ending 30 June of year stated.14-San José. 121939 100. 18Caracas.
Date Belgium Finland' France' Hungary Austria' Italy' Portugal°
19461947 _______
330 567 689 4506223394 878 1,159 826 2. 95. .5,45.4 219
1948 __ 445 1,215 1,713 875 462 5,492 207
1948 July 452 1,272 1,652 843 442 4,953 209Aug. 459 1,228 1,809 843 439 5,771 220Sept. 456 1,184 1,823 797 411 5,873 216Oct. ___ 428 1,146 1,883 844 552 5,877 216Nov. 445 1,117 1,889 767 556 5,906 221Dec. ____ 425 1,103 1,827 759 557 5.997 224
1949 Jan. _ 410 989 1,740 699 551 5,967 228Feb. ___ 397 971 1,637. . 553 5,851 219Mar. 375 941 1,616 . . 549 5,754 220April _ 367 919 1,583 . . 549 5,598 226May __ 366 884 1,708 . . 543 5,679 224June __ 382 913 1,548 . . 743 5,467 220
Nether- Switzer- United Czecho-Date Denmark' Norway' Sweden Ireland' lands' land' Kingdom slovakie
1946 -------------- 180 196 168 196 223 190 202 3131947 197 224 178 225 260 202 224 3221948 236 239 189 ... 274 211 245 331
1948 July 251 245 189 255 271 209 239 339Aug. 253 239 188 253 270 210 252 340Sept. 254 242 188 250 271 212 251 337Oct. 255 247 188 254 271 213 244 334Nov. 255 248 188 261 279 215 245 334Dec. 256 250 186 256 285 210 244 335
1949 Jan. 258 254 186 259 286 209 241 342Feb. 256 254 186 257 286 207 243 351Mar. 252 252 186 259 282 205 249 351April _ 252 251 188 257 283 205 262 352May 251 247 188 250 280 205 261 351June . 252 247 ... ... 271 205 262 352
Aus- South Costa Vene-Date Callada U.S.A. tralia" Africa" Chile Rican. Mexico" zuela',"
1946 168 190 130 168 239 186 288 1731947 178 227 157 198 329 207 297 2121948 211 234 211 231 377 199 289 228
1948 July 217 246 242 274 382 19] 304 236Aug. 221 239 246 275 384 192 297 230Sept. 218 237 248 272 386 191 292 230Oct. 217 226 241 259 391 185 295 224Nov. 215 221 253 260 397 190 290 221Dec. 217 219 255 262 390 190 274 214
1949 Jan. _ 215 219 255 261 388 195 269 206Feb. ....... 211 211 260 268 392 197 270 199Mar. __. 210 217 261 261 399 ... 277 202April ._ 209 212 239 255 408 294 206May 210 209 240 251 415 295 ...June ... 206 ... 255 ... . 294July 203 253 305
retroactive payments by the Canadian Wheat Board) and the purchasing power of thefarmer's dollar has deteriorated less markedly.
LATIN AMERICA
In Mexico, agricultural prices fluctuate considerably during the season and gen-erally rise considerably in the months just before the harvest. There has been nomarked trend in prices of farm products apart from this seasonal movement, but thecontinued inflation in other sectors of the economy has had the effect of reducing thepurchasing power of farmers' incomes. In Costa Rica, agricultural prices haveweakened over a long period, whereas general wholesale prices have remained steady,the result being a fall in fdrmers' purchasing power. There were signs of this trendbeing reversed from January 1949 onwards.
In Chile, agricultural prices have increased, but not enough to counteract theincrease in the prices of other goods; and the position of farmers has worsened. InVenezuela, the position of farmers has likewise worsened; all prices have been falling,but agricultural prices more rapidly than others, especially since January 1949.
Data are lacking for other Latin American countries.
SOUTHERN BRITISH DOMINIONS
In Australia and New Zealand, prices of farm products have continued to risein the past year, but, prices of other goods have also risen. Consequently, the pur-chasing power of farm incomes, which had risen steeply during thc previous twoyears, has in 1948/49 slightly declined. In the Union of South Africa, a rise in prices,both of agricultural products and of other goods, seems to have come to an end andthe improvement in the relative position of farmers has likewise halted. By May 1949the ratio between the prices of farm products and general wholesale prices haddeclined 8 percent from the 1948 average.
For other parts of Africa. for the Far East and the Near East, information onprices is not available.
In 1949/50 agricultural pikes may decline a little further where they are freeto do so. In Europe and North America the volume of output will again be largeasmall decline in crops compensated by an increase in livestock productsso that thelevel of farmers' prosperity should be reasonably well maintained.
RETAIL PRICES, CONSUMER PURCHASING POWER,AND FOOD SUBSIDIES
Retail PricesComparing the most recent data available for 1949 with those of the latter part of
1948 from all countries from which material is available, the trends in retail foodprices appear to be as shown in Table 12.
In the Far East and Europe there appears no decisive trend. Prices continue torise in many countries while falling in many others. However, compared with theposition a year earlier, some of those countries in which prices were then rising nowhave stable or falling prices. In the United States retail food prices have stabilizedafter an appreciable drop in the last half of 1948. In Canada they began to fall laterand are still falling. In most Latin American countries retail food prices continue to
23
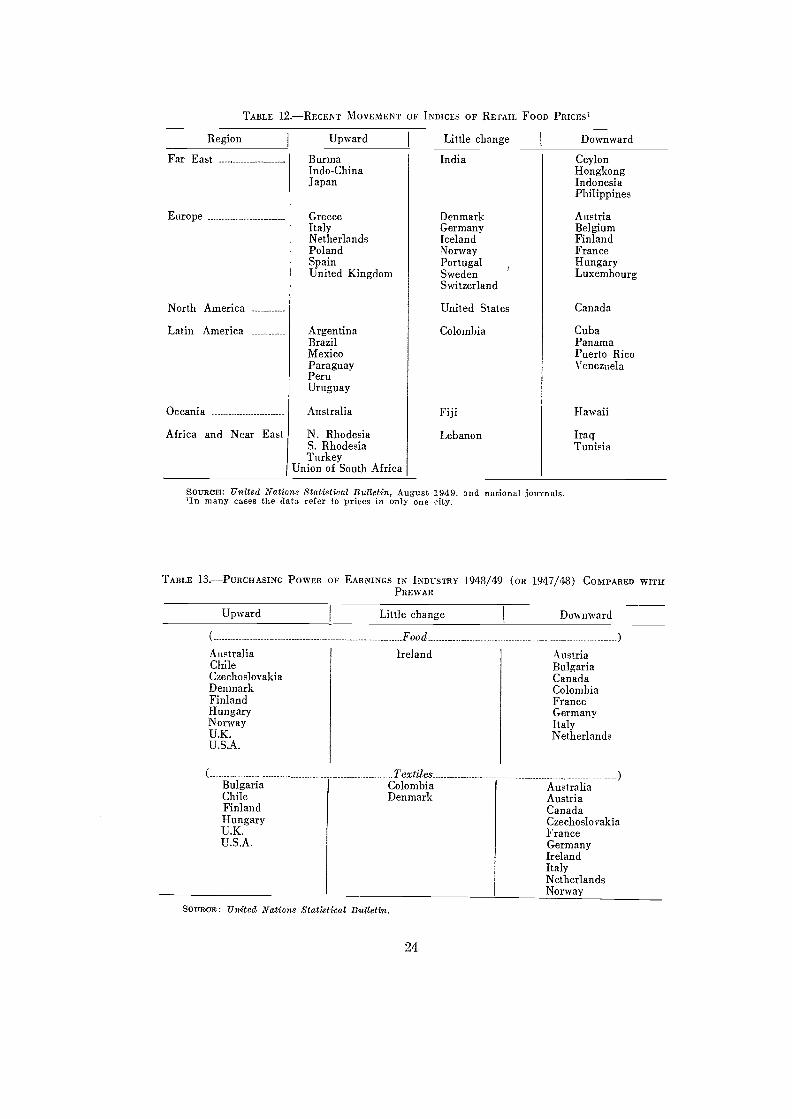
TABLE 12.RECENT MOVEMENT OF INDICES OF RETAIL FOOD PRICES'
Upward Little change Downward
Soul?,Cmg United Nations Statistical Bulletin, August 1949, and national ;journals.11n many cases the data refer to prices in only one city,
TABLE 13.PURCHASING POWER OF EARNINGS IN INDUSTRY 1948/49 (oR 1947/48) COMPARED WITHPREWAR
AustraliaChileCzechoslovakiaDenmarkFinlandHungaryNorwayU.K.U.S.A.
Sounoris United Nations Statistical Bulletin.
Food
Ireland
24
AustriaBulgariaCanadaColombiaFranceGermanyItalyNetherlands
AustraliaAustriaCanadaCzechoslovakiaFranceGermanyIrelandItalyNetherlandsNorway
RegionI
Upward Little changeI
Downward
Far East Burma India CeylonIndo-China HongkongJapan Indonesia
Philippines
Europe Greece Denmark AustriaItaly Germany BelgiumNetherlands Iceland FinlandPoland Norway FranceSpain Portugal HungaryUnited Kingdom Sweden Luxembourg
Switzerland
North America United States Canada
Latin America Argentina Colombia CubaBrazil PanamaMexico Puerto RicoParaguay VenezuelaPeruUruguay
Oceania Australia Fiji Hawaii
Africa and Near East N. Rhodesia Lebanon IraqS. Rhodesia TunisiaTurkey
Union of South Africa
TextilesBulgaria ColombiaChile DenmarkFinlandHungaryU.K.U.S.A.

move upward, reflecting the persistent inflationary situation of the region. In othercontinents no clear trend is discernible.
Data on clothing prices are more fragmentary but in most of Europe textile priceshave risen more than food prices during and since the war, and in several countriesare still rising. In most Western Hemisphere countries prices of clothing and othertextiles llave risen less than food prices and are not going up further except in Callada;in the United States they are declining.
The Purchasing Power of Earningsin order to measure the strength of consumer demand for food and clothing it
would be desirable to have not only the changes in retail prices but also a picture ofconsumer incomes. In the last section some indication of farm incomes has beengiven, but as regards earnings in industry data are 'fragmentary and are publishedwith a considerable time lag. Moreover, data on earnings do not adequately reflectchanges in the money income of the working population, but they are all that isavailable. Earnings in industry in the first half of 1949 rose in Australia, Canada,Germany, France, Ireland, and Ja.pan. Tilley changed little in Austria, Finland, Italy,Netherlands, and time United States. For no other countries are 1949 figures yet avail-able.
Comparing 194B/49 with 1947/48, the purchasing ,power of industrial workersappears to have declined in Italy, the Netherlands, and Japan. In Germany, Austria,Canada, and the United States there has been little change.
Table 13 compares purchasing power of industrial earnings in 1948/49 (in somecases 1947/48) with those of prewar in respect of food and textiles.
The position of industrial workers appears to have improved in time United King-dom, Scandinavia, and most Eastern European countries while deteriorating in Cen-tral and Western Europe. In the United States purchasing power has increased andin Canada it has fallen. Unfortunately, figures are available for very few countries inLatin America and for none in Asia or Africa.
Account should also be taken of changes in the level of industrial employment.During the past nine months unemployment has risen in the United States and in mostparts of Europe except Scandinavia and Portugal. Reduction in purchasing powercaused by unemployment is being increasingly mitigated by unemployment assistancepayments, which are more widespread and in many instances more generous thanbefore the war. Where, however, purchasing power is temporarily reduced, the effectin most cases is to reduce clothing and miscellaneous expenditures before sig-nificantcuts are made in food purchases.
The general picture for 1949 is that, in spite of some recession in some countries,consumer demand for food and clothing remains strong.
Food SubsidiesThe policy of subsidizing food prices, adopted by many countries during the war
as a measure to keep down prices of important foodstuffs in short supply, contributedgreatly toNvard a more equal distribution of the food supplies. During the first post-war years, this policy was continued and the amounts paid in subsidies increased andbecame a heavy burden on national budgets in certain countries. Table 14 shows the
25

TABLE 14.-4'0 OD SUBSIDIES IN SELECTED COUNTRIES, 1946-491
1111. MOSt cases ShOW/1 it iS not possible to separate exactlY the direct consumer subsidies and produeersubsidies. The figures include payments to producers of end food products (not feedstuiTs and farmrequisites) which indirectly work to the Bartle effect of keePing down the prices paid by consumers. Insome instances, transportation subsidies are paid for the purpose of equilibrating prices throughout thecountry%
amount of food subsidies paid and the ratio of these subsidies to total food consump-tion at current prices and government outlav in some European countries for the lastthree y-ears. The burden on national budgets was heaviest in the Netherlands and Nor-way. Translated into U.S. dollars per person the subsidies were highest in Norwayand the United Kingdom.
Some countries, such as Denmark and the Netherlands, have cut their subsidiesduring the last two years. In particular, many direct retail price subsidies have beenabolished or reduced, but production payments to farmers are being continued inmany cases. The rise in food prices caused by the dropping of subsidies was to acertain extent offset by a decline in black-market prices; but in certain countries itwas found necessary to pay special bonuses to low-income groups. In the Netherlands,for example, where in the autumn of 1948 food subsidies were reduced by more than50 percent, employers granted to workers with earnings below a certain minimum acost-of-living bonus corresponding to the rise in their cost of living through the cutin subsidies. In Italy a bread and pasta bonus paid to low-income groups is equivalentto the increase in the cost of six kilograms of bread and two kilograms of pasta permonth, caused by the abolition of the subsidy for these staple foodstuffs. Othercountries chose to relieve the burden by splitting, the market for certain commodities;Switzerland, for instance, is subsidizing the price of dark bread which is 30 percentless than the price of nonsubsidized white bread.
In Australia and New- Zealand, the increase in wages and earnings during thepostwar period made the abolition of direct food subsidies possible, while subsidies tofarmers are continued. Canada completely discontinued food subsidies in 1947.
Little information is available on subsidies for the other regions of the world.Rice and cereal importing countries in the Far East subsidize the prices of thesestaple foodstuffs. In 1948 the Indian Government paid a subsidy of £12.5 per ton on300,000 metric tons of high-cost imported rice. Japan discontinued all direct foodsubsidies in October 1947. In the Union of South Africa some reduction in foodsubsidies was made in the first half of 1949.
26
Country Millions of nationalcurrency
Percent of govern-ment outlay
Percent of totalfood consumption at
current pricesU.S. dollars per
person
Denmark1947 ___ .. 201 6.0 5.5 10.21948 322 9.5 8.7 16.01949 _ .... 253 7.4 6.6 12.5
Netherlarras1947 681 27.8 7.2 2631948 602 24.8 6.2 23.21949 .... ... 232 ... 2.3
Norway 8.81946/47 448 15.7 20.4 29.11947/48 ______ 658 25.1 30.2 42.7
United Kingdom1946/47 314 ... 15.2 25.71947/48 358 11.3 17.2 29.11948/49 400 10.8 18.0 32.3

3. Consumption and -N u trition al
Levels
INFORMATION ON FOOD coNsummoN given in The State of Food and Agriculture,1948 has been brought up to date for as many countries as possible, and one or twocountries have been added. In addition to the usual reservations concerning suchestimates, it must be emphasized that the 1948/49 figures are necessarily provisional,since the full information is not yet on hand. In examining the figures the followingpoints should also be borne in mind :
Food balance sheets are supply estimates expressed on an average per caputbasis and therefore do not give any indication of the differences in consump-tion levels of different groups within a country. The real consumption pic-ture is influenced by economic factors and food habits, and sometimes byfood management measures such as rationing and special feeding programs.
Certain commodities of relatively secondary importance in internationaltrade, and even in internal trade, for which national statistics are most likelyto be incomplete, such as vegetables and fruits, are most important from thenutritional standpoint as a source of both vitamins and minerals.
"Enrichment" policies, culinary practices, etc., influence the nutritional situa-tion in any given country, but are obviously not reflected in food balancesheets.
(4) Finally, extraneous factors such as climate, mode of living and activity, pre-vent the use of a uniform yardstick in evaluating the adequacy of a givenration on a comparative basis.
This does not, however, minimize the importance of the large differences inavailable calories and the even greater differences in the amount of animal proteinavailable per person in the countries shown in Table 15.1 Data available on the totalamount of proteins, and particularly of animal proteins, are important in themselvesand are indicative of other nutrients. An increase in the supply of animal protein isgenerally accompanied by an increase in vitamins of the B group and in minerals suchas iron.
1FAO is attempting to evolve a rational method of computing optimal caloric allowance,taking into account such factors as climate, mode of living, activity, age distribution, etc. Theseproblems were considered in detail by a committee of experts that met in Washington in September1949.
27

TABLE 15.-CHANGES IN AVERAGE CALORIE AND PROTEIN VALUE OF Ti-IR AVAILABLE FOOD SUPPLIES,1947/48 AND 1948/49
FAR EAST
Food statistics for 1948/49 are available for only a few countries, but clearlyno significant improvement has taken place in the per caput supply.
Attention is being paid to improving the nuiritive value of rice by methods suchas undermilling and parboiling or through enrichment programs. A large-scale projectwas begun in Bataan Province, Philippines, in October 1948 to determine the effectsof enriching rice with thiamine, niacin, and iron. Preliminary results indicate thatsuch rice is acceptable to the population and its consumption is leading to a decreasedincidence of infantile beri-beri as well as producing a better blood condition inchildren.
Soy products may be used to contribute vegetable protein of high nutritivevalue and other nutrients to the diet. In India a project is under way to develop
28
CountryCalories Total protein Animal protein
1947/48 i 1948/49 1947/48 I 1948/49 1947/48 I 1948/49
(Per person per day) (Grams per person per (Grams per person perday) day)
FAR EASTBurma 1,986 1,877 67.6 65.2 26.5 26.4Ceylon 1,977 1,918 55.9 51.5 14.7 13.5China (22 provinces) ...... 2,115 65.7 ... 4.5 ..India and Pakistan _____ .... 1,685 11,570 47.7 143.0 7.6 14.6Indo-China 2,039. . 47.2 4.7 4.7Japan '1,670 '1,79 50.1 53.6 7.8 10.9Java and Madura 1,840 .. 44.4 ... 3.2 ...Philippines 1,770 48.8 ... 13.0 ...Thailand 2,110 2,(126 54.4 52.5 14.1 14.0
EUROPE
Austria 2,397 2,698 74.4 78.0 22.3 25.7Belgium 2,667 2,760 78.7 81.2 34.0 33.8Czechoslovakia 2,402 2,656 72.5 82.1 28.3 31.5Denmark 3,125 3,206 107.5 105.0 63.9 61.2Finland 2,617 2,851 91.3 93.3 40.8 43.2France 12,357 2,667 76.2 87.7 30.1 35.2Germany: Bizone 2,189 2,543 74.9 79.0 22.1 23.7
French Zone 1,858 2,517 68.0 79.1 23.7 23.3Soviet Zone 1,895 2,384 60.7 67.4 14.3 14.4
Greece 2,266 2,358 68.1 71.6 17.8 17.1Hungary 2,432 ... 73.3 ... 15.5 ...IcelandIreland 3,268.3,260 3,27.6
123.4103.5 10 .3 . ..I 3
86.349.9 56:6
Italy 2,249 2,398 71.1 77.0 16.0 17.7Netherlands 2,856 77.5 .. 31.4 ...Luxembourg 2,693 2,878 77.8 84.9 34.7 41.9Norway 2,899 3,051 90.4 93.5 47.9 47.8Poland 2,363 2,625 65.9 74.8 16.8 21.2Portugal 2,279 2,184 67.8 66.1 18.0 18.0Spain 2,180 2,377 68.1 75.0 18.2 20.5Sweden 2,871 3,108 91.8 95.8 58.8 59.5Switzerland 3,050 2,996 92.6 91.7 46.5 48.4United Kingdom 2,968 3,084 89.3 92.5 46.6 44.7Yugoslavia 2,144 ... 64.9 ... 11.2 ...
OCEANIA AND NORTHAMERICA
Australia 3,262 3,265 105.3 102.8 67.4 64.9New Zealand4 3,286 3,259 99.7 101.3 67.5 66.4Canada 3,161 3,141 95.0 92.7 59.0 56.1U.S.A. 3,244 3,186 99.2 95.0 63.0 60.3

TABLE 15. -CHANGES IN AVERAGE CALORIE AND PROTEIN VALUE OF THE AVAILABLE FOOD SUPPLIES,1947/48 AND 1948/49 (Concluded)
lIndia only.21t is believed by the Supreme Command Allied Powers that for staple foods there is an appreciable
understatement of production, particularly from home gardens, both in staple foods and vegetables. Anutrition survey conducted by the Ministry of Welfare estimated calorie supplies per person per day at1,965.
3Unreported production has most likely provided enough calories to raise the level to about 2,500-2,600calories.
'Calendar year basis: 1947 and 1948.
good quality soybean milk and curd and to study their nutritive value as comparedwith that of cow's milk. In Bangalore, India, an extensive experiment has beencarried out on a group of school children. Preliminary results indicate that the soyproducts are somewhat inferior to cow's milk in supplementing the rice diet. However,the economic advantages are considerable and this work will doubtless have applica-tion throughout the rice-eating area.
An extensive school feeding program is operating in Ceylon, where free foodis distributed to about 80 percent of the school population. The Government con-tributes about 8 million rupees a year for the feeding program, while local authoritiesassume part of the cost. There is a need to improve the nutritive value of the fooddistributed, which generally consists of a wheat bun with sometimes a small servingof vegetable soup. School feeding programs, in general line with the recommenda-tions of the Baguio nutrition meeting, have been developed in Singapore and Malaya.In Malaya, distribution of reconstituted dried milk and milk cocoa to mothers andinfants, preschool and school children, has been carried out in a number of towns, inaddition to a free lunch program in twelve schools. A small program, providing afree meal for about 100 children and milk powder for a number of expectant mothers,has been initiated by the Department of Child and Maternal Welfare in Burma, and it
29
CountryCalories Total protein Animal protein
1947/48 1 1948/49 1947/48 1 1948/49 1947/48I 1948/49
(Per person per day) (Grams per person per (Grams per person perday) day)
LATH', AMERICA
Central America andCaribbean
Cuba 2,682 2,814 66.6 67.1 26.4 25.3El Salvador' 1,557 ... 41.2.. 14.3Mexico 2,032 2,101 56.7 59. 16.5 16.5
South America'Argentina 3,188 3,191 109.9 109.0 66.2 64.8Brazil 2,245 64.0 ... 26.9Chile 2,352 2,3i6 72.7 71.5 23.7 2.2.4Colombia 1,950 ... 51.2 ... 23.1Peru 1,925 2,219 52.1 59.4 13.5 13:6Uruguay 2,490 2,529 93.5 92.7 62.7 61.3
NEAR EAST
Egypt 2.364 2,458 68.4 71.6 9.4 9.5Turkey 2,173 2,506 67.8 76.6 12.3 12.4Ethiopia 1,770 ... 63.5 20.9
NORTH AND SOUTH AFRICA
Algeria 1,279 1,421 37.4 43.3 9.1 10.3Madagascar' 2,074 .. 57.3 ... 24.7Morocco 1,837 1,825 62.4 61.8 20.2 2.0.6Tanganyika' 2,163. 59.2
.
12.3Tunisia 1,498 1,545 5 441 41:6 .9:19.1Union of S. Africa 2,422 2,517 73.6 75.2 27.1 27.9
is reported that Thailand hopes to start a child feeding program in one of the govern-ment high schools.
The school feeding program started in Japan in 1946 for 252,000 children hadexpanded by December 1948 to include 6.5 million children out of a total schoolpopulation of 18 million. Difficulties encountered in 1949 in importing dried skimmilk, upon which the program was based, resulted in a bean paste soup of considerablylower nutritive value being used. Any improvement in the program depends on im-portation, or increased indigenous production of food or both. Recently the activitiesof the United Nations International Children's Emergency Fund (UNICEF) wereextended to the Far East. A demonstration feeding program, organized in the Philip-pines with the technical assistance of FAO, began on a small scale in July 1949.Similiar programs may be initiated in other countries. A very limited number ofchildren can be included, but a useful purpose will be served in demonstrating thevalue of school feeding and encouraging the development of this method of safeLruard-ing child health.
EUROPE
In terms of calories and proteins, the food situation in most European countriesshows a slight but general improvement. The most significant increase in caloriesupply has taken place in all zones of Germany (an average of 500 calories), whileAustria, Czechoslovakia, France, and Poland have shown smaller increases from 200to 300 calories. The supply of animal protein has increased in such countries as Aus-tria, Czechoslovakia, Finland, France, Netherlands, and Poland, while in the UnitedKingdom and Belgium it has decreased. In the Soviet Zone of Germany and in Greece,Italy, Poland, and Portugal the supply of animal protein remains low; probably alsoin Hungary and Yugoslavia. The improvement in the over-all food situation in1948/49 has been reflected in a general relaxation of rationing. Belgium, Poland,and Luxembourg abandoned rationing of all foods early in 1949, while there wereration increases in many countries.
In some countries, notably the United Kingdom, the diet of certain groups of thepopulation is kept under constant review by means of diet surveys, but in most coun-tries no recent investigations have been made. In France, however, diet surveys havebeen systematically carried out in Paris, 1Vlarseilles, and small cities. They indicatedthat in the last quarter of 1948 there was a considerable increase in the average dailyintake of calories. In Marseilles the calorie value of the diet increased from 2,200 in1947 to 2,900 in 1948, with accompanying increases in all nutrients. In Czecho-slovakia, preliminary results of diet surveys among school children and adolescentsindicate that the latter group is obtaining sufficient calories but not enough of certainnutrients, especially animal protein. The diet of various groups of the population inItaly in 1948 was found to show little improvement in quality or in quantity over thatof 1947.
Those vital statistics which to some degree reflect the state of nutrition suggestthat it has improved. With the exception of Rumania and most parts of Germany,infant mortality rates are gradually decreasing; in most countries they are belowthose of the prewar period. Tuberculosis rates, while showing a general decline, oftenreveal an increase in certain groups such as adolescents and young women. (Nutrition,despite its importance, is only one of several factors affecting tuberculosis.) Morespecific information on the nutritional condition of adolescents is urgently needed.
30

One of the most significant undertakings designed to improve the nutrition ofchildren is the joint UNICEF-FAO milk conservation project. A survey, made in 1948to determine the need for technical assistance and dairy requirements in the countriesreceiving UNICEF assistance, indicated a need to expand pasteurization plantsand establish milk drying plants, both of which would increase the supply of "safe"milk. During the current year, UNICEF has provided financial assistance, and FAOhas given technical aid to countries anxious to develop their dairy industry- alongsuch lines, with the agreement that the milk be distributed free of charge to infantsand children in accordance with UNICEF feeding policies. It is anticipated that in-digenous supplies of good quality milk will shortly replace the dried milk now beingprovided by UNICEF. These supplies will enable the child feeding programs initiatedby UNICEF to be carried on and further developed by the governments concerned.
The school meal scheme in the United Kingdom and the well-known OsloBreakfast in Norway continue to benefit a large proportion of the school populationin these countries. Since a decree of February 1948 that food should be given free toschool children in Denmark, the number of children participating in a school feedingprogram has increased greatly. In Finland, provision of food for school children wasmade obligatory in August 1948 and during the past school year milk was distributeddaily to the children. The school feeding programs in Greece and Czechoslovakia havebeen expanded. In Bizone Germany the child and student feeding program, whichcovers 4.26 million children, was extended 1 May 1949 to include 555,000 childrenin the French Zone. In Portugal, Obra das Mdes (Mothers' Organization) is respon-sible for providing free school meals to some 12,000 needy children in various townsand rural areas.
The child feeding programs in operation throughout the world indicate that thereis a widespread appreciation of the importance of such feeding in improving andmaintaining the nutrition of children. There is, however, a need for further develop-ment. In some cases it can take place only with the improvement of available foodsupplies and feeding facilities.
UNITED STATES, CANADA, AUSTRALIA, AND NEW ZEALAND
The high level of food supplies in these countries should be sufficient to providean adequate diet for everyone. But there are problems of distribution due on theone hand to economic and geographical factors and on the other to ignorance of orindifference to what foods contribute to good nutrition. In some groups there is alow intake of certain nutrients; in others, overconsumption of calories leading tooverweight is becoming a problem and the relationship between overweight and cer-tain degenerative diseases is being studied. In several communities of the UnitedStates signs of malnutrition, such as goiter, anemia, and rickets have been revealed byrecent studies of food consumption and nutritional status. In Canada a numberof dietary and nutritional investigations were carried out in the past year, especiallyamong school children and Indians of the James Bay area. The results have led toprograms of nutrition education and of food supply so designed as to help remedy theapparent defects. In a medical study carried out in Newfoundland in the summer of1948, the incidence of malnutrition was found to be lower than five years earlier,except for low intake of ascorbic acid. The improvement was attributed largely toeconomic betterment and to special measures, notably flour enrichment and the fortifi-cation of margarine with vitamin A.
31

Surveys carried out among groups of aborigines in Australia have revealedascorbic acid deficiencies associated with a low intake of fruits and vegetables. InCanberra the administration of potassium iodide to school children over a period ofone year brought about a marked reduction in the incidence of goiter. Likewise inNew Zealand, the incidence of goiter among school children has shown a significantimprovement since the introduction of iodized salt.
Of the four countries in this group, only the United States has a national schoollunch program. About 6.9 million children, or one-fifth of the school population, par-ticipated in 1948. The program, which extends to the dependent territories, is bringingabout a marked improvement in the nutritional status and food habits of children inPuerto Rico and the Virgin Islands.
New Zealand has a school milk distribution program, and in Canada and Aus-tralia there are some local school meal or milk programs in operation. During thepast year a free milk scheme for school children, operating from May to August, wasstarted in the State of Victoria, Australia. At present some 65,000 children are re-ceiving half a pint (300 c.c.) of milk a day.
LATIN AMERICA
Provisional food balance sheetsavailable for only some of the countries inLatin Americaas well as information from other sources indicate that supplies ofcalories per person increased in 1948/49. Per caput protein levels increased in certaincountries and fell in others, but the proportion of protein of animal origin decreasedin all countries for which data are available.
In Mexico and Central America the per caput food supply continued to be gen-erally low, especially in El Salvador, the most densely populated country on the main-land. In most of this area it is customary to treat maize, one of the basic foods, withlime to soften it before cooking, a practice which adds a significant amount of calciumto the diet. It is not followed in other maize-eating areas, and generally the calciumcontent of the diet in these areas is deficient.
In Paraguay, Uruguay, and Argentina, cattle outnumber people, and meat con-sumption is probably among the highest in the world. On the other hand, in the neigh-boring country of Chile, both meat and milk are relatively scarce. In Paraguay, maizeand manioc are staple foods, but wheat is imported for urban consumption. Althoughthere is a large number of cattle, milk supplies are small and unevenly distributed.The milk supplies in Uruguay and Argentina are the largest in Latin America, buteven there considerable sections of the population consume little milk. Some surveydata show that cakium deficiency is common.
In most Latin American countries the use of wheat flour is increasing with urbani-zation. Where maize is treated with lime, the substitution of white flour may bringabout a significant decrease in calcium in the diet, especially important where themilk supply is low. In many areas the per caput sugar consumption has increased, andwhite sugar tends to replace crude sugar, which contains some iron and other minerals.
Few surveys of diet and nutritional status have been made in Latin America. Sur-vey data from Mexico and Guatemala show great variations in calorie and proteinlevels among different groups of the population but a general deficiency in riboflavinand niacin. Animal protein levels are particularly low among the Indians, but the dietof those retaining their old food habits and consuming many wild plants has beenfound superior in vitamin A value and ascorbic acid to that of other groups who
32
have lost such habits. Recent studies among school children in Rio de Janeiro showedmultiple vitamin deficiencies and a high incidence of dental caries and anemia. Goiteris reported in many areas. Vitamin A and other deficiencies are reported from Colom-bia and Venezuela.
School feeding programs in Latin America have been developed primarily for thebenefit of indigent children. There is a need for considerable further development andexpansion, and for studies on the possibility- of providing low-cost meals of highnutritive value from foods which are available locally. In some countries, Brazil, forinstance, industrial feeding programs have been introduced and reports indicate thatthey are expanding. Emphasis has been placed on state restaurants which supply mealsto workers at low cost.
AFRICA
As far as most of the dependent territories are concerned, the meager informa-tion available seems to indicate that changes have been relatively slight in the pastyear. There is perhaps a tendency towards improvement in certain urban areas. Aconference on nutrition in Africa, called by Belgium, France, and the United Kingdom,was scheduled at Dschang, French Cameroons, for October 1949.
In the Union of South Africa the diversity of racial and economic groups isassociated with widespread inequalities in food distribution, and a national averagedoes not give a satisfactory picture of actual consumption. The school feeding pro-gram for children, introduced in 1944, is being reorganized. Finances have beenreduced in the state-aid milk and butter scheme, designed for preschool children andneedy families, as well as in the food scheme for drought-stricken native areas. Itseems doubtful whether the food and nutrition situation has improved sufficiently tojustify these changes. It is reported that the summer of 1949 has been characterizedby widespread malnutrition in reservations of the Eastern Cape Province. Manyinfants have died of starvation and deficiency diseases among children have beenwidespread.
NEAR EAST
A relatively low supply of calories, animal protein, and protective foods is char-acteristic of countries in the Near East. The insufficient milk is of poor quality andfresh vegetables are lacking in many districts. Deficiency diseases and other indica-tions of poor nutritional status are widespread. The rates of infant and child mortalityare of the same order as in Central America and the Far East. While statistics for theregion as a whole are very incomplete, they show that in general three-fourths of thetotal calories are provided by cereals, starchy roots, tubers, and sugars.
There has been some slight increase in calories in 1948/49, but the quantity ofanimal protein has not risen, and there is still a deficiency of vitamins of the Bgroup, and of vitamin A. In addition, inequalities in distribution have been accentu-ated by the continuing increase in the cost of living. Nevertheless, pellagra, once acommon deficiency disease in Egypt, is becoming progressively rarer.
The practice of providing hot or Oslo type meals to school children in Egypt con-tinues, and some attention is being given to the feeding of industrial workers. Israelhas successfully maintained a rationing system and has continued its school meal pro-
gram in which milk is included. But in general such measures are limited in scope.
33

Charts 3, 4, 5, and 6.Distribution of World Supply of Calories,Proteins, and Milk
3500
Q.
2500
80
-260
QQ.
IncIIa S.Pakistan
CALORIES
40
Q.
India &20 PakistanoChina
ANIMAL PROTEIN
Median-
U.S.A.Median
Italy
C it
ponce-
A PREWAR
194t/19481500
0 20 40 60 80 100CUMULATIVE PERCENT OF POPULATION IN
COUNTRIES HAVING INDICATED QUANTITY OR LESS
U.S.A..
PranceiBrazil U.K.
Oraece.L
PREWAR194E01949
20 40 60 BO 100CUMULATIVE PERCENT OF POPULATION IN
COUNTRIES HAVING INDICATED QUANTITY OR LESS
34
.
4000 20 40 60 80 100
CUMULATIVE PERCENT OF POPULATION INCOUNTRIES HAVING INDICATED QUANTITY OR LES
20 40 60 80 100CUMULATIVE PERCENT OF POPULATION IN
COUNTRIES HAVING INDICA TED QUANTITY OR LESS
FAO ChArt 74 284
INEQUALITIES IN WORLD FOOD DISTRIBUTION
To illustrate the wide differences in supplies of calories and of total and animalprotein among different countries, and to show the changes which have occurred overa period of ten or more yt-ars, cumulative curves of distribution are presented inCharts 3 to 6.2 Each of the curves suggests that the disparities have widened in recentyears.
Chart 3 shows that 22 percent of the total population was formerly at or belowthe level of 2,000 calories; this proportion is now 35 percent. At the median, i.e., 50percent of the population, the calorie level is now about 2,120 as compared with about2,240 prewar. The aggregate calorie supply for all countries increased by less than1 percent so that, with an 8-pereent increase in population, the per caput average islower than the prewar average by about 7 percent (2,220 calories as against 2,390).
Chart 4 shows that less protein is available to more than 80 percent of the popula-tion than in the pre-war period. This is due to a reduction in per caput supplies ofgrains and animal foods. At the median point in population the protein level is about
2The 51 countries covered by Charts 3 to 5 represent roughly three-quarters of the world'spopulation. For most of the countries the more recent information relates to 1998/49, and thecurves are labeled accordingly, but in several countries, notably in Asia, they are based on 1947/48,and, in a few, on 1947. Chart 6 covers 48 countries and the data refer principally to 1947/48.
800pAR
FLUID MILK EOUIVALENT
600 Median U S.A:3o.
8- 400
raonct7. e
India áQ. Pakistan
2002
- PREWAR19471940
1.5 Iridio S.4 Pakistan Turicey1
4E60a ...; I
China: I
..........PREWAR... 1948,1948
TOTAL PROTEINU.S.A.
MediU.K._
120
1100
e 80

66 grams, as against 71 grams prewar. The aggregate protein supply has increasedless than 2 percent. The per caput averages are the same as the median values andcorrespond to a 7-percent decrease.
From the nutritional standpoint the shifts in animal protein supplies shown inChart 5 are more significant and more serious than those in total protein althouah,naturally, the changes are smaller. At the median, the level is only about 8 grams, bothprewar and postwar. There has been a general decrease for most countries, whichconsumed in the prewar period less than 42 grams per person per day. At the upperend of the curve there have been appreciable gains. In 1948/49 the aggregate quantityfor all countries was 2 percent above prewar, but the average quantity per caput was18.5 grams as against 19.6 grams per day prewar, i.e. a drop of 6 percent.
The position for milk products is shown in Chart 6 in terms of fluid milk equiva-lent; however, since the emphasis is on milk protein, no account is taken of milk usedin the manufacture of butterfat or cream except to the extent that the non-fat solidsare used in human consumpion. As in Charts 3 to 5, the contrasts are sharp betweenthe most and the least favored countries; more of the population than prewar are nowbelow 200 grams, and more are below 300 grams. The percentage having more than700 grams has increased. At the median point, the present level of 165 grams or lesscontrasts with the prewar level of 190 grams. Yet, the aggregate supply represents again from prewar of about 6 percent, i.e. almost as much as the 8-percent gain inpopulation; so that the average per caput quantity was nearly the same as in theprewar period, about 200 grams.
CONCLUSIONS
It emerges that in countries in which the prewar food and nutrition situation wasin general satisfactory, a significant improvement appears to have taken place duringor since the war. By contrast, where the level of food intake has historically beenlow, the situation has deteriorated; and such countries represent a major proportionof the world's population. Over-all food supplies remain grossly inadequate and in-equalities in distribution have become greater. It seems important, therefore, to con-sider not only measures such as expanding agriculture and trade in foodstuffs, butalso measures to make the best use, from a nutritional standpoint, of the foods actuallyavailable. These include the following:
Rationing. In some countries, notably the United Kingdom, rationing hasmade it possible to use limited food supplies to good advantage. In countrieswhich depend largely on home-produced foods and where there are widedisparities in the econoinic position of different sections of the population, itis difficult to operate effective ration programs.
Milling Practices. The use of cereals of high extraction supplies nutrientsoften deficient in the diet. However, there may be resistance to even afamiliar staple food in slightly modified form. This may be at least partiallyovercome by a well-planned program of public education in nutrition.
Enrichnient. Wherever knowledge of the nutritional situation clearly indi-cates the need for certain nutrients such as vitamins and minerals, the enrich-ing of staple foods with these may be considered a logical step. On the otherhand, it must be recognized that enrichment is often costly and therefore haslimited application.
(1)
35

Nutrition Education. The changing of food habits and culinary practicesis always difficult and slow, but often most desirable. Education in nutritionusually stimulates demand for different foods of higher nutritive value, andit can also bring about a better utilization of existing supplies.
Supplementary Feeding. The development of nutritional deficiencies isconditioned both by the relative absence of a needed nutrient in the diet andby increased requirements which result from conditions of stress like rapidgrowth, child-bearing, and heavy work. Supplementary feeding programsfor children and adolescents, pregnant and nursing women, and canteens forcertain types of industrial workers, are therefore of great value.
Finally, nutrition programs must be based on a thorough knowledge of the nu-tritional situation in a country such as can be obtained by diet surveys and assessmentof nutritional status. An accurate knowledge of the nutritive value of available foodsis also desirable. It is not only the poor and undernourished countries that neednutrition programs, but also those in which available food supplies appear to beadequate, since inequalities in distribution may prevent important sections of thepopulation from obtaining a satisfactory diet.
36

4. Prospects for 1950/51
THE FAO CONFERENCE at its Fourth Session asked to have material collectedon the probable state of food and agriculture in 1950/51, including goals ofproduction, international trade, and consumption, and suggested that thesecretariat seek such information through the annual reports of MemberGovernments. The 1950/51 season is now less than a year ahead. Some ofthe crops which will be consumed in that year are already sown. Yet, as of1 September, only 15 governments have replied fully (and three partially)to the request of the Conference out of a total of more than 100 indepen-dent countries and dependent territories. The Director-General had to decidewhether to ztbandon the project requested by the Conference, or to try tomake secretariat projections for 1950/51 on a basis of available information.Such projections have been made and have been presented to pre-Conferenceregional meetings in order to get the comments of governments. At the timeof this writing, these meetings have not yet been held, so that this documentcan contain only tentative indications of the situation which might develop.Details on individual commodities are in the Appendices. Here only broadgeneral trends are summarized.
PRODUCT ON
Normally the rate of growth of world agricultural production matches the rate ofgrowth of world population, that is, it expands at between 1 and 2 percent per annum.Drought or flood may reverse this trend for a season or two in limited areas. Warmay reverse it in many countries over a period of years. Individual countries mayexpand their agricultural production more rapidly when they are building up anexport trade. Others may abandon a large part of their farming as they come to spe-cialize in manufacturing. However, in spite of these particular deviations, the worldrhythm of production has been remarkably constant.
Increases in per caput consumption would require the food supply to expandmore rapidly than population. But per caput consumption grows very slowly save inexceptional circumstances. An example is the United States, where per caput con-sumption (measured in money values at constant prices) increased 10 percent in theshort space of five war years, whereas over the previous 30 years it had increased byonly 5 percent. In industrial Europe, per caput consumption has been increasing at aslow speed over the last 150 years. Most of the underdeveloped low-income countriesshow no tendency at all to attain a higher per caput consumption. In other words,their population expands to the limit of their means of subsistence.
37

Today, people no longer accept such historical trends as inevitable. Governmentsof most underdeveloped countries hope to develop industry and agriculture rapidly,more rapidly than population increase. Somefor example, India, Mexico, andPolandare already taking steps in this direction. But the reported goals for pro-duction in 1950/51 and beyond suggest that, as yet, action programs are the exceptionrather than the rule. For the world as a whole, little speeding up of progress in generalagriculture seems likely unless new and more deliberate efforts are made.
For the Far East, it is difficult to generalize. China, the biggest population unitin the area, is at present an unknown element. Japan may be near the limit of itsfood production potential. India has a program which requires the attainment of self-sufficiency in food by 1951 and is asking all farmers to increase production by 15percent. The other countries of Southeast Asia have various programs. However,massive technical and social problems have hitherto bedeviled efforts to expand foodproduction. A great number of these problems need more vigorous government ac-tion to stimulate productive investment, but others require outside aid in the form ofequipment and technical assistance.
It is not expected that much progress could be recorded as early as 1950/51, buteven by that date rice supplies will be more plentiful than now, and possibly theregion's large food import, particularly of cereals, may be significantly reduced.Production programs are likewise ambitious in the traditional exporting countries,such as Indonesia, Malaya, the Philippines, and Thailand, with the intention of ex-panding food and raw-material exports to the prewar level or above.
The U.S.S.R. has plans for rapid expansion of agriculture and is encouragingfarmers to concentrate on livestock production more than on food crops. This mayindicate the achievement of sufficiency in bread and potatoes and a desire to diversifythe diet. Production targets of the U.S.S.R. would permit the export of both foodand forest products on a substantial scale.
The Eastern European countries have production goals which postulate a rate ofexpansion a little less rapid than that of the Soviet Union and involve a switch fromgrain exports to exports of livestock products. The countries of Western and CentralEurope, under the compulsion of dollar shortage and the need to curtail living stand-ards, are endeavoring to produce more food so that their imports can be limited towhat they can pay for. The results of their efforts will not be fully evident as early as1950/51. As a whole, Europe's output of grains by that date is planned to reach theprewar level; its output of sugar 12 percent above prewar; its output of milk and meat92 percent and 90 percent of prewar respectively.
In World War II, the United States, Canada, and Cuba, as in World War 1, filledan emergency role in supplying food to stricken countries; again they face readjust-ments of production as the emergency gradually passes. Already the United States hasintroduced acreage allotments (a form of restriction) for wheat and contemplates thesame for maize and cotton. Since price supports are currently at levels which tend tostimulate production, such programs may increasingly be combined with quantitativelimitation of output. Production goals for 1950/51 envisage the beginning of limita-tions to take into account the reduced opportunities for export. Similar readjustmentsin Canada and Cuba will be more difficult because of their greater dependence uponagricultural exports.
In Latin America, prospects differ widely from country to country. There arefew official production goals. Argentina has of recent years neglected agriculture forindustry but still has a large agricultural production potential; in June the Minister
38

of Agriculture officially announced a goal of 7 million hectares of wheat. In the samemonth price ceilings on bread, edible oils, and dairy products were removed, whichshould stimulate production. Three Latin American governments have or expect soonto have in practical operation comprehensive plans of agricultural development. Brazil,in its SALTE plan, proposes to spend 3,700 million cruzeiros on agricultural develop-ment, which includes bringing new areas into cultivation, new irrigation develop-ments, and the extensive use of improved seeds, fertilizers, and farm machinery. TheMexican six-year plan aims at reducing the necessity for importing cereals by theextensive irrigation of new land and the 1,vider use of fertilizers. Venezuela has aminimum plan of agricultural production, with the object of reducing food importsby increased cultivation of maize, rice, potatoes, pulses, and oilseeds. A large irriga-tion program and the colonization of iminigrants are included. In the West Indies, theBritish are developing a citrus industry to ensure a more adequate supply within thesterling area.
Generally speaking, however, Latin American countries are not yet taking actionwhich is likely to increase food production faster than population growth. To im-prove nutritional standards or develop their exports, these countries may have to putforth more vigorous efforts and spend more money to modernize their agriculture.
In Australia and New Zealand, production trends suggest expansion, but at a com-paratively slow rate. Both countries have an assured market in the United Kingdomfor almost all their food exports. Scope for expansion in Australia is perhaps greatestin Queensland, where much new land can still be brought into cultivation. New Zea-land has long-term plans for greatly increasing the productivity of its grasslands.
In colonial Africa, large developments have been started or planned, but notmuch increase in output can be expected as early as 1950/51. Formidable difficultiesof the environment demand extensive and in some cases long-time experiments beforethe arts of tropical farming can be mastered. Moreover, in Africa, social problemsare as difficult as technical problems. Apart from oilseeds, several colonial territoriesplan to expand cotton, coffee, and tobacco production for export. The Union ofSouth Africa expects to develop sugar production until there is again an export sur-plus. No further expansion of fruit for export is contemplated but more oilseeds willbe grown for domestic use. North Africa is expanding cereals production to meetthe needs of the rapidly increasing population and is expanding citrus for export. TheNear East has ambitious irrigation proposals which it will take some years to bringto realization. Here, as in Africa, the technical and social difficulties are interlocked.
Looking at the world as a whole, 1950/51 is likely to see Europe and NorthAmerica making such adjustments in agricultural production as their economic situa-tions require, the U.S.S.R. forging rapidly ahead, but few other regions embarking onany radical program of development. Lack of domestic funds, technical knowledge,and foreign equipment are the principal hindrances in underdeveloped countries. Ifthe traditional rhythm of slow agricultural development is to be. broken and if anyappreciable change in the world's malnutrition is to be effected, then steps of a farmore decisive character are needed. in this context the Technical Assistance Programproposed by President Truman acquires its true significance. By bringing extra adviceto the underdeveloped countries, it should be possible to lay the basis for nationalagricultural services without which no modernization of farming can be expected, andat the same time to prepare conditions more favorable to the granting of internationalloans which these countries urgently need for their larger land development projects.
39

INTERNAL DEMAND
Changes in internal demand for foodstuffs relate primarily to industrial countries.In underdeveloped countries, where 15 percent of the population lives in towns andthe remainder are farmers or neighbors of farmers, such a phrase means very little.However, even in these countries, to the extent that new industries are developed andcities grow in size, there will be an increasing demand for food in marketed form andfor foods of different kinds. For example, in Latin America the movement of popu-lation from rural to urban areas involves a change from maize to wheat consumption.Furthermore, in most underdeveloped countries, population is still growing fairlyrapidly. This will maintain a strong demand for food. On the other hand, efforts atindustrialization generally create inflationary situations which restrict the purchasingpower of consumers.
In industrialized countries consumer demand seems likely to remain high. Evenif the food subsidies, so significant at present in several countries, were to decline,and even if the United States recession were to continue, demand would remain highbecause of the high levels of real income. But there will be consumer resistance tohigh prices; it has been noted already in several countries. In cases where agricul-tural production costs are too rigid to permit appropriate price reductions, consumersmay switch to other products. There is, for example, the possibility of a switch frombutter to margarine, from one type of meat to another, or from meats to fish. Thedemand for a more varied diet which characterizes high levels of real income should,however, help to maintain the prosperity of the livestock industries in most countries.
Real incomes are planned to rise at a rapid rate in Eastern Europe and theU.S.S.R. and there is likelihood of substantial recovery from the present low levels inGermany and Japan. Elsewhere, changes will be more gradual, but if real incomesfall seriously anywhere, administrative techniques and experience exist which make itpossible to introduce quickly special programs, such as stamp plans, to stimulateconsumption.
The demand for clothing and other textiles is governed by much the same factorsas the demand for food, except that it is more sensitive and is likely to be affectedsooner; an example being the recent decline in United States consumer demand. InEurope, since clothes rationing was abandoned, demand and supply are being equalizedby selling the available supply at high prices. If real incomes have to fall in somecountries, consumer pressure will increase on the cheaper linesfor example, on cot-ton and rayon rather than on wool and linen.
The demand for forest products is even more sensitive. In the United States therecession has quickly affected purchases of lumber and pulp. In Western Europe,where the supply consists largely of licensed imports, the level of demand is the de-cision of the government. The tendency may well be to continue to give low priority toimports of lumber, pulp, and paper while foreign exchange continues scarce. Germanyand Japan will soon increase their imports again, but elsewhere, in other regions,changes will be insignificant.
EXTERNAL DEMAND AND SUPPLIESGreat interest attaches to the future of international trade in farm products. This
is an especially difficult topic on which to formulate definite views, since internationaltrade in many cases is a marginal factor representing a very small fraction of total
40

production. Moreover, the volume of international trade depends on influences inother sectors of the economy. Experience also shows that governments are more loathto establish export or import goals than production goals.
Those underdeveloped countries which have reported to FAO indicatean intention to reduce food importsnot one of them suggests any expan-sion; andan intention to expand agricultural exports.
These two tendencies are believed to be 1rue of most of the nonreporting countriesand cover a wide range of commodities and a substantial majority of the world'spopulation.
Examples of countries intending to expand agricultural production in order todispense with imports are Brazil for wheat, Chile for livestock, Central America formaize and rice, India for cereals and jute, Indonesia for rice. Examples of countriesplanning to expand their exports are Mexico for sugar and oilseeds, Ecuador for rice,East Africa for oilseeds, Burma and Thailand for rice, the Philippines for sugar,Eastern Europe for livestock products, and North Africa for fruit.
These intentions are easily understood. Underdeveloped countries want to importequipment for industrialization. Many of them hope to obtain foreign loans, butthese at be,st would cover only part of their needs. They do not have enough foreignexchange to buy all they need for economic development. Thus, if they are nowimporting foodand, in the case of India, for example, food is at present one-half ofthe total importsthey will try to reduce this item. On the other hand, they will en-deavor to export more, and their exports are about 80 percent agricultural and mineralproducts. Of course, a number of these countries have plans which will not be com-pletely fulfilled but, even if only partially successful, the general tendency to increaseexports and reduce imports would, if multiplied all around the world, produce con-siderable economic disturbance.
Superimposed upon these difficulties, most underdeveloped countries face to agreater or lesser degree a dollar problem, and some of them have a sterling prob-lem too.
Considering next the Anglo-Saxon food exporters, little change is expected in thevolume of exports from Australia and New Zealand, except over a much longer period.Canada, however, faces immediate difficulties because there are limits to the extent towhich it can accept payment in anything else but dollars.
The United States is in a special position. Its imports of agricultural productsconsist mainly of raw materials or tropical and subtropical foodstuffs. Few of these,such as coffee, enjoy a comparatively stable market; the majority are sensitive to thelevel of business activityfor example, cocoa, wool, and wood pulp. Against the im-port of temperate zone foodstuffs, U. S. agriculture is likely to remain protected.
In assessing U. S. agricultural exports, the elements to be considered include theagricultural policy of price supports, coupled with acreage control, the level of domes-tic consumption, and the availability of dollars in importing countries. Except duringthe two world wars, exports have been traditionally a small element in United Statesagricultural production. This production has expanded over the past 40 or 50 years ata rate which just covered the growth in population and the slow growth in per caputconsumption. Since 1939, however, agricultural production has jumped to an alto-gether new high, part of the increase being absorbed in domestic consumption andpart in greatly expanded exports. Assuming that the newly acquired farming tech-
41

niques have come to stay, it would be necessary either to sustain the present highlevel of exports and consumption or, if either fails, to cut back production to matchthe size of the market. Consumption or export subsidies would, of course, delay andcushion any necessary adjustment.
In Europe, the agricultural exports of the eastern and northwestern countrieswhich collapsed during the war are now recovering but will not have fully recoveredby 1950/51. Eastern Europe, instead of exporting cereals, will be competing withNorthwestern Europe in the export of livestock products. Most of the countries withlarge fishing fleets are likely, in 1950/51, to have difficulties in the export of theirproducts. By contrast, lumber and pulp exports from Eastern Europe and Scandinaviashould find a ready market in Western Europe.
As regards Europe's imports, the official plans indicate very little change in totalvalue. Some shift is contemplated from bread grain to coarse grain. More rice maybe imported and less sugar; more fats and less meat. Current efforts to switch supplysources from dollar to non-dollar areas will not have progressed very far by 1950/51.The dollar problem principally concerns cereals, cotton, and tobacco. (Dollar sugarwill be less urgently needed by 1950/51.) It will still be necessary for Europe toobtain substantial quantities of these three commodities from dollar areas. As tocurrent proposals for devaluing European currencies, it is not possible to predict howfar such a step would ease the financing of imports.
This brief survey of the outlook in the principal regions of the world may also beconsidered from the point of view of the principal commodities. In bread grains,Europe's and the Far East's 1950/51 imports should be below the current level, espe-cially if rice prices decline. Supplies of both bread and coarse grain should be amplefor international trade even if planned acreage reductions in the United States fullymaterialize. However, Europe may not be able to afford dollars for the quantitiesof coarse grain it has planned to import. It therefore attaches importance to the pos-sibilities of expanded exports from Argentina, the U.S.S.R., and other soft-currencysources.
A recovery of rice exports should bring prices down, which may prevent a sur-plus from developing.
Sugar is the one commodity in which a burdensome surplus seems sooner orlater inevitable. Europe will import less than prewar; Far Eastern exports will re-cover and new exporters, such as Mexico, have entered the market, so that Cuba's largeexport surplus will no longer be fully wanted.
While it is difficult to make any projection for such a complex group of com-modities as fats and oils, it appears that exports from Africa and the Far East are ex-panding at a speed which will make the European market progressively easier and mayresult in a fall in prices. The United States will have large quantities of lard to disposeof but may become an importer of flaxseed and linseed oil.
international trade in meat is almost entirely regulated for periods farther aheadthan 1950/51 by United Kingdom contracts with Australia, New Zealand, Argentina.and several European countries.
Fish prices arc already falling and the principal countries intensify their fishingactivities each year. Difficulties in export are likely to develop when tropical coun-tries begin to create fishing industries of their own.
Coffee is one of the few commodities where a comparative shortage is likely topersist through 1950/51. The enormously increased United States consumption canbe met by current output only so long as European consumption remains substan-
42

tially below prewar. New plantings in Latin America will not bear significant fruituntil after 1950/51.
Cotton is primarily a question of the level of United States consumption and ofdollar shortage. Stocks may accumulate in the United States while cotton is eagerlysought for in soft-currency countries.
Wool supplies promise to be in rough equilibrium in 1950/51; if United Statesimport demand recovers appreciably, the supply of fine apparel wools may be rathertight.
Supplies of lumber may accumulate in North America, owing to reduced domesticdemand and the virtual disappearance of exports because of dollar shortage. WesternEurope may increase its imports from Eastern Europe. Wood-pulp consumption in theUnited States and Canada is expected to recover from its present recession but it isnot certain that United States imports from Scandinavia will be resumed at the levelof 1947/48. Eastern Europe will seek to manufacture pulp and paper products ratherthan export pulpwood to Western Europe.
Considering the whole field of agricultural, fisheries, and forest products, the1950/51 position is likely to be one of more ample supplies than at present. Pricesshould therefore be lower than they now are, and in cases where they are upheld bygovernment support, there may be pressure for more subsidies. Prices are likely tofall much less in non-dollar markets even if the sterling area and other related coun-tries undertake devaluation.
Surpluses of various kinds may begin to accumulate. There may be structuralshiftsnatural rubber no longer wanted in prewar volume because of the syntheticsubstitute, sugar no longer wanted because of recovery from wartime devastation.There may be commodities, such as wheat and tobacco, which countries want butcannot buy because of dollar shortage, and there may be bad forward estimatingevidenced by overplanting as, for example, citrus fruit. There may be governmentprice-support programs and import duties which maintain production artificially atexcessively high levels.
The counterpart to surpluses is inability to pay. This also takes various forms.It may be a low-income group within a country, or an outburst of unemployment, ora shortage of dollars, or the chronic low purchasing power of an underdevelpedcountry.
At the time of writing, a group of economic experts is working in FAO on com-modity trade problems connected with emergent surpluses, and a special report hasbeen issued on this subject.

APP IA] DICES

A. Agricultural Products Foods
I. GRAINS
Review of 1948/49 Season
IN COMPARING the 1948 cereals harvest with that of 1947, the salient facts are an in-crease of nearly 50 percent in European production of bread grains and of nearly 10percent in Asian production; a decrease of over 20 percent in production of breadgrains in South America, principally in Argentina, where the weather was unfavor-able; an increase of 40 percent in the production of coarse grains in North Americadue to favorable weather. Reports on the U.S.S.R. indicate effective recovery ofproduction.
The international trade in grains during the year ending 30 June 1949 is esti-mated at around 36 2 million metric tons, which is the largest annual movement since1931/32 when a total of 39.8 million tons was recorded. (The record was 41 2 milliontons in the 1928/29 season.) Of the 1948/49 total, 26.6 million tons consisted ofbread grains (wheat and rye) and 9.6 million tons of coarse grains. The bread grainfigure was almost identical with that of 1947/48 and only slightly below the record of27.8 million tons in 1928/29. The coarse grain movement, on the other hand, whilelarger than in other years of the past decade, was still well below the levél of the 1920'sand 1930's.
Tables 17 and 18 show world grain trade by source and destination during thepast two seasons.
In 1948/49, Canada and the United States supplied 75 percent of the bread grainand 54 percent of the coarse grain export. Over 50 percent of the world whe,at ship-ments (including flour) originated from the United States. While Canada, Australia,and the United States increased their exports of bread grains in 1948/49, Argentinaexported only slightly over one-lialf as much as in the previous year. A similar situa-tion developed in respect of coarse grains, where increased exports from the UnitedStates and Canada more than compensated for the large reduction in exports from theU.S.S.R. and from Argentina which, in the case of the latter country, occurred despitethe existence of very large stocks of maize.
The decline in European imports of bread grain, comparing 1948/49 with1947/4.8, was offset by increased imports into Asia. As regards coarse grains, North
47

Region
North and CentralAmerica
Europe'U.S.S.R.'AsiaAfricaSouth AmericaOceaniaTOTAL (excl.
U.S.S.R.) _____
Source
AustraliaArgentinaCanadaUnited StatesOthers (incl. U.S.S.R.)TOTAL (incl. U.S.S.R.)
Destination
EuropeNorth and Central
AmericaSouth America --------AsiaAfricaOceaniaTOTAL
Period
Prewar (1935/36-1939/40) _
.fanuary 1948 ._July 1948January 1949 _July 1949
TABLE 16.-WORLD PRODUCTION OF GRAINS, PREWAR, 1947, AND 19481
1934-381 1947 I 1948 1934-38Bread grains Coarse grains
I 1947 I 1948
Million metric tons .
'For Southern Hemisphere. 1947/48 and 1948/49.2Postwor boundaries.
TABLE 17.-GRAIN EXPORTS (INCLUDING FLOUR) 1947/48 AND 1948/49
I 1948/49 1948/491947/48 I (prel.) 1947/48 (prel.)
( Million metric tons2.8 3.3 0.4 0.5 3.23.1 1.7 4.0 2.25 7.15.9 6.15 0.1 0.9 6.0
13.2 13.8 2.1 4.3 15.31.9 1.65 2.1 1.65 4.0
TABLE 18.-DESTINATIONS OF WORLD GRAIN EXPORTS (INCLUDING FLOUR), 1947/48 AND 1948/49
'Average of daily eash quotations.
Bread grains
Bread grainsI 1948/49
1947/48 I (preL)
19.8 17.7
1.0 0.81.1 1.14.0 5.80.8 0.90.2 0.3
26.9 26.6
Total grainsI 1934-38 I 1947 I 1948
81.2 95.2 134.6 109.4 143.1 182.254.9 43.4 50.2 116.3 80.2 104.534.993.533.0 32.. 7 34..6 74.3 72.2 7.8.9
8.9 9.5 9.0 12.7 12.7 12.717.0 16.1 14.9 25.5 25.3 22.10.8 1.5 1.3 5.2 7.6 6.6
195.8 198.4 244.6 343.4 341.1 407.0
Coarse grains
Coarse grainsI 1948/49
1947/48 i (prel.)Million metric tons
6.7 6.7
0.3 0.90.1 0.11.4 1.60.2 0.3
8.7 9.6
Total grains1948/49
1947/48 I (prel.)
Total grains1 1948/49
1947/48 I (preL)
26.5 24.4
1.3 1.71.2 1.25.4 7.41.0 1.20.2 0.3
35.6 36.2
3.83.957.05
18.13.3
TABLE 19.-SELECTED GRAIN PRICES IN NORTH AMERICA: WEIGHTED AVERAGE CASH PRICESFOR REPRESENTATIVE MARKETS
Wheat Maize Rye I Barley I OatsI No. 1 I No. 2 I
No. 2 I Dark N. Hard I No. 2I No. 1
Northern Spring Winter I Red Win-I No. 3 No. 2 j Feed No. 2Winni- Minne- I Kansas I ter St. I Yellow Minne-
IFort CW Fort
peg' apolisI City I Louis
I Chicago I apolisI
William William
48
28.2 47.9 47.661.4 36.8 54.363.641.3
3.8 3.2 3.78.5 9.2 7.24.4 6.1 5.3
147.6 142.7 162.4
26.9 26.6 8.7 9.6 35.6 36.2
( U.S. dollars per bu hel - )
0.91 1.15 0.96 0.93 0.72 0.643.23 3.20 3.03 3.12 2.71 2.76 1.282.46 2.43 2.19 2.25 2.14 1.78 1.19 0.862.30 2.35 2.25 2.29 1.43 1.63 1.10 0.772.01 2.38 2.00 1.87 1.40 1.45 1.16 0.51

and Central America substantially increased their imports, the situation in the othercontinents being little changed.
The 1948/49 season was largely one of transition from food scarcity conditionsto a working equilibrium between supplies and effective demand. During the July-September quarter (1948) supplies were still tight, most countries being on a day-to-day basis, with ration controls until the new harvests were available. With new graincrops in hand and a large production in Europe of other foodstuffs, especially potatoes,to supplement cereals, most countries relaxed or abolished consumption restrictions-such as admixtures of coarse grains with bread grains, high extraction rates, breadrations, farm delivery quotas, etc. This helped to maintain an active import demandfor wheat, notwithstanding the sizable increase in the 1948 harvest. Rebuilding ofcommercial stocks of bread grains in importing countries was rather limited onaccount of the dollar shortage. The general improvement of the world supply/demandposition was such that the international allocation of coarse grains and rye was dis-continued in December 1948, and of wheat and flour in April 1949.
Recent increases in production have brought about a decline in the prices ofcereals in countries maintaining a system of free prices. The drop has been particu-larly marked in North America.
In Europe, no such movement has occurred. In fact, in many leading countries,wheat prices for the 1948/49 season were fixed at higher levels than those of 1947/48.The same is true in Japan. In the case of coarse grains, however, some declines haveoccurred, as shown in Table 20.
TABLE 20.SELECTED GRAIN PRICES, EUROPE AND JAPAN
Period - France
'Per 112 lb.'Provisional price, 1949 crop.
Outlook for 1949/50
While it is still too early Lo make very definite forecasts regarding the 1949 worldgrain harvests, present information points to some decline from the 1948 level in allgrains except possibly rye, which is largely dependent upon the harvest in the SovietUnion. For wheat the decline may be about 10 percent in North America and 5 per-cent in Europe. In Asia the position is uncertain, but there may be some drop. Formaize, barley, and oats, some decline from last year's big crops in North America iscurrently forecast without compensating increases for other producing areas. Com-pared with a year ago, grain harvests as good or better now appear in prospect formost of Northern and Central Europe while less favorable conditions, especially forwheat, are noted in parts of Western. Southern, and Southeastern Europe. Countries
-Wheat
UnitedJapan King-
dom'
Yugo-slavia
Jan. 1947__ 1,078 340 18/7Jan. 1948_ 1,833 758 22/1 ziddJuly 1948_ 1,833 1,777 23/6 412Jan. 1949_ 2,275 1,777 25/- 412June 1949_ 2,275 '2,167 25/11 412
4,9
Rye
Poland
In nationa, currency per 100 kg1,9003,5003,0002,000
Barley
Hun-Denmark gary
43.00 3764.25 6951.00 7145.75 7043.50
Oats
Bel-gium
Maize
Italy
310 1,600325 3,500515 3,500344 4,500328 4,500

reporting the largest declines for wheat from last year are France, Spain, Rumania,Greece, and the United Kingdom.
The outlook for the Soviet Union is still uncertain. Wheat area, though stillbelow prewar levels, is reported to be above that of a year ago, and with normalweather conditions some increase over 1948 production could result; little change isindicated for other grains. In Turkey a sharp decline in all grain harvests is reported;wheat, the principal grain crop, is currently estimated at less than half the 194.8 out-turn. Drought conditions in the important plateau producing region have reducedyield prospects.
For the Southern Hemisphere, little information is yet available regarding thenext grain harvest. Some increase in wheat in Australia and Argentina is expected,however, and large outturns of maize in South Africa and of maize and barley inArgentina, where reduced harvests were reported this past season. Net changes inworld production of the various grains seem unlikely to be significantly affected bySouthern Hemisphere output unless the area and yields are sharply different fromthose of 1948/49.
International trade in grains in 1949/50 is expected to continue at a high level,provided the payments difficulties of importing countries are not appreciably aggra-vated, and may be near the 36.2 million tons estimated for the past cereal year. Onthe basis of the present production outlook, bread grain shipments of 25 to 27 milliontons, or about the same level as in the 1948/49 season, would appear necessary ifpresent bread consumption levelsespecially in Europe are to be maintained. Coarsegrain shipments of 10 to 11 million tons, or slightly larger than in the 1948/49 season,might be expected unless currency problems impose new restrictions. Still largershipments of all grains would be required if stock rebuilding were to be carried outto any significant extent in deficit countries.
North America may again account for around 75 percent of the total wheat move-ment and possibly 50 percent of the coarse grain shipments. Some increase over thesmall 1948/49 Argentinian exports of both bread grains and coarse grains seemslikely. With reduced wheat harvests reported for Rumania and Turkey, even smallerquantities might move from "other sources" in 1949/50 unless offset by larger exportsfrom the Soviet Union or North Africa.
The International Wheat Agreement will affect sales prices of a substantial pro-portion of the quantity, traded internationally. The maximum price under the Agree-ment, $1.80 per bushel, is slightly below recently- prevailing prices in North America.As most wheat in the Agreement comes from dollar sources, the ceiling in prices willsomewhat reduce dollar requirements for wheat imports and thus aid importers experi-encing dollar exchange difficulties. The Wheat Agreement, together with bilateraltrade deals with nonagreement sources, and additional quantities to be covered byUnited States financing, especially for military occupation areas, account for the bulkof the world trade in wheat.
No significant increases in carry-over stocks for the world as a whole are inprospect for 1 July 1950 and some reductions may even be recorded. The margin ofexisting or prospective stocks in 1950 over minimum working levels in the four ex-porting countries represents only 15 to 20 percent of the current world trade in wheatwhile stocks in many importing countries are still low.
50

Outlook for 1950/51
Europe's bread grain program for 1950 calls for a 5-percent increase in areaover 1948 and a 10-percent increase in production, which would restore output toabout the 1934-38 level.' In view of the fact that, despite a higher goal, the seededarea in 1949 was little changed from 1948 and that yields in 1948 were good owinglargely to unusually favorable weather, these 1950 targets for area and productionseem optimistic. Moreover, about one-half of the programmed increase in bread grainproduction is scheduled for Eastern Europe, where such an expansion would notnecessarily be accompanied by an increase in exports to Central and Western Europe.Europe is therefore unlikely to be able to reduce its bread grain imports in 1950/51as much as it planned to do, assuming that present consumption levels and extractionrates are to be maintained.
As regards other cereals, substantial increases in area and production of barleyand mixed grains are planned for Western and Northern Europe, while a de,crease inmaize area is scheduled for Eastern Europe. Increased imports of coarse grains havebeen programmed, perhaps optimistically, for Europe as a whole.
In the Far East, rice also has to be considered. A small increase in wheat outputis programmed, notably for India and Japan, and a more considerable increase forrice, particularly in India and the rice-exporting countries. While the full effect ofthese programs is likely to appear later than 1950/51, rice prices may be expected tofall relative to cereal prices, which might stimulate deficit countries to replace part oftheir wheat and maize imports by rice imports.
In Australia and Canada no substantial changes are anticipated. In the UnitedStates a reduced output of wheat and maize is the goal. On this assumption, andassuming no significant stock change, bread-grain exports would be 20 percent andcoarse-grain exports 33 percent below the 1948/49 level.
Exports from the U.S.S.R., Argentina, and other smaller sources of supply are amatter of great uncertainty. Several indications suggest that exports, both of wheatand coarse grains, may expand somewhat. This question assumes importance becausethese are the major cereal exporters, apart from Australia, which do not require pay-ment in dollars.
Altogether the importing countries will continue to depend on the dollar area forsome 70 percent of their wheat and nearly half their coarse grains, and there seems nopossibility of other sources of supply expanding soon or rapidly. This being so, thevolume of world imports, while depending in part on the rate of agricultural expansionin the Far East and Europe, will depend mainly on the state of the world dollar prob-lem in 1950/51. Wheat will, of course, have a high priority on the list of imports, andcoarse grains a rather lower priority, although Europe by then will have large live-stock numbers to feed. Because of the considerable carry-over stocks of coarse grainsanticipated for next summer in the United States, larger exports than those projectedcould be made if needed. Wheat stocks, hoNvever, which provide the only apparentflexibility in the world bread grain outlook for 1950/51, are not likely to be abnor-mally large.
1Such goals, of course, assume normal weather and growing conditions and a continuationof present price policies; the actual results may be higher or lower, depending upon developmentsin the intervening period.
51

Cha
rt 7
.Are
a an
d Y
ield
of W
heat
and
Mai
ze in
the
Uni
ted
Sta
tes,
188
0-19
49
Cfl
I\D
50 40 30 20Mill
ion
hect
ares
Qui
ntal
s pe
r he
ctar
e25 20 I 10
1950
Mai
ze, h
arve
sted
A /.0
0\area
4, /
Mai
ze y
ield
,10
-yea
r-av
erag
e
-//
e-
ee
.6 4
11.
.**
.
10-y
ear-
aver
age
Whe
at y
ield
,...
.. **
** .°
Whe
at, h
arve
sted
are
a
0.1
11
1!
II
11
I1
11
11
11
11
1111
1111
119
1019
201111
1111
1 1930III
IIIIII
1940
FA
O C
har
t No.
296
1111
(111
1_0
1880
1890
1900

TABLE 21.-LONG-TERM TRENDS IN GRAIN PRODUCTION'
Harvested area in million hectaresYield in quintals per hectareProduction in ntillion hectare-tons
COARSE GRAINS'
1Through 1939 the data are based on post-World War I boundaries; from 1940 on post-World War IIboundaries. Those areas previously a part of European countries now included in the Soviet Lrnion had,immediately before World War II, the following average area and production of grains: Bread grains:area 5.2 million hectares; production 5.7 million metric tons. Coarse grains: area 5.0 million hectares;production 4.9 million metric tons.
2Wheat and rye.14-year average.4Bulgaria, Hungary, Rumania, Yugoslavia.&Excluding U.S.S.R., China, Manchuria, Iran, and Iraq.'Barley, oats, and maize.
53
5-yearAverage
Argentina Australia Canada United StatesArea I Yield I Prod. Area I Yield I Prod. Area I Yield I Prod. Area I Yield I Prod.
1909-13 _ 4.4 13.0 5.7 0.5 11.4 0.6 4.6 14.7 6.8 60.4 14.3 86.11914-18 _ 5.1 11.1 5.6 0.5 9.4 0.5 5.9 13.1 7.7 63.6 14.1 89.71920-24 _ 4.2 14.7 6.2 0.7 10.7 0.7 7.4 12.6 9.4 61.7 14.9 91.81925-29 _ 5.0 17.9 8.9 0.7 8.2 0.6 7.0 12.1 8.5 61.1 14.7 89.71930-34 _ 5.7 17.7 10.1 0.8 8.3 0.6 7.1 10.4 7.4 61.3 12.6 77.11935-39 _ 5.7 15.5 8.9 1.0 7.5 0.8 7.2 10.2 7.3 56.4 14.0 79.11910-44 _ 4.5 17.4 7.8 1.0 6.8 0.7 8.2 13.7 11.3 59.3 16.4 97.31945-483 _ 4.1 16.7 6.8 1.2 8.5 1.0 7.8 11.4 8.9 56.0 18.6 104.2
5-year AverageDanube Basin' Other Europe
(excl. U.S.S.R.) World (partial)5
Area I Yield I Prod. Area I Yield I Prod. Area I Prod.1909-13 6.6 12.7 8.4 33.5 15.0 50.4 135.5 185.71914-18 10.0 12.0 12.0 22.9 13.6 31.1 129.3 171.21920-24 11.6 10.1 11.7 27.3 13.5 36.8 137.9 186.21925-29 12.9 11.5 14.8 27.6 15.3 42.1 145.9 196.91930-34 13.7 12.0 16.4 27.2 15.7 42.7 149.7 186.41935-39 13.6 12.3 16.7 26.4 16.1 42.5 145.2 189.81940-44 _________ 11.0 10.8 11.9 22.6 15.6 35.2 141.8 195.41945-483 10.6 10.2 10.8 21.7 14.3 31.0 140.8 194.5
1909-13 _ 6.1 6.6 4.0 3.1 8.0 2.5 4.1 13.3 5.4 20.0 9.7 19.41914-18 -- 6.8 6.6 4.4 4.2 7.1 3.0 6.0 11.4 6.9 23.5 10.0 23.51920-24 -- 6.5 8.4 5.4 4.0 7.5 3.0 9.3 10.5 9.8 26.2 9.2 24.11925-29 _. 7.9 8.2 6.5 5.2 7.2 3.7 9.7 12.5 112.1 25.0 9.4 23.41930-34 -- 7.7 9.0 6.9 6.2 8.2 5.1 10.8 9.0 9.7 23.1 9.0 20.71935-39 _ 6.7 9.4 6.3 5.3 8.8 4.7 10.7 8.2 8.7 24.7 8.8 22.01940-44 _ 6.0 11.2 6.6 4.1 7.6 3.1 9.5 12.5 11.8 23.2 11.3 26.21945-483 _ 5.4 10.4 5.6 5.2 8.7 4.6 10.2 10.1 10.3 28.9 11.8 34.1
5-year AverageDanube Basin' Other Europe
(excl. U.S.S.R.) World (partial)'
Area I Yield j Prod. Area I Yield I Prod. Area I Prod.1909-13 5.8 11.2 10.5 42.1 13.2 51.7 99.0 106.71914-18 8.4 10.8 7.8 29.2 12.0 35.1 97.1 95.31920-24 7.7 11.0 7.0 33.5 12.2 40.8 105.8 105.91925-29 9.0 10.8 9.7 36.6 13.4 49.2 117.8 123.71930-34 9.5 10.5 10.0 38.1 14.3 54.3 122.1 127.71935-39 10.2 12.0 12.2 37.6 14.6 54.9 124.6 132.61940-44 8.4 9.5 8.0 31.0 13.8 42.8 110.4 120.71945-483 7.5 8.7 6.5 29.7 12.3 36.4 115.4 118.0
BREAD GRAINS'
5-yearAverage
Argentina Australia Canada United StatesArea I Yield I Prod. Area I Yield I Prod. Area I Yield I Prod. Area I Yield I Prod.

Long-Term Trends in Grain Production and Trade
The principal features of bread-grain production are:
In the following section the broad historical movements in grain production andtrade are reviewed to provide a clearer understanding of the present world grain situa-tion. Tables 21 and 22 summarize the statistics of production and trade over a 40-year period for the principal producing and trading regions of the world.
An expansion of about 25 percent in world output between 1909-13 and thethirties, a decline during World War II, and an increase over the prewar level in 1948.
A large expansion in the United States during and after each world war,achieved on the first occasion by an increase in area and on the second by an increasein area and in yield (see Chart 7).
A rapid increase in Canada between 1910 and the mid-twenties and relativestability thereafter (see Charts 8 and 9).
A steady expansion in Argentina up to World War II, due largely to in-creasing yields; a reduced output in the last few years.
TABLE 22.--LONC-TERM TRENDS IN GRAIN EXPORTS (GROSS)
In million metric tens
'July-June year.24-pear average.Bulgaria. Hungary, Rumania, Yugoslavia.
54
5-year Averages'Argentina Australia Canada
Bread I Coarsegrain I grain
I TotalI grain
Bread I
grain I
Coarsegrain
I TotalI grain
Bread j Coarsegrain I grain I
I Totalgrain
1909/10-1913/14 ___ 2.3 3.6 5.9 1.4 0.05 1.4 2.6 0.3 2.9
1920/21-1924/25 _ _ 4.1 3.9 8.0 2.5 0.05 2.5 6.5 0.8 7.31925/26-1929/30 ____ 4.4 6.0 10.4 2.3 0.03 2.3 8.5 0.9 9.41930/31-1934/35 ____ 4.1 7.6 11.7 3.5 0.05 3.6 6.1 0.4 6.51935/36-1939/40 3.4 6.3 9.7 2.7 0.08 2.8 5.0 0.5 5.5
1945/46-1948/49' 2.1 2.7 4.8 2.1 0.30 2.4 7.1 0.6 7.7
5-year Averages'U.S.A. Danube Basin' U.S.S.R.
Bread I Coarsegrain I grain
I TotalI grain
Breadgrain
I Coarse I TotalI grain I grain
Breadgrain
Coarse I
grainTotal
I grain
1909/10-1913/14 ___ 2.9 1.4 4.3 3.6 2.4, 6.0 5.3 5.5 10.8
1920/21-1924/25 8.0 2.6 10.6 0.6 1.8 2.4 0.5 0.2 0.71925/26-1929/30 5.0 1.5 6.5 1.4 2.9 3.6 0.7 0.5 1.21930/31-1934/35 1.7 0.3 2.0 1.2 2.6 3.8 1.8 0.9 2.71935/36-1939/40 1.5 1.3 2.8 L9 L3 3.2 0.8 0.4 1.2
1945/46-1948/49' 2.2 2.9 15.1 0.2 0.2 0.8 0.3 1.1
1909/10-1913/14 1.8 0.5 2.3 19.8 13.8 33.6
1920/21-1924/25 0.1 1.0 1.1 22.3 10.3 32.61925/26-1929/30 0.7 2.2 2.9 23.0 13.3 36.31930/31-1934/35 1.2 1.4 2.6 19.6 13.3 32.91935/36-1939/40 1.4 2.5 3.9 16.7 12.4, 29.1
1945/46-1948/49' 0.5 0.6 1.1 24.8 7.6 32.4
Others World5-year Averages' Bread
grainCoarsegrain
Totalgrain
Bread I
grain I
Coarsegrain
I
1
Totalgrain

Cha t 8.Wheat Yields in Argentina, Australia, Canada, and Europe,1885-1948
55
1885 1895 1905 1915 1925 1935 1945
Some expansion in Australia in the period 1925-34 and fair stability there-after except for contraction during World War IL when export outlets were limited.
In Europe a slow increase (due to improving yield, especially in Western andCentral Europe) over the entire period, interrupted by significant declines duringand after the two wars.
For the -U.S.S.R. a drastic reduction after World War I, subsequent recovery,rapid progress, serious devastation again in World War il, followed by another re-covery.
The principal features of bread-grain trade are:
A doublin, of world exports between 1885-90 and 1909-13 as the Canadianprairies and Argentina were developed for wheat; expansion in the twenties, declinein the thirties, and a very high level :since World War II.
.Elimination of India, Russia, and the Danube countries as exporters by WorldWar I, the two latter recovering in part, only to be eliminated again in World War II.
Rise of Argentina, Australia, Canada, and the United States as the "Big Four"in the export trade after World War I, United States exports subsequently decliningagain only to re-emerge larger than ever after World War II; a :fall in Argentina'sexports from the beginning of this war.
An increase in Europe's imports during the twenties to 3-4 million tons (25-33percent) above the 1909-13 level; a dropping back below this level in the late thirties;a rise to new heights after World War
The appearance of the Far East for the first time as a substantial importer ofbread grains after World War II.
The principal features of coarse-grain production are:
I. Gradual expansion in world área and production, interrupted during WorldWar I and the depression of the thirties.
Bushels per acre Quintals per hectare
14Eu rap@m20
Canada12
. ...L. . . ....5 10
10t,----4......
8
Argontinar 6
5Australia FAO Chart 300
4

Chart 9.Wheat (Sown) Area in Argentina, Australia, and Canada,1885-1948
Million acres30
10
Argentina
56
A/
Million hectares12
2
FAO Chart No. 301o1885 1895 1905 1915 1925 1935 1945
Tremendous expansion in the United States during the forties resulting fromincreased yield (see Chart 7).
In Argentina an expansion up through the early thirties; comparative sta-bility thereafter until the forties, when there was a significant decline; increase inyields per hectare until the late twenties (see Charts 8 and 9).
In Europe, except for the declines during the two war periods, relativelylittle change in area or production.
The principal features of world trade in coarse grains are:
1. Slow recovery after World War I of Europe's imports, which is the principaldemand, to the 1909-13 level; slight decline in the latter thirties; in 1945-48, importsat little more than half the prewar level.
9- A fall during the interwar period to 1.5-3 million tons in exports from,.ountries which, before World War I. exported al-
3. The filling ot
o
25
20
15
10
8
6
4

extent, by Canada and from 1925 onward by Argentina, which came to contributemore than 50 percent of world exports but with great fluctuations from year to year.
Gradual decline in United States exports as a result of increased domesticdemand and later a succession of drought seasons; some expansion after World WarII to narrow the gap caused by the great reduction in Russian, Danubian, and Argen-tinian exports.
Decline in Canada's exports from 1 million tons in the twenties to half thisvolume in the thirties; large exports during World War II to the United States, andsubsequently a falling back to the prewar volume.
Considering the world as a whole, the volume of grain exports has been remark-ably stable over the past 40 years. Within this framework, however, there have beenmany shifts in the roles of individual exporting countries, the most remarkable flex-ibility having been shown by the United States which has twice expanded its exportsenormously to meet a great need. In respect of production, the most striking featurein the world picture has been the increased yields per unit of area in the UnitedStates over the past 10 years. To a lesser extent the same has happened in Argentinaover a longer period in respect of wheat, but nowhere else are significant and substan-tial trends discernible in either area or yield.
2. RICE
REDUCED PRESSURE of import demand on the relatively low exportable supplies is themost significant development in the world rice situation for the current year.
High prices of rice in the face of declining prices of wheat in the world markets,in combination with the low purchasing power of rice consumers, have tended to shiftsome of the Far Eastern import demand in the past three years from rice to cheaperfood grains. The slow rate at which abandoned rice lands have been restored to culti-vation in some of the exporting countries contrasts with the expansion of area underfood crops in the importing countries. In some of the latter, however, rice productionhas apparently failed to increase in the same proportion as the planted area.
The programs and projections of the food-deficit countries of the Far East, whichcurrently account for 80 percent of world rice production and trade, call for expan-sion in area both of rice and of other food grains, and in some instances also higheryields per hectare. According to the programs reported by governments (and projec-tions for those that have not reported) world export supplies of rice in 1950/51 willbe more than one-third greater than in 1948/49. The rice-importing countries, how-ever, do not expect to increase their rice imports appreciably over 1948/49. Thusthere is a possibility that large stocks of unsold rice may pile up in the Asiatic ex-porting countries uniess a reasonable parity of export prices of rice and other com-peting cereals is restored in the near future. But there are also several factors thatmight prevent complete achievement of the projected increase in exportable supplies,including a continuation of disturbed political conditions in some countries, failureto obtain sufficient fertilizer and other production requisites, and in some casesinability to increase transportation facilities.
57

Current Position
World production and consumption of rice have not yet reached the prewar level.Despite an increase of 3 percent over the prewar area under rice, world productionin 1948/49, estimated at 144 million tons in terms of paddy, is 2 percent below theprewar average. Production has exceeded the prewar level everywhere except inEurope and Asia. In Asia, though total production (estimated at 135 million tons)shows an increase of 2 million tons over the previous year, it falls short of the prewaraverage by 7 million tons (equivalent to nearly 5 million tons of cleaned rice). Sincethe reported area under rice in Asia has more than recovered the prewar level, theestimated deficit in production is perhaps open to question. Not only do the systemsof crop reporting in Asiatic countries usually lend themselves to an underestimationof production, but the probability of such underestimation is greater under existingconditions of shortage, one of the major contributory factors being the tendency ofthe rice growers to understate yields in order to reduce their liability to deliver grainsurpluses to the government at controlled prices.
As compared with prewar, the 1948/49 rice area in India has increased by 10percent, whereas the estimated production shows a decline of 2 percent. In Pakistan,likewise, the percentage increase is higher in area than in estimated production. Therice economy of South China has been strengthened by the recovery of production inthe rice-surplus province of Taiwan (Formosa). However, recent floods and politicaldevelopments in Central and South China may have changed the picture for that
TABLE 23.-ESTIMATED WORLD AREA AND PRODUCTION OF RICE, PREWAR, 1946/47, 1947/48, AND1948/49
Region
Far East'Near EastEurope (excl. U.S.S.R.)North AmericaLatin AmericaAfrica and OceaniaUnspecifiedTOTAL
1934-38
Exports 1 Imports
TABLE 24.-INTERNATI0NAL TRADE IN RICE (MILLED BASIS), 1934-38, 1947, 1948, AND RECOMMENDEDALLOCATIONS FOR 1949
Exports 1 Imports Exports 'ImportsThousand metric tons
1947 1948
lIneludes estimated rail- end river-borne trade between India and Pakistan.
58
FAO allocationsrecommended,
1949Exports 1 Imports
2,82887
38020
27747
174
3,813
RegionArea Production (paddy)
1934/35-1938/39 1946/47 11947/48 1948/49
1934/35-11938/39 11946/47 1947/48
Million hectares Million metric tons79.1 80.0Far East 79.7 77.6 140.5 129.9 132.1
Near East 0.6 0.7 0.8 0.8 1.3 1.8 2.0Europe (excl.
U.S.S.R) 0.2 0.2 0.2 0.3 1.1 0.8 0.9North America 0.4 0.6 0.7 0.7 1.0 1.5 1.6Latin America 1.3 2.5 2.4 2.3 2.0 4.0 3.9Africa and Oceania 1.5 2.3 1.9 1.9 1.5 2.1 2.0
WORLD TOTAL (excl.USSR) 83.7 83.9 85.1 86.0 147.4 140.1 142.5
8,076 6,267 1,609 1,942 2,367 2,815 2,615125 52 198 33 337 55 348183 1,262 0 44 29 126 14868 31 445 21 384 17 46594 364 294 438 346 294 21718 397 18 76 21 170 20
10 78,564 8,373 2,564 2,564 3,484 3,484 3,813
11918/49
133.72.1
1.11.73.62.0
144.2

country. Rice production in Japan, Malaya, and the Philippines has exceeded theprewar level, and a substantial recovery is also reported from Indonesia and SouthKorea. Production of other food grains in many of these rice-deficit countries hasincreased at a relatively faster rate than rice. The reported production of wheat,maize, barley, and oats in 1948 in the rice-deficit countries of Asia as a whole isgreater by more than 3 million tons than the prewar volume. Since the continent ofAsia has stopped exporting wheat as it did in prewar years and is now importing ona substantial scale, it is estimated that the total supply of these food grains in the rice-deficit countries has exceeded the prewar availability by about 9.5 million tons. Sta-tistics on production of millets (including sorghum) are not available for manycountries, although these hardy grains are important sources of food calories in someparts of Asia.
Postwar recovery of rice area and production in the exporting countries of Asiahas been comparatively slow, one of the major limiting factors being the inadequacyof incentive payments to growers either in cash or in kind. In Burma and Indo-Chinathe restoration to cultivation of rice lands abandoned during the war continues to beretarded by political unrest and civil disturbances. In Thailand conditions for expan-sion are relatively favorable. Production is continuing to expand in Egypt, althoughrice competes with cotton for the limited land and water resources.
Rice cultivation in the United States and other surplus-producing countries ofthe Western Hemisphere appears to have reached its postwar peak. Difficulties of dis-posing of exportable supplies at remunerative prices have apparently led to a restric-tion of rice area and production in Brazil. The tendency of the Far Eastern importdemand to shift from rice to cheaper food-grains exportable from the hard-currencyareas and the emergence of many prewar rice-importing countries of Latin America asself-sufficient units have set a problem of agricultural adjustment for the major rice-surplus areas of the Western Hemisphere. These countries are now faced with thealternative of substantially reducing rice production costs or of diverting rice landsto other export crops.
World trade in rice in 1948 improved considerably over the previous year; buttotal exports, amounting to 3 5 million tons, were still 60 percent below the prewaraverage. Supplies available for export in 1949 show only a slight increase over thedeclared export availability in the previous year. Total export availability fromSoutheast Asia (Burma, Indo-China, and Thailand), estimated at 2.6 million tons in1949, is appreciably larger than the reported shipments from these countries in theprevious year, but falls short of their prewar annual exports by 3 million tons. In ad-dition, Korea (which formerly exported 1.2 million tons) is hardly exporting at all,while Taiwan's exports (formerly 600,000 tons) are now part of China's "indigenous"production. Because of the relatively higher prices and balance-of-payment problems,shipments of rice from the Western Hemisphere in 1949 may be considerably lessthan the declared export availability of nearly 0.7 million tons. Exportable suppliesof rice from Italy in 1949, estimated at 148,000 tons, show a gain over the reportedshipments in 1948. Since international allocation recommendations provide for ex-ports of 0.4 million tons to Europe and 0.5 million tons to other non-Asiatic destina-tions, the rice-deficit countries of the Far East may receive in 1949 not more than 2.9million tons, or about the same quantity as in 194.8. This represents a decrease of 3.4million tons or 54 percent from the prewar net imports, mainly affecting India andJapan.
59

The critical shortage of rice over a protracted postwar period has forced pricesto very high levels. Export prices have been advanced faster in the low-cost produc-ing areas of Southeast Asia than in the high-cost producing countries of the WesternHemisphere. This has resulted in some narrowing of the price differentials amongrice-exporting countries, though United States and Latin American export prices arestill the highest.
In exporting countries of Asia, since the prices paid to growers are fixed at arelatively low level in line with domestic rice prices, the high prices charged by gov-ernments for rice exports have increased government revenues at the expense of theconsumers of imported rice. Indeed, in the deficit countries of the Far East withoutheavy subsidy payments by governments, imported rice is at present far beyond thereach of most needy consumers. To give an instance, the landed cost of Burma riceat Calcutta, which averaged £6.5 per metric ton in 1938, rose to £45.5 in 1948. Inorder to equate the retail sale prices of domestic and imported rice, the Indian Gov-ernment paid a subsidy of £12.5 per metric ton of rice imported. The price differen-tials between domestic and imported rice in India have tended to increase in 1949 asthe inflationary pressure on domestic food prices is being checked.
Export prices of rice in 1948 were generally six to seven times as high as in1934-38. Because of the shortage, rice prices have risen more sharply in recent yearsthan in the years following World War I, while the inflationary pressure on commodityprices in general vas less severe in 1948 than in 1920. Or again, as compared withthe export prices ruling in the depression period of the thirties, the 1948 prices
TABLE 25.-Rice PRICES IN SELECTED EXPORTING COUNTRIES
DateBurma rice
(Small mills special,f.o.b. Rangoon)
60
sounan : Office of Foreign Agricultural Relations, U. S. Dept. of Agriculture (excepting Burma riceprices).
TABLE 26.-PRICES OF RICE AND WHEAT, PREWAR, 1947, 1948, AND 1949
Canadian wheat(Basis No. 1 Northern in store, Port
William/Fort Arthur-exportable tonon-mutual aid countries)
Country Description 1936-40 1948First
semester1949
U.S.A. Long grains, 35 percent broken, f.o.b. New(U.S. dollars per 100 lb. export quality)
Orleans 3.00 12.70 8.60
Brazil Japanese 1st grade, Lob. Rio Grande doSul 2.50 8.60 8.55
Burma Small mills special, f.o.b. Rangoon 1.47 6.84 6.84
Indo-China Round white, 25% broken, f.a.s. Saigon(excl. export tax) 1.66 6.96 6.96
Thailand White No. 1, 35% broken, ex miHs Bangkok(excl. export tax and cost of gunnies) 1.35 6.30 6.30
U.S. dollars per metric tonPrewar 32.4 35.21947 132.2 103.71948 150.7 95.51949 (Jan.-June) 150.7 80.51949 (July) 150.7 74.9

showed a tenfold increase. As Table 26 shows, the price spread between rice andwheat in the world markets, which had widened to an unprecedented extent in the firsthalf of 1948, has widened further still with the declining trend of wheat prices sincethe middle of the year.
This resulted in greater consumption of wheat and coarse grains in the rice-deficitcountries. Imports of cereals other than rice into the Far East llave risen to the recordtotal of 7 million tons in 1948/49. If the price disparity between wheat and rice con-tinues, imports of wheat and coarse grains into the Far East may be equally heavy in1949/50.
Long-terrn Irends and Future OutlookNo world production figures of any reliability are available over a long series of
years. However, various evidence suggests that between 1909-13 and 1934-38 produc-tion probably increased by about 12 to 15 percent. World War II caused a severe set-back to production in Burma, China, and Indo-China and an increase of 70 percent inthe Western Hemisphere. Yields per hectare showed no discernible trend up to WorldWar II except in Japan, Nvhere they increased steadily; they have declined during thepostwar years in some countries, notably India. The Indian yield is now half that ofthe United States, one-third that of Japan, and one-quzirter that of Italy.
Some of the major deficit countries of Asia are now aiming at national self-sufficiency in their planning of agricultural production. Similar programs initiatedunder a different set of circumstances during the economic depression of the thirtiesseriously reduced import demand for rice in Indonesia, the Philippines, and someother areas. However, an expansion of import demand in Ceylon, India, Malaya, andFrance, stimulated by low prices prevailing at that time, helped to maintain the levelof rice exports from Burma, Indo-China, and Thailand.
For many decades before the Iyar, rice production in Asian countries other thanJapan was expanded by extending the planted area rather than by improving tradi-tional cultural practices. The potentialities for further extension of the rice area inmany Asian countries are by no means exhausted. The area under rice in India andPakistan has increased by 3 million hectares over prewar, though much of this ex-pansion has been broug,ht about by diverting cultivated land from nonfood crops. Inthe rest of Asia there are 3 million hectares of prewar rice lands yet to be broughtunder the plow, chiefly in Burma, China, and Indo-China. I3ut the fact that Japanraised the hectare yield of rice by more than 50 percent in the course of four dec-ades has inspired provisions for a substantial increase in yields by similar methods inall recent long-term plans for expansion of rice production in the deficit countries.
The production programs of the rice-deficit countries of the Far East envisage anincrease of 2 million tons in indigenous rice supplies within the next two years. Thismodest increase in rice output by 1950/51 is feasible even on the basis of the existingplanted area, provided that the hectare yields in the Indian subcontinent are partiallyrestored to the prewar levels. The programs also envisage an increased output ofabout 1 million tons of wheat and about the same quantity of other cereals. Total im-ports in the Far Eastern countries in 1950/51 may amount to 3 million tons of rice asagainst 3.6 million tons of wheat. The prospective supply situation in the rice-deficitcountries is shown in Table 27.
61

62
lExcluding millets. Prewar production of millets, sorghum, and other miscellaneousthe Far East is estimated roughly at 36 million tons.
coarse grains in
In 1950/51 total supplies of rice, wheat; and maize available to the Far East(after allowing for exports and imports) might be 158 million tons compared with152 million prewar. Even allowing for some expansion in millets, about which littleis known, this would not restore the per caput grain availability in the Far East toprewar levels. Moreover, in countries lacking transport facilities, an increase in agri-cultural production is not synonymous with increased availability of food. Becausepopulations migrated on a vast scale in recent years from surplus to deficit areas andfrom rural areas to urban centers, the shortage of rice and other food grains hasvaried in its intensity from country to country and from one part of a country toanother. Without still higher production or increased imports, food consumption in1950/51 in many urban and rural areas of the Far East may not be above the lowlevels of 1948/49.
International trade in rice, which grew from 4.7 million tons in the early twentiesto 8 2 million tons in the late thirties, is unlikely to recover very rapidly (India, China,and Japan, which absorbed more than half of the prewar world exports, are togetherimporting 3 million tons less than prewar). However, by 1950/51, exports fromSoutheast Asia should increase by 1 million tons, or more than one-third, while fur-ther increases are expected from Egypt and the Western Hemisphere. On the importside, the deficit countries of Asia are striving to reduce their dependence on imports;Europe may take less than half its prewar average of 1 million tons, of which asubstantial proportion was used as animal feed on account of its cheapness.
There remains the question whether, in the event of a material reduction in riceprices, the deficit countries of Asia would shift some of their import demand fromwheat and coarse grains to rice. Asian countries have been forced to import over 7million tons of cereals other than rice, mainly from hard-currency areas, in 1948/49as against 1.2 million tons prewar. As the export availability of rice from SoutheastAsia increases, and a reasonable parity between export prices of rice and wheat is re-established, a substantial substitution of rice for wheat in Asian imports is likelY tooccur. Ceylon, China, India, and the Philippines, together with Hong Kong andMalaya (through the United Kingdom), are obligated under the International WheatAgreement to take from 1.5 to 2 million tons of the cereal annually for four years ascompared with their current imports of 4 million tons. Japan, at present importingless than 2 million tons, is not so obligated, being a United States Government re-sponsibility, but will depend on United States shipments. The possibility of substan-tial supplies of unsold rice accumulating in the exporting countries is therefore boundup with the prospective price relationship between rice and other cereals in the worldmarkets.
(- Million m tric tonsProduction 85.8 2.5 84.6 61.6 64.8 66.3Imports +4.5 +2.8 +3.0 +1.3 +7.0 +4.0Exports 0.2 0.6TOTAL AVAILABLE
SUPPLIES 90.1 85.3 87.6 62.3 71.8 70.3
TABLE 27.SUPPLIES OF RICE AND OTHER CEREALS, RICE -DEFICIT COUNTRIES OF THE FAR EAST'
R ce (cleaned basis) Wheat, maize, barley, and oats1950/51 1950/51
Item Prewar 1948/49 (Targets and Prewar 1948/49 (Targets andprojections) projections)
Should rice prices begin to decline, the high-cost exports will naturally be af-fected first; in fact, some of the surplus-producing countries of the Western Hemi-sphere are already in difficulties. The Asian low-cost producers are in a position tomake up much of tbe reduction in their receipts from rice exports by increasing thevolume of rice shipments.
3. SUGAR
THE YEAR 1949 marks a turning point in the postwar histor,, of sugar. The periodof sugar shortages, which began in 1942, has ended. Furthermore, the 1948 cropprovided indications of the nature of the prospective sugar problemindicationswhich the 1949 crop is likely to substantiate. Table 28 shows the distribution ofworld sugar production by continents, as compared with prewar.
One of the outstanding features of the 1948 production picture was a markedincrease in European output. The 1948 crop (excluding the U.S.S.R.) of close to 6.9million metric tons (raw value) exceeded the 1934-38 average and it was more than2 million tons above the 1947 output. The greater domestic: production, as comparedwith the past few years, enabled many of the European importing countries to in-crease consumption. They became less dependent OT1 imported supplies, and especiallyon dollar area supplies.
Another feature of the 1948 production picture was the continued production lagin some of the major prewar exporting countries outside the Western Hemisphere. Ofthe major Far Eastern exporters, Taiwan (Formosa), the Philippine Islands, Java,and Madura, which before the war used to export about 2.3 million tonsonly thePhilippines made substantial recovery; and even Philippine exports in 1949 were onlyabout half of prewar. However, the production in other major Far Eastern exportingareasAustralia, Fiji, the Hawaiian Islands----was practically the same as in the lastprewar years.
Moreover, Western Hemisphere, production more than compensated for the de-cline in Far Eastern supplies. Although the 1948/49 Cuban production of 5.2 milliontons was lower than that of the previous year (reduction in Havana and Matanzasprovinces), it was still nearly double the average crops of 1930-39. No less significantwas the production increase in Brazil and Mexico. Taking the Western Hemisphere asa unit, production increased from about 9.0 million tons in 1934-38 to 13.2 milliontons in 1948/49. Table 29 sets forth the changes, as compared with prewar, in theproduction and exports of the major sugar exporting countries of the world.
Indications are that notwithstanding the substantial increase in world production,carry-over stocks at the end of 1949 will not be burdensome. Consumption increasedin many areaseven in the eight or ten European countries which still rationed sugar--and such stock increases as will have taken place will not be burdensome and willnot weigh heavily on the market. The large 1948 crop had the inevitable effect onprices, and fluctuations at the beginning of the year were considerable; but high Euro-pean demand, made effective through ECA financing, and a substantial purchase of
63

1September 1947-August 1948.°Calendar year.'Preliminary."Postwar boundaries.
Cuban sugar by the United States Government for distribution in Germany and Aus-tria stabilized the world market in the spring of 1949 at about 4 U.S. cents a pound.It is significant that from 1 October 1948 to 31 May 1949 the United States Govern-ment made available, through ECA alone, a total of $141 million for the purchase ofsugar and related products.
The slowness of Far Eastern exporting countries to rehabilitate their prewar pro-duction and exports has given the Western Hemisphere producer another year ofrelative prosperity. While indications are that the price of 4 cents a pound which pre.
TABLE 28.--SUGAR PRODUCTION BY CONTINENTS (RAW VALUE)
Continent
AfricaAsiaEurope (excl. U.S.S.R.)North and Central AmericaSouth AmericaOceania
Country
World total (beet)World total (cane)WORLD TOTAL (excl. U.S.S.R.)
TABLE 29.-SUGAR PRODUCTION AND EXPORTS OF MAJOR EXPORTING COUNTRIES, PREWAR AND1947/48
Cane Sugar ExportersBrazilCubaDominican RepublicPeruNetherlands IndiesPhilippinesMauritiusAustraliaBritish GuianaTrinidad and TobagoBarbadosReunionJamaicaMozambiqueUnion of South AfricaFijiPuerto RicoHawaiiMexicoTOTAL OF ABOVE
Beet Sugar ExportersCzechoslovakiaGermanyHungaryPolandTOTAL OF ABOVE
1934-38 I 1947/48 I 1948/49
7'housand metric tons
1,170 1,439 1,4859,230 7,613 8,2046,498 4,439 6,6946,900 10,897 9,9622,133 3,158 3,2741,834 1,545 1,9627,967
19,79827,765
6,373 8,22822,718 23,35329,091 31,581
Production Exports1935-39 1 1947/48 1935-39 I 1947/481
Thousand metric tons
1,051 1,720 20 2542,888 6,056 2,664 6,189
445 422 336 344406 483 297 321
1,313 91 1,100 601,022 452 806 '252
291 350 282 340811 613 397 143190 171 182 145134 118 133 81121 58 89 82
83 95 75 5108 196 92 17672 79 66 '49
452 533 199 '10130 142 131 144884 1,003 793 1,013894 790 884 '714330 650 0 100
11,625 14,024 8,646 10.422
3,202 1,752
213 988
2081 161
322 259
654 3511,925 782
126 69497 '550

vailed on world markets was not greatly above the cost of production, allowing forthe increased cost of other foods and industrial goods, the large quantities of sugarproduced and exported made possible a relatively high degree of prosperity in thesugar islands. Most of the shortfall of about 425,000 tons in the Philippine quotashipments to the United States in 1949 was allocated to Cuba, as well as the shortfall inthe U.S. domestic production. In addition, Western Hemisphere countries had a muchlarger share of the European markets than in prewar years.
Cuban exports (see Table 30) to countries other than the United States during thecrop year September 1947/August 1948 totaled 3.2 million metric tons, as comparedwith an average of about 1 million tons in 1938/39. These exports will be consider-ably lower during the current year, but still substantially above the prewar average.
Unfortunately, the 1949 equilibrium is obviously a precarious one and presentindications are that, on the balance, its continuation during 1950 cannot reasonablybe expected. Although it is too early to assess the 1949 crop, indications are thattotal world production will be higher than in 1948. In this connection it must beborne in mind that the price and market effects of changes in supply or demand (andespecially in the supply of, or the demand for, marginal "dollar" sugar) are likely tobe out of proportion to the quantities involved. While European countries will beable to utilize dollar resources made available through ECA to purchase indispensablesugar imports, crop prospects indicate that Europe's own domestic production may beabout 300,000 tons higher than last year. A slightly larger crop is indicated in theUnited States. The continued efforts to increase production in overseas territories ofEuropean countries, notably in the French Union and in British colonial territories,are beginning to bear fruit, and supplies from these soft-currency areas will probablybe higher. More important still, perhaps, is the anticipated increase in Far Easternproduction.
The production potentialities of the Far East must of course weigh heavily inany analysis of the outlook for 1950/51 and beyond. It is reasonable to assume thatboth Java and the Philippines will contribute substantially more to world exportsthan during the current year. While further increases in area and production inEurope are likely to be comparatively small, the programs submitted by WesternEuropean countries to OEEC do contemplate production increases. Nor can it be
TAI3LE 30.--CUBAN SUGAR EXPORTS, 1938/39 AND 1947/48 (RAWVALUE)
65
lineludes 654,267 for Germany, 465,805 for Japan, and 175,111 forItaly.
( Metric tons )
United States 1,606,114 2,951,788
United Kingdom 670,529 871,884France 92,126 135,820
Belgium 118,215 141,928
Netherlands 27,323 219,659
Norway 20,268 10,872
Sweden 11,177 20,055
Switzerland 21,882 71,001
Canada 1,365 157,206Central and South America 17,152 57,364
Africa 33,752 35,990
U.S. for refining and re-export 22,706 30,034
Other exports 14,949 11,485,575
TOTAL 2,657,558 6,189,176
Country 1938/39 I 1947/48

TABLE 31.--TiVonLo PRODUCTION OF CANE AND BEET SUGAR (IN TERMS OF RAW SUGAR), 1853/54, TO
Souuoz: Report ou the Sugar Beet industry at Home awl Abroad.U.K. Board of Trade, 1931, for pre-World War I figures.
assumed that world consumption will keep pace with the production increase andmaintain the market equilibrium of 1949. On the contrary, the policies to increaseproduction, domestically and in overseas dependent areas, are motivated by the de-sire to conserve foreign exchange, and especially dollar exchange, notwithstanding thefact that such sugar is more costly than imported "free" sugar (sometimes almostdouble the price of Cuban sugar).
Except in the United States, no major economies in beet-sugar production havebeen developed during the past decade or more. In the United States a number ofdevelopments--especially the improvements in mechanical harvestinghave reducedproduction costs; but improvements in varieties of beets themselves have been com-paratively small during the past decade. It is doubtful whether all of the mechanicaldevelopments could be applied to the smaller beet fields of European countries.
Long-term Trends
Some of the developments during 1947-49 indicate an intensification of the trendsand policies that undermined the world sugar market between the two world wars andthat led to the steep decline in prices which produced poverty and unemployment inmost of the major exporting countries.
The nineteenth century was characterized by steady and continuous growth in theproduction of both cane and beet sugar. Stimulated by government bounties, beet-sugar production expanded rapidly during the last quarter of the nineteenth centuryand the first decade of this century, especially in Europe. But cane-sugar productionmoved almost as rapidly. The removal of some bounties to beet sugar and improve-ment in methods of cane-sugar manufacture and of cane cultivation and breedingenabled cane to forge ahead rapidly during the decade before World War I. Althoughproduction more than doubled between 1893 and 1913, increasing from 9.8 milliontons to about 19.6 million tons, prices remained relatively stable. The average priceof raw sugar in public warehouses in Cuba fluctuated between 2.4 and 2.8 cents apound. In only three years between 1900 and 1914 did the average price declinebelow 2 cents a pound.
66
1935-39
Year Total Canej
Beet
Thousand nzetlic tons )
1853/4 2,483 2,282 2011863/4 2,952 2,517 4351873/4 4,530 3,290 1,2491883/4 7,296 4,860 2,4361893/4 9,817 6,006 3,8111903/4 12,545 6,666 5,8791913/4 19,615 10,744 8,8711925-29 26,700 18,100 8,6001930-34 27,100 17,800 9,3001934-38 30,065 l9,798 10,287

The equilibrium was decisively- upset by World War I. Denied access to its pre-war supply sources in Germany and Austria, the United Kingdom had to turn to Cubato fill the gap. Cuban production was expanded also to meet unprecedented require-ments from the United States and to offset the decline in production in France andother European countries. By the end of World War I, Cuban production had doubled.In the meantime, production in the Far East aho began to climb rapidly. At the turnof the century Java produced about 800,000 tons of sugar (raw value) ; productiondoubled in 20 years, and by 1928 it exceeded 3 million tons. After World War IEuropean beet production recovered rapidly and cane production increased in theUnited States protected areas. Technical improvements brought about great increasesin the per hectare yield of sugar in Hawaii, Java, and Fiji; there was little change inCuba. Table 31 shows the development of cane and beet production between 1853/54and the beginning of World War II.
While productio-n expanded rapidly in sugar-exporting areas, far-reachingchanges were taking place in sugar-importing countries. Programs to increase domes-tic production were launched everywhere. The increase in European beet productionhas been pointed out; no less significant similar policies were pursued in other areas.India, which had provided a market for close to a million tons of Java sugar annually,extended protection to domestic industry, which soon replaced imports. During theperiod 1934-38, total imports into India declined to about 100,000 tons a year. InAsia as a whole, annual imports dropped from 2.3 million tons during 1925-29 toabout 700,000 tons during 1934-38.
It was inevitable, under the circumstances, that prices should decline and stocksaccumulate. Indeed, the price of sugar fell to less than 1 cent per pound during1931-33, as compared with an average of 2.5 cents in the period 1885-1914. Thecheapest producing areas had to institute production controls, which were only partlysuccessful in alleviating the situation, since high cost producing countries continued toexpand domestic production. The International Sugar Agreement stabilized the posi-tion without improving it.
History has been repeating itself during the last few years. During World WarII, as during World War I, Cuba greatly expanded production to supply sugar forthe United Kingdom and the United States, which had lost its Philippine supplies.At the same time, production began to increase in other Western Hemisphere coun-tries. The demand for Western Hemisphere supplies remained at a high level until1949. However, as after World War I, European beet production has recovered; in-deed, as pointed out previously, efforts to assure self-sufficiency are greater than ever.While production expanded rapidly in the Far East after World War I, efforts have
been made since World War II to expand production in the colonial overseas terri-tories. It is only the failure of some of the Far Eastern producers to regain their pre-war production levels that has forestalled a collapse of the sugar market until now.
Restrictions on international trade in sugar promise to become more severe thanthey were in prewar years. Even in the last prewar year, when the InternationalSugar Agreeme.nt was in operation, requirements for "free" world supplies (that is,markets not protected by preferences or other special arrangements) amounted toonly slightly more than 3 million tons as compared with world production of over 30million tons. The tendency in the postwar years has been to reduce furdier the freemarket requirements. The major "bloc" which emerged between the wars in the worldsugar trade has become more significant.
67

First. from the standpoint of magnitude, is the United States market, with a con-sumption of 6.5 to 6.8 million tons. (It should be pointed out parenthetically thatUnited States per caput consumption has not recovered to the prewar level notwith-standing the enormous increase in national income, although it is too early to saywhether this represents a change in the national consumption pattern.) Under theSugar Act of 1948, definite quantities of the United States market continue to bereserved to domestic and off-shore producers, including Puerto Rico, the VirginIslands, Hawaii, and the Philippines, while Cuba is assigned over 90 percent of theremaining import requirement. Imports from other areas thus become residualquantities (70,000 tons out of an import of 4.8 million tons in 1947/48). In pointof fact, United States takings from free market supplies would be even smaller hadno ceiling been placed on domestic production.
The second large trading unit is the British Commonwealth and related territories,which account for some 3.2 million tons. Because of increased production and ra-tioned consumption within the United Kingdom, this area is currently taking about950,000 tons from the free market, compared with nearly 1.3 million tons prewar.Commonwealth policy, however, aims at gradually achieving greater self-sufficiencywithin the area and eliminatinir the need to import so much from outside.
The French Union, which consumes some 1.2 million tons, formerly took 225,000tons from other sources. Planned increase in production in France itself, as well asin some colonies, would eliminate that import. Likewise some smaller countries whichimport "free" sugar are expanding domestic output.
On the supply side, not only Cuba but other countries, such as Mexico, Brazil,Poland, Denmark, have increased supplies to offer on the free market. The Philip-pines plans a much larger export than prewar, though its preferential quota in theUnited States market diminishes each year, according to treaty. Java and Taiwan(Formosa) plan to recover their export business. The inescapable conclusion is thatwithin a short time a larger than prewar supply of "free" sugar will be placed on asmaller than prewar "free" market.
Under such a threat of burdensome surplus, it is easy to say that a new Inter-national Sugar Agreement should be negotiated, but as yet the governments are notclear- as to what provisions such an agreement should contain. For behind any out-ward forms there remain the real problems of (a) sharing equitably the burdens ofany readjustments necessary. (b) helping countries to find alternative lines of pro-duction and export, and (c) progressively stimulating sugar consumption in areaswhere it is still very low.
4. FATS AND OILS
EXPANSION OF FATS AND OILS PRODUCTION, already noted in last year's State of Foodand Agriculture, continued through 1949, bringing the total world supply up to aboutthe prewar level. Improvement has been general, except in Southern Europe. On apercentage basis, the greatest gains have been made in Indonesia and Africa; on atonnage basis, in North America and the U.S.S.R. The progress achieved, however,has not eliminated substantial differences as between countries or continents. Thus,
68

TABLE 32.INDIGENOUS PRODUCTION OF FATS AND OILS, POSTWAR COMPAREDWITH PREWAR
(Calendar year availability as oil)2
Producing area
Whaling (all areas)
Europe:North and WestCentralSouth and East
U.S.S.R.
America:United States and Canada._ .......ArgentinaOther
Africa:North and SouthOther
Asia and Oceania:China (including Manchuria)India and PakistanIndonesia and MalayaPhilippinesAustralia and New ZealandJapanOther
TOTAL
69
Prewar 1002
66 69 70
69 81 8745 48 5582 99 84
52 64 76
141 146 15787 70 81
120 127 134
97 103 11796 105 112
82 86 87
93 93 9553 65 83
167 130 13289 94 9420 37 4784 98 101
88 94 99
1Some allowance has been made for seasonal movement of oilseeds from farmto processor and for changes in carryover, particularly in the case of the highlyseasonal olive oil crop.
Me prewar period relates mainly to 3-5 years ending in 1938; for China,however, 1931-37 has been taken, and for most of the Americas, 1935-39.
only Africa, the Philippines, and the Western Hemisphere (except Argentina) have aproduction higher than prewar. In the occupied areas of Central Europe and Japan,1949 production reaches only half the prewar level.
As a result of the improved supply position, exports in 1949 are likely to increaseby 9 to 10 percent over the 1948 volume. The Western Hemisphere (160,000 metrictons), Africa (90,000), and Indonesia (90,000) will contribute the most to this in-crease. Nonetheless, total world trade in fats and oils is still about 30 percent belowthe prewar average. Striking differences between the regions emerge; only the Philip-pines and North America are exporting substantially more than prewar. (U.S.-Canadian exports now roughly balance their imports.)
China, Manchuria, India, and Pakistan, which together exported 1.2 millionmetric tons (oil equivalent) prewar, may in 1949 export about 200,000 tons. Malayan,Indonesian, and British Pacific exports llave fallen from 870,000 to 510,000 tons overi he same period, and European exports (mostly to other European countries) from600,000 to 230,000 tons.
In the "edible, soap" group of fats' the 1949 exports may be 10 percent above1948 and 74 percent of prewar. Copra exports were slightly above the prewar total;groundnut exports 57 percent of prewar. On the other hand the tonnages of soybeans,cottonseed, sesame seed, and sunflower seed and oil likely to be exported in 1949 vary
'This covers all fats and oils except "special technical," i.e., linseed, castor, oiticica, tung, andperilla.
1947 1948 I 1949

according to products from 20 to 35 percent of the prewar totals. Animal and marinefats should increase slightly over 1948, total exports reaching 70 percent of prewar,the shortfall being particularly, in whale oil and butter.
In the "special technical" group, exports will be slightly higher than prewar forall the smaller items, but exports of linseed (shipped as seed), which dominates thepicture, may be only 27 pe-rcent of prewar despite a large increase in 1949 as com-pared with 1948.
Taking together all seeds and oils of vegetable origin, the 1949 exports in theform of seed are about 69 percent, while those in the form of oil are 88 percent ofprewar. This fact illustrates the increased seed-crushing activity in exporting countries.
As Table 34 shows, supplies available for consumption per person during 1948were still substantially below the prewar level in a number of countries.
The improvement during 1949 raised the level of supplies in most of the countrieswhere consumption had been most reduced. Nevertheless, the progress achieved isstill quite inadequate, and the shortage of fats remains one of the most important foodproblems for several European countries. It may be noted that Europe during and sincethe war has cut back more on fats and oils for industrial than on those for edible use.
TABLE 34.PER CAPUT SUPPLIES OF VISIBLE FATS AND OILS AS PERCENTAGE OF PREWAR, SELECTED
70
I 1948 1 1949
11n Tables 33 and 34 "prewar" refers in most cases to 1934-38, though for afew countries to other periods. Excludes re-exports, unprocessed or processed.
TABLE 34.PER CAPUT SUPPLIES OF VISIBLE FATS AND OILS AS PERCENTAGE OF PREWAR, SELECTEDCOUNTRIES
Illsing 1937-41 as the prewar period of comparison. (Using 1935-39, there would be an increase of3 percent.)
Under50 percent
50 to 75percent .
75 to 90percent
90 to 100percent
About 100percent
I Over 100I percent
GermanyJapan
AustriaCzechoslovakiaDenmarkItalyNetherlandsU.S.S.R.
AustraliaBurmaFinlandFranceFr. N. AfricaGreeceNorwayPolandU.K.
BrazilCanadaChinaIndonesiaSpainSwedenSW itzerlandThailandU.S.A.'
CubaIndiaMexicoNew ZealandPakistanPortugalTurkeyUruguay
ArgentinaBelgium and
LuxembourgCeylonEastern EuropeEgyptIrelandMalayaPhilippinesUnion of South
Africa
Source 1947
(
Europe (incl. U.S.S.R. and Turkey) 20United States and Canada 268Latin America 70Africa 76Oceania 68Asia 45
(Philippines) (181)TOTAL 60
Prewar 100 )
38 38306 330
52 6892 10077 8046 50
(125) (126)65 70

In the United States, by contrast, total edible supplies have increased 10 percent since1935-39 and industrial supplies 30 percent.
In spite of an apparent world-wide shortage of fats and oils a change can benoted in the price trend from previous inflationary levels both in the internal marketsof particular countries, notably the United States, and also in respect of productsentering international trade, such as copra, groundnuts, and linseed. Some decline inthe prices of the principal fats and oils took place between the beginning and themiddle of 1949. This is reflected in the price index of vegetable fats and oils importedby the United States, which has fallen from 252 in December 1948 to 195 in July1949. In the summer of 1948, heavy consumer restocking in the United States dimin-ished, and was replaced by a growing consumer resistance. There were marked pricedeclines in Philippine copra and Argentine linseed oil. Prices of domestic fats onthe American market between 1 January and 1 June 1949 fell by 17 percent, but thedrop was much larger for inedible tallow (49 percent) and lard (29 per cent), -whichhad no price supports.
A large and probably major part of the supplies moving to Europe consists ofcolonial oils and oilseeds, which are largely controlled and marketed on a government-to-government basis, either at nominal prices or on special terms of trade, exchangingconsumer goods for imported fats. Although precise data are not available, it is under-stood that the price levels of this large tonnage do not show the same inflationaryincrease over prewar as characterized the so-called "open" markets, and similarly mayhave remained steadier during the fluctuations of recent months.
It appears clear that a buyer's market is developing in some areas, e.g. in theUnited States and Europe, where, in the face of declining prices, difficulty is beingexperienced in moving supplies produced or purchased during the high-price period of1948. One explanation of this apparent paradox of statistical deficits and market sur-pluses for some products is the stringent limitation of dollar and other hard-currencyresources in soft-currency importing countries which normally absorb 70 percent or
more of world export supplies.Despite the fact that United States prices are now much lower than those in most
other markets, there is little sign that the soft-currency importing countries feeljustified in using more than a small proportion of their available dollar resources tobuy fats from the dollar areas, even where fat consumption is well below prewar percaput levels and where some easing of austerity in this direction would be welcome.With the continuing and unsolved dollar-deficit problem, the prospects at presentare that the demand for "dollar" fats on the part of the soft-currency countries willcontinue to be weak, even in cases where demand for soft-currency fats may still be
well in excess of such supplies as are "freely" available. It may be that buyers in theimporting countries, in anticipation of some further decline in dollar prices, are post-
poning or limiting their purchases from these sources, as well as awaiting clarification
of the ECA position for the fiscal year 1949/50 so that some resumption or increase of
purchases might possibly occur later in the year. On the other hand, as fats and oils
prices still show a larger relative increase over prewar levels than most agricultural
commodities, the high inflation caused by acute scarcity will probably be followed in
due course by a corresponding readjustment downward.
71

TABLE 35.-PRODUCTION TRENDS IN PRINCIPAL VEGETABLE FATS AND OILS'
Class of fat I 1947-4921909-13 I 1924-28 I 1929-33 1934-38' I (estimate)
T housan d metric tons, oil equivalentHerbaceous or bu,sh crops:
GroundnutsSoybeansCottonseedRape and mustardLinseedOther
Tree crops:Coconuts'Palm kernels' _____Palm oils"Olive oilTung and other nuts'TOTAL
Class
Liquid edible'High lauric'Semihard and marine'Butter, margarine, lard, etc.Technical'
Region
Europe (incl. U.S.S.R.)U.S. and CanadaLatin AmericaAfrica and Near EastIndia and China'Other S.E. Asia and PacificAustralia and New ZealandTOTAL (eXG1. whaling)
1,150 1,975 2,480 2,240 2,425620 1,645 1,865 1,275 1,530
1,555 1,845 1,835 1,475 1,3001,625 1,275 1,295 1,030 1,180
940 1,265 1,185 1,110 930860 1,345 1,485 1,650 1,875
385 800 915 1,870 1,825145 240 250 350 340120 215 280 690 535590 750 850 1,000 930
45 85 95 170 3308,035 11,440 12,535 12,860 13,200
'In most cases the 1909-13 averages, and in many cases the averages for later periods, are very roughestimates.
gAdjustments have been made in these two periods but not in the earlier periods for unreported pro-duction, seed and waste, direct use of nuts as food, and seasonal movement and changes in carry-over.
oProduction for domestic consumption is included only in 1934-38 and 1947-49. Net exports areshown for other periods.
TABLE 36.-TRENDS IN EXPORTS OF FATS AND Ours'By Class of Fat
I 1947-491909-13 I 1924-28 1929-33 1934-38 I (estimate)
( Thousand metric tons, oil equivalent )
1,103 1,496 1,714 1,664 778536 1,075 1,178 1,430 1,236510 750 973 1,303 911580 790 820 715 508550 809 804 850 462
3,279 4,920 5,489 5,962 3,895
By Regions
I 1947-491909-13 1924-28 1929-33 I 1934-38 I (estimate)
( Thousand metric tons, oil equivalent )456 505 562 601 176560 468 352 152 459309 688 692 752 479498 844 904 1,065 959852 1.179 1,343 1,196 234396 -877 1,014 1,438 1,028118 157 214 258 217
3,189 4,718 5,081 5.462 3,552
/Excludes re-exports processed or unprocessed."Cottonseed, groundnut, soybean, rape, sesame, sunflower, olive, ete.^Copra, coconut oil, palm kernels and oil, babassu nuts and oil."Palm and marine oil, tallow, etc.^Linseed, castor, twig. oiticica, and perilla.^Tncluding Pakistan, Manchuria, and Korea.
72

Long-term Trends and Outlook for 1950/51
Between 1900 and 1939 the demand for fats and oils expanded markedly, particu-larly in the industrialized countries of Western and Central Europe, the United States,and the British Dominions. The increase in supplies was obtained partly through ex-panded production in these advanced countries, but the principal source has been im-ports from East Asia, the tropics, and Argentina. Between 1909-13 and 1934-38 con-sumption in the developed countries may have increased by about 55 percent(population b) 25 percent), while consumption in the rest of the world (mostly under-developed countries) increased by about 35 percent (population by 20 percent). Percaput consumption has not regained the prewar level in either group considered as awhole.
Table 35 summarizes the changes in the production of certain fats and oils overthe past 40 years. Statistical data on animal fats are too incomplete in the earlierperiods to be included in the table. The products listed represented only 54 percentof world production in 1934-38, but covered by far the greater part of the quantitiesentering into international trade. Despite these limitations, the table shows thatcertain basic changes have occurred.
The greatest increase between 1909 and 1939 was in tree crops (copra, palmkernels and palm oil, olive oil, tung nuts, and babassu kernels), especially in coconuts(copra) and palm oil. Among the herbaceous and bush crops there is a large increasein groundnuts and soybean output, relative stability in cottonseed and flaxseed, and adecrease in rapeseed and mustard seed.
Table 36 and Chart 10 summarize the trends in exports by classes of fats and bysources of supply. Within the liquid edible group, the period 1909-38 saw a largeexpansion of groundnuts and soybean exports, while cottonseed, rapeseed, sesame.sunflower, etc., remained static or declined. As regards oils produced in the tropicsor subtropics, exports and production show the same trend, since the production isoverwhelmingly for export. Thus the "high lauric" exports, copra and palm kernels,registered a large expansion up to World War II, notably in the Philippines, Indonesia,Malaya, Ceylon, and central Africa. The same applies to palm oil (semihard). Theexpansion in marine oils consists of whale oil from the Antarctic and fish oil (mainlyherring) from the North Pacific and North Atlantic,. Exports of butter, lard, otherprocessed fats, and the technical oils expanded only moderately.
Considering exports by regions, the table demonstrates clearly that the greatincrease in output came chiefly from the Far East, Africa, and Latin America. Exportsfrom the United States and Canada steadily declined until World War II. The FarEastern export has, as already mentioned, been the most drastically reduced byWorld War II and, to a lesser extent, the export from Europe and Latin America hasalso declined. This has affected respectively the "liquid edible," the "butter-margarine-lard," and the "technical" groups, in each of which the 1947-49 exports were actuallybelow the 1909-13 level.
Table 37 and Chart 11, showing retained imports by principal areas, emphasizethe great importance of Europe in the trade and particularly of Germany and theUnited Kingdom. However. Europe's share in world imports declined somewhat-from 80 percent in 1909-13 to 70 percent before and after World War IIwhile theimports of the United States significantly increased. The United Kingdom is the onlyvery large purchaser that is now importing again on the postwar scale.
73

Chart 10.Trends in Exports of Fats and Oils'
Thousand metric tons, oil equivalent6000
5000
4000
3000
2000
1000
o
5000
4000
3000
2000
1000
o
By Class of Fat
ut ermargarineard etc
echnical
Thousand metric tons, oil equivalent6000
PAO Chart No. 298
..... U1MMMM . 6....OM ..... 111
....
;Near East-
ainwomamoana1 ............ 1....:.»:
iExcludes re-exports, processed or unprocessed.2Cottonseed, groundnuts, soybeans, rape, sesame, sunflower, olive, etc.'Copra, coconut oil, palm kernels and oil, babassu nuts and oil.4Palm and marine oil, tallow, etc.2Linseed, castor, tung, oititica, and perilla.,Tncluding Pakistan, Manchuria, and Korea.
The outlook for 1950/51 depends substantially upon the state of demand in thet-wo main consuming areas, Europe and the United States.
Europe's production of butter and slaughter fats is expected to be some 20 per-cent higher than in 1948/49. Its oilseed production is unlikely to expand muchfurther than at present. National plans envisage an increase in imports of perhaps400,000 tons (oil equivalent), principally from dependent overseas territories and
74
1947-49Est.
1924-28 1929-33 1934-381909-13
1924-28 1929-33 1934-38 1947-49Est.
1909-13

EuropeGermany 715 1,124 1,143 1,130 150United Kingdom 989 983 1,119 1,215 1,185Other 938 1,445 1,663 1,680 1,370
United States and Canada __ 202 574 703 937 630Other areas 400 636 673 780 511TOTAL 3,244 4,762 5,301 5,742 3,846
'Excluding (prior to 1947-49) castor, tung, oiticica, and perilla, for which the available informationis insufficient.
the Far East. If these programs are fulfilled, total supplies will be more than 15percent larger than in 1948/49. The major portion of the increase may go to Germany.
In the United States the outlook is for a decline in output of vegetable oilseedsand tallow and a substantial increase in production of lard. This may mean largerimports of linseed and linseed oil and will certainly mean much larger export availabil-ities of lard. Through ECA financing the United States should be able to find marketsfor a large part of its exportable surplus of lard and other fats, the prices of which arealready considerable lower than corresponding prices in the soft-currency area.
Most other areas of the world produce chiefly for export and look either to theUnited States or the European market. Exports from the Far East should continue torecover gradually and those from Africa to expand somewhat. Accepting payment insoft currencies, these countries should have no difficulty in marketing all they mayhave available, though probably at prices lower than in the past four years. Difficultieswill be encountered by high-cost producers and those requiring payment in dollarsfor their exports. The Philippines exemplifies this type of difficulty. Argentina has
Chart 11.Trends in Retained Imports of Fats and Oi s'
Thousand metric tons, oil equivalent6000
Countries and Regions5000
4000
3000
2000
1000
TABLE 37.TRENDS IN RETAINED IMPORTS OF FATS AND OILS IN COUNTRIES AND REGIONS'
o
I 1947.491924-28 1929-33 1934-38 I (estimate)
Thousand metric tons, oil equivalent
909-13 1924-28 1929-33 1934-38 1947-49Est.
FAO Chart No. 299
'Excluding (prior to 1947/49) castor, tung, oitieica, and perilla, for which insufficient information isavailable.
75
Imported into:1909-13

had trouble in disposing of its export surpluses, but recent evidence suggests thatit may be increasingly prepared to accept lower prices and softer currencies.
The over-all impression for 1950/51 is one of an easier supply situation, lowerprices, and more advantageous buying terms. Increases in consumption may be slightin the high-consumption countries and more marked in Germany, 'Japan, and otherarcas still consuming at a rate significantly below the prewar level.
5. LIVESTOCK PROD.'. CTS
Production and Feed
PRODUCTION OF LIVESTOCK PRODUCTS in the major producing areas of the worldchanged very little in the first three postwar years. In Europe bad weather conditionsand shortag,es of fertilizers and other farm requisites for feed production retarded live-stock recovery. The severe drought of 1947, which affected most of Western and Cen-tral Europe, reduced livestock numbers and made recovery slow in 1948 in spite ofgood crops and good grazing conditions. As. a result, Europe's output of meat andmilk in 1948 stood at only 63 and 73 percent, respectively, of prewar.
In North America production has declined from the high levels attained duringthe war, but output of livestock products, particularly meat, remains considerablyabove the prewar level. Meat output in 1948 surpassed the prewar average by aboutone-third in the United States and by about 40 percent in Canada. Milk production inboth countries, although lower than in 1947, was about 10 to 12 percent over prewarlevels, In the principal livestock countries of South America production of ineat andmilk in 1948 was also considerably above prewar. in Oceania, it was still near theprewar averages.
Because Of better feed conditions, output of animal products is expected toincrease in 1949 in all major producing areas of the world. Preliminary indicationspoint to a larger output of meat and milk in nearly every European country, inNorth and South America, and in Oceania, with the most important gains in Europe.In the United States total supply of concentrates in 1949/50 is expected to be about8 percent greater than in the preceding year. In spite of a small increase in totalanimal units, particularly a larger pig crop, feed concentrates per animal unit will beabout 5 to 6 percent above the record level of 1948/49, or about one-fourth higherthan in the period 1937-41. A slight decrease in the hay supplies is expected, but theamount available per roughage-consuming animal unit is not likely to be much differ-ent from last year, when supplies were favorable.
The situation is likely to be much the same in Canada, where the number offeed-consuming animal units has been reduced by heavy shipments of cattle to theUnited States in 1948. In the South American countries and Oceania, livestock pro-duction is highly dependent on grazing; conditions in 1949 have been such thatsmall increases in output are expected.
76

TABLE 38.---PRODUCTION OF MEAT, MILK, BUTTER, AND CHEESE, SPECIFIED AREAS, PREWAR,' 1947,1948, 1949, AND 1950/512
MEATS'1949 11950/51(esti- (esti- Prewar
mate) mate)
Million metric tons8.5 10.0 102.75.4 6.5 72.0
93.469.8
31 3.5
11.5 11.7
5.3 5.3
1.6 1.6
Thousand netric tons1,260 1,440 1,490 950 1,100 1,185 1,3851,040 1,180 835 525 645 690 810
220 260
940 930
150
325 320
77
30.7
54.6
7.8
23.6
63.0
10.0 9.5 9.9 10.0 10.2
CHEESE
655
344
100
MILK'1950/51
(esti-mate)
425 455
591 539
170 175
495 575
604 586
180
120 136 131 130 130
All prewar data adjus ed to postwar boundaries.""Prewar" tetero to 1934-38 for most countries, but for a few
years between 1934 and 1939.,The 1990/51 figures are based on country estimates where available; FAO estimates are used for other
countries.5I1leat is in terms of carcass weight and includes 'beef, veal, pork, lamb, and mutton. Lard is excluded
but offal is included. Meat equivalent of live animals exported is excluded.451ilk from cows.5Bulgaria, Czechoslovakia, Greece, Hung,ary, Italy, Poland, Portugal, Rumania, Spain, and Yugoslavia.
In Europe the 1948/49 feed supply (excluding grazing and green fodder)amounted to 130 percent of 1947/48 and 83 percent of prewar. This improvement wasalmost entirely the result of increased indigenous production. Net imports of coarsegrains were at approximately the same level as in the preceding year, but still one-third below prewar. Oil-cake and -meal imports were 18 percent above 1947/48 but53 percent below prewar. Some increase in 1949/50 is likely in European imports ofoil-cake and -meal, but little change is expected in the volume of coarse grain trade.
Europe's supply of feed concentrates per animal unit rose from 65-70 percent ofthe prewar level in 1947/48 to 90-95 percent in 1948/49. During the first half of1949, pastures were excellent in many of the Western and Central European countriesand milk production was high. Lack of rain in some areas in the summer of 1949,and during the early- part of the year in the Mediterranean countries, has reduced hayand fodder root crops; but for the year as a whole the feed situation in Europe islikely to be good, at least when compared witb tbe average of the preceding postwaryears.
Trade
Meat exports from the principal exporters were about 83 percent of the 1947level and only 53 percent of the high volume reached in 1944. This decline occurredprimarily because of reduced shipments from Argentina and the United States. In
it refers to an average of three to five
AreaPrewar I 1947 I 1948
Europe (excl. U.S.S.R.and Turkey)Western and CentralEastern and Mediter-
ranean'
19.97.8
4.4
7.7 7.75.0 4.8
2.7 2.9United States and Can-
ada 8.5 12.3 11.3Argentina, Brazil, Chile,
Peru, and Uruguay 4.9 5.3 5.1Australia and New Zea-
land 1.5 1.5 1.5
BUTTER
Europe 1,670 1,041 1,142Western and Central _ 1,300 870 94-6Eastern and Mediter-
ranean' 370 171 196United States and Can-
ada 1,144 904 844Argentina, Brazil, Chile,
Peru, and Uruguay 90 140 135Australia and NOW Zea-
land .. 377 297 591
1947 I 19991949(esti-mato)
70.7 75.6 82.852.8 56.5 62.1
17.9 191 20.7
63.1 61.2 62.4
10.0 10.1 10.4

co
TA
BL
E 3
9.N
ET
TR
AD
E I
N M
EA
T, B
UT
TE
R, A
ND
CH
EE
SE, S
PEC
IFIE
D A
RE
AS,
PR
EW
AR
,i 19
47, 1
948,
AN
D 1
950/
51
1"Pr
ewar
" re
fers
to 1
934-
38 f
or m
ost c
ount
ries
, but
for
a f
ew it
ref
ers
to a
n av
erag
e of
thre
e or
mor
e ye
ars
betw
een
1934
and
194
9.23
,rea
t is
in c
arca
ss w
eigh
t and
incl
udes
bee
f, v
eal,
pork
, mut
ton,
and
lam
b. L
ard
is e
xclu
ded,
but
off
al is
incl
uded
. Mea
t equ
ival
ent o
f liv
e an
imal
sex
port
ed is
incl
uded
.3P
rodu
ct w
eigh
t.4A
R ty
pes,
exc
ludi
ng c
otta
ge c
hees
e.'B
ulga
ria,
Cze
chos
lova
kia,
Gre
ece,
Hun
gary
, Ita
ly, P
olan
d, P
ortu
gal,
Rum
ania
, Spa
in, a
nd Y
ugos
lavi
a.
+N
et im
port
sN
et e
xpor
ts
Cou
ntry
ME
AT
'B
UT
TE
R'
CH
EE
SE'
Prew
ar19
4719
48I(
estim
ate)
1950
/51
Prew
ar19
4719
4819
50/5
1(e
stim
ate)
Prew
ar19
4719
4819
50/5
1I
(est
imat
e)
(--
Tho
ztsa
nd m
etri
c to
ns _
)
Eur
ope
(exc
l. U
.S.S
.R. a
nd T
urke
y)+
1,42
0+
1,65
0+
1,35
0+
1,05
5+
295
+17
3+
207
+16
5+
83+
191
+14
0+
105
Wes
tern
and
Cen
tral
+1,
510
+1,
610
+1,
265
+1,
035
+30
5+
164
+20
3+
155
+10
7+
190
+14
5+
115
Eas
tern
and
Med
iterr
anea
n'90
+40
+85
+20
10+
9+
4+
1024
+1
510
Uni
ted
Stat
es a
nd C
anad
a49
328
103
772
5+
322
910
452
45A
rgen
tina,
Bra
zil,
Chi
le, P
eru,
and
Uru
guay
980
995
810
840
811
1520
910
1212
Aus
tral
ia a
nd N
ew Z
eala
nd56
167
461
565
124
020
522
320
597
112
101
105

both countries lower production of meat and increased domestic demand reducedexports. The reduction was primarily felt by the United Kingdom, where 1948 im-ports were only 74 percent of the 1947 volume. Some of the continental Europeancountries, notably Spain, Belgium, and the Netherlands, increased their imports signifi-cantly over 1947, and the imports of the United States were five times larger than inthe preceding year. Butter exports increased in 1948, the largest gains being made byDenmark and the Netherlands. Cheese trade fell by 15 percent, and the trade in con-centrated milk also declined.
During 1949 some increase in trade is expected. Butter exports are likely toincrease relative to cheese. Meat export gains are expected to come primarily fromSouth America and such European countries as Poland, the Netherlands, and Den-mark. It should be noted, however, that the United Kingdom, which normally acquiresthe bulk of the meat exports, obtained about 20 percent less meat in the first sixmonths of 1949 than in the corresponding period of 1948.
Most of the trade in livestock products is conducted through bilateral trade con-tracts. The United Kingdom, the predominant importer of these foods, has agreementswith the major exporters which assure it virtually all exports from Oceania and ahigh proportion of these from Denmark, Poland, the Netherlands, and the SouthAmerican countries. Denmark and Argentina, although under contract to sell themajor portion of their exports of animal products to the United Kingdom, have con-tracts with numerous other countries to cover the remainder of their exportablesupplies.
The new contracts which the United Kingdom has negotiated during the pastyear are for longer periods than formerly. Its present agreements with Australia andNew Zealand rurt for the seven-year period ending in 1955. Its agreements with Den-mark cover bacon for four years and butter for six years. The contracts with Argen-tina and Poland are for five years, and that with Ireland for four years. In all of theprincipal agreements the prices (and frequently the quantities) are subject to annualdetermination. In some of them, however, restrictions are placed on price changesfrom year to year. For example, the United Kingdom's contracts with Denmark limitthe price change in any one year to 7.5 percent of the prices in effect in the precedingyear; and in the U.K.-Irish agreement the prices to be paid for Irish cattle are tied tothe U.K. domestic price.
The comparative rigidity of contracts, together with the fact that prices agreed toare frequently influenced by economic factors other than price relationships, has re-sulted in sharp contrasts between the various export prices for a single product. Acompetitive world price in the usual meaning of the term, therefore, does not exist.This is shown by the figures in Table 40.
There was some reduction in the price spreads between 1948 and 1949. Thenarrowing of beef prices paid by the United Kingdom was brought about by a cessa-tion of buying in Canada and the purchase of very small quantities in Denmark; inthe case of bacon, butter, and cheese, by an increase in the 1949 prices paid toAustralia and New Zealand while other prices were held constant. More notable arethe changes in prices for the 1949/50 season. Denmark has accepted a 16-percentprice decrease on sales of butter to the United Kingdom, whereas Australia and NewZealand have been granted the maximum increase permitted by their contracts-7.5percenton butter, cheese, and meat. The remaining differences in butter prices arenot much greater than can be explained by differences in freight and insurance costs.
79

TABLE 40.--CONTRACT PRICES PAID BY TETE UNITED KINGDOM FOlt MEAT, BUTTER, AND CHEESE, 1948,JUNE 1949, AND 1949/50
MEAT
80
... No contract, or price unknown.iApproximate price including allowance for lump-suT1 payment.'Trice subject to further revision.2Average export price, to all markets.,Price through December 1949; for calendar 1950 the price agreed upon is 23.3 pence per pound.
The variation in meat prices, even after the price increase accorded to Australia andNew Zealand, will be quite large. A part of this, particularly in bacon prices, will bebecause of quality differentials.
Prospects for 1950/51
The outlook for production of animal products is closely associated with feedprospects. The better crop and grazing conditions in 1948 and 1949 in most of themajor livestock-producing areas have provided an excellent base for livestock expan-sion. If reasonably good weather conditions prevail, rapid gains can be expected,particularly in the areas where 1948 production was substantially below prewar.Table 38 shows projections for 1950/51 for broad areas in relation to productionand trade in previous periods. These estimates are based on official forecasts whereavailable, and on FAO estimates in other cases.
In general the non-European countries project only small increases in output by1950/51. These countries in 1948 and 1949 were near or above the prewar level ofoutput, and production is not expected to increase rapidly. The United States, forexample, has tentatively estimated that meat producion in 1950/51 will be only 3 to 4percent over the 1948 level in spite of the extremely favorable feed situation existingin the first half of 1949. Official estimates for Canada, Australia, and New Zealandalso show that only small increases are expected in the output of meat and milk in1950/51. Although no official estimates are available for the Latin American coun-tries, increases in the next two years are not likely to be large.
Good quality Good quality First qualitycarcass beef carcass lamb bacon
Exporter June I 1949/50 June 1949/50 I June I 1949/501948 1949 I contract 1948 I 1949 contract 1948 I 1949 I contract
Pence sterling per lb --)
Argentina '9.5 10.4 10.4 '14.0UruguayAustralia
7.95.3 6.2 7.8 8.7 9.4 16:6 216à
New Zealand 5.0 5.9 6.3 8.8 10.4 11.2 10.1 12.0 12.9Canada 15.8 21.4 21.4Denmark "15.5 24.1 24.1 42.4.1
Ireland 24.1 24.1
BUTTER CHEESE
ExporterI 1949/50 I
I
1949/501948 June 1949 I contract I 1948 I June 1949 I contract
Pence sterling per lb.
New ZealandAustralia
22.0 25.2 27.121.8 25.0 26.9
12.5 14.3 15.4,19,9 14.1 15.2
DenmarkCanada
34.4 34.4 28.9... ... ... 1.7:6

The European countries are trying to expand production of livestock productsin order to restore the prewar level of consumption as rapidly as possible. Increasesprojected for 1950/51 are consequently large, and many of the official estimates seemoptimistic,' particularly with respect to meat. But while the planned increases are insharp contrast with the rate of gain in the first three postwar years, their accomplish-ment would still leave Europe's output of meat at 82 percent and of milk at 90 percentof the prewar averages.
According to the projections, a somewhat higher proportion of milk will be usedfor manufacturing in 1950/51 than in recent years. Many countries have removed orrelaxed restrictions on the use of milk and on butter and cheese consumption. Someadditional demand for fluid milk may arise, however, as a result of improvement inmethods of handling and distributing in many of the Central and Eastern Europeancountries.
Whether the European goals cart be reached will depend on indigenous feed pro-duction and imports of feed. In 1948/49 about 50 percent of the world's imports ofcoarse grains carne from Canada and the United States. A lack of dollar exchangemay curtail European imports of these feeds, so the output of animal products may notincrease as rapidly as planned. Improvement in the volume of feeds available fromEastern Europe and the U.S.S.R. may also be slower than hoped for.
Indications point to some expansion in international trade in livestock productsduring the next few years. Exports from non-European countries in 1950/51 are likelyto be not greatly different from the 1948 level. The United States and Canada com-bined expect lower net ex-ports of meat and cheese in 1950/51 than in 1948. Canadamay have as much as 17,000 tons of butter available for export in 1950/51 (comparedwith net imports in 1948) because margarine can now legally- be manufactured andsold in Canada, which may somewhat reduce the consumption of butter. In Australiaand New Zealand, only small changes in export supplies are expected by 1950/51, withexports of all livestock food products at a lower level than in 1947. Some small in-crease in exports of rneat, butter, and cheese seems likely from the South Americanexporting countries, but no official estimates are available.
In European countries the production and trade estimates for 1950/51 indicatethat exports are expected to increase significantly, whereas imports are expected toadvance only slightly. In this event, export availabilities of livestock products wouldexceed import requirements. The meat situation is shown in Table 41.
European exporting countries propose to have net exports in 1950/51 about476,000 tons above the 1948 volume whereas European importing countries proposeto import only 165,000 tons more than in 1948.2 There is, of course, serious questionthat the plans or projections for European meat trade will materialize. For example,the European exporting countries are expected to have a lower volume of meat pro-duction in 1950/51 than in the prewar period. If this group of countries were toreach their prewar rate of meat consumption--even assuming that their productiongoals are reachedthey could not have net exports in excess of 440,000 tons.
'Available official forecasts for 1950/51 for European countries show a 48-percent increase inmeat and a 28-percent increase in milk over the 1948 output. FAO projections for European coun-tries not submitting forecasts show a 22-percent increase in meat and a 20-percent increase in milkover 1948 production.
2Not all of the projection figures shown above are official estimates. Time import and exportvolumes for the largest European trading countries are, however, official projections. FAO estimatesfor others are based chiefly on conditions in 1949.
81

TABLE 41.PROJECTED MEAT EXPORTS AND IMPORTS FOR 1950/51COMPARED WITH 1948
(-I-) Net import requirements() Net export availabilities
European exporting countriesDenmarkIrelandPolandNetherlandsFrance, Yugoslavia, Hungary,
TurkeyEuropean importing countries
United KingdomBelgiumGermany and SwitzerlandItaly, Spain, GreeceOthers'
Argentina; Uruguay, Brazil,Mexico
Canada and United States2OceaniaNon-European importing coun-
tries'
Thousand metric tons
164
+1,500
82
761062520
23
+1,25975476059
1950/51 projec-tion
640
+1,665
900777651
+ 325
250200
5040
100
+1,320-4- 604- 145
10040
lezechoslovakia, Finland, Austria, Portugal, 'Sweden, Norway, Luxembourg.3Excludes meat equivalent of dairy stock and breeding animals exported to
the United States from Canada.aTT.S.S.R. and Chile, plus miscellaneous countries which add up to about
210,000 to 215,000 tons.
On the other hand, if the European importing countries in 1950/51 were toachieve their meat production targets (90 percent of prewar) and if they were toreach the prewar rate of meat consumption, their import requirements would be 2.3million tons rather than the 1.7 million tons projected. (This example excludes theGerman Bizone, where consumption is expected to continue far below prewar.)
The targets and estimates reveal that countries propose to hold consumption belowprewar levels in order to have quantities of meat for export or to avoid large importsof meat. But this is likely to be possible only if artificial restrictions on consumptionare maintained. Otherwise, the effective demand for livestock products would prob-ably be near or above the prewar level since real income per person is already abovethe prewar average in some European countries and is expected to be above prewarin nearly all of them by 1950/51.
A large part of the theoretical surplus of meat in 1950/51 is due to the very lowimport target set by the United Kingdom. This target, which is equivalent to about73 percent of prewar imports, seems extremely pessimistic in view of (a) the UnitedKingdom's projection for indigenous meat production in 1950/51 (18 percent belowprewar) ; (b) its expected higher real income per person (5 to 10 percent above pre-war) ; and (c) its long-term meat contracts.
The United Kingdom's long-term meat contracts alone would indicate that im-ports will exceed the import target. In addition, the United Kingdom will undoubtedlyobtain certain quantities of meat from various countries with which it has no tradeagreements. The fact that nearly all of its meat purchases can be made in non-dollarcountries lends weight to the thesis that consumption rates may be higher than thetarget levels of production and trade imply.
Region 1948
900103615
+ 275

For butter and cheese the discrepancies between possible export availabilities andImport requirements are not so large as for meat. Here again, however, the Euro-pean countries tend to project large exports and small imports. For example, theNetherlands and Denmark, the two largest European butter exporters, plan by 1950/51to be back near the prewar volume of exports, although this will require a lowerper caput consumption of butter than prewar. The United Kingdom, on the otherhand, proposes to import only 298,000 tons as against 486,000 tons prewar.
A realistic examination of possible supplies relative to prospective purchasingpower would indicate that meat and dairy products may still be in short supply gen-erally by 1950/51 and that import requirements, in spite of goals to the contrary,may exceed export availabilities, particularly in view of the fact that the dollarareas are involved only in a small way.
In the United States and Canada the demand for livestock products at currentprices may decline, but so will prices. Total consumption, therefore, is likely to beas high as, or higher than, in 1948. Neither of these countries, however, is expected tobe an important factor in the European meat or butter trade in 1950/51.
6. CITRUS AND DRIED FRUITS
Citrus Fruits
THE STEADY EXPANSION which characterized citrus fruit production during the inter-war period has persisted through and beyond World War II in the Western Hemi-sphere and Africa. European and Near Eastern output, however, is still below prewarlevels. Output has risen rapidly in the United States, the world's leading producer,but the 1948 crop was much damaged by the severe winter in California and Texas.The predominant producer of limes, Mexico, has increased its production to threetimes the prewar level.
Statistics on the number of citrus trees of bearing age or even on orchard areaare unsatisfactory for most countries, but all available figures indicate continuingexpansion. In the United States the area under oranges has increased from 200,000hectares prewar to 232,000 hectares in 1948.
World trade in citrus products has increased steadily since the end of the war,but total exports are still considerably below the prewar level. Only for grapefruithas the trade fully recovered.
The picture, however, is rather different in different countries. Exports oforanges and tangerines from the United States, Italy, the Union of South Africa, andAlgeria have considerably surpassed the prewar export levels, but exports from Brazil,Spain, and Israel in 1948 were below the prewar volume.
Grapefruit exports from the United States have more than doubled as compared'with prewar, while Israel's exports have declined, particularly in 1948 when war con-ditions seriously affected Israel's citrus production and trade.
The chief exporter of lemons, Italy, shipped only 140.000 tons in 1948 as against213,000 tons prewar, but the proportion of exports to production was only slightlybelow the prewar figure of 62 percent.
83

Type of fruit
Oranges and tangerifles
GrapefruitLemons, limes, etc.TOTAL
Region
EuropeNorth and Central
AmericaSouth AmericaAsiaAfricaOceaniaWORLD
North and CentralAmerica
South AmericaAsiaAfricaWORLD
EuropeNorth and Central
AmericaSouth America ......AsiaAfricaOceaniaWORLD
1934-38
7,1201,140
990
Type of fruit
TABLE 42.-WORLD PRODUCTION OF CITRUS FRUIT
1945
8,0602,3501,160
Oranges and tangerinesGrapefruitLemons and limesTOTAL
1934-38
1946 1947
Thousand metric tons
8,4002,2401,190
9,250 11,570 11,830 12,580 11,300 11,820
TABLE 43.-PRODUCTION OF CITRUS FRUIT BY REGIONS
1934-38I
1945 I 1946 I 1947 1948
Thousand metric tons ) ( Percent __)
Oranges and Tangerines1,470 1,200 1,000 1,350 1,400 1,240 84
2,510 3,850 4,210 4,100 3,800 3,990 1591,690 1,620 1,700 1,790 1,740 1,710 101
910 760 750 1,010 720 810 89450 550 570 670 660 610 136
90 80 80 90 100 90 1007.120 8,060 8,310 9,010 8,420 8,450 119
Grapefruit1.060 2,300 2,150 2,280 1,640 2.090 197
- - 10 10 10 -60 30 60 60 40 48 8020 20 30 20 20 23 115
1,140 2,350 2,240 2,370 1,710 2,170 190
Lemons and Limes140 300 340 380 350 340 77
360 600 590 550 390 530 14760 90 100 100 150 110 18350 70 70 80 80 75 15070 80 60 60 60 65 9310 20 20 20 20 20 200
990 1,160 1,180 1,190 1,050 1,140 115
TABLE 44,-WORLD EXPORTS OF CITRUS FRUIT
84
9,0102,3701,200
1948
8,5001,7501,050
1945I 1946
1945-48average
8,4922,1781,150
1946-48average
1945-48 as c/oof 1934-38
( Percent _)
119191116128
1945-48 as %of 1934-38
I 1947 I 1948
Thousand metric tons
1.850 800 1,200 1,250 1,300130 90 135 160 130280 80 95 120 150
2,260 970 1.430 1.530 1,580

Among the major citrus importers the United Kingdom and France increasedtheir imports of oranges and lemons during 1948, but their imports are still belowprewar.
Canada and Belgium imported less in 1948 than in 1947, but their imports havebeen much above prewar. Canada is now the most important outlet for United Statesexports. The shortage of dollars has limited the European market for United Statescitrus fruit, and the United Kingdom has completely closed down on all imports fromthe United States.
Spain, the most important exporter of oranges, has been able to make trade agree-ments with European importing countries which will dispose of its exportable quanti-ties in 1949, in spite of Spain's high price level compared with other non-dollarsuppliers. In general, European imports continue to expand, but during the first sixmonths of 1949 the United Kingdom imported little more than half the quantity oforanges imported in the same period in 1948. This decline is largely in imports fromIsrael and may be interpreted as a result of the war in Israel rather than as adeliberate cut in the import program from areas outside the dollar region.
For the United States, where the citrus industry has been subject to much discus-sion in relation to future agricultural price policy, the export of fresh citrus fruit (ex-cept lemons) still represents the same proportion of production as in the prewar years.
The problem is, of course, whether United States exports can be maintained inface of the dollar shortage and whether the home market can absorb at remunerativeprices its regular share of the production. This depends to a considerable extent uponthe canning (including juice) industry, which now absorbs a substantially higher pro-portion of the production than before the v,ar.
It is an indication of a market at least temporarily stabilized that the specialCitrus Export Program, which had been in operation since 1 December 1948, wasterminated early in May 1949. Under the provisions of this program benefit pay-ments of not more than 25 percent ol the f.a.s. price were made to United Statesexporters consigning fresh and processed citrus fruits and juices to certain Europeancountries eligible to receive aid under the Foreign Assistance Act of 1948. Table 46indicates price developments since 1938.
The price trend in importing countries may be illustrated by the c.i.f. prices fororanges imported into the United Kingdom (Table 47).
OUTLOOK
Forecasting of the marketing situation is difficult for any fruit crop subject togreat fluctuation in yields. The 1 August 1949 crop report for the United Statesshows crop conditions below those of the same date last year and below the 10-yearaverage. For the European crop, no reports are available. In South Africa, an appre-ciable increase in production is anticipated during the coming season, and in Israelthe end of hostilities should improve both production and exports.
The European market will most likely absorb increasing quantities of citrus fruit,at least from non-dollar countries. With the recovery of industrial production in thecitrus-importing countries, exchange between these countries and some of the citrusexporters may increase. Sweden and Belgium, which both increased their citrus im-
85

TABLE 45.-UNITED STATES PRODUCTION AND EXPORTS OF CITRUS FRUIT, PREWAR AND 1948
Type of fruit
Oranges and tangerinesGrapefruitLemons
Type of fruit
PrunesUnited StatesOther
-RaisinsUnited StatesOther
'CurrantsDried fig,t
Source of import
PalestineSouth AfricaSpainUnited StatesBrazilWEIGHTED AVERAGE
Production
1934-38 1948
86
Export
1939-38 I 1948
Thousand metric tons
2,284 3,244 150 2201,017 1,617 45 75
322 314 16 5
TABLE 46.--AVERAGE PRICES RECEIVED BY FARMERS AT PACKINGHOUSES IN THE UNITED STATES, 1938-48
Oranges I Grapefruit I Lemons
U. S. dollars per box
0.76 0.31 1.480.95 0.44 1.591.18 0.43 1.201.56 0.74 1.602.47 1.15 2.472.64 1.53 3.312.69 1.64 2.752.93 1.37 1.941.55 0.86 2.671.25 0.51 2.441.17 0.53 2.45
SouRcm: U. S. Department of Agriculture, Crops arul Markets, vol.26, page 83.
1Refers to crop season beginning in the year named.20nly first part of season; the average for the whole season is
likely to have been higher.
TABLE 47.-AVERAGE IMPORT VALUE OF ORANGES IN THEUNITED KINGDOM
1938 I 1947 I 1948
( Pounds sterling per metric ton __ )
12.34 37.00 36.0514.86 37.53 40.6712.99 47.94 37.1612.77 38.54 38.0012.77 38.54 42.8513.70 41.50
SOURCE : Trade and Navigation Accounts of the United Kingdom.
TABLE 48.-PRODUC1'ION OF MAJOR TYPES OF DRIED FRUITS
Export as percent-age of production
1934-38 I 1948
( Percent )
6.6 6.84.5 4.65.0 1.4
1935-39 1 1945 1 1946 1 1947 1 1948
( Thousand metric tons )
270.8 240.3 222.5 217.5 616.6213.2 212.1 194.1 184.4 1,523.6
57.6 28.2 28.4 33.1 95.3462.9 471.6 438.2 469.3 197.5198.3 218.6 175.1 274.9 28.8264.6 253.0 263.1 194.4 420.3187.2 56.8 71.8 89.1 202.3260.0 201.5 185.5 215.4 218.0502.7 562.9 613.8 593.4 193.9
1.683.6 1,533.1 1.531.8 1.584.7 165.1
Date'
19381939194019411942194319441945194619471948'
ports during 1947 and 1948, may be cited as examples. The German market, whichin prewar years was one of the most important, may slowly recover, partly at leastbecause of the interest of Italy- and Spain in obtaining certain German industrialproducts.
Considerable expansion of the European market should be possible if prices arereduced to a level that would put these products within reach of the lower-incomegroups. Much can be done to increase y ields in the European orchards and to reduceproduction and distribution costs. The canning industry should be able to absorbsubstantial quantities for making juices.
The British Ministry of Food has recently made a 10-year contract with theBritish West Indies to produce concentrates and juice. A wide-scale expansion of thecitrus area has been planned and equipment for juice production will be installed. Ithas been estimated that by 1953 the British West'Indies will be able to produce about170,000 tons of oranges. The prewar export to the United Kingdom was 7,000 tons.This development scheme is an indication of how the dollar shortage may cause geo-graphical shifts in production.
Dried Fruits
Commercial production of dried fruits for the years 1945-48 was about 8 percentbelow the prewar volume, but the trend has been rather different for the individualvarieties. Table 48 indicates an expansion in the output of dates, a rather stableproduction of raisins, and a decline in production of prunes, currants, and dried figs.
Dried fruit production was supported in some areas during the war by an ex-traordinarily high demand for army supplies and for dehydrated food to ship overseas.Prices rose proportionately more than for fruit in other forms. Increased exportsfrom Australia, South Africa, and the United States compensated for the decline inexports from Greece, Turkey, Algeria, and Iran.
Since the war the exports from Mediterranean countries have been gradually re-covering. The market situation seems favorable for dates and also for dried figs, atleast from Turkey and Algeria, which are the two most important exporters.
Greece has obtained an agreement with Germany which reopens that importantmarket. Recent reports, however, indicate that Greece was unable to market a part ofthe 1948 pack of raisins, currants, and dried figs before the 1949 season; moreover,the crops of these fruits in 1949 are reported to be larger than in 1948. Iran andSpain have had a carry-over of raisins, and Spain and Italy of figs. In Italy, low-grade figs have been used for feeding livestock, and Spain has considered establish-ment of a special exchange rate to stimulate fig exports.
Late in 1948 Australia made a five-year contract with the United Kingdom ac-cording to which U.K. will purchase the available Australian export surplus of driedraisins and currants up to £2.5 million. Supplies required for export to Canada, NewZealand, and other markets are excluded from the contract. Prices are fixed for thefirst two years, after which they will be reviewed annually. For the first year anannual export of about 40,000 tons of raisins and currants is expected. Argentina,which has developed an export of prunes, recently faced a reduced export demand,and the 1948/49 market opened with surpluses.
The United States during 1947 and 1948 increased its export of dried prunes andraisins above the prewar level. Extensive government purchases through the Com-
87
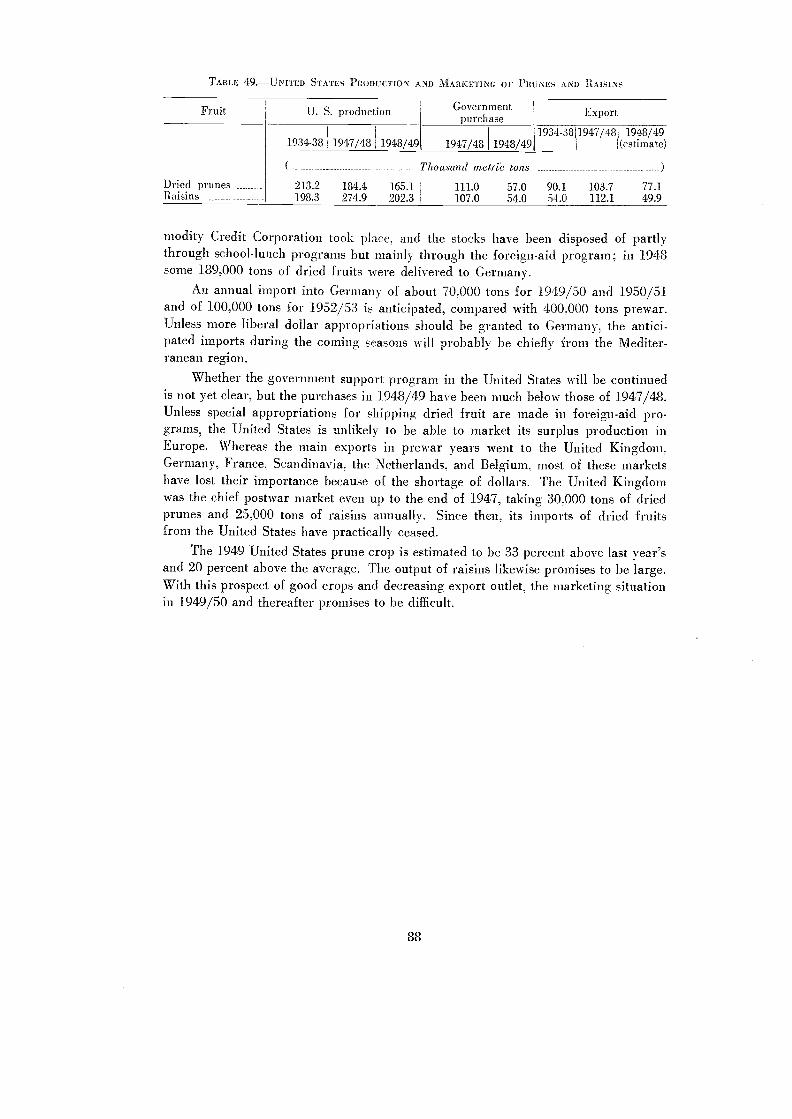
TABLE 49.UNITED STATES PuonucTioN AND MARKETING OF PRUNES AND RAISINS
Fruit
1934-38
U. S. production
1947/48 1948/49
88
Governmentpurchase
1947/48 1948/49
Thousand metria tons
Export
1934-381947/48I 1948/491(estimate)
modity Credit Corporation took place, and the stocks have been disposed of partlythrough school-lunch progra.ms but mainly through the foreign-aid program; in 1948some 189,000 tons of dried fruits were d.elivered to Germany.
An annual iinport into Get-many of about 70,000 tons for 194,9/50 and 1950/51and of 100,000 tons for 1952/53 is anticipated, compared with 400,000 tons prewar.Unless more liberal d.ollar appropriations should be granted to Germany, the antici-pated imports during the coining seasons will probably be chiefly from the Mediter-ranean region.
Whether the government support 'program in the United States will be continuedis not yet clear, but the purchases in 1948/49 have been much below those of 1947/48.Unless special appropriations for shipping dried fruit are made in foreign-aid pro-grams, the United States is unlikely to be able to :market its surplus production inEurope. Whereas the main exports in prewar years went to the United Kingdom,Germany, France, Scandinavia, the Netherlands, and Belgium., most of these marketshave lost .their importance because of the shortage of dollars. The United Kingdomwas the chief postwar market even up .to the end of 1947, taking 30,000 tons of driedprunes and 25,000 tons of raisins annually. Since then, its imports of dried fruitsfrom the United States have practically ceased.
The 1949 'United States prune crop is estimated to be 33 percent above last year'sand 20 percent above the average. The output of raisins likewise promises to be large.With this prospect of good crops and decreasing, export outlet, the marketing situationin 1949/50 and thereafter promises to be difficult.
Dried prunes 213.2 184.4 165.1 111.0 57.0 90.1 103.7 77.1Raisins 198.3 274.9 202.3 107.0 54.0 54.0 112.1 49.9

B. Agricultural Products Fibers
NATURAL FIBERS used in manufacture include a large variety of materials of vegetableand animal origin. Of these, the following nine fibers of major economic significancewere reviewed in last year's State of Food and Agriculture and are considered againthis year: cotton, wool, silk, flax, hemp, jute, and the three major hard fibersabaca,sisal, and henequen.
PRODUCTION
World production of fibers in 1948/49 was 10 percent larger than in the previousyear and reached 93 percent of the average volume for 1934-38. World productionof each of the major fibers other than abaca, jute, and silk was larger than in theprevious season, but wool alone among the natural fibers reached the prewar level.Because of the predominant importance of cotton and of the United States as thelargest cotton producer, the recovery of fibers output was strongly influenced by abumper cotton crop harvested in the United States.
Nine-tenths of the world fiber production still consists of the natural fibers; theoutput of man-made fibers, however, has resumed a strong upward trend in thepostwar period (see Table 50).
The Americas and Asia together contribute about 70 percent of world fiber out-put. In 1948/49 record yields of cotton and continuing high levels of rayon outputraised North American production of fibers to 129 percent of prewar, accounting formore than one-third of the world total as compared with one-fourth before the war. InAsia, on the other hand, output of fibers in 1948/49 was at only 64 percent of the pre-war level, reflecting low levels of cotton production, a poor jute crop in Pakistan, areduced abaca output in the Philippines, and slow recovery from the drastically cur-tailed wartime production of hard fibers in Indonesia and of rayon manufacture andsericulture in Japan. Europe's share in natural fibers production is extremely smallcompared with its importance as a consumer of these raw materials. But the situa-tion in the man-made fibers is different: European production has resumed a sharpupward movement, contributing more than two-fifths of the world output in 1948.Production of natural fibers in the Soviet Union is still considerably below prewar,because of a further decline in cotton production and the reduced size of postwarflax and hemp crops. Oceania, though of predominant importance as an exporter ofapparel wool, continues to contribute the smallest continental share of world outputby volume.
89

TABLE 50.WORLD PRODUCTION OF FIBERS, PREWAR, 1947/48, AND 1948/49,1 BY TYPES AND BYREGIONS
By Types
1Data for cotton, wool, and into relate to production seasons; those for silk, flax, hemp, hard fibers,rayon, and nylon to calendar years.
2Preliminary figures.3Abaca, sisal, and henequen.',Approximate estimates.
A longer range perspective of world production of the major apparel fibers showsthe growth of rayon's share in the fiber total and the collapse of silk (see Chart 12and Table 51). For the first time since the end of the war, the volume of rayon pro-duction in 1948 exceeded the clean weight of the world wool clip.
CONSUMPTION
During the first three postwar seasons, world consumption of fibers, while stillappreciably below the prewar average, ran well in excess of current production (seeTable 52). In 1948/49 the gap was narrowed. New supply of wool, jute, and silkhad to be supplemented from stock, but cotton production exceeded consumption forthe first time since the war. Usage of rayon was up sharply and consumption of allfibers, including synthetics, rose from 92 percent of the prewar average in 1947/48 to94 percent in 1948/49.
Despite the rapid development and continuing expansion of textile manufacture inLatin America, Africa, and Oceania, the volume of natural fibers consumed in thesethree regions in 1948 accounted for only 7 percent of the world total. Both Europeand Asia consumed smaller shares than before the war, while the North American
90
Fiber or fiber groupQuantity Index Distribution
1934-38 1 1947/48 I 1948/492 1947/48 1 1948/491 1934-38 I 194,8/4,92
(___Thousand metric tons __ ) (1934-38 = 100) ( Percent )
1. Cotton 6,651 5,513 6,281 83 94 56 572. Wool (clean) 943 928 948 98 101 8 93. Raw silk 54 13 13 24 24 14. Flax 790 350 450 44 57 7 45. Hemp 454 267 345 59 76 4 36. Jute 1,875 1,568 1,391 84 74 15 137. Hard fibers' 522 456 483 87 92 4 48. Rayon filament yarn . 446 595 706 133 158 3 69. Rayon staple fiber 186 308 417 166 224 2 4
10. Nylon 20 30TOTAL 11,921 10,018 11,064 84, 93 100 100
Natural fibers (1-7) 11,289 9,095 9,911 81 88 95 90Man-made fibers (8-10) 632 923 1,153 146 182 5 10Mainly apparel and house.
hold (1-4 and 8-10) 9,070 7,727 8,845 85 97 77 80Alainly industrial (5-7). 2,291 2,219 80 80 23 20
Region By RegionsEurope 814 776 970 95 119 7 9U.S.S.R. 1,553 949 1,021 61 66 13 9North America 2,998 3,139 3,870 105 129 25 35Latin America 908 971 1,088 107 120 8 10Asia 4.489 3,126 2,852 70 64 37 25Africa 833 711 899 85 108 7 8Oceania 326 346 364 106 112 3 4WORLD 11,921 10,018 11,064 84 93 100 100

ThousandMetric tans10,000
5,000
4,000
3,000
1,000
500400300
200
100
504030
20
o
6
Chart 12.World Production of Major Apparel Fibers1909-13 Average and 1920-48
Popu n
19 20 i925 I 1930 I
1 1 1 1 1 1 1 1 1 1 1 1
935 1940 19 45FAO Ghor I No. 145 (Ro,)
share was much increased. Consumption of synthetic fibers, in particular in NorthAmerica, was vastly increased, but Asia's share in world consumption fell from 25percent prewar to 6 percent, largely because of the war damage to Japan's rayon in-dustry.
The increased importance of the United States in the postwar -world fiber economyis illustrated by the figures in Table 53. Any change in its textile activity will tend tohave stronger effects on the world fiber market than before the war. The effects oncotton prices of a continuing economic recession in the United States in 1949/50
91
POPULATIONTHOUSANDS)
300025002000
1500

TABLE 51.-W0RLD PRODUCTION OF MAJOR APPAREL FIBERS AND WORLD POPULATION, SELECTEDPERIODS, 1890-1948/49'
'Data for cotton and wool relate to production seasons; those for rayon, silk, and world populationto calendar years.
2Rayon filament yarn and staple fiber.2Population estimates are not entirely comparable for various years, owing to changes in statistical
reporting and compilation.n911-15.61910-13.61939.7Preliminary figures.
TABLE 52.-WORLD FIBER CONSUMPTION BY CONTINENTS, PREWAR, 1947/48,AND 1948/49
Continent 1947/48 11948/49 Pre1im.1 1934-38 1947/48 1948/49 Prelim.(_ Index 1934-38 =100.,) 1 _ Percent of world total
Natural fibers'
'Cotton, wool (clean), silk, flax, hemp, jute, and hard fibers.2Rayon and nylon.
92
Europe 76 82 32 27 30U.S.S.R. 51 60 14 8 9North America 145 125 17 28 24Latin America 166 171 3 5 5AsiaAfrica
80315
79338
34-
301
301
Oceania 191 191 - 1 1WORLD 89 89 100 100 100
Syn hetic fibers'Europe 116 139 49 40 37U.S.S.R. 87 425 1 1 3North America _. 348 407 23 53 50Latin America 247 327 2 4 4Asia 13 36 25 2 6Africa 150 350 - - -Oceania 250 400 - - -WORLD 146 182 100 100 100
PeriodWool,
Cotton clean SilkWorld
Rayon' Total population'
1909-13 = 100
1890 58 87 41 62 851909-13 100 100 '100 166 100 '1001924-28 125 112 172 1,200 125 1081929-33 123 115 197 2,656 126 1131934-38 143 123 186 7,022 151 1181939-43 130 129 159 12,822 150 '121
1945/46 99 117 38 7,044 112 1251946/47 101 122 38 8,433 117 1281947/48 118 121 45 10,333 134 1301948/49' 135 124 45 12,478 153 131
Percentage distribution
1890 80.0 19.7 0.3 100.01909-13 85.3 14.0 '0.5 100.01924-28 85.2 12.5 0.7 1.6 100.01929-33 83.0 12.8 0.8 3.4 100.01934-38 80.4 11.4 0.6 7.6 100.01939-43 73.4 11.9 0.6 14.1 100.01945/46 75.0 14.5 0.2 10.3 100.01946/47 73.3 14.6 0.2 11.9 100.01947/48 74.9 12.6 0.2 12.3 100.01948/49' 75.1 11.3 0.2 13.4 100.0

would be cushioned by the U.S. loan support program. No equally effective bufferwould be available for wool and other fibers, of which the United States is a majorimporter. Lower receipts from wool sales to the United States would mean a seriousloss of dollar earnings for the sterling area and for Argentina and Uruguay. Someweakening of demand, in the world wool supply-demand situation; however, mayactually help to achieve balance especially in the market for fine merinos free offault. During the first three and one-half years after the war the new clip supply hadto be supplemented from stocks accumulated during the war, and these reserves arenow nearing depletion.
In Europe, by far the largest share of fiber consumption is traditionally absorbedby the group of countries now participating in the European Recovery Program. TheUnited Kingdom, the largest single user, expanded its textile exports in 1948 andalso abolished clothes rationing, which had been in force since June 1941, though theend of rationing did not bring about any major change in domestic consumption be-cause buying continued to be held down by the high cost of 'clothing relative to spend-able incomes. However, the volume of textiles manufactured in the United Kingdom in1948 still did not reach prewar levels. Shortage of textile labor continued to be alimiting factor, even though the number of workers employed increased appreciably ineach successive postwar year. The tight labor situation, the high cost of new equip-ment, and the limited possibility of radical change in the often antiquated Britishtextile rnachinery have focused attention on methods of increasing output per man-hour by redeployment of labor and by minor improvements of key equipment.
The French textile industry was greatly aided in 1948/49 by dollar funds madeavailable for imports of cotton and sisal under the European Recover), Program, bysterling drawing rights granted to France under the Intra-European Payments Scheme,and by the continuation of special private revolving credits provided for purchases ofraw wool. French consumption of cotton and wool reached 94 percent of the 1934-38average in 1947/48 and 121 percent in 1948/49. In Belgium and Italy, consumptionof major apparel fibers was appreciably larger in 1948/49 than before the war, but fellshort of the exceptionally high levels attained in 1947/48. The drop in the volume oftextile manufacture in these two countries was associated with general deflationarytrends in their economies and with growing difficulties in their textile sales abroad. Anumber of Belgian workers who could not find employment at home migrated to the
TABLE 53.THE -UNITED STATES IN THE WORLD FIBER ECONOMY
Production I Consumption' Exports I Imports
l-Cotton, wool (clean), silk, flax, hem ), jute (including jute manufactures),abaca, sisal, henequen.
2Preliminary.3Rayon filament. staple fiber, nylon.
93
Natural fibers'( U.S. as percentage of world total .. )
1934-38 25 19 25 101947/48 29 29 14 181948/492 33 25 28 17
Synthetic fibers'1934-38 20 21 161947/48 50 51 13 191948/492 47 50 8 16
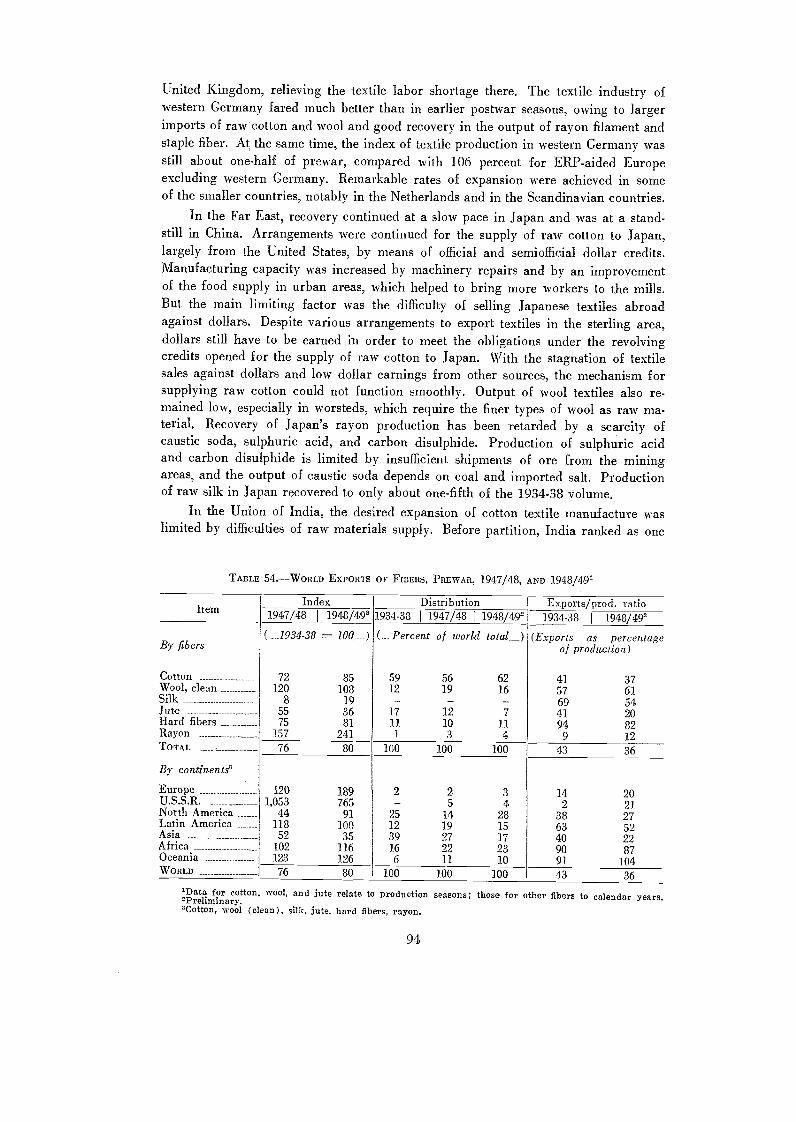
United Kingdom, relieving the textile labor shortage there. The textile industry ofwestern Germany fared much better than in earlier postwar seasons, owing to largerimports of raw cotton and wool and good recover), in the output of rayon filament andstaple fiber. At the same time, the index of textile production in western Germany wasstill about one-half of prewar, compared with 106 percent for ERP-aided Europeexcluding western Germany. Remarkable rates of expansion were achieved in someof the smaller countries, notably in the Netherlands and in the Scandinavian countries.
In the Far East, recovery continued at a slow pace in Japan and was at a stand-still in China. Arrangements were continued for the supply of raw cotton to Japan,largely from the United States, by means of official and semiofficial dollar credits.Manufacturing capacity was increased by machinery repairs and by an improvementof the food supply in urban areas, which helped to bring more workers to the mills.But the main limiting factor was the difficulty of selling Japanese textiles abroadagainst dollars. Despite various arrangements to export textiles in the sterling area,dollars still have to be earned in order to meet the obligations under the revolvingcredits opened for the supply of raw cotton to Japan. With the stagnation of textilesales against dollars and low dollar earnings from other sources, the mechanism forsupplying raw cotton could not function smoothly. Output of wool textiles also re-mained low, especially in worsteds, which require the finer types of wool as raw ma-terial. Recovery of Japan's rayon production has been retarded by a scarcity ofcaustic soda, sulphuric acid, and carbon disulphide. Production of sulphuric acidand carbon disulphide is limited by insufficient shipments of ore from the miningareas, and the output of caustic soda depends on coal and imported salt. Productionof raw silk in Japan recovered to only about one-fifth of the 1934-38 volume.
In the Union of India, the desired expansion of cotton textile manufacture waslimited by difficulties of raw materials supply. Before partition, India ranked as one
TABLE 54.WORLD EXPORTS OF FIBERS, PREWAR, 1947/48, ANO 1948/49'
/Data for cotton, wool, and jute relate to production2Preliminary.,Cotton, wool (clean), silk, jute, hard fibers, rayon.
94
seasons; those for other fibers to calendar years.
ItemIndex Distribution Exports/prod. ratio
1947/48 I 1948/49' 1934-38 I 1947/48 I 1948/49' 1934-38I 1948/492
By fibers(...J934-38 100) ( Percent of world total ) (Exports as percentage
of production)
Cotton 72 85 59 56 62 41 37Wool, cleanSilk
1208
10819
12 19 16 57 6169 54
Jute 55 36 17 12 7 41 20Hard fibers 75 81 11 10 11 94 82Rayon 157 241 1 3 4 9 12TOTAL _L 76 80 100 100 100 43 36
By continents"
Europe 120 189 2 2 3 14 20U.S.S.R. 1,053 765 5 4 2 21North AmericaLatin AmericaAsiaAfricaOceania
44118
52102123
9110035
116126
25 14 2812 19 1539 27 1716 22 236 11 10
38 2763 5240 2290 8791 104
WORLD 76 80 100 100 100 43 36

of the largest exporters of raw cotton. Since the establishment of the new frontiers,the Union of India has become a net importer of raw cotton while Pakistan nowdepends largely on supplies of finished textiles from abroad. The Bengal jute economyhas also been divided in two as a result of partition, raw jute supply is concentrated.largely in Pakistan, and the jute-manufacturing capacity in India is centered in thevicinity of Calcutta. While Indian exports of jute manufactures in 1948 were nearprewar levels, raw jute shipments overseas amounted lo little more than one-thirdof the prewar volume. The effeets of the reduction in raw jute supplies in the worldmarket have been felt most by the European industries, Nvhich have traditionallyabsorbed the bulk of jute fiber imports.
World consumption of hard fibers in 1948 recovered to 85 percent of theprewar rate. North America accounted for more than two-fifths of the total as com-pared with a third in the prewar period, while the shares of the other principalconsuming regions-----Europe and Asiawere correspondingly lower.
TRADE AND PRICESDespite some slight expansion of world fiber shipments in each successive postwar
season, the recovery of international fiber trade in the postwar period has been gen-erally slower than that of either world production or consumption. In the long run,this development may be accentuated further by the increasing importance of synthetictextile raw materials which can be produced where they are wanted and are largelyconsumed in countries of origin. In the case of raw cotton, the lowered ratio of worldexports to world production reflects in part the increased manufacturing use of rawcotton in certain major producing countries. A similar development has taken placein henequen; because a much larger share of the crop is being used in the Mexican in-dustry and exported as finished goods, exports of henequen have dropped from 75percent of total output before the war to 49 percent in 1948.
Three interrelated factors determine the importing countries' effective demandfor fibers: (1) processing capacity, (2) expectations concerning effective demand fortextiles at home and abroad, and (3) fiber prices and availability of foreign exchangefor fiber imports. During the first three postwar seasons, shortage of foreign exchangewas the most general obstacle, especially during the first three-quarters of the 1947/48season, when IJNRRA and other special credits had ended and United States aid hadnot yet been brought into effect. The general inflationary trend and the high rate oftextile manufacturing activity in the United States contributed to a sharp rise in fiberprices which made the position of fiber-importing countries more difficult, especially inEurope, which takes two-thirds of world imports. In 1948/49 the situation waschanging. The European Recovery Program and other credit arrangements madeavailable to importers much more liberal direct and indirect supplies o foreign .ex-change; industrial activity was declining in the United States; and in a number ofcountries there was growing consumer resistance to high textile prices.
A large share of the world's cotton and some of the hard fibers can be boughtonly for dollars. Wool and jute, on the other hand, are predominantly shipped fromsterling, areas, and are important sources of hard-currency earnings for these areas;indeed a larger-than-prewar share of world shipments of wool, jute, and hard fiberscontinued to be directed to the United States until the end of 1948.
95

In 1948/49, cotton for export was scarce in Asia, stocks were low in Brazil,whereas in the United States dollar credits and large supplies led to the declaration ofcotton as a surplus commodity under ERP. These facts account for the large shareof U.S. cotton in Europe's total cotton imports.
As regards raw wool, direct European purchases against dollars were quitesmall, but European importers were aided indirectly by ERP funds through themedium of sterling grants made available to them under the Intra-European PaymentsScheme. Special sterling credits for wool purchases were rnade available to France andPoland.
The Soviet Union supplied part of Eastern Europe's fiber requirements and atthe same time bought fairly substantial quantities of cotton and wool in the -worldmarket. An interesting instance of triangular trade was provided by an Austro-Hun-
TAI E 55.WHOLESALE PRICE INDICES OF MAJI OR FIBE S IN SELECTED MARKETS, SPECIFIED PERIODS
Fibers and wholesale price indices
Cotton:United States, Middling n", 10 U.S. mar-
kets, averageMexico, Middling torreon'Brazil, Type 5, Sao Paulo'India, Jarilla fine, Bombay'Egypt, Ashmouni good, Alexandria'Peru, Tanguis, Type 5, Lima'
Wool:Merino
Australia, 64's average, clean basis,London'
United States, Territory staple 64's,70's, 80's, clean basis, Boston
CrossbredArgentina, 56's, greasy basis, Buenos
Aires'New Zealand, 46's average, clean basis,
London'New Zealand, 56's average, clean basis,
London'Carpet
East Indian, average white vicanere,greasy basis, Liverpool'
Silk: Japanese, 13/15 denier, White Dgrade, New York
Rayon:Filament, Viscose, 150 denier, U.S.A.Stable Fiber, Viscose 11/2 denier, U.S.A.
Nylon: 30 denier, 10 filaments, U.S.A.'Jute: Indian, Native Firsts, New YorkAbaca: Davao I, New YorkSisal: British East Africa, No. 1, U.K.'Henequen: Mexican, Grade A, U.S. port of
entryWholesale Price Indices:
United States: Wholesale prices, general(Bureau of Labor Statistics)
United Kingdom: Wholesale prices, gen-eral (Board of Trade)
273 308 302 304 292 295 294 293197 229 251 260 218 224 198 191191 231 272 252 306 298 283 281245 239 341 313 338 338 338 338
. 268 422 450 338 298 298 278191 205 259 222 ... 257
153 236 368
122 145 177
114 152 185
177 218 273
182 206 234
199 202 229
... 276 158
Jan.-Mar. I Jan.-Mar.1948 1949
324 401 339 347 358
149 214 214 214 205
163
257 314 268 279 279
232 284 248 240 240
221 207 207 221 .
158 158 158 158 158
1934-38 =. 100
Apr. I May June1949 I 1949 1949
98 118 132 130 135 135 130 12583 107 122 120 123 123 120 11764 60 61 60 63 63 63 ...
228 367 430 398 486 465 446 ...194 391 396 392 425 407 411 ...249 354 425 411 458 458 458 ...154 304 323 323 317 317 317
151 190 206 203 197 195 194 193
182 199 228 224 229 235 240 240
lIndices based on quotations in U.S. cm ts per pound. Quotations in local currencies converted atInternational Monetary Fund ratee.
2Indices for Dominion and carpet wool and for sisal are based on original sterling quotations.331 December 1939 100.411-month average.
96
1946 1947 1948
ganan barter agreement, concluded under ERP auspices, under which dollars out ofAustria's ERP allocation were allotted to Hungary for purchases of United Statescotton against shipments of Hungarian grain to Austria.
After Europe, the Far East has traditionally had the next largest demand forimported fibers, mainly to supply the raw material needs of Japan. In 1948/49 thevolume of Asiatic fiber imports was less than half the prewar average, largelybecause of the difficulties in Japan already mentioned.
The scope and function of centralized competitive world fiber markets havebeen narrowed and changed, compared with prewar, by the strengthening of govern-mental control over trade and foreign exchange payments, enlargement of the statetrading sector, and wide-scale adoption of barter deals. Nevertheless, the importanceof centralized world fiber markets has reasserted itself to some extent since the war.The Joint Organization's system of determining the size of wool offerings and main-taining reserve prices has been combined with the sale at public auction of the pre-dominant share of all wool entering the world market. The Raw Cotton Commissionin the United Kingdom, which is responsible for all cotton purchases from abroad,follows the policy of adjusting domestic prices to spinners to changes in world marketprices. Even in countries where foreign trade is entirely conducted by the govern-ment, as in the Soviet Union, part of the buying is transacted through private tradingagents bidding in world market centers. Thus, prices quoted in competitive or semi-competitive world fiber markets continue to govern or influence the terms of tradingfor a large share of world fiber purchases, irrespective of whether these transactionsare conducted on private or government account.
Prices of most types of apparel fibers declined in early 1949, but as of June1949 they were still from two to three and a half times the 1934-38 average (see Table55). Prices of U.S. Middling, which had dropped sharply during the third quarter of1948, remained fairly stable from then on, oscillating within 1 to 2 cents above sup-port levels. Quotations for Egyptian cotton, which in 1947/48 had risen out of pro-portion to those of other growths, fell back nearer into line during the 1948/49 season.The price of Indian cotton, on the other hand, might have risen sharply if ceilings hadnot been imposed by the Government of the Indian Union. The cost of merino woolrose sharply in 1948 and, after a drop from February to April 1949, rallied again inMay at levels still nearly three and a half times the prewar average. Crossbred pricesfollowed the downturn early in 1949 and, in the case of 46's, continued to declinefrom April to May.
By contrast, the price of rayon staple fiber in the United States is quoted atonly 17 percent above the prewar average. Prices fixed for the sale of raw silk in theUnited States, the world's major silk market, were reduced sharply by SCAP at thebeginning of 1948, and now stand at 158 percent of the prewar average. The pricerelationship between raw silk and rayon has thus been brought more nearly into linewith that prevailing before the war.
Prices quoted for jute and for the major hard fibers have risen even moresharply, compared with prewar, than these other fibers and have dropped less.
In 1947, while unit values of raw cotton and wool imports into a number of majorconsuming countries were high compared with prewar, the unit values of their exportsof cotton and wool textiles were very much higher (see Table 56). In 1948, however,the trend was reversed. In the United Kingdom, Belgium, France, and Japan, unitvalues of raw cotton imports were up sharply from 1947 levels while those of cotton
97

TABLE 56.COTTON AND WOOL: INDICES OE UNIT VALUES AND PRICES'
I. Raw Cotton and Cotton Textiles
98
/Indices based on uuit values in U.S. dollars converted at International Monetary Fund official sellingrates except for French unit values for the period from 1 November - 31 December 1948, for which IMFaverage rates were used for all imports and for exports to soft-currency areas; Japanese postwar unitvalues computed from dollar trade returns as quoted in SCAP, Japancsa Economic Statistics.
2January-April.3Averages of quotations on ten markets for qualities of cotton consumed in each of 17 constructions
of cloth.*Average for 17 constructions./January-June.
textile exports rose less in the United Kingdom, much less in Japan, showed littlechange in France, and declined in Belgium. In the United States, the ratios of rawcotton prices to prices of finished cloth ex mill also increased between 1947 and 1949.
WORLD TRADE IN TEXTILES
Before World War II, exports from Europe and Japan provided nine-tenths ofall trade in cotton textiles and more than nine-tenths of the trade in wool and rayonfabrics (see Table 57). The most fundamental change from the prewar pattern is theeclipse of Japanese exports, which in 1948 were still little more than one-tenth of the1938 level for cotton textiles, less than one-fourteenth for wool textiles, and only 2 per-cent for rayon textiles. It had been hoped that the need for dire,ct dollar paymentswould be substantially relieved by an arrangement with the sterling area which pro-vided for the exchange of Japanese exports, mainly of textiles, against raw materials,especially salt, Australian wool, and Malayan rubber. Sizable quantities of Japanesecotton gray goods were shipped to the United Kingdom in 1948 and re-exported afterfurther processing, mainly to colonial markets. However, Japanese purchases in thesterling area fell short of expectations, and in early 1.949 the British Board of Tradesuspended further imports of Japanese gray goods because they might "involve the
Country1.
Raw cotton (imports)2.
Cotton textiles (exports)3.
Ratio 1:21947 I 1948 1949' 1947 I 1948 I 1949' 1947 I 1948 I 1949'
Indices of unit values: 1938 100
United Kingdom 258 455 408 278 345 356 93 129 115
Belgium 319 333 328 268 97 124
France 303 377 447 424 69 89
Japan 254 465 435 439 58 106
1. 2. 3.Raw cotton3 Cot ton cloth4 Ratio 1:2
1947 I 1948 I 19492 1947 I 1948 I 19496 1947 I 1943 I 19496
Price indices: 1938 100
United States 375 367 345 457 415 322 82 88 107
II. Raw Wool and Wool Textiles
Country 1.Raw wool (imports)
2.Wool textiles (exports)
3.Ratio 1:2
1947 I 1948 I 1949' 1947 I 1948 I 1949' 1947 I 1948 I 19492
( _ Indices of unit values: 1938 =.
United Kingdom 171 225 286 200 239 255 86 94 112France 193 274 326 306 59 90Belgium 172 197 201 160 86 123

United Kingdom in a dollar commitment." Continuation of the trade will presumablydepend on the outcome of negotiations now in progress for a new trade agreementwith japan for the trading year beginning 1 July 1949.
European textile exports in 1918 were back to about nine-tenths of the 1938level for wool and rayon and four-fifths for cotton. Britain's exports of wool textileswere 14 percent larger than in 1938, and its shipments of rayon fabrics reached twoand a half times the 1938 level. At the same time; exports of cotton textiles from theUnited States receded from the exceptionally high levels of 1947. In general, therecovery of world textile trade has been very much slower than that of textilemanufacture.
In part, the lowered ratio of textile trade to manufacture, like the loweredratio of fiber trade to consumption, reflects the industrial development in a number ofcountries such as Argentina, Brazil, and India, which replace imported textiles bygoods processed in their own mills from home-grown fibers. Another major factorhas been increased textile consumption in the United States, the bulk of which ishome-produced and is thus not reflected in increased international trade. And textilepurchases by countries which continue to rely on imports for thc bulk of their con-sumption have been held down by the shortage of external purchasing power and thehigh prices of textiles.
TABLE 57.W0RLD TRADE IN TEXTILES, 1947 AND 1948 COMPARED WITH PREWAR
L Exports
Debtination
II. Imports
Cotton I Wool 1 Rayontextiles 1 textiles I textiles
99
Cotton I Wool I Rayontextiles 1 textiles 1 textiles
SourceCottontextiles
I WoolI textiles
I Rayon1 textiles
Cottorttextiles
I WoolI textiles
Rayontextiles
1947 I 1948 1947 I 1948 1947 1948 1938 11918 1 1938 1948 1938 I 1948
Index 1938 100 -) PCFCCT tage of world exports__)
United Kingdom 45 63 91 114 181 255 19 19 33 47 7 29Other Europe 72 90 68 63 63 53 24 35 48 40 33 29Japan 12 12 4 7 1 2 45 10 19 2 56 2Europe and Japan 35 44 64 73 34 37 88 64 100 89 96 60North America 458 288 900 733 5 22 9 3 40Latin America ------- 1,700 1,500 _ _ 3
Other 90 90 7 11 2 1
WonLn 63 61 84 81 62 60 100 100 100 100 100 100
1947 1948 I 1947 I 1948 1947 I 1943 1938 11948 I 1938 I 1948 1938 I 1948
i(lex 1938 100 . ) Percet tage of world imports
Europe 98 102 79 75 80 67 9 15 34 31 17 19North America 240 153 117 133 300 300 2 5 9 14 1 5
Latin America 41 27 56 56 109 112 16 7 13 9 14 27Asia 42 39 85 69 21 91 47 30 19 16 47 16
Africa 72 80 62 50 92 92 22 30 11 7 11 17
Oceania _________ 79 90 83 83 103 107 4 6 8 9 10 16
Other 175 200 7 6 14
61 34 81 62 60 100 100 100 100 100 100

TEXTILE CONSUMPTIONPostwar per caput levels of textile consumption are strikingly different from
prewar in a number of countries. In Germany, Austria, Japan, and Indo-China, percaput consumption is only one-half or less of the prewar average. In Bulgaria, Den-mark, Finland, Greece, Ireland, and Indonesia, it has declined by one-half to one-third. By contrast, it has increased by one-third or more in Poland, Portugal, Switzer-land, Canada, the United States, Uruguay, Malaya, and British East and West Africa.It has also increased significantly in Belgium, France, and Sweden.
Chart 13 shows the inequality of textile consumption levels in different parts ofthe world. In 1938 the least favored tenth of the world's population consumed littlemore than 2 percent of all cotton, wool, and rayon textiles, while the most favoredtenth consumed nearly 30 percent. In 1948 the inequality was even more pronounced.
The United States, with 7 percent of the world's population, absorbed more thanone-third of all cotton, wool, and rayon textiles consumed in 1948, and had the highestper caput consumption. Canada, Sweden, Belgium, and Switzerland came next (seeTable 58). Together, these five high-income countries, accounting for just over 11
TABLE 58.-COTTON, RAYON, A ND WOOL TEXTIL :S AVAILABLE PER PERSON, 1938, 1947, AND 1948
'Partially estimated by interpolation.
100
Total: Cotton, Rayon Total: Cotton, RayonContinent and country and Wool textiles Continent and country and Wool textiles
1938 1947 I 1948 1938J
1947J
1948
( __Kg. per person ) ( _Kg. per person )
Austria 6.0 1.8 3.1 Cuba 4.8 4.6 3.9Belgium 9.3 10.9 11.3 Ecuador 1.6 1.3 1.8Bulgaria 4.5 2.6 2.9 Mexico 2.9 3.1 3.0Czechoslovakia 5.1 6.3 6.6 Peru 1.9 2.3 2.3Denmark 7.2 5.4 5.1 Uruguay 2.5 5.5 5.3Finland 6.9 4.8 5.2 Venezuela 1.9 2.1 2.4France 7.0 8.1 9.0 West Indies 3.5 3.1 2.4GermanyGreeceHungaryIrelandItalyNetherlandsNorwayPolandPortugalRumaniaSpainSwedenSwitzerlandUnited KingdomYugoslavia
8.2 2.5 3.74.7 3.4 3.63.8 2.1 2.94.4 4.2 3.34.2 5.7 4.48.2 7.6 8.76.2 7.0 6.22.8 3.3 4.03.1 4.1 4.22.6 1.7 2.02.4 3.2 3.29.0 12.5 11.57.5 12.3 11.2
12.4 10.3 10.93.3 2.6 2.4
LATIN AMERICA,TOTAL'
BurmaCeylonChinaIndia-PakistanIndo-ChinaIndonesiaIranJapanMalayaSyria and LebanonTurkey
ASIA, TOTAL'
3.7 3.6 3.61.5 1.0 1.12.6 1.2 1.21.7 1.4 1.42.2 1.9 2.11.1 0.5 0.50.9 0.6 0.62.4 1.7 1.79.1 1.6 1.53.0 4.5 5.04.6 3.8 3.63.5 3.5 3.32.3 1.5 1.6
EUROPE, TOTAL'. 6.3 5.5 5.8 Anglo-Egyptian Sudan 1.5 1.0 1.1U.S.S.R.CanadaUnited States
British East AfricaBritish West. AfricaEgyptSouthern Rhodesia
0.9 1.1 1.30.6 0.8 0.93.1 2.9 2.93.4 2.8 2.2
3.7 2.3 2.58.4 13.6 12.0
12.1 18.8 18.9
12.0 18.4 18.3NORTH AMERICA,
TOTALU. of S. Africa 3.2 3.2 2.9
1.5 1.3 1.3ArgentinaBrazilBritish Guiana
AFRICA, TOTAL'
AustraliaNew Zealand
6.7 8.2 8.13.8 4.2 4.12.6 3.3 2.4
8.5 8.4 9.75.5 6.9 6.7
Chile 3.8 4.3 3.4 OCEANIA, TOTAL1 6.6 6.6 7.7Colombia 2.4 2.6 2.7 WORLD TOTAL' 3.9 3.5 3.7

Chart 13.Inequality of Textile Consumption Levels1938 and 1948
B. Cotton, Wool, and RayonA. Cotton
z100 ct 100O coR .1a.
co
o8 z^ 80z oo 1-.
Q 1.-oozo 60 o 60u_f-I-- ZO oo
Q-
40 40cc coo zoo
u, coo Icr 20t-z g1,J L.0 0w
1.--w za w- 0 20 40 60 80 10020 40 60 80 100 (ii--)
u.,PERCENT OF WORLD POPULATION a_ PERCENT OF WORLD POPULATION220 Cnoo No 293
percent of the world population, absorbed in 1948 nearly one-half of all textiles usedin the world. At the other end of the scale, eight African and Asiatic countries (in-cluding China), accounting for 30 percent of the world's population, absorbed 9percent.
OUTLOOK FOR 1949/50 AND 1950/51The production outlook for the major fibers can be briefly summarized as folio vs:
Cotton. The world production outlook is dominated by the situation in theUnited States, where the planted area is reported to be 14 percent larger in 1949 thanin 1948; given average weather, the crop may approximately equal the exceptionallyhigh-yielding bumper harvest of the previous season. In most other cotton-growingareas, also, indications point toward some expansion of area. Unless growing condi-tions are poor, the world cotton crop may exceed the 1948/49 volume by 5 percentOr more.
Wool. Production in the chief exporting countries has been stimulated by re-munerative prices, but the downward trend of North American production shows nosigns of being reversed. The world clip may be about 3 to 5 percent larger than in1948/49, with a slightly more than proportionate increase of merino production.
Silk. World production in 1949 may reach from 25 lo 30 percent of the prewarvolume. In Japan, production is again expected to be about 10 percent higher thanin the previous year. In Italy-, although the drastic decline from 1947 to 1948 willprobably be sharply reversed, output in 1949 is not likely to reach the 1947 volume.
101
Flax and Hemp. Further and possibly substantial increases in world produc-tion may occur, depending mainly on the degree of recover), in the Soviet Union.Nevertheless, output of both fibers, and especially of flax, will probably remain con-siderably below prewar levels.
Jute. According to unofficial reports, the area in Pakistan is 12.5 percent largerthan in 1948/49, and the Indian area is larger by one-third. While early rains havelessened crop prospects, there seems to be at least a fair chance that the combined out-put of the two countries will be about 20 percent larger than in 1948/49, Or about 90percent of the prewar average.
Hard Fiber-s. Output in 1949 is expected to recover to within 5 percent of the1934-38 average. Gains in sisal and henequen production should more than offset t eprospective decline in abaca output.
Man-tnade Fibers. With added capacity and continuing expansion of output inmost regions, world production of man-made fibers may again rise by more than 20percent in 1949.
Aggregate output of major fibers in 1949/50 may be about 10 percent larger thanin the previous season, with synthetics representing about 12.5 percent of the total ascompared with an average of about 5 percent during the years 1934-38.
The 1949/50 outlook for world fiber consumption is largely influenced by eco-nomic prospects in the United States; if the recession goes no further, the level ofconsumption should recover somewhat from its recent decline. Moderate expansionmay continue in a number of European countries and in Latin America and Asia.Imports of raw cotton and wool into ERP countries are planned at higher levels thanthe quantities imported in 1948/49. Sterling finances for fiber imports should notpresent major difficulties; the wool program will presumably be carried out, therefore,unless mill activity is depressed by declining demand for finished wool goods at homeand abroad. As for cotton imports, sterling-area cotton, other than Egyptian, mayagain be rather scarce. At the same time, the hard-currency purchasing power of theERP group will presumably be low, despite Marshall Plan aid. Japan's consumptionof imported fibers hinges on its earnings from textile sales abroad, but there is littleprospect that its textile sales against dollars will increase. General indications arethat world fiber consumption will expand little in 1949/50, with cotton consumptiondropping slightly from the 1948/49 level, wool consumption showing little change,and consumption of flax and hemp, jute, hard fibers, and synthetics increasing inapproximate proportion to the increased output of these materials.
If these estimates are approximately correct, world fiber stocks in mid-1950would be about as follows: Cotton stocks would be larger by about 25 percent than ayear earlier, or equal to nearly eight months' consumption at the current rate, with acarry-over of U.S. cotton representing more than two-thirds of the world carry-over.Stocks of good apparel-type wool might be down to levels approximating those requiredfor working capital. Reserves of other fibers would continue at generally low levels.
As to the outlook for 1950/51, indications point toward a continuation of allmajor production trends anticipated for 1949/50, except for a probable reduction ofcotton area in the United States. In regard to consumption levels, the pace will beset again by general economic conditions in the United States and by the foreign
102
exchange situation in major fiber-importing countries. If industrial activity in theUnited States declines in 1950/51, the effects would be felt increasingly in othercountries by that time. Low levels of U.S. imports and intensified competition ofU.S. exporters would make it even more difficult for the rest of the world to earn thedollars required for their purchases of raw materials from hard-currency areas. Onthe other hand, if economic levels are high in the United States, and if some of themajor obstacles to the smooth functioning of world trade can be overcome, worldconsumption in 1950/51 would almost certainly exceed prewar levels for all majorapparel fibers except silk.
Looking arther ahead, the long-term prospects for the natural fibers are boundto be strongly influenced by the development of synthetic fibers and of new competinguses of other substitutes such as paper. The relation between prices of natural andsynthetic fibers has changed in favor of the latter, compared with prewar. Moreover,foreign exchange considerations have prompted most of the major fiber-importingcountries to give special attention in their long-term plans to the development of syn-thetic fiber industries.
As to production prospects, the amount of land and labor required per unit ofcotton and other vegetable fibers may decrease, and the amount of capital per unit ofland may increase. These developments may result from wider mechanization andfrom measures aiming at improved yields. Prospects of extending the world's sheep-grazing areas appear limited, but the carrying capacity of pastures can be- improved,and there is still much scope for increasing the weight per fleece and improving thequality of wool produced in areas where pastoral methods are still prirnitive.
In a prosperous world, effective demand should be sufficient to abSorb an ex-panded volume of natural fibers alongside increased quantities of synthetic materials,unless further drastic changes in price relationships and qualitative improvement ofsynthetics should fundamentally weaken the competitive position of natural fibers.
The decline in ratios of world fiber trade to fiber production and consumption,as well as the decline in the ratio of international textile trade to textile manufacture,may be expected to continue. These trends will be promoted by the growing impor-tance of synthetic fibers, which can be produced where they are wanted, and by thecontinuing .development of textile manufacture in countries producing the majornatural fibers.
103

C. Fisheries Products
MANY UNDERDEVELOPED COUNTRIES are anxious to expand their fisheries. Such coun-tries as Ceylon, China, Costa Rica, India, Pakistan, and Turkey have recently soughtand obtained technical advice in this field, while some have placed orders abroad forequipment. Landings have already significantly increased in a number of minorproducing countries, though not yet on a large enough scale to affect total worldproduction.
In North America and Europe, catching capacity continues to increase, withemphasis on larger craft and iinproved fishing equipment. A decline in fish prices,which is envisaged in certain quarters, would create difficulties in countries wherefisheries are expanding under relatively high production costs.
TRENDS IN QUANTITY PRODUCED
Landings in Europe in 1948 were about 700,000 metric tons greater than in 1947and about 1.1 million metric tons above the prewar average (see Table 59). Allcountries of major importance except Germany surpassed their prewar outputBel-gium, the Netherlands, Ireland, Denrnark, Sweden, Poland, Iceland, and probablyalso the Faroes, by more than 50 percent, and Norway and France by 38 percent.Although a complex of factors have played their part, the increase in landings is dueprimarily to greater catching capacity.
The United Kingdom put 18 new long-distance trawlers into operation during1948, and 40 additional vessels will start operations in 1949. Denmark launched 45relatively large cutters in 1948 to replace some worn-out craft. A floating trawl re-cently invented in Denmark for fishing in the free water between the bottom and thesurface of the sea is reported to be very efficient; it may well be the most importantinnovation in its field for many years. The Faroe Islands had 40 trawlers at the be-ginning of 1948, compared with 9 in 1939. Germany has acquired some trawlers bytransfer from the United States; it has also programmed the building of 100 newcraft, of which about 15 are under construction. The fleets of France, Ireland, theNetherlands, Norway. Portugal, and Spain have added several efficient new units.Since the cessation of hostilities several thousand echo sounders have been installedin the European fleet. Norway's long-term program envisages further investmentequivalent to US $117 million in its fisheries industry during 1949-52. Of thisamount, $40 million is planned for the construction of a number of small craft and
104
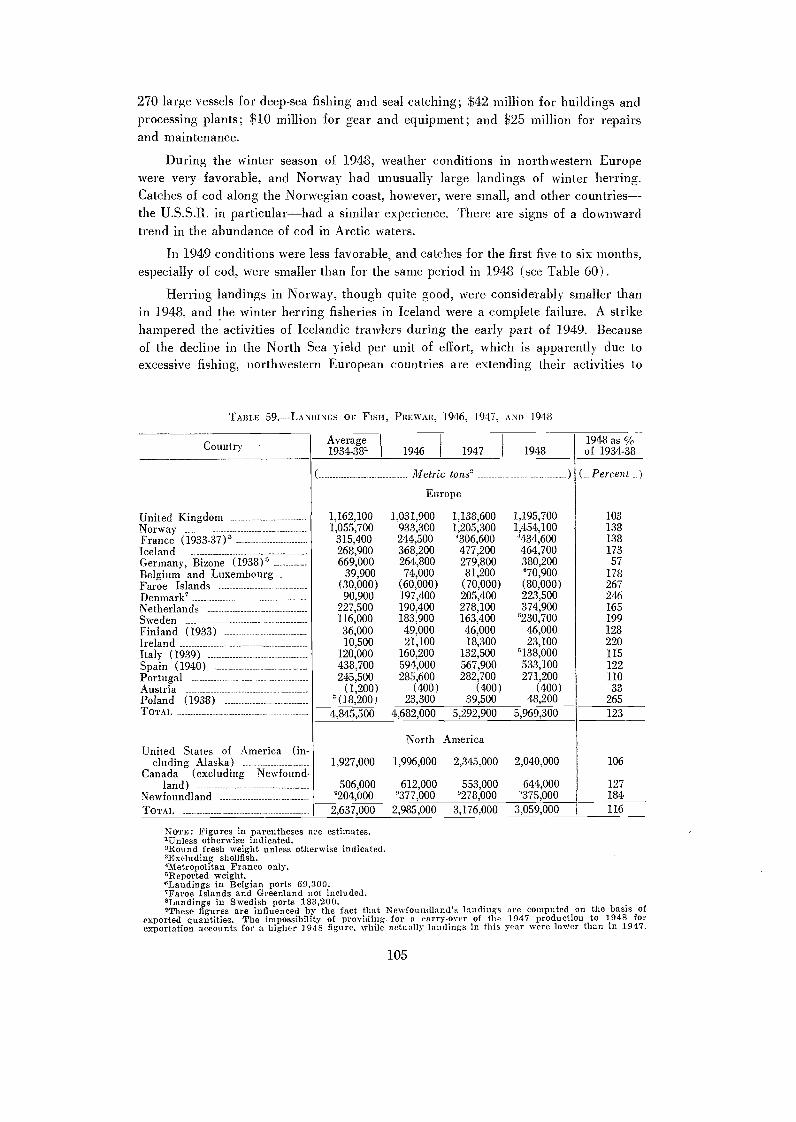
270 large vessels for deep-sea fishing and seal catching; $42 million for buildings andprocessing plants; $10 million for gear and equipment; and $25 million for repairsand maintenance.
During the winter season of 1948, weather conditions in northwestern Europewere very favorable, and Norway had unusually large landings of winter herring.Catches of cod along the Norwegian coast, however, were small, and other countries-the U.S.S.R. in particular-had a similar experience. There are signs of a dow-nwardtrend in the abundance of cod in Arctic waters.
In 1949 conditions were less favorable, and catches for the first five to six months,especially of cod, were smaller than for the same period in 1948 (see Table 60).
Herring landings in Norway, though quite good, were considerably smaller thanin 1948, and the winter herring fisheries in Iceland were a complete failure. A strikehampered the activities of Icelandic trawlers during the early part of 1949. Becauseof the decline in the North Sea yield per unit of effort, which is apparently due toexcessive fishing, northwestern European countries are extending their activities to
TABLE 59.-LANDINGS OF FISH, PREWAR, 1946, 1947, AND 1948
NoTE: Figures in parentheses are estimates.lUnless otherwise indicated."Round fresh weight unless otherwise indicated."Excluding shellfish.'Metropolitan France only.'Reported weight."Landings in Belgian ports 69,300.7Faroe Islands and Greenland not included.sLandings in Swedish ports 183,200.sThese figures are influenced by the fact that Newfoundland's landings are computed on the basis of
exported quantities. The impossibility of providing for a carry-over of the 1947 production to 1948 forexportation accounts for a higher 1948 figure. while actually landings in this year were lower than in 1947.
105
Country Average1934-381 1946
I
I 1947 I
I
1948
( Metric tons' )
Europe
United Kingdom 1,162,100 1,031,900 1,138,600 1,195,700Norway 1,055,700 933,300 1,205,300 1,454,100France (1933-37)3 315,400 244,500 4306,600 '434,600Iceland 268,900 368,200 477,200 464,700Germany, Bizone (1938)" 669,000 264,800 279,800 380,200Belgimn and Luxembourg 39,900 74,000 81,200 670,900Faroe Islands (30,000) (60,000) (70,000) (80,000)Denmark' 90,900 197,400 205,400 223,500Netherlands 227,500 190,400 278,100 374,900Sweden 116,000 183,900 163,400 8230,700Finland (1933) 36,000 49,000 46,000 46,000Ireland 10,500 21,100 18,300 23,100Italy (1939) 120,000 160,200 132,500 '138,000Spain (1940) 438,700 594,000 567,900 533,100Portugal 245,500 285,600 282,700 271,200Austria (1,200) (400) (400) (400)Poland (1938) "(13,200) 23,300 39,500 48,200TOTAL 4,845,500 4,682,000 5,292,900 5,969,300
North AmericaUnited States of America (in-
cluding Alaska) 1,927,000 1,996,000 2,345,000 2,040,000Canada (excluding Newfound-
land) 506,000 612,000 553,000 644,000Newfoundland '204,000 "377,000 '278,000 "375,000
TOTAL 2,637,000 2,985,000 3,176,000 3,059,000
1948 asof 1934-38
( Percent )
10313813817357
178267246165199128220115122110
33265123
106
127184,
116
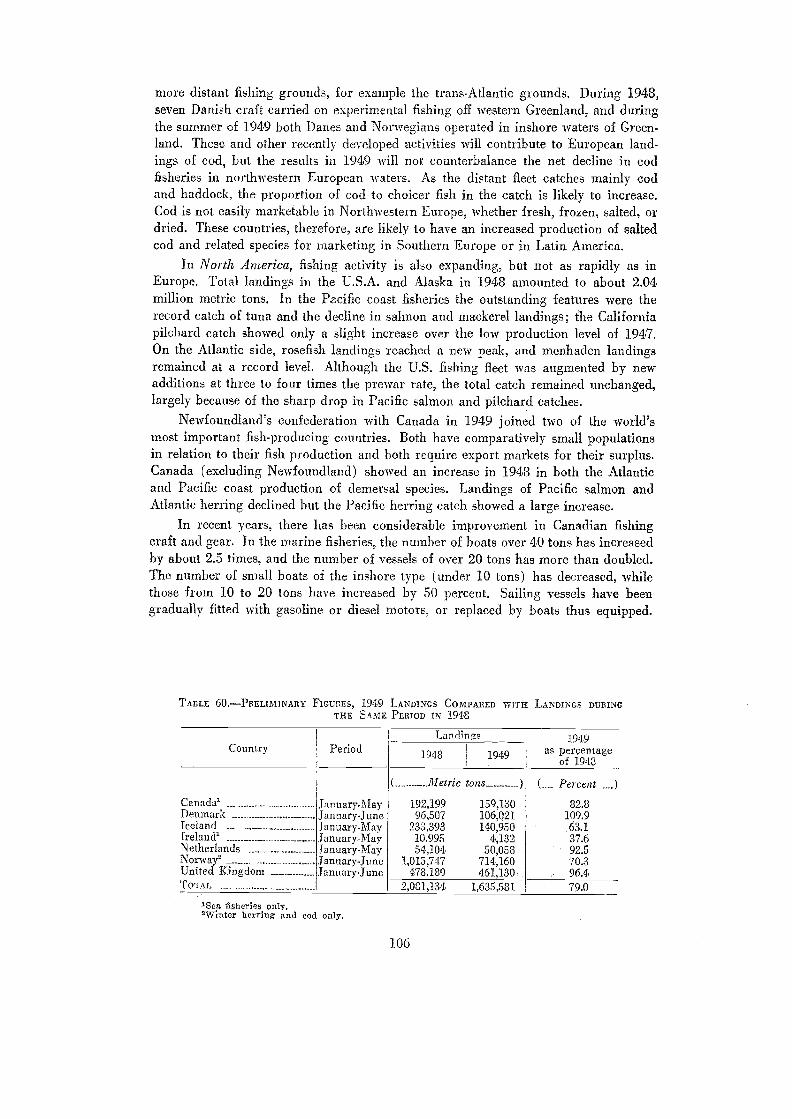
more distant fishing grounds, for example the trans-Atlantic grounds. During 1948,seven Danish craft carried on experimental fishing off western Greenland, and duringthe summer of 1949 both Danes and Norwegians operated in inshore waters of Green-land. These and other recently developed activities will contribute to European land-ings of cod, but the results in 1949 Nvill not counterbalance the net decline in codfisheries in northwestern European waters. As the distant fleet catches mainly- codand. haddock, .the proportion of cod to choicer fish in the catch is likely- to increase.Cod is not easily marketable in Northwestern Europe, whether fresh, frozen, salted, ordried. These countries, therefore, are likely to have an increased production of saltedcod and related species for marketing in Southern Europe or in Latin America.
In North America, fishing activity is also expanding, but not as rapidly as inEurope. Total landings in the U.S.A. and Alaska in 1948 amounted to about 2.04million metric tons. In the Pacific coast fisheries the outstanding features were therecord catch of tuna and the decline in salmon and mackerel landings; the Californiapilchard catch showed only a slight increase over the loi,v production level of 1947.On the Atlantic side, rosefish landings reached a new peak, and menhaden landingsremained at a record level. Although the U.S. fishing fleet was augmented by newadditions at three to four times the prewar rate, the total catch remained unchanged,largely- because of the sharp drop in Pacific salmon and pilchard catches.
Newfoundland's confederation with Canada in 1949 joined two of the world'smost important fish-producing countries. Both have comparatively small populationsin relation to their fish production and both require export markets for their surplus.Canada (excluding- Newfoundland) showed an increase in 1948 in both the Atlanticand Pacific coast production of dernersal species. Landings of Pacific salmon andAtlantic herring declined but the Pacific herring catch showed a large increase.
In recent yezrs, there has been considerable improvement in Canadian fishingcraft and gear. In the marine fisheries, the number of boats over 40 tons has increasedby about 2.5 times, and the number of vessels of over 20 tons has more than doubled.The number of small boats of the inshore type (under 10 tons) has decreased, -whilethose from 10 to 20 tons have increased by 50 percent. Sailing vessels have beengradually fitted with gasoline or diesel motors, or replaced by boats thus equipped.
TABLE 60.PRELIMINARY FicullEs, 1949 LANDINGS COMPARED WITH LANDINGS DURINGTHE SAME PERIOD IN 1943
:Tea fisheries only.'Winter herring and cod only.
106
Canada' January-May 192,199 159,130 82.3Denmark January-June 96,507 106,021 109,9Iceland january-May 233,393 140,950 63.1Ireland' _________ January-May 10,995 4,132 37.6Netherlands ranuary-May 54,104 50,058 92.5Norway' ranuary-June 1,015,747 714,160 70.3United Kingdom January-June 478,189 461,130- 96.4TOTAL 2,081,134 1,635,581 79.0
Country PeriodLandings 1949
as percentageof 1948
1948 1949
. ______ Metric tons (, Percent __)

Newfoundland production of salted cod was less in 1948 than in 1947 becauseof excessively stormy weather and a serious shortage of bait for inshore and bankfisheries. The Labrador fisheries showed an improvement. In 1948 production offresh and frozen fish showed an increase over 1947.
Available estimates show that the landings in Latin America increased from some250,000 metric tons annually during the immediate prewar years to some 460,000 tonsin 1947, or by more than 90 percent. On the basis of incomplete information, 1948landings have been estimated at 490,000 tons.
World scarcity of fish and other food during World War II encouraged expansionof Latin American fisheries, and the production of salted products was developed insome countries to substitute for salted cod previously imported from Europe andNorth America. After the war, the traditional sources of supplies became availableagain, but local fisheries continued to expand.
The Far East is one of the most important fish-producing areas in the world.Production includes large quantities of salt-water fish, crustaceans, mollusks, and alsofresh-water and brackish-water species. Research and development work in this areais being encouraged and co-ordinated by the Indo-Pacific Fisheries Council under theauspices of FAO.
In the non-self-governing British territories of the Far Eas Malaya, Sarawak,North Borneo, and othersthe British authorities are extending research and experi-menting with new fishing techniques. Pakistan is formulating plans to expand itsmarine and inland fisheries and is encouraging fish-pond farming. Two fisheriesresearch trawlers- and six other craft are being sought for biological surveys and ex-perimental fishing and plans are being made for the construction of a modern fishingharbor at Karachi. Thailand's production in 1948 was adversely affected by poorcatches and by a heavy export duty. The duty has now been reduced, and an increasein production is expected. Malaya, an important producer, has made excellent prog-ress in rehabilitating its fisheries to the prewar level of production. A resumption ofits export trade in salted fish may be expected with the return of more settled condi-tions. Ilong Kong has restored the productivity of its fisheries, but is facing seriousdifficulty in marketing its produce because of the unsettled economic conditions insouthern China.
According to most recent statistics, Japan's production decreased from 2 8 millionmetric tons in 1947 to 2.6 million metric tons in 1948. Increased supplies of fishingrequisites should have helped augment production, but sardine and herring stocksshow great fluctuations and appear at present to be declining. A greater proportionof the catch seems to be used for human food than in the prewar years. Oil and mealproduction, which was substantial before the -war, remains at a low level. The de-marcation of fishing areas open to Japanese fishermen is an important limiting factorin Japan's production.
In Oceania production increased only slightly; general improvements continuein craft, gear, the training of fishermen, and methods of handling and utilizing thecatch. The canning industry, developed during the war years, is experiencing difficultyin obtaining sufficient and regular supplies of suitable high-quality raw materials.Great interest is shown in the possibilities of pelagic fishing in these waters, mainlyfor tuna, to supply the needs of the canning industry.
107

The Union of South Africa (including the territory of Southwest Africa) and thePortuguese colony of Angola are practically the only African countries south of theSahara with commercially important fisheries. In South Africa the trawler fleet wasaugmented by the acquisition of trawlers from Europe, including larger-sized trawlersfrom United Kingdom yards. In 1948 the fleet consisted of 38 steam and motortrawlers, as compared with about 25 vessels prewar. Trawl-caught landings in 1948were double the prewar peak of approximately 18,000 metric tons. The productionof pelagic species from the west coast of southern Africa continued to expand rapidly(60,000 tons compared with 10,000 to 15,000 tons prewar) to supply raw materials(pilchards in particular) for the newly established canning, fish-oil, and meal-reduc-
TABLE 61.-ANTARCTIC WHALING, SELECTED PERIODS, 1934/35 TO 1948/49
Period Factoryships
lIncludes blue, fin, humpback, sei, sperm, and other whales.'Includes both whale and sperm oil.'Preliminary figures.
TABLE 62.-PH0DUCTI0N OF FISHERIES END PRODUCTS IN CERTAIN COUNTRIES, 1934-38, 1946, 1947,AND 1948
Shore I Catchingstations I boats
Number
1Belgium, Canada, Denmark, Finland France, Germany, Iceland, Ireland, Netherlands, Newfound-land, Norway, Sweden, United Kingdom, and other countries.
2Beigium, Canada, Denmark, Iceland, Netherlands, Newfoundland, Norway, Swgden, and UnitedStates of America.
'Dried basis: Canada, Faroe Islands, France, Greenland, Iceland, Newfoundland, Norway, St. Pierreand Miquelon, Portugal, Spain, Italy, United Kingdom, and U.S.A.
dCanada, Iceland, Netherlands, Newfoundland, Norway, Portugal, Sweden, United Kingdom, andother countries.
6Norway and Iceland. Figures for Iceland are based on exports; those for Norway on production,1946-48.
"Algeria, Canada, Denmark, France, French Tviorocco, Italy, Norway, Portugal, Spain, United King-dom, and U.S.A. (including Alaska).1Canada and U.S.A. (including Alaska).°U.S.A. only.'1935-39 average, except for Japan, where 1937 is used."Canada, Iceland, Japan, Newfoundland, Norway, and U.S.A. (intluding Alaska).111935-39 average, except for Japan, where 1934-88 average estimate is use,d."All whaling grounds.
108
Whalescaught'
Oilproduction'
(Metric tons)
4em 1934-38 1946 1947 19481948 as
percentageof 1934-38
Metric tons (Percent)
Fresh and frozen herring and relatedspecies, exports' 199,100 106,900 153,200 217,400 109
Fresh and frozen fish (excluding her-ring) exports' 141,500 291,400 306,000 373,000 264
Salted cod and related species, produc-tion' 239,600 194,900 253,100 203,800 85
Salted herring and related species, ex-ports' 314,100 259,400 240,500 288,100 92
Stockfish' 25,300 13,200 15,000 8,500 34Canned herring and related species'__ 182,000 237,700 229,500 220,100 121Canned salmon' 202,300 130,700 156,500 133,300 66Canned tuna' 23,900 42,000 51,600 61,700 258Herring meaP 729,300 215,700 204,400 296,000 41Herring oil" ---------- - 11220,700 102,500 100,800 130,400 59Whale and sperm oil' 508.300 160.600 369,800 397,600 78
Average 1934/35-1938/39 . 28 2 212 36.355 464,3001945/46 9 3 93 13,387 138,6001946/47 15 3 147 25,593 328.5001947/48 17 3 183 31,318 356,3001948/49 18 3 211 31,123 373,500
tion plants on the Union's Atlantic seaboard. In the non-self-governing African terri-tories of the United Kingdom, France, and Belgium, fisheries research stations arebeing established and experimental fishing craft are being introduced. A trawlerordered in the United Kingdom for Gambia was expected to start operations aboutthe middle of this year. Southern Rhodesia, which has no access to marine fisheries,is giving attention to fish farming. Various colonial authorities are investigating thepossibilities of productive fisheries in the rivers and lakes of East and EquatorialAfrica.
WHALING
During the 1948/49 whaling season 1 floating factory and 28 catching boats wereadded to the Antarctic whaling fleet. The catch totaled 17,200 blue-whale units, ofwhich 15,900 were processed by floating factories. The lower production of whaleoil as compared with prewar years (see Table 61) is due to the international agree-ment limiting the pelagic catching of baleen whales to ocean areas south of 40 degreessouth latitude. In 1949, threre was an increase of 17,000 metric tons over 1948 in theoutput of oil, explained by a higher yield of oil per blue-whale unit and also by alarger catch of sperm whales, which are not at presented protected by internationalagreement.'
The total number of floating factories is much smaller than before the war, butthe size and efficiency of each unit is greater. Floating factories have increased insize until they now average 14,134 gross tons (compared with 12,669 gross tons in1934-39). There are 10.6 catching boqts per floating factory (1934-39: 7.1), and thecatching boats average 398 gross tons (1934-39: 281) and 1,553 horsepower (1934-39: 1,043).
As the number of whales which can be taken in pelagic whaling is limited, thecapacity of the whaling fleet is not likely to increase substantially. Declining pricesfor whaling products also tend to discourage further investment. The recent decisionto open the whaling season on 22 December instead of 15 December and to carry onone week longer in April is expected to increase the oil output per blue-whale unitsomewhat because the whales are fatter toward the end of the season.
Owing to the limitations on catching by factory ships, shore stations may be ex-pected to increase their activities, since there is no limitation on the number of whaleseach station can take within the six consecutive months they are allowed to operate.Their contribution to the oil supply is likely to expand.
CHANGES IN OUTPUT OF END PRODUCTSTable 62 gives data on prewar and postwar production of various fish products.
Production of fresh and frozen herring increased substantially in 1948, owing tofavorable weather conditions in the winter season; and production of fresh and frozenfish other than herring, which in 1947 had already more than doubled the prewarlevel, was greater by some 67,000 metric tons in 1948. The expansion was widely
'In calculating the total production of whale and sperm oil, it was assumed that the productionat shore stations outside the Antarctic was the same in 1948 as in 1947. If there was an increase,which is likely, the total production may have exceeded 400,000 tons.
109

distributed among countries, but most marked in the United States. Production ofsalted cod and related species declined, a result of reduced landings of these speciesin Europe and the continued expansion in fresh and frozen products. These factorsalso explain the decline in stockfish production. Production of canned herring andrelated species remained high in 194.8, largely because of the high level of productionin North America.
The low level of herring meal and oil production results mainly from the greatdrop in Japanese output, which has hardly begun to recover. Other countries, andNorway in particular, are producing much more than before the war. In the Union ofSouth Africa, for example, the production of fish oils is being expanded, and vitamin-oil production has become an important industry. Production of fish meal is alsoexpanding in South Africa; the 1948 output, estimated at 15,000 tons, is sufficient tomeet the domestic demand for meal as animal feed.
INTERNATIONAL TRADETable 63 indicates the export trend in six countries which account for 40 to 50
percent of the total foreign trade in fisheries products. In all countries which havemade information available except the United States, fresh and frozen products repre-
TABLE 63.-Ex Powrs OF FISHERIES PRODUCTS, 1938, 1946, 1947, AND 19481
Country
Canada
Denmark
YearSalted,dried, orsmoked
Canned
Crusta-ceansand
mollusks
Otheredible
aquaticproducts
Fishoil
Fishmeal
and fer-tilizer
Metric tons
163,400 49,900 42,400 28,400 9,000 - 14.200 19,500236,900 106,600 49,000 67,800 11,500 0 2,000 0216,000 92,200 44.000 69,100 9,800 0 900 -223,100 96,400 49,200 39,900 11,300 0 4,600 21,700
56,600 249,900 4,500 400 2 _ 1,800 _95,800 282,300 12,700 300 2 - 500 -99,100 81,800 15,400 1,500 0 - 400 0
103,100 79,900 16,900 2,600 2,500 - 1,200 -147.900 17,400 80,200 0 100 27,900 22,300167,700 96,700 28,800 500 (- 25,300 16,400165,700 87,600 35.300 300 (-) 25,900 16.600257,200 151,800 28,400 1,000 (-) 36,400 39,600
195,500 20,700 76,700 600 46,100 - '50,000 90046,200 6,400 14,900 1,400 23,400 0 100
123,200 12,800 48,800 6,500 46,600 7,200 1,300119,300 13,400 48,900 5.300 44,100 5,200 2,400
377,500 120,100 115,700 25,400 3,400 32,400 80,500323,500 80,800 185,400 25,900 1,400 19,700 10.300377,700 136,000 172.300 31,400 4,200 25,400 8,400435,000 182,800 174,200 31,600 3,800 29,000 13,600
56,000 3,600 1,700 44,000 6,400 1,400 1,200 1,300100,000 700 5,500 72,500 13,100 1,500 6,600 100105,600 1,000 1,700 82,000 9,400 1,900 9,100 50054,100 1,400 900 34,300 7,900 700 8,800 100
996,900 261,600 321,200 95,200 65,000 1,400 128,000 124,500970,100 373,500 296,300 168,400 49,400 1,500 54,100 26,900
1.087,300 411,400 317,500 190,800 70,000 1,900 68,900 26,8001191.800 525.700 318,500 114,700 69,600 700 85,200 77,400
-Indicates nil.0Indicates negligible.1Some miscellaneous products are not included.2Crustaceans and mollusks included with salted, dried, or smoked.Wight include some whale oil.
110
FreshTotal and
frozen
Iceland
Netherlands
Norway
United Statesof America
TOTAL FORTHESECOUNTRIES
1938194619471948
1938194619471948
1938194619471948
1938194619471948
1938194619471948
19381946194719481938194619471948

sent a higher proportion of total fish exports than in the prewar period. Icelandincreased its export of fresh and frozen products from 17,000 tons in 1938 to 88,000tons in 1947 and 152,000 tons in 1948, while its exports of salted, dried, and smokedproducts declined from 80,000 tons in 1938 to 28,000 tons in 1948. In 1947 and1948, the United Kingdom imported some 217,000 tons of fresh and frozen fisheriesproducts, compared with 83,000 tons in 1938. Countries exporting fresh fish, however,fear a decline in their markets because of more fishing activity in the larger con-suming countries. A decline in the United Kingdom's imports from 85,000 tons inJanuary-March 1948 to 65,000 tons during the same period in 1949 may or may notindicate a development in that direction. It is clear, however, that Germany is still farfrom adequately supplied, and its imports of fresh and frozen products increased con-siderably during 1949; in January-March 1949, 126,000 tons were imported, com-pared with 77,000 tons during the same period in 1948.
Available data on eight exporting countries in the Northern Hemisphere revealthat the relative importance of markets has changed considerably since the prewarperiod. Measured in value, some 54 percent of Canada's exports of fisheries productsin 1947 went to the United States, compared with 46 percent in 1938. During thesame period Newfoundland's exports to Canada and the United States increased from18 percent to 42 percent of the total value. This situation is partly due to a marketingpattern established during the war years and partly to the desire to expand the produc-tion of frozen products for the dollar markets. Canada has turned from its traditionalsterling markets to the United States. In 1938 the sterling markets absorbed 41 per-cent of total Canadian exports of fish; in 1948 they took only 10 percent.
In Europe, the large exporters are trading more with the U.S.S.R. than in theprewar years. Iceland, Nvhich made no shipments to the U.S.S.R. in 1938, marketed20.5 percent of its exports there in 1947 (but much less in 1948). For the Nether-lands, shipments to the U.S.S.R. in 1938 amounted to only 1.4 percent of the exportvalue; in 1947, to 10.6 percent. The corresponding figures for Norway are 0.3 percentin 1938 and 5.5 percent in 1947. The United Kingdom, however, which sent 8 percentof its fish exports to the U.S.S.R. in 1938, has imported fisheries products such ascanned salmon and crab meat from that country since the war.
TRENDS IN PRICES AND MARKETINGCONDITIONS
Fish prices in the United States during the first months of 1949 declined morerapidly than would be explained by the normal downward trend at this season,dropping about 15 percent below the prices for the corresponding months in 1948.Canadian wholesale fish prices declined only slightly and rallied again from Aprilonwards. As regards canned salmon, the reduced size of the pack in the United Statesand Canada has helped to maintain prices in the face of declining European importsand may have strengthened the market for canned tuna.
Fish-oil prices declined in both the United States and Canada. From a level of15 U.S. cents per pound for crude sardine oil (Pacific Coast) in the last part of 1948,they fell in 1949 to as low as 6 cents, but subsequently rose again. Marine-oil prices inEurope have also shown some decrease.
Little information on fish prices in Europe is available, since a large proportionof the fish is sold under trade agreements. The trends have been conflicting. Forward
111

sales of salted herring caught off Iceland during the 1949 summer season have beennegotiated at prices below those of 1948. Similarly, export prices of iced cod andrelated species from Iceland and Norway in May 1949 were 4 to 5 percent belowthe level of May 1948. However, because cod landings fell off in 1948/49 and becausea higher proportion of the catch was marketed in fresh and frozen form, prices in thesalted cod market remained firm. On the whole, prices have declined for thecheaper qualities of fish and have remained high for halibut, lobster, and other moreexpensive products. This reflects the general improvement in European food supplies,which enables consumers to exercise greater discrimination in the kinds of fish theypurchase.
The plans reported from many countries for increasing the catching capacity oftheir fishing fleets are likely to result in larger landings in the near future, with con-sequent effects on prices. Perhaps the severest competition will be felt in the UnitedStates market, in which several fish-exporting countries reckon upon earning much-needed dollars. Should fish prices drop to any considerable extent, difficult situationsmay develop for those countries which have rehabilitated their fishing fleets duringthe recent years of inflated prices.
As yet such developments have not occurred, and profits to producers continuerelatively favorable. The 1949 annual report from Norway to FAO states that "thefishermen are one of the population groups which have increased their earnings mostduring the last ten years. From a standard of living which was dangerously low in theinterwar period, the boom has improved the income of fishermen to such an extentthat, in some cases, they are on a level with industrial workers."
112

D. Forest Products
THE CHIEF PROBLEM affecting supplies of forest products lies today in the field ofinternational trade and is intimately tied up with maladjustments of internationalexchange. A shrinkage in the flow of dollars abroad due to general cuts in UnitedStates imports has caused other countries, notably the United Kingdom, to scale downtheir lumber imports from Canada and the United States and to seek supplies outsidethe dollar area. Production in softer currency countries capable of producing exportsurpluses has thus been stimulated, while stocks have tended to accumulate in NorthAmerica. At the same time there has been a virtual cessation of United States pur-chases of wood pulp from Sweden, Finland, and Norway, which have depended he,avilyon pulp exports to balance their dollar trade. These countries produce over 60 percentof exportable world supplies of pulp, and the closure of American markets couldresult in a shift, temporary or permanent, to alternate markets.
World output of roundwood in 1949 is expected to be slightly below the 1948estimate of 1,430 million cubic meters,' declines in North America and the Far East2probably more than offsetting gains in the Soviet Union, Europe, and the dependentterritories of European nations, plus minor increases in Australia and New Zealand.
The features of the 1949 situation will probably be as follows: World lumber pro-duction will fall somewhat below the 1948 level, since the North American reductionwill exceed increases elsewhere. A relatively large reduction will occur in pulpwoodoutput, because stocks at pulp mills are high. Some of this timber will be diverted tothe production of pitprops, which will be slightly over the 1948 level. The output ofother products such as poles, sleepers (ties), and hardwood specialties will be atapproximately the 1948 level. Total output of veneers and plywood inay be somewhatLarger than in 1948, but the total for wood pulp will drop below 1948, although somenew mills will have come into production.
Domestic stocks of primary forest products in North America, normally repre-senting three to nine months' production, are sufficiently large in relation to likelyinternal consumption levels to meet any deficit in production through the rest of 1949and 1950. The change from a seller's to a buyer's market has caused relatively slightdeclines in internal prices. But the accumulated stocks may induce a selling drive thatwould result in a further fall in prices. This in turn could stiinulate constructionactivities and paper consumption.
The over-all decline in forest output, if these forecasts are accurate, is likely to bemoderate. It will be a decline in countries that could readily raise production in
1See FAO's Y earbook of Forest Products Statistics, 1949 (in press).2The decline in the Far East reflects disturbed political and social conditions.
113

keeping with an expansion in economic activity, and although there may be littlechange through 1950, reports of member governments to FAO show expectations ofa recovery in output in 1951.
At this stage there will be a new force to reckon withthe re-emergence of bothGermany and Japan as importing countries of major significance (and as exporters ofmanufactured products). Import requirements of Bizone Germany for 1950/51, asreported to FAO, are as follows:
Thousand cubic meters
Sawn softNvoods 366.1(Around 80,000 standards)Sawn hardwoods 58.8Pitprops 720.0Pulpwood 810.0Veneer/plywood 3.8Poles and piling 30.3Other industrial wood 2.4
TOTAL about 2,000
Japanese requirements for 1950 are reported to be in the order of 240,000 cubic metersof saw and veneer logs, but only about 5,000 standards of lumber. Before the warJapan imported about 300,000 standards of lumber annually. But it also drew onKorea and Manchuria for supplies, which were not classified as imports.
Looking much further ahead, if wood consumption levels of the underdevelopedcountries were to approach the levels current, for example, in Switzerland or NewZealand, it would be necessary to double the present volume of world wood output.3The forests of the world, given reasonably good forest management, could progres-sively supply yields of this order. In fact, Canada, already the world's largest exporterof forest products, could more than double its present output.4
The declared policy of most governments today is to bring about the maximumuse of forest resources, and not to let them lie idle and unused. This is the objectiveof the United States of America, the Soviet Union, the British Cominonwealth, andBrazil, which in the aggregate hold responsibility for more than 85 percent of theworld's productive forest area. But there is no evidence that the desired balance be-tween consumer needs and production will come about of itself; the nations mustcontinue to bring about an expanding world supply of diverse forest products for agrowing world population.
TABLE 64.INDICES OF LUMBER PRICES, 1996-49
Item
U.S.A. (domestic)1U.K. (imports)2Canada (exports)'
lAll lumber."Sawn sof twood.'Average, Jan.-May.
3Progress in the underdeveloped countries is tied closely to industrialization. No country hasever attained success as an industrial nation without an ample, economical, and dependable supplyof fuel. Many of the underdeveloped countries depend in large measure on wood for energy pro-duction. Wood is not an efficient fuel and in many areas must be brought from increasingly greaterdistances each year. It is evident that steps must be taken to develop alternative sources of energy.
4See Proceedings of the Third TVorld Forestry Congress, No. 2, "Forest Resources and HumanNeeds for Wood."
19'16 I 1947 I 1948 I 1949 Mav
1938=100204 318 356 326318 905 411 3397316 366 377
114

SAWN LUMBER
During most of 1948 world output of softwood and hardwood lumber continuedto show the upward trend characteristic of the postwar years. Production has in-creased from some 30.8 million standards in 1946 to around 39.4 million standards in1947 and 41.3 million standards in 1948, a level above the prewar average. Roughly75 percent of the world lumber output is represented by softwoods.
In Europe, during the latter part of 1948, the lumber markets were comparativelyeasy except for imports from hard-currency areas. Developments during the first halfof 1949 indicate that supplies, at least of the higher grades, are again short. Evidencefor this statement is the exceptional early close of export sales. By 1 July the Scandi-navian countries had contracted for 90 percent of their proposed exports. Strongefforts have also been made by importers to conclude contracts with the U.S.S.R.
In North America, available supplies of both softwood and hardwood lumberappear to have exceeded effective demand in 1948 and the first half of 1949, a situationattributed mainly to the recession in economic activity.
On the whole, effective demand has been influenced in international trade bycurrency difficulties, and in dome,stic business by a general reluctance to buy in antici-pation of a decline of prices. The downward price .trend in the lumber industry hasbeen considerably smaller than in the wood pulp and paper industries, and has so farresulted in a weakening of prices for lower grades only.
The following percentages, based on figures reported to FAO, indicate anticipatedlevels of lumber production for 1950 in countries covering about 80 percent of worldoutput:
EUROPE
Output of softwood lumber in Europe (excluding the U.S.S.R.) in 1948 was about33.9 million M3(S) 5 or 7.25 million standards, an increase of around 5 percent overthe previous year. Output of sawn hardwood totaled 8 million m3(s), an increase ofalmost 10 percent.
At the beginning of 1948, urgent postwar needs for timber having already beenmet, the effective import demand for softwood lumber (including sawnwood equivalentof sawlogs) of the main deficit countries in Europe was set at 2.1 million standards, inthe light of shortages of appropriate foreign currencies and other financial considera-tions. "Essential needs," defined by countries participating in the work of the TimberCommittee of the Economic Commission for Europe as potential requirements, wereestimated at a much higher figure-3.6 million standards.
By the end of the year Europe's gross softwood imports totaled 2 3 million stand-ards, of which 1.8 million came from within Europe and 0.4 million (as comparedwith 0.8 million in 1947) from Canada and the United States. Thus the wide gap
51713 (s) = cubic meters (sawn) , as distinguished from m3 (r) cubic meters (round) .
115
Production in 1950as percentage of 1948
Europe 103U.S.S.R. 180U.S.A. and Canada 94Australia and New Zealand 109Japan 85
WEIGHTED AVERAGE 112

between supply and demand in the European timber situation, which seemed evidentfrom the end of the war, changed into a temporary equilibrium in 1948. Because ofthe general easiness, the ECE Timber Committee recommended that no "buyinglimits" be set up for the importing countries in 1949.
But this equilibrium is an unstable one. Essential needs have not yet been met. Inmany countries, such as Belgium, the Netherlands, France, Italy, and Greece, buildingactivity in early 1949 suffered a definite setback or came almost to a standstill. AllEuropean governments have still to cope with serious housing shortages.
Moreover, there is a major change in respect to Germany. Cessation of Germanexports of lumber and sawlogs after 1949 will decrease European export supplies byperhaps half a million standards, and Germany's urgent import demands for 1949have already been estimated at well over 200,000 standards. A first step towardsreopening the German markets for timber imports was taken in June 1949, when US$11.25 million was reserved for one year's purchases by western Germany of sawnand planed wood equivalent to some 65,000 standards from Sweden. This has beenfollowed by purchases from Finland and is scheduled to be followed by imports fromAustria (which has already made several attempts to regain a traditional German mar-ket), and perhaps from Czechoslovakia.
The supply situation may imProve as a result of the special credit arrangementsnow being negotiated for purchases of forestry equipment by certain countries againstcommitments to increase timber production and exports. These negotiations are beingconducted, on the one hand, by the International Bank for Reconstruction and De-velopment in close consultation with the secretariats of FAO and ECE, and on theother hand, by a number of European timber exporting and importing countries.
The latest estimates of production and exports within the continent during 1949and 1950 promise a definite improvement in Europe's timber balance. Productionmay increase by half a million standards in 1949 and by another half million or morein 1950. A slight increase could occur in the Scandinavian and Finnish export ship-ments. The Swedish housing program provides for a progressive reduction of timberin the construction of dwellings from the present rate of about 5.8 standards per dwell-ing unit to 4.8 standards in 1951, and is thus expected to release additional quantitiesof timber for export. Additional lumber may be available from Finland as a resultof a shift from pulp to lumber production.
In view, also, of a probable increase in exports from the U.S.S.R. and possibleexports from Brazil, any gap between supply and demand in Europe would be ofsuch dimensions as could be filled by exports from North America. But this is
where the main problem lies.The United Kingdom, where the gap between supplies and potential demand is
greatest and where the current rate of softwood consumption is down to about 45percent of the 1934-38 average, was forced in mid-1949 to cut purchases from thedollar area by one-quarter. This new austerity program, therefore, seems to rule outgreater North American supplies unless special arrangements are made. It does mean,however, that market prospects for European export lumber remain good.
The United Kingdom price lists for Swedish and Finnish goods, agreed upon inApril 1949, confirmed the trend toward restoring the spread between prices for high-grade and lower-grade lumber. On the average, prices went down some 4 to 5 percentfrom the 1948 level, the drop of some lower-grade prices being 7 to 15 percent. Asusual, United Kingdom prices have also influenced prices on other timber markets.
116

The relatively slight price decline on the lumber market has been strongly felt bythe sawmill industries of several countries, where any further downward trend inexport prices would reduce forest-workers' wages.
U. S. S. R.
During the period 1935-38 the U.S.S.R. exported an annual average of 1.1 millionstandards of softwood lumber. Since the war, exports have been almost negligible,Soviet supplies of sawn softwood to European markets in 1948 being only about56,000 standards. The position of the Soviet Union is, of course, dependent on thehuge reconstruction and housing need with which the Government has still to cope.According to Soviet estimates,° the country's losses in output capacity (in terms ofcurrent output) during the last war corresponded to 64 million cubic meters of felledtimber, or 27 percent of the total capacity in 1940. On the same basis of calculation,the losses in sawmill capacity amounted to 2.57 million standards, equaling 34 percentof the 1940 capacity.
The current five-year plan provided for a production of about 4.6 million stand-ards of sawn lumber in 1948, and, according to official statistics, this target wasexceeded. Production is scheduled to attain 8.3 million standards by 1950, or 109percent of the 1940 output.
Domestic supplies of sawn lumber have been supplemented by considerable quan-tities imported from Finland, and probably by other quantities drawn from theSoviet Zone of Germany and elsewhere. Since 1945, up to 30 June 1948, when warreparations deliveries of timber were stopped, Finland had shipped 350,000 standardsof sawn softwood and 1.22 million cubic meters of roundwood to the U.S.S.R. asreparation and restitution deliveries. In addition, Finnish exports under normaltrade agreements with the U.S.S.R. included nearly 52,000 standards of sawn soft-woods in 1947 and over 72,000 standards in 1948.
The re-equipment of the Russian sawmill industry has advanced favorably, andreorganization of transport has made possible the exploitation of forests previouslyinaccessible. A large proportion of domestic lumber needs has apparently been met,and the increasing lumber production has reportedly allowed the building of sub-stantial reserves. Although the resumption of exports on the prewar scale will prob-ably occur only gradually, there is always the possibility that the Soviet Union mightin the near future increase its exports very considerably.
UNITED STATES AND CANADA
Combined output of softwood and hardwood lumber in the United States in1948 reached 18.2 million standards, compared with 17.9 million standards in 1947.Out of this total, softwood contributed 14.30 million standards, according to indus-try estimates, as against 14.11 million standards in 1947.
The value of all new construction, both public and private, in the United Stateswill reach a record total of $19,000 million in 1949, according to estimates by theU.S. Departments of Labor and Commerce. Nevertheless, it is expected that domesticrequirements in 1949 for softwood and hardwood lumber for construction purposes-11.78 million standardswill be 3.5 percent lower than in 1948. An explanation is
°Quoted in "The Soviet Union since World War II." Annals of the American Academy ofPolitical and Social Science, May 1949.
117

that private construction is expected to drop 5 percent from the 1948 level, whilepublic construction, which consumes relatively less timber, will increase more than 22percent.
United States lumber exports have also declined, the drop amounting to morethan 50 percent between 1947 and 1948. During the first half of 1949, exports ofcombined softwood and hardwood lumber were 15 percent below the rate for the cor-responding period of 1948; shipments to the United Kingdom, Argentina, China, andthe Union of South Africa declined considerably, but those to some destinations in-creased.
Diminished demand has resulted in a slight decline in production of lumber andlumber products, from 145 percent of prewar in 1948 to 127 percent in the first halfof 1949.
As of 9 July 1949, stocks in mills in the main producing centers of the Southand of the west coast of the United States were more than 35 percent higher than ayear before. At the same time, unfilled orders on these mills were about 32 percentlower than a year earlier.
Domestic lumber prices in the United States have fallen somewhat, but mostprices for higher grades have remained firm. According to official forecasts, domesticconsumption in 1950-51 will attain only about 17.3 million standards, productionbeing about 16.9 million and net imports about 900,000 standards.
Canada's production of softwood and hardwood lumber in 1948 declined by about14 percent from the previous year, and for the whole of 1949 is expected to be about2 to 3 percent below 1948.
The Canadian sawmill industry is dependent on export trade to the extent of 40to 50 percent of its total output, the United States being its principal market. Between1947 and 1948 Canada's lumber exports dropped nearly 10 percent from the 1947levels to about 1.2 million standards, 98 percent of which was softwood lumber. Ex-ports to the United States increased from 548,000 standards in 1947 to 824,000 stand-ards in 1948, offsetting to a considerable extent the serious drop in shipments to allother destinations. The United Kingdom, second only to the United States as a buyerof Canadian lumber, took only 286,000 standards, compared with 574,000 standardsin 1947. During the first quarter of 1948, Canada's lumber exports further declined by31 percent below the corresponding period of 1948.
Domestic prices for softwood lumber in Canada remained firm throughout 1948,but export prices, particularly to the United States, declined slightly during the lastquarter of the year. Though domestic and export prices for hardwood remained firm,there was some reluctance to accept lower grades. During the first half of 1949, therewas a slight drop in prices for lower grades of lumber. In Canada, as well as in theUnited States, a number of sawmills discontinued operations.
Were it not for payments difficulties, shipments from the United States andCanada could contribute greatly to Europe's reconstruction needs. According to offi-cial estimates, the minimum quantities available for export from the United Statesin 1950 total about 500,000 standards, and those from Canada 800,000 standardsafter allowing for shipments to the United States at about the 1948 level. There isstrong pressure in both countries to activate exports to Europe. Canada is makingfull use of the efficient service it operates for marketing its forest products abroad,with active representation by both the Federal Government and private businessassociations, backed by established grading rules.
118

FAR EAST AND OCEANIA
Japan is today, as in the prewar years, one of the world's largest producers ofsoftwood lumber, but the present rate of production, 2.03 million standards in 1948,is at the expense of limited forest resources which are being seriously overcut. Inthe prewar period, Japan imported 300,000 standards of lumber yearly, mostly ofsoftwoods, but also drew on adjacent countries for supplies which were not consideredas imports. These supplies are no longer available, and since a reduction in forestoutput is planned, import requirements are likely to rise considerably.
In Australia the production of sawn timber in 1948 reached a record of almost1 million standards, and is expected to rise still further in 1950 and 1951. New Zea-land expects to be in a position to export some 70,000 standards by 1955 withoutin any way depleting its forest resources. Since it is not a hard-currency area, itshould be able in a few years to meet some of Asia's demand for softwood lumber.
The Forestry and Timber Utilization Conference for Asia and the Pacific, heldunder the auspices of FAO at Mysore, India, in the spring of 1949, called attention tomeans for overcoming the prevailing shortage of forest products in the region byincreasing the now absolutely inadequate output of lumber. The development offorest output and trade within the region will be fostered through a projected RegionalForestry and Forest Products Commission.
LATIN AMERICA
Latin America, with a lumber production of roughly 7.2 million m3(s), or 1.5million standards in 1948, has a relatively low consumption rate. On balance, theregion is a lumber-importing area. The only exporting countries of major importanceat present are Brazil, Chile, and Mexico.
Brazilian production of softwood lumber was 376,000 standards in 1948, ofwhich 170,000 standards were exported, 90 percent going to South American desti-nations. Intraregional and overseas lumber trade slackened toward the end of 1948and at the beginning of 1949, owing to financial difficulties in Argentina (the mostimportant buyer of South American lumber) and shortages of foreign currencies onthe European markets. If Brazil could develop a sawmill industry capable of pro-ducing high export quality lumber, production could be stepped up with great advan-tage. Increasing attention will be paid in the future to the development of the greathardwood forest resources, especially of the Amazon Valley.
AFRICA
The Union of South Africa in 1946 imported almost twice as much softwood lum-ber as it produced-120,000 standards. Imports from the dollar area have since beenseverely restricted to reduce the drain on exchange, and tight controls have also beenimposed on imports from other areas. In French, Belgian, and some British territoriesin Africa, output of hardwood lumber or squared logs is rising, considerable quan-tities being exported to Europe and the United States.
PLYWOODManufacture of plywood, which just before the war was estimated to have at-
tained a yearly volume of 2 million m3, has rapidly recovered and expanded duringthe past few years. By 1948 it was estimated at some 3.2 million m3. The bulk of
119

production is still concentrated in the United States, Canada, Finland, and Japan. Thefirst two countries accounted for nearly two-thirds of the 1948 world total.
Finland, with a production of 210,000 m3 in 1948, has come very close to theprewar level; output will be increased in 1949. The United Kingdom, Italy, theNetherlands, and Czechoslovakia have surpassed, and France has reached, the prewarfigures of production. Some countries, such as Switzerland, have established newplywood industries, using their own wood. But large-scale plywood industries in mostof the Western European countries depend mainly on imported supplies of rawmaterial.
The plywood industry in North America has expanded greatly during the lastdecade.7 Since the end of the war the Douglas fir plywood industry in the UnitedStates has achieved a 70 percent increase in production. However, it is improbablethat the 1,738,000 m3 outturn of the United States softwood plywood industry in 1948will be exceeded during 1949. Similarly, it is officially estimated that Canada's ply-wood production will be somewhat less in 1949 than in 1948, when it was 293,500 m3,although several new companies will have come into operation; through 1950 and1951 the output of the Canadian plywood industry is expected to average 266.000 m3.
Output of the Japanese plywood industry since the war has been limited by thelack of logs; in 1948 it reached only 200,000 m3, less than one-third of the 1940peak production. If increased imports of logs are obtained, production during 1950is expected to approximate 250,000 m3, of which 26 percent will be designated forexport.
No precise data are available on current plywood production in the U.S.S.R.;however, veneer output in 1948 was nearly 35 percent greater than in 1947, and isplanned to reach a volume of 810,000 m3 in 1950.
Brazil greatly expanded its plywood manufacture during the war, the develop-ment being encouraged by the U.S.A., anxious to develop additional supplies of thisstrategic commodity. Production reached over 70,000 m3 in 1946, but capacity hassince had to lie idle because the United States market has disappeared and Brazilhas not yet developed other export markets. The war also encouraged efforts in someFrench, British, and Belgian territories in Africa toward establishing hardwoodveneer and plywood export industries, which are now yielding good results. Thereappears to be an important trend in all countries with suitable forest resources towarddomestic manufacture of plywood and a reduction in export of veneer logs.
Plywood consumption in Europe is still at less than one-half of the prewar level,since restricted purchasing power has limited effective demand. The United Kingdom,followed by the Netherlands, Belgium, and Denmark, has been the main importer.Plywood exports have not yet reached the prewar level, as the U.S.S.R. (with theformer Baltic countries) and Poland have been off the market. Now that reparationand restitution deliveries to the U.S.S.R. have been fulfilled, Finland, the largestplywood exporter, should be able to increase its plywood exports to 210,000 m3 in1949. United States and Canadian exports have declined. By 1950, competition onplywood markets should be lively, when Poland, Japan, Brazil, and possibly theSoviet Union will have considerable export availabilities.
7Related products, such as sandwich panels with thin, high-strength faces and relatively thick,low-strength cores, light in weight and economical of material, are also rapidly coming into use fora variety of structures, including houses, boats, and aircraft. The commercial production oflaminated wood products also continues to expand as adhesives are improved and gluing techniquesperfected.
120

PITPROPSGenerally speaking, the important mining and pitprop-consuming areas in South
America, the Rhodesias, South Africa, Australia, India, Japan, and the U.S.S.R.produce their own pitwood requirements or obtain them from nearby sources. TheUnited States, the world's largest coal producer, turns out about one-third of theworld's pitprop supplies without taking any considerable part in trade. Canada exportsthe main proportion of its output. Europe is by far the most important region in pit-prop production and international trade, accounting for about one-half of the totalworld output and some two-thirds of the total trade.
Under these circumstances, only the European pitprop requirements present aproblem of international importance. The demand depends on mining activity; fluc-tuations which affect it also affect pitprop production and trade. After the war, thedemand for pitprops in Europe was largely met by calling upon the national forestresources of the countries normally importing pitprops and by considerable shipmentsfrom Canada. The Soviet Union, one of the great suppliers of prewar years, has notyet re-entered the pitwood market. Poland, after acquisition of the Silesian mines, haschanged from an exporting to an importing country, while Germany has been tem-porarily self-sufficient.
With these changes in the supply-demand pattern, European production, supple-mented by imports from Canada, made it possible to cover the requirements of Euro-pean collieries in 1947 and 1948. Production of pitprops in Europe increased by about8 percent from 1947 to 1948, while imports from Canada simultaneously declined bynearly 12 percent. The ECE Timber Committee has found that against an estimatedimport requirement for 1949 of 5.3 million m3, there is an estimated export availabilityof 5.5 million m3, which, having regard to the improved stock position at the begin-ning of the year, indicates that supplies will be fully sufficient.
This satisfactory position for 1949 has been brought about partly by develop-ments in the pulp market. Pulpwood competes keenly with pitwood, and the recentdecline in demand for pulpwood is expected to give impetus to increased output ofpitprops.
Imports of Canadian pitprops by the United Kingdom declined in 1948, andagain during the first five months of 1949. The new dollar-saving program of theUnited Kingdom will presumably result in further cuts through 1949-51.
Plans have been made for a rapid development of pitprop production in Japan.Output reached 2.1 million m3 in 1948; it is scheduled to be 3.7 million IT13 in 1949and 4.0 million m3 in 1951. No provision is made for exports.
RAILWAY SLEEPERS (TIES)According to recent estimates, there are approximately 1.25 million kilometers
of railway track in the world, representing about 3,000 million sleepers (ties), 95percent of which are made of wood. Maintenance requirements are estimated at about5 percent annually, or 15 million m3. As sleepers rarely- appear in national statisticsas a separate item and information is generally scanty, it is not possible to give anyaccurate estimate of world output.
Output in countries reporting to FAO showed an upward trend in 1948, butfigures do not include some of the most important producers, e.g., the United Statesand the Soviet Union. The U.S.S.R. five-year plan provides for an output of 185
121

million sleepers during the period 1946-50. In Europe a deficit in sottwood sleepersis expected to continue, whereas the deficit in hardwood sleepers will graduallydecline and probably disappear by 1951.
Railway sleepers have always been of minor importance in relation to other forestproducts in world trade. In 1937, they accounted for less than 2 percent of all timberexports, and in 1948 the percentage was even smaller. Since World War II, Europeanintraregional trade in sleepers has been resumed only to a limited extent, the previousmajor suppliers, the Soviet Union and Poland, having been off the market until 1949.There are indications, however, of increased exports in the near future from a numberof Eastern European countries.
On the other hand, shipments of sleepers from North America to Europe con-siderably expanded during the early postwar years, the principal countries of destina-tion being the United Kingdom, the Netherlands, and Belgium. However, whileCanada's exports increased from about 222,000 to 281,000 m3, total exports of sleep-ers from the United States declined from almost 466,000 m3 in 1947 to 234,000 m3in 1948.
It was originally estimated that the United States could deliver 8 to 10 millionsleepers out of a requirement of 50 million for the Marshall Plan countries duringthe period up to 1951. The balance was expected to come primarily from Eastern
TABLE 65.WORLD PULP BALANCE'
Sougcm: FAO, Report of the Preparatory Conference on World Pulp Problems, Montreal, 1949.... None, small, or not available.1The forward estimates are based on hypothetical assumptions as to prevailing economic conditions in
various countries of the world.2Baltic republics.313ased on maximum production estimates for the United States.41t is generally expected that North America will continue to show a net import balance. The calcula-
tion on which these surplus figures are based assumes that maximum production will occur, which is notnecessarily true.
122
Region1937 1948 1950 Projection
Consump-tion
I Produc-I tion
Consump-tion
Produc-tion
Require-ments I
I Produc-tion
Thousand nzetric tons
Europe 9,900 11,590 7,000 8,050 9,400 9,600U.S.S.R. (exports) 1145 40 75Near East and N. Africa 15 5 10 15North America 12,030 10,950 19,255 19,010 20,290 820,310Latin America 245 25 470 190 580 315Africa 15 15 15 15Asia 1,186 520 505 715 665Oceania 50 200 160 245 175
WORLD TOTAL 23.765 23,895 27,475 27,980 31,265 31,170
Apparent surplus (+) or deficit )Region 1937 1948 1950
Thousand metric tons
Europe +1,690 +1,050 +200U.S.S.R. + 145 + 40 +75Near East and N. Africa 10 5 5North America 1,080 245 4+ 20Latin America 220 280 265AfricaAsia - 15 50Oceania 50 40 70WORLD TOTAL + 130 + 505 95

Europe but perhaps to some extent from Latin America, notably Chile, Brazil, CostaRica, Nicaragua, the Guianas, and Surinam. Later developments have increasedreliance on these European and other sources.
There is a considerable body of opinion that many countries demand too rigidspecifications, especially for hardwood sleepers, which means great conversion wastageand high costs of production.
WOOD PULP AND PULP PRODUCTSWorld output of all grades of wood pulp (excluding the U.S.S.R.) amounted in
1948 to about 28 million metric tons (see Table 65). Of this quantity, some 5 milliontons, or almost 18 percent, moved in international trade. From the point of view ofindustrial requirements, no shortage of pulp can be said to have prevailed, althoughconsumer needs in pulp products are, in most parts of the world except the UnitedStates and Canada, largely unsatisfied.
The main pulp-producing regions are North America, Nvhich in 1948 accountedfor 68 percent of world output (excluding U.S.S.R.), and Europe, which accountedfor 27 percent of world production. The corresponding figures for 1937 were 46percent and 49 percent.
Production in 1949 does not now seem likely to exceed the 1948 total, as wasenvisaged by the Montreal Pulp Conference. The 1950 projections may also not befulfilled on account of the reduced demand in the United States and Canada in 1949.In these countries, newsprint production showed a 7-percent gain during the first sixmonths of 1949 as compared with the corresponding period of 1948, but chemicalpulp production and purchases by other paper mills declined significantly. It wasclear that mills were buying only sufficient pulp to meet their immediate needs, andtheir pulp inventories at the end of March 1949 showed a drop of 18 percent from thesame date in 1948. The anxiety to reduce inventories seems likely to continue up tothe last quarter of 1949, according to reports; but unless the production of paperproducts begins to slacken, purchases of chemical pulp will have to be resumed earlyin 1950.
International trade in wood pulp consists primarily of exports from Canada, theScandinavian countries, and Finland, plus certain quantities from the United States toLatin America and other destinations. Imports from Sweden and Finland to theUnited States in 1947 amounted to more than one-third of the United States wood-pulpimports, and were important dollar earners. But these imports covered only marginalrequirements. As the United States pulp market became saturated in 194.8, theslackening demand was followed by a downward movement of prices and a sharpreduction, almost to zero, of imports of Scandinavian pulp.
The question arises whether the reduction in prices and imports is temporary orpermanent and whether, when the demand for pulp recovers in the United States, theimports from Northern Europe will be resumed. The reduction in prices will make itharder for these countries, with their comparatively high production costs, to competein the United States market. In the case of Finland, however, the recent devaluationof the markka by 17.7 percent and the release from having to deliver pulp and paperunder reparations to the U.S.S.R. is expected to restore its competitive position.
To the extent that the North European producers feel compelled to givepriority to whatever they can sell for dollars or other non-European currencies, the
123

chances of satisfying other European requirements for pulp are thereby lessened.European requirements are tending to expand more rapidly than production, althougheffective demand for imports is still strongly controlled by governmental restrictionson consumption. If these restrictions were eased, European demand could absorbalmost the entire European production.
The pulp and paper manufacturing capacity of Western Europe is being workedmuch below capacity because of lack of raw materials. The Western European coun-tries, including the United Kingdom, hope to regain their supplies of raw materials inorder to reduce their dependence on imported paper and to expand their exports ofnewsprint and other paper products to underdeveloped countries. At the moment, withfalling prices and a greater availability of raw materials from the Scandinaviancountries, their industries are recovering. This upturn, however, may be of shortduration.
The main difficulty is this question of the raw materials supply.8 On the conti-nent of Europe the forests of many countries have been heavily overcut during thewar and postwar years. Full use of Europe's existing pulp capacity would require anincrease of about 60 percent over the 1947 rate of cuttings. This clearly could not becontemplated, nor could the wood be secured by diverting supplies from other prod-ucts, such as saw timber and pitprops, since demand is high for both of these. Thesituation is made more acute by the lack of pulpwood exports from the U.S.S.R.
The plans of the underdeveloped countries include, in many instances, the estab-lishment of pulp industries in order to make them independent of imports. Since itis most efficient to manufacture pulp products as part of a continuous process withthe production of pulp, there might be a corresponding shift in paper-productioncapacity.
In Latin America and Africa the possibilities for augmenting the ivorld pulpsupply are enormous, providing that social, technical, and economic problems con-nected with the utilization of tropical forests can be solved. The problems of adaptingtropical sPecies to the commercial production of pulp are being explored, and a num-ber of countries are undertaking extended research in that field. Recently France hasconcluded experiments on an industrial scale for the pulping of a considerable numberof African species. Mixtures of as many as 24 such species have been successfullydigested in a commercial plant, and sample lots of good paper have been made fromthe resulting pulp. A pilot plant is under construction on the Ivory Coast to determinethe practical possibilities on a commercial scale.
The use of straw, bagasse, and similar fibers as substitutes for wood for pulpmanufacture has already given and may give in the future excellent results from a
TABLE 66.INDICES OF IMPORTED WOOD PULP PRICES(UNBLEACHED SULPHITE)
Country
United KingdomUnited States
1938 = 100
225 318 411 404 ...190 277 312 292 268
sFor forward estimates of pulpwood supplies see FAO's Report of Preparatory Conference onWorld Pulp Problems, Montreal, 1949.
124
1946 1947 1948 t 1949Marrh June

technical point of view. From the economic point of view their probable usefulnessdepends upon local conditions in each country.
Dissolving PulpAlthough so-called "dissolving wood pulp" accounts for only about 5 percent of
total pulp output, the products manufactured from this commodity are of greatimportance. Tentative estimates of the breakdown of the consumption of dissolvingwood pulp in 1948 in the United States show the following percentages:
Not much change is expected in the immediate future in the demand for dissolvingwood pulp for any field except rayon.
Over the last thirty years, the rayon yarn and staple fiber industry has developedgreatly. World production of rayon and staple fiber increased between 1930 and itspeak year, 1941, from 208,000 tons to over 1.25 million tons. This development wasinterrupted by the war, but in 1948 production reached 1.12 million tons.
It is to be assumed that, as a result of industrial rehabilitation in Germany andJapan, production in Europe and the Far East will revive substantially, although itwill still be small by prewar standards. There is already a large-scale diversion ofsulphite capacity from paper grades to dissolving grades in the Scandinavian coun-tries. In the United States, expansion of the rayon industry is expected to bringsteadily increasing demands for dissolving wood pulp. The United States industry in1948 used 81 percent wood pulp in rayon manufacture as against 19 percent cotton-linter pulp, the corresponding 1938 figures being 75 and 25 percent.
Foreign exchange shortages of major importers of natural fibers are also en-couraging use of dissolving wood pulp for rayon manufacture. World consumptionof rayon is expected to reach 1.4 million tons in 1949 and 1.5 million tons in 1950.So far in 1949, production of dissolving wood pulp, except in the United States, hasnot followed the downward trend that has occurred in paper pulps; there have beenprice drops to make wood-pulp prices more competitive with cotton-linter pulp.
FIBERBOARDSThe manufacture of fiberboards or fiber building boards offers a profitable use
for low-grade portions of the forest crop and conversion "waste." The industry hasexpanded considerably since the war. Production in European countries rose in 1948by about 14 percent as compared with 1947, and in North America by nearly 17percent. Total world production in 1948 is estimated at 2.0 million metric tons ascompared with 1.7 million metric tons in 1947.
This upward trend is expected to continue through 1949. The capacity of theSwedish fiberboard industry, which toward the end of 1948 was estimated at almost100,000 tons of insulating board and 200,000 tons of hardboards yearly, will risefurther in 1949 and 1950 on account of new industrial establishments. For the samereason, the capacity of the Finnish fiberboard industry, estimated at about 75,000tons in 1947, is expected to reach the level of 110,000 tons a year in 1949. The third
125
Percent
Viscose and acetate rayon 65Cellophane 17Nitrocellulose 3Plastics 2Special papers, vulcanized fiber, and miscellaneous 13

largest European fiberboard supplier, Norway, which had an annual capacity of ap-proximately 70,000 tons in 1948, will shortly start production in two new factories.Manufacture in the western zones of Germany has been steadily recovering. In addi-tion, Austria is expected to increase its production to a very great extent. In a numberof other European countries the fiberboard industry has been developed to such adegree that the main part of the requirements can be met from domstic supplies, andadditional countries, for instance Hungary, are planning new plants.
The fiberboard industry in the United States will be expanded so as to reach alarger output in 1950 than the 1.15 million tons produced in 1948. Ac,cording toofficial estimates, production in Canada, which was 143,000 metric tons in 1948, willbe over 163,000 metric tons by 1950 or 1951. Australia, which produced about 11,000metric tons of hardboard in 1947, will probably be able to increase production up to18,000 metric tons in 1949; softboard output is expected to remain at the presentlevel (about 9,000 metric tons). The Union of South Africa and at least two SouthAmerican countries are among the newcomers in fiberboard manufacturing.
Exports by the European producers of fiberboard also expanded during 1948,despite the fact that the change from a seller's to a buyer's market was accentuatedby new domestic production in many countries. The demand for hardboard roseproportionately higher than the demand for insulating board.
TABLE 67.EXPORTS OF THE MAIN FIBERBOARD SUPPLYINGCOUNTRIES
In 1948 exports from the three European countries to the United Kingdom (seeTable 67) were almost doubled, and the total U.K. purchases reached nearly 50,000tons (34,000 tons in 1947). As a result of these large purchases, stocks of fiberboardin the United Kingdom at the beginning of 1949 were unusually high, the softboardstocks corresponding to two years' consumption at present rates. Imports to theNetherlands, the second largest buyer, were more than doubled in 1948 as comparedwith 1947.
The trend toward a geographical spread in the establishment of fiberboard manu-facturing capacity may cause some of the major producing countries to cut down onproduction plans. Exporting countries are already looking for new markets, whichshould be available in some subtropical and tropical regions.
126
Country 19471947 1948
Metric tons
SwedenFinland
75,50016,000
94.30031,800
Norway 4,500 10,300United States 43,000 33,700
__ _________Canada ----------------- 47.000 41.000
Nitrogen
THE WORLD OUTPUT of nitrogenous fertilizers in 1948/49 surpassed the prewar(1936-38) level by more than 45 percent. The biggest gain over 1947/48 was inEurope, which on the whole has recovered its prewar level of production, althoughGermany's output is still low. Production in the United States remains very high.Japan has made a complete recovery, but no information is available for North Korea,which was an important prewar producer, For the 1949/50 season, Europe plans toincrease its output still further to 1 9 million metric tons of nitrogen.
The United States and Canada, where a tremendous expansion in nitrogen pro-duction for ordnance purposes took place during the war, are now turning out chieflyammonium nitrate, anhydrous ammonia, and nitrogen solutions for agricultural pur-poses. These newer types of fertilizer material have risen in the past ten years from7 to 25 percent of the total supplies. The output of the older types, such as sulphateof ammonia, calcium nitrate, and nitrate of soda, has increased much less, whilecyanamide output has not increased at all.
Postwar demand for nitrogenous fertilizer has been heavy. Import requirementshave been particularly pressing in Europe and Japan, because of the war damage tofertilizer plants and the need for increased food production. Sulphate of ammonia,the most popular nitrogenous fertilizer in Europe and the Far East, was the mostsought after and the most scarce. Dollar shortage added to the difficulties of obtainingsupplies from the Western Hemisphere, which alone had export surpluses. The Fer-tilizer Committee of I.E.F.C. kept nitrogen under international allocation until June1949.
Consumption is nearly four times greater than prewar in the United Kingdomand Austria, and nearly three times greater in the United States and Norway. InIndia, also, although total consumption is still quite small, it is nearly three times aslarge as prewar. In the rest of the Far East, however, except in Japan, supplies arestill below the prewar level. United States, Canadian, and Chilean exports are madeagainst dollars, except for the U.S. shipment to Japan and South Korea of 250,000tons of nitrogen supplied by Army Ordnance, which is not a commercial transaction.
K. Agricultural Requisites
1, FERTILIZERS
127
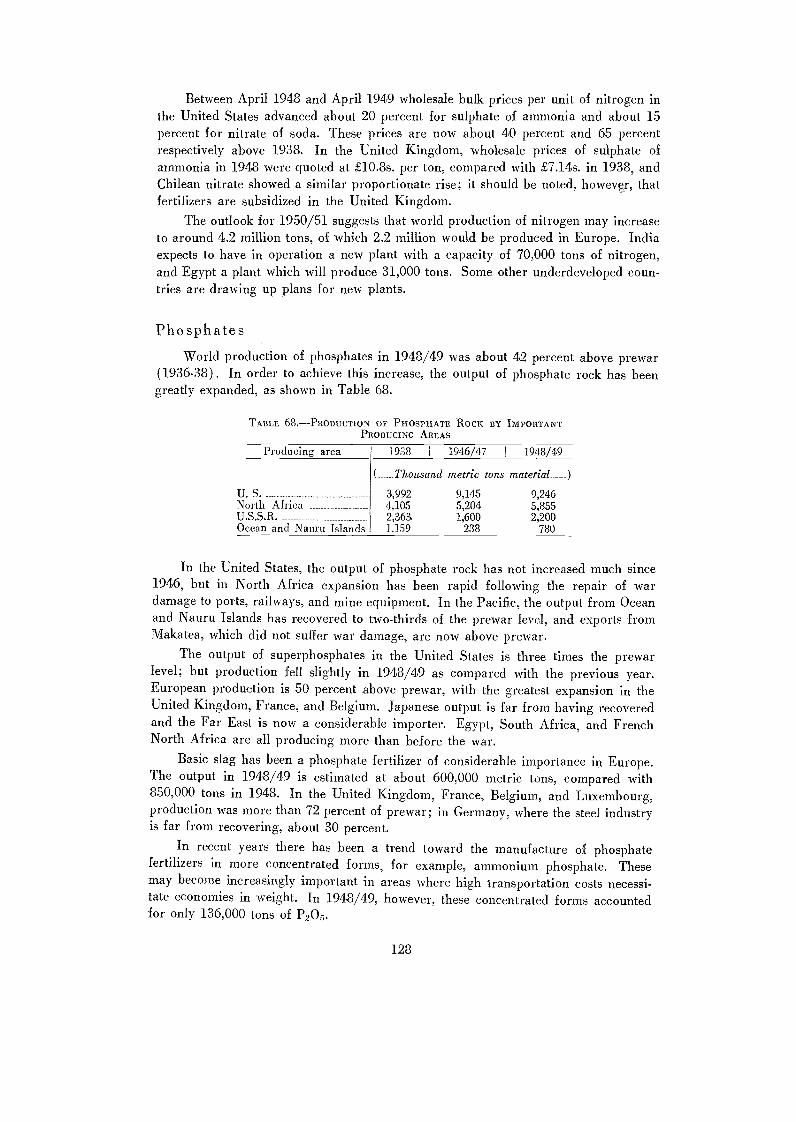
Between April 1948 and April 1949 wholesale bulk prices per unit of nitrogen inthe United States advanced about 20 percent for sulphate of ammonia and about 15percent for nitrate of soda. These prices are now about 40 percent and 65 percentrespectively above 1938. In the United Kingdom, wholesale prices of sulphate ofammonia in 1948 were quoted at £10.8s. per ton, compared with £7.14s. in 1938, andChilean nitrate showed a similar proportionate rise; it should be noted, however, thatfertilizers are subsidized in the United Kingdom.
The outlook for 1950/51 suggests that world production of nitrogen may increaseto around 4.2 million tons, of which 2.2 million would be produced in Europe. Indiaexpects to have in operation a new plant with a capacity of 70,000 tons of nitrogen,and Egypt a plant which will produce 31,000 tons. Some other underdeveloped coun-tries are drawing up plans for new plants.
PhosphatesWorld production of phosphates in 1948/49 was about 42 percent above prewar
(1936-38). In order to achieve this increase, the output of phosphate rock has beengreatly expanded, as shown in Table 68.
TABLE. 68.PRODUCTION OF PHOSPHATE ROCK. BY IMPORTANTPRODUCING AREAS
In the United States, the output of phosphate rock has not increased much since1946, but in North Africa expansion has been rapid following the repair of wardamage to ports, railways, and mine equipment. In the Pacific, the output from Oceanand Nauru Islands has recovered to two-thirds of the prewar level, and exports fromMakatea, which did not suffer war damage, are now above prewar.
The output of superphosphates in the United States is three times the prewarlevel; but production fell slightly in 1948/49 as compared with the previous year.European production is 50 percent above prewar, with the greatest expansion in theUnited Kingdom, France, and Belgium. Japanese output is far from having recoveredand the Far East is now a considerable importer. Egypt, South Africa, and FrenchNorth Africa are all producing more than before the war.
Basic slag has been a phosphate fertilizer of considerable importance in Europe.The output in 1948/49 is estimated at about 600,000 metric tons, compared with850,000 tons in 1948. In the United Kingdom, France, Belgium, and Luxembourg,production was more than 72 percent of prewar; in Germany, where the steel industryis far from recovering, about 30 percent.
In recent years there has been a trend toward the manufacture of phosphatefertilizers in more concentrated forms, for example, ammonium phosphate. Thesemay become increasingly important in areas where high transportation costs necessi-tate economies in weight. In 1948/49, however, these concentrated forms accountedfor only 136,000 tons of P005.
128
( Thousand metric tons material )
U. S. 3,992 9,145 9,246North Africa 4,105 5,204 5,855U.S.S.R. 2,363 1,600 2,200Ocean and Nauru Islands 1.159 238 780
Producing area 1938 I 1946/47 I 1948/49
Consumption of phosphates has increased almost everywhere. In the United:States it is three times the prewar level, and in the United Kingdom it has doubled.Only in Germany and Japan is it still low relative to prewar; indeed, in the SovietZone of Germany, consumption is only 25 percent of prewar because of difficulties inobtaining phosphate rock or basic slag.
Prices of superphosphates in some areas have increased only moderately in thepast ten years, and there has been little change in the last twelve months. The UnitedStates (Baltimore) wholesale quotation for superphosphate in April 1949 was $0.770per unit, bulkabout 56 percent above 1938. In the United Kingdom (Liverpool)superphosphate was quoted at £5.19s. per ton in May 1949, compared with £3.15s. inSeptember 1937.
Potash
World production of potash in 1948/49 was 33 percent above the 1936-38 level,the steep reduction in Germany's output being more than offset by a large increasein the United States and smaller increases in France and Spain. Two-thirds of theprewar German output came from what is now the Soviet Zone, where 1948/49 pro-duction was only 60 percent of prewar, compared with 83 percent in WesternGermany.
Since Germany was the principal prewar exporter of potash to all parts of theworld, exports have substantially declined. However, the United States, formerly thelargest importer, has now become self-sufficient. Imports into the United States com-pensate for exports from the United States to Canada and other Western Hemispherecountries.
Consumption of potash fertilizers is two and a half to three times the prewarvolume in the United Kingdom, the United States, Denmark, and Norway; the increasein Belgium and France has also been large. By contrast, consumption in Germanyand Poland is still below prewar. In Latin America potash consumption has increaseda little, use being made of nitrate of soda potash from Chile and some imports fromthe United States and Europe. Potash supplies are still low in Australia and NewZealand.
Wholesale prices of United States potash f.o.b. mines are somewhat lower nowthan before the war. Potash (50 percent) in the United Kingdom was quoted in May
1949 at £11.10s. per ton, compared with £8 in September 1937.
Fertilizer UseThe widespread increase in demand for fertilizers has been partly a result of
government policies designed to stimulate food production and partly a result of thefavorable ratio of fertilizer prices to the prices of farm products. Though wholesale
bulk prices of fertilizers in some countries are about 50 percent above prewar, and
the prices to farmers probably at an even higher relative level because of higherfreight rates and handling costs, prices of farm products in most countries are double
or more than double prewar. The fertilizer industry is at last catching up with the newhigh level of demand, and from now on the rate of expansion, though continuing, islikely to be less rapid.
129

Generally speaking, the increase in fertilizer consumption over the past ten yearshas been greatest in the countries which already used considerable quantities. Beforethe war there were striking differences in the quantities consumed in different coun-tries. No satisfactory measure of utilization can be devised because some countriesuse important quantities of fertilizer, especially phosphates, on their grassland, butTable 70 shows the rate of consumption per hectare of arable land.
This listing shows the high consumption in Belgium, the Netherlands, and NewZealand;' and the level in Belgium has actually increased. It shows also the rise inthe position of the United Kingdom, Norway, and Switzerland, all three of whichhave been pursuing policies designed to increase their food production greatly. Noother non-European country has a consumption for any one fertilizer higher than anaverage of 10 kilograms per hectare of arable land.2 Clearly the use of fertilizers in
1New Zealand and Australia use considerable quantities of phosphates, but principally ongrazing land.
2United States data would be more comparable cited by states than for the whole country.In New Jersey, the heaviest user in 1948/49, the per hectare consumption was 31 kg. N., 66 kg.P205, and 50 kg. IC20.
TABLE 69.ESTIMATED FERTILIZER PRODUCTION, TRADE, ANO CONSUMPTION, PREWAR AND 1948/49
Net imports +Production ConsumptionRegion Net exports'1936-38 I 1948/49 I 1936-38 I 1948/49 1936-38 I 1948/49
Nitrogen ( Thousand metric tons N )
Europe' (excluding U.S.S.R.) 1,372 1,635 75 16 1,297 1,610North and Central America' 266 1,104 +114 187 380 917South America 279 299 247 249 32 50Asia 378 306 + 92 +258 470 564Africa - - + 88 +128 87 128Oceania 4 10 + 13 + 3 17 13TOTAL 2.299 3.354 2.283 3.291
Phosphoric Acid ( Thousand metric tons P205 _)
Europe' (excluding U.S.S.R.) 2,109 2,329 66 47 2,043 2,282North and Central America' 686 1,916 + 28 115 714 1,801South America' 22 43 - + 37 22 80Asia' 307 181 5 + 82 302 263Africa 51 99 + 24 + 9 75 108Oceania 340 434 -+ 11 - 351 434TOTAL 3,515 5,002 3.507 4.968
Potash ( Thousand nzetric tons l<20 )
Europe' (excluding 'U.S.S.R.) 2,075 2,175 305 81 1,770 2,094North and Central America 291 962 +126 + 21 417 983South America 1 11 + 9 + 7 10 18Asia 29 62 + 89 + 44 118 106Africa - 0.2 + 11 + 28 11 28Oceania 1 1 --i- 14 + 8 15 9TOTAL 2.397 3.212 2.341 '3.238
1Export and import figures are derived; they represent the difference between reported production andconsumption figures and include changes in pipeline and other stocks.2U.K. and Spanish dependent overseas territories included in Europe.3U.S, noncontiguous territories included in North America.',Excluding guano and bones from Argentina and India.6Includes some deliveries from U.S.S.R. production, primarily to Eastern European countries.
130

TABLE 70.CONSUMPTION OF FERTILIZERS, SELECTED COUNTRIES, 1936-38 AND 1948/49
NI P205
IK.0
Consumption\ 1936_38 i 1918/49 1 ,9 ,6_38I 1948/49 I 1936-38 I 1948/49
( Kilograms per hectare arable land )
many countries, and especially in most underdeveloped countries, must be consider-ably increased before appreciable results in crop production can appear.
2. PESTICIDES
THE USE OF VARIOUS CHEMICALS to control insects, plant pathogens, and weeds hasbecome an important part of crop production. There are no indications that thedemand for pesticides will lessen as agricultural science progresses. On the contrary,the countries most advanced in scientific agriculture are the highest users, and inthese countries the trend is toward a continually increasing use.
Production figures on pesticides are not readily available except in the UnitedStates, although several other countries, notably the United Kingdom and Switzerland,are large producers.
Both the United Kingdom and Switzerland supply their domestic requirementsand are also heavy exporters to European and Asiatic countries. In Latin Americaproduction of synthetic pesticides is unimportant, but Peru is the world's largestproducer of rotenone. It is reported that sufficient roots to supply the world marketfor the next ti,vo years are already planted and that a greatly improved extractionmethod is in use. These two factors could markedly affect the cost of rotenone, witha resultant impact on the competitive insecticides. Mexico and Sweden are two of themajor producers of white arsenic.
131
Over 100 Kg. Netherlands NetherlandsNew Zealand New Zealand
Netherlands BelgiumLuxembourg
81-100 Kg. ____ BelgiumNetherlands
Belgium Netherlands
61-80 Kg. Netherlands BelgiumLuxembourg
Switzerland Germany
41-60 Kg. Belgiumi apan
EgyptJapan
Switzerland NorwayU.K.
BelgiumGermany
Norway
21-40 Kg. EgyptGermany
GermanyNorwayU. K.
DenmarkEgyptGermanyJapanU. K.
DenmarkFinlandGermanyJapan
DenmarkSwitzerlandU.K.
11-20 Kg. DenmarkPeru
AustriaDenmarkFrancePeruSwedenSNVi tzerland
AustraliaFinlandFranceIrelandItalyNorwayPeruPortugalqw.den
AustraliaAustriaCzechoslovakiaFranceIrelandItalyPeruPortugalsweden
DenmarkFranceJapanNorwaySwedenSwitzerlandU.K.
FinlandFranceJapan

In the United States, the major producer of pesticides, the potential productionof DDT in 1947 was 100 million pounds but actual production was about 50 millionpounds. In 1948, because of accumulated stocks, production was only 18 millionpounds. In the first half of 1949, production equaled the total output for 1948.
Consumption figures are frequently meaningless because of the large and rapidlyincreasing number of formulas of different basic materials in various concentrations.The vast differences in toxicity invalidate a comparison between mere tonnages ofhome-made Bordeaux mixture and the organic fungicides unless each is stated interms of the basic material used. A few countries report that consumption is limitedby unavailability of certain pesticides, particularly those which have to be imported.But this is not in itself the main factor retarding the use of pesticides on crops. Lackof trained personnel in agricultural extension or other services to demonstrate theefficient use and potential benefits of the pesticides and lack of application equipmentare factors of equal or even greater importance.
Pesticides include three major groups of chemicalsinsecticides, fungicides, andweed killers. During the past few years there has been a rapid development of newproducts in each group. Many of these are highly competitive, one with another.Many are quite specific in that they give protection against certain pests. The resultis a certain amount of confusion as each of the new products either finds its appro-priate use or for various reasons is replaced by others. The trend is continually towardthe use of more toxic materials. DDT and BHC have been followed by an increasinglist of effective organic insecticides, a few of which are still designated only by num-ber. The same is true in the fungicidal field, where the bulky Bordeaux is beingreplaced by organics with much greater toxicity. Among the hormone weed-killers,2,4-Dwhich can be obtained in eleven different compoundsand methoxone havebecome standard items, but other similar products have arrived on the market in thepast year and many more are in the testing stage. The trend toward increased toxicityor selective specificity introduces additional problems in regard to application equip-ment already in use. As the toxicity increases, the amount of pesticide needed perhectare decreases, frequently necessitating changes in the equipment if the new mate-rials are to be used efficiently on an economic basis.
Pesticides in general are available for export from the major producing countries,but lack of foreign exchange unquestionably restricts purchases to some extent. Theyare produced mainly in only a few countries with major chemical industries. Import-ing nations must anticipate their needs and place orders in advance, therefore, so thatsupplies can be on hand when needed. The organic insecticides are offered in manydifferent finished preparations, frequently in extreme dilutions. This has stimulated atrend towards importation of basic materials or concentrates for mixing into finishedinsecticides within the consuming country.
There are a number of developments which may affect the use and therefore theproduction of individual pesticide materials. Because of the effects of toxic residuesof DDT, certain authorities in the United States have issued regulations that will un-doubtedly reduce its use; pyrethrum, rotenone, methoxychlor, parathion, and otherswill be used instead. The production of synthetic pyrethrin on a commercial scalemay affect the market for pyrethrum, but no effect is seen at this time. The trend inimporting countries towards domestic formulation of pesticides from basic materials
132
or concentrates may have a marked effect on consumption by developing formulasdesigned to fit the particular needs of the country and providing immediately availablestockpiles of pesticides. The need for technical advisory services has been recognizedby a number of major pesticide producers and distributors, and some action has beentaken to provide such services in several countries. Further developments along thisline could logically become a strong factor in extending the benefits in crop produc-tion to be derived from the proper and increased use of pesticides.
The use of pesticides will continue to increase, and the quantities available forexport from the major producing countries will continue to be adequate to meet allforeseeable demands.
3. FARM MACHINERY
TRENDS IN TRACTOR AND ANIMAL DRAFT POWER on farms from 1930 to 1947 weretraced on a world and regional basis in The State of Food and Agriculture, 1948.During this period the number of tractors in use in the world increased greatly, butin 1947 tractors still provided only 15 percent of the draft power on farms. Produc-tion of other modern farm machinery also increased manyfold, particularly after theivar, but the supply in 1947 was unequal to the unprecedented demand. The presentstatement attempts to bring the picture up to date and to examine current trends in thefield of farm machinery.
Work animal numbers are gradually being restored in the war-devastated areasof the Far East and Europe. Progress continues also in the struggle against rinder-pest, and new measures (notably the drug antrycide) for combating trynosomiasis inAfrica raise hopes for greatly increased animal power in that underdeveloped area.Increases in the number of the world's work animals, however, have not been largein the past year.
Tractors and other modern farm machines continue to be used on an increasingscale in the more developed regions, and even in areas previously little affected bymechanization they are being used more and more, often for special purposes such asland reclamation. The figures assembled in Table 71 illustrate the rapid but unevenadoption of mechanical power on farms in the major regions of the world during thelast two decades. Striking features of this development are the fourfold increase inthe number of tractors over the 19-year period; the concentration of 97.5 percent ofall tractors in North America, Europe, the U.S.S.R., and Oceania (whereas LatinAmerica, the Far East, the Near East, and Africa, containing together nearly half theworld's cultivated land, have only 2.5 percent) ; and the rapid intensification ofpower farming in Europe, particularly in Western Europe.
In Europe a diminishing proportion of the farm machinery being manufacturedis suitable for operation by draft animals, and tractors are being generally introduced,notwithstanding fuel import problems, in order to gain greater speed of operation andto obtain the benefits derived from the release of approximately one hectare of land
133

for each animal displaced. To an increasing extent, therefore, tractor numbers arelikely to provide an index of the level of mechanization in Europe. There remains ingeneral use, of course, a great deal of animal-drawn equipment in addition to hugequantities of the more primitive traditional implements in underdeveloped areas.
It is important to bear in mind, however, that tractor numbers alone do not indi-cate the extent to which mechanical power is used on farms. The hours of work theyperform the year round must also be considered. There is evidence that the numbervaries greatly from region to region, but few details are available. In the UnitedStates, for example, it is reported that farm tractors in 1941 worked on the average493 hours; in the United Kingdom the estimated figure is 800 hours a year; and in theU.S.S.R. the range for collective farms in 1936 was 800 to 1,600 hours.
TABLE 71.TRENDS IN TRACTOR NUMBERS SINCE 1930
Country or region
United States 1,945 983Canada 148 125United Kingdom 272 126Europe (excl. U.K.) '250 4175
Latin America 43 '4Near East ... ...Far East ... ...Africa 41 41Oceania 430 426U.S.S.R. '400 '265
Production'Machinery
Total other thantractors
134
'As far as possible the figures g.ven have reference to agricultural tractors, but in some cases no clearseparation from horticultural (garden) types and tractors used for nonagricultural purposes can be made.
TABLE 72.FARM MACHINERY SITUATION, 1948
Exports'Machinery
Total other thantractors
Imports'Machinery
Total other thantractors
Million U. S. dollars
382 18984 73
'106 2835 423
03 53
73 51132 7425 19
122 68113 54
17 815 780 2333 11
TOTAL 3,049 1,704 610 316 610 315
1Factory prices.6Export prices at ports; i.e., about 20 percent above factory prices.6Export prices at ports in United States, Canada, United Kingdom; also includes France, Sweden,Switzerland, and Australia where data are available.4Estimates made by FAO.6Excludes dairy equipment.61946/47 data.
North America 1,020 1,597 2,890 3,700 71.0 19.9United KingdomEurope (excl. U.K.)
20110
60205
200312
285501
(15.0
1/ 11.9
Latin America 20 35 62 70 1.3 6.3Near East 2 5 10 13 0.2 5.6Far East 1 3 10 13 0.2 21.3Africa 10 17 26 40 0.8 14.2Oceania 32 53 90 101 1.9 1.6U.S.S.R. 79 523 400 500 9.6 19.2TOTAL 1.287 2,498 4.000 5,223 100.0 100.0
Estimated tractor inventOries' Distributionof Nvorld Distribution
Region 1930 1938/39 1946/47 1943/49 tractors1948/49
of -worldcrop land
( Thousand units ) (Percent) (Percent)

Country or region
United StatesWheel and trackGarden
CanadaUnited Kingdom
Wheel and trackGarden
Europe (excl. U.K.)Latin AmericaNear EastFar EastAfricaOceaniaU.S.S.R.TOTAL (excl. garden tractors)TOTAL (incl. garden tractors)
TABLE 73.TRACTOR NUMBERS, 1947 AND 19481
Production1947 1948
Thousand units
135
'Figures are in some cases estimates and are subject to revision.21948/49 program.
Production and Overseas Trade
Production and international trade in farm equipment have nearly trebled in vol-ume since 1937. North America and Europe remain the principal centers of produc-tion. Within Europe, however, the former concentration of production in the UnitedKingdom is now being balanced to some extent by growth of the industry in otherEuropean countries, notably France, Italy, Czechoslovakia, Sweden, Switzerland, andGermany, while Austria, Poland, and Hungary are making considerable progress.Manufacture of tractors on a significant scale has also commenced in Australia.
Information on production of tractors and other farm equipment and on intra-regional trade in these items in 1948 has been assembled in Tables 72 and 73. In 1948the volume of world output of all types of farm equipment increased over 1947 levelsby roughly one-third, mainly as a result of freedom from labor disputes in the UnitedStates, big increases in plant capacity in the United States and the United Kingdom,and better supplies of raw materials. Production of 819,000 wheel and crawler trac-tors, compared with 592,000 in 1947, illustrates the progress made. The market forhorticultural or garden tractors justified only small expansion in production. Anotherfact worthy of note is that tractor production in the U.S.S.R. in 1948 doubled theprevious year's figure, though prewar levels have not yet been reached. Crawlertractors were in short supply during 1948, despite some expansion in the United Statesand the entry of a few European manufacturers into this field on a small scale. Con-struction of mounted and trailing equipment associated with tractors was increased tokeep pace with the increase in tractors. This applies not only to relatively simpleimplements such as plows and harrows, but also to more elaborate machines such ascombine harvesters. In the United States alone, 91,000 combines, including 10,000self-propelled types, were manufactured in 1948, compared with 77,000 in 1947.
Table 73 shows that less than a quarter of the tractors produced in 1948 wereexported. For farm machinery other than tractors, the proportion entering inter-
Exports1947 I 1948
98 117(15) (11)
6 9
123 199
138 210
Imports1947 I 1948
2233 67
592 819793 1,036
470 568(173) (183)
10 15
58 117(28) (34)
21 50
6 21
46
2 2
5420 29
2 42 39 22
10 182
123 199

national trade was somewhat less because manufacture of those items is often lessspecialized (Table 72). When considering the distribution of exports, it is of interestthat the four less developed regions combined took only one-third of the tractors andother farm equipment entering world trade. As shown by Table 74, this proportionhas not changed greatly over the last decade, notwithstanding heavy imports in recentyears for the highly mechanized agriculture of French North Africa and the Union ofSouth Africa, which are included in otherwise underdeveloped regions along with suchLatin American countries as Argentina, Venezuela, and Mexico, where mechanizationis making considerable progress. The figures for North America show that a largeproportion of United States and Canadian exports were exchanged between these twocountries. Oceania exports such items as seeding and harvesting equipment but isdependent on overseas sources for most of its tractors.
TABLE 74.-EXPORTS OF TRACTORS AND OTHER FARM MACHINERYENTERING VARIOUS MARKETS: PERCENTAGES OF TOTAL VALUE
1949 Situation
It is too early to assess in detail the world's farm machinery situation for 1949,but certain indications are available. The most striking and important feature is thatproduction has at last caught up with demand. Transition from a seller's to a buyer'smarket is taking place.
In the United States, tractor production in the first half of 1949 totaled some266,000 units, slightly more than in the first half of 1948, but prospects are for loweroutput in the second half of the year. In the United Kingdom, also, production oftractors and other agricultural machinery in the first quarter of 1949 was above theaverage quarterly level for 1948, but below 'the figure for the last quarter of 1948. Thesame applies to exports from the United Kingdom. It seems probable, therefore, thatboth world production of these items and overseas trade will be of roughly the sameorder in 1949 as in 1948, and will tend to decline towards a lower level in 1950. Thereis no reason to suppose that the distribution of exports will diverge markedly from thepattern shown in Table 74.
In the latter part of 1948 governments of the Far East repeatedly informed theFAO-ECAFE Joint Working Party on Agricultural Requisites that delivery of farmmachinery ordered from exporters in North America and Europe was being long
136
Destination 1937 I 1946 I 1947 I 1948
(Percentage of world exports)
North America 22 33 31 34Europe 27 32 26 24Latin America 22 17 22 19Near East 2 2 2 3Far East 2 2 3 2Africa 11 9 10 13Oceania 14 4 5 5U.S.S.R. 1 1
TOTAL 100 100 100 100Actual value in million U. S.
dollars 117 228 428 610Actual number of tractors--
1,000 units 51 78 123 199

delayed, despite the fact that arrangements for payment had been made. Anothercomplaint was that plows, for instance, would be delivered, but the tractors ordered atthe same time would not arrive until months afterward; pumps would be shipped, butno engines. Similar delays and lack of co-ordination were reported from LatinAmerica, the Near East, and other regions.
By the early part of 1949, however, relatively few complaints of this kind weremade to the ECLA-FAO Joint Working Party in Latin America. About this time, siximportant farm machinery exporting companies in the United States were consultedby FAO. Without exception they stated that they were in a position to make promptdelivery of most items of equipment produced by them to both domestic and foreignbuyers if proper procurement arrangements had been made. Their chief problemv,-as that many governments were restricting dollar purchases. Production had beencatching up with demand throughout 1948, and the backlog of unfilled orders whichhad accumulated during and after the war had eventually been satisfied. These rep-resentatives of the industry pointed out that crawler tractors, heavy-wheel tractors,and certain types of heavy plows were still in short supply, but that progress was beingmade in overcoming these shortages. On the other hand, some types of medium andlight tractors and equipment had actually been overproduced. A similar situation hasbeen reported from the United Kingdom, where some factories are not working atfull capacity. With further plants coming into production in EuroPe, there is a dis-tinct prospect of overproduction now that demand is largely confined to replacementof worn-out and obsolete machines and the needs arising from limited newmechanization.
Future Prospects
The high level of demand for farm machinery results partly from the relativelyhigh level of farm wages and partly from the favorable level of machinery prices ascompared with the prices of agricultural products; future demand will depend largelyon the evolution of this relationship. Until now, the prices which farmers have re-ceived for their products have increased in general more rapidly than the prices theyhave had to pay for farm machinery, as the figures in Table 75 for two selectedcountries indicate.
TABLE 75.PRICE INDICES, AGRICULTURAL PRODUCTS AND FARM MACHINERY, SELECTED COUNTRIES
Export prices for farm machinery in the United Kingdom (the only data avail-able) have risen more steeply than those shown in Table 75 (an index of 264 on thebasis of 1939 100), but the depreciation of sterling and the shortage of dollarshave made United Kingdom exports competitive with those of the United States inimport markets.
Because of the easier market situation, farm machinery prices are unlikely to risesubstantially. On the other hand, because of the comparative rigidity of productioncosts, they are unlikely to decline rapidly.
137
Country Base period Index of farmmachinery prices
Index of prices ofagricultural products
U.S.A. (March 1949)Union of South Africa (April 1949)
1935-39 = 1001936-38 = 100
170183
254255

If the present decline in commodity prices continues, this development, togetherwith the fact that many farmers have invested heavily in capital equipment, maysharply contract demand in some regions, notably in North America, which is by farthe biggest market. European mechanization plans are ambitious, and even if theyare not fully realized, demand seems likely to be greater for a few years at least thanin 1948/49, when roughly 150,000 tractors with associated equipment were taken up.This increase will be met almost entirely by the industry of the region, which will alsoproduce a substantial surplus for export. The U.S.S.R. is likely to rely on its ownresources for farm equipment and may have surplus production before 1953, so it isunlikely to buy from other regions.
The figures quoted in Tables 72, 73, and 74 show that Latin America, the NearEast, the Far East, Africa, and Oceania consumed, in the aggregate, only 10 percentof total world production of farm equipment in 1948, and roughly 40 percent of ex-ports, including 76,000 tractors. Although the potential market in some of these areasis tremendous, it can develop only slowly. Sales to these regions are seriously handi-capped by their growing balance-of-payment difficulties.
For the immediate future, annual world demand, excluding North America andthe U.S.S.R., would appear to be not much in excess of 250,000 tractors with asso-ciated equipment. European factories alone are estimated to ,have the capacity toproduce this quantity. If the huge productive capacity of North America, which isnow faced with a contracting domestic market, is added, abundant supplies of alltypes of farm machinery will clearly be available. It appears, therefore, that condi-tions will be increasingly favorable for carrying out mechanization programs, whichhave been delayed by difficulties in obtaining delivery of the appropriate kinds ofequipment.
Sales Agents for FAO Publications*GUAILEMALA
José GoubaudGoubaud & Cía. Ltda.5a Av. Sur No 6a y 9aGuatemala
HUNGARYGrill's BookshopR. Gergely, Ltd.Dorottya Utca 2Budapest V
INDIAThe Oxford Book & Station-
ery Co.:Scindia House, New Delhi;The Mall, Simia;17 Park Street, CalcuttaMessrs. HigginbothamsMound RoadPost Box 311Madras
IRELANDThe ControllerStationery OfficeDublin
ITALYRequests for FAO publica-
tions should be addressedto:
Bureau Régional Européende la FAO
Villa BorgheseRome
LEBANONLibrairie UniverselleAvenue des FrançaisBeirut
MEXICOManuel Gómez Pezuela e Hijo"Libros Técnicos y Científi-
cos"Donceles, 12México, D.F.
NETHERLANDSN. V. Martinus NijhoffLange Voorhout 9The Hague
NORWAYJohan Grundt Tannin. ForlagKr. Augustsg,t, 7AOslo
PAKISTANEast: Farcos' Publications2, Inglis RoadP. B. 13, RamnaDaccaWest: Ferozsons60 The Mall, LaboreVariawa Bldg., Karachi;35 The Mall, Peshawar
PERULibrería Internacional del
Perú, S.A.P. 0. Box 147Lima
PORTUGALLivraria Bertrand, S.A.R.L.73 Rua Garrett, 75Lisbon
SWITZERLANDLibrairie Payot, S.A.LausanneHans RaunhardtKirchgasse 17Zurich 1
SYRIALibrairie UniverselleAvenue Fouad lerB. P. 336Damascus
T 1LANDRequests for FAO publica-
tions should be addressedto:
FAO Regional Office for Asiaand the Far EastMaliwan MansionBangkok
TURKEYLibrairie Hachette469 Istiklál Caddesi, PeyogluIstanbul
UNION OF SOU'Ill AFRICACentral Nev,,s Agency Ltd.P. 0. Box 1033Johannesburg
UNITED KINGDOMH. M. Stationery OfficeP. 0. Box 569London S. E. 1
UNITED STATES OFAMERICA
International Documents Serv-ice
Columbia University Press.2960 BroadwayNew York 27, New YorkLocally in Washington, D. C.FAO Documents Sales
ServiceFood and Agriculture Organi-
zation1201 Connecticut Avenue,
N. W.Washington 6, D. C.
YUGOSLAVIADrzavno PreduzeceJugoslovenska KnjigaBelgrade
01131.R COUNTRIES: Requests may be sent to: FAO Documents Sales Service, Food andAgriculture Organization, 1201 Connecticut Avenue, N.W., Washington 6, D.C., U.S.A.*FAO publications are priced in U.S. dollars. Payment to FAO sales agents may be made
in local currencies.
ARGENTINAEditorial Sudamericana, S.A.Alsina 500Buenos Aires
AUSTRALIAH. A. Goddard Pty. Ltd.255a George StreetSydney
CANADAThe Ryerson Press299 Queen Street, WestToronto 2, Ontario
CHILEEdmund() Pizarro RojasOrganizaciónEditorialLibreraLa HispanoamericanaCasilla 3916Santiago
CHINAThe Commercial Press Ltd.211 Honan RoadShanghai
COLOMBIA"Agricultura Tropical"Avenida Jiménez, No. 8-74Oficinas 416-416aBogotá
COSTA RICATrejos HermanosApartado 1313San José
CUBARené de SmedtLa Casa BelgaO'Reilly 455Havana
CZECHOSLOVAKIAMoravia and Bohemia: OrbisStalinova 46, Prague XII.SlovaTia: "Journal,"LenH:rradska 14, Bratislava
DENEjna MunksgaardNorregade 6Copenhagen
EGYPTLibrairie de la Renaissance
d'Egypte9 Sh. Adly Pacha, Cairo
EL SALVADORLibrería NavasJa. Avenida Sur 37San Salvador
FINLANDAkateeminen Kirjakauppa2 KeskuskatuHelsinki
FRANCELes Editions A. Pedone13 rue Sou oParis 5e

Price: $1.50


![[Investigatory Project] CITRUS FRUITS AS A BACTERIAL HAND SANITIZER](https://img.pdfslide.net/doc/110x75/55cf94cb550346f57ba46c2b/investigatory-project-citrus-fruits-as-a-bacterial-hand-sanitizer.jpg)