Embed Size (px)
Citation preview

Food and Population: Priorities in Decision Making
Report of a Meeting of the International Conference of Agricultural Economists, Nairobi, August 1976.
SAXON 9 HOUSE
EDITED BY T. DAMS the late K.E. HUNT G.J. TYLER

©The International Association of Agricultural Economists, 1978
All rights reserved. No part of this publication may be reproduced, stored in a retrieval system, or transmitted in any form or by any means, electronic, mechanical, photocopying, recording or otherwise without the prior permission of Teakfield Limited.
Published by Saxon House Teakfield Limited, Westmead, Farnborough, Hants, England.
IBJLI British Library Cataloguing in Publication Data
International Conference of Agricultural Economists, Z6th~ Nairobi Z9?6 Food and population. 1. Food supply - Congresses 2. Population policy -Congresses I. Dams, T II. Hunt, Kenneth Edward III. Tyler, G 338.1'9 HD9000.5
ISBN 0-566-00250-7
Printed in Great Britain by Biddies Limited, Guildford, Surrey. Typeset by Supreme Litho Typesetting, IIford, Essex.

Food, population and rural development in Kenya: progress, policies, problems and prospects*
Leopold P. Mureithi and James 0. Otieno
Introduction
Kenya's economic set-up
Kenya, by African standards, is a medium sized country covering an area of 582,646 square kilometres. Out of this, land area measures 569,250 square kilometres and the rest is water.
According to the 1962 population census 93 per cent of Kenya's population lived in rural areas. That proportion had declined to 90 per cent in 1969 so that urban population rose from 7 per cent in 1962 to 10 per cent of the total population in 1969. Between the two years rural population rose from 8.1 million to 9.9 million while urban population rose from 0.6 million to 1.1 million. These facts underline two things. The first is that, given the overall rate of population growth (3.3 per cent per annum}, the urban areas could have gained in numbers largely due to movement of people from rural to urban areas. This is the familiar phenomenon of rural to urban migration which raises complex issues of population mobility and unemployment. The second is that rural development is synonymous with taking economic benefits where the majority of the people are. This has resource allocation and income distribution implications.
Some of the most interesting characteristics of Kenya's population include the fact that 51 per cent of the total population are children and dependants and only 49 per cent of the population could be considered active labour [ 1] . If the rate of population growth stays the same, total population will double every 22 years; there will be 15.9 million people in 1980 and about 34.0 million people by the year 2000. By that year urban population which grows at 8 per cent per year will have reached the 3.0 million mark.
GDP (Gross Domestic Product) in 1973 was valued at K£731.1 million in current prices, which is K£586.56 million in constant (1964) prices [2] . This GDP level was in fact 12.1 per cent higher than 1972. Over the ten year period since independence, the rate of growth of GDP at current prices has been in the order of 6.7 per cent per year. This high growth rate has been contributed to by the growth
* This is a revised version of a paper originally presented at the IAAE/UNFPA/FAO Seminar on Population and Food and Agricultural Development in Rome, Italy, in December 1975. The authors would like to thank J.P. Bhattacharjee, Martin David, Judith Heyer and R.P. Sinha for offering constructive comments, and the Food and Agriculture Organisation of the United Nations for financial assistance. Views express herein are those of the authors and should not be interpreted as reflecting the views of any institutions with which they may be associated.
65
of the industrial and service sectors whose average growth have been 8.1 per cent over the period. The agricultural sector on the other hand has grown at the rate of 6.5 per cent per year.
The contribution of agriculture (monetary) to GDP rose from K£53.1 million in 1964 to K£89.5 million in 1973 in real terms. There has been a relative decline of the agricultural sector contribution to the economy from 23.8 per cent in 1964 to 19.1 per cent in 1974. Apart from the important fact that the agricultural sector claims 90 per cent of the population it is also important to the economy in two other aspects; namely that it provides almost all the food requirements of the country, and that it is a very important foreign exchange earner. In 1973, for instance, agriculture contributed K£87 .6 million to export earnings, which is 54 per cent of the national total. Leading agricultural exports include coffee (29 .2 per cent), pyrethrum (3.0 per cent) and meat products (3.1 per cent) [3].
Kenya is primarily an agricultural country and 'rural areas comprise well over 98 per cent of the land area of Kenya' [ 4] ;hence the predominance of agriculture in generating domestic income, creating employment, earning foreign exchange, etc., and the necessity to gear economic development to agriculture and agriculturally based activities.
Policy goals in agriculture
While the 1964-70 Development Plan focused upon rapid growth and the 1970-74 plan attempted to shift the locale of growth to the rural areas, in the 1974-78 Development Plan 'policies which have as their objectives agricultural and rural modernisation and income redistribution appear in every chapter and affect every sector of the economy' [5].
In the field of agriculture, the Kenya government intends, amongst other things, to improve the distribution of rural income by obtaining a significant increase in the proportion of farmers who obtain a cash income from their land; to devise methods of developing the less favoured areas and to promote a more even development among different areas of the country; to increase the opportunities for employment in the agricultural sector; and to improve standards of nutrition in the rural areas [ 6]. In a nutshell, the economic objectives in the rural areas encompass rural transformation and regional balance, nutritional improvement, employment generation and income distribution.
The primary objective of rural development is the enrichment of the material and social welfare of the rural population. To accomplish this, it may prove necessary to institute comprehensive regional and subregional planning covering all functional sectors. Rural development is a multisectoral activity which includes agricultural development, rural industry, the establishment or improvement of social overhead facilities or infrastructure (schools, clinics, roads, rural electrification, improvement in quality of rural housing, communications, water supply), and welfare services or programmes (e.g. disease control, improved nutrition, adult literacy, family planning).
66

Some of these factors will be examined in this paper.
Agricultural production and population growth
Recent past experience
In this section we examine the historical experience of Kenya with respect to population change and agricultural output. A count of immigrant (non-African) population in Kenya was undertaken as early as 1911. This was repeated in 1921, 1926 and 1931. In 1946 and 1947 an estimate of African population was made. Total population in those two years was 5.2 million and 5.3 million, respectively. The first reasonably comprehensive census of population in Kenya was undertaken in 1948. Another census was carried out in 1962 and 1969. Estimates for intercensal years are regularly published. Table I gives Kenya's population estimates for the period 1946 to 1973 and annual rates of growth implicit in these totals.
Between 1946 and 1973 there has been differing degrees of coverage. Estimates for non-censal years are based on the previous census plus annual adjustments for migration and natural increase. The latter takes into account assumed trends in fertility and mortality. There has been gradual public awareness of the advantage of registration and govemment extension of the areas of compulsory registration. In this regard, it should be noted that in the years 1968 and 1969 there was a doubling of compulsory registration areas from seven in 1967 to fourteen in 1969. This may have been responsible for the overshooting of the annual rate of population change in 1968. For reasons explained in this paragraph, the estimates for 1958 and 1959 might have been underestimates.
The contribution of agriculture to GOP is given in Table 2. Here too, are included time series of the economy's output of livestock and food crops in both monetary and nonmonetary sectors. These figures are subject to the usual statistical, enumeration and valuation problems inherent in national income estimation in developing countries, in particular, the figures for the nonmonetary sector are imputed educated guesses. But they give a picture of the total foodstuffs available in the economy.
A notion of how the two magnitudes - food and population - have been faring is given by a comparison of their respective rates of growth. The difference between the rate of growth of agricultural production and that of population gives the rate of growth of agricultural production per capita. If that gap is negative this is an indication of a lean year. This suggests that the years 1956-5 8 were years of agricultural prosperity. The years 1960-61 were lean years; in fact there was widespread drought in 1960 and devastating floods in 1961-62. Between 1966 and 1968 agricultural output per head declined markedly. There are indications that the year 1973-74 was a disappointing year for agriculture [7]. The frequency of the incidence of famine and drought in Kenya has been clarified by T.R. Masaya who found that, in a decade, one would expect 3.6 bumper maize harvests and 2
67

Table 1 Annual population estimates, 1946-1973
Annual rate of Year Population change(%)
1946 5,152,000 2.35 1947 5,273,000 2.52 1948 5,405,966 2.26 1949 5,528,000 2.37 1950 5,659,000 2.35 1951 5,792,000 2.33 1952 5,927,000 2.31 1953 6,064,000 2.36 1954 6,207,000 2.40 1955 6,356,000 2.41 1956 6,509,000 2.41 1957 6,666,000 2.27 1958 6,817,000 1.56 1959 7,880,000 1.71 1960 8,115,000 2.92 1961 8,352,000 3.40 1962 8,636,263 2.44 1963 8,847,000 2.90 1964 9,104,000 2.87 1965 9,365,000 2.97 1966 9,643,000 2.96 1967 9,928,000 2.83 1968 10,209,000 7.19 1969 10,942,705 2.58 1970 11,225,000 3.97 1971 11,671,000 3.39 1972 12,067,000 3.44 1973 12,483,000
Source: Statistical Abstract, various years.
moderate harvests with about 6.4 food shortages [8]. Maize shortage is synonymous with food shortage because of maize's importance as a staple food for many Kenyans. Besides, maize shortage is likely to be ushered in by rainfall shortage so that other crops, e.g. vegetables, etc., are also likely to be short.
What we see is an uneasy balance between agricultural production and population growth. The problem can be solved either from the demand side by reducing increases in consumers (population policy) or from the supply side by augmenting
68

Table 2 Value of agricultural output in Kenya
Total Annual Food crops Annual agricultural rate of and rate of
product change livestock change Year (K£ million) (%) (K£ million) (%)
1955 69.80 12.2 1956 78.29 1.3 19.16 2.1 1957 79.27 1.1 20.55 25.1 1958 80.11 1.5 25.71 1.1 1959 81.41 4.5 26.00 7.9 1960 85.04 -4.1 28.06 -26.1 1961 81.52 -16.4 20.75 0.3 1962 68.21 49.4 20.82 5.6 1963 101.95 14.1 21.98 -2.9 1964 126.29 -11.8 21.35 27.2 1965 111.44 25.5 27.15 13.6 1966 139.89 0.8 30.85 18.8 1967 141.03 1.9 36.65 11.9 1968 143.72 0.2 41.01 1.5 1969 144.02 15.3 41.64 3.6 1970 165.99 3.9 43.15 12.7 1971 172.52 17.3 48.65 15.9 1972 202.35 10.9 56.39 1973 222.49
Sources: Statistical Abstract, various years; Economic Survey, 1975.
agricultural production. In the past, deficits in food supply have been made good by importation of maize ptincipally from the United States of America. Progressively, storage facilities of maize and other food crops have been and are being improved so that strategic stocks can be carried over from bumper to lean years. Besides, the hybrid maize revolution and improvements in crop husbandry have recently tended to reverse the bleak picture of the food situation in Kenya.
At the macro level, the picture of food availability is fairly good. But at the micro level, we still have to contend with distributional and accessibility problems so that the quantity of food intake is adequate for each member of the population. Besides, even if the quantity is adequate it does not automatically follow that the quality of food intake is adequate in terms of nutritional characteristics.
69

Prospects for population growth and food supply
'Per capita food intake is of special importance because of (a) its direct effect on human welfare and happiness, (b) its indirect effect on output through influence on the capability of a man to perform work and the attitude of man toward work, and (c) its indirect effect on per capita income through influence on death rates and hence on population growth. In low income countries, agricultural productivity and incomes are such that both the quantity and quality of food consumed is low ... large numbers of people have a diet which is lacking in important qualitative features, such as certain amino acids and vitamins. As a result, health is impaired, resistance to disease is lowered and capacity to work is reduced.' [9]
Knowledge of the state of human nutrition in such countries as Kenya comes largely from three major types of studies: food balance sheets, dietary surveys and medical and clinical studies.
The most obvious constraint towards making these studies is lack of statistical data. Dietary and clinical surveys of the nutritional status in Kenya have been done but these have been of limited coverage and are of limited usefulness [10). The most recent attempt to construct a food balance sheet was made by Lawrence Smith in 1973 [11) and was subsequently improved upon by the World Bank Mission of 1973 [12].
The World Bank's, as well as Smith's, analysis of the food situation involved two essential steps. First, an assessment of per capita consumption of each food commodity was made. This was done through food balance sheets with apparent consumption levels obtained by substracting net exports and non-food utilisation from domestic availabilities (i.e. production and carryover stock). Household expenditure data were also used for this purpose. The second step was to project per capita consumption and population growth rates to derive total future consumption requirements. Indicative estimates for the 1972 position with regard to important food items such as maize, wheat, rice, sorghum, pulses, sugar, edible oils, fats, milk and milk products are given (see Table 3). Also included are data for meat, starchy roots and fish.
Comparing total consumption requirements with production projections, we see clearly that we will not be self sufficient in wheat, rice, and sugar, even if weather conditions are favourable. Kenya may meet her own demand for maize, sorghum, millets, pulses, milk, eggs and meat products. However, the levels of actual consumption and production will also depend upon the growth of real income over this period, and whether the present plans for food crops (especially sugar and wheat) and livestock developments are successfully implemented.
Although, the food balance sheet analysis shows that food supply will not be very critical over this period this does not imply that nutritional adequacy will also be achieved. The achievement of national nutritional adequacy will depend upon the growth and distribution of incomes, the success with which current nutritional education programmes will be successfully implemented and whether the supply situation will be guaranteed. The supply problem hinges on the overall
70

Table 3 Food demand and supply for selected products, 1972, 1973 and 1978
1972 1973 1978 1978 Product Consumption Production Consumption Production
Maize (million tons) 1.5 2.1 1.9 3.3 Wheat ('000 tons) 160.8 136.2 217.6 170.0 Sugar ('000 tons) 159.6 140.0 235.4 195.0 Rice ('000 tons) 22.8 31.6 29.6 55.4 Meat ('000 tons) 215.2 218.3 346.5 355.4 Milk 0.9t 279.6:j: 1.4t 400.0:j: Beans & Pulses ('000 tons) 240.0* 82.0** 321.3* 258.1 ** Edible oils & fats
('000 tons) 36.0 n.a. 53.3 n.a. Starchy roots (million tons) 1.4 n.a. 1.9 n.a. Sorghum & millets
('000 tons) 87.6 n.a. 112.5 n.a. Eggs ('000 tons) 6.0 n.a. 8.9 n.a.
t Milk and milk products in '000 tons :j: Milk only in million litres * Pulses ** Beans only n.a. = not available
Source: L.D. Smith, 'Food situation in Kenya, 1969-75' and Kenyan Development Plan, 1974-78 ..
strategy the government has taken to stimulate the development of the small farm sector and hence must depend upon the incentives (price, credit, extensiOn) that will be provided to the farmers.
A study of nutrition in relation to income distribution in Kenya by B. Jones and E. Osundwa reveals that most Kenyans are undernourished and that most receive very low incomes that would prevent them from achieving nutritionally adequate diet [13]. Using adjusted FAO Food Composition Tables they show that an adult Kenyan needs 2,589 calories and 70.6 grams of protein a day and that a Kenyan child needs 1,891 calories and 55.6 grams of protein a day. These required intakes are costed for 1970. For that year they found that the 'minimum cost of adequate diet' for an average Kenyan household comprising 5.6 members needed Kshs. 221 per month and for 1973 (after price adjustments) Kshs. 224 per month. Allowing for 20 per cent price inflation it would seem that at 1975 prices household expenditure on food per month has to be Kshs. 292 in order to achieve the 'minimum cost of adequate diet'. Therefore, in order that a household should get the annual
71

nutritional adequacy their nonmonetary and monetary disposable income must be above K£175.
The majority of Kenya households, as the ILO report shows, received less than K£100 per annum in 1972. In fact they found that out of the 2.34 million households, 2.04 million (87 per cent) earned less than K£200 per annum and that 1.47 million households (60 per cent) earned less than K£60 per year. Conditions have changed dramatically since 1973, such that with existing rates of inflation and the slow growth in income, the majority of the rural population cannot afford the 'minimum cost of adequate diet'.
What comes out of this is the fact that a lot has to be done to stimulate agricultural/rural development so that people receive higher incomes. To bridge the gap between increasing food demand and supply and to solve distributional problems there are several measures that have to be taken. Some of these include land reform, agricultural extension, marketing and credit programmes, pricing incentives and proper nutrition education and family planning.
Nutrition policy and family planning
Kenya does not have, as yet, a clearly worked out nutrition policy although in the current Development Plan it was hoped that national nutrition policy regarding production, marketing and distribution of foodstuffs, food technology, the improvement of nutritive quality, nutrition education and research would be formulated and that a National Food and Nutrition Council would be formed to co-ordinate and implement that policy. A major step taken in this direction is the organisation of a nutrition workshop early in 197 5 under the auspices of the Institute for Development Studies and was intended to provide the framework for national nutrition policy. The workshop findings [14] and recommendations are now being scrutinised by government. What is currently available in the field of nutrition are the various nutrition intervention programmes which can be divided into three categories. The first are the direct programmes which include the School Feeding Programme and Pre-School Feeding Programme under the Ministries of Health and Social Services, Mother-Child Health activities under the Ministry of Health and Famine Relief under the Office of the President. Second are the Public Education Programmes under the Ministries of Health and Agriculture. Third are the various nutrition education and training programmes now undertaken at Karen College for nutrition field workers and the agricultural training colleges for the training of agricultural extension personnel, social workers and Community Development workers. One of the most serious difficulties with these programmes are their limited coverage and lack of co-ordination.
Apart from the programmes outlined above designed to increase food availability and nutritional adequacy, it is important that in order to ease the population/food situation something must be done to limit the rate of population growth. In Kenya the attempt is made through the family planning programme. This programme is primarily intended to enhance the health and welfare of mothers
72

and children in general and in particular to reduce in some way the rate of population growth through the introduction of various methods of fertility control including contraceptive devices. These programmes have not produced measurable impact on population control and the conclusion of Professor Livingstone with regard to his assessment of the programme's impact in Vihiga seem to be justified. He says [ 15] that from the general analytical point of view we may conclude that the calculation of costs and benefits of an avoided birth for Kenya would be an extremely hazardous business, from the point of view of the response factor alone.
The 197 4-79 Kenya National Family Planning Programme, financed by the Government of Kenya, the World Bank, United Nations Fund for Population Activities, Swedish International DevelopmentAuthority and the US Agency for International Development, aims at averting some 150,000 births and reducing Kenya's rate of population growth from the present 3.3 per cent per annum to 2.8 per cent by year 2000. It is increasingly realised that· attitu-des towards family planning are influenced by education, shortages of land, the cost of providing for children and exposure to information about family planning.
From the point of view of population policy in Kenya, as Livingstone has pointed out, the overall conclusion should not be the abandonment of the programme despite the difficulty of demonstrating a substantial impact but, first, a reformulation of the programme to attack the problem of non-continuation, and second, in the face of the increasingly serious population situation, the acceptance of the fact that controlling population growth is likely to be a long haul, with the size of the problem becoming worse the longer the delay in corning to grips with it.
Major constraints on agricultural development and food supply
Generally, one would expect that the nature of economic activity in a country should closely reflect its natural resource endowment. The largest resources Kenya has are its people and the land, which includes the minerals and the flora and fauna it contains. Kenya in its development has not fully utilised the principal resources of land and people, and future development strategies have to address themselves to this fact. The development of any resource must however be achieved at a price. Below is a summary of the resources available and some of the major constraints that have to be considered.
Land
Compared to other countries in the world Kenya's land/population ratio seems reasonable. Kenya's population density is only 19 persons per square kilometre compared to 280 for Japan, 318 for Netherlands and 170 for India. By African standards land/population ratio however, seems to be moderately high; the overall population density is only 11 persons per square kilometre.
73

This, however, hides the fact that Kenya is by and large a land scarce country and also that there are wide differences in population densities for various districts in the country. For example, population densities for 1969, varied between one person per square kilometre for Tana River, Isiolo, Marsabit, andGarissa to 307, 222, 194 and 193 persons per square kilometre for Kisii, Kakamega, Kiambu and Kisumu districts respectively. Given the rate of population growth of 3.3 per cent per year the land/population ratios will rise dramatically over time. Availability of good agricultural land has in fact reached critical proportions and already rural/ rural migration from high and medium potential lands to marginal agricultural land has continued rapidly. This problem is likely to get more acute as years go by. Agricultural production will be severely limited by the scarcity of good land, unless intensive usage and changes of technology intervene to overcome this constraint.
Qimate
Climate in Kenya is largely determined by altitude; lowlands tend to be dry while highlands are cool and have plenty of rainfall.
The climate of the highlands has two distinct zones separated by the Rift Valley. The Western Highlands and the Western slopes of the Mau Range receive the greatest amount of rainfall particularly in the Central altitudes. Kitale, which typifies the zone at 1,900 metres above sea level, has an annual rainfall of 1,130 millimetres. Temperatures over Trans Nzoia and Uasin Gishu Plateau vary very little with mean maxima between 23°C and 29°C and minima between l0°C and 13°C. Further west, average annual rainfall is 1,275 millimetres for Kisumu at 1,157 metres above sea level with marked peaks in April and November. Temperature ranges between maxima of 30°C and 34°C and minima between 14°C and 18°C. The area around Kisii and Kericho shares climatic characteristics similar to Kitale.
East of the Rift a high rainfall zone covers the Aberdares and Mt Kenya. South Kinangop and Nairobi, for example, receive 2,600 mm and 1,800 mm annually. Machakos, which is at the Southern end of the highlands at an altitude of 1,680 metres, receives 620 mm. This pattern also covers Isiolo and the Narok areas.
A narrow band at the coast receives adequate rainfall for crop farming. Mombasa at sea level has an annual rainfall of 1 ,040 mm with a pronounced peak in April/May. Further North at Lamu rainfall declines to 899 mm per year. Relative humidity in this zone is generally around 80 per cent.
The remaining part of the country (over half of the country) receives less than 500 mm of rainfall annually. The Northern parts are the driest. A belt between Lake Turkana and Wajir in fact receives less than 250 mm of rain. Over much of the year the area is dry and hot.
Soils
Although detailed soil data are not available, because the ongoing soil survey is not yet completed, a broad soil classification is possible.
74

In general the soils over much of the highlands are well-drained, deep and dark clays. They are, however, phosphate deficient and acid. These are the typical soils of the tea and coffee areas and are derived from volcanic and basement complex soils. At higher altitudes, particularly on the Mau and Aberdare Ranges and Mt Kenya, dark brown loams occur. These are derived from volcanic activity.
On the plateau and below the highland ranges, soils have a laterite horizon which leads to impeded drainage. Agriculturally, the most significant are the Uasin Gishu Plateau, parts of Western Province and much of Nyanza except for the Kisii Highlands. Also suffering from impeded drainage are the 'black cotton soils' of the Kano plains and the Trans Mara area in Narok district. They also occur over much of the potential commercial ranching areas of Athi Plains and Laikipia.
At the coast dark red loamy sands derived from sedimentation occur. Elsewhere along the coast sand predominates with broken clays frequently occurring in the depressions.
The soils of the plains between the coastal belt and the highlands are mainly dark red loamy soils derived from volcanic basement complex rocks. Soils of the North Eastern parts of Kenya are dark reddish brown sandy loams derived from sediments of basement complex rocks. The balance of the North Plain has shallow stony soil interspersed with areas predominantly covered by lava boulders.
Water resources, irrigation potential and fisheries
As we have shown above less than 40 per cent of Kenya receives high rainfall that can support forests and natural vegetation and give rise to permanent streams. This explains why water conservation is of paramount importance.
Although most of the country does not receive much rainfall the basic problem in Kenya is one of storage and distribution. Total rainfall on the land areas is estimated to be 289,500 million cubic metres in an average year. The mean annual discharge of rivers and streams is estimated at 14,836 million cubic metres. Ground water availability has not yet been fully assessed but its importance for the development of the drier low potential areas is enormous.
The domestic requirement of the present population is about one per cent of the average annual precipitation and slightly more than one per cent of annual run off. The long term objectives of water development and conservation aim at providing water to thirty million people by the year 2000. The new Ministry of Water Development is charged with the responsibility of accomplishing this task.
As far as food production is concerned, the availability of water for irrigation purposes may be relevant. Though complete assessment of water resources available for irrigation is not made, potential irrigation areas have been identified. One is the Lake Victoria basin where irrigation potential is about 35,000 hectares and includes 12,000 hectares in the Kano plains and 17,000 hectares in Yala Swamp. The second is the Rift Valley drainage area. This area of internal drainage into Lakes Turkana, Natron, Naivasha, Nakuru and Baringo has limited irrigation potential. The third is the Athi River drainage system where very little is known
75
about the irrigation potential though about 6,000 hectares at Taveta has been identified as usable. The fourth is the Tana River Basin where the irrigation potential is about 100,000 hectares in the Upper Basin and about 120,000 hectares in the Lower Basin. Tana River has got major hydropower development potential and hence irrigation possibilities might be linked to hydropower developments in the future. The fifth is the Ewaso Nyiro drainage area which has the least development potential. Total irrigation potential is estimated to be around 700,000 hectares.
The full exploitation of Kenya's irrigation potential will be constrained by lack of finance. Hence, its contribution to the food situation will also be limited by that factor. Development expenditures on irrigation (including minor irrigation schemes) will amount to K£5.7 million during the current plan period.
Fish is no doubt a very importance source of protein, the consumption of which needs encouragement. Like most developing countries fishing makes a very small contribution to national income. Yet even for Kenya the full contribution of fisheries can only be assessed after taking into consideration the value added in processing, distribution and other related industries attributed to fishing operations [16].
About seventy-five per cent of the tonnage of fish landed in recent years comes from freshwater fisheries. Lake Victoria alone accounts for over half of the national catch, the remaining amount comes from Lakes Turkana, Naivasha and Baringo, the deep sea fisheries and numerous other lakes, rivers and fish ponds [17].
Fish consumption varies considerably among population groups, being traditionally greatest among the communities living adjacent to the principal fisheries of Lake Victoria, Lake Turkana and the Indian Ocean seaboard. For the country as a whole estimates of fish production and trade suggest that per capita consumption of fish is about 3 kilogrammes per person per year [ 18) . This is very low indeed for a country that has the fish and is suffering widespread protein deficiency, especially among the young children. In terms of the whole population of Kenya and considering nutrition status, animal protein contribution of fish to the diet is not significant.
Although one of the factors that prevent widespread consumption of fish is the different customary practices, the other factors include high prices, poor distribution and marketing channels and the simple fact that some of the fisheries have reached the absolute limit of their potential. This is particularly so for the inland lakes. Deep-sea fishing offers the greatest potential if people can be persuaded to consume deep-sea fish and if investments can be provided for this difficult operation. However, fish farming is one area where on the farm consumption of fish can be improved.
Capital and financial constraints
The brief survey of the natural resource position given above shows clearly that in order to guarantee food and employment to the majority of the people currently
76

either unemployed or earning very low incomes, a lot has to be done to increase the productivity of the land. The population/resource position has very important implications for economic development in general and the choice of agricultural strategy in particular. What seems crucial in the present economic environment is the fact that whatever strategy is chosen, capital, manpower and financial constraints have become acutely binding.
In order to deal with unemployment and its attendant problems, the government had, at the time of the current plan preparation, a strategy that involved structural transformation of the economy and which would require the continued flow of resources into industrial and service sectors (modern sector) and with a pattern of investment that should be labour-using. Secondly, more resources (human and financial) should be directed to the agricultural sector in such a manner as to encourage easy adoption of innovations and the use of modem agricultural practices, consistent with the small farmer socio-economic environment.
What this strategy means is that more resources would be provided to small farmers to enable them to use fertilisers, pesticides, animal and mechanical power and to exploit and conserve available soil and water resources.
Agriculture is the only sector whose development makes moderate demands upon financial resources. In Kenya, it has the greatest development potential at least cost. The policy of large-scale industrialisation would be difficult to attain due to lack of sufficient demand and, much more important, would face very serious constraints imposed by the low level of domestic savings, the problems that limit increased foreign investment and foreign exchange constraints that are decisive in this context.
At the time the current plan was being prepared, it was envisaged that a total of K£455.9 million would be spent on all central government development projects. Out of this agriculture and water would take K£66.7 million or 14.6 per cent of total development outlay [19]. At the same time recurrent expenditure over the plan period was to amount to K£986.6 million, of which K£55.9 million would be spent on agriculture and water development. This is 5.7 per cent of total recurrent expenditure allocations. It was assumed at that time that with improvements in the tax system and with increased revenues from other sources such as sales tax and import duties, total domestic revenues would amount to K£24.8 million and external financing would amount to K£45 million and both shortterm and long-term borrowing would bring in K£15.0 and K£28.0 million respectively. The terms of trade facing Kenya were assumed to remain favourable and the balance of payments position would not become worse compared to the situation towards the end of 1972.
However, as a result of the 'oil crisis' and the consequent inflationary trends the balance of payments position and foreign exchange availability became critical. Planned expenditures were thrown out of balance and plan figures and targets have had to be revised.
As shown in the Sessional Paper No.4 of 1975, major revisions were made [20].
77
Total development expediture is to be maintained at K£455.9 million. This would be a smaller figure, taking account of price inflation. The situation calls for a more efficient utilisation of domestic resources and the only sector where this can be achieved with relative ease is the agricultural sector. This is dictated by the totally new environment Kenya is facing because, since independence in 1963, Kenya was able to maintain a favourable balance of payments position and availability of foreign exchange was not a serious problem. Although the trade deficit had increased from K£10.7 million in 1963 to K£80.0 million in 1973, it was off-set by increases in net receipts from other current account items (e.g. tourism) so that the deficit remained relatively small. From 1971 there has been a gradual deterioration in the balance of payments position. As a result of very tight import and credit controls, foreign exchange reserves increased from K£6.8 million at the end of 1973. The situation got much worse after the 'oil crisis'. Various corrective measures were taken, including assistance from the IMF of K£1.9 million for easing the balance of payments difficulties. Yet the reserve stood at K£6.8 million by the end of 1974; equivalent to merely two months of imports [21].
To deal with the situation, the government has introduced additional fiscal and monetary policies and measures including increased taxes, higher interest rates and a ceiling on the expansion of credit to the private sector. Government borrowing from the Central Bank has also been reduced. In addition more restraints on imports have been imposed and measures have been taken to expand exports and private sector consumption is to be compressed in order to release resources for increased local production of import substitutes and exports [22] .
What seems clear is that Kenya is facing a more severe foreign exchange constraint than ever before. What this implies is that Kenya's highly capital and import intensive growth cannot be sustained any longer. As emphasised by the World Bank in their report of 1974, the only way out of this situation is to make fuller use of domestic resources through greater emphasis on agriculture and industries based on local resources.
Experience has shown, in Kenya and elsewhere in the developing world, that in order to stimulate small farm activity, an extension package of credit, research, extension, training and marketing programmes are needed. In Kenya the importance of these have been recognised. The marketing system, that is largely based on co-operatives and statutory boards, has been found to be slow in responding to the needs of increased production from the rural areas. It is now under special study by experts from FAO and UNDP [23].
Kenya's agricultural credit system includes financial institutions which may be classified into three types. The first consists of the relatively new institutions and programmes serving smallholders. The second type includes older structures oriented towards large scale agriculture; and the third is composed of a series of programmes formed to support the transfer of agricultural land from European to African ownership. The current institutional distribution of funds outstanding by source and term are as follows.
78

Credit type
Long term
Medium term
Short term
Institution
Agricultural Settlement Fund Agricultural Finance Corporation Commercial Banks
Agricultural Finance Corporation Agricultural Settlement Fund Commercial Banks Government Programmes
Commercial Banks Merchant Supplies Guaranteed Minimum Return (GMR) Co-operative Societies
Proportion of all credit(%) I9 6 4
I8 I4 II 2
I3 9 3
These data show that most of the farm credit is provided by a few major institutions, notably the Agricultural Finance Corporation (AFC), Agricultural Settlement Fund and the commercial banks [24] .
For a long time most of the available credit went to the large farm sector and it is only recently that attention has been given to the small farm sector. Up until I973 out of the I.2 million smallholders only 250,000 were able to get some form of credit. Most of the 23,000 large farms and ranches received the bulk of institutional credit in Kenya.
The most significant short term lenders to smallholders include the AFC, and the Co-operative Bank through the Co-operative Production Credit Scheme. In order to correct this imbalance the Government of Kenya has entered into an agreement with the World Bank for the finance of an Integrated Agricultural Development Programme and with USAID for an Agricultural Sector Programme Loan that are primarily designed to meet the small farmer's needs. The IADP is in two phases. Phase one starts in I975 and will cost K£9.25 million. At project maturity, the net incremental annual output is estimated to be K.£3.99 million from crops and K£5.25 million from livestock [25]. The USAID loan programme during the first phase will cost K£6.4 million. It is anticipated that most of the farmer participants will be able to receive net additional incomes ranging from K£97 to K£I44 per year [26]. The basic purpose of these loans is to provide a practical and operational means of reaching the small farmers and to bring about changes in the existing practices which tend to limit small farmer access to inputs and markets. These include size of farm loan, security and other eligibility requirements for credit, risks to be assumed by the agencies providing inputs and marketing arrangements for the outputs. The basic components of these loan programmes which depart from the usual government approach to this sector include training, marketing and storage, rural access road improvement and various forms of institution building.
79

In spite of these programmes the traditional problems in the area of small farm credit will not be easily solved. First, the credit system will still remain fragmented with the co-ordinating mechanism yet to be worked out. Secondly, loan payment by many farmers will still be difficult to achieve.
Regional imbalance
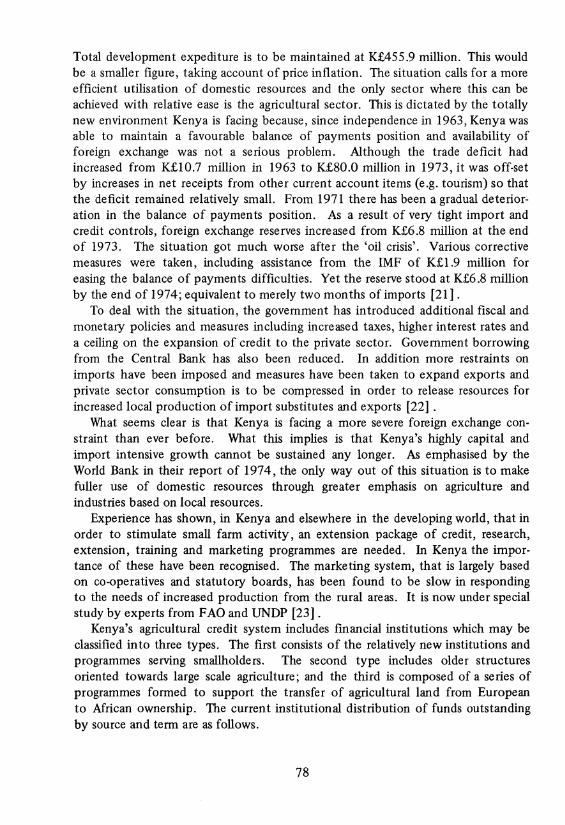
Regional disparities in the level of economic development can come about due to uneven factor endowment. In this regard, the critical factor in a predominantly agricultural country is the regional distribution of rainfall [27] and good agricultural land. Land in Kenya is classified into four categories:
1. High potential land with adequate rainfall (889 millimetres or more); 2. Medium potential land with 635 to 889 millimetres of rainfall a year; 3. Low potential land receiving between 508 and 635 millimetres and suited
mainly to ranching, except for irrigation; 4. Nomadic pastoral land with less than 508 rnillimetres of rainfall [28] .
An indication of the distribution of high potential land by administrative districts is given in Table 4. Some districts in the Central, Coast, Rift Valley, Nyanza and Western Provinces are well endowed with agriculturally good land, most of the Eastern and North-East Provinces are not so favourably endowed.
Natural or geographical drawbacks can be mitigated by deliberate government policy and action. For some time now, 'balanced economic development' [29] has been a declared government policy and 'in the allocation of funds for agriculture, greater attention will be paid to less developed agricultural areas and to range areas than before' [30]. For a comprehensive picture of the regional development scene, one would have to look at such things as the effect of the taking up by the central government from the local governments of education and health services, the activities of the National Irrigation Board, the work done by the Range Management Division of the Ministry of Water Development and local initiatives by way of self help (Harambee) activities. While unable to do justice to all these, some indication of the distribution of public social and economic services is to be found in Table 4 where are shown length of road per 1 ,000 square kilometres and ranking of districts in terms of educational expenditure. An index of both government and communal effort is given by the proportion of the population in primary school and percentage of land devoted to cash crops.
The conclusion is inescapable that:
'There are enormous regional disparities ... the percentage of the total population in primary schools varies widely between provinces and districts. Even greater disparities are found in the provision of secondary schools. Wide differences also exist in the availability of other services such as water and electricity supply, roads and health services.' [31]
80
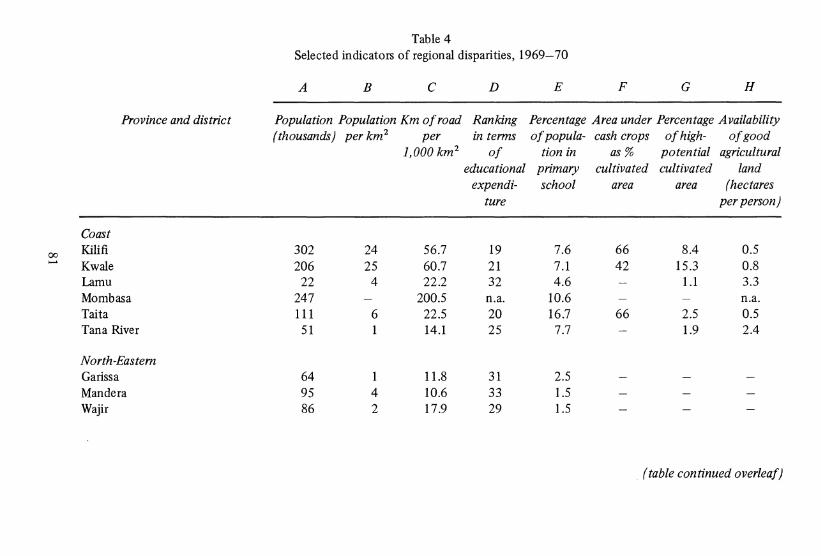
Table 4 Selected indicators of regional disparities, 1969-70
A B c D E F G H
Province and district Population Population Km of road Ranking Percentage Area under Percentage Availability (thousands) per km 2 per in terms ofpopula- cash crops of high- of good
1,000 km 2 of tion in as% potential agricultural educational primary cultivated cultivated land
expendi- school area area (hectares ture per person)
Coast
00 Kilifi 302 24 56.7 19 7.6 66 8.4 0.5 Kwale 206 25 60.7 21 7.1 42 15.3 0.8 Lamu 22 4 22.2 32 4.6 1.1 3.3 Mombasa 247 200.5 n.a. 10.6 n.a. Taita 111 6 22.5 20 16.7 66 2.5 0.5 Tana River 51 14.1 25 7.7 1.9 2.4
North-Eastern Garissa 64 11.8 31 2.5 Mandera 95 4 10.6 33 1.5 Wajir 86 2 17.9 29 1.5
(table continued overleaf)
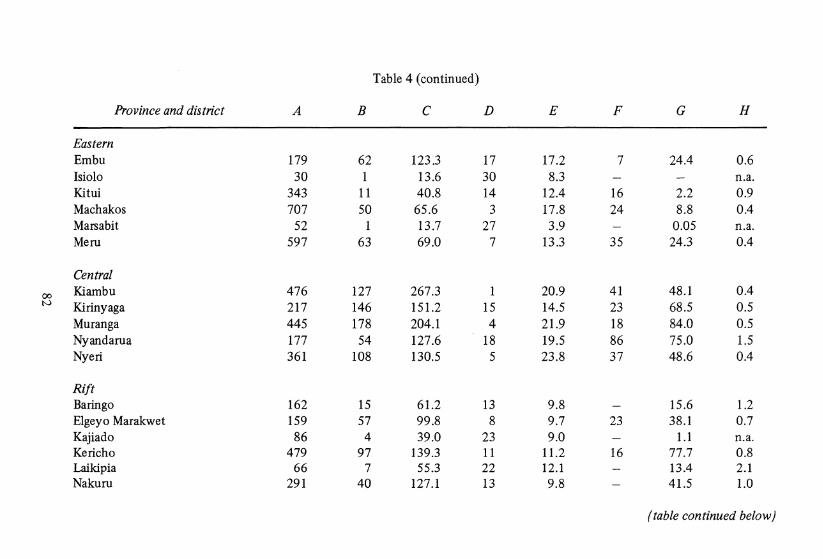
Table 4 (continued)
Province and district A B c D E F G H
Eastern Embu 179 62 123.3 17 17.2 7 24.4 0.6 Isiolo 30 1 13.6 30 8.3 n.a. Kitui 343 11 40.8 14 12.4 16 2.2 0.9 Machakos 707 50 65.6 3 17.8 24 8.8 0.4 Marsabit 52 13.7 27 3.9 0.05 n.a. Meru 597 63 69.0 7 13.3 35 24.3 0.4
Central
00 Kiambu 476 127 267.3 20.9 41 48.1 0.4 N Kirinyaga 217 146 151.2 15 14.5 23 68.5 0.5
Muranga 445 178 204.1 4 21.9 18 84.0 0.5 Nyandarua 177 54 127.6 18 19.5 86 75.0 1.5 Nyeri 361 108 130.5 5 23.8 37 48.6 0.4
Rift Baringo 162 15 61.2 13 9.8 15.6 1.2 Elgeyo Marakwet 159 57 99.8 8 9.7 23 38.1 0.7 Kajiado 86 4 39.0 23 9.0 1.1 n.a. Kericho 479 97 139.3 11 11.2 16 77.7 0.8 Laikipia 66 7 55.3 22 12.1 13.4 2.1 Nakuru 291 40 127.1 13 9.8 41.5 1.0
(table continued below)

Table 4 (continued)
Province and district A B c D E F G H
Rift (continued) Nandi 209 75 133.7 8 9.7 8 85.4 1.1 Narok 125 7 46.3 24 5.0 49.0 7.3 Samburu 70 3 20.2 28 3.3 6.7 2.2 Trans-Nzoia 124 50 134.6 8 9.7 84.2 1.7 Turkana 165 2 13.2 26 0.9 0.2 n.a. Uasin Gishu 191 50 135.8 8 9.7 86.5 1.7 West Pokot 82 16 71.8 8 9.7 28.2 1.3
00 Nyanza w Kisii 675 304 212.1 9 12.6 31 100.0 0.3
Kisumu 401 192 } 6 { 10.8 21 } 0.6 Siaya 383 151
173.4 12.9 9
93.7 0.9
South Nyanza 663 114 149.5 10 7.2 20 99.1
Western Bungoma 345 113 138.0 12 16.8 13 82.1 0.7 Busia 200 119 196.9 16 13.9 20 100.0 0.8 Kakamega 783 220 176.1 2 12.4 13 92.3 0.4
na. = available - = magnitude negligible.
Source: ILO, Employment Incomes and Equality, Geneva, 1972, Table 28, p. 78 and Table 1, p. 35.
The existence of regional imbalance makes it possible to divide the country into six ecological zones [32] which have differing land use potential. A comprehensive study of the economic potential of the various ecological zones was undertaken by the World Bank team [33]. They estimated the area and type of activity that would guarantee an annual income of K£70, which they defined as the 'minimum acceptable income' at 1973 prices. Prices in general have gone up 30 per cent since then but the analysis brings out the limitations population growth, natural and other factors are putting on the economic use of available land.
Zone 1:
This ecological zone covers 801 sq. kilometres and lies at high altitudes above the treeline. Vegetation is moorland or grassland and use is limited to water catchment, tourism, forestry and animal life.
Zone 2:
This covers about 53,000 sq. kilometres and embraces most of Kenya's forest land, both indigeneous and exotic. Agricultural potential of this zone is high and tea, coffee and pyrethrum are important cash crops. Macadamia nuts can be grown in the higher altitudes and cotton in the lower altitudes. For this zone, the area and type of activity that can provide the 'minimum income' of K£70 would be the following:
Enterprise Area employed Gross margin Labour requirements (ha.) (Kshs.) (man-days)
Maize/potatoes 0.8 550 140 Cash crops 0.4 350 275 Grade dairy cattle 1.0 475 50 House & gardening 0.1 50 75
2.3 1,425 540 Allow 10 per cent for other uses 0.3 Average farm size required for K£70 2.6
It is important to note that this is the zone with the highest population density and where the demand for land is most acute. Pressure is being put upon the government to allow part of the 100,000 hectares of planted forests to be excised and the area put to agricultural use. This pressure has been resisted because these forests are also very important as water catchment zones.
84

Zone 3:
Covers 53,000 sq. kilometres and has medium agricultural potential. The zone contains the largest mixed farming areas in the country. Maize would be the main crop for subsistence and for sale. Pulses and vegetables, cotton and livestock would also be important cash earners.
Enterprise Area employed Gross margin Labour requirements (ha.) (Kshs.) (man-days)
Maize 0.8 620 120 Beans 0.4 160 60 livestock 4.0 280 100 Cotton 0.5 310 225 House & vegetables 0.1 50 75
5.8 1,420 580 Allow 10 per cent for other uses 0.6 Average farm size required for K£70 6.4
Zone 4: (including drier parts of zone 3)
This zone also covers about 53,000 sq. kilometres and is marginal for agricultural purposes. Commercial ranching on well managed pastures can support one stock unit per four hectares or less. Drought resistant Katumani maize can be grown. Crop diversity is a great problem in this zone.
Enterprise Area employed Gross margin Labour requirements (ha.) (Kshs.) (man-days)
Maize 1.25 625 150 Beans 0.4 160 60 Cotton 0.75 220 190 livestock 14.00 380 140 House & vegetables not significant Average farm size for
K£70 16.4 1,385 615
Zone 5:
This zone covers 300,000 sq. kilometres and is largely not suitable for cropping. This zone is the main focus of the livestock development programmes. Subsistence crops would include millet and pulses.
85
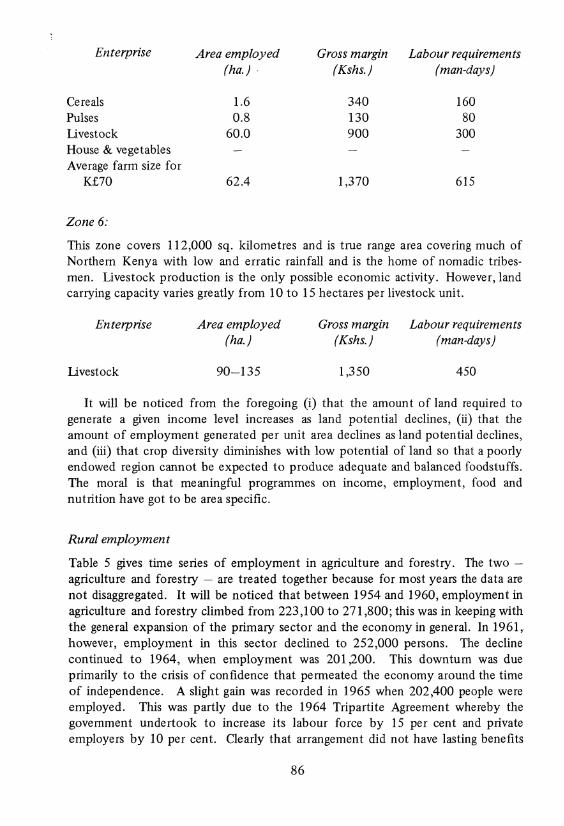
Enterprise Area employed Gross margin Labour requirements (ha.) · (Kshs.) (man-days)
Cereals 1.6 340 160 Pulses 0.8 130 80 Livestock 60.0 900 300 House & vegetables Average farm size for
K£70 62.4 1,370 615
Zone 6:
This zone covers 112,000 sq. kilometres and is true range area covering much of Northern Kenya with low and erratic rainfall and is the home of nomadic tribesmen. Livestock production is the only possible economic activity. However, land carrying capacity varies greatly from 10 to 15 hectares per livestock unit.
Enterprise
Livestock
Area employed (ha.)
90-135
Gross margin (Kshs.)
1,350
Labour requirements (man-days)
450
It will be noticed from the foregoing (i) that the amount of land required to generate a given income level increases as land potential declines, (ii) that the amount of employment generated per unit area declines as land potential declines, and (iii) that crop diversity diminishes with low potential of land so that a poorly endowed region cannot be expected to produce adequate and balanced foodstuffs. The moral is that meaningful programmes on income, employment, food and nutrition have got to be area specific.
Rural employment
Table 5 gives time series of employment in agriculture and forestry. The two -agriculture and forestry - are treated together because for most years the data are not disaggregated. It will be noticed that between 1954 and 1960, employment in agriculture and forestry climbed from 223,100 to 271 ,800; this was in keeping with the general expansion of the primary sector and the economy in general. In 1961, however, employment in this sector declined to 252,000 persons. The decline continued to 1964, when employment was 201,200. This downturn was due primarily to the crisis of confidence that permeated the economy around the time of independence. A slight gain was recorded in 1965 when 202,400 people were employed. This was partly due to the 1964 Tripartite Agreement whereby the government undertook to increase its labour force by 15 per cent and private employers by 10 per cent. Clearly that arrangement did not have lasting benefits
86
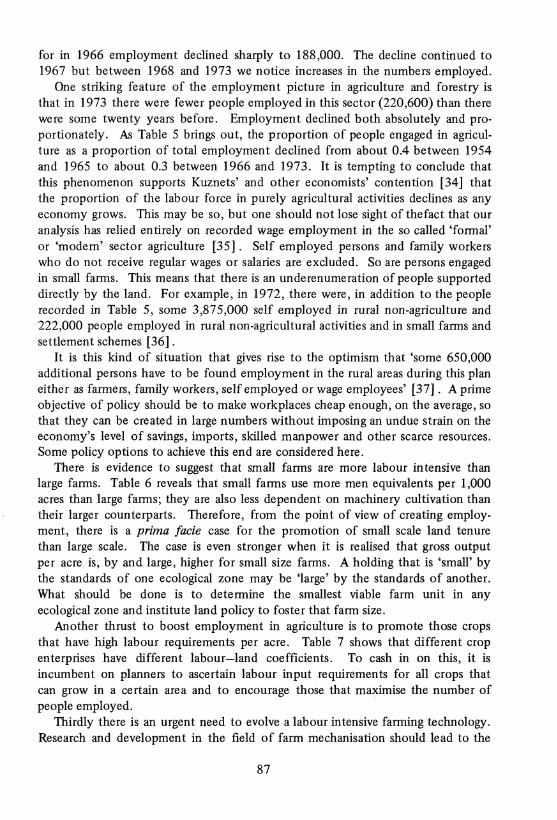
for in 1966 employment declined sharply to 188,000. The decline continued to 1967 but between 1968 and 1973 we notice increases in the numbers employed.
One striking feature of the employment picture in agriculture and forestry is that in 1973 there were fewer people employed in this sector (220,600) than there were some twenty years before. Employment declined both absolutely and proportionately. As Table 5 brings out, the proportion of people engaged in agriculture as a proportion of total employment declined from about 0.4 between 1954 and 1965 to about 0.3 between 1966 and 1973. It is tempting to conclude that this phenomenon supports Kuznets' and other economists' contention [34) that the proportion of the labour force in purely agricultural activities declines as any economy grows. This may be so, but one should not lose sight of the fact that our analysis has relied entirely on recorded wage employment in the so called 'formal' or 'modem' sector agriculture [35] . Self employed persons and family workers who do not receive regular wages or salaries are excluded. So are persons engaged in small farms. This means that there is an underenumeration of people supported directly by the land. For example, in 1972, there were, in addition to the people recorded in Table 5, some 3,875,000 self employed in rural non-agriculture and 222,000 people employed in rural non-agricultural activities and in small farms and settlement schemes [36).
It is this kind of situation that gives rise to the optimism that 'some 650,000 additional persons have to be found employment in the rural areas during this plan either as farmers, family workers, self employed or wage employees' [37) . A prime objective of policy should be to make workplaces cheap enough, on the average, so that they can be created in large numbers without imposing an undue strain on the economy's level of savings, imports, skilled manpower and other scarce resources. Some policy options to achieve this end are considered here.
There is evidence to suggest that small farms are more labour intensive than large farms. Table 6 reveals that small farms use more men equivalents per 1,000 acres than large farms; they are also less dependent on machinery cultivation than their larger counterparts. Therefore, from the point of view of creating employment, there is a prima facie case for the promotion of small scale land tenure than large scale. The case is even stronger when it is realised that gross output per acre is, by and large, higher for small size farms. A holding that is 'small' by the standards of one ecological zone may be 'large' by the standards of another. What should be done is to determine the smallest viable farm unit in any ecological zone and institute land policy to foster that farm size.
Another thrust to boost employment in agriculture is to promote those crops that have high labour requirements per acre. Table 7 shows that different crop enterprises have different labour-land coefficients. To cash in on this, it is incumbent on planners to ascertain labour input requirements for all crops that can grow in a certain area and to encourage those that maximise the number of people employed.
Thirdly there is an urgent need to evolve a labour intensive farming technology. Research and development in the field of farm mechanisation should lead to the
87

Table 5 Recorded employment in agriculture and forestry
Employment in Total Proportion agriculture and employment employed in
forestry agriculture and Year ('000) ('000) forestry
1954 223.1 544.4 0.41 1955 247.9 615.1 0.40 1956 235.2 596.7 0.39 1957 253.4 614.4 0.41 1958 249.5 593.2 0.42 1959 251.7 596.9 0.42 1960 271.8 622.2 0.44 1961 252.0 596.8 0.42 1962 245.5 579.8 0.42 1963 215.7 539.2 0.40 1964 201.2 575.4 0.35 1965 202.4 582.1 0.35 1966 188.1 585.4 0.32 1967 172.7 597.5 0.29 1968 173.0 606.4 0.29 1969 178.7 627.2 0.28 1970 183.7 644.5 0.29 1971 189.6 691.2 0.27 1972 197.9 719.8 0.27 1973 202.6 761.6 0.29
Source: Statistical Abstract, various years.
introduction and promotion of prototypes of small tractors and other farm implements. In particular, serious attention should be given to the promotion of cattledrawn ploughs and other intermediate farm machinery.
All these emphasise that 'low cost labour-using, rather than capital-using techniques must be employed to the greatest extent possible in agriculture' (38] .
Even labour intensive agriculture is unlikely to provide year-round full employment in rural areas due to the seasonal nature of agriculture. Employmentgenerating minor development works with high labour content should be carried out with underemployed and seasonally unemployed rural labour (39]. Construction of feeder roads, irrigation and other works, flood control such as school houses and clinical buildings should be phased in the slack during the rainfall and agricultural activity cycle. These activities contribute directly or indirectly in boosting agriculture. Local materials should be used wherever possible to provide
88

Table 6 Output, employment and farm size
Farm size Gross output Labour inputs Expenditure on (acres) (Sh. per acre) (men equivalents machinery
per 1000 acres) cultivation (Sh. per acre)
10 or less 635 808 6 10- 19.9 250 399 11 20-29.9 156 234 9 30-39.9 161 159 28 40-49.9 113 124 21 50-59.9 98 111 19 60-69.9 98 109 12 70 or more 111 70 10
All small farms* 156 190 14
250 or less 248 93 135 250-499 161 62 140 500-749 133 43 136 750-999 113 44 146 1 ,000 - 1 ,249 89 34 119 1,250- 1,499 149 46 167 1,500 - 1 ,999 128 28 155 2,000 - or more 65 14 131
All large farms** 117 36 143
* 1967/68 ** 1970/71
Source: Kenya Statistical Digest, vol. X, no. 1, March, 1972, Tables 3 and 4, pp. 7 and 8.
employment and reduce transport costs. Small-scale, labour-using light industries [40] with low capital requirements
should be established in rural areas to supplement employment opportunities in agriculture and provide supplemental incomes to small cultivators and landless agricultural workers. Certain light industries are better than others. Obvious cases are (1) the processing of agricultural commodities produced in the areas concerned which might include fruit and vegetable canneries, flour and rice mills, wood working factories, slaughter houses, creameries and milk powder plants,
89
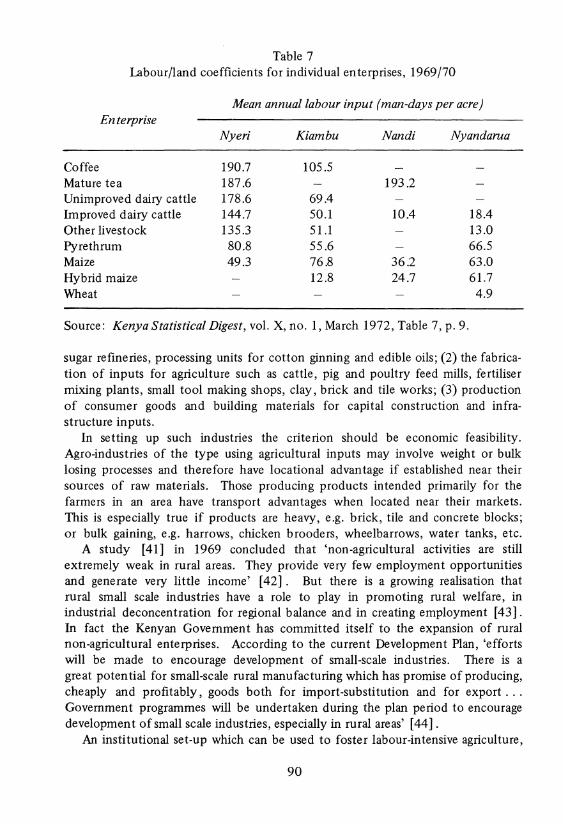
Table 7 Labour/land coefficients for individual enterprises, 1969/70
Mean annual labour input (man-days per acre) Enterprise
Nyeri Kiambu Nandi Nyandarua
Coffee 190.7 105.5 Mature tea 187.6 193.2 Unimproved dairy cattle 178.6 69.4 Improved dairy cattle 144.7 50.1 10.4 18.4 Other livestock 135.3 51.1 13.0 Pyrethrum 80.8 55.6 66.5 Maize 49.3 76.8 36.2 63.0 Hybrid maize 12.8 24.7 61.7 Wheat 4.9
Source: Kenya Statistical Digest, vol. X, no. 1, March 1972, Table 7, p. 9.
sugar refineries, processing units for cotton ginning and edible oils; (2) the fabrication of inputs for agriculture such as cattle, pig and poultry feed mills, fertiliser mixing plants, small tool making shops, clay, brick and tile works; (3) production of consumer goods and building materials for capital construction and infrastructure inputs.
In setting up such industries the criterion should be economic feasibility. Agro-industries of the type using agricultural inputs may involve weight or bulk losing processes and therefore have locational advantage if established near their sources of raw materials. Those producing products intended primarily for the farmers in an area have transport advantages when located near their markets. This is especially true if products are heavy, e.g. brick, tile and concrete blocks; or bulk gaining, e.g. harrows, chicken brooders, wheelbarrows, water tanks, etc.
A study [41] in 1969 concluded that 'non-agricultural activities are still extremely weak in rural areas. They provide very few employment opportunities and generate very little income' [42]. But there is a growing realisation that rural small scale industries have a role to play in promoting rural welfare, in industrial deconcentration for regional balance and in creating employment [43]. In fact the Kenyan Government has committed itself to the expansion of rural non-agricultural enterprises. According to the current Development Plan, 'efforts will be made to encourage development of small-scale industries. There is a great potential for small-scale rural manufacturing which has promise of producing, cheaply and profitably, goods both for import-substitution and for export ... Government programmes will be undertaken during the plan period to encourage development of small scale industries, especially in rural areas' [ 44] .
An institutional set-up which can be used to foster labour-intensive agriculture,
90

labour using minor development works and agriculturally oriented small-scale light industry using labour intensive techniques already exists. The Special Rural Development Programme (SRDP) and Rural Industrial Development Programme (RIDP) are being implemented with a view to experimenting, replicating, doing research and evaluation designed to achieve increased standards of living in the countryside. These two programmes aim at co-ordinating and synchronising on a continuing basis the related activities of the different ministries, departments and agencies concerned with rural development in Kenya.
Income distribution
One of the policy goals in Kenya is 'to improve the distribution of rural income' [45]. An approximate estimate of rural incomes in 1969 is given in Table 8. About 40 per cent of the K£231 million was derived from sources other than agriculture as such.
In Table 9 we present the distribution of earnings among people employed in formal sector agriculture and forestry. It will be noticed that over 90 per cent of the employees earn less than KSh. 200 per month suggesting a skewed income distribution. When all economic groups in rural areas are considered as in Table 10, the picture of skewness in income distribution is similarly supported. The majority of rural households are poor.
In the absence of firm data on personal income, some researchers have resorted to an assessment of the distribution of such income-related items as consumer durables, tea acreage and cattle. Michael Cowen's study of Mathira Division in Nyeri District and Diana Hunt's study of Mbere Division in Eastern Province reveal 'unequal distribution of economic status' [46] .
The ILO report [47] talks of there being a high degree of income inequality in both rural and urban areas because 'the dispersion around the average ... is enormous' [48], but concludes that in terms of absolute numbers, the great majority of the poor in Kenya are to be found in the rural areas [49]. So whatever is to be done about the overall strategies of mitigating inequality, most of the target groups will have to be the rural poor.
Migration
We should distinguish two kinds of migration: rural-to-rural migration and rural-tourban migration. Both are causally the same because they are necessitated by differences of what origin and destination have to offer. There is a relative 'pull' of the area of in-migration and 'push' of the area of out-migration.
There is a tendency in Kenya for people to migrate from rural areas to urban centres. This 'involves a rapid shift of people towards the larger towns, especially Nairobi and Mombasa. The movement is massive and involves all kinds of people -young, old, male, female, the educated and the illiterate, the landless and those with large holdings' [50].
91
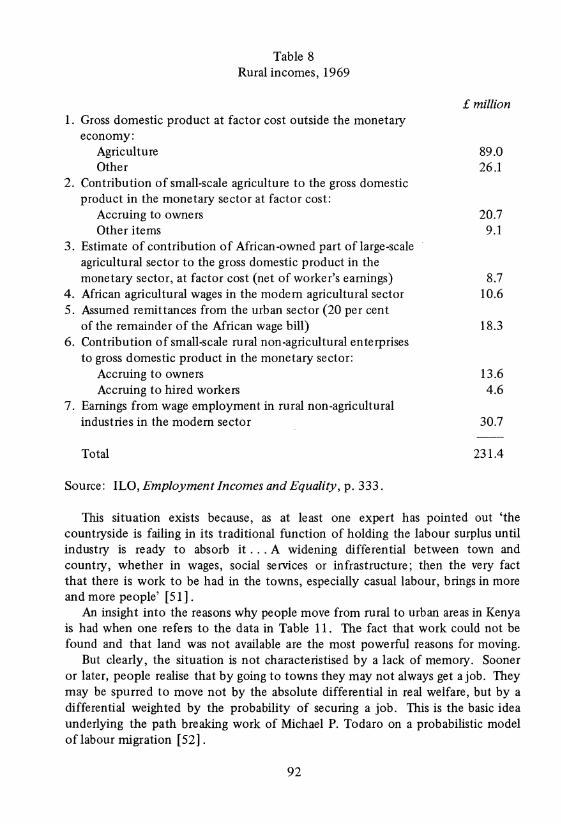
Table 8 Rural incomes, 1969
1. Gross domestic product at factor cost outside the monetary economy:
Agriculture Other
2. Contribution of small-scale agriculture to the gross domestic product in the monetary sector at factor cost:
Accruing to owners Other items
3. Estimate of contribution of African-owned part oflarge-scale agricultural sector to the gross domestic product in the monetary sector, at factor cost (net of worker's earnings)
4. African agricultural wages in the modern agricultural sector 5. Assumed remittances from the urban sector (20 per cent
of the remainder of the African wage bill) 6. Contribution of small-scale rural non-agricultural enterprises
to gross domestic product in the monetary sector: Accruing to owners Accruing to hired workers
7. Earnings from wage employment in rural non-agricultural industries in the modern sector
Total
Source: ILO, Employment Incomes and Equality, p. 333.
£million
89.0 26.1
20.7 9.1
8.7 10.6
18.3
13.6 4.6
30.7
231.4
This situation exists because, as at least one expert has pointed out 'the countryside is failing in its traditional function of holding the labour surplus until industry is ready to absorb it ... A widening differential between town and country, whether in wages, social services or infrastructure; then the very fact that there is work to be had in the towns, especially casual labour, brings in more and more people' [51] .
An insight into the reasons why people move from rural to urban areas in Kenya is had when one refers to the data in Table 11. The fact that work could not be found and that land was not available are the most powerful reasons for moving.
But clearly, the situation is not characteristised by a lack of memory. Sooner or later, people realise that by going to towns they may not always get a job. They may be spurred to move not by the absolute differential in real welfare, but by a differential weighted by the probability of securing a job. This is the basic idea underlying the path breaking work of Michael P. Todaro on a probabilistic model oflabour migration [52].
92
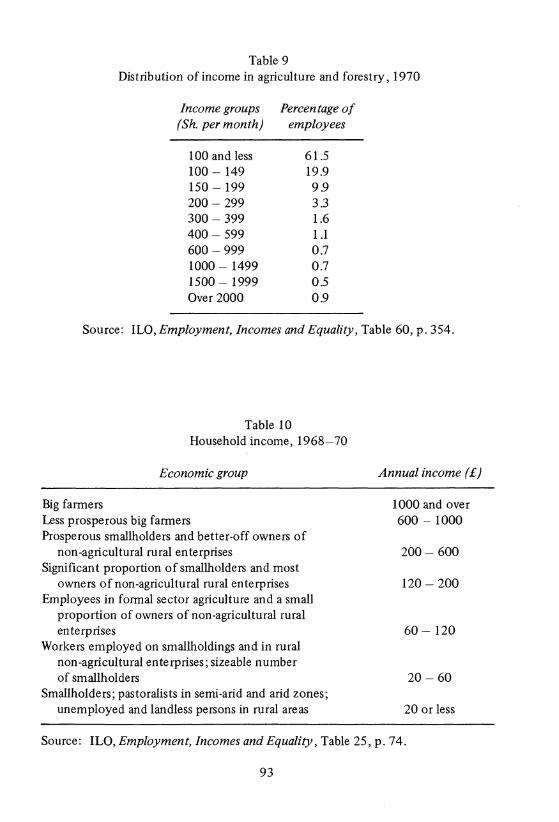
Table 9 Distribution of income in agriculture and forestry, 1970
Income groups (Sh. per month)
100 and less 100- 149 150- 199 200-299 300-399 400-599 600-999 1000-1499 1500- 1999 Over 2000
Percentage of employees
61.5 19.9 9.9 3.3 1.6 1.1 0.7 0.7 0.5 0.9
Source: ILO, Employment, Incomes and Equality, Table 60, p. 354.
Big farmers
Table 10 Household income, 1968-70
Economic group
Less prosperous big farmers Prosperous smallholders and better-off owners of
non-agricultural rural enterprises Significant proportion of smallholders and most
owners of non-agricultural rural enterprises Employees in formal sector agriculture and a small
proportion of owners of non-agricultural rural enterprises
Workers employed on smallholdings and in rural non-agricultural enterprises; sizeable number of smallholders
Smallholders; pastoralists in semi-arid and arid zones; unemployed and landless persons in rural areas
Annual income ( £)
1000 and over 600- 1000
200-600
120-200
60- 120
20-60
20 or less
Source: ILO, Employment, Incomes and Equality, Table 25, p. 74.
93

Table 11 Reasons for migration among male migrants aged 15-50, 1970
Reason
Could not find work Land was not available Could not enter school Schools not available or of poor quality Lack of social amenities Other
Total
80.9 3.2 4.4 0.6 0.2
10.7
100.0
Source: ILO, Employment, Incomes and Equality,Table 9, p. 46.
A study [53] by Mbithi and Barnes deciphered that rural-to-rural migration may come about for several reasons. There is migration due to famine, drought and land pressure in home areas. This is the kind of migration that has led to squatting within the ten mile coastal strip by tribesmen from drier hinterlands. There is migration due to political manoeuvring to gain possession of unoccupied special reserves, state land, margins of game parks, land owned by a pastoral tribe, or on large scale farms. There is also temporary migration when crop failure occurs and people are forced back into the more prosperous areas for short term employment [54].
Rural-to-rural migration is determined by (1) the carrying capacity of a given piece of land as determined by the level of technology and physical characteristics of the environment, (2) rate of population growth, (3) alternative non-farm employment, and (4) land tenure policies. These factors, operating in any one given setting, will determine occupational opportunities, food supply and population movements [55] .
Hence, it is clear that migration, of whatever category, is in response to differential earning power, social amenities and unemployment. These factors are closely connected with uneven development between various areas and regions. A diagnosis should be made of the various 'pull' and 'push' forces and action taken accordingly.
Political and social constraints [56]
Agriculture as the prime mover in the Kenya economy suffers from its historical -colonial structures. The most significant elements of the historical structure of agriculture [57] was first European ownership, second its location in the white highlands and, third its relative capital intensity. These first two elements led to important political constraints after independence as the government spent valuable
94

resources to Africanise the ownership of European - owned agricultural land in the white highlands. There were two approaches to this. These were to allow individual Africans to buy the land and the other was to settle 'landless' Africans in the white highlands [58]. The impact of the policies related to Africanisation of white highlands was to continue the relatively capital intensive 'tractor' based agriculture which was practised by Europeans. Colin Leys [59] estimates that there may be as many as 500,000 Africans in the former white highlands. On the whole they have led to the peasantisation of plantation agriculture. This probably has not led to an increase in inter-regional labour mobility but rather it has transferred labour (family labour mainly) from the former African areas to the former white highlands. It also transferred inter-tribal political competition for land into the Rift Valley Province.
A parallel process has been the increase in cash crop production in the smallholder sector in the former African areas [60]. This has been remarkable especially for tea and dairy production. This has led to seasonal labour shortages in some high potential districts and the consequent increase in migrant labour. The extent of this is hardly quantified although many people have working estimates [61].
The Africanisation of European agriculture and the growth of smallholder cash crop production in high potential areas has led to fantastic regional inequalities compared to the medium and low potential districts. These non-high potential areas can be considered as potential labour reservoirs. But given the socio-political constraints, particularly ethnicity which does not allow the migrating labour to own land (the perceived critical production variable to most of the population), there are several interrelated issues. First, it is not easy for minority tribes to get access to former white highlands, e.g. there are few Pokots in settlement schemes. Second, land in the marginal/low potential minority areas is being also bought by relatively richer migrants from high potential areas who can break the ecological parameters by utilising higher technology, e.g. Kikuyus and Kambas buying Digos and Durumas out in Kwale District. Thirdly, low potential areas are less organised [62] to have access to the political system, e.g. the number of schools, business loans to North-Eastern Province are insignificant compared to the same in Central Province or even Eastern Province. In reviewing factors such as the above one gets a feel of the impact of agriculture on access to food and nutrition.
The major social and political constraints to future food policy pertain (a) to distribution and (b) patterns of consumption.
Taking political constraints first one should note that the recent political history of Kenya shows that local large scale farmers have, as an item of their priority in accumulation, pushed up the farm gate prices of basic foodstuffs. Thus, as is clearly illustrated in maize and milk policy they get fantastic prices for their commodities. This is so since they are organised and some also control the instrumentalities of the state which initiate, debate and execute the policy. Since these commodities are distributed by statutory monopolies there is not a framework for consumers, be they urban, labour or small scale producer/consumers to force the statutory boards to change policy in their favour.
95

Another aspect of the political constraint is the regional nature of access to the political system as a factor in distribution of basic foods. Surplus maize comes essentially out of Western Province (which is relatively unimportant in national politics) and the large scale farmers in former white-highlands. If Western Province was perceived as important nationally it could be rewarded by opening its maize reserves for speculation in other regions. The large scale farmers have essentially been interested in farm gate prices to bale themselves out of the farm loans and not in trading/speculating on the grain. Thus, there has not developed a marketing system to distribute the regional surpluses to the areas of shortfall in production. These areas mainly in Eastern, Coast and North-Eastern provinces have not been able to force the political system to allow them to import the maize surplus from the regions of surplus. The same point about the relative unimportance politically of regions can be shown by looking at the sources of milk and the areas of dumping. Milk from Rift Valley and Central Province is usually processed but when Kenya Cooperative Creameries (KCC) has a surplus it is the Sotik plant which dumps rather than Naivasha or Kiganjo. Probably feeding school children with the milk may serve a more useful purpose to society whatever the politics of price support.
Social constraints operate to act as constraints on food and nutrition. They do not act independently of the political constraints but in tandem. Clearly the fact that there is no systematic research on agriculture and horticulture of traditional foods, e.g. finger millet and assorted vegetables, is a political variable. When low income families in arid areas change their consumption patterns to follow what they consider as good (ustaarabu) food, e.g. rice, maizemeal rather than finger millet, etc., then we are in the realm of social constraints, i.e. copying the consumption patterns of the elite although from a nutrition point of view mixtures of finger millet, eluisine and arrowroots etc. can be shown to be more nutritious than maize/beans mixtures. Of course when the low income groups change to ustaarabu food they also create demand on some foodstuffs which are short, e.g. rice.
The other aspect of social constraints which has perhaps received undue emphasis is the fact that some foods are not acceptable to some peoples, pork to Moslems, maizemeal to Somalis, Masais etc. This may not be as important now, as the traditional structures of food and nutrition are collapsing. Whereas a group like the Masai had a healthy balanced diet based on meat and blood (usually of small stock) as more of them are marginalised by land consolidation, and the encroachment on grazing land by commercial agricultural production (usually not controlled by the Masai) their diet patterns have become poorer and they have moved into the maize/beans pattern. International teams have made a great deal of fish and wildlife as protein sources. The evidence is conflicting on fish but the traditional fish eaters now complain that they cannot get enough since people who never used to eat it are appropriating this resource. Wildlife in the rural areas is still an important source of protein. Those who stress game cropping only pay attention to the monetisation.
96

In summary then, sociological and political marginal groups have not been able to have access to the political system and thereby insure that basic foodstuff research, production and distribution is in their favour. The political system has in its pricing mechanism, structure of agriculture and monopoly marketing insured high returns to the large-scale producers. Monetisation leads to less easily available food which to some extent is less nutritious. To break this constraint would entail fundamental reorientation on distribution of foods and a new policy on especially protein sources.
Suggestions for further work on food, population and rural development
In the course of our investigation in this area we came across several topics and subareas where we felt more investigation is required. We group these into those topics that relate to:
1. agriculture and rural development; 2. food and nutrition; 3. population and family planning; and 4. general coverage.
Agriculture and rural development
(a) There is need to assess land carrying capacity, paying special attention to dry land research and dry farming methods, optimal land use plans and strategies.
{b) Research into optimum farm size for the various ecological zones should be carried out, bearing in mind the constraints imposed by resources (natural or otherwise) and laudable objectives like regional balance, employment and equitable income distribution.
(c) Research and development (R & D) should be accelerated in the area of small farm implements for various terrains and soil texture.
{d) A comparative study of large and small farms is called for so as to assess the relative contribution of each and how 'efficiently' each can be used as an instrument to achieve various social and economic objectives.
(e) Construction of Water Balance Sheets and development possibilities should be undertaken with a view to highlighting the various sources and applications and their related dynamics.
{f) Research is needed into the 'pull' and 'push' forces of the various areas, regions and centres. Ways and means to reduce the 'potential difference' between the 'poles' are required so as to achieve a balance of job opportunities and development activities within the nation.
97
Food and nutrition
(a) There is need for research into optimum food baskets with respect to nutritional objectives and related economic and other costs.
(b) An urgent line of action is research on traditional foods such as finger millet, arrowroots, grams, eluisine (peas, njahi), etc. This would help in assessing whether to phase them in or out as farm activities.
(c) A thorough study of food habits would provide a basis for inducing diversification of food intake. Such a survey would help establish nutritional status among various communities and population groups.
(d) A plank in the food agenda should be fisheries research: the stocking and harvesting of rivers, lakes and ocean should help in boosting protein adequacy.
(e) Cases of the effects of food processing should be documented with respect to, say, maize, wheat, fruits, vegetables, etc. and, if necessary, compulsory fortification of, for example, bread with soybean or other oilseed and of salt with iodine, should be required by statute.
Population
(a) Research into the determinants of population growth in an African situation is urgently required. In particular we need to know: is there such a thing as a desired or optimum family size?
(b) More research ought to go into family planning - its desirability and its delivery programme.
General
(a) Research is required into the optimal combination of agricultural and nonagricultural activities that would achieve the multiple objectives of nutritional adequacy, employment creation, income generation, minimisation of risks, etc. Perforce, such studies would be area-bound.
(b) There is need to establish how effectively to co-ordinate the activities of the agricultural extension worker, the nutritionist and adult literacy worker in rural areas. Is it better to have several workers with different skills or all workers trained in all skills?
(c) To what extent can the price mechanism be used to discourage the consumption of some items and encourage the consumption of others?
(d) A large scale statistical survey should be undertaken to provide data on the magnitude of the unemployment problem and the distribution of income in rural areas. Parallel with this should be a census of capital assets in these areas.
(e) A relatively neglected area in the whole sphere of food, population and rural development is the differential roles of men and women. A comparative study of the two sexes should be a matter of priority. What is their roles in
98

Notes
making important and critical decisions, bearing the costs and sharing the benefits?
[1] See Table 19(a), Statistical Abstract, 1974. [2] See Statistical Abstract, 1974, pp. 42 and 43. [3] Table 59(c), Statistical Abstract, 1974, p. 63. [4] Kenya, Development Plan: 1970-74, p. 2. See also Chapter 6, pp. 168-178. [5] Kenya, Development Plan: 1974-78, p. 91. [6] Ibid., p. 197. [7] See Central Bureau of Statistics, Economic Survey 1975, pp. 5 and 86. [8] T.R. Masaya, 'Spectral Analysis of Coffee, Maize and Wheat Production in
Kenya', Working Paper No. 218, Institute for Development Studies, University of Nairobi, May 1975, p. 6.
[9] John W. Mellor, The Economics of Agricultural Development, Cornell University Press, 1969,p.37.
[10] See J.C. Likimani, 'Report on Nutrition in Kenya' (1969), and M. Bohdal, N.E. Gibbs and W .K. Simmon a, 'Nutrition Survey' (I 971 ).
[II] L. Smith, 'Food situation in Kenya, 1969-75' (mimeo). Earlier Food Balance Sheets for Kenya have been constructed by USDA (1960-61) and FAO (1964-66).
[12] IBRD, Report No. 254 (a)- KE, Annex 2. [13] B. Jones and E. Osundwa, 'Nutrition in Relation to the Distribution of
Incomes in Kenya' (mimeo, 1973). [14] See Food and Nutrition Strategy for Kenya, IDS Occasional Paper No. 14,
1975. [15] Ian Livingstone, 'Prospects for Population Limitation in Kenya: a Statistical
Evidence from Vihiga Programme', IDS Working Paper No. 214, 1975. [16] FAO, Fisheries in the food economy, Basic Study No. 19, Rome, 1968. [17] Kenya Development Plan 1974-78, pp. 226. [18] For per capita consumption data see Table 1, FAO Basic Study No. 19. [19] Sessional paper No. 4 of 1975 on Economic Prospects & Policies, Republic
of Kenya, 197 5. [20] Ibid. [21] Central Bank of Kenya, Financial and Economic Review, March 1975.
Statutorily, the Central Bank is supposed to hold foreign reserves worth at least four months' imports.
[ 22] Sessional Paper No. 4, 197 5. [23] Work has already started on the F AO/UNDP supported Marketing Develop
ment Programme -Project No. KEN 75/005, 1975. [24] See J.D. Von Piscke, 1973, 'A Survey of Major Agricultural Credit Pro
grammes and Institutions operating in Kenya', IDS, November 1973.
99
[25] See IBRD, Integrated Agricultural Development Programme Report 1975. [26] USAID, Agricultural Sector Programme Loan, 1975. [27] For rainfall patterns in Kenya, see earlier section. [28] S.H. Ominde, Land and Population Movements in Kenya, Heinemann Educa-
tional Books, 1968, p. 28. [29] Kenya, Development Plan for 1970-74, p. 2. [30] Kenya, Development Plan for 1974-78, p.l8. [31] International Labour Office, Employment, Incomes and Equality: A Strategy
for Increasing Productive Employment in Kenya, ILO: Geneva, 1972, p. 81. [32] The six ecological zones coincide with the four categories into which land is
classified earlier. Ecological zones 1 and 2 correspond to the high potential land with adequate rainfall; ecological zones 3 and 4 correspond to medium potential land, zone 5 to low potential land and zone 6 to nomadic pastoral land.
[33] See IBRD Report No. 254 (a)- KE. [34] Simon Kuznets, Economic Growth and Structure, London: Heinemann, 1966. [35] This includes large-scale farms as well as establishments of the public sector
engaged in agricultural activities. [36] Development Plan for 1974-78, table 3.3, p. 95. [37] Ibid., p. 109. [38] Albert Waters ton, 'A Viable Model for Rural Development', Finance and
Development, vol. 11, no. 4, December 1974, p. 23. The next three paragraphs rely heavily on this article.
[39] The experience gained in the SRDP roads indicates clearly that conditions exist under which large-scale employment of a local work force can be cheaper than the application of a capital-intensive technology. See Chapter 12 of the Second Overall Evaluation of the Special Rural Development Programme, IDS Occasional Paper No. 12, 1975.
[40] For an examination of the interaction between industry and agriculture, see Bruce F. Johnston, 'The Agriculture Industry Continuum'. Discussion Paper No. 215, IDS, University of Nairobi, December 1974, and also Bruce Johnston and Peter Kilby ,Agriculture and Structural Transformation, Oxford University Press, 197 5.
[41] Judith Heyer, Dunstan Ireri and Jon Moris, Rural Development in Kenya, IDS, October 1969, mimeo.
[42] Loc. cit., p. 55. [43] See L.P. Mureithi, 'Non-farm Economic Activities in Rural Areas', in Frank
Child and Mary Kempe (eds), Small-Scale Enterprise, IDS, Nairobi, Occasional Paper No.6, 1973.
[44] Kenya, Development Plan for 1974-78, p.19. [45] Kenya, Development Plan for 1974-78, p.l97. [46] See Diana Hunt, 'Methodological Issues and Selected Findings of an Analysis
of the Distribution of Wealth and Income in Mbere Division, Eastern Kenya', IDS Working Paper No. 212, March 1975;and Michael Cowen, 'Concentration
100

of Sales and Assets: Dairy Cattle and Tea in Magutu, 1964-1971 ', IDS Working Paper No. 146, 1972.
[47] ILO, Employment, Incomes and Equality. [48] Ibid., p. 77. [49] Ibid., p. 76. [50] ILO, Employment, Incomes and Equality, p. 45. [51] W. Arthur Lewis, 'Summary of a Symposium on Economic Research for the
World Employment Programme', International Labour Review, vol. 101, no. 5, May 1970, p. 551.
[52] See Michael P. Todaro, 'A Model of Labour Migration and Urban Unemployment in Less Developed Countries', American Economic Review, March 1969, pp. 138-48.
[53] Phillip M. Mbithi and Carolyn Barnes, 'Spontaneous Settlement in the Context of Rural Development in Kenya', IDS, June 1973, mimeo.
[54] For more on this, see P.M. Mbithi and B. Wisner, 'Drought and Famine in Kenya: Magnitude and attempted solutions', IDS Discussion Paper No. 144, July 1972; and George D. Gwyer, 'Trends in Kenyan Agriculture in Relation to Employment', Journal of Modem African Studies, vol. 11, no. 3, September 1973.
[55] Mbithi and Barnes, op. cit., pp. 2-3. [56] This section was ably put together by Gideon M. Mutiso of the Department
of Government, University of Nairobi. [57] There are many studies of European Agriculture. Among the best are M.P.K.
Sorrenson, Origins of European Settlement, 1968; R. Van Zwanenberg, 'Primative Colonial Accumulation in Kenya 1919-1939', D. Phil. Thesis (Sussex University), 1971.
[58] See (a) (Lawrence Report) Report of the Mission on Land Consolidation and Registration in Kenya 1965-66, Nairobi, 1966; (b) (Stamp Report) Report of the Mission appointed to advise on proposals for Further Transfer of European Farmers in Kenya, 1965 (mimeo); (c) Government of Kenya, Department of Settlement Five Year Review and Annual Report, 1969; (d) Government of Kenya Economic Surveys 1963-197 5; (e) H. Ruthernberg, Mrican Agricultural Production Development Policy in Kenya 1952-1965 (Berlin) 1966; (f) (Van Arkadie Report) Report of the Mission on Land Settlement in Kenya (mimeo) 1966, for the policy debates and figures of year to year Africanisation. See Colin Leys, Underdevelopment in Kenya, London, 1975; and G.C.M. Mutiso, Political Economy as a Constraint to Equitable Distribution, (mimeo) 1973, for details of the political impact of white highlands transfer.
[59] Colin Leys, op. cit., p. 63. [60] Ministry of Agriculture Annual Reports 1963-1975. [61] See, for example, G.D. Gwyer, 'Trends in Kenyan Agriculture in Relation to
Employment', Journal of Modem African Studies, vol. 11, no. 3, September 1973.
101

[62] M. Godfrey and G.C.M. Mutiso, Politics, Economics and Technical Training: Kenya's Institute of Science and Technology (Forthcoming) reviews the structure of inequality even in Harambee education.
102