Embed Size (px)
Citation preview
PHILIPPINE STATISTICS AUTHORITY
FOOD AVAILABILITY AND SUFFICIENCY
:

PHILIPPINE STATISTICS AUTHORITY
FOOD AVAILABILITY AND SUFFICIENCY
TERMS OF USE
Agricultural Indicators System (AIS) is a publication of the Philippine
Statistics Authority (PSA). The PSA reserves exclusive right to reproduce this publication in whatever form. Should any portion of this publication be included in a report/article, the title of the publication and the PSA should be cited as the source of the data. The PSA will not be responsible for any information derived from the processing of data contained in this publication.
ISSN-2012-0435 OCTOBER 2020
AGRICULTURAL INDICATORS SYSTEM FOOD AVAILABILITY AND SUFFICIENCY
PHILIPPINE STATISTICS AUTHORITY
DENNIS S. MAPA, Ph.D.
Undersecretary National Statistician and Civil Registrar General
SECTORAL STATISTICS OFFICE
MACROECONOMIC ACCOUNTS SERVICE
VIVIAN R. ILARINA Assistant National Statistician
AGRICULTURAL ACCOUNTS DIVISION
Maria Carol G. Duran Chief Statistical Specialist
Manuela S. Nalugon Supervising Statistical Specialist
Maria Clarinda E. De Guzman Senior Statistical Specialist
Mylene M. Evangelista Statistical Specialist II
Donita Rose S. Baluso Statistical Specialist II

PHILIPPINE STATISTICS AUTHORITY
FOREWORD
The Agricultural Indicators System (AIS) is one of the statistical indicator frameworks maintained by the Philippine Statistics Authority (PSA). As part of the continuing efforts of PSA to improve its products and services, the coverage of the AIS was reviewed to rationalize releases, merge related indicators and package these into reports with more emphasis on statistics and indicators related to the development of the agriculture sector. The AIS now comprises of eight (8) modules which will be updated and released annually. These modular reports provide measures for assessing socio-economic changes in the agriculture sector, characterizing the agrarian structure of the economy and situating agriculture in the national economy.
This is the sixth module entitled Food Availability and Sufficiency. It provides information on per capita production, per capita net food disposable and per capita supply of calories, protein and fats of selected agricultural commodities. Further, this module is supplemented with statistics on self-sufficiency ratio and import dependency ratio of selected agricultural commodities and data on rice and corn stocks. The reference years are 2015 to 2019.
The AIS aims to cover more agricultural development indicators to support the information needs of our data users. We encourage the readers to give their comments and suggestions on the improvement of the AIS, in general, and this report, in particular.
DENNIS S. MAPA, Ph.D. Undersecretary
National Statistician and Civil Registrar General
Quezon City, Philippines October 2020
i 82
This page is intentionally left blank.

PHILIPPINE STATISTICS AUTHORITY
FOOD AVAILABILITY AND SUFFICIENCY
TABLE OF CONTENTS
ii 16
This page is intentionally left blank.
FOREWORD i
LIST OF TABLES ii
FOOD AVAILABILITY AND SUFFICIENCY
Table 1. Annual per capita production index of selected
agricultural commodities, Philippines, 2015-2019 9
Table 2. Daily per capita net food disposable index of selected
agricultural commodities, Philippines, 2015-2019 10
Table 3a. Daily per capita calories supply of selected
agricultural commodities, Philippines, 2015-2019 11
Table 3b. Daily per capita protein supply of selected
agricultural commodities, Philippines, 2015-2019 12
Table 3c. Daily per capita fat supply of selected
agricultural commodities, Philippines, 2015-2019 13
Table 4a. Total annual family expenditure and percentage shares
of food in the total annual family expenditure, Philippines,
2012, 2015 and 2018 14
Table 4b. Percentage shares of food in the total annual family expenditure
by food item, Philippines, 2012, 2015 and 2018 15
Table 4c. Percentage shares of food in the total annual family expenditure
by region, Philippines, 2012, 2015 and 2018 16
Table 5. Self-sufficiency ratio (SSR) of selected
agricultural commodities, Philippines, 2015-2019 17
Table 6. Import dependency ratio (IDR) of selected
agricultural commodities, Philippines, 2015-2019 18
Table 7a. Stocks of rice: Highest and lowest levels and
percentage shares of households, commercial
warehouses and NFA, Philippines, 2015-2019 19
Table 7b. Total stock of rice by month, Philippines, 2015-2019 20
Table 8a. Stocks of corn: Highest and lowest levels and
percentage shares of households, commercial
warehouses and NFA, Philippines, 2015-2019 21
Table 8b. Total stock of corn by month, Philippines, 2015-2019 22

PHILIPPINE STATISTICS AUTHORITY
FOOD AVAILABILITY AND SUFFICIENCY
22
Month 2015 2016 2017 2018 2019
January 183.96 386.96 382.13 951.60 676.13
February 252.77 311.67 439.57 410.33 781.52
March 186.55 302.35 1,078.29 278.33 397.12
April 340.17 365.11 1,146.76 369.34 614.00
May 223.33 517.24 1,556.54 338.31 829.11
June 207.21 327.46 978.86 592.01 859.77
July 275.40 215.92 683.62 480.86 822.70
August 313.33 336.48 696.46 1,221.91 724.08
September 329.00 380.57 1,422.21 531.07 768.66
October 420.74 543.85 1,368.86 566.83 1,095.92
November 298.16 604.79 603.29 639.52 1,198.50
December 265.20 369.98 536.56 629.91 794.87
Source of basic data: Philippine Statistics Authority
Table 8b. Total stock of corn by month, Philippines, 2015-2019
(in '000 metric tons)

PHILIPPINE STATISTICS AUTHORITY
FOOD AVAILABILITY AND SUFFICIENCY
1 20
Per Capita Production
Per capita production refers to the volume of production of a particular commodity available for each member of the population. Annual per capita production index provides information on the change in the per capita production of the commodity in a given year compared to a base year. It measures the capacity of the country’s agriculture sector to produce food commodities in pace with the growth of the population.
In 2019, the annual per capita production of rice dropped to 114.69 kilograms and posted production index of 97.3 percent. This means that the per capita production of rice in 2019 was 2.7 percentage points lower than the 2018 record. In contrast, the per capita production level of corn increased to 74.37 kilograms in 2019. This was equivalent to a production index of 101.2 percent which indicates that the annual per capita production of corn in 2019 surpassed the 2018 level by 1.2 percentage points. Meanwhile, the annual per capita production of sugarcane at 193.12 kilograms, coconut at 137.62 kilograms and coffee at 0.16 kilogram were below their base year’s records. Cacao exceeded the base year’s per capita production record by 4.8 percentage points in 2019.
Among the reference fruits, mango and calamansi with corresponding per capita production of 6.88 kilograms and 1.17 kilograms in 2019 were higher than the base year’s records. Lower than the base year’s level was noted for banana, pineapple, papaya and pomelo.
In the case of vegetables and rootcrops, the 2019 per capita production levels of onion, cabbage, eggplant and ampalaya were above the base year’s records. Among the reference crops, the per capita production of onion at 2.07 kilograms in 2019 indicated the highest production index at 126.8 percent. On the other hand, declines in the 2019 per capita production levels were reported for tomato, garlic, peanut, mongo, cassava, sweet potato and potato as indicated by less than 100 percent index.
Figure 1. Annual per capita production index of selected agricultural commodities, Philippines, 2019 2018=100
(in percent)
97.3101.2 98.8
82.6
98.1104.8
96.5 99.2 102.2109.3
96.8 97.9 99.794.6
126.8
104.6100.6 100.8 98.1 97.5 95.2
98.6 97.4
Month 2015 2016 2017 2018 2019
January 2,662.05 3,198.79 2,765.12 2,289.65 2,550.70
February 2,350.60 2,942.84 2,296.32 1,795.78 2,141.23
March 2,265.51 2,674.17 2,176.20 1,697.37 2,221.42
April 2,542.68 3,359.01 2,675.55 2,182.67 2,629.03
May 3,167.25 3,689.41 3,214.18 2,909.46 2,947.42
June 3,019.42 3,235.29 2,572.94 2,360.98 2,598.34
July 2,568.19 2,733.64 2,347.90 1,990.82 2,625.25
August 2,244.38 2,103.16 2,028.00 1,520.76 2,133.84
September 1,955.50 1,775.76 1,422.84 1,168.03 1,842.37
October 2,196.18 2,286.57 1,935.87 1,589.89 2,279.73
November 3,107.30 3,302.33 2,958.73 3,000.45 2,962.46
December 3,441.41 3,338.98 2,849.37 2,718.48 3,098.01
Source of basic data: Philippine Statistics Authority
Table 7b. Total stock of rice by month, Philippines, 2015-2019
(in '000 metric tons)

PHILIPPINE STATISTICS AUTHORITY
FOOD AVAILABILITY AND SUFFICIENCY
19 2
All the reference livestock products exhibited lower per capita production estimates in 2019 as compared with the base year’s levels. Production indices of beef, carabeef, pork and chevon ranged from 96.9 percent to 97.8 percent. Among the poultry products, only duck (dressed) production with 0.21 kilogram per person in 2019 recorded lower than the base year’s level. Meanwhile, the per person production levels went up to 13.83 kilograms for chicken (dressed), 5.44 kilograms for chicken egg and 0.46 kilogram for duck egg in 2019. Their respective production indices were estimated at 103.4 percent, 107.7 percent and 104.8 percent.
For the fishery products, higher than the 2018 production levels were observed for milkfish, roundscad, shrimps and prawns, and oyster. Oyster production at 0.35 kilogram per person in 2019 posted the highest production index of 127.2 percent. This was followed by roundscad, milkfish, and shrimps and prawns with production indices of 108.8 percent, 102.2 percent and 100.0 percent, respectively. These corresponded to annual per capita production at 1.76 kilograms, 3.87 kilograms and 0.49 kilograms in 2019. In contrast, the per capita production estimates of tilapia, tuna and crabs decreased in 2019 and fell below the base year’s records (Table 1).
Daily Per Capita Net Food Disposable (NFD)
Net Food Disposable (NFD) refers to the volume of commodity available in its original (unprocessed) form for human consumption. Data on NFD are sourced from the Supply Utilization Accounts. It is the remaining balance after all the "use" parameters are taken into account. The daily net food disposable of a commodity of each member of the population measured through an index indicates the movement of food available for consumption in a specified year relative to a base year.
Source: Philippine Statistics Authority
97.6 96.9 97.6 97.8103.4
96.3
107.7 104.8 102.2108.8
98.6 98.2 100.092.1
127.2Figure 1. Annual per capita production index … (Concluded)
107.2
67.4
98.8
82.687.9 86.4
75.2
89.2
102.2109.3
95.6 97.9 99.7104.8
86.0
104.698.6 100.8 96.8 95.4 95.2 98.5 99.9
Figure 2. Daily per capita net food disposable (NFD) index of selected agricultural commodities, Philippines, 2019 2018=100 (in percent)
Item 2015 2016 2017 2018 2019
Highest
Month December May May November December
Quantity ('000 MT) 3,441.41 3,689.41 3,214.18 3,000.45 3,098.01
Percent share
Households 47.8 40.0 46.4 51.9 51.9
Commercial 28.4 28.3 45.2 44.6 32.6
NFA 23.8 31.7 8.4 3.5 15.5
Lowest
Month September September September September September
Quantity ('000 MT) 1,955.50 1,775.76 1,422.84 1,168.03 1,842.37
Percent share
Households 29.2 35.4 48.4 52.2 36.5
Commercial 29.7 29.4 47.0 38.2 41.2
NFA 41.0 35.2 4.6 9.5 22.2
Sources of basic data: Philippine Statistics Authority and National Food Authority
Table 7a. Stocks of rice: Highest and lowest levels and percentage shares of
households, commercial warehouses and NFA,
Philippines, 2015-2019
PHILIPPINE STATISTICS AUTHORITY
FOOD AVAILABILITY AND SUFFICIENCY
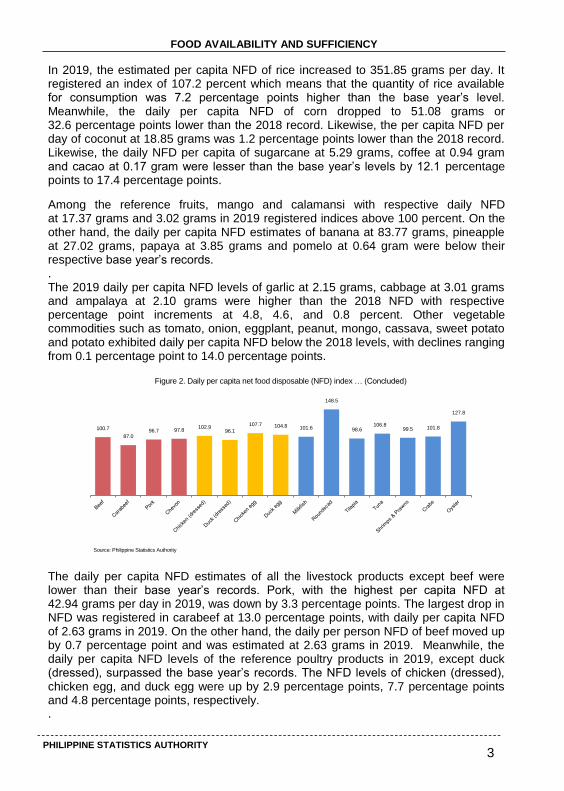
In 2019, the estimated per capita NFD of rice increased to 351.85 grams per day. It registered an index of 107.2 percent which means that the quantity of rice available for consumption was 7.2 percentage points higher than the base year’s level. Meanwhile, the daily per capita NFD of corn dropped to 51.08 grams or 32.6 percentage points lower than the 2018 record. Likewise, the per capita NFD per day of coconut at 18.85 grams was 1.2 percentage points lower than the 2018 record. Likewise, the daily NFD per capita of sugarcane at 5.29 grams, coffee at 0.94 gram and cacao at 0.17 gram were lesser than the base year’s levels by 12.1 percentage points to 17.4 percentage points.
Among the reference fruits, mango and calamansi with respective daily NFD at 17.37 grams and 3.02 grams in 2019 registered indices above 100 percent. On the other hand, the daily per capita NFD estimates of banana at 83.77 grams, pineapple at 27.02 grams, papaya at 3.85 grams and pomelo at 0.64 gram were below their respective base year’s records. . The 2019 daily per capita NFD levels of garlic at 2.15 grams, cabbage at 3.01 grams and ampalaya at 2.10 grams were higher than the 2018 NFD with respective percentage point increments at 4.8, 4.6, and 0.8 percent. Other vegetable commodities such as tomato, onion, eggplant, peanut, mongo, cassava, sweet potato and potato exhibited daily per capita NFD below the 2018 levels, with declines ranging from 0.1 percentage point to 14.0 percentage points. The daily per capita NFD estimates of all the livestock products except beef were lower than their base year’s records. Pork, with the highest per capita NFD at 42.94 grams per day in 2019, was down by 3.3 percentage points. The largest drop in NFD was registered in carabeef at 13.0 percentage points, with daily per capita NFD of 2.63 grams in 2019. On the other hand, the daily per person NFD of beef moved up by 0.7 percentage point and was estimated at 2.63 grams in 2019. Meanwhile, the daily per capita NFD levels of the reference poultry products in 2019, except duck (dressed), surpassed the base year’s records. The NFD levels of chicken (dressed), chicken egg, and duck egg were up by 2.9 percentage points, 7.7 percentage points and 4.8 percentage points, respectively.
.
3 18
100.7
87.096.7 97.8
102.996.1
107.7 104.8 101.6
148.5
98.6106.8
99.5 101.8
127.8
Figure 2. Daily per capita net food disposable (NFD) index … (Concluded)
Source: Philippine Statistics Authority
Commodity 2015 2016 2017 2018 2019
Rice 11.1 5.0 6.6 13.8 20.2
Corn 8.7 10.0 5.7 11.6 5.4
Coconut - - a/ a/ -
Sugarcane - - a/ - -
Coffee 67.0 68.1 55.7 71.0 67.6
Cacao 31.7 32.5 44.3 29.9 17.1
Calamansi - - - - -
Papaya - - - - -
Pomelo - a/ - - -
Tomato a/ - - - -
Garlic 87.1 89.1 90.0 91.4 92.2
Onion 16.0 52.6 15.6 38.5 9.6
Cabbage - a/ - - -
Eggplant - - - - -
Ampalaya - - - - -
Peanut 71.6 72.5 75.0 75.3 75.0
Mongo 47.8 47.9 50.8 51.0 50.5
Cassava - a/ - - -
Sweet potato a/ a/ a/ - a/
Potato 14.5 14.8 14.7 16.6 18.1
Beef 29.2 32.7 35.7 39.0 40.3
Carabeef 33.7 31.5 32.7 34.9 28.3
Pork 10.2 10.6 12.5 13.9 12.9
Chevon - - - - -
Chicken (dressed) 13.0 15.5 4.0 6.4 6.0
Duck (dressed) 1.0 0.9 0.6 0.7 0.6
Chicken egg - - - - -
Duck egg - - - - -
Milkfish a/ a/ 0.1 - 0.1
Roundscad 0.2 0.4 1.5 3.1 21.9
Tilapia a/ a/ 0.1 a/ a/
Tuna 22.5 21.2 22.5 24.5 27.9
Shrimps & Prawns 4.6 5.7 8.4 10.1 8.2
Crabs a/ 0.4 0.3 0.1 0.1
Oyster a/ a/ a/ a/ 0.1
Source of basic data: Philippine Statistics Authority
a/ - less than 0.01 percent
Table 6. Import dependency ratio (IDR) of selected agricultural commodities,
Philippines, 2015-2019
(in percent)
IDR = import
production + import − export
x 100%

PHILIPPINE STATISTICS AUTHORITY
FOOD AVAILABILITY AND SUFFICIENCY
17 4
Most of the reference fishery products reported higher daily per capita NFD estimates in 2019 relative to the 2018 levels. The daily per capita NFD of roundscad at 4.49 grams and oyster at 0.96 grams recorded the highest NFD indices of 148.5 percent and 127.8 percent, respectively. For milkfish, tuna and crabs, NFD indices ranged from 101.64 percent to 106.81 percent. Below the 2018 NFD levels were observed in tilapia and shrimps and prawns (Table 2).
Per Capita Supply of Calories, Protein and Fats Information on the nutrient equivalents of the different food intake measured on per capita per day basis will show the food items that contributed the highest content of calories, protein and fats. Rice continued to be the major source of calories as it supplied 1,252.59 kcal per person per day in 2019. About 182.37 kcal came from corn. Among the commercial crops, the highest daily calorie content was noted in coconut at 19.23 kcal per person. The calorie contents of sugarcane, coffee and cacao ranged from 0.44 kcal to 2.65 kcal per person daily. In the case of fruits, banana contained the biggest amount of calories at 94.13 kcal per capita per day. Pineapple and mango contributed 14.86 kcal and 12.53 kcal of daily per capita calories, respectively. For vegetables and rootcrops, greater quantities of calories were contributed by sweet potato at 15.39 kcal and peanut at 11.09 kcal. For the livestock and poultry products, pork, chicken (dressed) and chicken egg were the main sources of calories with corresponding contents of 153.36 kcal, 80.40 kcal and 19.05 kcal. Low supply of calories came from the fishery products. Tuna had bigger daily calorie content at 14.65 kcal per person (Table 3a). In 2019, the daily per capita protein supply of rice was 26.04 grams while that of corn, at 4.24 grams. Other prime sources of protein were pork at 6.51 grams and chicken (dressed) at 7.31 grams. Among the reference fishery products, tuna contributed more protein supply at 3.09 grams (Table 3b). For the fats supply, about 1.76 grams were sourced from rice and 0.77 gram came from corn in 2019. Coconut and chicken egg supplied 1.00 gram and 1.29 grams of fat contents, respectively. About 14.13 grams of fats supply were provided by pork while around 5.70 grams by chicken (dressed). Minimal quantities of less than 1.00 gram of fats were supplied by the other reference agricultural commodities (Table 3c).
Commodity 2015 2016 2017 2018 2019
Rice 88.9 95.0 93.4 86.2 79.8
Corn 91.3 90.0 94.3 88.4 94.6
Coconut 100.0 100.0 100.0 100.0 100.0
Sugarcane 100.0 100.0 100.0 100.0 100.0
Coffee 33.0 31.9 44.3 29.0 32.4
Cacao 97.5 104.9 99.8 106.6 129.3
Calamansi 100.0 100.0 100.1 100.1 100.1
Papaya 101.1 101.0 101.4 102.2 103.5
Pomelo 100.2 100.0 100.0 100.0 100.0
Tomato 100.0 100.0 100.0 100.0 100.0
Garlic 13.0 11.0 10.1 8.7 7.9
Onion 84.5 47.6 84.6 61.5 90.5
Cabbage 100.0 100.0 100.0 100.0 100.0
Eggplant 100.0 100.0 100.0 100.0 100.0
Ampalaya 100.0 100.0 100.0 100.0 100.0
Peanut 28.4 27.5 25.1 24.7 25.0
Mongo 52.2 52.2 49.2 49.0 50.0
Cassava 100.0 100.0 100.0 100.0 100.0
Sweet potato 100.0 100.0 100.0 100.0 100.1
Potato 85.5 85.2 85.3 83.4 81.9
Beef 70.8 67.3 64.3 61.0 59.7
Carabeef 66.3 68.5 67.3 65.1 71.7
Pork 89.8 89.4 87.5 86.1 87.1
Chevon 100.0 100.0 100.0 100.0 100.0
Chicken (dressed) 87.3 84.7 96.1 93.6 94.1
Duck (dressed) 99.1 99.2 99.4 99.3 99.5
Chicken egg 100.0 100.0 100.0 100.0 100.0
Duck egg 100.0 100.0 100.0 100.0 100.0
Milkfish 100.8 100.8 100.6 101.0 101.4
Roundscad 99.9 99.6 98.6 96.9 78.1
Tilapia 100.0 100.0 99.9 99.9 99.9
Tuna 81.6 83.9 83.6 81.4 76.5
Shrimps & Prawns 104.0 107.0 113.1 103.2 103.7
Crabs 121.0 127.8 140.0 128.7 116.7
Oyster 101.1 100.2 101.4 100.6 100.1
Source of basic data: Philippine Statistics Authority
Table 5. Self-sufficiency ratio (SSR) of selected agricultural commodities,
Philippines, 2015-2019
(in percent)
SSR = production
production + import - export
x 100%

PHILIPPINE STATISTICS AUTHORITY
FOOD AVAILABILITY AND SUFFICIENCY
Food Expenditure
The proportion of food expenditure to total annual family expenditure indicates the extent of the allocation of the household’s disposable income to pay for the food commodities.
As reported in the 2018 Family Income and Expenditure Survey (FIES), the total annual family expenditure of Filipinos was estimated at PhP 5.906 trillion, recording a 20.9 percent increase from the 2015 level of PhP 4.883 trillion (Table 4a).
In 2018, the share of food in the total annual family expenditures rose to 42.6 percent, from the 41.9 percent reported in 2015. Of this proportion, 33.6 percent were spent for food consumed at home while 9.0 percent were expenditures for food regularly consumed outside. Among the food items consumed at home, breads and cereals had the biggest share in food expenditures at 11.0 percent. This was followed by expenditures for meat and fish, and seafood with respective shares of 5.7 percent and 5.0 percent. The least share of 0.7 percent was recorded for oils and fats (Table 4b).
At the regional level, majority of the regions posted increasing proportions of food in the total annual family expenditures as compared with the 2015 levels. ARMM continued to record the biggest proportion of food expenditures in 2018 at 60.7 percent. About 46 to 49 percent shares were reported in Ilocos Region, Cagayan Valley, MIMAROPA Region, Bicol Region, Zamboanga Peninsula, Davao Region and SOCCSKSARGEN. In contrast, declining and least allocation for food expenditures was noted in CAR at 34.5 percent (Table 4c).
5 16
38.134.5
46.6 46.842.7
40.0
47.0 47.043.2 42.5
45.849.7
43.946.1 47.5
45.0
60.7
Figure 3. Percentage shares of food in the total annual family expenditure by region,
Philippines, 2018
Source: Philippine Statistics Authority
2012 2015 2018
Philippines 42.8 41.9 42.6
NCR 36.5 36.3 38.1
CAR 40.8 39.4 34.5
Ilocos Region 45.3 44.4 46.6
Cagayan Valley 49.4 46.9 46.8
Central Luzon 43.7 42.0 42.7
CALABARZON 40.6 39.8 40.0
MIMAROPA Region 46.4 44.4 47.0
Bicol Region 49.0 48.0 47.0
Western Visayas 44.4 45.6 43.2
Central Visayas 44.5 44.3 42.5
Eastern Visayas 45.8 44.9 45.8
Zamboanga Peninsula 49.0 48.2 49.7
Northern Mindanao 43.8 40.6 43.9
Davao Region 47.6 43.6 46.1
SOCCSKSARGEN 48.2 44.7 47.5
Caraga 47.5 45.3 45.0
ARMM 59.8 59.0 60.7
Source of data: FIES, Philippine Statistics Authority
Table 4c. Percentage shares of food in the total annual family expenditure
by region, Philippines, 2012, 2015 and 2018
RegionYear

PHILIPPINE STATISTICS AUTHORITY
FOOD AVAILABILITY AND SUFFICIENCY
In 2019, the country’s self-sufficiency ratio (SSR) of rice dropped to 79.8 percent from the previous year’s ratio of 86.2 percent. This implies that the country’s own production accounted for 79.8 percent of the domestic supply of rice. The decline in the SSR of rice was brought about by the reduced share of domestic production to the country’s supply while the share of rice imports was on the uptrend. Meanwhile, the self-sufficiency ratio of corn increased to 94.6 percent from the 2018 ratio of 88.4 percent. This can be traced from the increase in domestic production and reduction in the level of corn importation. Sufficiency in production was continuously recorded for coconut and sugarcane. SSR of cacao increased to 129.3 percent and recorded the highest ratio among the reference commodities in 2019. While coffee recorded an increasing SSR to 32.4 percent, still, domestic production remained insufficient in 2019.
Adequacies in production continued for fruits such as calamansi, papaya and pomelo. For vegetables and rootcrops, self-sufficiency was likewise achieved for tomato, cabbage, eggplant, ampalaya, cassava and sweet potato. On the other hand, the domestic production levels of garlic, peanut and mongo remained deficit with their respective SSRs recorded at 7.9 percent, 25.0 percent and 50.0 percent. Onion posted a higher SSR which went up to 90.5 percent in 2019 as compared with the 61.5 percent in 2018. of potato to 81.9 percent in 2019.
Source: Philippine Statistics Authority
Figure 4. Self-sufficiency ratio (SSR) of selected agricultural commodities, Philippines, 2019
(in percent)
79.8
94.6
100.0
100.0
32.4
129.3
100.1
103.5
100.0
100.0
7.9
90.5
100.0
100.0
100.0
25.0
50.0
100.0
100.1
81.9
59.7
71.7
87.1
100.0
94.1
99.5
100.0
100.0
101.4
78.1
99.9
76.5
103.7
116.7
100.1
Rice
Corn
Coconut
Sugarcane
Coffee
Cacao
Calamansi
Papaya
Pomelo
Tomato
Garlic
Onion
Cabbage
Eggplant
Ampalaya
Peanut
Mongo
Cassava
Sweet potato
Potato
Beef
Carabeef
Pork
Chevon
Chicken (dressed)
Duck (dressed)
Chicken egg
Duck egg
Milkfish
Roundscad
Tilapia
Tuna
Shrimps & Prawns
Crabs
Oyster
100.0 and Above Below 100.0
15 6
Self-Sufficiency Ratio
Self-sufficiency ratio (SSR) shows the magnitude of production in relation to domestic utilization. It is the extent to which a country’s supply of commodities is derived from its own domestic production. A ratio of less than 100 percent indicates inadequacy of food production to cope with the demand of the population; equal to 100 percent indicates that food production capacity of the sector is just enough to support the food needs of the population; ratio of greater than 100 percent indicates that domestic production is more than enough to support the domestic requirements. The higher the ratio, the greater the self-sufficiency.
2012 2015 2018
Food 42.8 41.9 42.6
Food consumed at home 35.3 33.7 33.6
Breads and Cereals 12.0 11.7 11.0
Meat 5.9 5.4 5.7
Fish and seafood 5.4 5.0 5.0
Milk, Cheese and Eggs 2.9 2.8 3.0
Oils and Fats 0.7 0.6 0.7
Fuits 1.3 1.2 1.3
Vegetables 2.4 2.3 2.5
Sugar, jam, honey, chocolate
and confectionary 1.0 0.9 0.8
Food products not elsewhere classified 1.0 1.0 0.9
Coffee, tea and cocoa 1.3 1.5 1.4
Mineral water, Softdrinks, Fruit and
Vegetable Juices 1.4 1.3 1.2
Food regularly consumed outside 7.5 8.2 9.0
Source of data: FIES, Philippine Statistics Authority
ItemYear
Table 4b. Percentage shares of food in the total annual family expenditure
by food item, Philippines, 2012, 2015 and 2018

PHILIPPINE STATISTICS AUTHORITY
FOOD AVAILABILITY AND SUFFICIENCY
20.2
5.4
67.6
17.1
92.2
9.6
75.0
50.5
18.1
40.3
28.3
12.9
6.0
0.6
0.1
21.9
27.9
8.2
0.1
0.1
Rice
Corn
Coffee
Cacao
Garlic
Onion
Peanut
Mongo
Potato
Beef
Carabeef
Pork
Chicken (dressed)
Duck (dressed)
Milkfish
Roundscad
Tuna
Shrimps & Prawns
Crabs
Oyster
Figure 5. Import dependency ratio (IDR) of selected agricultural commodities, Philippines, 2019
(in percent)
Source: Philippine Statistics Authority
2012 4,125,312 42.8
2015 4,882,860 41.9
2018 5,905,688 42.6
Source of data: FIES, Philippine Statistics Authority
Table 4a. Total annual family expenditure and percentage shares of
food in the total annual family expenditure,
Philippines, 2012, 2015 and 2018
Year
Total Annual Family
Expenditure
(in million pesos)
Share of Food
in the Total Annual Family
Expenditure
(in percent)
compared with the 61.5 percent in 2018. This can be attributed to the higher share of domestic production and lower volume of onion imports during the period. Lesser share of local production led to the continuous decline in the SSR of potato to 81.9 percent in 2019.
Among the livestock and poultry products, sufficiency in production was sustained for chevon, chicken egg and duck egg. In 2019, the country was almost self-sufficient for duck (dressed) at a ratio of 99.5 percent. Increases in SSRs were noted for carabeef at 71.7 percent, pork at 87.1 percent and chicken (dressed) at 94.1 percent. In contrast, SSR of beef declined to 59.7 percent in 2019.
Sufficiency in production was achieved for fishery products such as milkfish, shrimps and prawns, and oyster. Higher but declining SSR was recorded for crabs at 116.7 percent. Production remained inadequate for roundscad and tuna whose self-sufficiency ratios further slid to 78.1 percent and 76.5 percent, respectively (Table 5).
Import Dependency Ratio
Import dependency ratio (IDR) indicates the extent to which a country’s supply of commodities came from imports. A high ratio implies greater dependency on importation.
Continued importation was recorded for livestock and poultry products except for chevon, chicken egg and duck egg. Higher IDR was observed for beef which went up to 40.3 percent. In contrast, carabeef and pork registered lower and decreasing IDRs in 2019 at 28.3 percent and 12.9 percent, respectively. Dependency on imports was low for chicken (dressed) at 6.0 percent and duck (dressed) at 0.6 percent.
7 14
The country’s import dependency ratio (IDR) of rice went up to 20.2 percent in 2019. This means that 20.2 percent of the domestic supply of rice was sourced from imports. In the same year, corn recorded a reduction in importation as IDR dropped to 5.4 percent.
Higher but declining dependency on importation in 2019 was noted for coffee, peanut and mongo. Their corresponding IDRs in 2019 were estimated at 67.6 percent, 75.0 percent and 50.5 percent. Minimal importation was noted for cacao, onion and potato with IDRs at 17.1 percent, 9.6 percent and 18.1 percent, respectively. On the other hand, uptrend in importation was observed in garlic which resulted to the highest IDR among the reference commodities at 92.2 percent in 2019.

PHILIPPINE STATISTICS AUTHORITY
FOOD AVAILABILITY AND SUFFICIENCY
1,955.50(September) 1,775.76
(September)1,422.84
(September) 1,168.03(September)
1,842.37(September)
183.96(January)
215.92(July)
382.13(January)
278.33(March)
397.12(March)
2015 2016 2017 2018 2019
Rice Corn
Figure 7. Cereals inventory levels during lean months of stocking, 2015-2019
(in '000 MT)
Source: Philippine Statistics Authority and National Food Authority
13 8
Importation was minimal for most of the reference fishery products. High and increasing IDRs were noted for roundscad at 21.9 percent and tuna at 27.9 percent in 2019. Importation of shrimps and prawns declined as IDR dropped to 8.2 percent. IDRs of milkfish, crabs and oyster were recorded at 0.1 percent each (Table 6).
Cereals Stocks Information on supply condition is vital to be able to maintain food balance. The occurrence of typhoons and other calamities as well as volatile grains market structures necessitate the need to monitor stocks situation of the staple grains. This is to ensure supply and demand equilibrium, access and price stability. Information on monthly stockholdings can guide policy makers on how much and whether to export or import rice or corn in the future.
In 2019, the peak month of rice stocking was reported in December with a total volume of 3.10 million metric tons. The bulk of the rice stocks inventory came from households accounting for 51.9 percent while 32.6 percent were from commercial warehouses and the remaining 15.5 percent were stocks from the National Food Authority (NFA) holdings. In contrast, the lowest rice stocks inventory was consistently recorded in the month of September at 1.84 million metric tons. Of this total stock, 41.2 percent were held by commercial warehouses, 36.5 percent were kept by households. Stocks in NFA depositories comprised 22.2 percent (Tables 7a and 7b)
For corn, the biggest volume of stocks in 2019 was noted in November with 1.20 million metric tons. The commercial warehouses comprised 81.4 percent while households shared 18.6 percent in the total corn stocks. On the other hand, the lowest volume of corn stocks at 0.40 million metric tons was recorded in the month of March. Of this volume, 71.7 percent were in commercial holdings and 28.3 percent were stocks in the households (Tables 8a and 8b).
Figure 6. Cereals inventory levels during peak months of stocking, 2015-2019
(in '000 MT)
3,441.41 (December)
3,689.41(May)
3,214.18(May) 3,000.45
(November)
3,098.01 (December)
420.74(October)
604.79(November)
1,556.54(May) 1,221.91
(August) 1,198.50
(November)
2015 2016 2017 2018 2019
Rice Corn
Commodity 2015 2016 2017 2018 2019
Rice 1.53 1.48 1.63 1.64 1.76
Corn 0.84 0.93 0.62 1.14 0.77
Coconut 1.05 0.97 0.98 1.01 1.00
Sugarcane 0.01 0.01 0.02 0.01 0.01
Coffee a/ a/ a/ a/ a/
Cacao 0.07 0.06 0.07 0.08 0.07
Banana 0.54 0.53 0.46 0.45 0.34
Pineapple 0.06 0.05 0.06 0.06 0.05
Mango 0.09 0.08 0.07 0.07 0.07
Calamansi 0.04 0.03 0.03 0.03 0.03
Papaya 0.01 0.01 0.01 0.01 0.01
Pomelo a/ a/ a/ a/ a/
Tomato a/ a/ a/ a/ a/
Garlic 0.01 a/ 0.01 0.01 0.01
Onion 0.02 0.02 0.02 0.03 0.02
Cabbage a/ a/ a/ a/ a/
Eggplant 0.01 0.01 0.01 0.01 0.01
Amplaya 0.01 0.01 0.01 0.01 0.01
Peanut 0.68 0.66 0.76 0.76 0.74
Mongo 0.03 0.03 0.03 0.03 0.03
Cassava 0.01 0.01 0.01 0.01 0.01
Sweet potato 0.05 0.05 0.05 0.05 0.05
Potato a/ a/ a/ a/ a/
Beef 0.04 0.04 0.04 0.04 0.04
Carabeef 0.11 0.10 0.11 0.11 0.09
Pork 13.58 14.13 14.36 14.62 14.13
Chevon 0.03 0.03 0.03 0.03 0.03
Chicken (dressed) 5.59 5.72 5.21 5.54 5.70
Duck (dressed) 0.06 0.05 0.05 0.05 0.05
Chicken egg 1.04 1.06 1.12 1.20 1.29
Duck egg 0.14 0.14 0.14 0.14 0.15
Milkfish 0.44 0.44 0.45 0.42 0.43
Roundscad 0.08 0.08 0.07 0.06 0.09
Tilapia 0.31 0.29 0.30 0.31 0.30
Tuna 0.26 0.23 0.24 0.24 0.26
Shrimps & Prawns 0.02 0.02 0.01 0.02 0.02
Crabs 0.04 0.04 0.04 0.04 0.04
Oyster 0.01 0.01 0.01 0.01 0.02
a/ - less than 0.01 gram
Table 3c. Daily per capita fats supply of selected agricultural commodities,
Philippines, 2015-2019
(in grams)
Source of basic data: Philippine Food Composition Tables, Food and Nutrition Research Institute and
Philippine Statistics Authority
Source: Philippine Statistics Authority and National Food Authority

PHILIPPINE STATISTICS AUTHORITY
FOOD AVAILABILITY AND SUFFICIENCY
9 12
2015 2016 2017 2018 2019
Rice 117.91 99.1 94.7 102.6 100.0 97.3 -2.7 114.69
Corn 73.49 100.7 95.1 103.4 100.0 101.2 1.2 74.37
Coconut 139.25 104.2 96.2 96.9 100.0 98.8 -1.2 137.62
Sugarcane 233.85 96.5 92.7 120.2 100.0 82.6 -17.4 193.12
Coffee 0.16 124.9 116.9 104.5 100.0 98.1 -1.9 0.16
Cacao 0.08 78.6 80.4 89.1 100.0 104.8 4.8 0.08
Banana 88.49 101.1 97.5 99.4 100.0 96.5 -3.5 85.36
Pineapple 25.82 98.5 98.0 99.3 100.0 99.2 -0.8 25.61
Mango 6.73 132.1 117.2 105.1 100.0 102.2 2.2 6.88
Calamansi 1.07 149.2 106.7 104.3 100.0 109.3 9.3 1.17
Papaya 1.60 106.3 98.4 100.3 100.0 96.8 -3.2 1.55
Pomelo 0.25 116.5 109.6 102.7 100.0 97.9 -2.1 0.25
Tomato 2.09 101.3 97.7 100.6 100.0 99.7 -0.3 2.08
Garlic 0.07 143.5 101.2 104.1 100.0 94.6 -5.4 0.07
Onion 1.63 109.3 72.7 108.4 100.0 126.8 26.8 2.07
Cabbage 1.14 108.5 104.5 103.1 100.0 104.6 4.6 1.19
Eggplant 2.32 99.0 98.6 100.3 100.0 100.6 0.6 2.33
Ampalaya 0.83 107.1 102.5 103.9 100.0 100.8 0.8 0.83
Peanut 0.28 103.3 97.2 101.3 100.0 98.1 -1.9 0.27
Mongo 0.35 95.5 95.1 97.9 100.0 97.5 -2.5 0.34
Cassava 25.75 103.8 103.6 104.6 100.0 95.2 -4.8 24.52
Sweet potato 4.97 106.2 103.2 103.8 100.0 98.6 -1.4 4.90
Potato 1.11 105.1 101.9 101.7 100.0 97.4 -2.6 1.08
Beef 1.46 105.5 105.2 102.7 100.0 97.6 -2.4 1.42
Carabeef 0.79 103.3 103.5 102.4 100.0 96.9 -3.1 0.77
Pork 18.50 95.2 98.5 99.1 100.0 97.6 -2.4 18.05
Chevon 0.42 104.8 103.1 102.0 100.0 97.8 -2.2 0.42
Chicken (dressed) 13.37 94.2 93.4 96.5 100.0 103.4 3.4 13.83
Duck (dressed) 0.22 114.7 107.1 102.5 100.0 96.3 -3.7 0.21
Chicken egg 5.05 86.7 88.6 93.6 100.0 107.7 7.7 5.44
Duck egg 0.44 94.7 97.0 99.0 100.0 104.8 4.8 0.46
Milkfish 3.78 102.2 103.1 105.6 100.0 102.2 2.2 3.87
Roundscad 1.62 136.8 126.6 108.5 100.0 108.8 8.8 1.76
Tilapia 3.04 101.1 95.9 98.3 100.0 98.6 -1.4 2.99
Tuna 5.04 109.5 97.9 103.1 100.0 98.2 -1.8 4.95
Shrimps & Prawns 0.49 118.3 110.9 103.7 100.0 100.0 0.02 0.49
Crabs 0.53 81.2 85.6 91.9 100.0 92.1 -7.9 0.48
Oyster 0.28 74.8 72.4 81.8 100.0 127.2 27.2 0.35
1/ 2019 Index less 2018 Index, (2018=100)
Source of basic data: Philippine Statistics Authority
2019
Per Capita
Production
(kg/annum)
Percentage
Point
Difference1/
Commodity
Table 1. Annual per capita production index of selected agricultural commodities, Philippines, 2015-2019
(2018=100)
(in percent)
2018
Per Capita
Production
(kg/annum)
IndicesCommodity 2015 2016 2017 2018 2019
Rice 22.63 21.86 24.15 24.28 26.04
Corn 4.67 5.12 3.43 6.29 4.24
Coconut 0.28 0.26 0.26 0.27 0.26
Sugarcane 0.01 0.01 0.01 0.01 0.01
Coffee 0.08 0.08 0.05 0.07 0.06
Cacao 0.01 0.01 0.01 0.01 0.01
Banana 1.52 1.47 1.28 1.25 0.94
Pineapple 0.12 0.11 0.11 0.12 0.11
Mango 0.13 0.12 0.10 0.10 0.10
Calamansi 0.02 0.01 0.01 0.01 0.01
Papaya 0.03 0.02 0.02 0.02 0.02
Pomelo 0.01 0.01 a/ a/ a/
Tomato 0.04 0.03 0.04 0.04 0.04
Garlic 0.14 0.11 0.13 0.14 0.15
Onion 0.09 0.11 0.09 0.11 0.10
Cabbage 0.05 0.05 0.05 0.05 0.05
Eggplant 0.06 0.06 0.06 0.06 0.06
Ampalaya 0.02 0.02 0.02 0.02 0.02
Peanut 0.45 0.43 0.49 0.50 0.48
Mongo 0.40 0.40 0.44 0.45 0.43
Cassava 0.05 0.05 0.05 0.05 0.04
Sweet potato 0.12 0.12 0.12 0.11 0.11
Potato 0.07 0.06 0.06 0.07 0.07
Beef 0.10 0.11 0.11 0.11 0.11
Carabeef 0.67 0.64 0.65 0.66 0.57
Pork 6.26 6.51 6.62 6.73 6.51
Chevon 0.17 0.17 0.17 0.16 0.16
Chicken (dressed) 7.18 7.33 6.68 7.10 7.31
Duck (dressed) 0.16 0.15 0.14 0.14 0.13
Chicken egg 1.36 1.39 1.47 1.57 1.69
Duck egg 0.13 0.13 0.13 0.13 0.14
Milkfish 1.35 1.36 1.40 1.31 1.34
Roundscad 0.81 0.75 0.65 0.62 0.92
Tilapia 1.48 1.40 1.44 1.46 1.44
Tuna 3.15 2.71 2.87 2.89 3.09
Shrimps & Prawns 0.28 0.26 0.23 0.24 0.24
Crabs 0.13 0.13 0.13 0.15 0.15
Oyster 0.03 0.03 0.04 0.04 0.06
a/ - less than 0.01 gram
Table 3b. Daily per capita protein supply of selected agricultural commodities,
Philippines, 2015-2019
(in grams)
Source of basic data: Philippine Food Composition Tables, Food and Nutrition Research Institute and
Philippine Statistics Authority

PHILIPPINE STATISTICS AUTHORITY
FOOD AVAILABILITY AND SUFFICIENCY
11 10
2015 2016 2017 2018 2019
Rice 328.11 93.2 90.0 99.5 100.0 107.2 7.2 351.85
Corn 75.79 74.3 81.4 54.5 100.0 67.4 -32.6 51.08
Coconut 19.07 104.2 96.1 96.9 100.0 98.8 -1.2 18.85
Sugarcane 6.41 96.5 92.7 120.2 100.0 82.6 -17.4 5.29
Coffee 1.07 109.8 106.4 68.5 100.0 87.9 -12.1 0.94
Cacao 0.19 85.9 81.7 95.2 100.0 86.4 -13.6 0.17
Banana 111.41 121.8 117.8 102.8 100.0 75.2 -24.8 83.77
Pineapple 30.30 100.9 88.2 94.5 100.0 89.2 -10.8 27.02
Mango 17.00 132.7 117.3 104.8 100.0 102.2 2.2 17.37
Calamansi 2.76 149.2 106.7 104.3 100.0 109.3 9.3 3.02
Papaya 4.03 107.4 99.5 101.0 100.0 95.6 -4.4 3.85
Pomelo 0.66 116.3 109.6 102.7 100.0 97.9 -2.1 0.64
Tomato 4.46 101.3 97.7 100.6 100.0 99.7 -0.3 4.45
Garlic 2.05 96.1 79.5 89.2 100.0 104.8 4.8 2.15
Onion 6.62 79.3 93.9 78.6 100.0 86.0 -14.0 5.70
Cabbage 2.87 108.5 104.5 103.1 100.0 104.6 4.6 3.01
Eggplant 5.83 99.1 98.6 100.3 100.0 98.6 -1.4 5.75
Ampalaya 2.08 107.1 102.5 103.9 100.0 100.8 0.8 2.10
Peanut 2.86 89.6 87.1 99.6 100.0 96.8 -3.2 2.77
Mongo 1.93 89.5 89.2 97.3 100.0 95.4 -4.6 1.84
Cassava 7.05 103.8 103.7 104.7 100.0 95.2 -4.8 6.71
Sweet potato 12.89 106.2 103.2 103.8 100.0 98.5 -1.5 12.70
Potato 2.73 101.6 99.0 98.7 100.0 99.9 -0.1 2.73
Beef 5.32 91.9 97.7 98.4 100.0 100.7 0.7 5.36
Carabeef 3.02 101.3 97.8 98.6 100.0 87.0 -13.0 2.63
Pork 44.43 92.9 96.7 98.2 100.0 96.7 -3.3 42.94
Chevon 0.88 104.8 103.1 102.0 100.0 97.8 -2.2 0.86
Chicken (dressed) 39.13 101.0 103.3 94.1 100.0 102.9 2.9 40.27
Duck (dressed) 0.60 114.9 107.2 102.3 100.0 96.1 -3.9 0.58
Chicken egg 12.72 86.7 88.6 93.6 100.0 107.7 7.7 13.70
Duck egg 1.14 94.7 97.0 98.9 100.0 104.8 4.8 1.19
Milkfish 6.64 102.5 103.3 106.2 100.0 101.6 1.6 6.75
Roundscad 3.02 130.6 121.4 105.8 100.0 148.5 48.5 4.49
Tilapia 8.07 101.0 95.9 98.4 100.0 98.6 -1.4 7.96
Tuna 12.14 109.0 93.7 99.3 100.0 106.8 6.8 12.96
Shrimps & Prawns 1.28 117.4 106.9 94.4 100.0 99.5 -0.5 1.27
Crabs 1.10 86.4 86.2 84.3 100.0 101.8 1.8 1.12
Oyster 0.75 74.4 72.7 81.1 100.0 127.8 27.8 0.96
NFD- Net Food Disposable1/ 2019 Index less 2018 Index, (2018=100)
Source of basic data: Philippine Statistics Authority
2019
Per Capita
NFD
(grams/day)
Percentage
Point
Difference1/
Table 2. Daily per capita net food disposable (NFD) index of selected agricultural commodities,
Philippines, 2015-2019
(2018=100)
(in percent)
Commodity
2018
Per Capita
NFD
(grams/day)
Indices Commodity 2015 2016 2017 2018 2019
Rice 1,088.67 1,051.75 1,161.68 1,168.08 1,252.59
Corn 200.93 220.23 147.33 270.56 182.37
Coconut 20.27 18.70 18.84 19.45 19.23
Sugarcane 3.09 2.97 3.85 3.20 2.65
Coffee 0.55 0.54 0.34 0.50 0.44
Cacao 0.68 0.65 0.76 0.79 0.69
Banana 152.44 147.51 128.68 125.18 94.13
Pineapple 16.82 14.69 15.75 16.66 14.86
Mango 16.27 14.39 12.85 12.26 12.53
Calamansi 1.81 1.30 1.27 1.22 1.33
Papaya 2.30 2.13 2.16 2.14 2.04
Pomelo 0.39 0.37 0.34 0.33 0.33
Tomato 1.13 1.09 1.12 1.12 1.11
Garlic 2.54 2.10 2.36 2.64 2.77
Onion 3.15 3.73 3.12 3.97 3.42
Cabbage 0.98 0.95 0.93 0.91 0.95
Eggplant 1.68 1.67 1.70 1.69 1.67
Ampalaya 0.58 0.55 0.56 0.54 0.55
Peanut 10.26 9.98 11.41 11.46 11.09
Mongo 6.14 6.13 6.68 6.86 6.55
Cassava 10.98 10.96 11.07 10.58 10.07
Sweet potato 16.60 16.13 16.22 15.63 15.39
Potato 2.16 2.11 2.10 2.13 2.13
Beef 7.69 8.17 8.23 8.37 8.43
Carabeef 3.65 3.53 3.56 3.61 3.14
Pork 147.41 153.42 155.88 158.66 153.36
Chevon 0.93 0.92 0.91 0.89 0.87
Chicken (dressed) 78.94 80.68 73.49 78.13 80.40
Duck (dressed) 1.15 1.07 1.02 1.00 0.96
Chicken egg 15.34 15.67 16.56 17.69 19.05
Duck egg 1.90 1.95 1.99 2.01 2.11
Milkfish 9.25 9.33 9.59 9.03 9.17
Roundscad 3.95 3.67 3.20 3.02 4.49
Tilapia 8.72 8.28 8.50 8.64 8.51
Tuna 14.95 12.85 13.62 13.72 14.65
Shrimps & Prawns 1.38 1.26 1.11 1.17 1.17
Crabs 1.16 1.15 1.13 1.34 1.36
Oyster 0.33 0.33 0.36 0.45 0.57
Table 3a. Daily per capita calories supply of selected agricultural commodities,
Philippines, 2015-2019
(in kilo calories)
Source of basic data: Philipine Food Composition Tables, Food and Nutrition Research Institute and Philippine
Statistics Authority

PHILIPPINE STATISTICS AUTHORITY
FOOD AVAILABILITY AND SUFFICIENCY
9 12
2015 2016 2017 2018 2019
Rice 117.91 99.1 94.7 102.6 100.0 97.3 -2.7 114.69
Corn 73.49 100.7 95.1 103.4 100.0 101.2 1.2 74.37
Coconut 139.25 104.2 96.2 96.9 100.0 98.8 -1.2 137.62
Sugarcane 233.85 96.5 92.7 120.2 100.0 82.6 -17.4 193.12
Coffee 0.16 124.9 116.9 104.5 100.0 98.1 -1.9 0.16
Cacao 0.08 78.6 80.4 89.1 100.0 104.8 4.8 0.08
Banana 88.49 101.1 97.5 99.4 100.0 96.5 -3.5 85.36
Pineapple 25.82 98.5 98.0 99.3 100.0 99.2 -0.8 25.61
Mango 6.73 132.1 117.2 105.1 100.0 102.2 2.2 6.88
Calamansi 1.07 149.2 106.7 104.3 100.0 109.3 9.3 1.17
Papaya 1.60 106.3 98.4 100.3 100.0 96.8 -3.2 1.55
Pomelo 0.25 116.5 109.6 102.7 100.0 97.9 -2.1 0.25
Tomato 2.09 101.3 97.7 100.6 100.0 99.7 -0.3 2.08
Garlic 0.07 143.5 101.2 104.1 100.0 94.6 -5.4 0.07
Onion 1.63 109.3 72.7 108.4 100.0 126.8 26.8 2.07
Cabbage 1.14 108.5 104.5 103.1 100.0 104.6 4.6 1.19
Eggplant 2.32 99.0 98.6 100.3 100.0 100.6 0.6 2.33
Ampalaya 0.83 107.1 102.5 103.9 100.0 100.8 0.8 0.83
Peanut 0.28 103.3 97.2 101.3 100.0 98.1 -1.9 0.27
Mongo 0.35 95.5 95.1 97.9 100.0 97.5 -2.5 0.34
Cassava 25.75 103.8 103.6 104.6 100.0 95.2 -4.8 24.52
Sweet potato 4.97 106.2 103.2 103.8 100.0 98.6 -1.4 4.90
Potato 1.11 105.1 101.9 101.7 100.0 97.4 -2.6 1.08
Beef 1.46 105.5 105.2 102.7 100.0 97.6 -2.4 1.42
Carabeef 0.79 103.3 103.5 102.4 100.0 96.9 -3.1 0.77
Pork 18.50 95.2 98.5 99.1 100.0 97.6 -2.4 18.05
Chevon 0.42 104.8 103.1 102.0 100.0 97.8 -2.2 0.42
Chicken (dressed) 13.37 94.2 93.4 96.5 100.0 103.4 3.4 13.83
Duck (dressed) 0.22 114.7 107.1 102.5 100.0 96.3 -3.7 0.21
Chicken egg 5.05 86.7 88.6 93.6 100.0 107.7 7.7 5.44
Duck egg 0.44 94.7 97.0 99.0 100.0 104.8 4.8 0.46
Milkfish 3.78 102.2 103.1 105.6 100.0 102.2 2.2 3.87
Roundscad 1.62 136.8 126.6 108.5 100.0 108.8 8.8 1.76
Tilapia 3.04 101.1 95.9 98.3 100.0 98.6 -1.4 2.99
Tuna 5.04 109.5 97.9 103.1 100.0 98.2 -1.8 4.95
Shrimps & Prawns 0.49 118.3 110.9 103.7 100.0 100.0 0.02 0.49
Crabs 0.53 81.2 85.6 91.9 100.0 92.1 -7.9 0.48
Oyster 0.28 74.8 72.4 81.8 100.0 127.2 27.2 0.35
1/ 2019 Index less 2018 Index, (2018=100)
Source of basic data: Philippine Statistics Authority
2019
Per Capita
Production
(kg/annum)
Percentage
Point
Difference1/
Commodity
Table 1. Annual per capita production index of selected agricultural commodities, Philippines, 2015-2019
(2018=100)
(in percent)
2018
Per Capita
Production
(kg/annum)
IndicesCommodity 2015 2016 2017 2018 2019
Rice 22.63 21.86 24.15 24.28 26.04
Corn 4.67 5.12 3.43 6.29 4.24
Coconut 0.28 0.26 0.26 0.27 0.26
Sugarcane 0.01 0.01 0.01 0.01 0.01
Coffee 0.08 0.08 0.05 0.07 0.06
Cacao 0.01 0.01 0.01 0.01 0.01
Banana 1.52 1.47 1.28 1.25 0.94
Pineapple 0.12 0.11 0.11 0.12 0.11
Mango 0.13 0.12 0.10 0.10 0.10
Calamansi 0.02 0.01 0.01 0.01 0.01
Papaya 0.03 0.02 0.02 0.02 0.02
Pomelo 0.01 0.01 a/ a/ a/
Tomato 0.04 0.03 0.04 0.04 0.04
Garlic 0.14 0.11 0.13 0.14 0.15
Onion 0.09 0.11 0.09 0.11 0.10
Cabbage 0.05 0.05 0.05 0.05 0.05
Eggplant 0.06 0.06 0.06 0.06 0.06
Ampalaya 0.02 0.02 0.02 0.02 0.02
Peanut 0.45 0.43 0.49 0.50 0.48
Mongo 0.40 0.40 0.44 0.45 0.43
Cassava 0.05 0.05 0.05 0.05 0.04
Sweet potato 0.12 0.12 0.12 0.11 0.11
Potato 0.07 0.06 0.06 0.07 0.07
Beef 0.10 0.11 0.11 0.11 0.11
Carabeef 0.67 0.64 0.65 0.66 0.57
Pork 6.26 6.51 6.62 6.73 6.51
Chevon 0.17 0.17 0.17 0.16 0.16
Chicken (dressed) 7.18 7.33 6.68 7.10 7.31
Duck (dressed) 0.16 0.15 0.14 0.14 0.13
Chicken egg 1.36 1.39 1.47 1.57 1.69
Duck egg 0.13 0.13 0.13 0.13 0.14
Milkfish 1.35 1.36 1.40 1.31 1.34
Roundscad 0.81 0.75 0.65 0.62 0.92
Tilapia 1.48 1.40 1.44 1.46 1.44
Tuna 3.15 2.71 2.87 2.89 3.09
Shrimps & Prawns 0.28 0.26 0.23 0.24 0.24
Crabs 0.13 0.13 0.13 0.15 0.15
Oyster 0.03 0.03 0.04 0.04 0.06
a/ - less than 0.01 gram
Table 3b. Daily per capita protein supply of selected agricultural commodities,
Philippines, 2015-2019
(in grams)
Source of basic data: Philippine Food Composition Tables, Food and Nutrition Research Institute and
Philippine Statistics Authority

PHILIPPINE STATISTICS AUTHORITY
FOOD AVAILABILITY AND SUFFICIENCY
1,955.50(September) 1,775.76
(September)1,422.84
(September) 1,168.03(September)
1,842.37(September)
183.96(January)
215.92(July)
382.13(January)
278.33(March)
397.12(March)
2015 2016 2017 2018 2019
Rice Corn
Figure 7. Cereals inventory levels during lean months of stocking, 2015-2019
(in '000 MT)
Source: Philippine Statistics Authority and National Food Authority
13 8
Importation was minimal for most of the reference fishery products. High and increasing IDRs were noted for roundscad at 21.9 percent and tuna at 27.9 percent in 2019. Importation of shrimps and prawns declined as IDR dropped to 8.2 percent. IDRs of milkfish, crabs and oyster were recorded at 0.1 percent each (Table 6).
Cereals Stocks Information on supply condition is vital to be able to maintain food balance. The occurrence of typhoons and other calamities as well as volatile grains market structures necessitate the need to monitor stocks situation of the staple grains. This is to ensure supply and demand equilibrium, access and price stability. Information on monthly stockholdings can guide policy makers on how much and whether to export or import rice or corn in the future.
In 2019, the peak month of rice stocking was reported in December with a total volume of 3.10 million metric tons. The bulk of the rice stocks inventory came from households accounting for 51.9 percent while 32.6 percent were from commercial warehouses and the remaining 15.5 percent were stocks from the National Food Authority (NFA) holdings. In contrast, the lowest rice stocks inventory was consistently recorded in the month of September at 1.84 million metric tons. Of this total stock, 41.2 percent were held by commercial warehouses, 36.5 percent were kept by households. Stocks in NFA depositories comprised 22.2 percent (Tables 7a and 7b)
For corn, the biggest volume of stocks in 2019 was noted in November with 1.20 million metric tons. The commercial warehouses comprised 81.4 percent while households shared 18.6 percent in the total corn stocks. On the other hand, the lowest volume of corn stocks at 0.40 million metric tons was recorded in the month of March. Of this volume, 71.7 percent were in commercial holdings and 28.3 percent were stocks in the households (Tables 8a and 8b).
Figure 6. Cereals inventory levels during peak months of stocking, 2015-2019
(in '000 MT)
3,441.41 (December)
3,689.41(May)
3,214.18(May) 3,000.45
(November)
3,098.01 (December)
420.74(October)
604.79(November)
1,556.54(May) 1,221.91
(August) 1,198.50
(November)
2015 2016 2017 2018 2019
Rice Corn
Commodity 2015 2016 2017 2018 2019
Rice 1.53 1.48 1.63 1.64 1.76
Corn 0.84 0.93 0.62 1.14 0.77
Coconut 1.05 0.97 0.98 1.01 1.00
Sugarcane 0.01 0.01 0.02 0.01 0.01
Coffee a/ a/ a/ a/ a/
Cacao 0.07 0.06 0.07 0.08 0.07
Banana 0.54 0.53 0.46 0.45 0.34
Pineapple 0.06 0.05 0.06 0.06 0.05
Mango 0.09 0.08 0.07 0.07 0.07
Calamansi 0.04 0.03 0.03 0.03 0.03
Papaya 0.01 0.01 0.01 0.01 0.01
Pomelo a/ a/ a/ a/ a/
Tomato a/ a/ a/ a/ a/
Garlic 0.01 a/ 0.01 0.01 0.01
Onion 0.02 0.02 0.02 0.03 0.02
Cabbage a/ a/ a/ a/ a/
Eggplant 0.01 0.01 0.01 0.01 0.01
Amplaya 0.01 0.01 0.01 0.01 0.01
Peanut 0.68 0.66 0.76 0.76 0.74
Mongo 0.03 0.03 0.03 0.03 0.03
Cassava 0.01 0.01 0.01 0.01 0.01
Sweet potato 0.05 0.05 0.05 0.05 0.05
Potato a/ a/ a/ a/ a/
Beef 0.04 0.04 0.04 0.04 0.04
Carabeef 0.11 0.10 0.11 0.11 0.09
Pork 13.58 14.13 14.36 14.62 14.13
Chevon 0.03 0.03 0.03 0.03 0.03
Chicken (dressed) 5.59 5.72 5.21 5.54 5.70
Duck (dressed) 0.06 0.05 0.05 0.05 0.05
Chicken egg 1.04 1.06 1.12 1.20 1.29
Duck egg 0.14 0.14 0.14 0.14 0.15
Milkfish 0.44 0.44 0.45 0.42 0.43
Roundscad 0.08 0.08 0.07 0.06 0.09
Tilapia 0.31 0.29 0.30 0.31 0.30
Tuna 0.26 0.23 0.24 0.24 0.26
Shrimps & Prawns 0.02 0.02 0.01 0.02 0.02
Crabs 0.04 0.04 0.04 0.04 0.04
Oyster 0.01 0.01 0.01 0.01 0.02
a/ - less than 0.01 gram
Table 3c. Daily per capita fats supply of selected agricultural commodities,
Philippines, 2015-2019
(in grams)
Source of basic data: Philippine Food Composition Tables, Food and Nutrition Research Institute and
Philippine Statistics Authority
Source: Philippine Statistics Authority and National Food Authority

PHILIPPINE STATISTICS AUTHORITY
FOOD AVAILABILITY AND SUFFICIENCY
20.2
5.4
67.6
17.1
92.2
9.6
75.0
50.5
18.1
40.3
28.3
12.9
6.0
0.6
0.1
21.9
27.9
8.2
0.1
0.1
Rice
Corn
Coffee
Cacao
Garlic
Onion
Peanut
Mongo
Potato
Beef
Carabeef
Pork
Chicken (dressed)
Duck (dressed)
Milkfish
Roundscad
Tuna
Shrimps & Prawns
Crabs
Oyster
Figure 5. Import dependency ratio (IDR) of selected agricultural commodities, Philippines, 2019
(in percent)
Source: Philippine Statistics Authority
2012 4,125,312 42.8
2015 4,882,860 41.9
2018 5,905,688 42.6
Source of data: FIES, Philippine Statistics Authority
Table 4a. Total annual family expenditure and percentage shares of
food in the total annual family expenditure,
Philippines, 2012, 2015 and 2018
Year
Total Annual Family
Expenditure
(in million pesos)
Share of Food
in the Total Annual Family
Expenditure
(in percent)
compared with the 61.5 percent in 2018. This can be attributed to the higher share of domestic production and lower volume of onion imports during the period. Lesser share of local production led to the continuous decline in the SSR of potato to 81.9 percent in 2019.
Among the livestock and poultry products, sufficiency in production was sustained for chevon, chicken egg and duck egg. In 2019, the country was almost self-sufficient for duck (dressed) at a ratio of 99.5 percent. Increases in SSRs were noted for carabeef at 71.7 percent, pork at 87.1 percent and chicken (dressed) at 94.1 percent. In contrast, SSR of beef declined to 59.7 percent in 2019.
Sufficiency in production was achieved for fishery products such as milkfish, shrimps and prawns, and oyster. Higher but declining SSR was recorded for crabs at 116.7 percent. Production remained inadequate for roundscad and tuna whose self-sufficiency ratios further slid to 78.1 percent and 76.5 percent, respectively (Table 5).
Import Dependency Ratio
Import dependency ratio (IDR) indicates the extent to which a country’s supply of commodities came from imports. A high ratio implies greater dependency on importation.
Continued importation was recorded for livestock and poultry products except for chevon, chicken egg and duck egg. Higher IDR was observed for beef which went up to 40.3 percent. In contrast, carabeef and pork registered lower and decreasing IDRs in 2019 at 28.3 percent and 12.9 percent, respectively. Dependency on imports was low for chicken (dressed) at 6.0 percent and duck (dressed) at 0.6 percent.
7 14
The country’s import dependency ratio (IDR) of rice went up to 20.2 percent in 2019. This means that 20.2 percent of the domestic supply of rice was sourced from imports. In the same year, corn recorded a reduction in importation as IDR dropped to 5.4 percent.
Higher but declining dependency on importation in 2019 was noted for coffee, peanut and mongo. Their corresponding IDRs in 2019 were estimated at 67.6 percent, 75.0 percent and 50.5 percent. Minimal importation was noted for cacao, onion and potato with IDRs at 17.1 percent, 9.6 percent and 18.1 percent, respectively. On the other hand, uptrend in importation was observed in garlic which resulted to the highest IDR among the reference commodities at 92.2 percent in 2019.

PHILIPPINE STATISTICS AUTHORITY
FOOD AVAILABILITY AND SUFFICIENCY
In 2019, the country’s self-sufficiency ratio (SSR) of rice dropped to 79.8 percent from the previous year’s ratio of 86.2 percent. This implies that the country’s own production accounted for 79.8 percent of the domestic supply of rice. The decline in the SSR of rice was brought about by the reduced share of domestic production to the country’s supply while the share of rice imports was on the uptrend. Meanwhile, the self-sufficiency ratio of corn increased to 94.6 percent from the 2018 ratio of 88.4 percent. This can be traced from the increase in domestic production and reduction in the level of corn importation. Sufficiency in production was continuously recorded for coconut and sugarcane. SSR of cacao increased to 129.3 percent and recorded the highest ratio among the reference commodities in 2019. While coffee recorded an increasing SSR to 32.4 percent, still, domestic production remained insufficient in 2019.
Adequacies in production continued for fruits such as calamansi, papaya and pomelo. For vegetables and rootcrops, self-sufficiency was likewise achieved for tomato, cabbage, eggplant, ampalaya, cassava and sweet potato. On the other hand, the domestic production levels of garlic, peanut and mongo remained deficit with their respective SSRs recorded at 7.9 percent, 25.0 percent and 50.0 percent. Onion posted a higher SSR which went up to 90.5 percent in 2019 as compared with the 61.5 percent in 2018. of potato to 81.9 percent in 2019.
Source: Philippine Statistics Authority
Figure 4. Self-sufficiency ratio (SSR) of selected agricultural commodities, Philippines, 2019
(in percent)
79.8
94.6
100.0
100.0
32.4
129.3
100.1
103.5
100.0
100.0
7.9
90.5
100.0
100.0
100.0
25.0
50.0
100.0
100.1
81.9
59.7
71.7
87.1
100.0
94.1
99.5
100.0
100.0
101.4
78.1
99.9
76.5
103.7
116.7
100.1
Rice
Corn
Coconut
Sugarcane
Coffee
Cacao
Calamansi
Papaya
Pomelo
Tomato
Garlic
Onion
Cabbage
Eggplant
Ampalaya
Peanut
Mongo
Cassava
Sweet potato
Potato
Beef
Carabeef
Pork
Chevon
Chicken (dressed)
Duck (dressed)
Chicken egg
Duck egg
Milkfish
Roundscad
Tilapia
Tuna
Shrimps & Prawns
Crabs
Oyster
100.0 and Above Below 100.0
15 6
Self-Sufficiency Ratio
Self-sufficiency ratio (SSR) shows the magnitude of production in relation to domestic utilization. It is the extent to which a country’s supply of commodities is derived from its own domestic production. A ratio of less than 100 percent indicates inadequacy of food production to cope with the demand of the population; equal to 100 percent indicates that food production capacity of the sector is just enough to support the food needs of the population; ratio of greater than 100 percent indicates that domestic production is more than enough to support the domestic requirements. The higher the ratio, the greater the self-sufficiency.
2012 2015 2018
Food 42.8 41.9 42.6
Food consumed at home 35.3 33.7 33.6
Breads and Cereals 12.0 11.7 11.0
Meat 5.9 5.4 5.7
Fish and seafood 5.4 5.0 5.0
Milk, Cheese and Eggs 2.9 2.8 3.0
Oils and Fats 0.7 0.6 0.7
Fuits 1.3 1.2 1.3
Vegetables 2.4 2.3 2.5
Sugar, jam, honey, chocolate
and confectionary 1.0 0.9 0.8
Food products not elsewhere classified 1.0 1.0 0.9
Coffee, tea and cocoa 1.3 1.5 1.4
Mineral water, Softdrinks, Fruit and
Vegetable Juices 1.4 1.3 1.2
Food regularly consumed outside 7.5 8.2 9.0
Source of data: FIES, Philippine Statistics Authority
ItemYear
Table 4b. Percentage shares of food in the total annual family expenditure
by food item, Philippines, 2012, 2015 and 2018

PHILIPPINE STATISTICS AUTHORITY
FOOD AVAILABILITY AND SUFFICIENCY
Food Expenditure
The proportion of food expenditure to total annual family expenditure indicates the extent of the allocation of the household’s disposable income to pay for the food commodities.
As reported in the 2018 Family Income and Expenditure Survey (FIES), the total annual family expenditure of Filipinos was estimated at PhP 5.906 trillion, recording a 20.9 percent increase from the 2015 level of PhP 4.883 trillion (Table 4a).
In 2018, the share of food in the total annual family expenditures rose to 42.6 percent, from the 41.9 percent reported in 2015. Of this proportion, 33.6 percent were spent for food consumed at home while 9.0 percent were expenditures for food regularly consumed outside. Among the food items consumed at home, breads and cereals had the biggest share in food expenditures at 11.0 percent. This was followed by expenditures for meat and fish, and seafood with respective shares of 5.7 percent and 5.0 percent. The least share of 0.7 percent was recorded for oils and fats (Table 4b).
At the regional level, majority of the regions posted increasing proportions of food in the total annual family expenditures as compared with the 2015 levels. ARMM continued to record the biggest proportion of food expenditures in 2018 at 60.7 percent. About 46 to 49 percent shares were reported in Ilocos Region, Cagayan Valley, MIMAROPA Region, Bicol Region, Zamboanga Peninsula, Davao Region and SOCCSKSARGEN. In contrast, declining and least allocation for food expenditures was noted in CAR at 34.5 percent (Table 4c).
5 16
38.134.5
46.6 46.842.7
40.0
47.0 47.043.2 42.5
45.849.7
43.946.1 47.5
45.0
60.7
Figure 3. Percentage shares of food in the total annual family expenditure by region,
Philippines, 2018
Source: Philippine Statistics Authority
2012 2015 2018
Philippines 42.8 41.9 42.6
NCR 36.5 36.3 38.1
CAR 40.8 39.4 34.5
Ilocos Region 45.3 44.4 46.6
Cagayan Valley 49.4 46.9 46.8
Central Luzon 43.7 42.0 42.7
CALABARZON 40.6 39.8 40.0
MIMAROPA Region 46.4 44.4 47.0
Bicol Region 49.0 48.0 47.0
Western Visayas 44.4 45.6 43.2
Central Visayas 44.5 44.3 42.5
Eastern Visayas 45.8 44.9 45.8
Zamboanga Peninsula 49.0 48.2 49.7
Northern Mindanao 43.8 40.6 43.9
Davao Region 47.6 43.6 46.1
SOCCSKSARGEN 48.2 44.7 47.5
Caraga 47.5 45.3 45.0
ARMM 59.8 59.0 60.7
Source of data: FIES, Philippine Statistics Authority
Table 4c. Percentage shares of food in the total annual family expenditure
by region, Philippines, 2012, 2015 and 2018
RegionYear

PHILIPPINE STATISTICS AUTHORITY
FOOD AVAILABILITY AND SUFFICIENCY
17 4
Most of the reference fishery products reported higher daily per capita NFD estimates in 2019 relative to the 2018 levels. The daily per capita NFD of roundscad at 4.49 grams and oyster at 0.96 grams recorded the highest NFD indices of 148.5 percent and 127.8 percent, respectively. For milkfish, tuna and crabs, NFD indices ranged from 101.64 percent to 106.81 percent. Below the 2018 NFD levels were observed in tilapia and shrimps and prawns (Table 2).
Per Capita Supply of Calories, Protein and Fats Information on the nutrient equivalents of the different food intake measured on per capita per day basis will show the food items that contributed the highest content of calories, protein and fats. Rice continued to be the major source of calories as it supplied 1,252.59 kcal per person per day in 2019. About 182.37 kcal came from corn. Among the commercial crops, the highest daily calorie content was noted in coconut at 19.23 kcal per person. The calorie contents of sugarcane, coffee and cacao ranged from 0.44 kcal to 2.65 kcal per person daily. In the case of fruits, banana contained the biggest amount of calories at 94.13 kcal per capita per day. Pineapple and mango contributed 14.86 kcal and 12.53 kcal of daily per capita calories, respectively. For vegetables and rootcrops, greater quantities of calories were contributed by sweet potato at 15.39 kcal and peanut at 11.09 kcal. For the livestock and poultry products, pork, chicken (dressed) and chicken egg were the main sources of calories with corresponding contents of 153.36 kcal, 80.40 kcal and 19.05 kcal. Low supply of calories came from the fishery products. Tuna had bigger daily calorie content at 14.65 kcal per person (Table 3a). In 2019, the daily per capita protein supply of rice was 26.04 grams while that of corn, at 4.24 grams. Other prime sources of protein were pork at 6.51 grams and chicken (dressed) at 7.31 grams. Among the reference fishery products, tuna contributed more protein supply at 3.09 grams (Table 3b). For the fats supply, about 1.76 grams were sourced from rice and 0.77 gram came from corn in 2019. Coconut and chicken egg supplied 1.00 gram and 1.29 grams of fat contents, respectively. About 14.13 grams of fats supply were provided by pork while around 5.70 grams by chicken (dressed). Minimal quantities of less than 1.00 gram of fats were supplied by the other reference agricultural commodities (Table 3c).
Commodity 2015 2016 2017 2018 2019
Rice 88.9 95.0 93.4 86.2 79.8
Corn 91.3 90.0 94.3 88.4 94.6
Coconut 100.0 100.0 100.0 100.0 100.0
Sugarcane 100.0 100.0 100.0 100.0 100.0
Coffee 33.0 31.9 44.3 29.0 32.4
Cacao 97.5 104.9 99.8 106.6 129.3
Calamansi 100.0 100.0 100.1 100.1 100.1
Papaya 101.1 101.0 101.4 102.2 103.5
Pomelo 100.2 100.0 100.0 100.0 100.0
Tomato 100.0 100.0 100.0 100.0 100.0
Garlic 13.0 11.0 10.1 8.7 7.9
Onion 84.5 47.6 84.6 61.5 90.5
Cabbage 100.0 100.0 100.0 100.0 100.0
Eggplant 100.0 100.0 100.0 100.0 100.0
Ampalaya 100.0 100.0 100.0 100.0 100.0
Peanut 28.4 27.5 25.1 24.7 25.0
Mongo 52.2 52.2 49.2 49.0 50.0
Cassava 100.0 100.0 100.0 100.0 100.0
Sweet potato 100.0 100.0 100.0 100.0 100.1
Potato 85.5 85.2 85.3 83.4 81.9
Beef 70.8 67.3 64.3 61.0 59.7
Carabeef 66.3 68.5 67.3 65.1 71.7
Pork 89.8 89.4 87.5 86.1 87.1
Chevon 100.0 100.0 100.0 100.0 100.0
Chicken (dressed) 87.3 84.7 96.1 93.6 94.1
Duck (dressed) 99.1 99.2 99.4 99.3 99.5
Chicken egg 100.0 100.0 100.0 100.0 100.0
Duck egg 100.0 100.0 100.0 100.0 100.0
Milkfish 100.8 100.8 100.6 101.0 101.4
Roundscad 99.9 99.6 98.6 96.9 78.1
Tilapia 100.0 100.0 99.9 99.9 99.9
Tuna 81.6 83.9 83.6 81.4 76.5
Shrimps & Prawns 104.0 107.0 113.1 103.2 103.7
Crabs 121.0 127.8 140.0 128.7 116.7
Oyster 101.1 100.2 101.4 100.6 100.1
Source of basic data: Philippine Statistics Authority
Table 5. Self-sufficiency ratio (SSR) of selected agricultural commodities,
Philippines, 2015-2019
(in percent)
SSR = production
production + import - export
x 100%

PHILIPPINE STATISTICS AUTHORITY
FOOD AVAILABILITY AND SUFFICIENCY
In 2019, the estimated per capita NFD of rice increased to 351.85 grams per day. It registered an index of 107.2 percent which means that the quantity of rice available for consumption was 7.2 percentage points higher than the base year’s level. Meanwhile, the daily per capita NFD of corn dropped to 51.08 grams or 32.6 percentage points lower than the 2018 record. Likewise, the per capita NFD per day of coconut at 18.85 grams was 1.2 percentage points lower than the 2018 record. Likewise, the daily NFD per capita of sugarcane at 5.29 grams, coffee at 0.94 gram and cacao at 0.17 gram were lesser than the base year’s levels by 12.1 percentage points to 17.4 percentage points.
Among the reference fruits, mango and calamansi with respective daily NFD at 17.37 grams and 3.02 grams in 2019 registered indices above 100 percent. On the other hand, the daily per capita NFD estimates of banana at 83.77 grams, pineapple at 27.02 grams, papaya at 3.85 grams and pomelo at 0.64 gram were below their respective base year’s records. . The 2019 daily per capita NFD levels of garlic at 2.15 grams, cabbage at 3.01 grams and ampalaya at 2.10 grams were higher than the 2018 NFD with respective percentage point increments at 4.8, 4.6, and 0.8 percent. Other vegetable commodities such as tomato, onion, eggplant, peanut, mongo, cassava, sweet potato and potato exhibited daily per capita NFD below the 2018 levels, with declines ranging from 0.1 percentage point to 14.0 percentage points. The daily per capita NFD estimates of all the livestock products except beef were lower than their base year’s records. Pork, with the highest per capita NFD at 42.94 grams per day in 2019, was down by 3.3 percentage points. The largest drop in NFD was registered in carabeef at 13.0 percentage points, with daily per capita NFD of 2.63 grams in 2019. On the other hand, the daily per person NFD of beef moved up by 0.7 percentage point and was estimated at 2.63 grams in 2019. Meanwhile, the daily per capita NFD levels of the reference poultry products in 2019, except duck (dressed), surpassed the base year’s records. The NFD levels of chicken (dressed), chicken egg, and duck egg were up by 2.9 percentage points, 7.7 percentage points and 4.8 percentage points, respectively.
.
3 18
100.7
87.096.7 97.8
102.996.1
107.7 104.8 101.6
148.5
98.6106.8
99.5 101.8
127.8
Figure 2. Daily per capita net food disposable (NFD) index … (Concluded)
Source: Philippine Statistics Authority
Commodity 2015 2016 2017 2018 2019
Rice 11.1 5.0 6.6 13.8 20.2
Corn 8.7 10.0 5.7 11.6 5.4
Coconut - - a/ a/ -
Sugarcane - - a/ - -
Coffee 67.0 68.1 55.7 71.0 67.6
Cacao 31.7 32.5 44.3 29.9 17.1
Calamansi - - - - -
Papaya - - - - -
Pomelo - a/ - - -
Tomato a/ - - - -
Garlic 87.1 89.1 90.0 91.4 92.2
Onion 16.0 52.6 15.6 38.5 9.6
Cabbage - a/ - - -
Eggplant - - - - -
Ampalaya - - - - -
Peanut 71.6 72.5 75.0 75.3 75.0
Mongo 47.8 47.9 50.8 51.0 50.5
Cassava - a/ - - -
Sweet potato a/ a/ a/ - a/
Potato 14.5 14.8 14.7 16.6 18.1
Beef 29.2 32.7 35.7 39.0 40.3
Carabeef 33.7 31.5 32.7 34.9 28.3
Pork 10.2 10.6 12.5 13.9 12.9
Chevon - - - - -
Chicken (dressed) 13.0 15.5 4.0 6.4 6.0
Duck (dressed) 1.0 0.9 0.6 0.7 0.6
Chicken egg - - - - -
Duck egg - - - - -
Milkfish a/ a/ 0.1 - 0.1
Roundscad 0.2 0.4 1.5 3.1 21.9
Tilapia a/ a/ 0.1 a/ a/
Tuna 22.5 21.2 22.5 24.5 27.9
Shrimps & Prawns 4.6 5.7 8.4 10.1 8.2
Crabs a/ 0.4 0.3 0.1 0.1
Oyster a/ a/ a/ a/ 0.1
Source of basic data: Philippine Statistics Authority
a/ - less than 0.01 percent
Table 6. Import dependency ratio (IDR) of selected agricultural commodities,
Philippines, 2015-2019
(in percent)
IDR = import
production + import − export
x 100%

PHILIPPINE STATISTICS AUTHORITY
FOOD AVAILABILITY AND SUFFICIENCY
19 2
All the reference livestock products exhibited lower per capita production estimates in 2019 as compared with the base year’s levels. Production indices of beef, carabeef, pork and chevon ranged from 96.9 percent to 97.8 percent. Among the poultry products, only duck (dressed) production with 0.21 kilogram per person in 2019 recorded lower than the base year’s level. Meanwhile, the per person production levels went up to 13.83 kilograms for chicken (dressed), 5.44 kilograms for chicken egg and 0.46 kilogram for duck egg in 2019. Their respective production indices were estimated at 103.4 percent, 107.7 percent and 104.8 percent.
For the fishery products, higher than the 2018 production levels were observed for milkfish, roundscad, shrimps and prawns, and oyster. Oyster production at 0.35 kilogram per person in 2019 posted the highest production index of 127.2 percent. This was followed by roundscad, milkfish, and shrimps and prawns with production indices of 108.8 percent, 102.2 percent and 100.0 percent, respectively. These corresponded to annual per capita production at 1.76 kilograms, 3.87 kilograms and 0.49 kilograms in 2019. In contrast, the per capita production estimates of tilapia, tuna and crabs decreased in 2019 and fell below the base year’s records (Table 1).
Daily Per Capita Net Food Disposable (NFD)
Net Food Disposable (NFD) refers to the volume of commodity available in its original (unprocessed) form for human consumption. Data on NFD are sourced from the Supply Utilization Accounts. It is the remaining balance after all the "use" parameters are taken into account. The daily net food disposable of a commodity of each member of the population measured through an index indicates the movement of food available for consumption in a specified year relative to a base year.
Source: Philippine Statistics Authority
97.6 96.9 97.6 97.8103.4
96.3
107.7 104.8 102.2108.8
98.6 98.2 100.092.1
127.2Figure 1. Annual per capita production index … (Concluded)
107.2
67.4
98.8
82.687.9 86.4
75.2
89.2
102.2109.3
95.6 97.9 99.7104.8
86.0
104.698.6 100.8 96.8 95.4 95.2 98.5 99.9
Figure 2. Daily per capita net food disposable (NFD) index of selected agricultural commodities, Philippines, 2019 2018=100 (in percent)
Item 2015 2016 2017 2018 2019
Highest
Month December May May November December
Quantity ('000 MT) 3,441.41 3,689.41 3,214.18 3,000.45 3,098.01
Percent share
Households 47.8 40.0 46.4 51.9 51.9
Commercial 28.4 28.3 45.2 44.6 32.6
NFA 23.8 31.7 8.4 3.5 15.5
Lowest
Month September September September September September
Quantity ('000 MT) 1,955.50 1,775.76 1,422.84 1,168.03 1,842.37
Percent share
Households 29.2 35.4 48.4 52.2 36.5
Commercial 29.7 29.4 47.0 38.2 41.2
NFA 41.0 35.2 4.6 9.5 22.2
Sources of basic data: Philippine Statistics Authority and National Food Authority
Table 7a. Stocks of rice: Highest and lowest levels and percentage shares of
households, commercial warehouses and NFA,
Philippines, 2015-2019

PHILIPPINE STATISTICS AUTHORITY
FOOD AVAILABILITY AND SUFFICIENCY
1 20
Per Capita Production
Per capita production refers to the volume of production of a particular commodity available for each member of the population. Annual per capita production index provides information on the change in the per capita production of the commodity in a given year compared to a base year. It measures the capacity of the country’s agriculture sector to produce food commodities in pace with the growth of the population.
In 2019, the annual per capita production of rice dropped to 114.69 kilograms and posted production index of 97.3 percent. This means that the per capita production of rice in 2019 was 2.7 percentage points lower than the 2018 record. In contrast, the per capita production level of corn increased to 74.37 kilograms in 2019. This was equivalent to a production index of 101.2 percent which indicates that the annual per capita production of corn in 2019 surpassed the 2018 level by 1.2 percentage points. Meanwhile, the annual per capita production of sugarcane at 193.12 kilograms, coconut at 137.62 kilograms and coffee at 0.16 kilogram were below their base year’s records. Cacao exceeded the base year’s per capita production record by 4.8 percentage points in 2019.
Among the reference fruits, mango and calamansi with corresponding per capita production of 6.88 kilograms and 1.17 kilograms in 2019 were higher than the base year’s records. Lower than the base year’s level was noted for banana, pineapple, papaya and pomelo.
In the case of vegetables and rootcrops, the 2019 per capita production levels of onion, cabbage, eggplant and ampalaya were above the base year’s records. Among the reference crops, the per capita production of onion at 2.07 kilograms in 2019 indicated the highest production index at 126.8 percent. On the other hand, declines in the 2019 per capita production levels were reported for tomato, garlic, peanut, mongo, cassava, sweet potato and potato as indicated by less than 100 percent index.
Figure 1. Annual per capita production index of selected agricultural commodities, Philippines, 2019 2018=100
(in percent)
97.3101.2 98.8
82.6
98.1104.8
96.5 99.2 102.2109.3
96.8 97.9 99.794.6
126.8
104.6100.6 100.8 98.1 97.5 95.2
98.6 97.4
Month 2015 2016 2017 2018 2019
January 2,662.05 3,198.79 2,765.12 2,289.65 2,550.70
February 2,350.60 2,942.84 2,296.32 1,795.78 2,141.23
March 2,265.51 2,674.17 2,176.20 1,697.37 2,221.42
April 2,542.68 3,359.01 2,675.55 2,182.67 2,629.03
May 3,167.25 3,689.41 3,214.18 2,909.46 2,947.42
June 3,019.42 3,235.29 2,572.94 2,360.98 2,598.34
July 2,568.19 2,733.64 2,347.90 1,990.82 2,625.25
August 2,244.38 2,103.16 2,028.00 1,520.76 2,133.84
September 1,955.50 1,775.76 1,422.84 1,168.03 1,842.37
October 2,196.18 2,286.57 1,935.87 1,589.89 2,279.73
November 3,107.30 3,302.33 2,958.73 3,000.45 2,962.46
December 3,441.41 3,338.98 2,849.37 2,718.48 3,098.01
Source of basic data: Philippine Statistics Authority
Table 7b. Total stock of rice by month, Philippines, 2015-2019
(in '000 metric tons)

PHILIPPINE STATISTICS AUTHORITY
FOOD AVAILABILITY AND SUFFICIENCY
21
This page is intentionally left blank.
Item 2015 2016 2017 2018 2019
Highest
Month October November May August November
Quantity ('000 MT) 420.74 604.79 1,556.54 1,221.91 1,198.50
Percent share
Households 43.4 30.1 6.6 5.7 18.6
Commercial 56.4 69.7 93.0 94.3 81.4
NFA * 0.2 0.1 0.4 0.0 0.0
Lowest
Month January July January March March
Quantity ('000 MT) 183.96 215.92 382.13 278.33 397.12
Percent share
Households 46.2 22.0 45.8 26.0 28.3
Commercial 52.9 77.8 53.9 74.0 71.7
NFA * 0.9 0.2 0.3 0.0 0.0
Sources of basic data: Philippine Statistics Authority and National Food Authority
Table 8a. Stocks of corn: Highest and lowest levels and percentage shares of
households, commercial warehouses and NFA,
Philippines, 2015-2019
* Note: Generation of data for corn stocks of NFA warehouses has already stopped since May 2018. NFA will
no longer maintain buffer stock for corn. Hence, no data to be collected.

PHILIPPINE STATISTICS AUTHORITY
FOOD AVAILABILITY AND SUFFICIENCY
22
Month 2015 2016 2017 2018 2019
January 183.96 386.96 382.13 951.60 676.13
February 252.77 311.67 439.57 410.33 781.52
March 186.55 302.35 1,078.29 278.33 397.12
April 340.17 365.11 1,146.76 369.34 614.00
May 223.33 517.24 1,556.54 338.31 829.11
June 207.21 327.46 978.86 592.01 859.77
July 275.40 215.92 683.62 480.86 822.70
August 313.33 336.48 696.46 1,221.91 724.08
September 329.00 380.57 1,422.21 531.07 768.66
October 420.74 543.85 1,368.86 566.83 1,095.92
November 298.16 604.79 603.29 639.52 1,198.50
December 265.20 369.98 536.56 629.91 794.87
Source of basic data: Philippine Statistics Authority
Table 8b. Total stock of corn by month, Philippines, 2015-2019
(in '000 metric tons)
PHILIPPINE STATISTICS AUTHORITY
FOOD AVAILABILITY AND SUFFICIENCY
17
This page is intentionally left blank.
MODULES OF THE AGRICULTURAL INDICATORS SYSTEM
1. Government Support in Agriculture Sector
2. Economic Growth: Agriculture
3. Output and Productivity
4. Agricultural Resources
5. Agricultural Exports and Imports
6. Food Availability and Sufficiency
7. Employment and Wages in the Agriculture Sector
8. Prices and Marketing of Agricultural Commodities

PHILIPPINE STATISTICS AUTHORITY
FOOD AVAILABILITY AND SUFFICIENCY
TERMS OF USE
Agricultural Indicators System (AIS) is a publication of the Philippine
Statistics Authority (PSA). The PSA reserves exclusive right to reproduce this publication in whatever form. Should any portion of this publication be included in a report/article, the title of the publication and the PSA should be cited as the source of the data. The PSA will not be responsible for any information derived from the processing of data contained in this publication.
ISSN-2012-0435 OCTOBER 2020
AGRICULTURAL INDICATORS SYSTEM FOOD AVAILABILITY AND SUFFICIENCY
PHILIPPINE STATISTICS AUTHORITY
DENNIS S. MAPA, Ph.D.
Undersecretary National Statistician and Civil Registrar General
SECTORAL STATISTICS OFFICE
MACROECONOMIC ACCOUNTS SERVICE
VIVIAN R. ILARINA Assistant National Statistician
AGRICULTURAL ACCOUNTS DIVISION
Maria Carol G. Duran Chief Statistical Specialist
Manuela S. Nalugon Supervising Statistical Specialist
Maria Clarinda E. De Guzman Senior Statistical Specialist
Mylene M. Evangelista Statistical Specialist II
Donita Rose S. Baluso Statistical Specialist II

PHILIPPINE STATISTICS AUTHORITY
FOOD AVAILABILITY AND SUFFICIENCY
:


![[DATA SUFFICIENCY] - Solutions](https://img.pdfslide.net/doc/110x75/62019492cf1b84113b6594e5/data-sufficiency-solutions.jpg)