Embed Size (px)
Citation preview
School of something FACULTY OF OTHER ESRC Food Security Seminar Series: Newcastle 7th July 2015
Food Choice and Behaviour,
nutrition interventions and
implications for Waste
Louise Dye Professor of Nutrition & Behaviour
Human Appetite Research Unit
Institute of Psychological Sciences
University of Leeds
Louise Dye, HARU, Leeds
“Things I have learned so far”
(not quite Jacob Cohen)
• Household waste = 50% UK waste (A. Parry, Seminar 1)
• Unintended consequence of a move to healthy diet
• Most waste is unavoidable
People throw food away because: (Tom Quested Seminar 2)
• ½ not used in time
• accidents –food burned, dropped
• mechanical failure (fridge breaks)
• 1/3 cooked, prepared or served too much
•Size of jar/pack & recipes to use ingredients

Louise Dye, HARU, Leeds
“Things I have learned so
far…2
• Excess purchases
• Excess portions
• Misunderstanding labels
• Errors in food storage
• Attitudes
• Cultural norms
• Single person households
• Lower income/SES (some
food categories only)
• BOGOF – low income
appeal
• Older adults – less waste
• Knowledge of healthy diet -
less waste
Individual behaviours which drive waste and patterns in waste
generation (Matteo Vittori, Seminar 2;Sian Lewis Seminar 1)

Louise Dye, HARU, Leeds
Overview and Aims
Examine the potential for dietary interventions to
improve health and wellbeing
Who is most likely to comply & how do we
increase this
Consider what strategies are useful in achieving
compliance with interventions
examples – increasing dietary fibre
- getting kids to eat breakfast
Discuss the implications of nutritional
recommendations for waste

Louise Dye, HARU, Leeds
• 72 Low fibre consuming overweight women randomised to
• Diet A - healthy eating or
• Diet B - healthy eating with increased fibre (HF) - up to 25g/day
• Products
• Recipes
• Advice
12-week randomised controlled dietary
intervention study
Louise Dye, HARU, Leeds
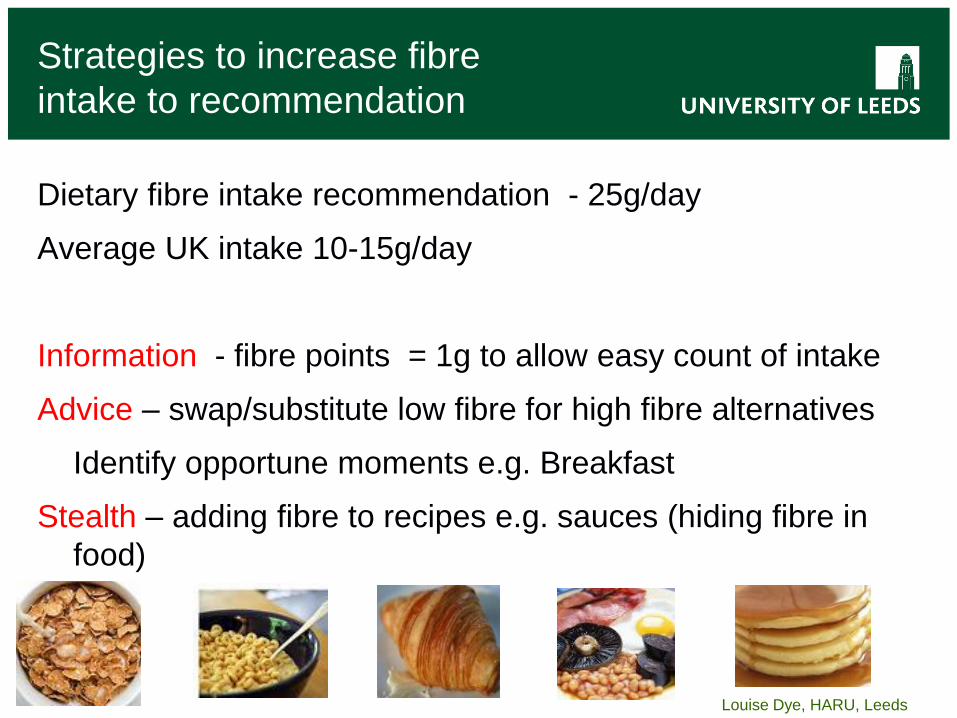
Strategies to increase fibre
intake to recommendation
Dietary fibre intake recommendation - 25g/day
Average UK intake 10-15g/day
Information - fibre points = 1g to allow easy count of intake
Advice – swap/substitute low fibre for high fibre alternatives
Identify opportune moments e.g. Breakfast
Stealth – adding fibre to recipes e.g. sauces (hiding fibre in
food)

Louise Dye, HARU, Leeds
Changes in fibre intake from baseline to week 12 (N=71)
0
5
10
15
20
25
screening week 12
Fib
re in
tak
e g
/da
y
Study phase
•DINE •LWW-DINE
10
15
20
25
30
35
1 4 7 10 13 16 19 22 25 28 31 34 37 40 43 46 49 52 55 58 61 64 67 70 73 76 79 82 85 88 91
Fib
re p
oin
ts/d
ay (
WD
B)
Intervention phase week 4 week 8
•Fibre intake (points/d) (N=35)
0
10
20
30
40
50
60
screening week 12
DIN
E s
co
re
Study phase
Fibre &Healthy
Healthy

Louise Dye, HARU, Leeds
Barriers to increasing fibre intake
• Time – to plan meals, shop and prepare
• Need for flexibility – plan B if food not available/time is short
• Requires level of skill/competence,
• hampered by lack of confidence/training
/experience of cooking
• Experimentation – waste if disliked
• Cant add fibre if cooking for family – waste
• Need to eat (and cook) separately
often families do not eat together
Louise Dye, HARU, Leeds
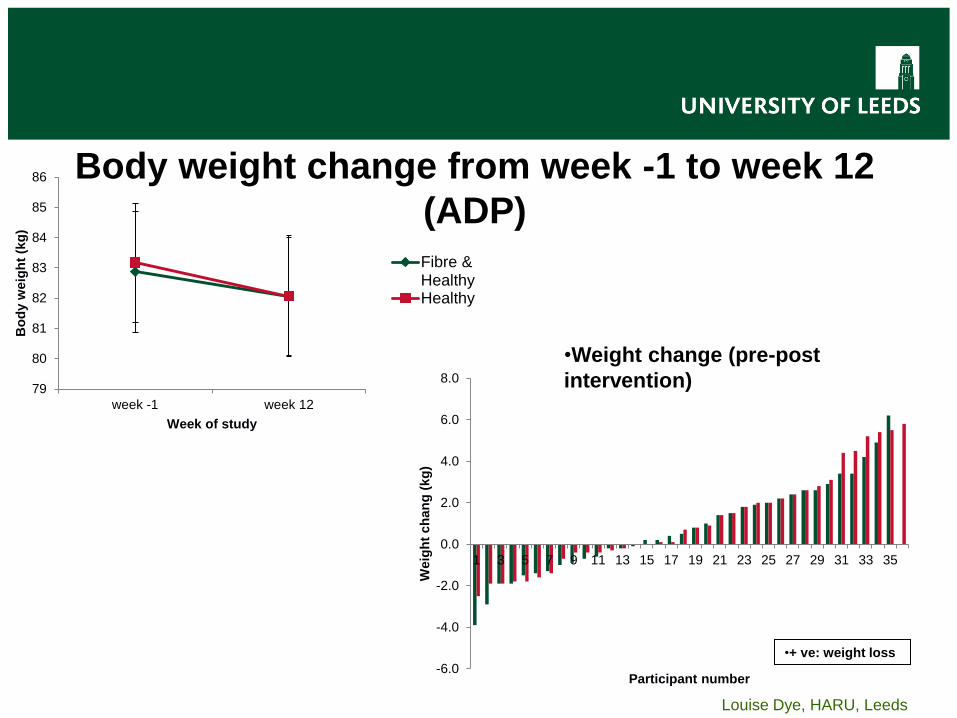
Body weight change from week -1 to week 12
(ADP)
79
80
81
82
83
84
85
86
week -1 week 12
Bo
dy w
eig
ht
(kg
)
Week of study
Fibre &HealthyHealthy
-6.0
-4.0
-2.0
0.0
2.0
4.0
6.0
8.0
1 3 5 7 9 11 13 15 17 19 21 23 25 27 29 31 33 35
Weig
ht
ch
an
g (
kg
)
Participant number
•Weight change (pre-post
intervention)
•+ ve: weight loss
Louise Dye, HARU, Leeds
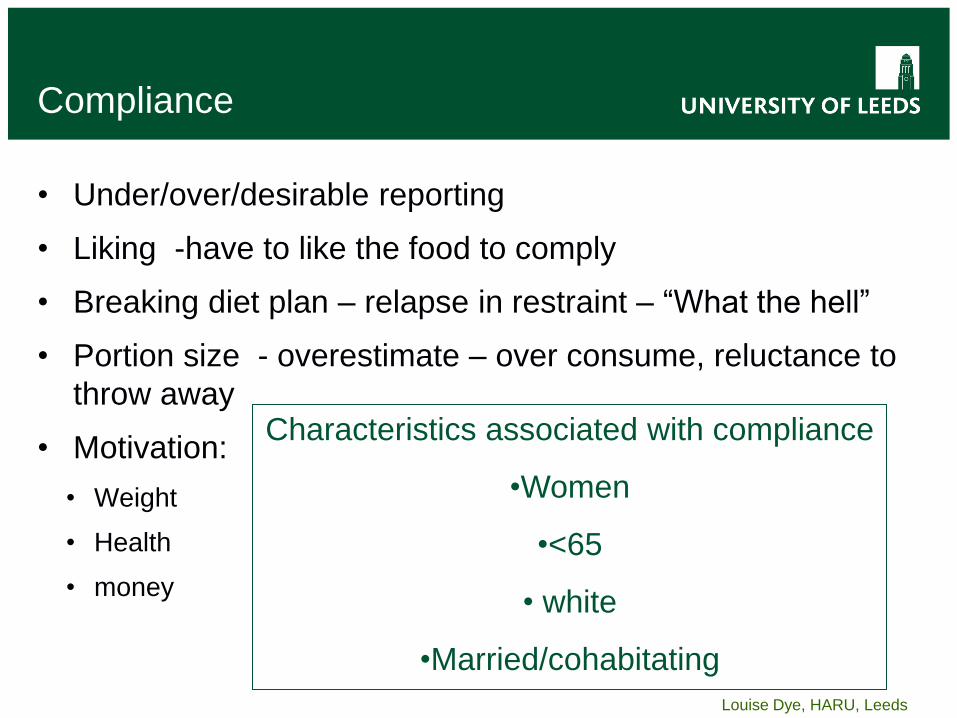
Compliance
• Under/over/desirable reporting
• Liking -have to like the food to comply
• Breaking diet plan – relapse in restraint – “What the hell”
• Portion size - overestimate – over consume, reluctance to
throw away
• Motivation:
• Weight
• Health
• money
Characteristics associated with compliance
•Women
•<65
• white
•Married/cohabitating
Louise Dye, HARU, Leeds
2.50
2.70
2.90
3.10
3.30
3.50
3.70
3.90
4.10
4.30
4.50
16.00
18.00
20.00
22.00
24.00
26.00
28.00
30.00
32.00
1 3 5 7 9 11 13 15 17 19 21 23 25 27 29 31 33 35 37 39 41 43 45 47 49 51 53 55 57 59 61 63 65 67 69 71 73 75 77 79 81 83
BS
FS
Rati
ng
Fib
re I
nta
ke
Day
_ Fibre points Stool Type Diet B Stool Type Diet A
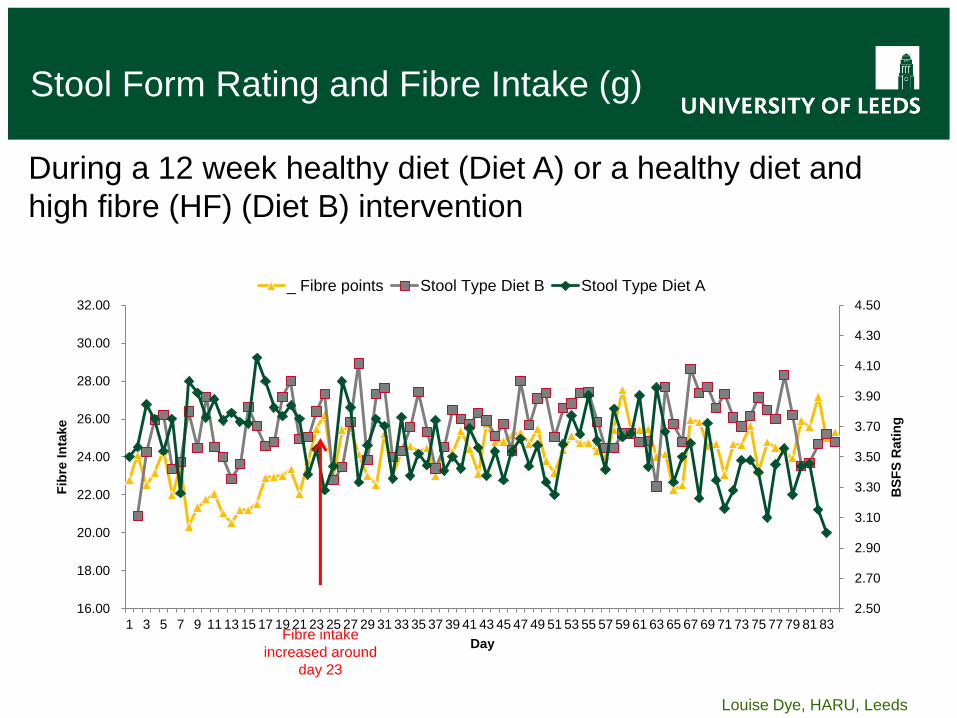
Stool Form Rating and Fibre Intake (g)
During a 12 week healthy diet (Diet A) or a healthy diet and
high fibre (HF) (Diet B) intervention
Fibre intake
increased around
day 23
Louise Dye, HARU, Leeds
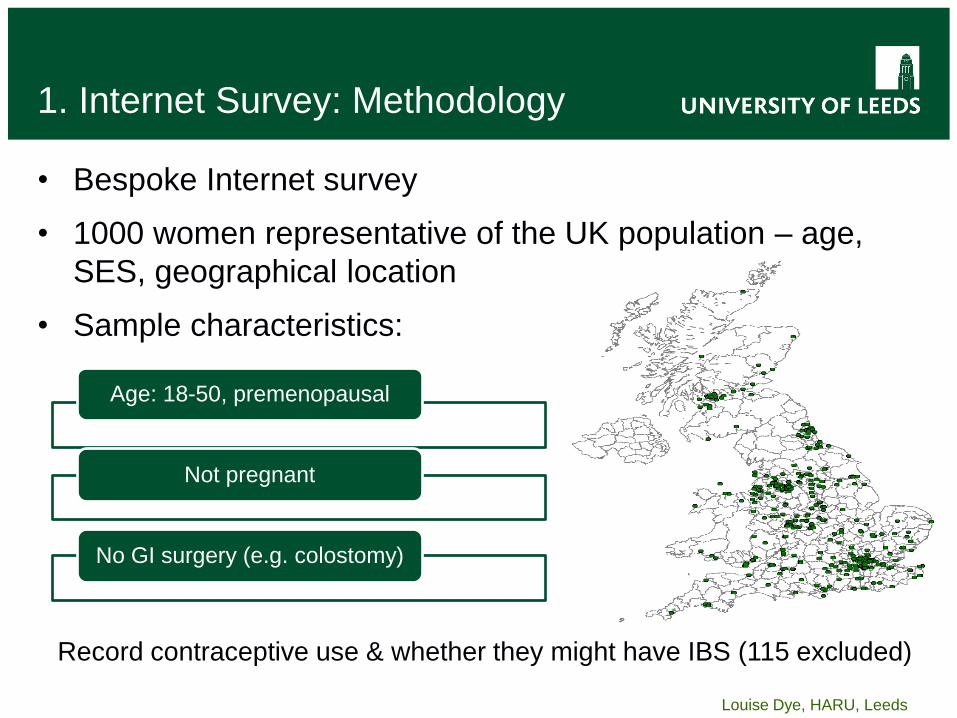
1. Internet Survey: Methodology
• Bespoke Internet survey
• 1000 women representative of the UK population – age,
SES, geographical location
• Sample characteristics:
Record contraceptive use & whether they might have IBS (115 excluded)
Age: 18-50, premenopausal
Not pregnant
No GI surgery (e.g. colostomy)
Louise Dye, HARU, Leeds
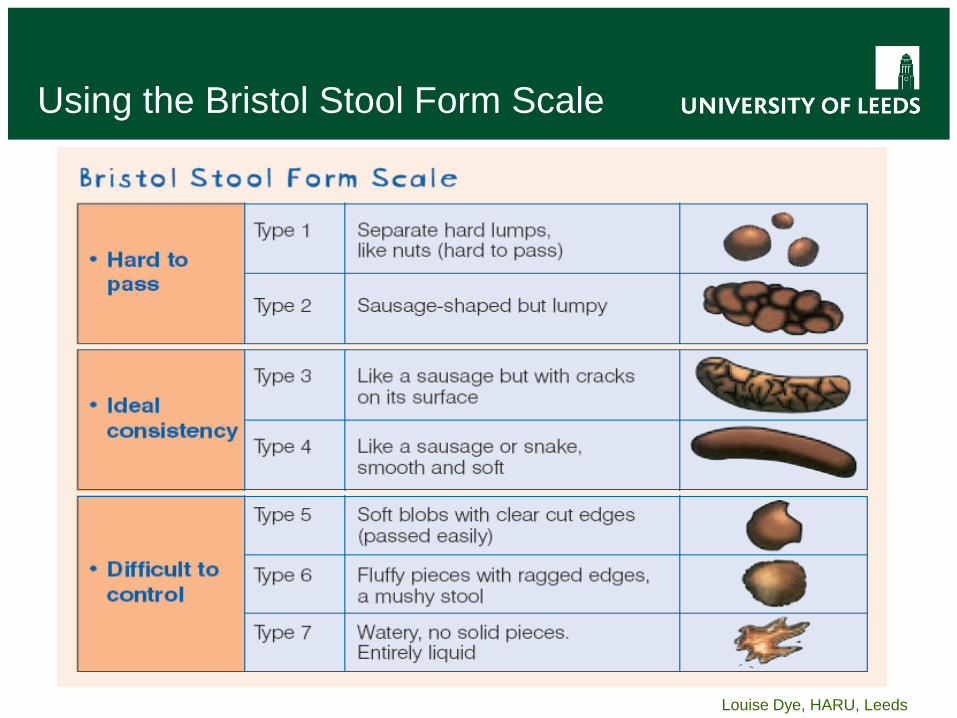
Using the Bristol Stool Form Scale

Louise Dye, HARU, Leeds
RATING OF STOOL FORM DURING THE CYCLE
(BRISTOL STOOL FORM SCALE)
FOR EACH INDIVIDUAL
•Persistent
•diarrhoea
•Persistent
•constipation
•Consistently
•normal (4)
Louise Dye, HARU, Leeds
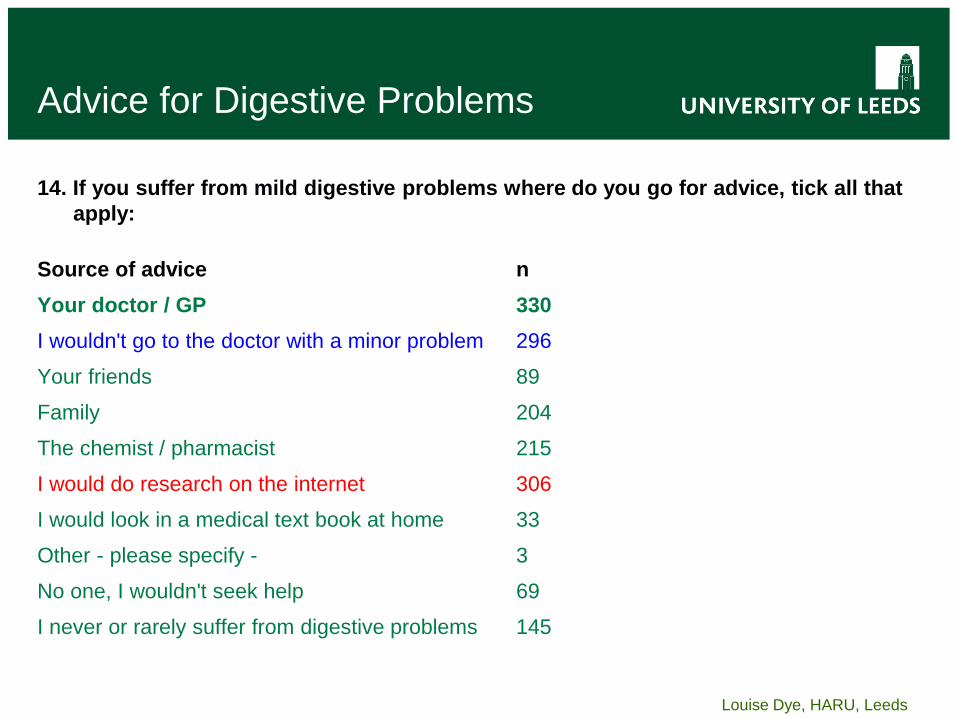
Advice for Digestive Problems
14. If you suffer from mild digestive problems where do you go for advice, tick all that
apply:
Source of advice n
Your doctor / GP 330
I wouldn't go to the doctor with a minor problem 296
Your friends 89
Family 204
The chemist / pharmacist 215
I would do research on the internet 306
I would look in a medical text book at home 33
Other - please specify - 3
No one, I wouldn't seek help 69
I never or rarely suffer from digestive problems 145

Louise Dye, HARU, Leeds
The Cost of Constipation
Schmier et al. (2015)
Economic analysis - medical cost saving based on
• Prevalence of functional constipation (men, women)
• Proportion of population not meeting recommended dietary fibre
recommendations
Assumes that 25% of adults make no change in fibre intake,
25% increase intake by 3g/day, 15% increase intake by 4g/day,
25% increase intake by 5 g/day, 10% increase intake by 11g/day.
Annual cost savings £127m in the United Kingdom

Louise Dye, HARU, Leeds
Implications for behaviour
change messages
What types of foods would individuals consume to obtain
additional dietary fibre in their diets?
Little additional cost to increased fibre consumption - Many
foods are available in conventional and fibre enriched
versions for comparable price
No data showing that fibre-rich foods are more expensive than
lower-fibre foods
Simple, small-step substitutions possible without affecting
caloric intake - intakes of total energy & saturated fat
may decrease, & other dietary components found in fibre-
rich foods may increase
Unintended health & economic consequences of modifying
fibre intake

Louise Dye, HARU, Leeds

Louise Dye, HARU, Leeds
School breakfast programs
Breakfast consumption
• helps to ensure nutritional
adequacy in school-aged children
• associated with better nutritional
profiles cf children who habitually
skip breakfast
Breakfast skipping is associated with:
• Increased levels of snack food consumption
• increased likelihood of being overweight or obese
•Defeyter, Graham, Walton & Apicella (2010) Nutr Bull, 35, 245–253
Louise Dye, HARU, Leeds
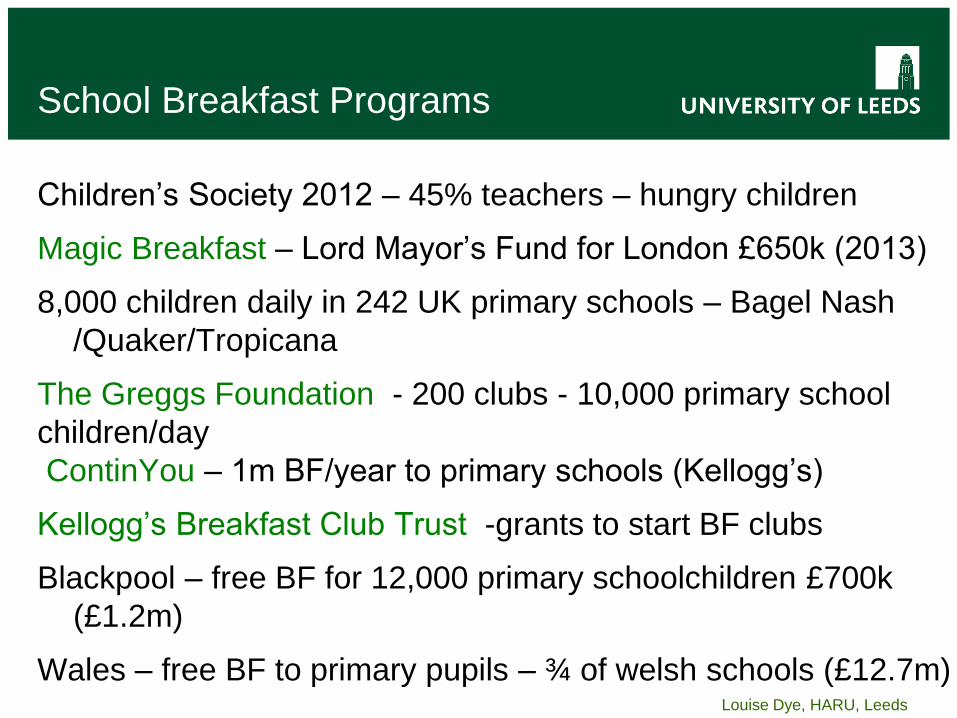
School Breakfast Programs
Children’s Society 2012 – 45% teachers – hungry children
Magic Breakfast – Lord Mayor’s Fund for London £650k (2013)
8,000 children daily in 242 UK primary schools – Bagel Nash
/Quaker/Tropicana
The Greggs Foundation - 200 clubs - 10,000 primary school
children/day
ContinYou – 1m BF/year to primary schools (Kellogg’s)
Kellogg’s Breakfast Club Trust -grants to start BF clubs
Blackpool – free BF for 12,000 primary schoolchildren £700k
(£1.2m)
Wales – free BF to primary pupils – ¾ of welsh schools (£12.7m)

Louise Dye, HARU, Leeds
Louise Dye, HARU, Leeds
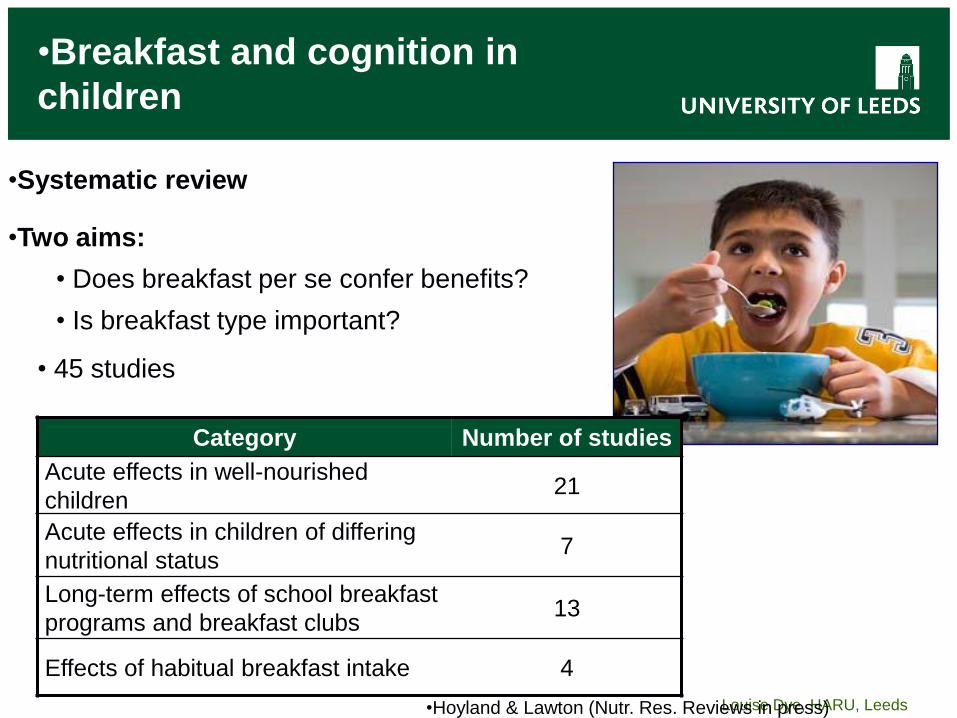
•Breakfast and cognition in
children
•Systematic review
•Two aims:
• Does breakfast per se confer benefits?
• Is breakfast type important?
•Hoyland & Lawton (Nutr. Res. Reviews in press)
• 45 studies
Category Number of studies
Acute effects in well-nourished
children 21
Acute effects in children of differing
nutritional status 7
Long-term effects of school breakfast
programs and breakfast clubs 13
Effects of habitual breakfast intake 4
Louise Dye, HARU, Leeds
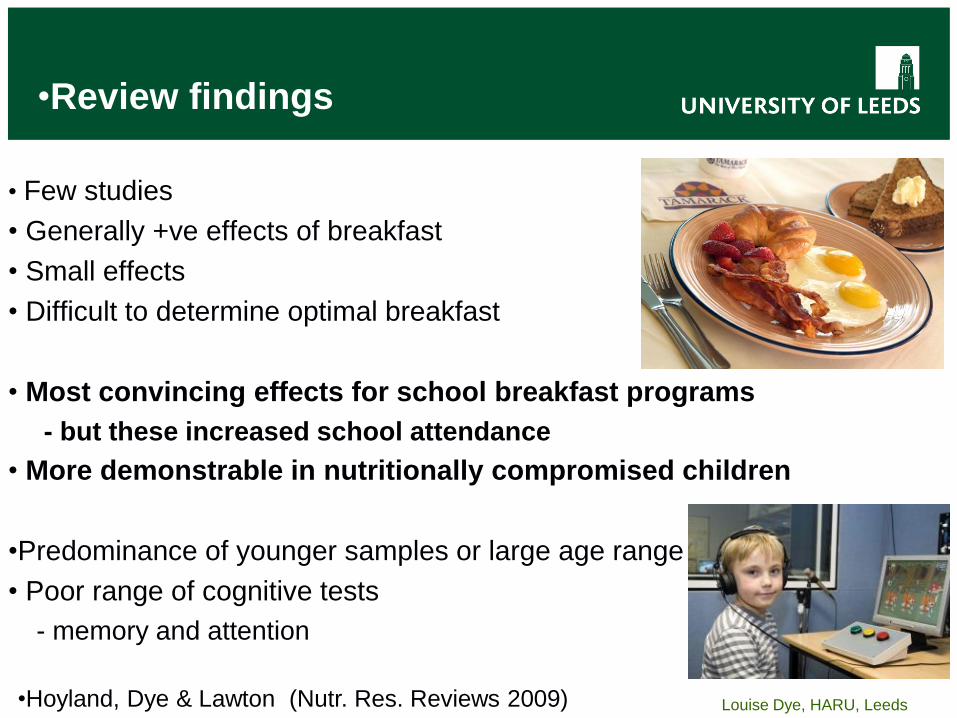
• Few studies
• Generally +ve effects of breakfast
• Small effects
• Difficult to determine optimal breakfast
• Most convincing effects for school breakfast programs
- but these increased school attendance
• More demonstrable in nutritionally compromised children
•Predominance of younger samples or large age range
• Poor range of cognitive tests
- memory and attention
•Review findings
•Hoyland, Dye & Lawton (Nutr. Res. Reviews 2009)
Louise Dye, HARU, Leeds
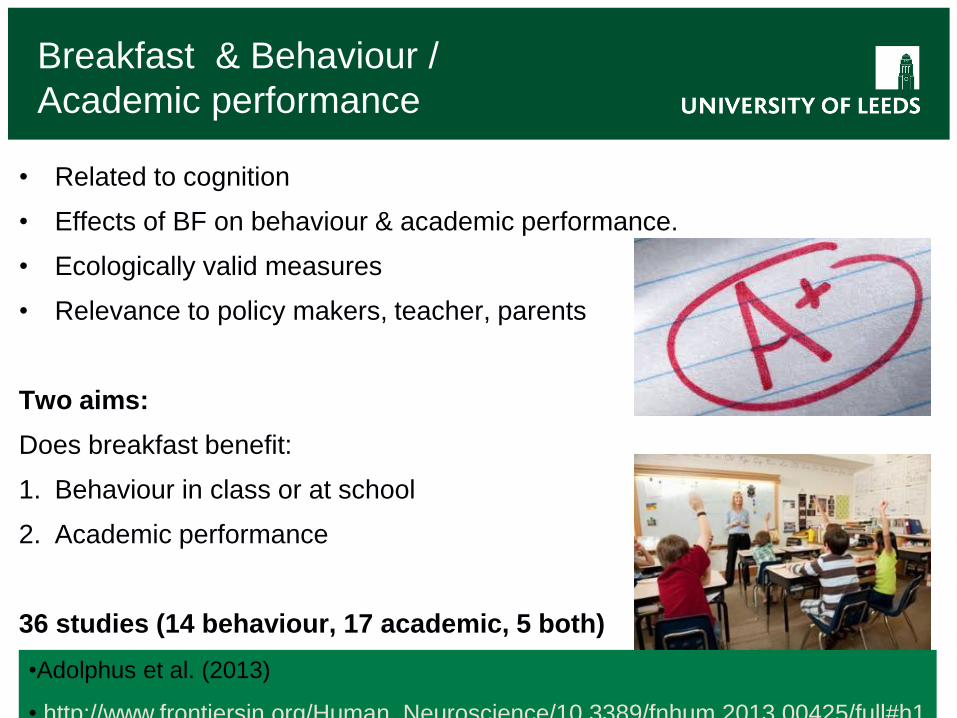
Breakfast & Behaviour /
Academic performance
• Related to cognition
• Effects of BF on behaviour & academic performance.
• Ecologically valid measures
• Relevance to policy makers, teacher, parents
Two aims:
Does breakfast benefit:
1. Behaviour in class or at school
2. Academic performance
36 studies (14 behaviour, 17 academic, 5 both)
•Adolphus et al. (2013)
• http://www.frontiersin.org/Human_Neuroscience/10.3389/fnhum.2013.00425/full#h1

Louise Dye, HARU, Leeds
Results: Behaviour
19 studies
Measures: Classroom observations or teacher rating scale
Design: Mostly acute or SBP, few habitual.
Findings:
• Mixed with +tive effects for on-task classroom behaviour
• Less consistent – distractible, hyperactive & disruptive behaviour
• Effects in:
Well & undernourished
Low SES & more affluent
Young children <13 years
Measure* Studies Sig effects
Classroom
observations: Live or
filmed
11 7
Teacher rating scales
and questionnaire 12 6
•Adolphus, K., Lawton, C. L., & Dye, L. (2013) Frontiers in Human Neuroscience

Louise Dye, HARU, Leeds
Results: Academic performance
22 studies
Measures: Average school grades and standardised achievement tests
Design: Mostly cross-sectional (habitual) and SBP - longer term effects
Findings:
• Consistent - habitual breakfast (frequency and quality) & SBPs
+tive effects on academic performance
• Maths and arithmetic
• Effects:
Clearest in undernourished
Low SES and more affluent
Children and adolescents
Adolphus, K., Lawton, C. L., & Dye, L. (2013) Frontiers in Human Neuroscience.
Measure Studies Sig effects
School grades 10 10
Standardised
achievement tests 12 10

Louise Dye, HARU, Leeds
Are we reaching the right
people?
Breakfast studies of children:
younger (<13years)
middle class
normal weight
higher IQ than average
School based studies
SES related
opt out not in
parental disengagement
Louise Dye, HARU, Leeds
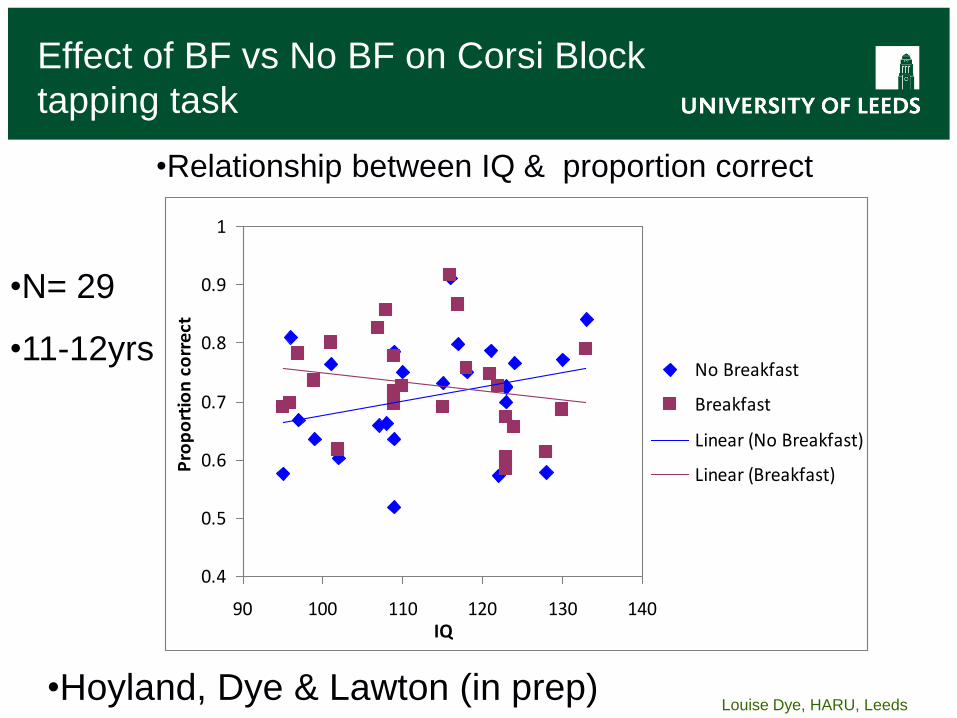
Effect of BF vs No BF on Corsi Block
tapping task
0.4
0.5
0.6
0.7
0.8
0.9
1
90 100 110 120 130 140IQ
Pro
po
rtio
n c
orr
ect
No Breakfast
Breakfast
Linear (No Breakfast)
Linear (Breakfast)
•Relationship between IQ & proportion correct
•Hoyland, Dye & Lawton (in prep)
•N= 29
•11-12yrs

Louise Dye, HARU, Leeds
Devore et al (2012) Nurses Health Study
•prevention of
•cognitive aging
•ABILITY
•infant •child •adult •elderly
16010 women aged 70+
Follow up – 2yr intervals
Greater intake of
&
Slower rate of cognitive decline
(6 cognitive tests)
Health promotion
initiatives tend to be more
readily adopted by people
with higher SES

Louise Dye, HARU, Leeds
Nutritional strategies
•Increase understanding
•Substitution
•Improve palatability
•Increase availability
•& exposure esp children
• Form good habits early
implications for waste?
Louise Dye, HARU, Leeds
Takeway messages
Behaviours that influence food
choice and waste
• planning,
• buying,
• storing,
• preparing,
• exposure to foods (try out)
• skills
Features of the Message
•Understandable
•Easy to implement
•Complementary not
contradictory
•Informative - build
knowledge & skills
•No unintended
consequences

Louise Dye, HARU, Leeds
Prompt intention/ goal formation 27 (67.5%)
Provide feedback on performance 26 (67.5%)
Provide instruction 26 (67.5%)
Provide information on consequences 16 (40%)
Provide information on health-behaviour link 14 (35%)
Prompt self-monitoring of behaviour 13 (32.5%)
Set graded tasks 11 (27.5%)
Provide general encouragement 11 (27.5%)
Prompt barrier identification 10 (25%)
Teach to use prompts and cues 10 (25%)
Use of Techniques in 40 HE Interventions II
Michie & Abraham (2009)
Technique No of interventions using technique

Louise Dye, HARU, Leeds
The Yellow Label Diet

Louise Dye, HARU, Leeds
My food waste disposal unit

School of something FACULTY OF OTHER
Disclosures
The internet survey was supported by a grant from Kellogg’s Sales and Marketing UK to L Dye.
Schnell performed statistical analysis and acted as consultant.
Leeds Women’s Wellbeing Study was supported by a grant from Kellogg’s Sales and Marketing UK to L Dye & C Lawton.
Thank you

Louise Dye, HARU, Leeds
Strategies to Manage Digestive
Problems
Daily Weekly Monthly Yearly Never
Laxatives 18 23 40 69 815
Fibre Gel 9 12 20 29 919
Stool Softeners 9 7 22 24 923
Anti Diarrhoea 6 16 30 100 798
Milk of Magnesia 4 7 24 24 929
Pain Killers 18 32 88 37 802
Fibre Supplements 32 68 44 22 810
Pharmaceutical Strategies:
High Fibre Breakfast Cereal 168 162 95 21 532
Probiotics 78 81 65 28 710
Peppermint Tea 30 61 54 23 809
Aloe Vera 11 12 27 26 914
High Fibre Fruit/Juice 39 70 55 55 766
Dietary Strategies:

Louise Dye, HARU, Leeds
•Why do we need legislation?