Embed Size (px)
Citation preview
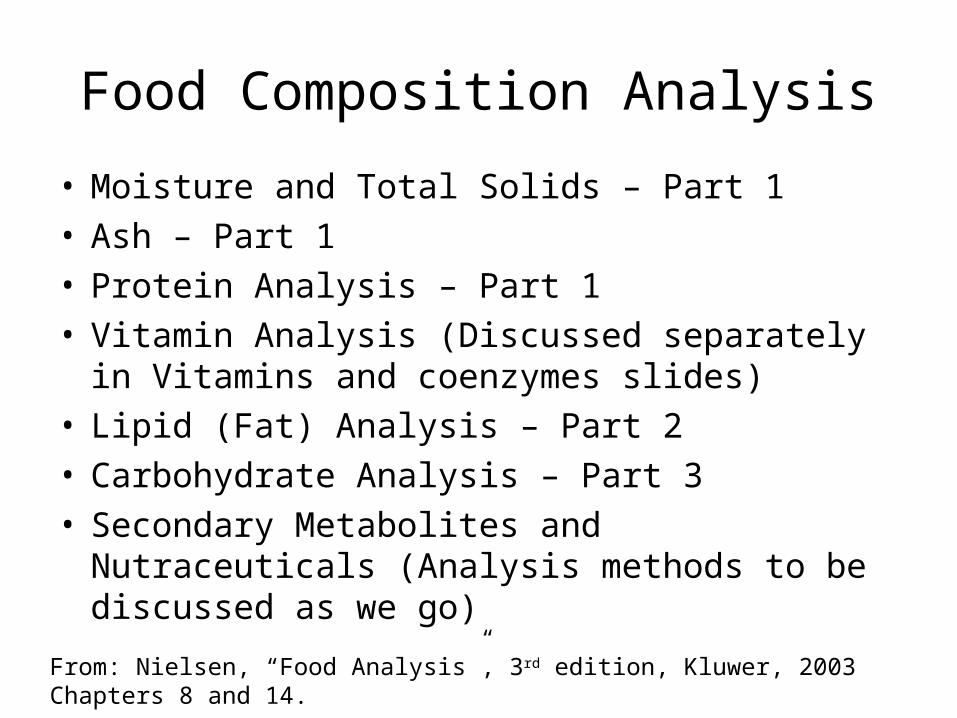
Food Composition Analysis
• Moisture and Total Solids – Part 1• Ash – Part 1• Protein Analysis – Part 1• Vitamin Analysis (Discussed separately in
Vitamins and coenzymes slides) • Lipid (Fat) Analysis – Part 2• Carbohydrate Analysis – Part 3• Secondary Metabolites and Nutraceuticals
(Analysis methods to be discussed as we go)
From: Nielsen, “Food Analysis”, 3rd edition, Kluwer, 2003Chapters 8 and 14.
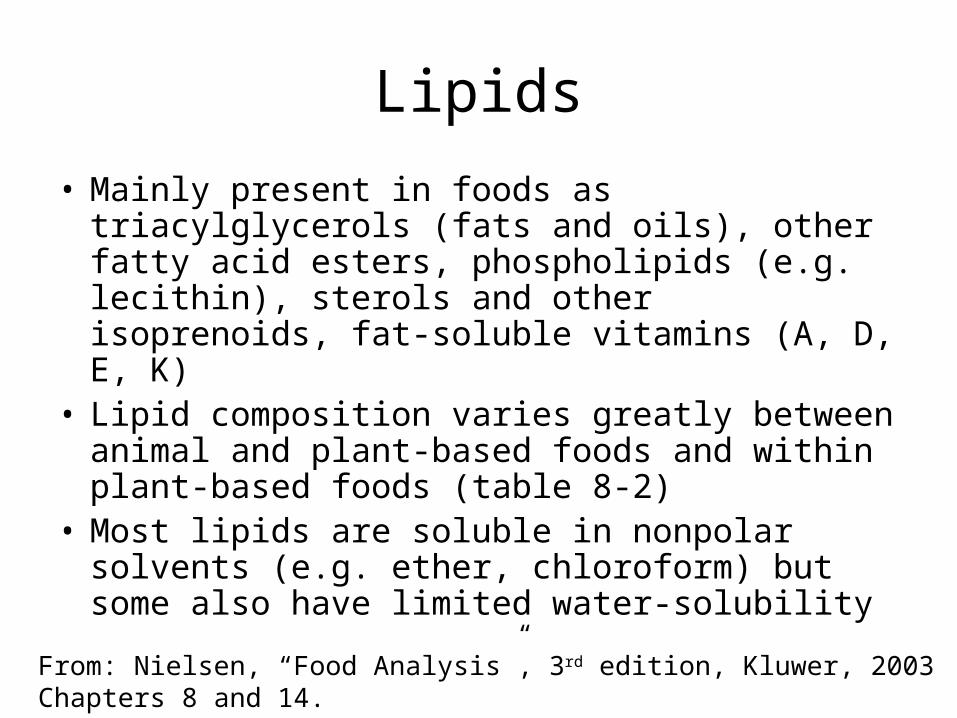
Lipids
• Mainly present in foods as triacylglycerols (fats and oils), other fatty acid esters, phospholipids (e.g. lecithin), sterols and other isoprenoids, fat-soluble vitamins (A, D, E, K)
• Lipid composition varies greatly between animal and plant-based foods and within plant-based foods (table 8-2)
• Most lipids are soluble in nonpolar solvents (e.g. ether, chloroform) but some also have limited water-solubility
From: Nielsen, “Food Analysis”, 3rd edition, Kluwer, 2003Chapters 8 and 14.

Lipids – quantitative analysis
• Accurate lipid analysis requires effective extraction from the food matrix
• extraction methods tailored to particular food• nonpolar solvents utilized – hexane, ethyl ether,
petroleum ether• extract, dry and weigh• hydrolysis may be needed with complex lipids to
release lipid from carbohydrate/protein moieties• steps may be taken to minimize oxidation
– addition of BHT or other antioxidant

Extraction of lipids
• Most effective if samples pre-dried• Samples are ground to reduce particle size, maximize
surface area• Blending helps saturate particles• Hydrolysis (1 hr reflux w 3 M HCl or saponification with
ethanolic KOH) needed with dairy, grains, animal products
• Sequential solvent extractions of plant materials begin with least polar solvent and increase in polarity so that lipids are removed first, other constituents follow
• Reverse-phase separation methods isolate the polar constituents first, lipids last

Lipid extraction methods
• Continuous solvent extraction – sample exposed to boiling solvent for several hrs
• Semicontinuous (Soxhlet extraction) – same idea but periodic solvent exposure
• Mojonnier flask or Babcock methods (dairy) use a digestion step prior to allowing fat to separate
• Microwave-assisted extraction often used w dairy, meats• Ultrasound-assisted extraction • Supercritical fluid extraction – “green” method uses
pressurized CO2 – hybrid gas-liquid state at 80oC, 10,000 psi– fluid pumped through sample cell, collected at ambient pressure,
60oC and rotary evaporated

Diagram of SFE
From Brazilian J. of Chem. Eng. at http://www.scielo.br/scielo.php?

Instrumental lipid quantification
• NMR – low resolution is effective because one monitors broader regions– CW NMR can determine degree of unsaturation– pulsed NMR – oil vs. solid fat content can be
determined - protons relax faster in solids– signal amplitude is proportional to quantity
• IR - fat absorbs strongly at C=O stretching region (1745 cm-1) – meat, dairy, oilseeds
• x-ray absorption – higher in lean meat than fat• ultrasound – fat content in meats

Lipid characterization
Ch. 14 (Nielsen)• Iodine value – degree of unsaturation• Saponification equivalents• Free fatty acidsLipid oxidation status & oxidation products• TBARS test for malondialdehyde• conjugated dienes & trienes by UV• volatile organics by GC• fatty acid composition by GC (14.6.2)• trans fatty acids by IR (14.6.3) – total trans fatty acids
quantified based on trans C=C absorption at 967 cm-1

Chemistry of TBARS test
Colored adduct is measured at 530 nm
From Methods of Analysis for Functional Foods and Nutraceuticals, Chapter 2”
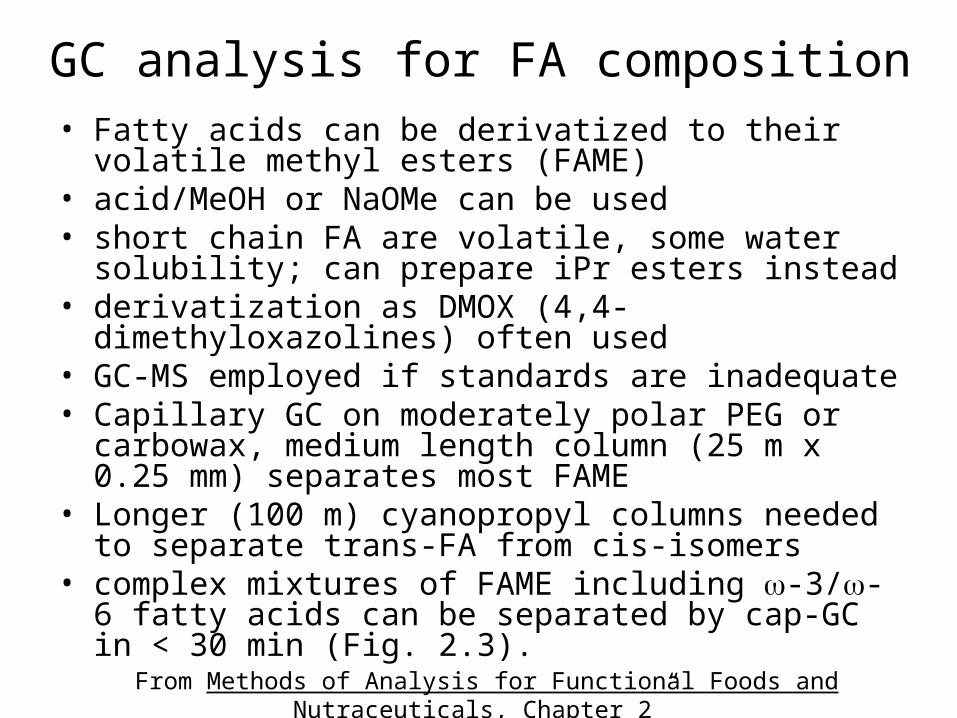
• Fatty acids can be derivatized to their volatile methyl esters (FAME)
• acid/MeOH or NaOMe can be used• short chain FA are volatile, some water solubility; can
prepare iPr esters instead• derivatization as DMOX (4,4-dimethyloxazolines) often
used• GC-MS employed if standards are inadequate• Capillary GC on moderately polar PEG or carbowax,
medium length column (25 m x 0.25 mm) separates most FAME
• Longer (100 m) cyanopropyl columns needed to separate trans-FA from cis-isomers
• complex mixtures of FAME including -3/-6 fatty acids can be separated by cap-GC in < 30 min (Fig. 2.3).
GC analysis for FA composition

Cap GC analysis of fish/sunflower oil mixture

Conjugated linoleic acid (CLA)
• Discussed in detail in Hurst, Ch. 2• Analysis poses a challenge because of the
mixture of isomers• Cap GC on 100 m cyanopropyl column
requires long runtime (80 min)• Silver-ion HPLC: Ag+ forms polar pi-bonded
complexes with unsat. FA– Si column packings impregnated with silver
developed for lipid analysis (normal-phase LC)– http://lipidlibrary.aocs.org/topics/silver/index.htm