Embed Size (px)
Citation preview

CLIMATE RESEARCHClim Res
Vol. 32: 229–245, 2006 Published October 26
1. INTRODUCTION
1.1. Objectives and research questions
In an earlier study (Adejuwon 2005a), the effects ofcontemporary inter-annual climate variability on theyield of the major food crops in Nigeria were analysed. Inthe present study, the objective was to characterizechanges in crop yield expected as a response to changesin climate during the 21st century. It is now generally ac-cepted that global climate is changing due to increasedconcentrations of the main greenhouse gases in theatmosphere. Attribution of climate change to humanactivities, in addition to natural forcing, was addressedby the IPCC Working Group I on Climate Change(Houghton et al. 2001). Globally-averaged surface airtemperature is projected to increase by 1.4°C to 5.8°C by2100, relative to 1990. The projections also indicate thatwarming could be accompanied by increases or de-
creases in precipitation, changes in inter-annual vari-ability of climate, and changes in the frequency and in-tensity of some extreme weather events such as storms,droughts and floods. The magnitude and spatial andtemporal patterns of the changes in each element ofclimate are expected to vary from one region of theearth’s surface to the other.
The present study was designed to determine (1) thespecific effects of increased levels of atmospheric CO2
concentrations on crop yield, (2) the specific effects ofchanges in each of 4 elements of climate (precipitation,relative humidity [RH], temperature and solar radia-tion) on crop yield, (3) the effects of aggregate changesin climate on crop yield for maize, sorghum, millet, riceand cassava, (4) possible differences in the effects ofclimate change on crop yield between one part ofNigeria and the other, and (5) possible changes in theeffects of climate change on crop yield in the course ofthe 21st century.
© Inter-Research 2006 · www.int-res.com*Email: [email protected]
Food crop production in Nigeria. II. Potential effectsof climate change
James O. Adejuwon*
Department of Geography, Obafemi Awolowo University, Ile-Ife, Osun State, Nigeria
ABSTRACT: Two separate lines of investigation were adapted from the recommendations of the 1994United States Country Studies Program (USCP). In one approach, arbitrary incremental scenarioswere adopted to assess the response of crop yield to changes in the various elements of climate. Usingthe erosion productivity impact calculator (EPIC) crop model, tests were conducted to demonstratehow crop yield might respond to changes in rainfall, relative humidity (RH), temperature, solarradiation and CO2 concentration. The value of one element was altered incrementally while holdingconstant the values of the others. In the second approach, potential future changes in the yieldsof maize, sorghum, millet, rice and cassava were simulated based on a scenario specifying meanconditions for 1961–9190 as a baseline and general circulation model (GCM) projections from this for3 periods: 2010–2039, 2040–2069 and 2070–2099. The results predicted a possible increase in cropyield during the first half of the 21st century to be followed by a decrease during the second half.Enhanced crop yield was explained by projected increases in rainfall, solar radiation, atmospherichumidity and CO2 concentrations. Lower yields were explained in terms of continued global warm-ing, as a result of which maximum and minimum temperatures approach the limits of tolerance forthe modelled crops.
KEY WORDS: Climate change · Crop yield · Nigeria · Food production
Resale or republication not permitted without written consent of the publisher

Clim Res 32: 229–245, 2006
1.2. Study area
The primary study area was Nigeria, where all vege-tation types of the various tropical regional climatecategories are present. Thus, northwards from the veryhumid eastern coastal locations to the boundary withthe desert, the vegetation profile includes moist ever-green rain forests, dry semi-evergreen rainforests,Southern Guinea savannah, Northern Guinea savan-nah, Sudan Savannah, and Sahel Savannah (Fig. 1)(Keay 1959). The rainforest zone, which covers about25% of the country, is humid; the Guinea savannahzones, which extend over 40% of the land area, aresub-humid; while the Sudan savannah and the Sahelzones, constituting about 35% of the land area, aresemi-arid. (‘Derived savannah’ was originally highforest, before it was converted to savannah as a resultof human activities).
Across the various climatic and ecological zones,mean monthly maximum temperature varies between28 and 40°C. In coastal locations, mean monthly maxi-mum temperatures are lowest in August at about 28°Cand highest in March to May (MAM) at around 34°C.In the sub-humid Guinea zones, mean monthly maxi-mum temperatures are also lowest in August at about30°C and highest in the MAM season averaging 38°C.In the semi-arid zones, i.e. in the Sudan and Sahel, thehighest maximum temperatures are also recorded dur-ing the MAM season and can be as high as 40°C. Onthe other hand, the lowest maximum temperatures ofaround 28°C are experienced in December or January.
On average, mean monthly minimum temperaturesare about 8°C lower than mean maximum tem-peratures in the coastal forest zone. This differenceincreases to about 15°C in the semi-arid zone. Whilethe highest minimum temperatures are observed dur-ing the MAM season (i.e. the same months in whichthe highest maximum temperatures are also observed),the month with the lowest minimum temperatures isJanuary (not August, as is the case with maximumtemperatures). The annual range of minimum temper-ature increases from the humid through the sub-humidto the semi-arid zones. At Port Harcourt, within therainforest zone, mean monthly minimum temperaturevaries between 21 and 24°C; for Ilorin in the sub-humid zone, it varies between 17 and 24°C; while forKano in the semi-arid zone, it varies between 12 and26°C. Thus nights are relatively cool all over the coun-try during the months MAM. However, in December,January and February, the semi-arid locations experi-ence cold nights compared with the forest zone loca-tions, where night temperatures remain relatively mild.
In the forest zone, the atmosphere is perenniallyhumid with RH always above 70% at 09:00 h. This isbecause the area is perennially overlaid by the moisttropical air mass, which has its source in the SouthAtlantic. In the sub-humid and semi-arid zones, forperiods varying in length from 1 to 4 mo, the moistair mass is replaced by a dry tropical air mass, whichoriginates over the Sahara Desert. In the forest zone,mean annual rainfall can be as high as 3000 mm, butusually lies between 1200 and 2000 mm. Although rain
230
Fig. 1. Nigerian vegetation/ecologicalzones, and stations employed in thisstudy (bold); see Table 1 for station
data

Adejuwon: Climate change and crop yield in Nigeria
could be expected during each month, there is usuallya relatively dry period of about 2 mo in the southeastand 4 mo in the southwest. In the sub-humid zones, theyear is sharply divided into a rainy and dry season. Thedry season is about 7 mo long in the northernmostareas, whereas it is only 5 mo long at the boundarywith the forest zone. For about 2 of the 5 to 7 months ofthe dry season, drought is expressed in terms of bothlow rainfall and low humidity of the air because of theprevalence of the dry air mass invading from theSahara Desert. There is little difference between thenorthern drier boundary and the southern wet bound-ary of the sub-humid zone in terms of total annual rain-fall. In fact, the total annual rainfall at Ilorin within theSouthern Guinea zone is less than that of Kaduna nearthe northern boundary of the Northern Guinea zone.However, the boundary between the sub-humid andthe semi-arid zones corresponds to a sharp drop inmean annual rainfall from 1000 mm to about 750 mm.In the Sahel, the rainy season is barely 4 mo long,whereas in the Sudan savannah, the rainy seasonextends over a period of up to 5 mo. In terms of meanannual rainfall, the boundary between the Sahel andSudan savannah regions is defined by the isohyet of600 mm.
2. APPROACHES TO THE ASSESSMENT OFCLIMATE CHANGE AND CROP YIELD
2.1. Relating crop yield to climate change
In a preceding study on the effects of contemporaryclimate variability on crop yield (Adejuwon 2005a),observed data for both climate and crop yield wereused. These were analysed to generate linear modelsthat were interpreted as the effects of climate variabil-ity on crop yield. However, for the present study nosuch data are available, and this represents the funda-mental problem in climate change research. Whenaddressing the response of crop yield to future climate,one tool that researchers use is the general circulationmodel (GCM), which is, in essence, a dynamical or sta-tistical representation of the earth–atmosphere–oceansystem. Extended-range GCM-based weather fore-casts are issued for West Africa by the MO (Met Office;United Kingdom), the CRC (Centre de Recherches declimatologie; CNRS, France) and the NOAA (NationalOceanic and Atmospheric Administration; USA). An-other tool is the agro-ecological system model, usuallydescribed as the crop model, the building-blocks ofwhich are empirical formulations derived from a largenumber of in situ experiments on ecosystems. Cropmodels such as the erosion productivity impact calcu-lator (EPIC) (Williams et al. 1989), the general purpose
formulation model of the soil-plant atmosphere system(GAPS) (Butler & Riha 1989), the decision support sys-tems for agro-technology transfer (DSSAT) (Tsuji et al.1994) and the soybean crop growth simulation model(SOYGRO) (Jones et al. 1989) are efficient in determin-ing the response of crops to changes in weather andclimate. The basic linked systems of national agricul-tural models (BLS) constructed by the Food and Agri-cultural Programme at the International Institute forApplied Systems Analysis (IIASA) is also an exampleof such an approach (Fischer et al. 1988).
Future climates are simulated by introducing higherconcentrations of greenhouse gases into a GCM. Theoutputs of such simulations, in terms of weather andclimate elements, are introduced as inputs into thecrop model to simulate changes in crop yield. Thus, thecrop yield simulated is interpreted as a response to afuture climate, which in turn corresponds to a level ofgreenhouse gas concentration, which in turn corre-sponds to a predicted future pattern of social andeconomic activity.
2.2. Use of incremental scenarios
In this study 2 separate approaches have beenadapted from the recommendations of the UnitedStates Country Studies Program (USCP 1994). In thefirst approach, ‘arbitrary (incremental) scenarios (e.g.+2°C and +4°C temperature changes, ±10% precipita-tion changes)’ were recommended, whereas in the sec-ond approach, ‘scenarios derived from GCMs’ weresuggested for estimating potential future changes inyield (see also similar recommendations by Fischer1996).
In the present study, incremental scenarios wereadopted using the EPIC crop model in order to demon-strate the effects of changes in rainfall, RH, tempera-ture, solar radiation and CO2 concentration on cropyield. This approach affords the opportunity to demon-strate the effects of each climate element separately.The value of one element was altered incrementallywhile holding constant the values of the others.
2.3. Use of GCM-generated climate change scenarios
In the second approach, a climate scenario consistingof the mean observed data from 1961–1990 as base-line, and the climate for each of 3 additional periods(2010–2039, 2040–2069, 2070–2099) generated by aGCM, was adopted to simulate potential future changesin crop yield (data available at http://ipcc-ddc.cru.uea.ac.uk). This was an output of the HadCM2 GCM,based on a 1% per annum compound increase in CO2
231

Clim Res 32: 229–245, 2006
concentration. The data represent choices of GCMexperiments and emission scenarios based on the‘worst case’ scenario of CO2 increase. It falls into theIPCC climate scenario group that includes IS92e, IS92f,SRES A1F1 and SRES A2, each of which is projected toresult in concentrations of greenhouse gases >850 ppmby the end of the 21st century, from the current levelof 370 ppm (Houghton et al. 1995, Nakicenovic &Swart 2000).
Table 1 summarises climate change projections forNigeria. The most significant potential changes in cli-mate are with respect to temperature and temperature-related parameters. Changes in minimum and maxi-mum temperatures in the order of 5°C or more could beexpected all over the country. Maximum temperaturesmay, within this century, attain levels that have nohistorical precedent outside hot desert regions. Thishas the potential to increase the wilting coefficientcomputed in terms of the amount of available moisture.Minimum temperatures are projected to increase at ahigher rate than maximum temperatures. A generaldecrease in cloudiness is projected, which couldimprove the availability of sunlight for primary produc-tion. The adopted scenario indicates that the trendtowards aridity in sub-Saharan West Africa during thegreater part of the 20th century (Adejuwon et al. 1990,Hulme et al. 2001, Nicholson 2001) could be halted orreversed as the 21st century progresses. Marginal to
substantial increases in rainfall are projected for allparts of the country during the rainy season. However,no such increases are projected for the drier parts ofthe year. Moreover, there are possibilities that theadditional water need created by higher temperaturesmay not be met by projected increases in rainfall.On the other hand, average vapour pressure may riseby as much as 5 to 8 hPa during the growing season,leading to increased RH, which could also result in areduction in evaporation, lower moisture stress andimproved primary production. One aspect of the cur-rent climate pattern that will be carried forward intothe potential climate of the future is zonation. Rainfall,temperature, cloudiness, incident solar radiation andhumidity will decrease or increase, depending on theseason, with increasing distance from the ocean in thesouth.
2.4. Uncertainties of projected changes
Accuracy of climate change scenario predictionsdepends on the skill of the GCM used. Since no twoGCMs give exactly the same climate change projec-tions, there is no reliable way of determining whichone will be most useful for a specific exercise ofclimate change projection. Tubiello (2002), for exam-ple, demonstrated differential effects of using 2 GCM
232
Table 1. Climate projections for 5 ecological zones in Nigeria 1961–2100, based on data from IPCC (available at http://ipcc-ddc.cru.uea.ac.uk). Bold: present conditions. Projections are for the year 2100. nc: no change, nsc: no significant change
Port Harcourt Ilorin Kaduna Kano Maiduguri
GeographyRegion Forest Southern Guinea Northern Guinea Sudan savannah Sahel savannahKöppen classification Af Aw Aw BS BSSurface of country (%) 25 21 19 28 7
PrecipitationPresent amount (mm) 1200–3000 1000–1250 1000–1250 600–1000 <600Rainy season (mo) 9–12 8–9 6 4 3Projected: Rainy season Wetter Wetter Wetter and longer Wetter and earlier Wetter until 2069
Dry season nsc nsc nc nsc nsc
Maximum temperaturePresent (°C) 28–34 30–38 30–38 28–40 28–40Lowest August August August January JanuaryHighest March March March May MayProjected (°C) 31–36 34–40 34–43 32–43 35–46
Minimum temperaturePresent (°C) 21–24 17–24 15–24 12–26 10–26Lowest January January January January JanuaryHighest April April April May MayProjected (°C) 21–27 20–30 18–30 19–30 19–30
Vapour pressurePresent (hPa) 27–31 17–28 8–25 5–25 6–25Lowest January January January January JanuaryHighest April May July August AugustProjected (hPa) 33–38 22–34 12–33 10–32 10–33

Adejuwon: Climate change and crop yield in Nigeria
climate change scenarios to simulate crop productionin the USA.
Apart from the technical problems presented by themultiplicity of GCMs available, there are difficulties inpredicting the true course of future greenhouse gasemissions, which are the required inputs into the cli-mate models. Given the fact that global warming islargely determined by concentrations of the green-house gases in the atmosphere, it is hardly surprisingthat a large proportion of climate change uncertaintiesis a reflection of uncertainties inherent in the socio-economic conditions that underlie the greenhouse gasemission projections. In a case study based on Ibadan,southwestern Nigeria, changes in climate based on 1and 0.5% increases in equivalent CO2 per annum werecompared (Adejuwon & Omotayo 2006). While the‘0.5%’ scenario is projected to make Ibadan warmerby about 3°C, the ‘1%’ scenario will create an envi-ronment 5°C warmer than between 1961 and 1990.Similarly, a case study looking at climate change inNigerian climate zones (MOE 2003) reported differingprojected increases in precipitation according to theemission scenario used (SRES A2 or B1).
2.5. EPIC crop model
The EPIC crop model (version 8120—available atwww.brc.tamus.edu/epic) adopted for crop yield simu-lation in this study was developed by the USA Depart-ment of Agriculture (Williams et al. 1989, 1990, Kiniryet al. 1990). EPIC has been employed for the study ofthe effects of climate on crop growth and development(Cabelguenne et al. 1990, Easterling et al. 1992, 1993,1996, McKenney et al. 1992, Rollof et al. 1998, Rinaldi2000). Like other crop models, EPIC represents a sim-plified crop production system. It consists of non-linearmathematical equations relating crop yield to theunderlying physiological processes of growth anddevelopment (Ritche 1991). EPIC functions as a seriesof equations that sequentially estimate potential growth(biomass accumulation) from heat unit accumulation,solar radiation interception, water use and nutrientuptake. Economic yield, the amount of grain, pulse, ortuber that could be removed from the ground in tonnesper hectare, is a derivative of potential growth anda harvest index that is particular to each crop underoptimum conditions. Potential crop growth and yieldare usually not achieved because of constraintsimposed by the plant environment. The model esti-mates stresses caused by water, nutrients, tempera-ture, aeration, and radiation. In EPIC, the stresses areconsidered when estimating constraints on biomassaccumulation, root growth and yield. Stresses thataffect biomass accumulation and root growth will be
reflected in the economic yield, which is the output ofinterest in our simulation exercises.
2.6. Testing and validating EPIC
Concern has been expressed over the inadequatevalidation of model-simulated crop yields, which lim-its their usefulness in policy analysis (Easterling et al.1996). The most recent works still fail to address theissues of physiological testing, validation and suit-ability of the crop models before using them to makeprojections on crop productivity and production.Using the DSSAT crop model, Tubiello et al. (2002)found significant differences between simulated andobserved yields. Percent model error (root meansquare error of simulated versus observed yielddivided by mean observed yield) was 16 to 25%across all crops. Coefficient of variation (a measure ofrisk to farmers) for observed yield was 10 to 15%compared with 10 to 30% under simulated irrigatedconditions, and 30 to 50% for simulated rain fed pro-duction. In general, simulated yields were observed tobe biased towards higher values. These findingsnotwithstanding, the study advanced to make projec-tions on yield using 2 scenarios of climate changedeveloped with the Hadley Centre model and theCanadian Climate Centre model. With such discrep-ancies between observed and simulated yields, itcould be argued that the projections are of limitedcredibility. Thus further evidence is required to showthat predictions made with such crop model simula-tions are not too distant from reality.
Validation of the EPIC crop model has been investi-gated by Kiniry et al. (1990), Easterling et al. (1992,1996), Rosenberg et al. (1992) and Adejuwon (2005b),among others. Recognising the need for the physio-logical testing of crop models, Easterling et al. (1996)attempted to improve the validity of EPIC-simulatedyield response to climate change. Validity was defin-ed as a reasonably strong covariance of modelled andobserved results. The study hypothesized that theperformance of crop models during recent years ofextreme weather conditions relative to norms of thesame period may give a better indication of the valid-ity of crop yield simulations than performance acrossthe full range of climate scenarios, as is commonlystudied. The climate record for 1971–1990 in 7 loca-tions in northeastern Nebraska, USA, was separatedinto normal, extremely warm and extremely coldyears. The records were also used to identify yearswith low, normal and high levels of precipitation.EPIC was used to simulate crop yield with each of therecognized weather classes. Statistical comparisonswere made between simulated yields, observed yields
233

Clim Res 32: 229–245, 2006
and observed yields detrended of technology influ-ences. The study concluded that the EPIC modelaccurately tracks crop yields under observed depar-tures from current temperature norms, thus mimick-ing the most certain feature of expected climatechange—i.e. warming. The study also concluded thatthe reliability of EPIC simulations during extremelydry years was not as high as during the extremelywarm years, but argued that the simulations were stillrelatively credible.
Adejuwon (2005b) assessed for the first time thesuitability of the EPIC crop model to West Africa.Notwithstanding the limitations arising from the needto calibrate for each crop variety, the study confirmedthe potential suitability of the crop model not only tosite-specific, but also to spatial analytical studies ofthe impacts of climate variability and climate changeon crop yield. With correlation coefficients significantat confidence levels >95%, the model was used toconfirm the known ‘real world’ sensitivities of maize(0.7759), sorghum (0.7121) and millet (0.7366) togrowing season rainfall in the arid zone of the coun-try. Sensitivities to RH, solar radiation and soil weresimilarly demonstrated. Using the rainfall data for1986 as input, yields of maize were simulated thatvaried between 97 and 110% of average real worldyields recorded on experimental farms located inhumid, sub-humid and arid zones of the country. In asimilar study using 1987 rainfall data, yields of ricewere generated that varied between 110 and 117%of average real world yields on experimental farmswithin the humid zone. In these experiments, simu-lated yields were judged to be sufficiently close toreality to be used in the assessment of the impactsof climate variability and climate change.
2.7. Creation of EPIC data files
The simulation of crop yield requires the creation ofEPIC crop model data files. Therefore, for each farmsite adopted for the current study, a principal data filewas created with observed data from the period1961–1990. In the main, the data file includes: programcontrol codes, general site data, water erosion data, cli-mate data, wind erosion data, soil data, managementinformation operation codes and management infor-mation operation variables (Williams et al. 1989, 1990,Kiniry et al. 1990). The main data file requires 446items of input data, 300 of which are the climatic char-acteristics of each modelled site. As downloaded fromthe web, the crop model includes such characteristicsfor all possible selected sites for continental USA. ForNigeria, however, each datum had to be computedusing data covering the 30 yr period. For the assess-
ment of the impacts of climate change using GCM sce-narios, 3 other data files were created with projecteddata for 2010–2039, 2040–2069 and 2070–2099 respec-tively. The projected data were substituted for theobserved data already in the EPIC data file createdwith observed 1961–1990 data. To run the model, 2other files are required. One is an operations schedulefile created for each crop, giving details of farm opera-tions and dates of their execution. Another is a soil filewith the details of the soil characteristics for the site.The soil used for the simulation has been described atseries level in various soil survey reports. It is freedraining, loamy in texture and of average productivity.It was adopted as one of the most frequently-used soilsfor food crop production around the respective mod-elled localities. For Ibadan the ‘Iwo’ soil series, derivedfrom igneous and metamorphic rocks (Smyth & Mont-gomery 1962), was used to compile the soil file. Asavannah zone variant of the same soil series (Mur-dock et al. 1976) was adopted for the Ilorin site. For thePort Harcourt site the ‘Owode’ series, derived fromcoastal sands geological formation (Moss 1957), wasused to create the EPIC soil file. The profile used tocreate the soil file for Jos is a derivative of lava flowidentified in a local soil survey (Ibigbami et al. 1979).The same study also included the description of aprofile derived from igneous and metamorphic rocksadopted for the creation of the soil file for Kaduna. Thesoil profiles used for the creation of soil files for Kanoand Maiduguri were identified in the report of a surveyfor a National Agricultural Land Development Agengy(NALDA) farm site at Tikau in Yobe state (Nwaka 1997).
2.8. Case studies
The assessment of the effects of climate change oncrop productivity reported here was undertaken in 10case studies. Five of the studies adopted incrementalscenarios and were designed to demonstrate the rela-tive effects of individual climate elements on crop yield.Using the EPIC crop model, the elements investigatedincluded rainfall, RH, temperature, solar radiation andCO2. The EPIC data file for Ilorin, in the SouthernGuinea savannah ecological zone, was used in the rain-fall and RH studies. The file for Ibadan in the rainforestzone was used in the temperature study at low eleva-tion. The data file for Jos (a high altitude site) was usedfor a repeat of the temperature study. The studies of therelative sensitivities to changes in solar radiation andCO2 were also conducted with the Jos data file. Theother 5 case studies adopted GCM scenarios. Each ofthe studies in this group was designed to demonstratechanges in simulated yield of a particular crop, fromthe baseline of 1961–1990 through 3 other periods in-
234

Adejuwon: Climate change and crop yield in Nigeria
cluding 2010–2039, 2040–2069 and 2070–2099. Only 5crops (maize, millet, sorghum, rice and cassava) wereinvestigated. The other major crop, yam, was not in thecrop list of EPIC. It was for these series of studies thatoutputs of the HadCM2 data were adopted.
3. METHODS
3.1. Response of crops to individual climate parameters
Maize, sorghum, millet and rice were investigatedfor sensitivity to climate factors, using incremental sce-narios. The Ilorin study on the effects of changing sea-sonal rainfall on crop yield adopted the EPIC data file(created with 1961–1990 observed data) as the base-line of a 4-member scenario. The three other membersof the scenario were created by increasing the monthlyrainfall values by 5, 10 and 15%. EPIC simulationswere conducted with these data files and the outputsdemonstrate the changes that could occur in crop yieldif the climate were to become generally wetter. Thesame strategy was adopted to assess the possibleeffects of changing RH on crop yield, also using an ini-tial data file created for Ilorin. Fakorede (1985) testedthe effects of increasing rainfall and increasing RH onthe yields of crops planted early (March) and later(May), observing that planting early in the rainy sea-son tends to result in higher yields.
To assess the effects of changing temperature oncrop yield, the main EPIC data files created for Ibadan(lowland) and Jos (upland) with the observed data forthe period 1961–1990 (baseline) were employed. The2-site experiment design for the assessment of theeffects of temperature incorporates the difference inbaseline temperatures between high and low altitudelocations. Mean monthly temperature for Jos is, onaverage, lower than mean monthly temperature forIbadan by about 8°C. The characteristics for Ibadanare similar to those of Port Hacourt within the forestzone. However, the characteristics for Jos are uniquein Nigeria being comparable only to those observableon the East African Plateau in Kenya. Changing thevalues for monthly minimum and maximum tempera-tures in the baseline data files created 4 other datafiles. To create the 2nd, 3rd, 4th and 5th files, 1, 2, 2and 4°C, respectively, were added to the values of themonthly maximum temperature, and at the same time,2, 2, 3 and 5°C, respectively, were added to the valuesof the monthly minimum temperature.
For the assessment of the effects of changing solarradiation and CO2 concentrations, the EPIC file cre-ated for Jos using 1961–1990 observed data repre-sented the baseline climate. The incremental scenariofor solar radiation included 3 other files, with values of
solar radiation increased by 5, 10 and 15% in succes-sion. For the CO2 concentration levels, the scenarioconsisted of data files with concentrations of 350, 370,500 and 650 ppm.
3.2. Effects of changing climate on crop yield
The climate change scenario outlined in Section 2.3was used in creating EPIC data files for 6 sites and 4periods (1961–1990 [baseline], 2010–2039, 2040–2069and 2070–2099). The sites represented 5 ecologicalzones: the moist rainforest, Southern Guinea savan-nah, Northern Guinea savannah, Sudan savannahand Sahel savannah as well as the high altitude JosPlateau. The 5 crops involved in the assessmentincluded: maize, sorghum, millet, rice and cassava.
3.3. Interpretation of EPIC-run outputs
The output of the model runs included not only theyield of the crops, but also the numbers of days ofwater stress, nitrogen stress, phosphorus stress, tem-perature stress and aeration stress (when too muchwater in the soil fills all the spaces between soil parti-cles). Stress occurs on such days when the crop’sspecific needs are fulfilled to a level below the crop’stolerance. Crop yields simulated for each periodwere used to characterize changes in crop yield from1961–1990 to 2070–2099. When interpreting the pat-terns of changes in crop yield, the climate-relatedstresses were first considered. In addition, changes inthe elements of climate as arbitrarily introduced or asoutlined earlier in the climate change scenario werealso considered.
4. EFFECTS OF INCREASES IN CLIMATEPARAMETERS ON CROP YIELD
4.1. Precipitation
Table 2 depicts crop yield responses to changingrainfall and RH components of climate while values ofthe other elements were held constant at baselinelevels. Baseline yields for March plantings were higherthan those for May plantings for all the crops. This con-firms the findings of Fakorede (1985) that grain yield ofmaize decreases by 30, 38, and 34 kg ha–1 for each daythat planting is delayed after the first planting inMarch 1978, 1980 and 1981 respectively. The effectson yields of increases in rainfall of up to 15% are mar-ginal, regardless of whether crops were planted inMarch (at the beginning of the season) or May (when
235

Clim Res 32: 229–245, 2006
the rainy season was well under way) (Table 2).Increasing rainfall did not result in either a decrease inwater stress or an increase in aeration stress for cropsplanted in March, as one would expect, and marginalchanges in yield were positive. For crops planted inMay there were also no significant changes in waterstress in response to increases in rainfall up to 15%.However, there were increases of up to 2 d in aerationstress for maize, sorghum and millet, while the level ofaeration stress remained constant for rice. Perhapsthe most significant observation from Table 2 is thatincreasing rainfall for crops planted in May appearedto produce lower yields. An increase of 15% in rainfallproduced a decrease of 2.8% in the yield of maize, adecrease of 2.2% in the yield of sorghum and adecrease of 1.4% in the yield of millet. The yield of ricewas not affected.
4.2. Relative humidity
As depicted in Table 2 the increases in yield associ-ated with increased RH were much higher than thoseassociated with increases in precipitation. An increasein RH by 15% led to yield increases of 12 to 17% underthe different scenarios. Changes in RH and yield werenot associated with changes in either water stress,temperature stress or aeration stress.
4.3. Temperature
The effects of increasing temperature on crop yield aredepicted in Table 3, which shows EPIC-simulated yieldsfor the baseline situation, as well as for 4 scenarios of in-creased temperature, at the low and high elevation sites.For the 4 crops investigated, the baseline-simulatedyields for the low elevation site were higher than thosefor the high altitude location by factors varying from75% for maize, 133% for sorghum, 300% for millet to1200% for rice. The results for the low elevation siteindicate increases in the simulated yields correspondingto increases in temperature for all crops. However, therate of increase declined and the decline became morepronounced with increasing temperature. The point inthe climate scenario at which the rates of crop yieldincrease started to decline varied. For maize, sorghum,millet, and rice (respectively), this was at the point whenthe increase in maximum/minimum temperature was2/3°C (Climate IV), 4/5°C (Climate V), 4/5°C (Climate V)and 2/2°C (Climate III). For maize and rice, yields result-ing from the simulations with the highest temperatures(Climate V) were lower than yields simulated with thebaseline temperatures (11 and 22% lower, respectively).
The reductions in yield at the higher levels of tem-perature were due to increased temperature stress. AtIbadan, the baseline (Climate I) conditions producedno temperature stress for millet and sorghum, 1 d of
236
Table 2. Crop yield sensitivity to changing precipitation and changing relative humidity at Ilorin. Baseline = mean climate 1961–1990;II = baseline +5%; III = baseline +10%; IV = baseline +15%; Y: yield (t ha–1); %ch = % change in yield from baseline; ws = water stress (d);
ts = temperature stress (d); as = aeration stress (d)
Climate Maize Sorghum Millet RiceY %ch ws ts as Y %ch ws ts as Y %ch ws ts as Y %ch ws ts as
CHANGING PRECIPITATIONMarch plantingsBaseline 4.696 15.3 3.1 0.0 3.825 14.4 0.5 0.0 1.559 6.9 0.1 0.0 1.811 0.5 7.5 0.0II 4.705 0.2 15.2 3.1 0.0 3.831 0.2 14.3 0.5 0.0 1.562 0.2 6.8 0.1 0.0 1.811 0.0 0.5 7.5 0.0III 4.713 0.4 15.1 3.1 0.0 3.838 0.3 14.2 0.5 0.0 1.564 0.3 6.7 0.1 0.0 1.811 0.0 0.5 7.5 0.0IV 4.727 0.7 15.0 3.1 0.0 3.849 0.6 14.1 0.5 0.0 1.568 0.6 6.6 0.1 0.0 1.812 0.01 0.5 7.5 0.0
May plantingsBaseline 4.065 2.2 1.2 16.3 2.888 2.1 0.2 18.4 0.852 1.3 0.6 21.2 1.175 0.4 2.5 0.0II 4.058 –0.2 2.2 1.2 16.6 2.876 –0.4 2.1 0.2 18.7 0.849 –0.4 1.3 0.6 21.5 1.175 0.0 0.4 2.5 0.0III 4.026 –0.6 2.2 1.2 17 2.859 –1.0 2.0 0.2 19.1 0.846 –0.8 1.3 0.5 22.0 1.175 0.0 0.4 2.5 0.0IV 3.953 –2.8 2.2 1.0 18.4 2.816 –2.5 2.0 0.1 20.4 0.840 –1.4 1.3 0.4 23.1 1.175 0.0 0.4 2.5 0.0
CHANGING RELATIVE HUMIDITYMarch plantingsBaseline 4.696 15.3 3.1 0.0 3.825 14.4 0.5 0.0 1.559 6.9 0.4 0.0 1.811 0.5 7.5 0.0II 4.911 4.6 15.3 3.1 0.0 4.002 4.6 14.4 0.5 0.0 1.646 5.6 6.8 0.1 0.0 1.898 4.8 0.5 0.5 0.0III 5.079 8.2 15.2 3.1 0.0 4.140 8.2 14.3 0.5 0.0 1.712 9.8 6.8 0.1 0.0 1.946 7.5 0.5 0.5 0.0IV 5.262 12.1 15.2 3.1 0.0 4.289 12.1 14.3 0.5 0.0 1.785 14.5 6.8 0.1 0.0 2.042 12.8 0.5 0.5 0.0
May plantingsBaseline 4.065 2.2 1.2 16.3 2.888 2.1 0.2 18.4 0.852 1.3 0.6 21.2 1.175 0.4 2.5 0.0II 4.289 5.5 2.2 1.2 16.4 3.048 5.5 2.1 0.2 18.5 0.907 6.4 1.3 0.6 21.3 1.230 4.6 0.4 2.5 0.0III 4.500 11 2.2 1.2 16.5 3.199 11 2.1 0.2 18.6 0.960 13 1.3 0.6 21.4 1.284 9.2 0.4 2.5 0.0IV 4.670 15 2.2 1.2 16.6 3.319 15 2.1 0.2 18.7 0.999 17 1.3 0.6 21.5 1.324 13 0.4 2.5 0.0

Adejuwon: Climate change and crop yield in Nigeria
temperature stress for maize and 4 d of stress for rice.However, conditions represented by Climate V pro-duced 23 d of temperature stress for rice and 12 d ofstress for maize. Temperature stresses for sorghum andmillet were still relatively low at 4 and 0.3 d, respec-tively. At the high altitude site, temperature stress washighest for the baseline climate, which probablyresulted from low temperature. With higher tempera-tures, temperature stress declined and the yield im-proved. For the baseline climate, temperature stresswas 8 d for maize, 18 d for sorghum, 25 d for millet and10 d for rice. However, the conditions represented byClimate V produced no temperature stress for maize,only 3 d of stress for sorghum, 8 d for millet and <1 d forrice. This seems to explain why there was less curtail-ment of yield at the higher levels of temperature.
Baseline water stress of 6 d for maize, 8 d for sorghumand 2 d for millet did not change markedly with increas-ing temperature. Furthermore, no water stress was asso-ciated with changes in yield and corresponding changesin temperature. None of the climates used for yield sim-ulation produced aeration stress for rice. Baseline aera-tion stress of 12, 12 and 17 d was experienced by maize,sorghum and millet, respectively. With the exception ofmaize and for Climate V, there were only marginal re-ductions in aeration stress corresponding to increases intemperature. Yield simulation with Climate V producedno aeration stress.
Table 3 shows that across the range of temperaturesituations, there were corresponding increases in yieldat the higher altitude. Thus, percentage changes inyield also increased with changes in temperature. Inthis respect the pattern contrasted strongly with thatobtained at the lower elevation at Ibadan, where therewere reductions in percentage changes at some pointsas the climate became warmer.
At the high altitude site, there was no aeration stressrecorded for any of the crops under any of the climatesadopted for the simulation of yield. For maize andsorghum, water stress increased as temperature in-creased from baseline climate to Climate V. For ricethere was a decline in water stress from baseline cli-mate to Climate IV, but an increase under Climate Vconditions. For millet, water stress remained at mini-mal levels from baseline to Climate V. Temperaturestress declined for all crops from baseline to Climate V.These results indicate that the positive effects ofdeclining temperature stress were able to override thenegative effects of increasing water stress (e.g. formaize, a decrease in temperature stress from 8 to 0 dwas sufficient to override an increase in water stressfrom 5 d to 16 d and produce a substantial increaseof 28% over baseline yield).
4.4. Solar radiation
The first part of Table 4 depicts the pattern ofresponse of the 4 crops to different levels of solar radi-ation. For each crop, the increases in yield were con-tinuous, regular and considerable, and more or less atthe same percentage levels as increases in solar radia-tion. Thus, percentage changes in yield also increasedwith changes in the amounts of solar radiation re-ceived. The increases observed with respect to maizewere less than those for the other crops. However,even with conditions represented by Climate IV, whichincluded increases of 15% solar radiation, the yields ofmillet and rice remained at uneconomical levels. Therewas no aeration stress recorded for any of the cropsunder any of the climates adopted for the simulation ofyield. For maize, water stress doubled from baseline to
237
Table 3. Crop yield sensitivity to changing temperature at Ibadan and Jos. Baseline = mean climate 1961–1990; II = baseline maximum temper-ature +1°C, minimum temperature +2°C; III = baseline maximum temperature +2°C, minimum temperature +2°C; IV = baseline maximumtemperature +2°C, minimum temperature +3°C; V = baseline maximum temperature + 4°C, minimum temperature +5°C; Y: yield (t ha–1);
%ch = % change in yield from baseline; ws = water stress (d); ts = temperature stress (d); as = aeration stress (d)
Climate Maize Sorghum Millet RiceY %ch ws ts as Y %ch ws ts as Y %ch ws ts as Y %ch ws ts as
Low altitude (Ibadan), 225 m a.s.l.Baseline 4.585 8.5 1.0 11.9 3.523 7.8 0.0 12.4 1.256 2.4 0.1 17.6 2.987 0.5 4.1 0.0II 4.873 6.3 7.2 3.1 12.1 3.990 13.3 7.8 0.2 12.7 1.439 14.6 2.5 0.0 17.6 3.312 10.9 0.7 8.9 0.0III 4.918 7.3 8.2 4.6 9.8 4.046 14.8 9.3 0.4 11.0 1.492 18.8 3.9 0.0 14.7 3.261 9.2 1.6 11.1 0.0IV 4.895 6.8 6.9 5.7 11.3 4.102 16.4 8.2 0.7 12.2 1.503 19.7 3.2 0.0 16.2 3.131 4.8 1.5 13.1 0.0V 4.101 –11 6.8 12.1 0.0 3.625 2.9 7.9 3.7 9.7 1.360 8.3 4.1 0.3 13.0 2.323 –22 2.4 22.8 0.0
High altitude (Jos), 1295 m a.s.l.Baseline 2.592 5.1 8.0 0.0 1.534 1.2 18.4 0.0 0.310 1.4 24.8 0.0 0.221 11.1 9.7 0.0II 2.693 4.2 8.6 3.7 0.0 1.917 24.0 1.4 11.3 0.0 0.438 41.3 0.0 18.4 0.0 0.435 106 7.9 4.8 0.0III 2.695 4.3 10.3 2.9 0.0 1.991 29.8 2.4 9.2 0.0 0.471 51.9 0.0 16..5 0.0 0.532 141 7.2 3.8 0.0IV 2.709 4.9 11.7 2.0 0.0 2.060 34 3.7 7.3 0.0 0.510 64.5 0.0 14.3 0.0 0.625 183 7.3 2.6 0.0V 3.304 28.0 16.4 0.4 0.0 2.384 55.4 9.2 2.6 0.0 0.887 184 0.1 7.6 0.0 0.814 268 10.7 0.5 0.0
Clim Res 32: 229–245, 2006
Climate IV. Baseline water stress for sorghum, milletand rice did not change significantly, whereas theother elements of the scenario were adopted for simu-lating crop yield. Temperature stress also remained atbaseline levels for simulations that adopted ClimatesII, III and IV. The minimum response in the form ofchanges in stress factors is understandable. Becausesolar radiation is the basis for primary biological pro-duction, its effect on crop yield is directly and posi-tively proportional to crop yield.
4.5. Carbon dioxide
Table 4 (second part) depictschanges in simulated crop yield thatcorrespond to increases in CO2 con-centration from 350 to 650 ppm.Increases were observed across therange of concentrations; however,for all crops (especially for maize andsorghum), the rate of increase inyield per unit increase in concentra-tion tended to decline at the higherlevels of CO2 concentration. Forexample, for sorghum, the 130 ppmchange in concentration betweenClimate II and Climate III wasresponsible for a 5.2% change inyield, while the greater 150 ppmchange in concentration betweenClimate III and Climate IV was asso-ciated with a change of only 0.4%.Water stress, temperature stress andaeration stress remained at baselinelevels across the range of CO2 con-centrations.
5. EFFECTS OF CLIMATE CHANGE ON CROP YIELD
5.1. Maize
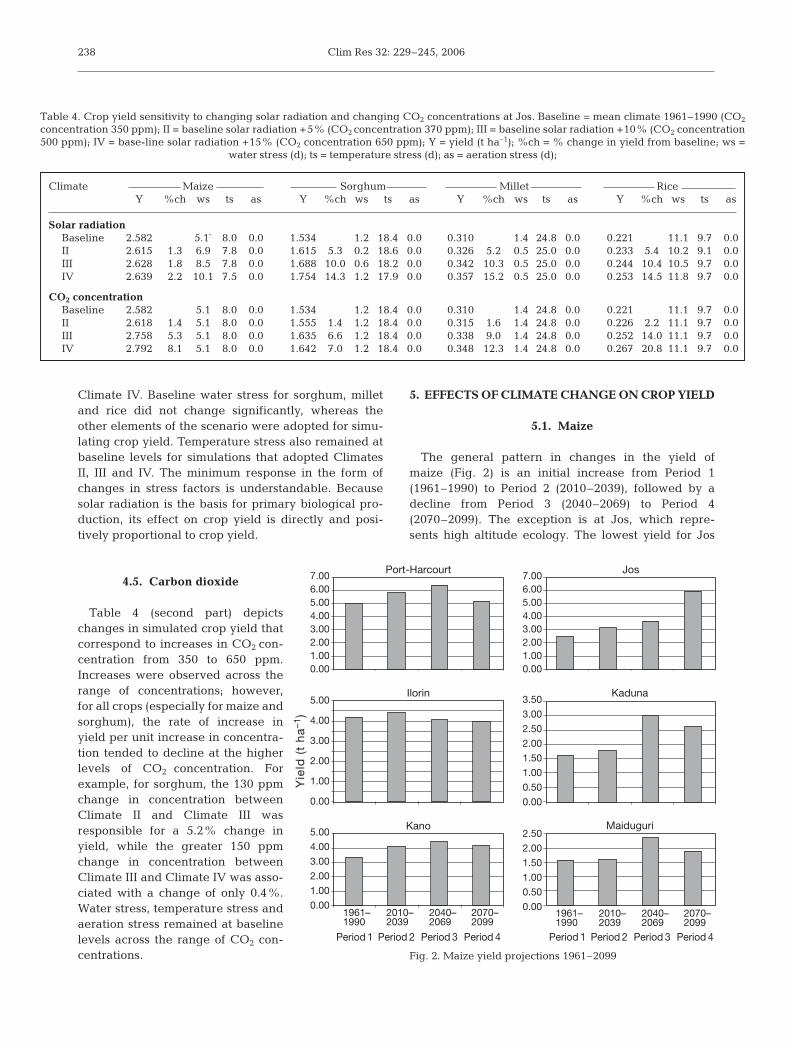
The general pattern in changes in the yield ofmaize (Fig. 2) is an initial increase from Period 1(1961–1990) to Period 2 (2010–2039), followed by adecline from Period 3 (2040–2069) to Period 4(2070–2099). The exception is at Jos, which repre-sents high altitude ecology. The lowest yield for Jos
238
Table 4. Crop yield sensitivity to changing solar radiation and changing CO2 concentrations at Jos. Baseline = mean climate 1961–1990 (CO2
concentration 350 ppm); II = baseline solar radiation +5% (CO2 concentration 370 ppm); III = baseline solar radiation +10% (CO2 concentration500 ppm); IV = base-line solar radiation +15% (CO2 concentration 650 ppm); Y = yield (t ha–1); %ch = % change in yield from baseline; ws =
water stress (d); ts = temperature stress (d); as = aeration stress (d);
Climate Maize Sorghum Millet RiceY %ch ws ts as Y %ch ws ts as Y %ch ws ts as Y %ch ws ts as
Solar radiationBaseline 2.582 5.1` 8.0 0.0 1.534 1.2 18.4 0.0 0.310 1.4 24.8 0.0 0.221 11.1 9.7 0.0II 2.615 1.3 6.9 7.8 0.0 1.615 5.3 0.2 18.6 0.0 0.326 5.2 0.5 25.0 0.0 0.233 5.4 10.2 9.1 0.0III 2.628 1.8 8.5 7.8 0.0 1.688 10.0 0.6 18.2 0.0 0.342 10.3 0.5 25.0 0.0 0.244 10.4 10.5 9.7 0.0IV 2.639 2.2 10.1 7.5 0.0 1.754 14.3 1.2 17.9 0.0 0.357 15.2 0.5 25.0 0.0 0.253 14.5 11.8 9.7 0.0
CO2 concentrationBaseline 2.582 5.1 8.0 0.0 1.534 1.2 18.4 0.0 0.310 1.4 24.8 0.0 0.221 11.1 9.7 0.0II 2.618 1.4 5.1 8.0 0.0 1.555 1.4 1.2 18.4 0.0 0.315 1.6 1.4 24.8 0.0 0.226 2.2 11.1 9.7 0.0III 2.758 5.3 5.1 8.0 0.0 1.635 6.6 1.2 18.4 0.0 0.338 9.0 1.4 24.8 0.0 0.252 14.0 11.1 9.7 0.0IV 2.792 8.1 5.1 8.0 0.0 1.642 7.0 1.2 18.4 0.0 0.348 12.3 1.4 24.8 0.0 0.267 20.8 11.1 9.7 0.0
Port-Harcourt
Ilorin Kaduna
Maiduguri
7.006.005.004.003.002.001.000.00
5.00
4.00
3.00
2.00
1.00
0.00
Yie
ld (
t h
a–1
)
Jos7.006.005.004.003.002.001.000.00
Kano5.00
4.00
3.00
2.00
1.00
0.001961–1990
2070–2099
2040–2069
2010–2039
3.50
3.00
2.50
2.00
1.50
1.00
0.50
0.00
2.50
2.00
1.50
1.00
0.50
0.001961–1990
2070–2099
2040–2069
2010–2039
Period 1 Period 2 Period 3 Period 4 Period 1 Period 2 Period 3 Period 4
Fig. 2. Maize yield projections 1961–2099
Adejuwon: Climate change and crop yield in Nigeria
was recorded for the 1961–1990 period. Increases inyield, projected to start during the second periodearly in the 21st century, are projected to continueuntil the end of the century. For Kano, which rep-resents the Sudan savannah ecology, Maiduguri(Sahelian ecology), Kaduna (Northern Guinean eco-logy) and Port Harcourt, (forest zone ecology),peak yields are projected for the third period (2040–2069). For Ilorin, which represents the SouthernGuinean ecology, peak yield is projected for thesecond period (2010–2039). The yield projected forthe fourth period is lower than the yield recorded forthe first.
The general increase in yield is explained in partby increases in CO2 concentration. The steadyincrease in yield at the high altitude location corre-sponds to a steady decline in water stress from 47 dduring the 1961–1990 period to 15 d during thefourth period, i.e. 2070–2099. The duration of tem-perature stress also declined from 2.6 to 0.5 d. Sincethe high altitude site also experienced the generalwarming trend, one could conclude that the currenttemperature levels are sub-optimal and that thewarmer days ahead provide environmental conditionsfor enhanced yield of maize. However, the steadyand significant increases in the yield of maize, espe-cially in the drier zones, are related to increasedrainfall and not increased temperature. In Maiduguri,which falls into the Sahelian ecological zone, theincreases in yield from 1961 to 2069 correspond to adecline in water stress from 46 to 28 d. However, thefurther decline to 25 d during thefourth period seems not to bereflected in continued increase incrop yield. It appears that by thetime of the fourth period, the risingtemperature would have taken overas the limiting factor. In otherwords, the decline in crop yieldfrom 2.75 to 2.31 t ha–1 could beascribed to the increase in tempera-ture stress from 8 to 11 d. Oneshould note here that across thecountry and across the 4 periods,the experiments did not show anystress related to nitrogen, phos-phorus and aeration. When select-ing the soil with which to create thesoil files used, I adopted the morecommonly-cultivated soil series,which in most cases are of moder-ate productivity. In addition, 300 kgha–1 of NPK (Nitrogen PhosphorusPotassium) was applied as part ofthe operations schedule.
5.2. Sorghum
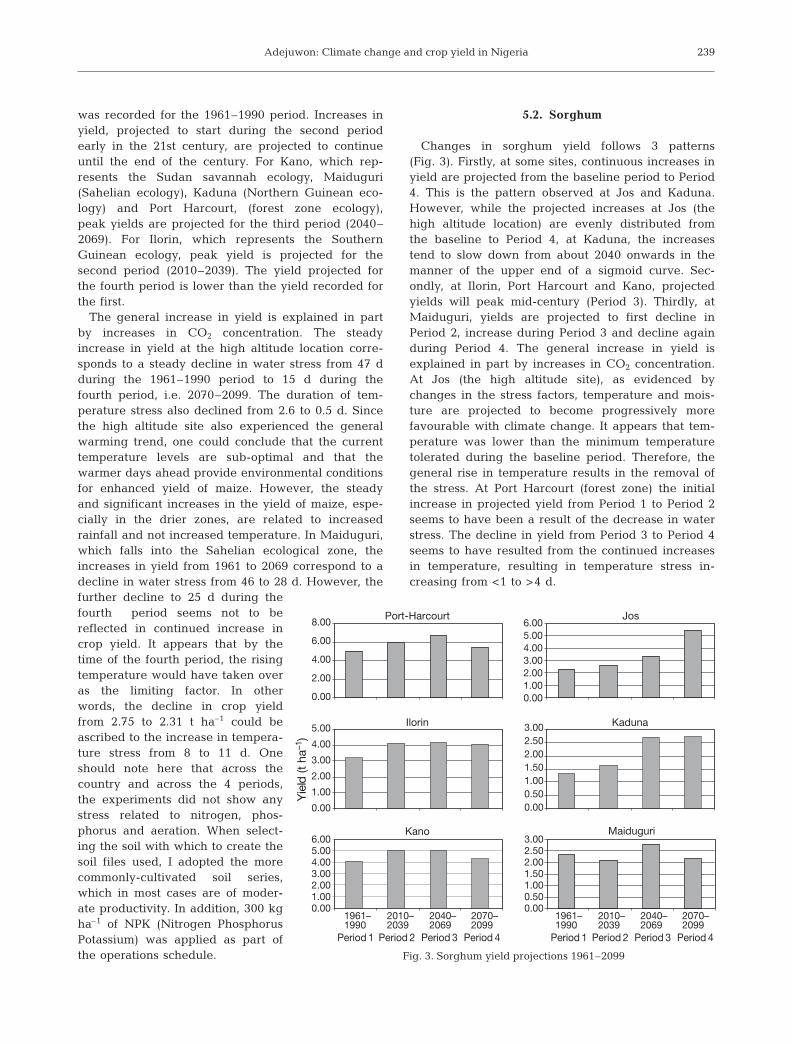
Changes in sorghum yield follows 3 patterns(Fig. 3). Firstly, at some sites, continuous increases inyield are projected from the baseline period to Period4. This is the pattern observed at Jos and Kaduna.However, while the projected increases at Jos (thehigh altitude location) are evenly distributed fromthe baseline to Period 4, at Kaduna, the increasestend to slow down from about 2040 onwards in themanner of the upper end of a sigmoid curve. Sec-ondly, at Ilorin, Port Harcourt and Kano, projectedyields will peak mid-century (Period 3). Thirdly, atMaiduguri, yields are projected to first decline inPeriod 2, increase during Period 3 and decline againduring Period 4. The general increase in yield isexplained in part by increases in CO2 concentration.At Jos (the high altitude site), as evidenced bychanges in the stress factors, temperature and mois-ture are projected to become progressively morefavourable with climate change. It appears that tem-perature was lower than the minimum temperaturetolerated during the baseline period. Therefore, thegeneral rise in temperature results in the removal ofthe stress. At Port Harcourt (forest zone) the initialincrease in projected yield from Period 1 to Period 2seems to have been a result of the decrease in waterstress. The decline in yield from Period 3 to Period 4seems to have resulted from the continued increasesin temperature, resulting in temperature stress in-creasing from <1 to >4 d.
239
8.00
6.00
4.00
2.00
0.00
Port-Harcourt
Ilorin Kaduna
Maiduguri
Jos
Kano
5.00
4.00
3.00
2.00
1.00
0.00
6.005.004.003.002.001.000.00
1961–1990
2070–2099
2040–2069
2010–2039
6.005.004.003.002.001.000.00
3.002.502.001.501.000.500.00
3.002.502.001.501.000.500.00
1961–1990
2070–2099
2040–2069
2010–2039
Yie
ld (t
ha–
1 )
Period 1 Period 2 Period 3 Period 4 Period 1 Period 2 Period 3 Period 4
Fig. 3. Sorghum yield projections 1961–2099

Clim Res 32: 229–245, 2006
5.3. Millet
Millet, like sorghum, demonstrates 3 patterns ofyield change over the 140 yr period of study as de-picted in Fig. 4. One pattern characterizes Jos, Ilorinand Kaduna, which together represent the sub-humidmiddle-belt of the country. In this pattern, yields areprojected to follow a consistent straight-line increasepattern from the baseline period to Period 4. The sec-ond pattern characterizes the forest-based location ofPort Harcourt and the semi-arid ecology of Kano.After early, significant increases from the baselineperiod to Period 2, yields are projected to remain highuntil Period 3 and then notably decline toward theend of the century. The third pattern, obtained forMaiduguri (representing the Sahelian ecology), isunique. Projections are for an initial decline early inthe century, followed by an increase between 2040and 2069, to be followed by another decline between2070 and 2099.
The general increase in yield is explained in part byincreases in CO2 concentrations. Projected increasesin the yield of millet from the baseline period toPeriod 4 at Jos, Kaduna and Ilorin correspond todecreases in water stress and to increases in CO2 con-centration. The interpretation here is that the risingminimum and maximum temperatures are not suffi-cient to impose a limitation either directly as a resultof supra-optimal levels or indirectly as a result ofincreased rates of evaporation and transpiration. Forthe forest-based site, namely Port Harcourt, the earlyincreases in yield from the baseline period to Period 2correspond to significant decreasesin water stress, apparently a conse-quence of increased RH. There wereno corresponding projected increasesin water stress or temperature stressat Port Harcourt that could explainthe decrease in yield from Period 3 to4. With respect to Kano, the increasein yield from the baseline period toPeriod 2 could be a consequence ofthe general increase in RH. Thedecrease in yield from the third tothe fourth period does not corre-spond to significant changes in anystress factor. Some marginal changesin aeration stress were observed.Even though the climate of Kano isclassified as semi-arid, rainfall duringthe months of July and August isusually in excess of 250 mm permonth. This is enough to causewater-logging of the surface soilhorizon.
5.4. Rice
Like the other crops, rice seems to demonstrate amixed pattern of responses to climate change across theecological zones (Fig. 5). The most common pattern isan increase in projected yields up to the third period,followed by a levelling-off or a slight decrease duringthe fourth period. This pattern could be observed forMaiduguri (Sahelian ecology), Kano (Sudan ecology),Kaduna (Northern Guinea ecology) and Port Harcourt(forest zone ecology). For Jos, representing high alti-tude ecology, yields are projected to increase, followinga steady and consistent pattern from the baseline pe-riod to the fourth period. For the Ilorin site (SouthernGuinea ecology), projected yields are expected to peakduring the second period after a small early increase.Subsequently, yields are projected to decline to aboutthe 1961–1990 level during the third and the fourthperiods.
The general increase in yield is explained in part byincreases in CO2 concentration and RH. For Port Har-court (forest zone ecology), the pattern of projectedcrop yield changes could be explained by decliningwater stress. Changes in temperature stress are notprojected. It could be noted that increases in precipita-tion are projected for the coastal areas in the climatechange scenario briefly described in Section 2. In theSahelian ecological zone, i.e. Maiduguri, projectedincreases from the baseline period to the third periodcorrespond to a steady decline in water stress. Theslight decline in yield from the third to the fourthperiod seems to be determined by limits imposed
240
Port-Harcourt
Ilorin Kaduna
Maiduguri
3.002.502.001.501.000.500.00
3.002.502.001.501.000.500.00
2.00
1.50
1.00
0.50
0.00
2.00
1.50
1.00
0.50
0.00
Yie
ld (t
ha–
1 )
Jos
Kano
1961–1990
2070–2099
2040–2069
2010–2039
1.401.201.000.800.600.400.200.00
1.201.000.800.600.400.200.00
1961–1990
2070–2099
2040–2069
2010–2039
Period 1 Period 2 Period 3 Period 4 Period 1 Period 2 Period 3 Period 4
Fig. 4. Millet yield projections 1961–2099

Adejuwon: Climate change and crop yield in Nigeria
by the increasing temperature. Eventhough total annual precipitation is pro-jected to decline, the growing seasonrainfall does not, according to the cli-mate change projections outlined ear-lier. Moreover, the levels of rainy seasontemperature projected are still relativelylow during the first 2 periods.
At the high altitude location, pro-jected changes in both water stress andtemperature stress appear to favourincreases in yield. The steady and con-sistent increases in yield correspond tosteady decreases in water stress result-ing from increasing rainfall. Duration oftemperature stress declined from 4 to 1 dfrom the baseline period to the secondperiod. Subsequently, it increased to 3 dduring the fourth period. However, thenegative effects of increased tempera-ture stress during the fourth periodappear to have been masked by the pos-itive effects of the lower water stress.
5.5. Cassava
Projections depicted in Fig. 6 indicatesignificant increases in the yield of cas-sava from the baseline period to thefourth period, in all the semi-arid andsub-humid northern ecological zones.For Kaduna, the increases are from<300 kg ha–1 during the baseline periodto >3 t towards the end of the 21stcentury. The simulations are in essencetheoretical because these areas lie out-side the current cassava-producingareas. For example, while the simulatedyield for Jos during the baseline periodis only 800 kg ha–1, that for Port Hacourtis as high as 8 t ha–1. As a confirmation ofthis, water stress in Kaduna ran as highas 114 to 175 d compared with <20 d forPort Harcourt. Cassava is a 2-seasoncrop: the stress is computed for its entiregrowing period. The increases beingprojected for the northern, more aridzones are indicative that the cultivationrange may be extended northwards inresponse to climate change. Such anextension could be based on increasedtemperature at the high altitude sitesand higher rainfall in the other areas. InPort Harcourt (forest zone), the indica-
241
Port-Harcourt
Ilorin Kaduna
Maiduguri
3.002.502.001.501.000.500.00
3.002.502.001.501.000.500.00
2.50
2.00
1.50
1.00
0.50
0.00
3.002.502.001.501.000.500.00
1.201.000.800.600.400.200.00Y
ield
(t h
a–1 )
Jos
Kano
1961–1990
2070–2099
2040–2069
2010–2039
2.00
1.50
1.00
0.50
0.001961–1990
2070–2099
2040–2069
2010–2039
Period 1 Period 2 Period 3 Period 4 Period 1 Period 2 Period 3 Period 4
Fig. 5. Rice yield projections 1961–2099
Port-Harcourt
Ilorin Kaduna
Maiduguri
12.00
10.00
8.00
6.00
4.00
2.00
0.00
5.00
4.00
3.00
2.00
1.00
0.00
3.503.002.502.001.501.000.500.00
7.006.005.004.003.002.001.000.00
7.006.005.004.003.002.001.000.00
Yie
ld (t
ha–
1 )
Jos
Kano
1961–1990
2070–2099
2040–2069
2010–2039
3.00
2.50
2.00
1.50
1.00
0.50
0.001961–1990
2070–2099
2040–2069
2010–2039
Period 1 Period 2 Period 3 Period 4 Period 1 Period 2 Period 3 Period 4
Fig. 6. Cassava yield projections 1961–2099

Clim Res 32: 229–245, 2006
tions are a slight increase from 8 t ha–1 during the base-line period to 10 t ha–1 during the third period. The pat-tern in Ilorin, the sub-humid southern zone, is pro-jected to consist of an initial modest increase followedby a substantial decrease. The initial increase corre-sponds to a decline in the duration of water stress from96 to 74 d. The subsequent decreases in projected yieldare not supported by a corresponding decrease inwater stress. However, during the period, the durationof temperature stress increased from 2 to 7 d while aer-ation stress increased from 19 to 29 d.
6. DISCUSSION
6.1. Effects of changing climate parameters
Farmers’ most common response to the problem ofrainfall variability is the changing of planting dates,the assumption being that avoidance of the earlierparts of the growing season, when rainfall is more vari-able, can result in enhanced productivity. In the resultspresented earlier, however, lower rather than higheryields were recorded for May plantings (when theseason was well under way) compared with Marchplantings (at the beginning of the season), despite theincreased rainfall and reduced water stress for cropsplanted in May. In the current set of experiments, theprobable explanation appears to be the higher levels ofaeration stress for May compared with March plan-tings. While the maize crop planted in March did notexperience any aeration stress, the crop planted inMay experienced 18 d of aeration stress. Similar obser-vations are made with respect to sorghum and millet,which like maize are upland crops. However, nosuch contrasts in aeration and water stresses betweenMarch and May plantings were observed with respectto rice, which prefers wetter conditions. It thus appearsthat the negative effects of increasing aeration stresscould override the positive effects of decreasing waterstress.
The decrease in yield associated with delayed plant-ing dates has been explained in an experiment con-ducted on the research farm of Obafemi AwolowoUniversity, Nigeria (Fakorede 1985). The decrease inyield was ascribed to the higher levels of solar radia-tion received during the earlier parts of the growingseason. The climate data from Ilorin and the universitysite indicate that sunshine hours, average daily tem-perature, evaporation and accumulated heat unitsdecreased as the season progressed, whereas RHincreased. Although maize planted in March couldreceive as much as 5 h of full sunshine per day duringthe grain filling phase, those planted in early Maymight not even receive as much as 3 h of full sunshine
per day for grain filling. Osafo (1976; working inKumasi, Ghana), and Cooper & Law (1977; working inKenya) arrived at similar conclusions.
Some of the effects of climate on crop yield can onlybe understood in the broader context. There is, forexample, the decrease in yield associated withincreased rainfall when the values of the other factorsare not changed. Crop plants require specific amountsof materials for optimum performance and maximumyield; additional supplies that are in excess of optimumrequirements will not lead to enhanced yields, andmay lead instead to reduced yields. This ecologicalprinciple is derived from a combination of Liebig’s‘law of the minimum’ and Shelford’s ‘law of tolerance’(Liebig 1840, Shelford 1913, Odum 1971). The waterrequirement of plants is assumed to be fully met whenthe water available through precipitation is suffi-cient to balance potential evapotranspiration (Garnier1960). At Ibadan, measured potential evapotranspira-tion amounted on average to about 75 mm during thehumid growing season (Garnier 1961). The implica-tion of this for crop yield response to climate changeis that whenever baseline precipitation is >75 mm,additional rainfall will not result in additional cropyield. Additional rainfall could also result in reducedcrop yield, owing to the fact that it contributes toincreased gravitational soil water and increasedaeration stress.
Furthermore, the way in which increases in RH areconverted to increases in yield is not clear from theresults, as neither water stress nor aeration stress seemto be affected for any of the crops, whether planted inMarch or in May. It is conceivable that increasing RHleads to higher rates of dew formation. Dew formed onleaves could be absorbed through the cuticle of normalepidermal cells, or through specialised cells, thus pro-viding an alternative source of moisture and avoidingthe much more stressful uptake of soil water throughroot hairs (Daubenmire 1974). While water intakethrough root hairs is subject to limitation by the ab-sorptive capacity of the atmosphere exercised throughevaporation and transpiration, water intake from theleaf surface may not be subject to such limits and couldpermit the crop plants to breach the limits of crop per-formance that are normally based strictly on rates ofevapotranspiration.
It appears that, in general, higher temperatures cre-ate more favourable conditions for crop growth at thehigher altitude site. This is to be expected, becausebaseline temperatures are sub-optimal. As the climatebecomes warmer, the temperature approaches thelevel required for optimum performance, and cropyield is enhanced. On the other hand, baseline tem-peratures at the low altitude site appear to be supra-optimum. Thus, as the climate becomes warmer, tem-
242

Adejuwon: Climate change and crop yield in Nigeria
perature approaches the upper limits of tolerance anda decline in yield materialises.
The minimum temperatures at Ibadan and at Jos, theexperimental sites, are lower than the optimum tem-perature for most varieties of the crop plants. Thelower end of the range of tolerance for maize is 26°C(Johnston 1958). Thus, there could be potential forincreased temperature to promote increased yield ofmaize before the maximum temperature begins toconstrain yield (as observed for Ibadan in Table 3).Furthermore, before this point is reached, the in-creases in yield will become smaller. The simulationoutputs seem to have captured this stage for maize andsorghum (see Ibadan values in Table 3).
In the EPIC model the potential yield is determinedprimarily by the amount of solar radiation received.The other climatic-determining factors play a con-straining role in reducing the potential yields (Williamset al. 1989). This conforms to the explanations of Fako-rede (1985) and Osafo (1976) regarding the higheryields of March compared with May plantings ofmaize. It also conforms to our observations from anearlier study, to the effect that lower amounts of solarradiation that characterize the main growing seasonmonths in Nigeria tend to depress the yield of maize(Adejuwon 2002). It is conceivable that the levels ofsolar radiation received at the experiment site duringthe growing season for the 1961–1990 period weresub-optimal for the current varieties of the crop (seeTable 4). If changes in climate turn out in reality to beas they are currently projected (Houghton et al. 2001),West Africa may experience substantial increases inthe yields of cereal crops, not only as a result of in-creases in moisture supply or temperature, but also inresponse to higher levels of solar radiation.
Besides solar radiation, CO2 in the atmosphere andwater from both the soil and the atmosphere are essen-tial for the processes of photosynthesis or primary bio-logical productivity. One would expect an enhancedlevel of CO2 concentration in the atmosphere to in-crease the gradient between the external air and theair spaces inside the leaves, thus promoting higherlevels of diffusive transfer and absorption of CO2 intothe chloroplasts and higher levels of photosynthesisand biological productivity. Another important physio-logical effect of CO2-enrichment is the closure ofstomata. Accordingly, a rise in atmospheric CO2 mayreduce transpiration even while promoting photo-synthesis. This dual effect may improve water-useefficiency (Fischer 1996). Therefore, higher concentra-tions of atmospheric CO2 should also induce plants tobe more economical in the use of water. With higherconcentrations of CO2, crops should be less subject towater stress in areas normally considered marginalwith respect to precipitation. The sensitivity of maize
to changes in atmospheric concentration of CO2 atJos in Central Nigeria (Table 4) confirms this.
However, according to Fischer (1996), plant speciesvary in their response to CO2-enrichment in part owingto differing photosynthetic mechanisms. C3 plants(wheat, rice, and soybean) use part of the solar energythey absorb in photorespiration. In this process, someof the carbon fixed into carbohydrates is re-oxidised toCO2. C3 species tend to respond readily to increasedCO2 levels because photorespiration is suppressedunder these conditions. On the other hand, in C4 plants(maize, millet, sorghum and sugarcane), CO2 is trappedinside the leaf and becomes concentrated in the cellsthat carry out photosynthesis. These plants are morephotosynthetically-efficient under current levels ofCO2 concentration. This explains the progressivelysmaller responses of maize sorghum and millet, whichare C4 plants, to higher CO2 concentrations. Theresponse of rice, a C3 plant, to the same levels of CO2
concentrations appears to be much more vigorous.With CO2 concentration at 650 ppm, the percentagechange in yield over baseline was 8.1 for maize, 7.0for sorghum and 12.3 for millet compared with 20.8for rice (Table 4).
6.2. Effects of projected climate change on the yieldof each crop
Increases in crop yield during the first half of the 21stcentury are probably related to lower water stress as aresult of increased rainfall, higher levels of incidentsolar radiation resulting from less cloud cover, andhigher levels of CO2 concentration resulting from un-mitigated increases in anthropogenic emissions. Thereduction in yields towards the end of the centurycould be ascribed to the attainment of supra-optimumlevels of temperature and CO2 concentrations.
It should be noted that the climate change scenarioused for the assessment of the current study assumes1% per annum increases in the concentration of atmo-spheric CO2. The assumption is based on failure to putinto practice the prescriptions of the Kyoto Protocol, alack of progress in developing alternative sources ofenergy to fossil fuels and continued high rates of pop-ulation increase. In other words, this study has adopteda ‘worst case’ climate change scenario. Ironically, theworst-case climate change scenario appears to be pro-ducing a ‘best-case’ food production scenario. Thereare other equally plausible climate change scenariosbased on lower rates of increase in concentrations ofatmospheric greenhouse gases. If any of these shouldturn out to be closer to the course of the real worldchanges in global climate, the effects on crop yieldmay be substantially different from that outlined
243

Clim Res 32: 229–245, 2006
above. While the direction of change may be the same,the magnitude of change could be quite different. Itmay take up to 100 yr to attain what the foregoingassessment suggested would be realized in 50 yr. Inother words, we might not have reached the stage ofdeclining crop yield by 2100, and crop yield changesmay remain positive until the end of the 21st century.
7. SUMMARY AND CONCLUSIONS
In the present study, EPIC was used in the assess-ment of the effects of climate change on the yield ofmaize, sorghum, rice, millet and cassava. Yam, whichis also listed among the major food crops in Nigeria,was not included in the study because it is not on theEPIC crop list. Sensitivity of the various crops tochanges in climate elements was demonstrated. Themodel was used to show crop yield response tochanges in rainfall, solar radiation, temperature, RHand CO2.
Solar radiation is the primary determinant of biomassyield from which other yields are derived (Williams etal. 1989). Climate change projections by the variousGCMs for West Africa are for a higher level of solarradiation as a consequence of lower levels of cloudcover. From our own findings, the decrease in cloudcover with respect to the 1961–1990 mean is projectedto continue to the end of the 21st century.
The indications are that, in general, there will beincreases in crop yield across all ecological zones asthe climate changes during the 21st century. In mostcases, the increases will continue until mid-century.However, towards the end of the century, the rate ofincrease will tend to slow down. This could result inyields that are lower in the last quarter than in the thirdquarter of the century. The yield increases during theearlier parts of the century will not be completelyreversed. Thus, for the century as a whole, the projec-tions are for a net increase. As should be expected,there will be significant differences between the vari-ous ecological zones. For example, there will be sub-stantial increases in the yield of cassava in the drierareas compared with the rainforest zone, where theremay be a net decrease in yield. The implication of thisis that the cassava-growing region could be extendednorthwards. However, yield in the wetter forest areaswill still remain much higher than yield in the north.Another exception to the general trend is that yield ofall the crops will continue to increase right to the endof the century on the high altitude Jos Plateau.
In conclusion, for the rest of the current century, therisks of crop failure due to occasional droughts willmost likely remain. As the climate changes during thefirst half of the century, risks of crop failure will most
likely be tempered due to crop yield increases inresponse to higher levels of solar radiation, rainfall,atmospheric humidity and CO2 concentrations. How-ever, during the second half of the century, the risks ofcrop failure will be driven by a new set of climaticfactors, especially those based on increasing globalwarming. The current moisture-based limiting factorsare projected to be replaced by temperature-basedones. In the context of limiting-factor ecology, supra-optimum temperatures will tend to replace inadequatemoisture as the factor most closely approaching thelimits of tolerance of the crop plants and therefore mostlikely to determine changes in crop yield.
Acknowledgements. This study was conducted as part of aresearch project funded and supported by 3 organizations:START (SysTem for Analysis, Research and Training), NOAA(USA National Oceanic and Atmospheric Administration) andAIACC (Assessment of Impacts of and Adaptations to Cli-mate Change). The supporting organizations for AIACC are:START, TWAS (Third World Academy of Sciences) and UNEP(United Nations Environment Programme).
LITERATURE CITED
Adejuwon JO (2002) Extended weather forecasts as a man-agement tool for the enhancement of crop productivity inSub-Saharan West Africa. J Niger Meteorol Soc 3:25–38
Adejuwon JO (2005a) Food crop production in Nigeria. I.Present effects of climate variability. Clim Res 30:53–60
Adejuwon JO (2005b) Assessing the suitability of EPIC CropModel for use in the study of impacts of climate variabilityand climate change in West Africa. Singapore J TropGeogr 24:44–60
Adejuwon JO, Omotayo MO (2006) Potential climate changein Nigeria during the 21st century: the worst case sce-nario. In: Adejuwon JO, Ogunkoya OO (eds) Climate vari-ability, climate change and food security in Nigeria.Obafemi Awolowo University Press, Ile-Ife
Adejuwon JO, Balogun EE, Adejuwon SA (1990) On theannual and seasonal patterns of rainfall fluctuations inSub-Saharan West Africa. Int J Climatol 10:839–848
Butler JW, Riha Riha SJ (1989) GAPS: a general purposeformulation model of the soil–plant–atmosphere system,version 1.1 User’s manual. Department of Agronomy,Cornell University, Ithaca, NY
Cabelguenne M, Jones CA, Marty JR, Dyke PT, WilliamsJR (1990) Calibration and validation of EPIC for croprotations in southern France. Agric Systems 33:153–171
Cooper PJM, Law R (177) Soil temperature and its associationwith maize yield variation in the highlands of Kenya.J Agric Sci 89:355–363
Daubenmire RF (1974) Plants and environment: a text book ofplant autecology, 3rd edn. John Wiley & Sons, New York
Easterling WE, Rosenberg NJ, McKenney MS, Jones CA,Dyke PT, Williams JR (1992) Preparing the erosion pro-ductivity impact calculator (EPIC) model to simulate cropresponse to climate change and the direct effects of CO2.Agric For Meteorol 59:17–34
Easterling WE, Crosson PR, Rosenberg NJ, McKenney MS,Katz LA, Lemon KM (1993) Agricultural impacts of and
244

Adejuwon: Climate change and crop yield in Nigeria
responses to climate change in the Missouri-Iowa-Nebraska-Kansas (MINK) Region. Clim Change 24:23–62
Easterling WE, Chen X, Hays C, Brandle JR, Zhang H (1996)Improving the validation of model-simulated crop yieldresponse to climate change: an application to the EPICmodel. Clim Res 6:263–273
Fakorede MAB (1985) Response of maize to planting dates ina tropical rain forest location. Explor Agric 21:19–50
Fischer G, Frohberg K, Keyzer MA, Parikh KS (1988) Linkednational models: a tool for international policy analysis.Kluwer, Amsterdam
Fischer G, Frohberg K, Parry ML, Rosenzweig C (1996)Impacts of potential climate change on global and re-gional food production and vulnerability. In: Downing TE(ed) Climate change and world food security. Springer-Verlag, Heidelberg, p 115–160
Garnier BJ (1960) Maps of water balance in West Africa. BullIFAN Ser A 22:709–722
Garnier BJ (1961) Delimitation of the humid tropics. GeogrRev 51:339–347
Houghton JT, Meira Filho LG, Bruce J, Lee H, Callander BA,Haites E, Harris N, Maskell K (1995) Climate change 1994.Radiative forcing of climate change and an evaluation ofthe IPCC IS92 emission scenarios. Cambridge UniversityPress, Cambridge
Houghton JT, Ding Y, Griggs DJ, Noguer M, van der LindenPJ, Xiaosu D (2001) Climate change 2001: the scientificbasis. Contribution of Working Group I to the ThirdAssessment Report of the Intergovernmental Panel onClimate Change. Cambridge University Press, Cambridge
Hulme M, Wigley TML, Barrow EM, Raper SCB, Cantella A,Smith S, Chipanshi AC (2000) Using a climate scenariogenerator for vulnerability and adaptation assessments:MAGICC and SCENGEN version 2.4. University of EastAnglia, Norwich
Hulme M, Doherty R, Ngara T, New M, Lister D (2001)African climate change: 1900–2100. Clim Res 17:145–168
Ibigbami IA, Areola O, Akintola F (1979) The soils of thelower Ngeli Plain, Plateau state (a preliminary soil surveyfor irrigated agriculture). University of Ibadan, Ibadan
Johnston BF (1958) The staple food economies of westerntropical Africa. Stanford University Press, Stanford, CA
Jones JW, Boote KJ, Hoogenboom G, Jagtar SS, WilkersonGG (1989) SOYGRO V 5.42, soybean crop growth simula-tion model, User’s guide. Department of AgriculturalEngineering and Department of Agronomy, Universityof Florida, Gainsville
Keay RWJ (1959) An outline of Nigerian vegetation. Govern-ment Printer, Lagos
Kiniry JR, Spanel DA, Williams JR, Jones CA (1990) Demon-stration and validation of crop grain yield simulation byEPIC. US Dept Agric Tech Bull 1768:220–235
Liebig J (1840) Chemistry and its applications to agricultureand physiology. Taylor & Walton, London
McKenney MS, Easterling WE, Rosenberg NJ (1992) Simula-tion of crop productivity and responses to climate changein the year 2030: the role of future technologies, adjust-ments and adaptations. Agric For Meteorol 59:103–137
MOE (Ministry of Environment of the Federal Republic ofNigeria) (2003) Nigeria’s first communication under theUNFCCC. MOE, Abuja
Moss RP (1957) Report on the classification of the soils foundover sedimentary rocks in Western Nigeria. Ministry ofAgriculture and Natural Resources, Ibadan
Murdock G, Ojo-Atere J, Colborne G, Olomu EI, OdugbesanEM (1976) Soils of the Western State savanna in Nigeria.Land Resources Study 23. Land Resources Division, Min-istry of Overseas Development, Tolsworth Tower
Nakicenovic N, Swart R (2000) Emission scenarios 2000:Special Report of the Intergovernmental Panel on ClimateChange. Cambridge University Press, Cambridge
Nicholson SE (2001) Climatic and environment change inAfrica during the last two centuries. Clim Res 17:123–144
Nwaka GIC (1997) Soil survey and fertility baseline data col-lection for NALDA farm site at Tikau, Yobe state, Nigeria.National Agricultural Land Development Authority, Abuja
Odum EP (1971) Fundamentals of ecology. Saunders CollegePublishing, Philadelphia, PA
Osafo DM (1976) Weather conditions and the growth of maizein the Kumasi area of Ghana: an analysis of the growth ofa maize variety sown on different days. Ghana J Agric Sci9:25–34
Rinaldi M (2001) Application of EPIC model for irrigationscheduling of sunflower in southern Italy. Agric WaterManage 49:185–196
Ritchie JT (1991) Specification of the ideal model for predict-ing crop yields. In: Muchow RC, Bellamy JA (eds) Climaterisks in crop production: models and management for thesemi arid tropics and sub tropics. CAB International,Wallingford, p 97–122
Roloff G, De-Jong R, Nolin MC (1998) Crop yield, soil tem-perature and sensitivity of EPIC under central-easternCanadian conditions. Can J Soil Sci 78:431–439
Rosenberg NJ, McKenney MS, Easterling WE, Lemon KM(1992) Validation of EPIC model simulations of cropresponses to current climate and CO2 conditions: com-parison with census, expert judgement and experimentalplot data. Agric For Meteorol 59:35–51
Shelford VE (1913) Animal communities in temperateAmerica. University of Chicago Press, IL
Smyth AJ, Montgomery RF (1962) Soil and land use in centralwestern Nigeria. Government of Western Nigeria, Ibadan
Tsuji GY, Uehara G, Balas S (1994) DSSAT version 3. Univer-sity of Hawai, Honolulu
Tubiello FN, Rosenzweig C, Goldberg RA, Jagtap S, Jones JW(2002) Effects of climate change on US crop production:simulation results using two different GCM scenarios.Part I: wheat, potato, maize, and citrus. Clim Res 20:259–270
USCP (1994) Guidance for vulnerability and adaptationassessment version 1.0. US Country Studies Program,Washington, DC
Williams JR, Jones CA, Kiniry JR, Spanel DA (1989) The EPICcrop growth model. Trans Am Soc Agric Eng 32:498–511
Williams JR, Jones CA, Dyke PT (1990) The EPIC model. USDept Agric Tech Bull 1768:3–92
245
Editorial Responsibility: Otto Kinne,Oldendorf/Luhe, Germany
Submitted: July 14, 2005; Accepted: April 5, 2006Proofs received from author(s): October 3, 2006