Embed Size (px)
Citation preview
i
FEEDcities projectFood Environment Description in cities – eastern Europe and central Asia Sarajevo. The Federation of Bosnia and Herzegovina. Bosnia and Herzegovina
Technical reportFebruary 2019

FEEDcities projectFood Environment Description in cities – eastern Europe and central Asia
Technical reportSarajevo. The Federation of Bosnia and Herzegovina. Bosnia and HerzegovinaFebruary 2019
AbstractThis technical report presents the results of a cross-sectional survey conducted in Sarajevo, the Federation of Bosnia and Herzegovina, Bosnia and Herzegovina, between June and August 2017, as part of the FEEDcities Project (Food Environment Description in cities – eastern Europe and central Asia). The aim of the report is to describe the city’s local street food and takeaway food environment, exploring the characteristics of food vending sites, the industrially produced and homemade foods they typically offer, and the nutritional composition of these foods. Finally, the report provides guidance on how to address its findings through policy action.
The study was conducted through a bilateral partnership between the World Health Organization (WHO) and the Institute of Public Health of the University of Porto, in collaboration with the Faculty of Medicine, the Faculty of Nutrition and Food Sciences, the Faculty of Pharmacy of the University of Porto (WHO registration 2015/591370 and 2017/698514) and the Institute of Public Health of the Federation of Bosnia and Herzegovina. The study was funded through a voluntary contribution of the Ministry of Health of the Russian Federation, and through a contribution made by the Swiss Agency for Development and Cooperation (SDC)/Swiss Government to a joint WHO/SDC project, “Reducing Health Risk Factors in Bosnia and Herzegovina: Developing and Advancing Modern and Sustainable Public Health Strategies, Capacities and Services to Improve Population Health”, implemented in Bosnia and Herzegovina.
Keywords
STREET FOODTAKEAWAY FOODREADY-TO-EAT FOODNUTRITIONAL COMPOSITIONTRANS-FATTY ACIDS
SODIUMPOTASSIUMFOOD ANALYSISBOSNIA AND HERZEGOVINATHE FEDERATION OF BOSNIA AND HERZEGOVINA
Address requests for publications of the WHO Regional Office for Europe to: Publications WHO Regional Office for Europe UN City, Marmorvej 51 DK-2100 Copenhagen Ø, DenmarkAlternatively, complete an online request form for documentation, health information or permission to quote or translate on the Regional Office web site (http://www.euro.who.int/pubrequest).
© World Health Organization 2018 All rights reserved. The Regional Office for Europe of the World Health Organization welcomes requests for permission to reproduce or translate its publications, in part or in full.
The designations employed and the presentation of the material in this publication do not imply the expression of any opinion whatsoever on the part of the World Health Organization concerning the legal status of any country, territory, city or area or of its authorities, or concerning the delimitation of its frontiers or boundaries. Dotted lines on maps represent approximate border lines for which there may not yet be full agreement.
The mention of specific companies or of certain manufacturers’ products does not imply that they are endorsed or recommended by the World Health Organization in preference to others of a similar nature that are not mentioned. Errors and omissions excepted, the names of proprietary products are distinguished by initial capital letters.
All reasonable precautions have been taken by the World Health Organization to verify the information contained in this publication. However, the published material is being distributed without warranty of any kind, either express or implied. The responsibility for the interpretation and use of the material lies with the reader. In no event shall the World Health Organization be liable for damages arising from its use. The views expressed by authors, editors, or expert groups do not necessarily represent the decisions or the stated policy of the World Health Organization.
V
ContentsContributors ..............................................................................................................................................viii
Acknowledgements ..................................................................................................................................viii
Abbreviations ..............................................................................................................................................ix
Executive summary .....................................................................................................................................ix
1. Introduction .......................................................................................................................................... 1
2. Objectives .............................................................................................................................................. 3
3. Methods ................................................................................................................................................ 4
Eligibility criteria .................................................................................................................................... 4Sampling of vending sites ..................................................................................................................... 4Characterization of vending sites and foods offered ............................................................................ 5Selection, collection and analysis of food samples .............................................................................. 7Statistical analysis .................................................................................................................................. 8
4. Results ................................................................................................................................................... 9
Distribution of selected markets and vending sites ............................................................................. 9Characteristics of vendors and vending sites ..................................................................................... 14Characteristics of the food offered ..................................................................................................... 16Nutritional composition of foods collected ........................................................................................ 19
5. Conclusions and policy implications ................................................................................................... 22
6. References .......................................................................................................................................... 25
Annex 1: Examples of industrial foods collected in food vending sites in Sarajevo ................................ 27
Annex 2: Examples of homemade foods collected in food vending sites in Sarajevo ............................. 30
VI
TablesTable 1. Selected markets selling ready-to-eat food in Sarajevo ............................................................... 5Table 2. Definition of food sample sets ...................................................................................................... 7Table 3. Framework for random sampling of food products ..................................................................... 8Table 4. Characteristics of street food and takeaway food vendors and vending sites in Sarajevo, overall and by municipality ....................................................................................................................... 15Table 5. Physical setup of street food vending sites in Sarajevo, overall and by municipality ................ 15Table 6. Food offer at street food and takeaway food vending sites in Sarajevo, overall, by type of establishment and by municipality ........................................................................................................... 16Table 7. Detailed characteristics of a subsample of homemade foods most commonly offered at street food and takeaway food vending sites in Sarajevo ........................................................................ 17Table 8. Types of beverage offered at street food and takeaway food vending sites in Sarajevo, overall, by type of establishment and by municipality ............................................................................ 18Table 9. Nutritional composition of food samples in Sarajevo evaluated by bromatological analysis ... 20
FiguresFig. 1. Life expectancy in the Federation of Bosnia and Herzegovina, 2013–2016 ................................... 1Fig. 2. Percentage of premature deaths (between ages 30 – 70 years) in the Federation of Bosnia and Herzegovina due to cardiovascular diseases, 2010–2017 ......................................................................... 2Fig. 3. Selected markets and food vending sites in Sarajevo ..................................................................... 9Fig. 4. The Markale market (pijaca) buffer, showing the food vending sites evaluated .......................... 10Fig. 5. The Grbavica market (pijaca) buffer, showing the food vending sites evaluated ......................... 10Fig. 6. The Hrasno market (pijaca) buffer, showing the food vending sites evaluated ............................ 11Fig. 7. The Ciglane market (pijaca) buffer, showing the food vending sites evaluated ........................... 11Fig. 8. The Otoka market (pijaca) buffer, showing the food vending sites evaluated.............................. 12Fig. 9. The Alipašino Polje market (pijaca) buffer, showing the food vending sites evaluated ............... 12Fig. 10. The Vogošća market (pijaca) buffer, showing the food vending sites evaluated ........................ 13Fig. 11. The Dobrinja market (pijaca) buffer, showing the food vending sites evaluated ....................... 13Fig. 12. The Ustanička market (pijaca) buffer, showing the food vending sites evaluated ..................... 14
VII
VIII
ContributorsThis report was written by Patrícia Padrão (University of Porto, Portugal), Gabriela Albuquerque (University of Porto, Portugal), Marcello Gelormini (WHO Consultant), Aida Filipović-Hadžiomeragić (Public Health Institute of the Federation of Bosnia and Herzegovina), Jo Jewell (WHO Europe) and Nuno Lunet (University of Porto, Portugal).
Further contributions for the present work were made by João Breda (WHO Regional Office for Europe), Susana Casal (University of Porto, Portugal), Albertino Damasceno (Eduardo Mondlane University, Mozambique), Inês Morais (WHO Consultant), Pedro Moreira (University of Porto, Portugal), Olívia Pinho (University of Porto, Portugal), Sofia Sousa (University of Porto, Portugal), and Mariana Santos (National Institute of Health, Portugal)
AcknowledgementsPreparation of this report was coordinated by the University of Porto in collaboration with the WHO Regional Office for Europe and WHO Country Office in Bosnia and Herzegovina through the WHO/Swiss Agency for Development and Cooperation (SDC) project “Reducing Health Risk Factors in Bosnia and Herzegovina: Developing and Advancing Modern and Sustainable Public Health Strategies, Capacities and Services to Improve Population Health”, implemented in Bosnia and Herzegovina (2013–18) and financially supported by the Swiss Government, in Biennial Collaborative Agreements (BCAs) in Bosnia and Herzegovina 2016–17 and 2018–19. Funding was also made available via the WHO Europe Project on Noncommunicable Diseases, which is generously funded by the Ministry of Health of the Russian Federation.
The FEEDcities Project in Bosnia and Herzegovina was implemented under the overall guidance of Dr Victor Olsavszky, WHO Representative and head of the Country Office in Bosnia and Herzegovina; Gauden Galea, Director of the Division of Noncommunicable Diseases, WHO Regional Office for Europe; and João Breda, Programme Manager on Nutrition, Physical Activity and Obesity, Division of Noncommunicable Diseases and Promoting Health through the Life-course, WHO Regional Office for Europe.
Technical and logistical support was provided by Boris Rebac, Sanid Vlajčić and Mirza Palo, WHO Country Office in Bosnia and Herzegovina. Support for implementation of the study and methodology in the field in Bosnia and Herzegovina was also provided by Inês Morais, Jo Jewell, Marcello Gelormini and Gabriela Albuquerque.
The authors express their sincere gratitude to Vjekoslav Mandić , Minister of Health of the Federation of Bosnia and Herzegovina; Davor Pehar, Director of the Public Health Institute of the Federation of Bosnia and Herzegovina; and Aida Filipović-Hadžiomeragić , Survey Coordinator, Public Health Institute of the Federation of Bosnia and Herzegovina. Special thanks are also due to the team of field researchers from the Institute of Public Health of the Federation of Bosnia and Herzegovina (Šaćira Čoković, Munevera Kežić, Iskra Vučina, Elma Skalonja, Amna Dedajić, Azemina Bešić, Azra Reko, Nejra Ćatić, Sanela Tukulija, Mirsada Hadžović and Aida Priganica), all of whom were involved in collection and preparation of the food samples and interviewing.
The authors also express their sincere gratitude to all the staff of the Food Chemistry Laboratory of the Food and Nutrition Department, National Institute of Health Dr Ricardo Jorge, Lisbon, Portugal (INSA), who were involved in the laboratory analysis performed for this study.
The work of Gabriela Albuquerque was funded by the European Regional Development Fund through the Operational Programme Competitiveness and Internationalization and national funding from the Foundation for Science and Technology − FCT (Portuguese Ministry of Science, Technology and Higher Education) under the Unidade de Investigação em Epidemiologia − Instituto de Saúde Pública da Universidade do Porto (EPI Unit) (POCI-01-0145-FEDER-006862; Ref. UID/DTP/04750/2013). An individual PhD grant (Ref. SFRH/BD/118630/2016) was funded by FCT and the “Programa Operacional Capital Humano” (POCH/FSE).
ix
Patrícia Padrão, Susana Casal, Pedro Moreira and Nuno Lunet are members of the EPI Unit – Epidemiology Research Unit, Institute of Public Health, University of Porto (ISPUP), Porto, Portugal.
The bromatological analyses were performed at the Food Chemistry Laboratory of the Food and Nutrition Department, National Institute of Health Dr Ricardo Jorge (INSA), Lisbon, Portugal, under the coordination of Mariana Santos.
AbbreviationsFAO Food and Agriculture Organization of the United NationsNCD noncommunicable diseaseTFA trans-fatty acidWHO World Health Organization
Executive summaryThe current report gives an overview of the food context in urban Sarajevo, the Federation of Bosnia and Herzegovina, Bosnia and Herzegovina, based on a standardized methodology. Some aspects of the urban food environment revealed by the report are positive, while others are cause for concern; these latter are areas that could be improved by targeted policy action.
The Food and Agriculture Organization of the United Nations (FAO) and the World Health Organization (WHO) define street food as “ready-to-eat foods and beverages prepared and/or sold by vendors and hawkers especially in streets and other similar places”. In many settings, especially in urban areas of low- and middle-income countries, street food is diverse and constitutes a widely accessible and inexpensive food source. However, it often includes energy-dense foods rich in fat, sugar and sodium. Previous research on street food has focused mainly on food safety, paying little attention to its contribution to the diet of the population. Furthermore, little or no research has been conducted in the WHO European Region.
The main objective of the FEEDcities Project is to characterize the street food environment in cities in eastern Europe and central Asia. The study provides information that supports some of the objectives of the WHO European Food and Nutrition Action Plan 2015–2020, such as creating healthy food and drink environments and increasing surveillance, monitoring, evaluation and research. This report describes the characteristics of vending sites; the ready-to-eat food they offer; and the nutritional composition (specifically, trans-fatty acids (TFA), sodium and potassium content) of the street foods and takeaway foods – typically, from bakeries and outlets selling savoury pies and barbecued foods – that are most commonly available in Sarajevo. The findings and conclusions of this study will contribute to implementation of health strategies set out in existing health programmes at the national level (1), and particularly to the design and implementation of population-based interventions to reduce TFA and sodium intake.
Between July and August 2017, eligible street food and takeaway food vending sites were identified by means of random and systematic sampling procedures; these sites were situated in and around 10 markets located in urban and suburban areas of Sarajevo. Vending sites selling only unprepared fresh fruit were not included in the study. A total of 228 eligible food vendors (street food: 127; takeaway food: 101) were interviewed to ascertain the characteristics of their vending sites and the types of ready-to-eat foods and beverages sold. Following this assessment, random and systematic sampling was then used to select vending sites from which the foods most commonly available in these settings could be sampled. A total of 118 food samples (street food: 44; takeaway food: 74) were collected; these represented approximately four samples of each of the 30 most commonly available foods – 20 homemade (foods cooked and/or prepared at home or on the street) and 10 industrial (foods produced by the food industry).
x
In order to characterize the street foods and takeaway foods offered, products were grouped as fruit (fresh or dried), beverages (any drink, alcoholic or non-alcoholic), and foods other than fruit and beverages; this last category was divided into homemade and industrial. Unprocessed fruit (i.e. in its natural form) and vegetables were not sampled for analysis as their composition is already known in the literature.
The establishments identified were mostly street food vending sites (55.7%), all of which were stationary. The vendors were usually women (74.1%) and employees (86.0%). The most prevalent street food vending site setups were kiosks (73.4%) and establishments selling food or beverages through a window (21.0%). Bakeries were the commonest takeaway food vending sites (19.7%). Generally, food was sold 7 days a week (74.9% of all food vending sites) and during all four seasons (96.5% of all food vending sites). Street food vendors reported, additionally, that vending activity occurred regardless of the weather (96.0%).
A wide variety of homemade and industrial foods were sold, demonstrating a rich street food culture. Fruit was sold at only 1.3% of sites (street food: 2.4%; takeaway food: 0.0%); food other than fruit was available at 97.4% of sites (street food: 95.3%; takeaway food: 100.0%); and beverages were sold at 85.5% of sites (street food: 89.8%; takeaway food: 80.2%). Food other than fruit was mostly only homemade (all: 58.4%; street food: 25.6%; takeaway food: 98.0%) or only industrial (all: 39.8%; street food: 72.7%; takeaway food: 0.0%). Vending sites selling both homemade and industrial foods represented a small portion of the sample (all: 1.8%; street food: 1.7%; takeaway food: 2.0%). Soft drinks were available at 88.6% of sites selling beverages; fruit juice-based drinks at 78.8%; water at 76.7%; and traditional beverages at 44.0%.
The foods analysed frequently contained high levels of TFA and sodium; this was particularly so in the case of homemade foods. The mean TFA content per serving was highest for homemade puff pastry (1.86 g), homemade sweet pie (1.52 g) and homemade stuffed roll (1.47 g), corresponding to 83.9%, 68.7% and 66.4%, respectively, of the recommended maximum daily intake of TFA (based on a reference daily intake of 2000 kcal for an average adult). The highest mean sodium content per serving was observed in pljeskavica (3838 mg), ćevapi (2231 mg) and hamburger (1798 mg), corresponding to 191.9%, 111.5% and 89.9%, respectively, of the recommended maximum daily intake. The mean potassium content per serving was highest in homemade pljeskavica (814 mg), homemade ćevapi (507 mg) and homemade hamburger (500 mg), corresponding to 23.2%, 14.4% and 14.2%, respectively, of the recommended minimum daily intake of potassium.
These results demonstrate high levels of salt and trans fats in homemade foods sold in the urban environment of Sarajevo. The highest TFA content was found in homemade savoury pastries sold on the street and in takeaway food establishments; this suggests common use of cooking fats and shortening containing TFA in preparation and manufacture of foods. Widely diverse foods were found to be rich in sodium, including homemade main dishes and some industrial snacks sold on the street; this indicates that excess salt is added during food preparation, not only by street food vendors but also in fast-food outlets and by the food manufacturing industry.
Although street vending sites that sold only fruit (e.g. market stalls) were excluded from the study, ready-to-eat fresh fruit was less widely available than other foods or drinks at many vending sites (e.g. kiosks) in urban Sarajevo. Greater availability would ensure that urban residents had easier, more convenient access to such foods as an essential part of a healthy diet. The wide availability of sugary drinks, in the form of soft drinks, fruit juice-based drinks and energy drinks, is a concern in light of the increasing rates of obesity and other noncommunicable diseases (NCDs) in the country.
The types of food and beverage offered in the streets of Sarajevo, as well as the nutritional composition of the most common foods, indicate that the nutritional quality of ready-to-eat food available in the city should be improved. It will be important, however, to preserve the cultural and community role of food vendors in sustaining traditional foods and providing access to whole foods, such as fruit and vegetables. There are various practical policy options to ensure a healthier urban food environment; these should be integrated into existing policies in the Federation of Bosnia and Herzegovina, such as the Strategic Plan for Health Care Development in the Federation of Bosnia and Herzegovina 2008–2018 (1) and the Action Plan for the Prevention and Control of Noncommunicable Diseases in the Federation of Bosnia and Herzegovina 2019–2025, which was recently implemented by the Federal Ministry of Health.
xi
Reducing the salt content of ready-to-eat foods sold in both street food and takeaway food vending sites is likely to require a multipronged approach. One such initiative will be health promotion to convince street food vendors and small producers to use less salt; another will be to raise awareness among the public about the high salt content of such foods and the health effects of excess consumption. Another, increasingly important component of changing the food context is adoption of targets for reducing salt in industrially produced food (e.g. savoury snacks). Policies to help achieve these targets could include setting maximum limits for salt in specific food categories through regulation, which would apply to all foods on the market, including in takeaway food establishments, to ensure non-discrimination. Nutritional information on packaged foods in the country could be improved to ensure that all packages bear a nutrient declaration (including sodium) in addition to an ingredients list.
Cooking fats and pastry shortening containing TFA are widely used in food preparation. Legislation targeted directly at producers of industrial fats and manufactured foods, prohibiting use of hydrogenated fats and oils in food production, is recommended; in this regard, a maximum limit of 2 g trans fat per 100 g of total fat might be appropriate. Encouraging producers such as bakers and vendors to use healthier fats and oils in their recipes is one practical policy option to facilitate the move towards a healthier street food environment.
This study shows that there is scope for improving the nutritional adequacy of street and takeaway foods sold in Sarajevo. It also underlines the need for health policies targeted at enhancing the nutritional quality of such foods – while protecting their cultural and community role – in order to reduce the occurrence of diet-related NCDs in the country.
xii
1
1. IntroductionBosnia and Herzegovina is a European country located in the western part of the Balkan Peninsula. According to the Constitution of Bosnia and Herzegovina, which is an integral part of the General Framework Agreement for Peace in Bosnia and Herzegovina, the country consists of two entities – the Federation of Bosnia and Herzegovina and the Republika Srpska – and a third administrative unit, Brčko District (2). It is an upper-middle-income country, with an annual gross domestic product (GDP) of US$ 16.9 billion and an annual growth rate of 3.0% (3). The poverty rate in Bosnia and Herzegovina (measured as the threshold at which a person’s minimum nutritional, clothing and shelter needs are met (3)) fell slightly from 17.9% in 2011 to 16.9% in 2015.
Sarajevo is the capital of the country as a whole, as well as of its entity, the Federation of Bosnia and Herzegovina. It is the largest city in the country, with a population of approximately 275 000 people within its current administrative limits (4). The population of the country is about 3.5 million, of which 2.2 million live in the Federation of Bosnia and Herzegovina. The population growth rate of the country has been falling in recent years (3).
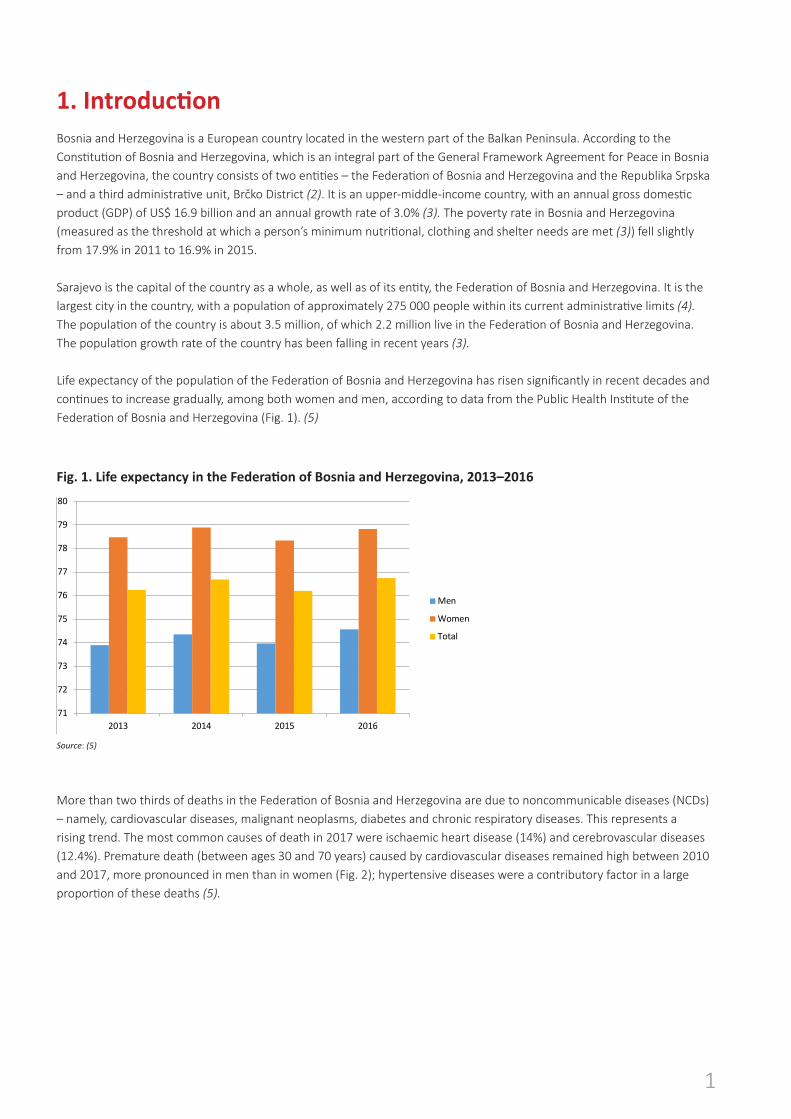
Life expectancy of the population of the Federation of Bosnia and Herzegovina has risen significantly in recent decades and continues to increase gradually, among both women and men, according to data from the Public Health Institute of the Federation of Bosnia and Herzegovina (Fig. 1). (5)
Fig. 1. Life expectancy in the Federation of Bosnia and Herzegovina, 2013–2016
Source: (5)
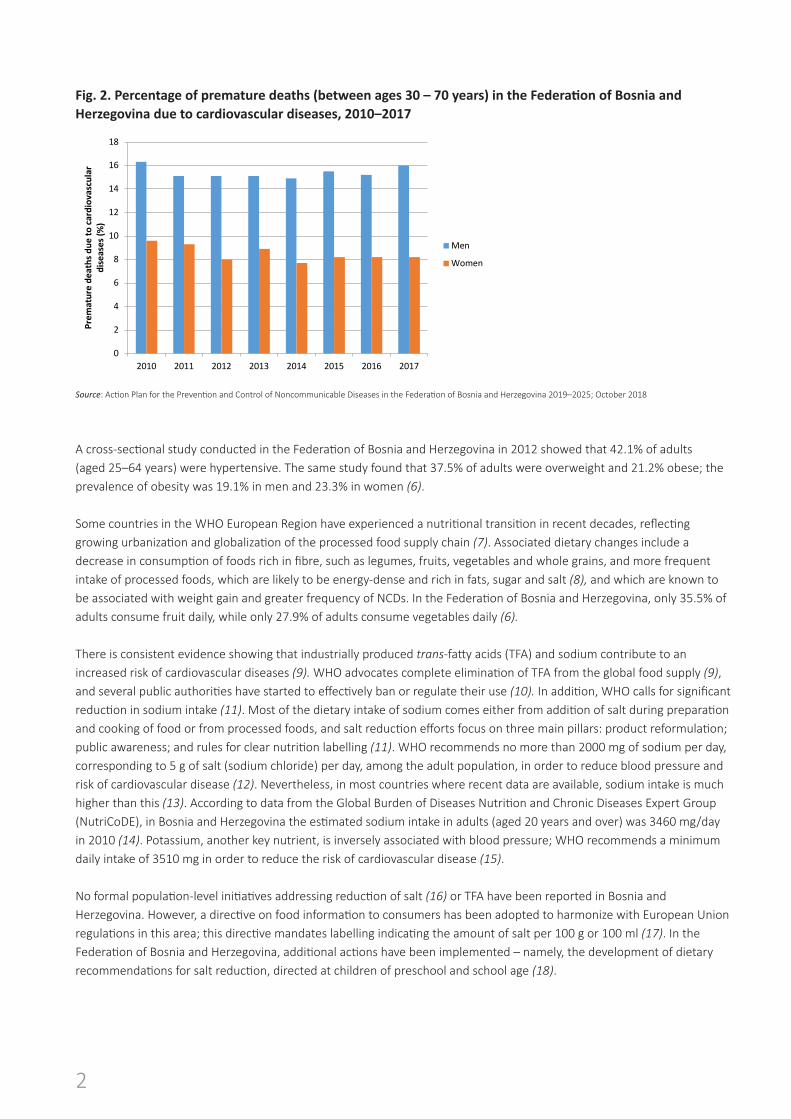
More than two thirds of deaths in the Federation of Bosnia and Herzegovina are due to noncommunicable diseases (NCDs) – namely, cardiovascular diseases, malignant neoplasms, diabetes and chronic respiratory diseases. This represents a rising trend. The most common causes of death in 2017 were ischaemic heart disease (14%) and cerebrovascular diseases (12.4%). Premature death (between ages 30 and 70 years) caused by cardiovascular diseases remained high between 2010 and 2017, more pronounced in men than in women (Fig. 2); hypertensive diseases were a contributory factor in a large proportion of these deaths (5).
1
Introduction Bosnia and Herzegovina is a European country located in the western part of the Balkan Peninsula. According to the Constitution of Bosnia and Herzegovina, which is an integral part of the General Framework Agreement for Peace in Bosnia and Herzegovina, the country consists of two entities – the Federation of Bosnia and Herzegovina and the Republika Srpska – and a third administrative unit, Brčko District (2). It is an upper-middle-income country, with an annual gross domestic product (GDP) of US$ 16.9 billion and an annual growth rate of 3.0% (3). The poverty rate in Bosnia and Herzegovina (measured as the threshold at which a person’s minimum nutritional, clothing and shelter needs are met (3)) fell slightly from 17.9% in 2011 to 16.9% in 2015.
Sarajevo is the capital of the country as a whole, as well as of its entity, the Federation of Bosnia and Herzegovina. It is the largest city in the country, with a population of approximately 275 000 people within its current administrative limits (4). The population of the country is about 3.5 million, of which 2.2 million live in the Federation of Bosnia and Herzegovina. The population growth rate of the country has been falling in recent years (3).
Life expectancy of the population of the Federation of Bosnia and Herzegovina has risen significantly in recent decades and continues to increase gradually, among both women and men, according to data from the Public Health Institute of the Federation of Bosnia and Herzegovina (Fig. 1).(5)
Fig. 1. Life expectancy in the Federation of Bosnia and Herzegovina, 2013–2016
Source: (5)
71
72
73
74
75
76
77
78
79
80
2013 2014 2015 2016
Men
Women
Total
2
Fig. 2. Percentage of premature deaths (between ages 30 – 70 years) in the Federation of Bosnia and Herzegovina due to cardiovascular diseases, 2010–2017
Source: Action Plan for the Prevention and Control of Noncommunicable Diseases in the Federation of Bosnia and Herzegovina 2019–2025; October 2018
A cross-sectional study conducted in the Federation of Bosnia and Herzegovina in 2012 showed that 42.1% of adults (aged 25–64 years) were hypertensive. The same study found that 37.5% of adults were overweight and 21.2% obese; the prevalence of obesity was 19.1% in men and 23.3% in women (6).
Some countries in the WHO European Region have experienced a nutritional transition in recent decades, reflecting growing urbanization and globalization of the processed food supply chain (7). Associated dietary changes include a decrease in consumption of foods rich in fibre, such as legumes, fruits, vegetables and whole grains, and more frequent intake of processed foods, which are likely to be energy-dense and rich in fats, sugar and salt (8), and which are known to be associated with weight gain and greater frequency of NCDs. In the Federation of Bosnia and Herzegovina, only 35.5% of adults consume fruit daily, while only 27.9% of adults consume vegetables daily (6).
There is consistent evidence showing that industrially produced trans-fatty acids (TFA) and sodium contribute to an increased risk of cardiovascular diseases (9). WHO advocates complete elimination of TFA from the global food supply (9), and several public authorities have started to effectively ban or regulate their use (10). In addition, WHO calls for significant reduction in sodium intake (11). Most of the dietary intake of sodium comes either from addition of salt during preparation and cooking of food or from processed foods, and salt reduction efforts focus on three main pillars: product reformulation; public awareness; and rules for clear nutrition labelling (11). WHO recommends no more than 2000 mg of sodium per day, corresponding to 5 g of salt (sodium chloride) per day, among the adult population, in order to reduce blood pressure and risk of cardiovascular disease (12). Nevertheless, in most countries where recent data are available, sodium intake is much higher than this (13). According to data from the Global Burden of Diseases Nutrition and Chronic Diseases Expert Group (NutriCoDE), in Bosnia and Herzegovina the estimated sodium intake in adults (aged 20 years and over) was 3460 mg/day in 2010 (14). Potassium, another key nutrient, is inversely associated with blood pressure; WHO recommends a minimum daily intake of 3510 mg in order to reduce the risk of cardiovascular disease (15).
No formal population-level initiatives addressing reduction of salt (16) or TFA have been reported in Bosnia and Herzegovina. However, a directive on food information to consumers has been adopted to harmonize with European Union regulations in this area; this directive mandates labelling indicating the amount of salt per 100 g or 100 ml (17). in the Federation of Bosnia and Herzegovina, additional actions have been implemented – namely, the development of dietary recommendations for salt reduction, directed at children of preschool and school age (18).
2
More than two thirds of deaths in the Federation of Bosnia and Herzegovina are due to noncommunicable diseases (NCDs) – namely, cardiovascular diseases, malignant neoplasms, diabetes and chronic respiratory diseases. This represents a rising trend. The most common causes of death in 2017 were ischaemic heart disease (14%) and cerebrovascular diseases (12.4%). Premature death (between ages 30 and 70 years) caused by cardiovascular diseases remained high between 2010 and 2017, more pronounced in men than in women (Fig. 2); hypertensive diseases were a contributory factor in a large proportion of these deaths (5).
Fig. 2. Percentage of premature deaths (between ages 30 – 70 years) in the Federation of Bosnia
and Herzegovina due to cardiovascular diseases, 2010–2017
Source: Action Plan for the Prevention and Control of Noncommunicable Diseases in the Federation of Bosnia and Herzegovina 2019–2025; October 2018
A cross-sectional study conducted in the Federation of Bosnia and Herzegovina in 2012 showed that 42.1% of adults (aged 25–64 years) were hypertensive. The same study found that 37.5% of adults were overweight and 21.2% obese; the prevalence of obesity was 19.1% in men and 23.3% in women (6).
Some countries in the WHO European Region have experienced a nutritional transition in recent decades, reflecting growing urbanization and globalization of the processed food supply chain (7). Associated dietary changes include a decrease in consumption of foods rich in fibre, such as legumes, fruits, vegetables and whole grains, and more frequent intake of processed foods, which are likely to be energy-dense and rich in fats, sugar and salt (8), and which are known to be associated with weight gain and greater frequency of NCDs. In the Federation of Bosnia and Herzegovina, only 35.5% of adults consume fruit daily, while only 27.9% of adults consume vegetables daily (6).
0
2
4
6
8
10
12
14
16
18
2010 2011 2012 2013 2014 2015 2016 2017
Prem
atur
e de
aths
due
to
card
iova
scul
ar
dise
ases
(%)
Men
Women
3
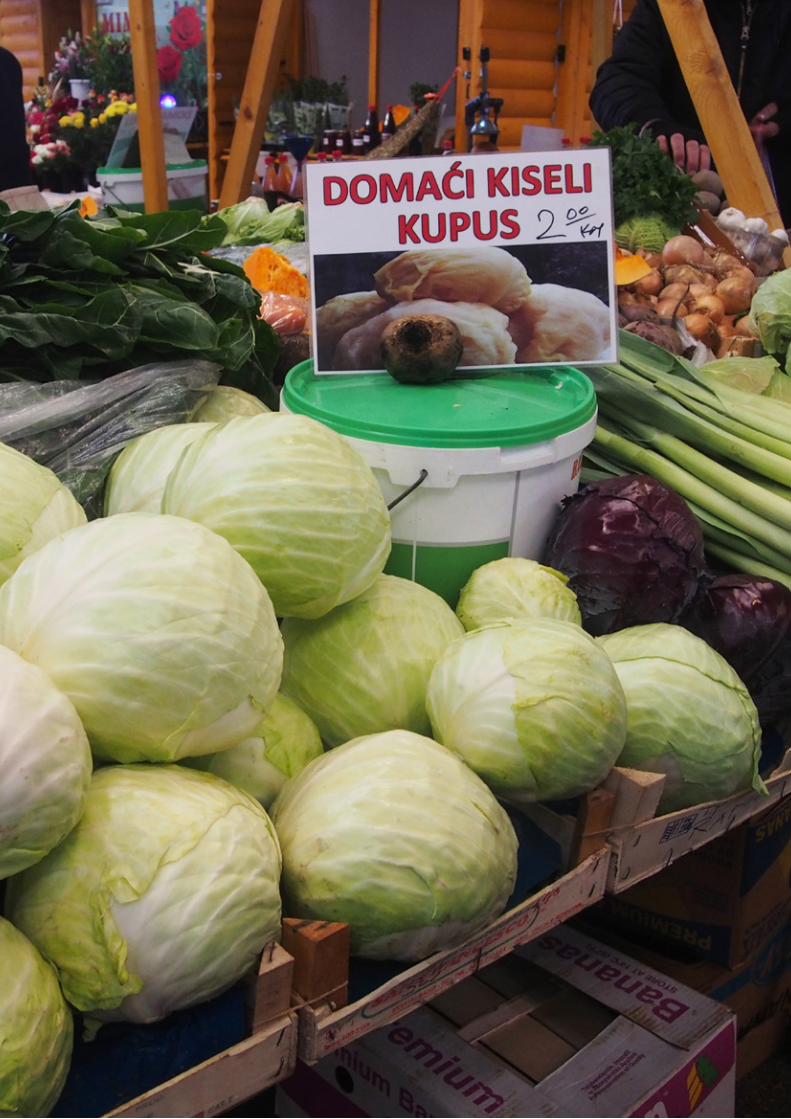
Street food context in SarajevoThe Food and Agriculture Organization (FAO) and WHO define street food as “ready-to-eat foods and beverages prepared and/or sold by vendors or hawkers especially in the streets and other similar places” (19). Street food can be an important component of the daily diet (20), representing a cultural, social and economic phenomenon that is typical of urbanized areas, where the lifestyle is becoming more sedentary and the time dedicated to cooking at home is dramatically reduced (21). It also plays an important community role, giving access to high-fibre foods rich in micronutrients (fruits and vegetables) and protecting traditional food/diet habits.
On the other hand, foods purchased from street vendors may significantly contribute to excess energy and nutrient intake. This aspect has been understudied (22) – more attention should be given to the nutritional quality of foods available from street vendors and markets. Furthermore, the expansion of takeaway outlets in urban settings has led to important changes in the food supply and in food purchasing patterns, with consequent dietary changes. This underlines the importance of characterizing and monitoring the types of ready-to-eat foods that are offered and purchased, in the context of efforts to prevent NCDs. Nevertheless, research in low- and middle-income countries has focused mostly on issues linked to hygiene and food security (22), and little is known about the nutritional characteristics of street food.
In Sarajevo, unlike other settings where research on street food has been conducted, it was observed that most of the food available for consumption on the street was not sold in traditional street food vending sites (as normally defined). Most food vending sites in Sarajevo are formal establishments selling ready-to-eat food: some sell directly to the street via a window or a counter; most are takeaway establishments, where food products are displayed on a counter but customers are required to enter the premises in order to purchase. Open shopfronts are a common feature, rather than the closed doors typical of more formal shops and restaurants. The usual mobile street vendors, or “street hawkers”, are not common. The food offer is relatively homogeneous across the city centre and outskirts of Sarajevo. Food available in Sarajevo is predominantly of the fast-food and other ready-to-eat varieties, including savoury pastries, breads, sandwiches, biscuits/cookies and cakes, pizza, industrial snacks and sweets, yoghurt and other traditional drinks. Savoury pies and barbecue options are very common as main dishes, reflecting the traditional gastronomy of the country. Accordingly, the study methodology was adapted to the local context and included both street food in the classical sense and ready-to-eat food sold in takeaway vending sites.
2. ObjectivesThe aim of this study is to characterize the food environment of urban Sarajevo. The specific objectives addressed are as follows:
• to describe the characteristics of the city’s street food and takeaway food vending sites;
• to characterize the food offered at selected vending sites;
• to assess the nutritional composition of ready-to-eat foods (other than fruits) sold in street and takeaway food vending sites – specifically, with respect to their sodium, potassium and TFA content.
4
3. MethodsA cross-sectional evaluation of street food and takeaway food vending sites was conducted in Sarajevo between 27 June and 4 August 2017. The study protocol was developed by the University of Porto in collaboration with the WHO Regional Office for Europe and approved by the Ethics Committee of the Institute of Public Health of the University of Porto.
WHO Regional Office staff and consultants carried out recruitment and training of local field researchers (interviewers); the session was held over a four-day period and attended by 11 interviewers. The training included lectures, demonstrations, and practice interviews involving pre-testing of the data collection forms; this was conducted both in the office and in a pilot study carried out in one of the city markets that had not been selected for the study.
Eligibility criteriaStreet food vending sites
We adopted the definition of street food proposed by FAO and WHO: “ready-to-eat foods and beverages prepared and/or sold by vendors or hawkers especially in the streets and other similar places” (18). This definition includes products that have been prepared in advance (e.g. sandwiches, salads) or cooked (e.g. boiled eggs, traditional dishes), as well as raw foods that are sold for immediate consumption (e.g. fruits, nuts), even though these products may sometimes be bought to be consumed later (e.g. at home or at work).
Regarding physical setup, eligible vending sites are those that sell ready-to-eat food, including beverages and/or snacks, from any venue other than a permanent storefront business or an establishment with four permanent walls, operating in a predefined perimeter, that does not sell directly on the street. The definition includes “street hawkers”, or mobile vendors, as well as sellers with semi-static or stationary vending units. Vending sites selling only unprepared fresh fruit were not eligible, as much of the produce bought at such sites is for household consumption and so does not meet the definition of “ready-to-eat” food.
Takeaway food vending sites
To give a better representation of the food offer in Sarajevo, specific takeaway food establishments were also included in the study sample, taking into account observations of the urban food environment made during the field visit. The definition of a takeaway food vending site proposed by the United Kingdom authorities in their town and country planning regulations was adopted for this study: “an outlet whose primary business is the sale of ready-to-eat food and beverages for consumption off the premises” (23). The definition includes vending sites where ready-to-eat foods and beverages are ordered and paid for at the till, where there is limited space for sitting in or out, and where no waiter service is available. Such sites include:
• bakeries (pekara);
• takeaway food restaurants selling savoury pies (buregdžinica);
• takeaway food restaurants selling barbecue (ćevabdžinica).
Cafés, full-service restaurants, drinking establishments and shops were ineligible, as were takeaway food franchises.
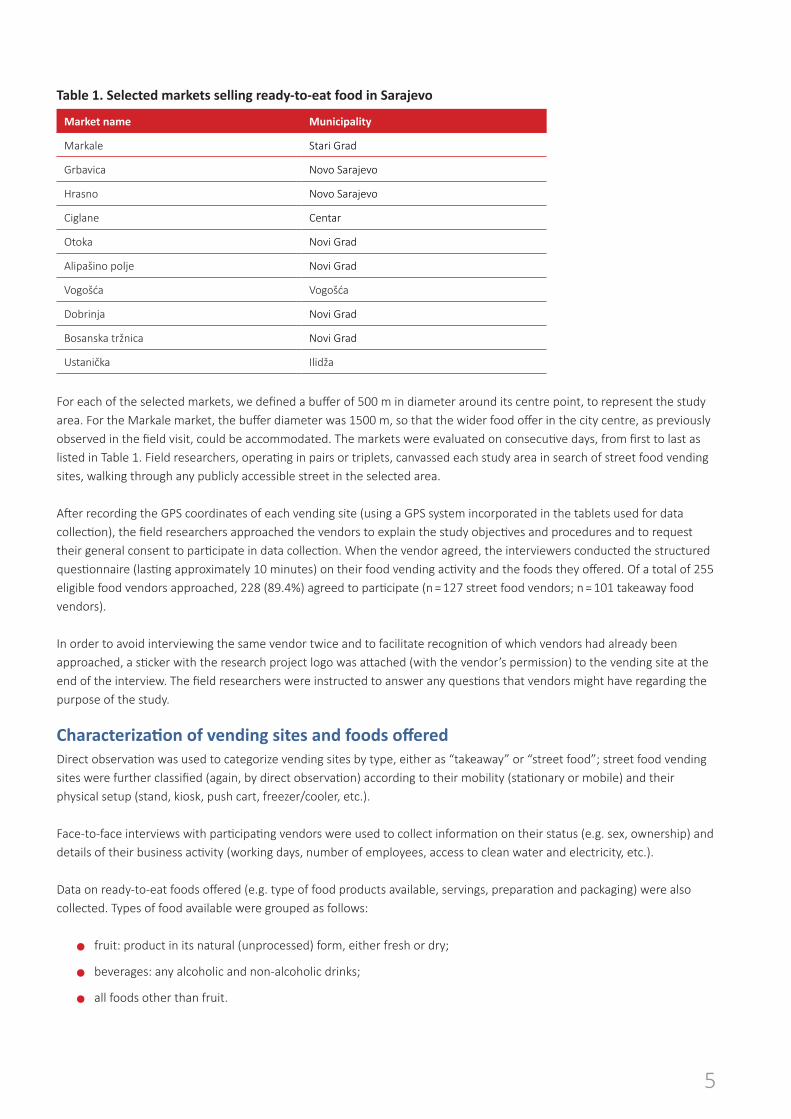
Sampling of vending sitesFollowing the field visit, our final assessment was that eligible vending sites were widespread throughout the city, with a higher density in the city centre; they were mainly concentrated in public markets and their surroundings, both in the centre and in outlying areas (suburbs). Our sampling procedure therefore started with selection of 10 main public markets in the city of Sarajevo (Table 1), from a list provided by local authorities and gathered during the preliminary field visit. The sample included the main city market in the centre, Markale, and nine other markets. The 10 selected markets were located in four main urban municipalities (Stari Grad, Centar, Novi Grad and Novo Sarajevo) and two suburban areas (Vogošća and Ilidža).
5
Table 1. Selected markets selling ready-to-eat food in Sarajevo
Market name Municipality
Markale Stari Grad
Grbavica Novo Sarajevo
Hrasno Novo Sarajevo
Ciglane Centar
Otoka Novi Grad
Alipašino polje Novi Grad
Vogošća Vogošća
Dobrinja Novi Grad
Bosanska tržnica Novi Grad
Ustanička Ilidža
For each of the selected markets, we defined a buffer of 500 m in diameter around its centre point, to represent the study area. For the Markale market, the buffer diameter was 1500 m, so that the wider food offer in the city centre, as previously observed in the field visit, could be accommodated. The markets were evaluated on consecutive days, from first to last as listed in Table 1. Field researchers, operating in pairs or triplets, canvassed each study area in search of street food vending sites, walking through any publicly accessible street in the selected area.
After recording the GPS coordinates of each vending site (using a GPS system incorporated in the tablets used for data collection), the field researchers approached the vendors to explain the study objectives and procedures and to request their general consent to participate in data collection. When the vendor agreed, the interviewers conducted the structured questionnaire (lasting approximately 10 minutes) on their food vending activity and the foods they offered. Of a total of 255 eligible food vendors approached, 228 (89.4%) agreed to participate (n = 127 street food vendors; n = 101 takeaway food vendors).
In order to avoid interviewing the same vendor twice and to facilitate recognition of which vendors had already been approached, a sticker with the research project logo was attached (with the vendor’s permission) to the vending site at the end of the interview. The field researchers were instructed to answer any questions that vendors might have regarding the purpose of the study.
Characterization of vending sites and foods offeredDirect observation was used to categorize vending sites by type, either as “takeaway” or “street food”; street food vending sites were further classified (again, by direct observation) according to their mobility (stationary or mobile) and their physical setup (stand, kiosk, push cart, freezer/cooler, etc.).
Face-to-face interviews with participating vendors were used to collect information on their status (e.g. sex, ownership) and details of their business activity (working days, number of employees, access to clean water and electricity, etc.).
Data on ready-to-eat foods offered (e.g. type of food products available, servings, preparation and packaging) were also collected. Types of food available were grouped as follows:
• fruit: product in its natural (unprocessed) form, either fresh or dry;
• beverages: any alcoholic and non-alcoholic drinks;
• all foods other than fruit.
6
7
Foods other than fruit and beverages were further classified as homemade (cooked and/or prepared at home or on the street, even if industrially produced ingredients are used) or industrial (products produced by the food industry sold without any further preparation). Beverages were classified as soft drinks, water, fruit juice-based drinks, fresh fruit juice, milk, alcoholic drinks, energy drinks, coffee, tea and traditional beverages.
Selection, collection and analysis of food samplesAfter the vending sites had been characterized with respect to the food they offer, the 20 most frequently available homemade foods and the 10 most frequently available industrial foods were selected from street food and takeaway food vending sites for bromatological analysis. Common drinks with known nutritional composition, such as coffee, tea, milk and soft drinks, were not eligible for bromatological analysis. A total of 118 samples (44 from street food vending sites, 74 from takeaway food vending sites) were collected, corresponding to approximately four different samples of each of the 30 foods previously identified (in the case of two industrial foods, popcorn and salted sticks, only three different samples were available). The food samples collected represented one unit, or a single “serving”, as normally sold. For any type of food sold in small portions (such as snacks or biscuits), each sample included several units, according to the usual purchasing/consumption pattern. Examples of each of the 30 food samples are shown in the annexes at the end of this report.
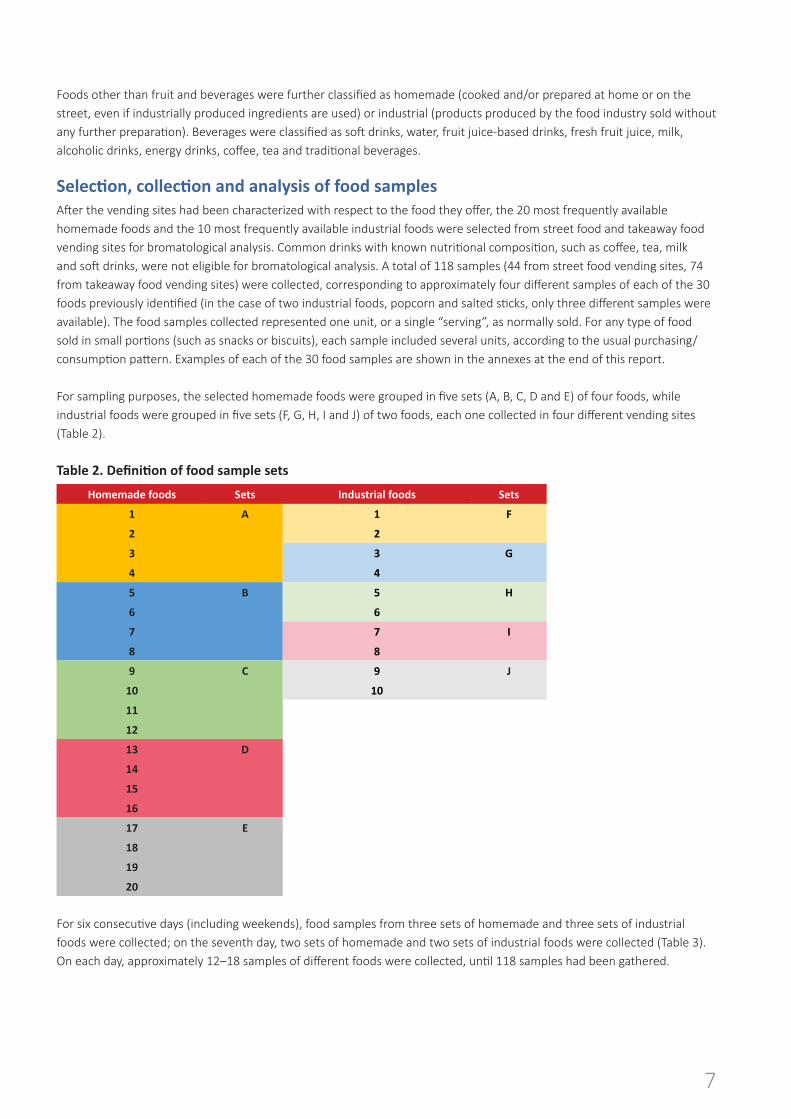
For sampling purposes, the selected homemade foods were grouped in five sets (A, B, C, D and E) of four foods, while industrial foods were grouped in five sets (F, G, H, I and J) of two foods, each one collected in four different vending sites (Table 2).
Table 2. Definition of food sample sets
Homemade foods Sets Industrial foods Sets
1 A 1 F
2 2
3 3 G
4 4
5 B 5 H
6 6
7 7 I
8 8
9 C 9 J
10 10
11
12
13 D
14
15
16
17 E
18
19
20
For six consecutive days (including weekends), food samples from three sets of homemade and three sets of industrial foods were collected; on the seventh day, two sets of homemade and two sets of industrial foods were collected (Table 3). On each day, approximately 12–18 samples of different foods were collected, until 118 samples had been gathered.
8
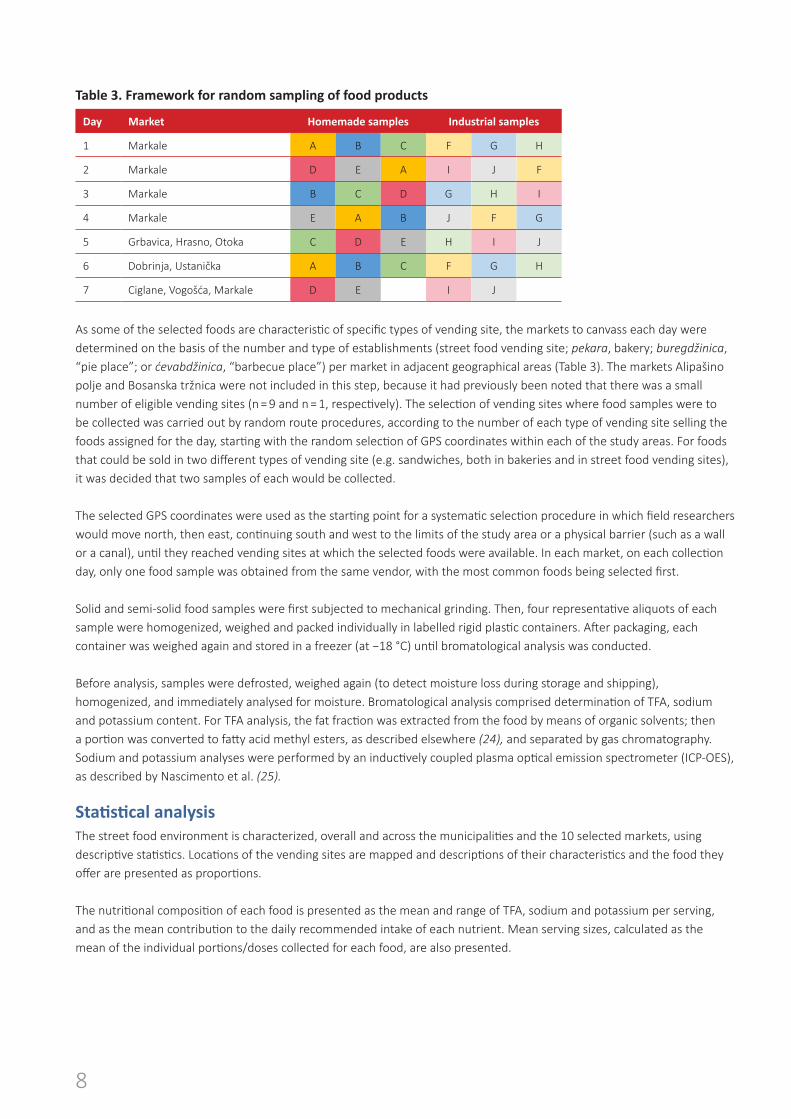
Table 3. Framework for random sampling of food products
Day Market Homemade samples Industrial samples
1 Markale A B C F G H
2 Markale D E A i J F
3 Markale B C D G H i
4 Markale E A B J F G
5 Grbavica, Hrasno, Otoka C D E H i J
6 Dobrinja, Ustanička A B C F G H
7 Ciglane, Vogošća, Markale D E i J
As some of the selected foods are characteristic of specific types of vending site, the markets to canvass each day were determined on the basis of the number and type of establishments (street food vending site; pekara, bakery; buregdžinica, “pie place”; or ćevabdžinica, “barbecue place”) per market in adjacent geographical areas (Table 3). The markets Alipašino polje and Bosanska tržnica were not included in this step, because it had previously been noted that there was a small number of eligible vending sites (n = 9 and n = 1, respectively). The selection of vending sites where food samples were to be collected was carried out by random route procedures, according to the number of each type of vending site selling the foods assigned for the day, starting with the random selection of GPS coordinates within each of the study areas. For foods that could be sold in two different types of vending site (e.g. sandwiches, both in bakeries and in street food vending sites), it was decided that two samples of each would be collected.
The selected GPS coordinates were used as the starting point for a systematic selection procedure in which field researchers would move north, then east, continuing south and west to the limits of the study area or a physical barrier (such as a wall or a canal), until they reached vending sites at which the selected foods were available. In each market, on each collection day, only one food sample was obtained from the same vendor, with the most common foods being selected first.
Solid and semi-solid food samples were first subjected to mechanical grinding. Then, four representative aliquots of each sample were homogenized, weighed and packed individually in labelled rigid plastic containers. After packaging, each container was weighed again and stored in a freezer (at −18 °C) until bromatological analysis was conducted.
Before analysis, samples were defrosted, weighed again (to detect moisture loss during storage and shipping), homogenized, and immediately analysed for moisture. Bromatological analysis comprised determination of TFA, sodium and potassium content. For TFA analysis, the fat fraction was extracted from the food by means of organic solvents; then a portion was converted to fatty acid methyl esters, as described elsewhere (24), and separated by gas chromatography. Sodium and potassium analyses were performed by an inductively coupled plasma optical emission spectrometer (ICP-OES), as described by Nascimento et al. (25).
Statistical analysis The street food environment is characterized, overall and across the municipalities and the 10 selected markets, using descriptive statistics. Locations of the vending sites are mapped and descriptions of their characteristics and the food they offer are presented as proportions.
The nutritional composition of each food is presented as the mean and range of TFA, sodium and potassium per serving, and as the mean contribution to the daily recommended intake of each nutrient. Mean serving sizes, calculated as the mean of the individual portions/doses collected for each food, are also presented.
9
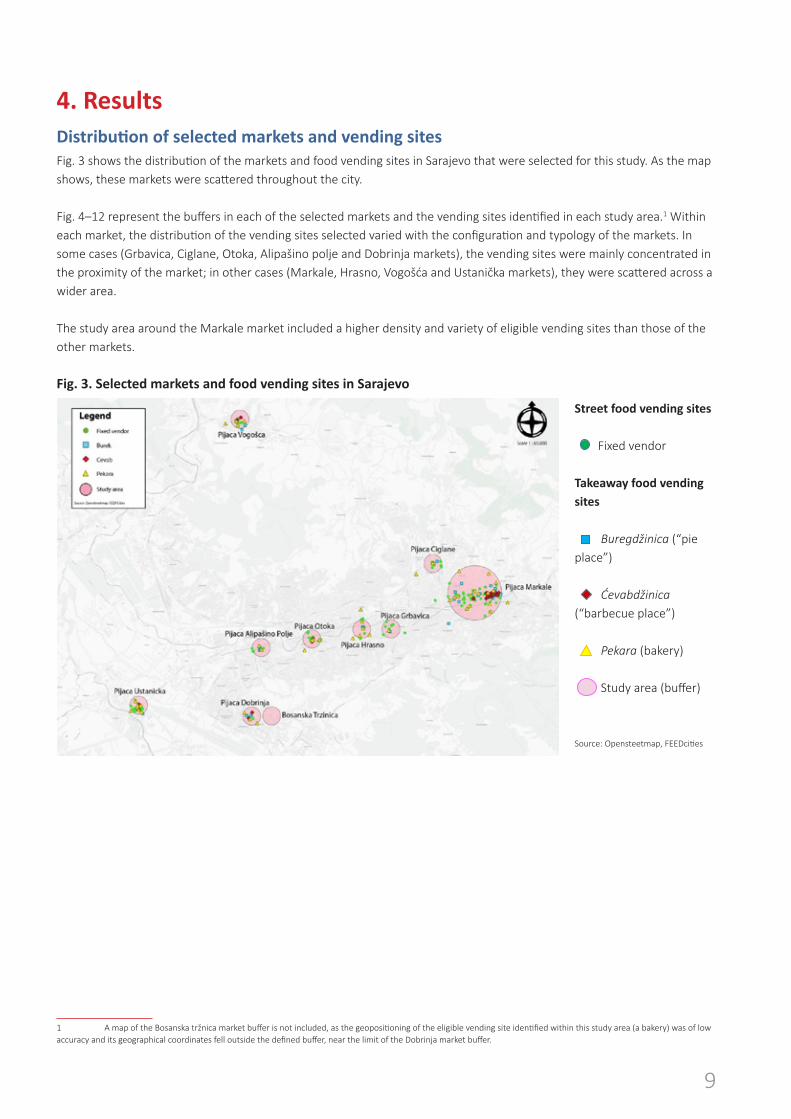
4. ResultsDistribution of selected markets and vending sitesFig. 3 shows the distribution of the markets and food vending sites in Sarajevo that were selected for this study. As the map shows, these markets were scattered throughout the city.
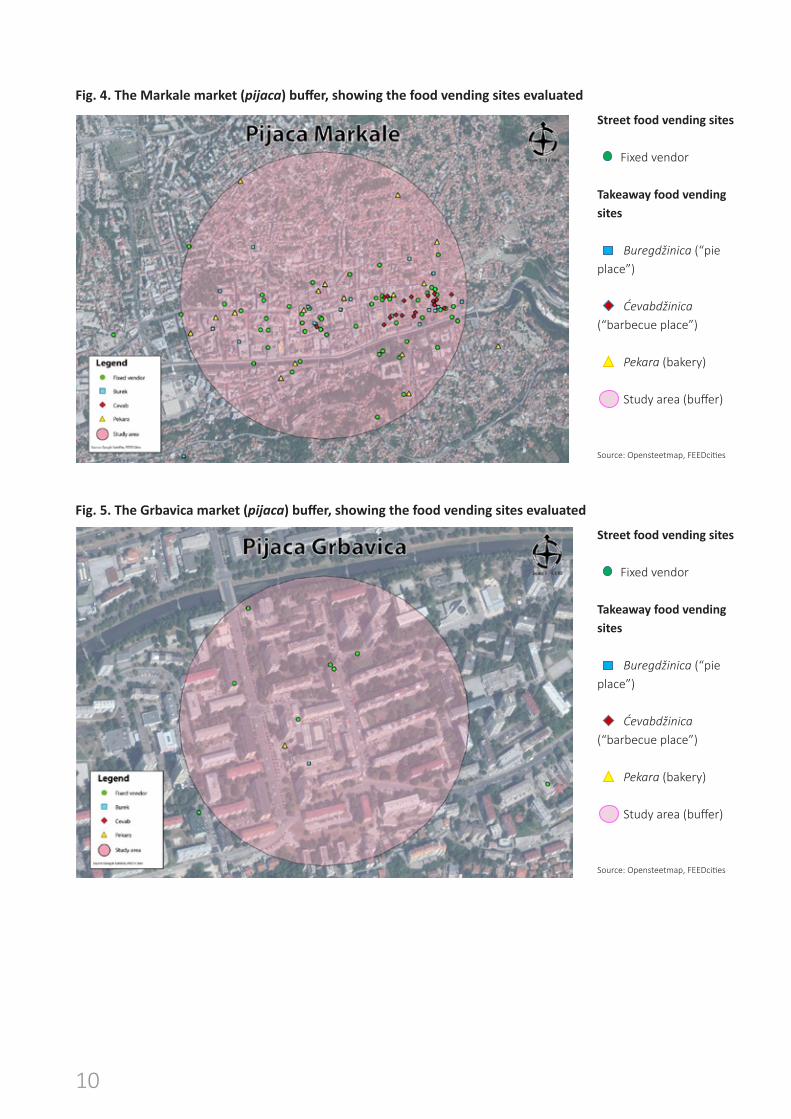
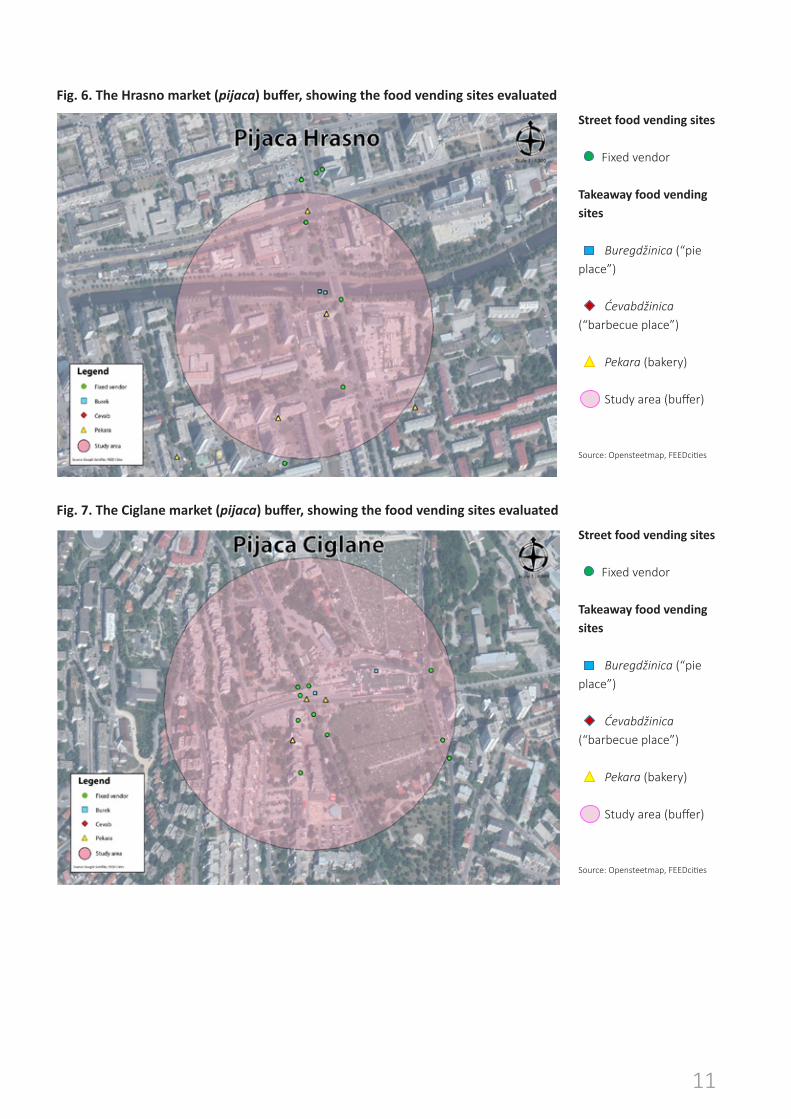
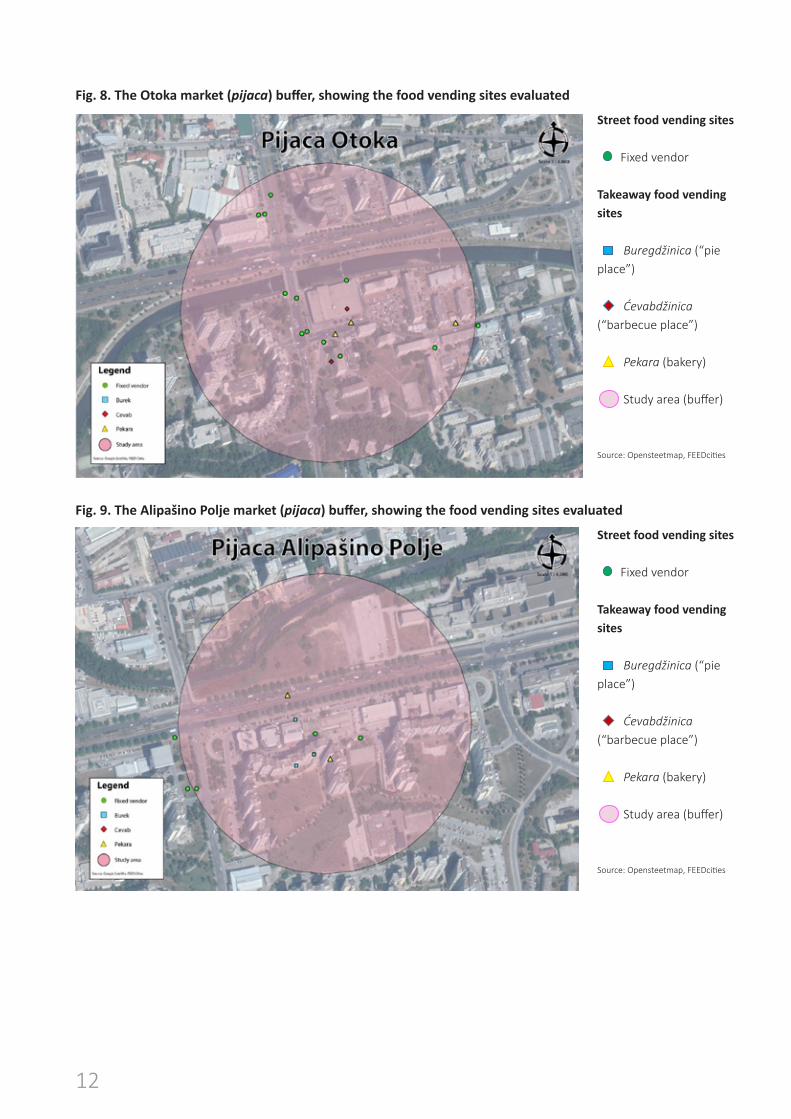
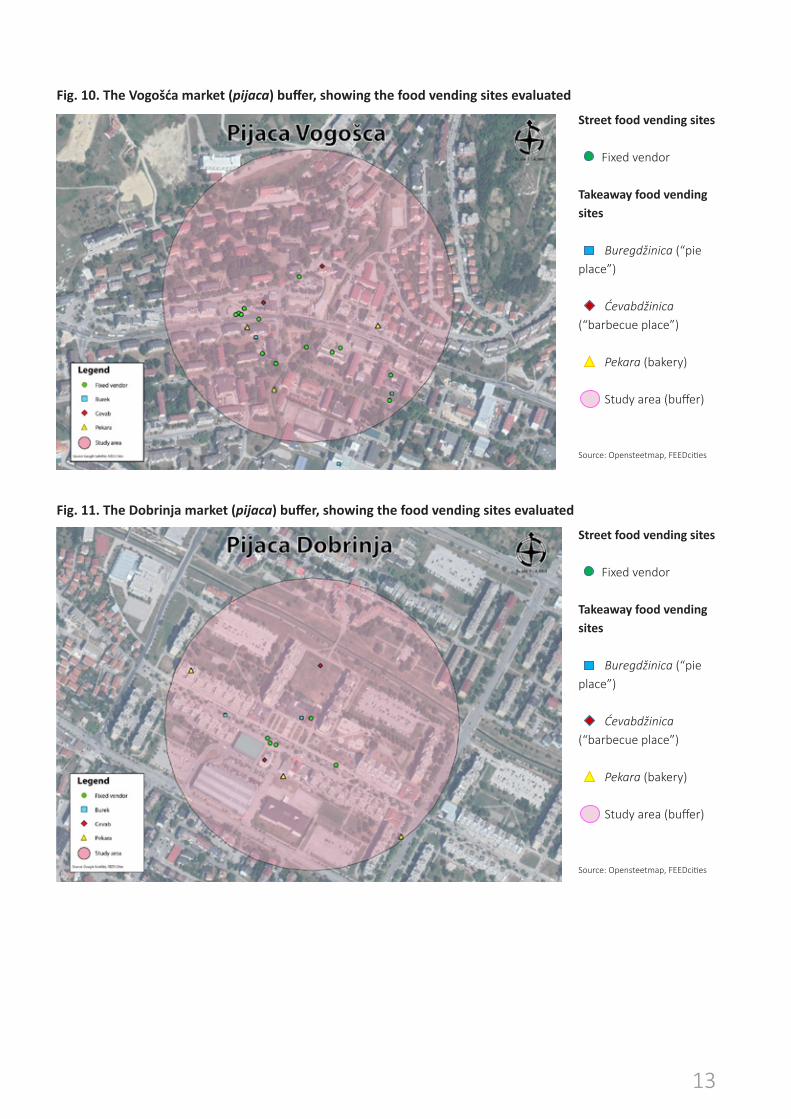
Fig. 4–12 represent the buffers in each of the selected markets and the vending sites identified in each study area.1 Within each market, the distribution of the vending sites selected varied with the configuration and typology of the markets. In some cases (Grbavica, Ciglane, Otoka, Alipašino polje and Dobrinja markets), the vending sites were mainly concentrated in the proximity of the market; in other cases (Markale, Hrasno, Vogošća and Ustanička markets), they were scattered across a wider area.
The study area around the Markale market included a higher density and variety of eligible vending sites than those of the other markets.
Fig. 3. Selected markets and food vending sites in Sarajevo
Street food vending sites
11
Street food vending sites
Fixed vendor
Takeaway food vending sites
Buregdžinica (“pie place”)
Ćevabdžinica (“barbecue place”)
Pekara (bakery)
Study area (buffer)
Source: Opensteetmap, FEEDcities
Fig. 3. Selected markets and food vending sites in Sarajevo
Kommenterede [BD1]: Note to designer This edited map information (legend) can be set alongside the map (as I have done it) or placed in the map (as it was done originally). The old legend of course needs to be deleted. Same for all following.
Fixed vendor
Takeaway food vending sites
11
Street food vending sites
Fixed vendor
Takeaway food vending sites
Buregdžinica (“pie place”)
Ćevabdžinica (“barbecue place”)
Pekara (bakery)
Study area (buffer)
Source: Opensteetmap, FEEDcities
Fig. 3. Selected markets and food vending sites in Sarajevo
Kommenterede [BD1]: Note to designer This edited map information (legend) can be set alongside the map (as I have done it) or placed in the map (as it was done originally). The old legend of course needs to be deleted. Same for all following. Buregdžinica (“pie
place”)
11
Street food vending sites
Fixed vendor
Takeaway food vending sites
Buregdžinica (“pie place”)
Ćevabdžinica (“barbecue place”)
Pekara (bakery)
Study area (buffer)
Source: Opensteetmap, FEEDcities
Fig. 3. Selected markets and food vending sites in Sarajevo
Kommenterede [BD1]: Note to designer This edited map information (legend) can be set alongside the map (as I have done it) or placed in the map (as it was done originally). The old legend of course needs to be deleted. Same for all following.
Ćevabdžinica (“barbecue place”)
11
Street food vending sites
Fixed vendor
Takeaway food vending sites
Buregdžinica (“pie place”)
Ćevabdžinica (“barbecue place”)
Pekara (bakery)
Study area (buffer)
Source: Opensteetmap, FEEDcities
Fig. 3. Selected markets and food vending sites in Sarajevo
Kommenterede [BD1]: Note to designer This edited map information (legend) can be set alongside the map (as I have done it) or placed in the map (as it was done originally). The old legend of course needs to be deleted. Same for all following.
Pekara (bakery)
11
Street food vending sites
Fixed vendor
Takeaway food vending sites
Buregdžinica (“pie place”)
Ćevabdžinica (“barbecue place”)
Pekara (bakery)
Study area (buffer)
Source: Opensteetmap, FEEDcities
Fig. 3. Selected markets and food vending sites in Sarajevo
Kommenterede [BD1]: Note to designer This edited map information (legend) can be set alongside the map (as I have done it) or placed in the map (as it was done originally). The old legend of course needs to be deleted. Same for all following.
Study area (buffer)
Source: Opensteetmap, FEEDcities
1 A map of the Bosanska tržnica market buffer is not included, as the geopositioning of the eligible vending site identified within this study area (a bakery) was of low accuracy and its geographical coordinates fell outside the defined buffer, near the limit of the Dobrinja market buffer.
11
Street food vending sites
Fixed vendor
Takeaway food vending sites
Buregdžinica (“pie place”)
Ćevabdžinica (“barbecue place”)
Pekara (bakery)
Study area (buffer)
Source: Opensteetmap, FEEDcities
Fig. 3. Selected markets and food vending sites in Sarajevo
Kommenterede [BD1]: Note to designer This edited map information (legend) can be set alongside the map (as I have done it) or placed in the map (as it was done originally). The old legend of course needs to be deleted. Same for all following.
10
Fig. 4. The Markale market (pijaca) buffer, showing the food vending sites evaluated
Street food vending sites
11
Street food vending sites
Fixed vendor
Takeaway food vending sites
Buregdžinica (“pie place”)
Ćevabdžinica (“barbecue place”)
Pekara (bakery)
Study area (buffer)
Source: Opensteetmap, FEEDcities
Fig. 3. Selected markets and food vending sites in Sarajevo
Kommenterede [BD1]: Note to designer This edited map information (legend) can be set alongside the map (as I have done it) or placed in the map (as it was done originally). The old legend of course needs to be deleted. Same for all following.
Fixed vendor
Takeaway food vending sites
11
Street food vending sites
Fixed vendor
Takeaway food vending sites
Buregdžinica (“pie place”)
Ćevabdžinica (“barbecue place”)
Pekara (bakery)
Study area (buffer)
Source: Opensteetmap, FEEDcities
Fig. 3. Selected markets and food vending sites in Sarajevo
Kommenterede [BD1]: Note to designer This edited map information (legend) can be set alongside the map (as I have done it) or placed in the map (as it was done originally). The old legend of course needs to be deleted. Same for all following. Buregdžinica (“pie
place”)
11
Street food vending sites
Fixed vendor
Takeaway food vending sites
Buregdžinica (“pie place”)
Ćevabdžinica (“barbecue place”)
Pekara (bakery)
Study area (buffer)
Source: Opensteetmap, FEEDcities
Fig. 3. Selected markets and food vending sites in Sarajevo
Kommenterede [BD1]: Note to designer This edited map information (legend) can be set alongside the map (as I have done it) or placed in the map (as it was done originally). The old legend of course needs to be deleted. Same for all following.
Ćevabdžinica (“barbecue place”)
11
Street food vending sites
Fixed vendor
Takeaway food vending sites
Buregdžinica (“pie place”)
Ćevabdžinica (“barbecue place”)
Pekara (bakery)
Study area (buffer)
Source: Opensteetmap, FEEDcities
Fig. 3. Selected markets and food vending sites in Sarajevo
Kommenterede [BD1]: Note to designer This edited map information (legend) can be set alongside the map (as I have done it) or placed in the map (as it was done originally). The old legend of course needs to be deleted. Same for all following.
Pekara (bakery)
11
Street food vending sites
Fixed vendor
Takeaway food vending sites
Buregdžinica (“pie place”)
Ćevabdžinica (“barbecue place”)
Pekara (bakery)
Study area (buffer)
Source: Opensteetmap, FEEDcities
Fig. 3. Selected markets and food vending sites in Sarajevo
Kommenterede [BD1]: Note to designer This edited map information (legend) can be set alongside the map (as I have done it) or placed in the map (as it was done originally). The old legend of course needs to be deleted. Same for all following.
Study area (buffer)
Source: Opensteetmap, FEEDcities
Fig. 5. The Grbavica market (pijaca) buffer, showing the food vending sites evaluated
Street food vending sites
11
Street food vending sites
Fixed vendor
Takeaway food vending sites
Buregdžinica (“pie place”)
Ćevabdžinica (“barbecue place”)
Pekara (bakery)
Study area (buffer)
Source: Opensteetmap, FEEDcities
Fig. 3. Selected markets and food vending sites in Sarajevo
Kommenterede [BD1]: Note to designer This edited map information (legend) can be set alongside the map (as I have done it) or placed in the map (as it was done originally). The old legend of course needs to be deleted. Same for all following.
Fixed vendor
Takeaway food vending sites
11
Street food vending sites
Fixed vendor
Takeaway food vending sites
Buregdžinica (“pie place”)
Ćevabdžinica (“barbecue place”)
Pekara (bakery)
Study area (buffer)
Source: Opensteetmap, FEEDcities
Fig. 3. Selected markets and food vending sites in Sarajevo
Kommenterede [BD1]: Note to designer This edited map information (legend) can be set alongside the map (as I have done it) or placed in the map (as it was done originally). The old legend of course needs to be deleted. Same for all following. Buregdžinica (“pie
place”)
11
Street food vending sites
Fixed vendor
Takeaway food vending sites
Buregdžinica (“pie place”)
Ćevabdžinica (“barbecue place”)
Pekara (bakery)
Study area (buffer)
Source: Opensteetmap, FEEDcities
Fig. 3. Selected markets and food vending sites in Sarajevo
Kommenterede [BD1]: Note to designer This edited map information (legend) can be set alongside the map (as I have done it) or placed in the map (as it was done originally). The old legend of course needs to be deleted. Same for all following.
Ćevabdžinica (“barbecue place”)
11
Street food vending sites
Fixed vendor
Takeaway food vending sites
Buregdžinica (“pie place”)
Ćevabdžinica (“barbecue place”)
Pekara (bakery)
Study area (buffer)
Source: Opensteetmap, FEEDcities
Fig. 3. Selected markets and food vending sites in Sarajevo
Kommenterede [BD1]: Note to designer This edited map information (legend) can be set alongside the map (as I have done it) or placed in the map (as it was done originally). The old legend of course needs to be deleted. Same for all following.
Pekara (bakery)
11
Street food vending sites
Fixed vendor
Takeaway food vending sites
Buregdžinica (“pie place”)
Ćevabdžinica (“barbecue place”)
Pekara (bakery)
Study area (buffer)
Source: Opensteetmap, FEEDcities
Fig. 3. Selected markets and food vending sites in Sarajevo
Kommenterede [BD1]: Note to designer This edited map information (legend) can be set alongside the map (as I have done it) or placed in the map (as it was done originally). The old legend of course needs to be deleted. Same for all following.
Study area (buffer)
Source: Opensteetmap, FEEDcities
12
Street food vending sites
Fixed vendor
Takeaway food vending sites
Buregdžinica (“pie place”)
Ćevabdžinica (“barbecue place”)
Pekara (bakery)
Study area (buffer)
Source: Google Satellite, FEEDcities
Fig. 4. The Markale market (pijaca) buffer, showing the food vending sites evaluated
13
Street food vending sites
Fixed vendor
Takeaway food vending sites
Buregdžinica (“pie place”)
Ćevabdžinica (“barbecue place”)
Pekara (bakery)
Study area (buffer)
Source: Google Satellite, FEEDcities
Fig. 5. The Grbavica market (pijaca) buffer, showing the food vending sites evaluated
11
Fig. 6. The Hrasno market (pijaca) buffer, showing the food vending sites evaluated
Street food vending sites
11
Street food vending sites
Fixed vendor
Takeaway food vending sites
Buregdžinica (“pie place”)
Ćevabdžinica (“barbecue place”)
Pekara (bakery)
Study area (buffer)
Source: Opensteetmap, FEEDcities
Fig. 3. Selected markets and food vending sites in Sarajevo
Kommenterede [BD1]: Note to designer This edited map information (legend) can be set alongside the map (as I have done it) or placed in the map (as it was done originally). The old legend of course needs to be deleted. Same for all following.
Fixed vendor
Takeaway food vending sites
11
Street food vending sites
Fixed vendor
Takeaway food vending sites
Buregdžinica (“pie place”)
Ćevabdžinica (“barbecue place”)
Pekara (bakery)
Study area (buffer)
Source: Opensteetmap, FEEDcities
Fig. 3. Selected markets and food vending sites in Sarajevo
Kommenterede [BD1]: Note to designer This edited map information (legend) can be set alongside the map (as I have done it) or placed in the map (as it was done originally). The old legend of course needs to be deleted. Same for all following. Buregdžinica (“pie
place”)
11
Street food vending sites
Fixed vendor
Takeaway food vending sites
Buregdžinica (“pie place”)
Ćevabdžinica (“barbecue place”)
Pekara (bakery)
Study area (buffer)
Source: Opensteetmap, FEEDcities
Fig. 3. Selected markets and food vending sites in Sarajevo
Kommenterede [BD1]: Note to designer This edited map information (legend) can be set alongside the map (as I have done it) or placed in the map (as it was done originally). The old legend of course needs to be deleted. Same for all following.
Ćevabdžinica (“barbecue place”)
11
Street food vending sites
Fixed vendor
Takeaway food vending sites
Buregdžinica (“pie place”)
Ćevabdžinica (“barbecue place”)
Pekara (bakery)
Study area (buffer)
Source: Opensteetmap, FEEDcities
Fig. 3. Selected markets and food vending sites in Sarajevo
Kommenterede [BD1]: Note to designer This edited map information (legend) can be set alongside the map (as I have done it) or placed in the map (as it was done originally). The old legend of course needs to be deleted. Same for all following.
Pekara (bakery)
11
Street food vending sites
Fixed vendor
Takeaway food vending sites
Buregdžinica (“pie place”)
Ćevabdžinica (“barbecue place”)
Pekara (bakery)
Study area (buffer)
Source: Opensteetmap, FEEDcities
Fig. 3. Selected markets and food vending sites in Sarajevo
Kommenterede [BD1]: Note to designer This edited map information (legend) can be set alongside the map (as I have done it) or placed in the map (as it was done originally). The old legend of course needs to be deleted. Same for all following.
Study area (buffer)
Source: Opensteetmap, FEEDcities
Fig. 7. The Ciglane market (pijaca) buffer, showing the food vending sites evaluated
Street food vending sites
11
Street food vending sites
Fixed vendor
Takeaway food vending sites
Buregdžinica (“pie place”)
Ćevabdžinica (“barbecue place”)
Pekara (bakery)
Study area (buffer)
Source: Opensteetmap, FEEDcities
Fig. 3. Selected markets and food vending sites in Sarajevo
Kommenterede [BD1]: Note to designer This edited map information (legend) can be set alongside the map (as I have done it) or placed in the map (as it was done originally). The old legend of course needs to be deleted. Same for all following.
Fixed vendor
Takeaway food vending sites
11
Street food vending sites
Fixed vendor
Takeaway food vending sites
Buregdžinica (“pie place”)
Ćevabdžinica (“barbecue place”)
Pekara (bakery)
Study area (buffer)
Source: Opensteetmap, FEEDcities
Fig. 3. Selected markets and food vending sites in Sarajevo
Kommenterede [BD1]: Note to designer This edited map information (legend) can be set alongside the map (as I have done it) or placed in the map (as it was done originally). The old legend of course needs to be deleted. Same for all following. Buregdžinica (“pie
place”)
11
Street food vending sites
Fixed vendor
Takeaway food vending sites
Buregdžinica (“pie place”)
Ćevabdžinica (“barbecue place”)
Pekara (bakery)
Study area (buffer)
Source: Opensteetmap, FEEDcities
Fig. 3. Selected markets and food vending sites in Sarajevo
Kommenterede [BD1]: Note to designer This edited map information (legend) can be set alongside the map (as I have done it) or placed in the map (as it was done originally). The old legend of course needs to be deleted. Same for all following.
Ćevabdžinica (“barbecue place”)
11
Street food vending sites
Fixed vendor
Takeaway food vending sites
Buregdžinica (“pie place”)
Ćevabdžinica (“barbecue place”)
Pekara (bakery)
Study area (buffer)
Source: Opensteetmap, FEEDcities
Fig. 3. Selected markets and food vending sites in Sarajevo
Kommenterede [BD1]: Note to designer This edited map information (legend) can be set alongside the map (as I have done it) or placed in the map (as it was done originally). The old legend of course needs to be deleted. Same for all following.
Pekara (bakery)
11
Street food vending sites
Fixed vendor
Takeaway food vending sites
Buregdžinica (“pie place”)
Ćevabdžinica (“barbecue place”)
Pekara (bakery)
Study area (buffer)
Source: Opensteetmap, FEEDcities
Fig. 3. Selected markets and food vending sites in Sarajevo
Kommenterede [BD1]: Note to designer This edited map information (legend) can be set alongside the map (as I have done it) or placed in the map (as it was done originally). The old legend of course needs to be deleted. Same for all following.
Study area (buffer)
Source: Opensteetmap, FEEDcities
15
Street food vending sites
Fixed vendor
Takeaway food vending sites
Buregdžinica (“pie place”)
Ćevabdžinica (“barbecue place”)
Pekara (bakery)
Study area (buffer)
Source: Google Satellite, FEEDcities
Fig. 7. The Ciglane market (pijaca) buffer, showing the food vending sites evaluated
14
Street food vending sites
Fixed vendor
Takeaway food vending sites
Buregdžinica (“pie place”)
Ćevabdžinica (“barbecue place”)
Pekara (bakery)
Study area (buffer)
Source: Google Satellite, FEEDcities
Fig. 6. The Hrasno market (pijaca) buffer, showing the food vending sites evaluated
12
Fig. 8. The Otoka market (pijaca) buffer, showing the food vending sites evaluated
Street food vending sites
11
Street food vending sites
Fixed vendor
Takeaway food vending sites
Buregdžinica (“pie place”)
Ćevabdžinica (“barbecue place”)
Pekara (bakery)
Study area (buffer)
Source: Opensteetmap, FEEDcities
Fig. 3. Selected markets and food vending sites in Sarajevo
Kommenterede [BD1]: Note to designer This edited map information (legend) can be set alongside the map (as I have done it) or placed in the map (as it was done originally). The old legend of course needs to be deleted. Same for all following.
Fixed vendor
Takeaway food vending sites
11
Street food vending sites
Fixed vendor
Takeaway food vending sites
Buregdžinica (“pie place”)
Ćevabdžinica (“barbecue place”)
Pekara (bakery)
Study area (buffer)
Source: Opensteetmap, FEEDcities
Fig. 3. Selected markets and food vending sites in Sarajevo
Kommenterede [BD1]: Note to designer This edited map information (legend) can be set alongside the map (as I have done it) or placed in the map (as it was done originally). The old legend of course needs to be deleted. Same for all following. Buregdžinica (“pie
place”)
11
Street food vending sites
Fixed vendor
Takeaway food vending sites
Buregdžinica (“pie place”)
Ćevabdžinica (“barbecue place”)
Pekara (bakery)
Study area (buffer)
Source: Opensteetmap, FEEDcities
Fig. 3. Selected markets and food vending sites in Sarajevo
Kommenterede [BD1]: Note to designer This edited map information (legend) can be set alongside the map (as I have done it) or placed in the map (as it was done originally). The old legend of course needs to be deleted. Same for all following.
Ćevabdžinica (“barbecue place”)
11
Street food vending sites
Fixed vendor
Takeaway food vending sites
Buregdžinica (“pie place”)
Ćevabdžinica (“barbecue place”)
Pekara (bakery)
Study area (buffer)
Source: Opensteetmap, FEEDcities
Fig. 3. Selected markets and food vending sites in Sarajevo
Kommenterede [BD1]: Note to designer This edited map information (legend) can be set alongside the map (as I have done it) or placed in the map (as it was done originally). The old legend of course needs to be deleted. Same for all following.
Pekara (bakery)
11
Street food vending sites
Fixed vendor
Takeaway food vending sites
Buregdžinica (“pie place”)
Ćevabdžinica (“barbecue place”)
Pekara (bakery)
Study area (buffer)
Source: Opensteetmap, FEEDcities
Fig. 3. Selected markets and food vending sites in Sarajevo
Kommenterede [BD1]: Note to designer This edited map information (legend) can be set alongside the map (as I have done it) or placed in the map (as it was done originally). The old legend of course needs to be deleted. Same for all following.
Study area (buffer)
Source: Opensteetmap, FEEDcities
Fig. 9. The Alipašino Polje market (pijaca) buffer, showing the food vending sites evaluated
Street food vending sites
11
Street food vending sites
Fixed vendor
Takeaway food vending sites
Buregdžinica (“pie place”)
Ćevabdžinica (“barbecue place”)
Pekara (bakery)
Study area (buffer)
Source: Opensteetmap, FEEDcities
Fig. 3. Selected markets and food vending sites in Sarajevo
Kommenterede [BD1]: Note to designer This edited map information (legend) can be set alongside the map (as I have done it) or placed in the map (as it was done originally). The old legend of course needs to be deleted. Same for all following.
Fixed vendor
Takeaway food vending sites
11
Street food vending sites
Fixed vendor
Takeaway food vending sites
Buregdžinica (“pie place”)
Ćevabdžinica (“barbecue place”)
Pekara (bakery)
Study area (buffer)
Source: Opensteetmap, FEEDcities
Fig. 3. Selected markets and food vending sites in Sarajevo
Kommenterede [BD1]: Note to designer This edited map information (legend) can be set alongside the map (as I have done it) or placed in the map (as it was done originally). The old legend of course needs to be deleted. Same for all following. Buregdžinica (“pie
place”)
11
Street food vending sites
Fixed vendor
Takeaway food vending sites
Buregdžinica (“pie place”)
Ćevabdžinica (“barbecue place”)
Pekara (bakery)
Study area (buffer)
Source: Opensteetmap, FEEDcities
Fig. 3. Selected markets and food vending sites in Sarajevo
Kommenterede [BD1]: Note to designer This edited map information (legend) can be set alongside the map (as I have done it) or placed in the map (as it was done originally). The old legend of course needs to be deleted. Same for all following.
Ćevabdžinica (“barbecue place”)
11
Street food vending sites
Fixed vendor
Takeaway food vending sites
Buregdžinica (“pie place”)
Ćevabdžinica (“barbecue place”)
Pekara (bakery)
Study area (buffer)
Source: Opensteetmap, FEEDcities
Fig. 3. Selected markets and food vending sites in Sarajevo
Kommenterede [BD1]: Note to designer This edited map information (legend) can be set alongside the map (as I have done it) or placed in the map (as it was done originally). The old legend of course needs to be deleted. Same for all following.
Pekara (bakery)
11
Street food vending sites
Fixed vendor
Takeaway food vending sites
Buregdžinica (“pie place”)
Ćevabdžinica (“barbecue place”)
Pekara (bakery)
Study area (buffer)
Source: Opensteetmap, FEEDcities
Fig. 3. Selected markets and food vending sites in Sarajevo
Kommenterede [BD1]: Note to designer This edited map information (legend) can be set alongside the map (as I have done it) or placed in the map (as it was done originally). The old legend of course needs to be deleted. Same for all following.
Study area (buffer)
Source: Opensteetmap, FEEDcities
16
Street food vending sites
Fixed vendor
Takeaway food vending sites
Buregdžinica (“pie place”)
Ćevabdžinica (“barbecue place”)
Pekara (bakery)
Study area (buffer)
Source: Google Satellite, FEEDcities
Fig. 8. The Otoka market (pijaca) buffer, showing the food vending sites evaluated
17
Street food vending sites
Fixed vendor
Takeaway food vending sites
Buregdžinica (“pie place”)
Ćevabdžinica (“barbecue place”)
Pekara (bakery)
Study area (buffer)
Source: Google Satellite, FEEDcities
Fig. 9. The Alipašino Polje market (pijaca) buffer, showing the food vending sites evaluated
13
Fig. 10. The Vogošća market (pijaca) buffer, showing the food vending sites evaluated
Street food vending sites
11
Street food vending sites
Fixed vendor
Takeaway food vending sites
Buregdžinica (“pie place”)
Ćevabdžinica (“barbecue place”)
Pekara (bakery)
Study area (buffer)
Source: Opensteetmap, FEEDcities
Fig. 3. Selected markets and food vending sites in Sarajevo
Kommenterede [BD1]: Note to designer This edited map information (legend) can be set alongside the map (as I have done it) or placed in the map (as it was done originally). The old legend of course needs to be deleted. Same for all following.
Fixed vendor
Takeaway food vending sites
11
Street food vending sites
Fixed vendor
Takeaway food vending sites
Buregdžinica (“pie place”)
Ćevabdžinica (“barbecue place”)
Pekara (bakery)
Study area (buffer)
Source: Opensteetmap, FEEDcities
Fig. 3. Selected markets and food vending sites in Sarajevo
Kommenterede [BD1]: Note to designer This edited map information (legend) can be set alongside the map (as I have done it) or placed in the map (as it was done originally). The old legend of course needs to be deleted. Same for all following. Buregdžinica (“pie
place”)
11
Street food vending sites
Fixed vendor
Takeaway food vending sites
Buregdžinica (“pie place”)
Ćevabdžinica (“barbecue place”)
Pekara (bakery)
Study area (buffer)
Source: Opensteetmap, FEEDcities
Fig. 3. Selected markets and food vending sites in Sarajevo
Kommenterede [BD1]: Note to designer This edited map information (legend) can be set alongside the map (as I have done it) or placed in the map (as it was done originally). The old legend of course needs to be deleted. Same for all following.
Ćevabdžinica (“barbecue place”)
11
Street food vending sites
Fixed vendor
Takeaway food vending sites
Buregdžinica (“pie place”)
Ćevabdžinica (“barbecue place”)
Pekara (bakery)
Study area (buffer)
Source: Opensteetmap, FEEDcities
Fig. 3. Selected markets and food vending sites in Sarajevo
Kommenterede [BD1]: Note to designer This edited map information (legend) can be set alongside the map (as I have done it) or placed in the map (as it was done originally). The old legend of course needs to be deleted. Same for all following.
Pekara (bakery)
11
Street food vending sites
Fixed vendor
Takeaway food vending sites
Buregdžinica (“pie place”)
Ćevabdžinica (“barbecue place”)
Pekara (bakery)
Study area (buffer)
Source: Opensteetmap, FEEDcities
Fig. 3. Selected markets and food vending sites in Sarajevo
Kommenterede [BD1]: Note to designer This edited map information (legend) can be set alongside the map (as I have done it) or placed in the map (as it was done originally). The old legend of course needs to be deleted. Same for all following.
Study area (buffer)
Source: Opensteetmap, FEEDcities
Fig. 11. The Dobrinja market (pijaca) buffer, showing the food vending sites evaluated
Street food vending sites
11
Street food vending sites
Fixed vendor
Takeaway food vending sites
Buregdžinica (“pie place”)
Ćevabdžinica (“barbecue place”)
Pekara (bakery)
Study area (buffer)
Source: Opensteetmap, FEEDcities
Fig. 3. Selected markets and food vending sites in Sarajevo
Kommenterede [BD1]: Note to designer This edited map information (legend) can be set alongside the map (as I have done it) or placed in the map (as it was done originally). The old legend of course needs to be deleted. Same for all following.
Fixed vendor
Takeaway food vending sites
11
Street food vending sites
Fixed vendor
Takeaway food vending sites
Buregdžinica (“pie place”)
Ćevabdžinica (“barbecue place”)
Pekara (bakery)
Study area (buffer)
Source: Opensteetmap, FEEDcities
Fig. 3. Selected markets and food vending sites in Sarajevo
Kommenterede [BD1]: Note to designer This edited map information (legend) can be set alongside the map (as I have done it) or placed in the map (as it was done originally). The old legend of course needs to be deleted. Same for all following. Buregdžinica (“pie
place”)
11
Street food vending sites
Fixed vendor
Takeaway food vending sites
Buregdžinica (“pie place”)
Ćevabdžinica (“barbecue place”)
Pekara (bakery)
Study area (buffer)
Source: Opensteetmap, FEEDcities
Fig. 3. Selected markets and food vending sites in Sarajevo
Kommenterede [BD1]: Note to designer This edited map information (legend) can be set alongside the map (as I have done it) or placed in the map (as it was done originally). The old legend of course needs to be deleted. Same for all following.
Ćevabdžinica (“barbecue place”)
11
Street food vending sites
Fixed vendor
Takeaway food vending sites
Buregdžinica (“pie place”)
Ćevabdžinica (“barbecue place”)
Pekara (bakery)
Study area (buffer)
Source: Opensteetmap, FEEDcities
Fig. 3. Selected markets and food vending sites in Sarajevo
Kommenterede [BD1]: Note to designer This edited map information (legend) can be set alongside the map (as I have done it) or placed in the map (as it was done originally). The old legend of course needs to be deleted. Same for all following.
Pekara (bakery)
11
Street food vending sites
Fixed vendor
Takeaway food vending sites
Buregdžinica (“pie place”)
Ćevabdžinica (“barbecue place”)
Pekara (bakery)
Study area (buffer)
Source: Opensteetmap, FEEDcities
Fig. 3. Selected markets and food vending sites in Sarajevo
Kommenterede [BD1]: Note to designer This edited map information (legend) can be set alongside the map (as I have done it) or placed in the map (as it was done originally). The old legend of course needs to be deleted. Same for all following.
Study area (buffer)
Source: Opensteetmap, FEEDcities
18
Street food vending sites
Fixed vendor
Takeaway food vending sites
Buregdžinica (“pie place”)
Ćevabdžinica (“barbecue place”)
Pekara (bakery)
Study area (buffer)
Source: Google Satellite, FEEDcities
Fig. 10. The Vogošća market (pijaca) buffer, showing the food vending sites evaluated
19
Street food vending sites
Fixed vendor
Takeaway food vending sites
Buregdžinica (“pie place”)
Ćevabdžinica (“barbecue place”)
Pekara (bakery)
Study area (buffer)
Source: Google Satellite, FEEDcities
Fig. 11. The Dobrinja market (pijaca) buffer, showing the food vending sites evaluated
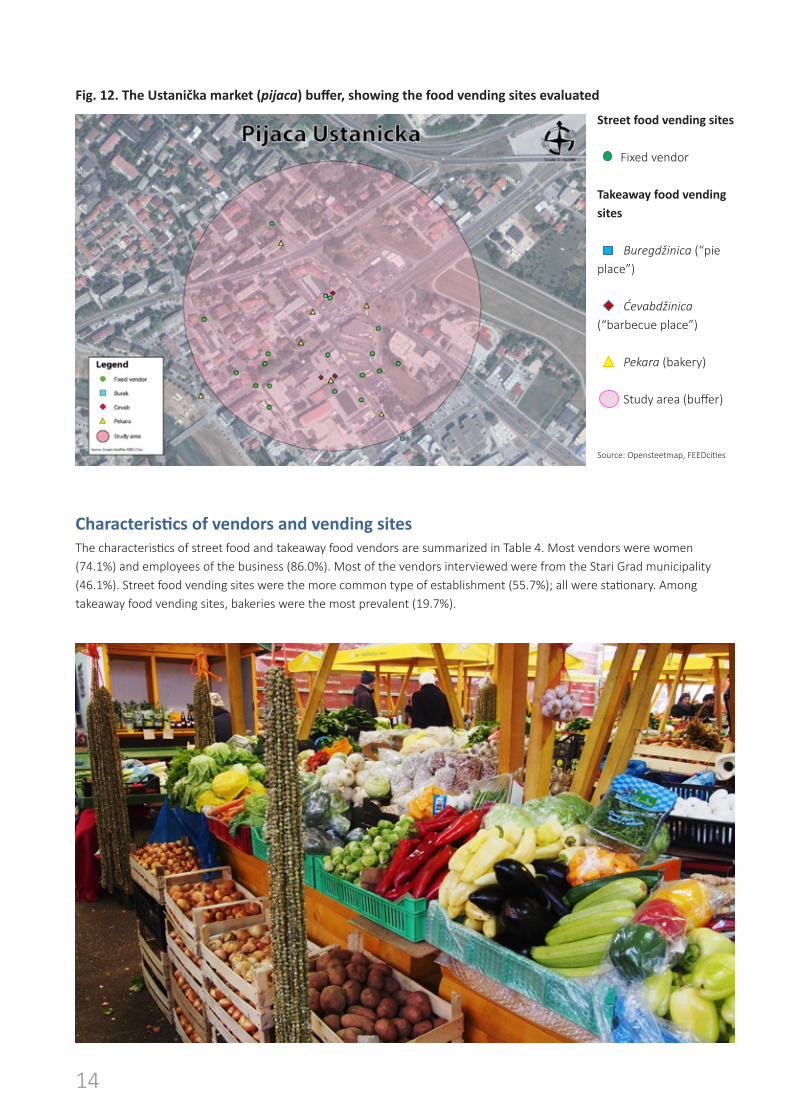
14
Fig. 12. The Ustanička market (pijaca) buffer, showing the food vending sites evaluated
Street food vending sites
11
Street food vending sites
Fixed vendor
Takeaway food vending sites
Buregdžinica (“pie place”)
Ćevabdžinica (“barbecue place”)
Pekara (bakery)
Study area (buffer)
Source: Opensteetmap, FEEDcities
Fig. 3. Selected markets and food vending sites in Sarajevo
Kommenterede [BD1]: Note to designer This edited map information (legend) can be set alongside the map (as I have done it) or placed in the map (as it was done originally). The old legend of course needs to be deleted. Same for all following.
Fixed vendor
Takeaway food vending sites
11
Street food vending sites
Fixed vendor
Takeaway food vending sites
Buregdžinica (“pie place”)
Ćevabdžinica (“barbecue place”)
Pekara (bakery)
Study area (buffer)
Source: Opensteetmap, FEEDcities
Fig. 3. Selected markets and food vending sites in Sarajevo
Kommenterede [BD1]: Note to designer This edited map information (legend) can be set alongside the map (as I have done it) or placed in the map (as it was done originally). The old legend of course needs to be deleted. Same for all following. Buregdžinica (“pie
place”)
11
Street food vending sites
Fixed vendor
Takeaway food vending sites
Buregdžinica (“pie place”)
Ćevabdžinica (“barbecue place”)
Pekara (bakery)
Study area (buffer)
Source: Opensteetmap, FEEDcities
Fig. 3. Selected markets and food vending sites in Sarajevo
Kommenterede [BD1]: Note to designer This edited map information (legend) can be set alongside the map (as I have done it) or placed in the map (as it was done originally). The old legend of course needs to be deleted. Same for all following.
Ćevabdžinica (“barbecue place”)
11
Street food vending sites
Fixed vendor
Takeaway food vending sites
Buregdžinica (“pie place”)
Ćevabdžinica (“barbecue place”)
Pekara (bakery)
Study area (buffer)
Source: Opensteetmap, FEEDcities
Fig. 3. Selected markets and food vending sites in Sarajevo
Kommenterede [BD1]: Note to designer This edited map information (legend) can be set alongside the map (as I have done it) or placed in the map (as it was done originally). The old legend of course needs to be deleted. Same for all following.
Pekara (bakery)
11
Street food vending sites
Fixed vendor
Takeaway food vending sites
Buregdžinica (“pie place”)
Ćevabdžinica (“barbecue place”)
Pekara (bakery)
Study area (buffer)
Source: Opensteetmap, FEEDcities
Fig. 3. Selected markets and food vending sites in Sarajevo
Kommenterede [BD1]: Note to designer This edited map information (legend) can be set alongside the map (as I have done it) or placed in the map (as it was done originally). The old legend of course needs to be deleted. Same for all following.
Study area (buffer)
Source: Opensteetmap, FEEDcities
Characteristics of vendors and vending sites The characteristics of street food and takeaway food vendors are summarized in Table 4. Most vendors were women (74.1%) and employees of the business (86.0%). Most of the vendors interviewed were from the Stari Grad municipality (46.1%). Street food vending sites were the more common type of establishment (55.7%); all were stationary. Among takeaway food vending sites, bakeries were the most prevalent (19.7%).
20
Street food vending sites
Fixed vendor
Takeaway food vending sites
Buregdžinica (“pie place”)
Ćevabdžinica (“barbecue place”)
Pekara (bakery)
Study area (buffer)
Source: Google Satellite, FEEDcities
Fig. 12. The Ustanička market (pijaca) buffer, showing the food vending sites evaluated
Kommenterede [BD2]: NB Where the name is printed over the map, the accent (č) is missing.
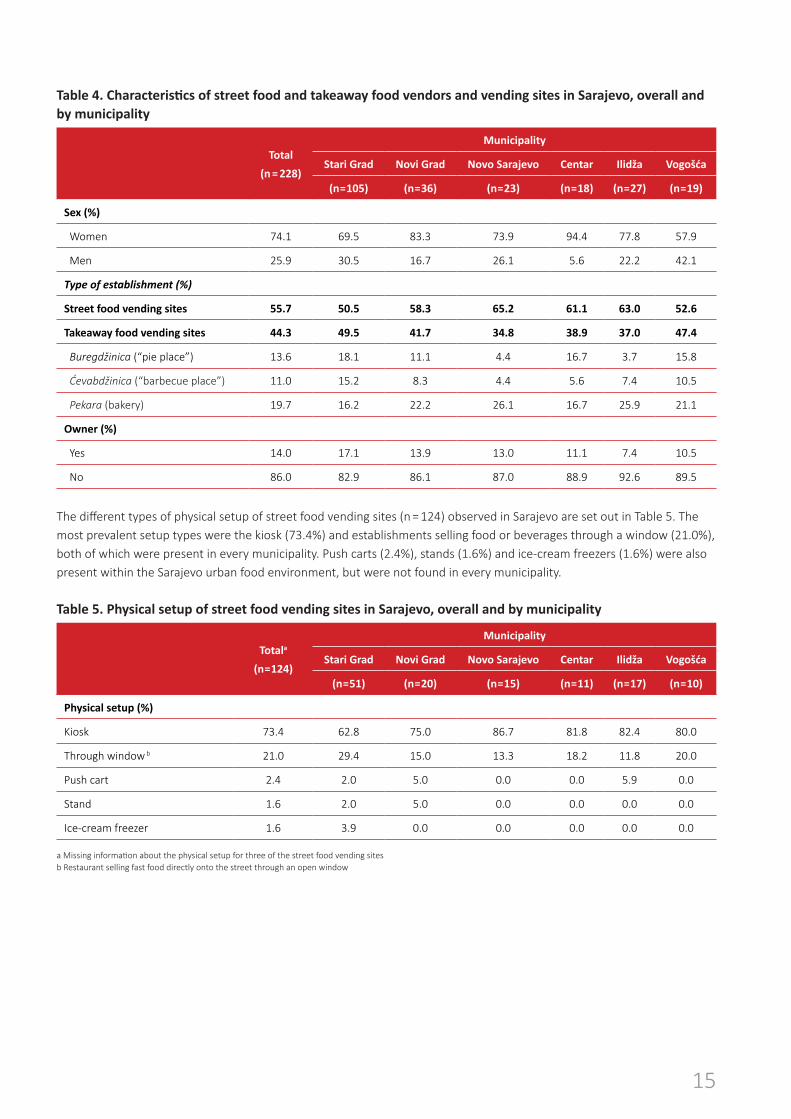
15
Table 4. Characteristics of street food and takeaway food vendors and vending sites in Sarajevo, overall and by municipality
Total
(n = 228)
Municipality
Stari Grad Novi Grad Novo Sarajevo Centar Ilidža Vogošća
(n = 105) (n = 36) (n = 23) (n = 18) (n = 27) (n = 19)
Sex (%)
Women 74.1 69.5 83.3 73.9 94.4 77.8 57.9
Men 25.9 30.5 16.7 26.1 5.6 22.2 42.1
Type of establishment (%)
Street food vending sites 55.7 50.5 58.3 65.2 61.1 63.0 52.6
Takeaway food vending sites 44.3 49.5 41.7 34.8 38.9 37.0 47.4
Buregdžinica (“pie place”) 13.6 18.1 11.1 4.4 16.7 3.7 15.8
Ćevabdžinica (“barbecue place”) 11.0 15.2 8.3 4.4 5.6 7.4 10.5
Pekara (bakery) 19.7 16.2 22.2 26.1 16.7 25.9 21.1
Owner (%)
Yes 14.0 17.1 13.9 13.0 11.1 7.4 10.5
No 86.0 82.9 86.1 87.0 88.9 92.6 89.5
The different types of physical setup of street food vending sites (n = 124) observed in Sarajevo are set out in Table 5. The most prevalent setup types were the kiosk (73.4%) and establishments selling food or beverages through a window (21.0%), both of which were present in every municipality. Push carts (2.4%), stands (1.6%) and ice-cream freezers (1.6%) were also present within the Sarajevo urban food environment, but were not found in every municipality.
Table 5. Physical setup of street food vending sites in Sarajevo, overall and by municipality
Totala
(n = 124)
Municipality
Stari Grad Novi Grad Novo Sarajevo Centar Ilidža Vogošća
(n = 51) (n = 20) (n = 15) (n = 11) (n = 17) (n = 10)
Physical setup (%)
Kiosk 73.4 62.8 75.0 86.7 81.8 82.4 80.0
Through window b 21.0 29.4 15.0 13.3 18.2 11.8 20.0
Push cart 2.4 2.0 5.0 0.0 0.0 5.9 0.0
Stand 1.6 2.0 5.0 0.0 0.0 0.0 0.0
Ice-cream freezer 1.6 3.9 0.0 0.0 0.0 0.0 0.0
a Missing information about the physical setup for three of the street food vending sitesb Restaurant selling fast food directly onto the street through an open window
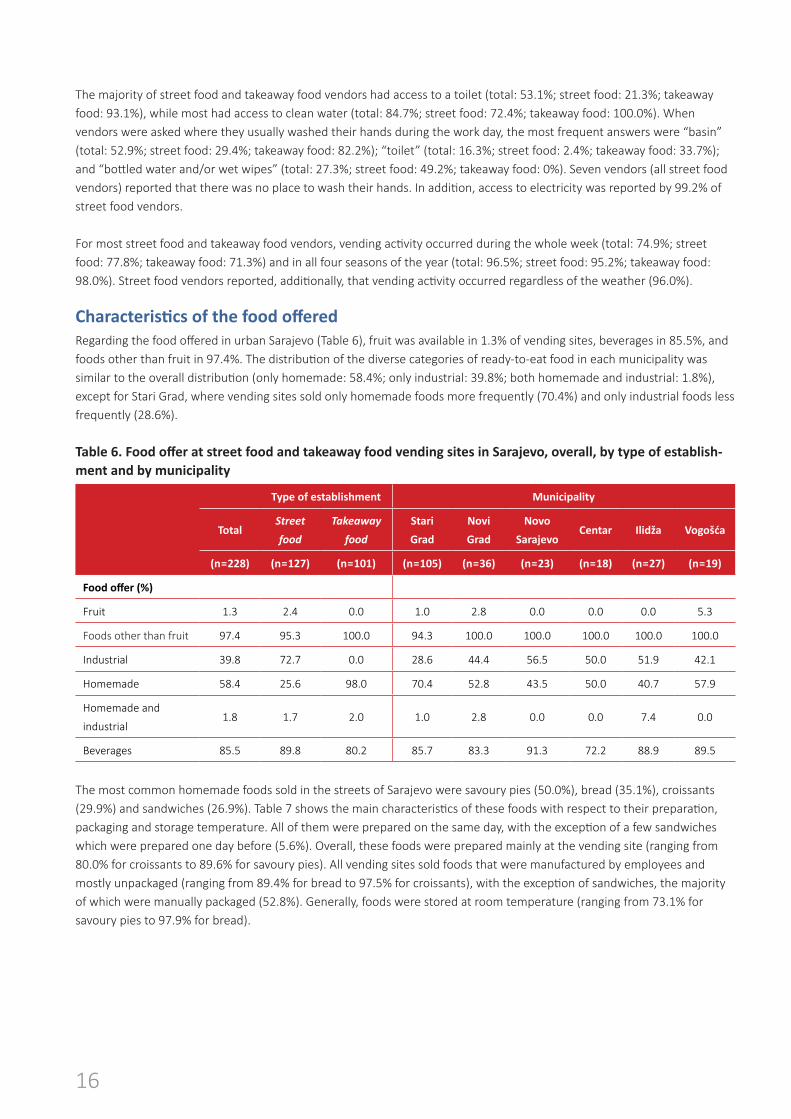
16
The majority of street food and takeaway food vendors had access to a toilet (total: 53.1%; street food: 21.3%; takeaway food: 93.1%), while most had access to clean water (total: 84.7%; street food: 72.4%; takeaway food: 100.0%). When vendors were asked where they usually washed their hands during the work day, the most frequent answers were “basin” (total: 52.9%; street food: 29.4%; takeaway food: 82.2%); “toilet” (total: 16.3%; street food: 2.4%; takeaway food: 33.7%); and “bottled water and/or wet wipes” (total: 27.3%; street food: 49.2%; takeaway food: 0%). Seven vendors (all street food vendors) reported that there was no place to wash their hands. In addition, access to electricity was reported by 99.2% of street food vendors.
For most street food and takeaway food vendors, vending activity occurred during the whole week (total: 74.9%; street food: 77.8%; takeaway food: 71.3%) and in all four seasons of the year (total: 96.5%; street food: 95.2%; takeaway food: 98.0%). Street food vendors reported, additionally, that vending activity occurred regardless of the weather (96.0%).
Characteristics of the food offeredRegarding the food offered in urban Sarajevo (Table 6), fruit was available in 1.3% of vending sites, beverages in 85.5%, and foods other than fruit in 97.4%. The distribution of the diverse categories of ready-to-eat food in each municipality was similar to the overall distribution (only homemade: 58.4%; only industrial: 39.8%; both homemade and industrial: 1.8%), except for Stari Grad, where vending sites sold only homemade foods more frequently (70.4%) and only industrial foods less frequently (28.6%).
Table 6. Food offer at street food and takeaway food vending sites in Sarajevo, overall, by type of establish-ment and by municipality
Type of establishment Municipality
TotalStreet
food
Takeaway
food
Stari
Grad
Novi
Grad
Novo
SarajevoCentar Ilidža Vogošća
(n = 228) (n = 127) (n = 101) (n = 105) (n = 36) (n = 23) (n = 18) (n = 27) (n = 19)
Food offer (%)
Fruit 1.3 2.4 0.0 1.0 2.8 0.0 0.0 0.0 5.3
Foods other than fruit 97.4 95.3 100.0 94.3 100.0 100.0 100.0 100.0 100.0
Industrial 39.8 72.7 0.0 28.6 44.4 56.5 50.0 51.9 42.1
Homemade 58.4 25.6 98.0 70.4 52.8 43.5 50.0 40.7 57.9
Homemade and
industrial1.8 1.7 2.0 1.0 2.8 0.0 0.0 7.4 0.0
Beverages 85.5 89.8 80.2 85.7 83.3 91.3 72.2 88.9 89.5
The most common homemade foods sold in the streets of Sarajevo were savoury pies (50.0%), bread (35.1%), croissants (29.9%) and sandwiches (26.9%). Table 7 shows the main characteristics of these foods with respect to their preparation, packaging and storage temperature. All of them were prepared on the same day, with the exception of a few sandwiches which were prepared one day before (5.6%). Overall, these foods were prepared mainly at the vending site (ranging from 80.0% for croissants to 89.6% for savoury pies). All vending sites sold foods that were manufactured by employees and mostly unpackaged (ranging from 89.4% for bread to 97.5% for croissants), with the exception of sandwiches, the majority of which were manually packaged (52.8%). Generally, foods were stored at room temperature (ranging from 73.1% for savoury pies to 97.9% for bread).
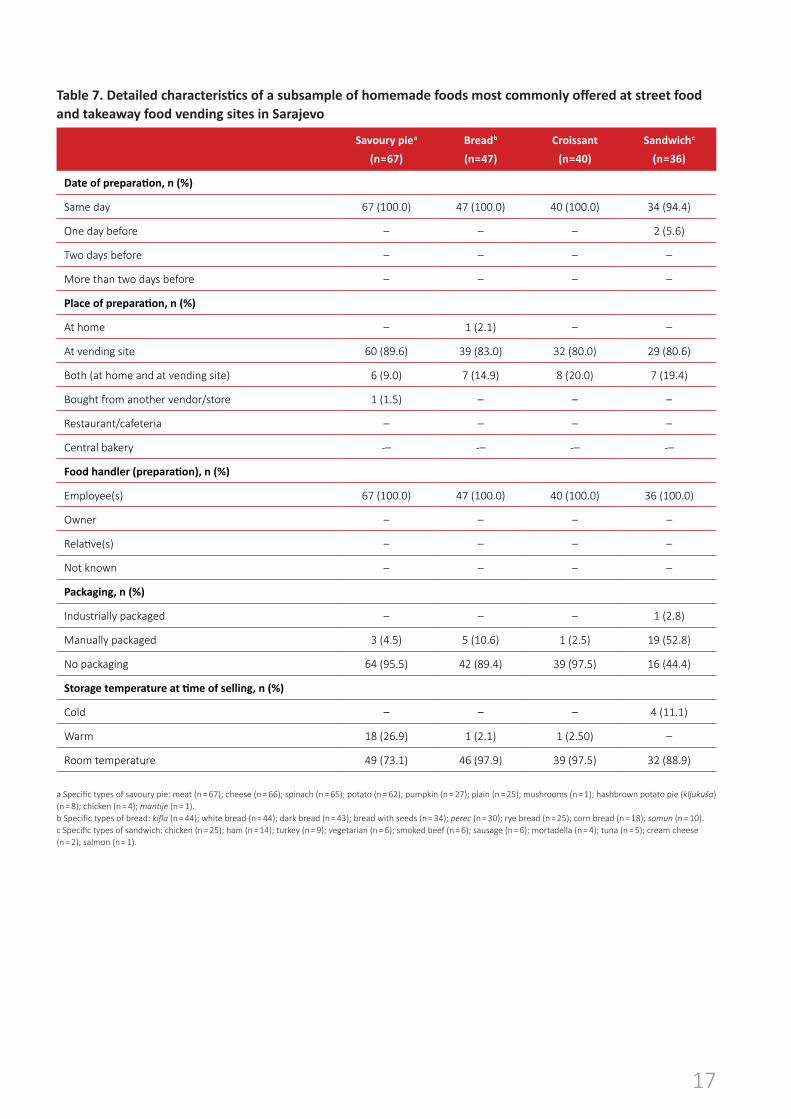
17
Table 7. Detailed characteristics of a subsample of homemade foods most commonly offered at street food and takeaway food vending sites in Sarajevo
Savoury pie a
(n = 67)
Bread b
(n = 47)
Croissant
(n = 40)
Sandwich c
(n = 36)
Date of preparation, n (%)
Same day 67 (100.0) 47 (100.0) 40 (100.0) 34 (94.4)
One day before – – – 2 (5.6)
Two days before – – – –
More than two days before – – – –
Place of preparation, n (%)
At home – 1 (2.1) – –
At vending site 60 (89.6) 39 (83.0) 32 (80.0) 29 (80.6)
Both (at home and at vending site) 6 (9.0) 7 (14.9) 8 (20.0) 7 (19.4)
Bought from another vendor/store 1 (1.5) – – –
Restaurant/cafeteria – – – –
Central bakery -– -– -– -–
Food handler (preparation), n (%)
Employee(s) 67 (100.0) 47 (100.0) 40 (100.0) 36 (100.0)
Owner – – – –
Relative(s) – – – –
Not known – – – –
Packaging, n (%)
Industrially packaged – – – 1 (2.8)
Manually packaged 3 (4.5) 5 (10.6) 1 (2.5) 19 (52.8)
No packaging 64 (95.5) 42 (89.4) 39 (97.5) 16 (44.4)
Storage temperature at time of selling, n (%)
Cold – – – 4 (11.1)
Warm 18 (26.9) 1 (2.1) 1 (2.50) –
Room temperature 49 (73.1) 46 (97.9) 39 (97.5) 32 (88.9)
a Specific types of savoury pie: meat (n = 67); cheese (n = 66); spinach (n = 65); potato (n = 62); pumpkin (n = 27); plain (n = 25); mushrooms (n = 1); hashbrown potato pie (kljukuša) (n = 8); chicken (n = 4); mantije (n = 1).b Specific types of bread: kifla (n = 44); white bread (n = 44); dark bread (n = 43); bread with seeds (n = 34); perec (n = 30); rye bread (n = 25); corn bread (n = 18); somun (n = 10).c Specific types of sandwich: chicken (n = 25); ham (n = 14); turkey (n = 9); vegetarian (n = 6); smoked beef (n = 6); sausage (n = 6); mortadella (n = 4); tuna (n = 5); cream cheese (n = 2); salmon (n = 1).
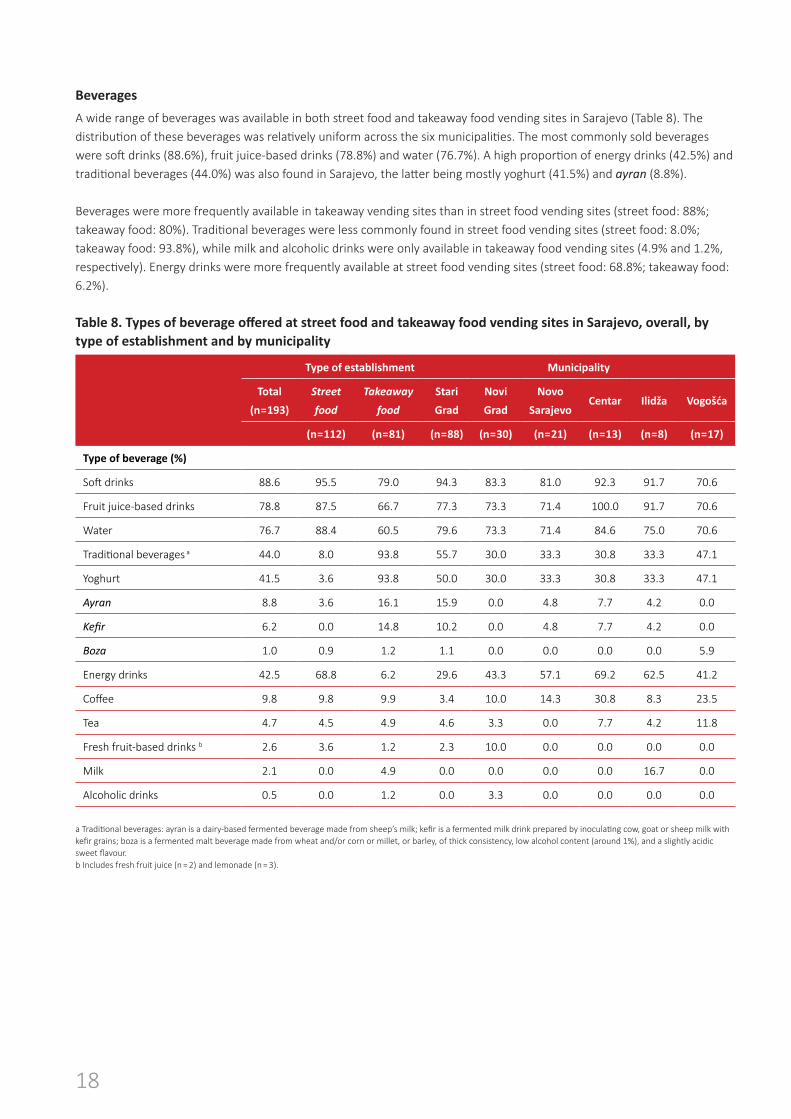
18
Beverages
A wide range of beverages was available in both street food and takeaway food vending sites in Sarajevo (Table 8). The distribution of these beverages was relatively uniform across the six municipalities. The most commonly sold beverages were soft drinks (88.6%), fruit juice-based drinks (78.8%) and water (76.7%). A high proportion of energy drinks (42.5%) and traditional beverages (44.0%) was also found in Sarajevo, the latter being mostly yoghurt (41.5%) and ayran (8.8%).
Beverages were more frequently available in takeaway vending sites than in street food vending sites (street food: 88%; takeaway food: 80%). Traditional beverages were less commonly found in street food vending sites (street food: 8.0%; takeaway food: 93.8%), while milk and alcoholic drinks were only available in takeaway food vending sites (4.9% and 1.2%, respectively). Energy drinks were more frequently available at street food vending sites (street food: 68.8%; takeaway food: 6.2%).
Table 8. Types of beverage offered at street food and takeaway food vending sites in Sarajevo, overall, by type of establishment and by municipality
Type of establishment Municipality
Total
(n = 193)
Street
food
Takeaway
food
Stari
Grad
Novi
Grad
Novo
SarajevoCentar Ilidža Vogošća
(n = 112) (n = 81) (n = 88) (n = 30) (n = 21) (n = 13) (n = 8) (n = 17)
Type of beverage (%)
Soft drinks 88.6 95.5 79.0 94.3 83.3 81.0 92.3 91.7 70.6
Fruit juice-based drinks 78.8 87.5 66.7 77.3 73.3 71.4 100.0 91.7 70.6
Water 76.7 88.4 60.5 79.6 73.3 71.4 84.6 75.0 70.6
Traditional beverages a 44.0 8.0 93.8 55.7 30.0 33.3 30.8 33.3 47.1
Yoghurt 41.5 3.6 93.8 50.0 30.0 33.3 30.8 33.3 47.1
Ayran 8.8 3.6 16.1 15.9 0.0 4.8 7.7 4.2 0.0
Kefir 6.2 0.0 14.8 10.2 0.0 4.8 7.7 4.2 0.0
Boza 1.0 0.9 1.2 1.1 0.0 0.0 0.0 0.0 5.9
Energy drinks 42.5 68.8 6.2 29.6 43.3 57.1 69.2 62.5 41.2
Coffee 9.8 9.8 9.9 3.4 10.0 14.3 30.8 8.3 23.5
Tea 4.7 4.5 4.9 4.6 3.3 0.0 7.7 4.2 11.8
Fresh fruit-based drinks b 2.6 3.6 1.2 2.3 10.0 0.0 0.0 0.0 0.0
Milk 2.1 0.0 4.9 0.0 0.0 0.0 0.0 16.7 0.0
Alcoholic drinks 0.5 0.0 1.2 0.0 3.3 0.0 0.0 0.0 0.0
a Traditional beverages: ayran is a dairy-based fermented beverage made from sheep’s milk; kefir is a fermented milk drink prepared by inoculating cow, goat or sheep milk with kefir grains; boza is a fermented malt beverage made from wheat and/or corn or millet, or barley, of thick consistency, low alcohol content (around 1%), and a slightly acidic sweet flavour.b Includes fresh fruit juice (n = 2) and lemonade (n = 3).
19
Nutritional composition of foods collectedThe nutritional composition of the 30 most commonly available foods other than fruit that were collected in the streets of Sarajevo is shown in Table 9. A wide range of food products was analysed, including, for example, traditional and western fast foods, sweet and savoury pastries, snacks and traditional main dishes. The TFA, sodium and potassium content varied substantially across the products analysed, with high values of these nutrients (relative to serving size) found mainly among homemade foods.
The mean TFA content per serving was highest for the following homemade foods: puff pastry (1.86 g), sweet pie (1.52 g), stuffed roll (1.47 g) and pljeskavica (0.92 g), corresponding to 83.9%, 68.7%, 66.4% and 41.7%, respectively, of the recommended maximum daily intake of TFA (based on a reference daily intake of 2000 kcal for an average adult). The mean TFA content per serving was lowest for industrial salted peanuts (0.01 g), industrial popcorn (0.01 g), homemade white bread (0.01 g) and perec bread (0.01 g), corresponding to 0.6%, 0.5%, 0.5% and 0.4%, respectively, of the recommended maximum daily intake of TFA.
The highest mean sodium content per serving was observed in the following homemade foods: pljeskavica (3838 mg), ćevapi (2231 mg), hamburger (1798 mg) and meat savoury pie (1394 mg), corresponding to 191.9%, 111.5%, 89.9% and 69.7%, respectively, of the recommended maximum daily intake. The lowest mean sodium content per serving was observed in the following industrial foods: popcorn (121 mg), biscuits/cookies (87 mg), chocolate (43 mg) and ice-cream (39 mg), corresponding to 6.1%, 4.3%, 2.1% and 1.9%, respectively, of the recommended maximum daily intake.
The mean potassium content per serving was highest for the following homemade foods: pljeskavica (814 mg), ćevapi (507 mg), hamburger (500 mg) and meat savoury pie (471 mg), corresponding to 23.2%, 14.4%, 14.2% and 13.4%, respectively, of the recommended minimum daily intake for potassium. The mean potassium content per serving was lowest for the following foods: homemade kifla (69 mg), industrial salted peanuts (66 mg), homemade perec bread (63 mg) and industrial salty crackers (50 mg), corresponding to 2.0%, 1.9%, 1.8% and 1.4%, respectively, of the recommended minimum daily intake for potassium.
These results show that a number of street and takeaway foods available in Sarajevo are nutritionally inadequate with respect to their TFA, sodium and potassium content. For example, a single portion of pljeskavica (traditional barbecue, a main dish) exceeds the recommended maximum daily sodium intake (191.9%) and accounts for a large proportion of the recommended maximum daily TFA intake (41.7%).
In fact, homemade traditional foods, such as barbecue or savoury pastries, were found to have high sodium and TFA content, most of them exceeding 50% of the recommended maximum daily intake for these nutrients. Conversely, the foods analysed presented, generally, low proportions of the recommended daily potassium intake.
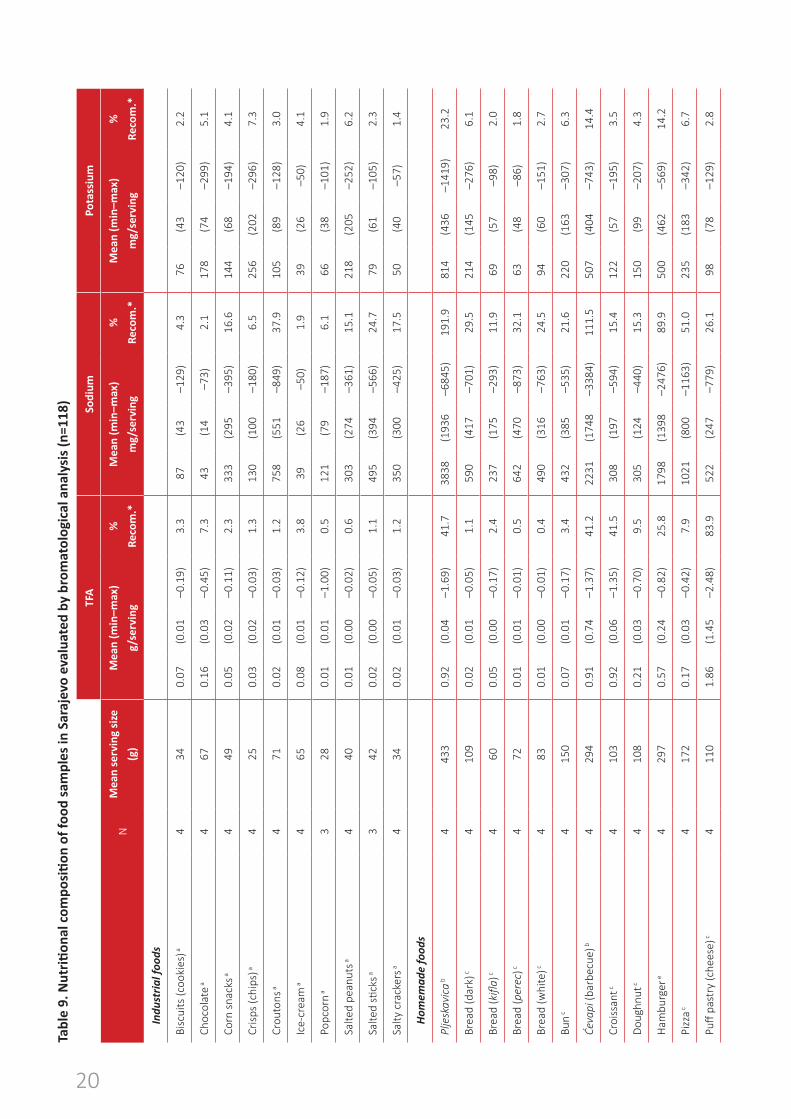
20
Tabl
e 9.
Nut
riti
onal
com
posi
tion
of f
ood
sam
ples
in S
araj
evo
eval
uate
d by
bro
mat
olog
ical
ana
lysi
s (n
=118
)
TF
ASo
dium
Pota
ssiu
m
N
Mea
n se
rvin
g si
ze
(g)
Mea
n (m
in–m
ax)
g/se
rvin
g
%
Reco
m.*
Mea
n (m
in–m
ax)
mg/
serv
ing
%
Reco
m.*
Mea
n (m
in–m
ax)
mg/
serv
ing
%
Reco
m.*
In
dust
rial
food
s
Bisc
uits
(coo
kies
) a4
340.
07(0
.01
–0.1
9)3.
387
(43
–129
)4.
376
(43
–120
)2.
2
Choc
olat
e a
467
0.16
(0.0
3–0
.45)
7.3
43(1
4–7
3)2.
117
8(7
4–2
99)
5.1
Corn
sna
cks a
449
0.05
(0.0
2–0
.11)
2.3
333
(295
–395
)16
.614
4(6
8–1
94)
4.1
Crisp
s (c
hips
) a4
250.
03(0
.02
–0.0
3)1.
313
0(1
00–1
80)
6.5
256
(202
–296
)7.
3
Crou
tons
a4
710.
02(0
.01
–0.0
3)1.
275
8(5
51–8
49)
37.9
105
(89
–128
)3.
0
Ice-
crea
m a
465
0.08
(0.0
1–0
.12)
3.8
39(2
6–5
0)1.
939
(26
–50)
4.1
Popc
orn
a3
280.
01(0
.01
–1.0
0)0.
512
1(7
9–1
87)
6.1
66(3
8–1
01)
1.9
Salte
d pe
anut
s a4
400.
01(0
.00
–0.0
2)0.
630
3(2
74–3
61)
15.1
218
(205
–252
)6.
2
Salte
d sti
cks a
342
0.02
(0.0
0–0
.05)
1.1
495
(394
–566
)24
.779
(61
–105
)2.
3
Salty
cra
cker
s a4
340.
02(0
.01
–0.0
3)1.
235
0(3
00–4
25)
17.5
50(4
0–5
7)1.
4
H
omem
ade
food
s
Plje
skav
ica
b4
433
0.92
(0.0
4–1
.69)
41.7
3838
(193
6–6
845)
191.
981
4(4
36–1
419)
23.2
Brea
d (d
ark)
c4
109
0.02
(0.0
1–0
.05)
1.1
590
(417
–701
)29
.521
4(1
45–2
76)
6.1
Brea
d (kifla)
c4
600.
05(0
.00
–0.1
7)2.
423
7(1
75–2
93)
11.9
69(5
7–9
8)2.
0
Brea
d (p
erec
) c4
720.
01(0
.01
–0.0
1)0.
564
2(4
70–8
73)
32.1
63(4
8–8
6)1.
8
Brea
d (w
hite
) c4
830.
01(0
.00
–0.0
1)0.
449
0(3
16–7
63)
24.5
94(6
0–1
51)
2.7
Bun
c4
150
0.07
(0.0
1–0
.17)
3.4
432
(385
–535
)21
.622
0(1
63–3
07)
6.3
Ćevapi
(bar
becu
e) b
429
40.
91(0
.74
–1.3
7)41
.222
31(1
748
–338
4)11
1.5
507
(404
–743
)14
.4
Croi
ssan
t c4
103
0.92
(0.0
6–1
.35)
41.5
308
(197
–594
)15
.412
2(5
7–1
95)
3.5
Doug
hnut
c4
108
0.21
(0.0
3–0
.70)
9.5
305
(124
–440
)15
.315
0(9
9–2
07)
4.3
Ham
burg
er e
429
70.
57(0
.24
–0.8
2)25
.817
98(1
398
–247
6)89
.950
0(4
62–5
69)
14.2
Pizz
a c4
172
0.17
(0.0
3–0
.42)
7.9
1021
(800
–116
3)51
.023
5(1
83–3
42)
6.7
Puff
past
ry (c
hees
e) c
411
01.
86(1
.45
–2.4
8)83
.952
2(2
47–7
79)
26.1
98(7
8–1
29)
2.8
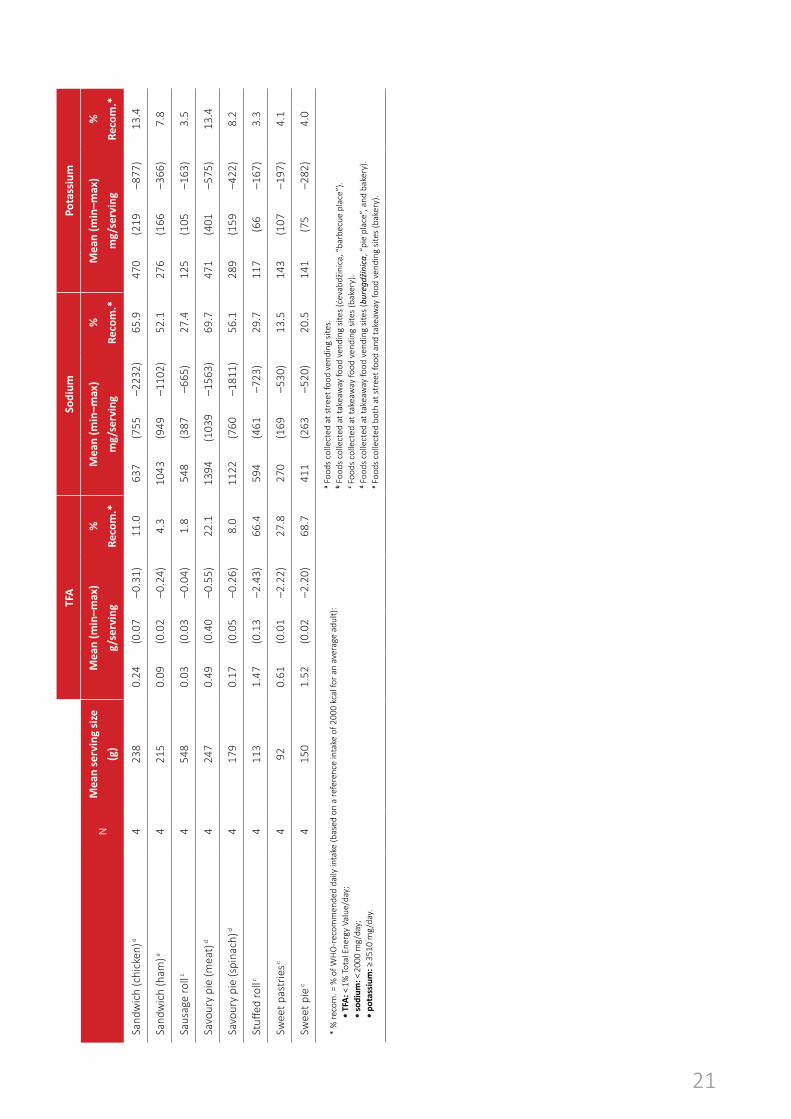
21
TF
ASo
dium
Pota
ssiu
m
N
Mea
n se
rvin
g si
ze
(g)
Mea
n (m
in–m
ax)
g/se
rvin
g
%
Reco
m.*
Mea
n (m
in–m
ax)
mg/
serv
ing
%
Reco
m.*
Mea
n (m
in–m
ax)
mg/
serv
ing
%
Reco
m.*
Sand
wic
h (c
hick
en) e
423
80.
24(0
.07
–0.3
1)11
.063
7(7
55–2
232)
65.9
470
(219
–877
)13
.4
Sand
wic
h (h
am) e
421
50.
09(0
.02
–0.2
4)4.
310
43(9
49–1
102)
52.1
276
(166
–366
)7.
8
Saus
age
roll c
454
80.
03(0
.03
–0.0
4)1.
854
8(3
87–6
65)
27.4
125
(105
–163
)3.
5
Savo
ury
pie
(mea
t) d
424
70.
49(0
.40
–0.5
5)22
.113
94(1
039
–156
3)69
.747
1(4
01–5
75)
13.4
Savo
ury
pie
(spi
nach
) d4
179
0.17
(0.0
5–0
.26)
8.0
1122
(760
–181
1)56
.128
9(1
59–4
22)
8.2
Stuff
ed ro
ll c4
113
1.47
(0.1
3–2
.43)
66.4
594
(461
–723
)29
.711
7(6
6–1
67)
3.3
Swee
t pas
trie
s c4
920.
61(0
.01
–2.2
2)27
.827
0(1
69–5
30)
13.5
143
(107
–197
)4.
1
Swee
t pie
c4
150
1.52
(0.0
2–2
.20)
68.7
411
(263
–520
)20
.514
1(7
5–2
82)
4.0
* %
reco
m. =
% o
f WH
O-r
ecom
men
ded
daily
inta
ke (b
ased
on
a re
fere
nce
inta
ke o
f 200
0 kc
al fo
r an
aver
age
adul
t):
• T
FA: <
1%
Tot
al E
nerg
y Va
lue/
day;
•
sod
ium
: < 2
000
mg/
day;
•
pot
assi
um: ≥
351
0 m
g/da
y.
a Foo
ds c
olle
cted
at s
tree
t foo
d ve
ndin
g sit
es.
b Foo
ds c
olle
cted
at t
akea
way
food
ven
ding
site
s (ć
evab
džin
ica,
“ba
rbec
ue p
lace
”).
c Foo
ds c
olle
cted
at t
akea
way
food
ven
ding
site
s (b
aker
y).
d Foo
ds c
olle
cted
at t
akea
way
food
ven
ding
site
s (bureg
džinica,
“pi
e pl
ace”
, and
bak
ery)
. e F
oods
col
lect
ed b
oth
at st
reet
food
and
take
away
food
ven
ding
site
s (b
aker
y).
22
5. Conclusions and policy implicationsThis report gives an overview of the food context in urban Sarajevo, the capital city of Bosnia and Herzegovina, using a standardized methodology. The urban food environment is mixed, characterized by the coexistence of street food vending sites and more formal establishments selling takeaway food – namely, bakeries, ćevabdžinica (“barbecue places”) and buregdžinica (“pie places”). Ready-to-eat food is abundant and available throughout the city, with a concentration in the city centre. Among the 228 eligible vendors interviewed for this report, most were women, employees of the business, and working on street food vending sites. All street food vending sites were stationary. The majority of street food and takeaway food vendors had access to basic sanitary facilities.
Fruit was sold by 1.3% of the eligible food vending sites, while foods other than fruit were sold by 97.4% of such sites and beverages by 85.5%. Vending sites exclusively selling unprepared fresh fruit were not included in the study sample, so it may be that the availability of fruit is not fully captured by the report. Nevertheless, there is a need to increase the availability of nutritionally dense foods, such as fruit and vegetables, that are rich in fibre and sources of potassium and other micronutrients to the urban population of Sarajevo through markets and other forms of street food supply.
A range of beverages was sold in the streets. Soft drinks were the most frequent, followed by fruit-based juices and, to a lesser extent, energy drinks. This suggests the rising influence of a western-style diet; this is especially concerning given the high sugar content of these drinks, which are known (from observations in other countries) to be the main source of added sugar in the diet (26). This is likely to contribute to excess energy intake and weight gain, running counter to WHO’s recommendation that the intake of free sugars should be reduced throughout the life-course (26). On the other hand, traditional beverages were also widely available, which suggests the continued existence of traditional food habits. These beverages were more frequently available in takeaway vending sites than in street food vending sites. Alcoholic beverages were not found to be widely available – they were present only in a single takeaway food vending site.
Concerning foods other than fruit sold within the urban food environment, homemade foods were more often available than industrial foods. The 30 foods most commonly observed in the streets of Sarajevo included traditional main dishes and various types of sweet and savoury pastries and snacks. With respect to their nutritional composition, the highest values for sodium were found in homemade foods, some of which exceeded 50% (and, in a few cases, 100%) of the recommended daily sodium intake. Notably, some of these foods were westernized foods, such as hamburger and pizza, although traditional foods such as barbecue and savoury pie were also included. This finding underlines the importance of increasing awareness among food vendors (in both street food and takeaway food vending sites) of the need to avoid adding excess salt during cooking and food preparation. Among industrial foods, the savoury snacks that were collected presented the highest sodium content. In view of this, efforts towards reformulation of industrially processed foods to decrease their sodium content may benefit from regulatory measures. Regarding TFA content, high values per serving were again found in homemade foods – in particular, sweet and savoury pastries. This is especially concerning as most of these foods are regularly eaten during the day, possibly leading to excessive intake of a nutrient that is clearly harmful to health. These results back up the findings of a previous multicentre study conducted in several European countries, in which the highest levels of artificial TFA were found in industrial foods sold in supermarkets in Bosnia and Herzegovina (27).
From these results, it is clear that promotion of healthy diets needs to be prioritized and foregrounded within wider work on health/nutrition promotion in the country; a focus on salt and TFA would provide an effective strategic starting point. There are various practical policy options available to encourage a move towards a healthier street food environment; such initiatives should be incorporated into existing policy processes, such as the Action Plan for the Prevention and Control of Noncommunicable Diseases in the Federation of Bosnia and Herzegovina 2019–2025, in order to prevent diet-related NCDs.
Reducing the salt and TFA content of ready-to-eat foods sold in street and takeaway food vending sites is likely to require a multipronged approach. One aspect will involve health promotion activities to educate street and takeaway food vendors to use less salt, and to raise public awareness that these foods can be harmful to health if consumed in excess. A second component will involve government showing leadership and taking on a regulatory role.
23
Taking its lead from initiatives successfully implemented in other countries (28), the government might consider measures aimed at encouraging manufacturers and vendors to shift to healthier ingredients. The slender margins made by street food vendors and small-scale manufacturers mean that they are extremely price-conscious, so in regard to TFA, for example, their choice of cooking fat is likely to be strongly influenced by price (29). Efforts by governments to increase the availability and affordability of healthier oils for use by food vendors and manufacturers (for example, in frying and in pastry preparation) could lead to significant changes in dietary intake, as has been successfully accomplished in other contexts (30). For example, the Healthier Hawker Programme (Singapore) improved availability of and access to healthier oils, reduced-sodium salt and other ingredients, by bulk purchasing and improving the logistics and supply to street vendors. This, in turn, reduced prices and encouraged vendors to swap to healthier ingredients and thus to offer healthier food options (28, 30).
The government could also play a leading role in introducing legislation on TFA and adopting salt-reduction targets for industrially produced foods (e.g. savoury snacks, bread). For TFA, such regulation is likely to follow the model successfully introduced in seven countries of the WHO European Region, where a maximum limit of 2 g TFA per 100 g total fat has been established. For salt, regulation could take the form of setting maximum limits, as has already been done in many countries, such as Turkey, Greece and Finland, and – perhaps most comprehensively – in South Africa and Argentina (31). Such rules would then apply to all foods available on the market, including supermarkets and takeaway and street food vending sites, to ensure a level playing field. One final measure could be to improve the nutritional information provided on food packaging in Bosnia and Herzegovina, to ensure that all products provide a nutrient declaration (which would include sodium and TFA) in addition to an ingredients list.
Such policies require, additionally, regular monitoring. For both salt reduction and TFA elimination, an important starting point will be to map local food suppliers (e.g. manufacturers of oils and fats used in freshly prepared products, wholesale producers, manufacturers of breads, pastries and confectionary, savoury snacks, drinks, and processed meats), in order to engage them and monitor their compliance with regulations and guidance. Such a mapping was previously conducted in India, for example, where the barriers to reducing the use of TFA, as well as the opportunities to do so, were explored in order to improve compliance with the government’s adopted policy (32). Taking international food suppliers into consideration will also be important.
A particularly good example of a monitoring process to ensure compliance with legislation comes from Denmark, which introduced a ban on TFA in food in 2003 (33). In line with this initiative, WHO recently developed a guide to elimination of industrially produced TFA from the global food supply at the national level: the “REPLACE Trans Fat” action package (34). This guide outlines six strategic action areas:
• to review dietary sources of industrially produced TFA;
• to promote replacement of industrially produced TFA with healthier fats and oils;
• to legislate or enact regulatory actions to eliminate industrially produced trans fats;
• to assess and monitor TFA content in the food supply and changes in TFA consumption in the population;
• to create awareness of the negative health impact of TFA among policy-makers, producers, suppliers and the public; and
• to enforce compliance with existing policies and regulations.
Together, such activities would contribute significantly to promotion of healthy diets and prevention of diet-related NCDs in Bosnia and Herzegovina.
This study shows that there is considerable room for improving the nutritional adequacy of street and takeaway foods sold in Sarajevo. It also underlines the need for health policies targeted at enhancing the nutritional quality of such foods – while protecting their cultural and community role – in order to prevent the occurrence of diet-related NCDs in the country. Regulating the production of safe, affordable and nutritious street and takeaway foods, while also promoting the population’s access to vendors selling/promoting healthy foods, is imperative if we are to tackle NCDs and associated health disparities in the urban context.
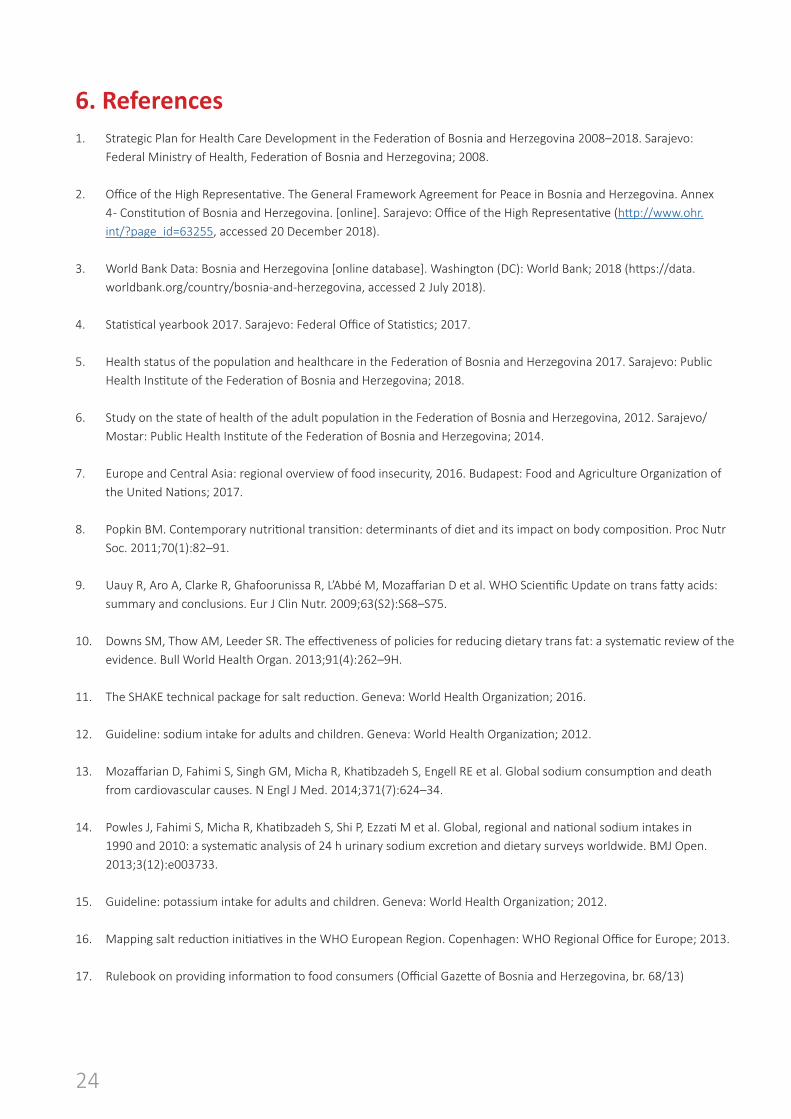
24
6. References1. Strategic Plan for Health Care Development in the Federation of Bosnia and Herzegovina 2008–2018. Sarajevo:
Federal Ministry of Health, Federation of Bosnia and Herzegovina; 2008.
2. Office of the High Representative. The General Framework Agreement for Peace in Bosnia and Herzegovina. Annex 4 - Constitution of Bosnia and Herzegovina. [online]. Sarajevo: Office of the High Representative (http://www.ohr.int/?page_id=63255, accessed 20 December 2018).
3. World Bank Data: Bosnia and Herzegovina [online database]. Washington (DC): World Bank; 2018 (https://data.worldbank.org/country/bosnia-and-herzegovina, accessed 2 July 2018).
4. Statistical yearbook 2017. Sarajevo: Federal Office of Statistics; 2017.
5. Health status of the population and healthcare in the Federation of Bosnia and Herzegovina 2017. Sarajevo: Public Health Institute of the Federation of Bosnia and Herzegovina; 2018.
6. Study on the state of health of the adult population in the Federation of Bosnia and Herzegovina, 2012. Sarajevo/Mostar: Public Health Institute of the Federation of Bosnia and Herzegovina; 2014.
7. Europe and Central Asia: regional overview of food insecurity, 2016. Budapest: Food and Agriculture Organization of the United Nations; 2017.
8. Popkin BM. Contemporary nutritional transition: determinants of diet and its impact on body composition. Proc Nutr Soc. 2011;70(1):82–91.
9. Uauy R, Aro A, Clarke R, Ghafoorunissa R, L’Abbé M, Mozaffarian D et al. WHO Scientific Update on trans fatty acids: summary and conclusions. Eur J Clin Nutr. 2009;63(S2):S68–S75.
10. Downs SM, Thow AM, Leeder SR. The effectiveness of policies for reducing dietary trans fat: a systematic review of the evidence. Bull World Health Organ. 2013;91(4):262–9H.
11. The SHAKE technical package for salt reduction. Geneva: World Health Organization; 2016.
12. Guideline: sodium intake for adults and children. Geneva: World Health Organization; 2012.
13. Mozaffarian D, Fahimi S, Singh GM, Micha R, Khatibzadeh S, Engell RE et al. Global sodium consumption and death from cardiovascular causes. N Engl J Med. 2014;371(7):624–34.
14. Powles J, Fahimi S, Micha R, Khatibzadeh S, Shi P, Ezzati M et al. Global, regional and national sodium intakes in 1990 and 2010: a systematic analysis of 24 h urinary sodium excretion and dietary surveys worldwide. BMJ Open. 2013;3(12):e003733.
15. Guideline: potassium intake for adults and children. Geneva: World Health Organization; 2012.
16. Mapping salt reduction initiatives in the WHO European Region. Copenhagen: WHO Regional Office for Europe; 2013.
17. Rulebook on providing information to food consumers (Official Gazette of Bosnia and Herzegovina, br. 68/13)
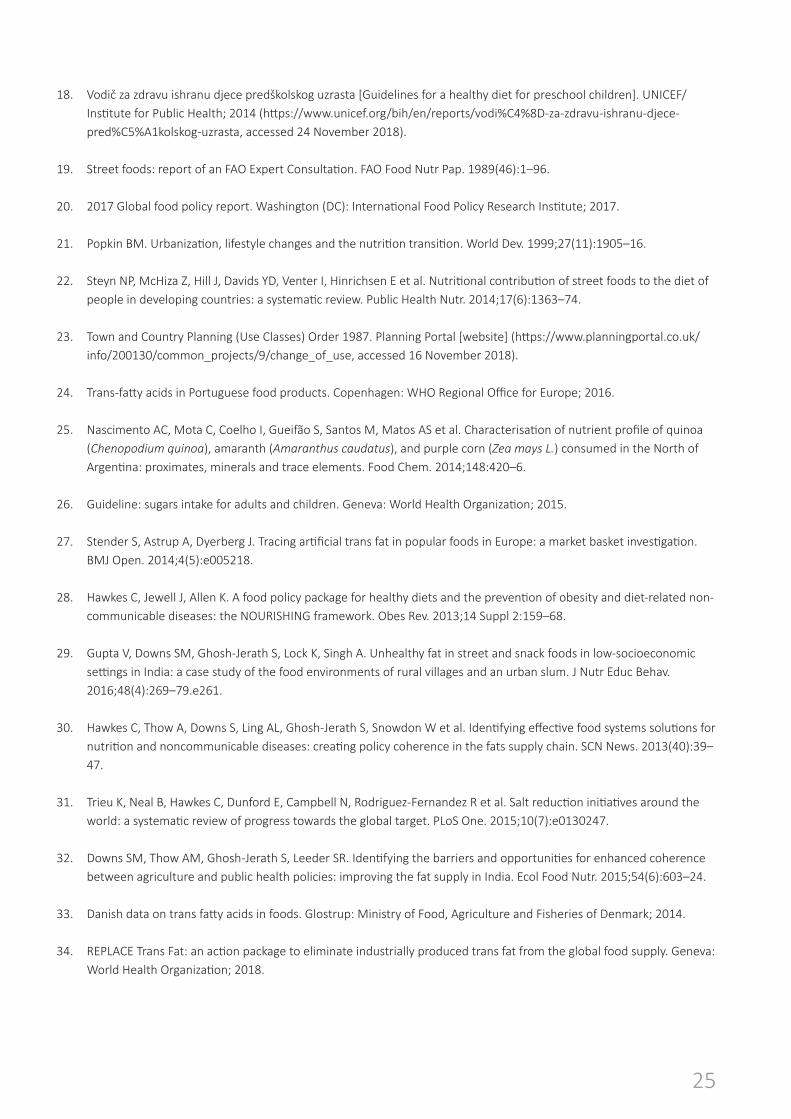
25
18. Vodič za zdravu ishranu djece predškolskog uzrasta [Guidelines for a healthy diet for preschool children]. UNICEF/Institute for Public Health; 2014 (https://www.unicef.org/bih/en/reports/vodi%C4%8D-za-zdravu-ishranu-djece-pred%C5%A1kolskog-uzrasta, accessed 24 November 2018).
19. Street foods: report of an FAO Expert Consultation. FAO Food Nutr Pap. 1989(46):1–96.
20. 2017 Global food policy report. Washington (DC): International Food Policy Research Institute; 2017.
21. Popkin BM. Urbanization, lifestyle changes and the nutrition transition. World Dev. 1999;27(11):1905–16.
22. Steyn NP, McHiza Z, Hill J, Davids YD, Venter I, Hinrichsen E et al. Nutritional contribution of street foods to the diet of people in developing countries: a systematic review. Public Health Nutr. 2014;17(6):1363–74.
23. Town and Country Planning (Use Classes) Order 1987. Planning Portal [website] (https://www.planningportal.co.uk/info/200130/common_projects/9/change_of_use, accessed 16 November 2018).
24. Trans-fatty acids in Portuguese food products. Copenhagen: WHO Regional Office for Europe; 2016.
25. Nascimento AC, Mota C, Coelho I, Gueifão S, Santos M, Matos AS et al. Characterisation of nutrient profile of quinoa (Chenopodium quinoa), amaranth (Amaranthus caudatus), and purple corn (Zea mays L.) consumed in the North of Argentina: proximates, minerals and trace elements. Food Chem. 2014;148:420–6.
26. Guideline: sugars intake for adults and children. Geneva: World Health Organization; 2015.
27. Stender S, Astrup A, Dyerberg J. Tracing artificial trans fat in popular foods in Europe: a market basket investigation. BMJ Open. 2014;4(5):e005218.
28. Hawkes C, Jewell J, Allen K. A food policy package for healthy diets and the prevention of obesity and diet-related non-communicable diseases: the NOURISHING framework. Obes Rev. 2013;14 Suppl 2:159–68.
29. Gupta V, Downs SM, Ghosh-Jerath S, Lock K, Singh A. Unhealthy fat in street and snack foods in low-socioeconomic settings in India: a case study of the food environments of rural villages and an urban slum. J Nutr Educ Behav. 2016;48(4):269–79.e261.
30. Hawkes C, Thow A, Downs S, Ling AL, Ghosh-Jerath S, Snowdon W et al. Identifying effective food systems solutions for nutrition and noncommunicable diseases: creating policy coherence in the fats supply chain. SCN News. 2013(40):39–47.
31. Trieu K, Neal B, Hawkes C, Dunford E, Campbell N, Rodriguez-Fernandez R et al. Salt reduction initiatives around the world: a systematic review of progress towards the global target. PLoS One. 2015;10(7):e0130247.
32. Downs SM, Thow AM, Ghosh-Jerath S, Leeder SR. Identifying the barriers and opportunities for enhanced coherence between agriculture and public health policies: improving the fat supply in India. Ecol Food Nutr. 2015;54(6):603–24.
33. Danish data on trans fatty acids in foods. Glostrup: Ministry of Food, Agriculture and Fisheries of Denmark; 2014.
34. REPLACE Trans Fat: an action package to eliminate industrially produced trans fat from the global food supply. Geneva: World Health Organization; 2018.
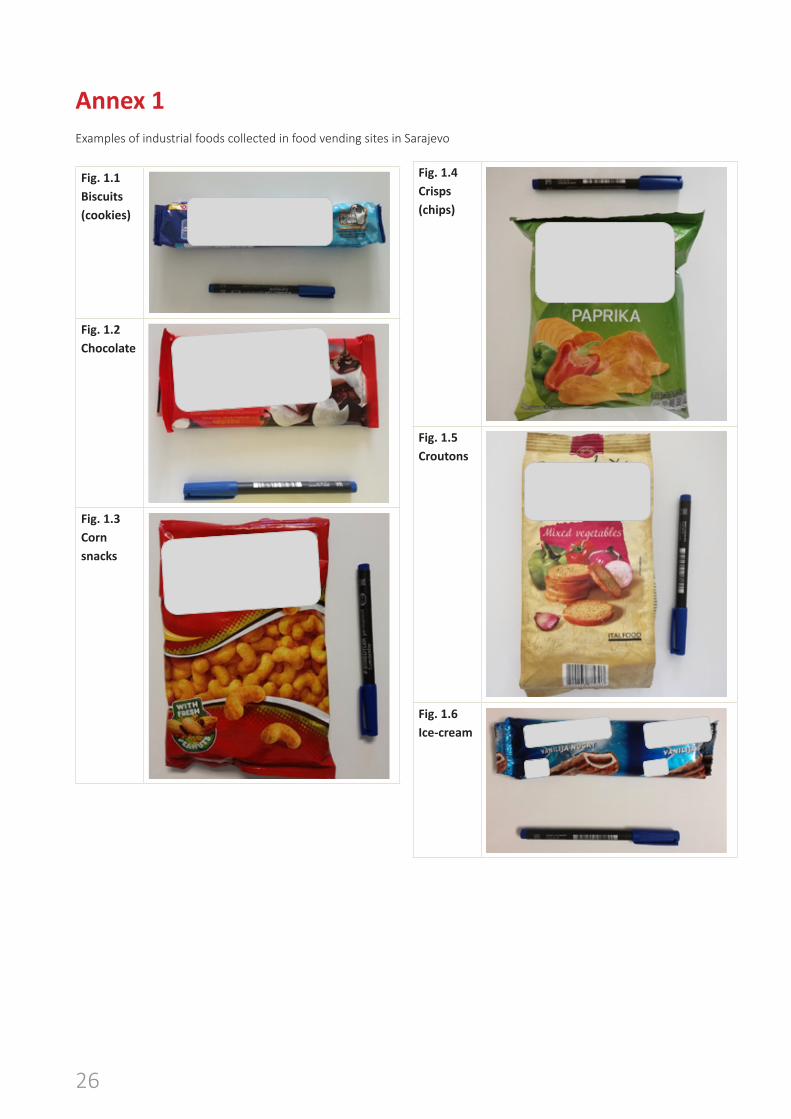
26
Annex 1Examples of industrial foods collected in food vending sites in Sarajevo
Fig. 1.1 Biscuits (cookies)
33
Annex 1
Examples of industrial foods collected in food vending sites in Sarajevo
Fig. 1.1 Biscuits (cookies)
Fig. 1.2 Chocolate
Fig. 1.2 Chocolate
33
Annex 1
Examples of industrial foods collected in food vending sites in Sarajevo
Fig. 1.1 Biscuits (cookies)
Fig. 1.2 Chocolate
Fig. 1.3 Corn snacks
34
Fig. 1.3 Corn snacks
Fig. 1.4 Crisps (chips)
Fig. 1.4 Crisps (chips)
34
Fig. 1.3 Corn snacks
Fig. 1.4 Crisps (chips)
Fig. 1.5 Croutons
35
Fig. 1.5 Croutons
Fig. 1.6 Ice-cream
Fig. 1.6 Ice-cream
35
Fig. 1.5 Croutons
Fig. 1.6 Ice-cream
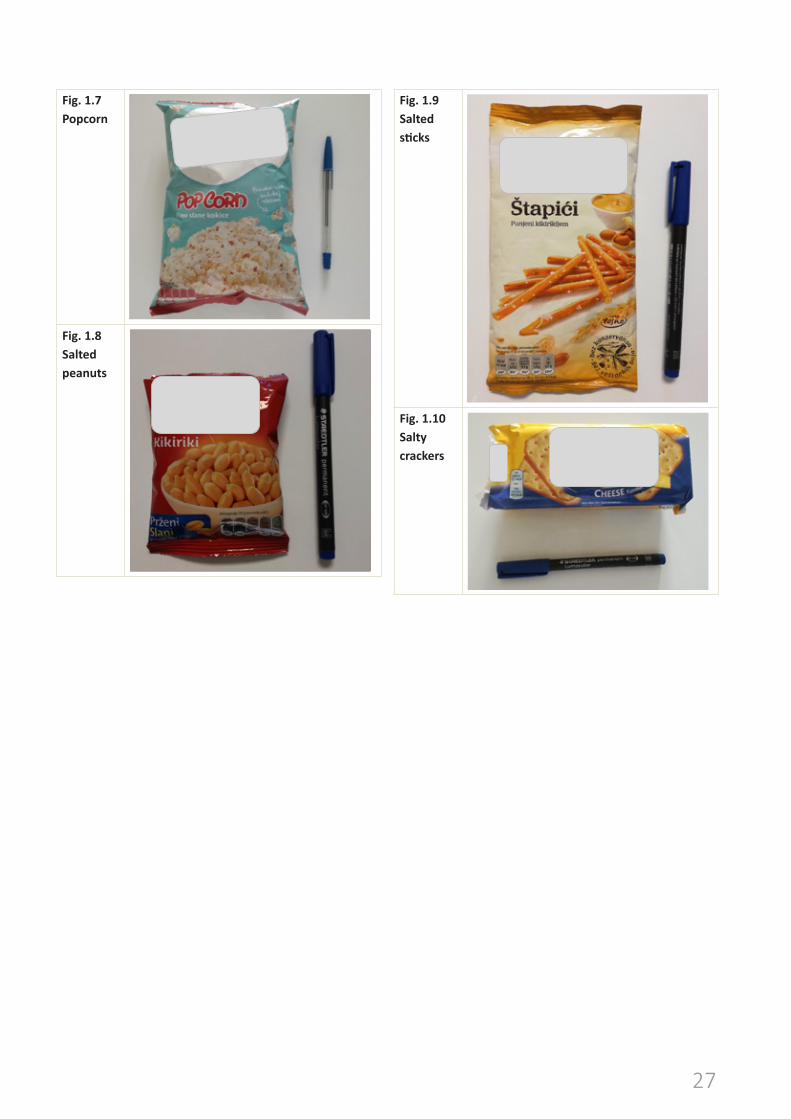
27
Fig. 1.7 Popcorn
36
Fig. 1.7 Popcorn
Fig. 1.8 Salted peanuts
Fig. 1.8 Salted peanuts
36
Fig. 1.7 Popcorn
Fig. 1.8 Salted peanuts
Fig. 1.9 Salted sticks
37
Fig. 1.9 Salted sticks
Fig. 1.10 Salty crackers
Fig. 1.10 Salty crackers
37
Fig. 1.9 Salted sticks
Fig. 1.10 Salty crackers
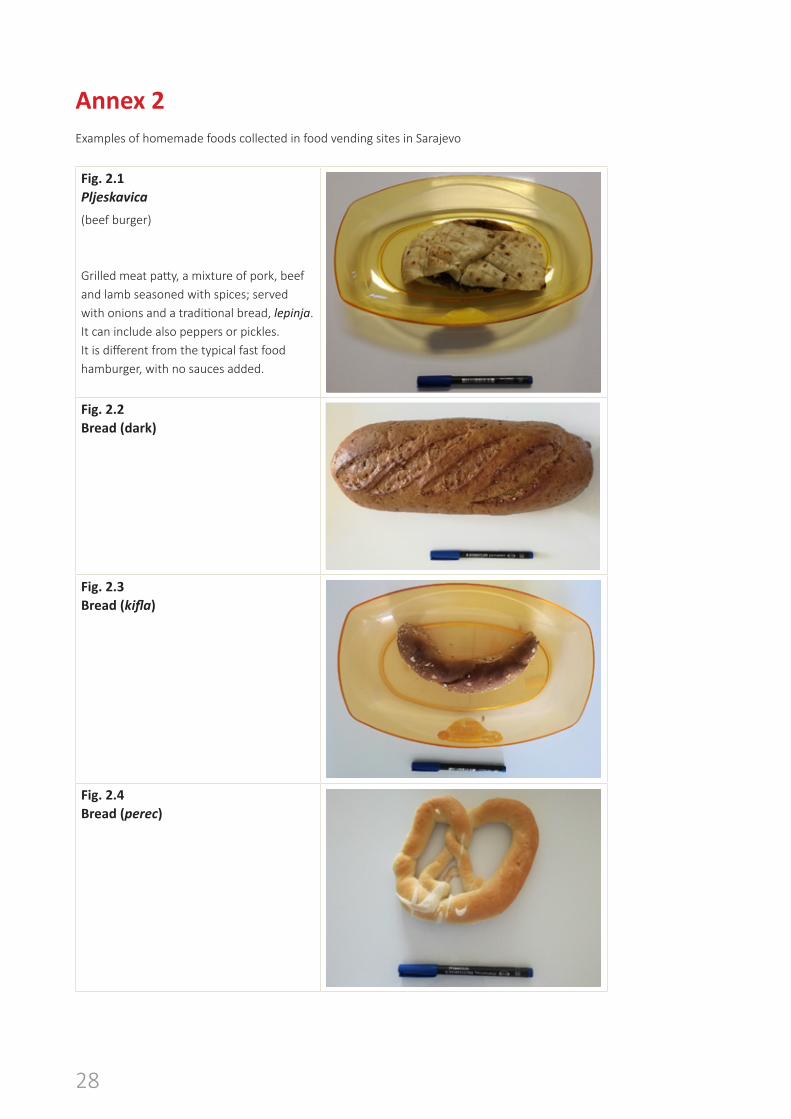
28
Annex 2Examples of homemade foods collected in food vending sites in Sarajevo
Fig. 2.1 Pljeskavica
(beef burger)
Grilled meat patty, a mixture of pork, beef and lamb seasoned with spices; served with onions and a traditional bread, lepinja. It can include also peppers or pickles. It is different from the typical fast food hamburger, with no sauces added.
38
Annex 2
Examples of homemade foods collected in food vending sites in Sarajevo
Fig. 2.1 Pljeskavica
(beef burger)
Grilled meat patty, a mixture of pork, beef and lamb seasoned with spices; served with onions and a traditional bread, lepinja. It can include also peppers or pickles. It is different from the typical fast food hamburger, with no sauces added.
Fig. 2.2 Bread (dark)
Fig. 2.2 Bread (dark)
38
Annex 2
Examples of homemade foods collected in food vending sites in Sarajevo
Fig. 2.1 Pljeskavica
(beef burger)
Grilled meat patty, a mixture of pork, beef and lamb seasoned with spices; served with onions and a traditional bread, lepinja. It can include also peppers or pickles. It is different from the typical fast food hamburger, with no sauces added.
Fig. 2.2 Bread (dark)
Fig. 2.3 Bread (kifla)
39
Fig. 2.3 Bread (kifla)
Fig. 2.4 Bread (perec)
Fig. 2.5 Bread (white)
Fig. 2.4 Bread (perec)
39
Fig. 2.3 Bread (kifla)
Fig. 2.4 Bread (perec)
Fig. 2.5 Bread (white)
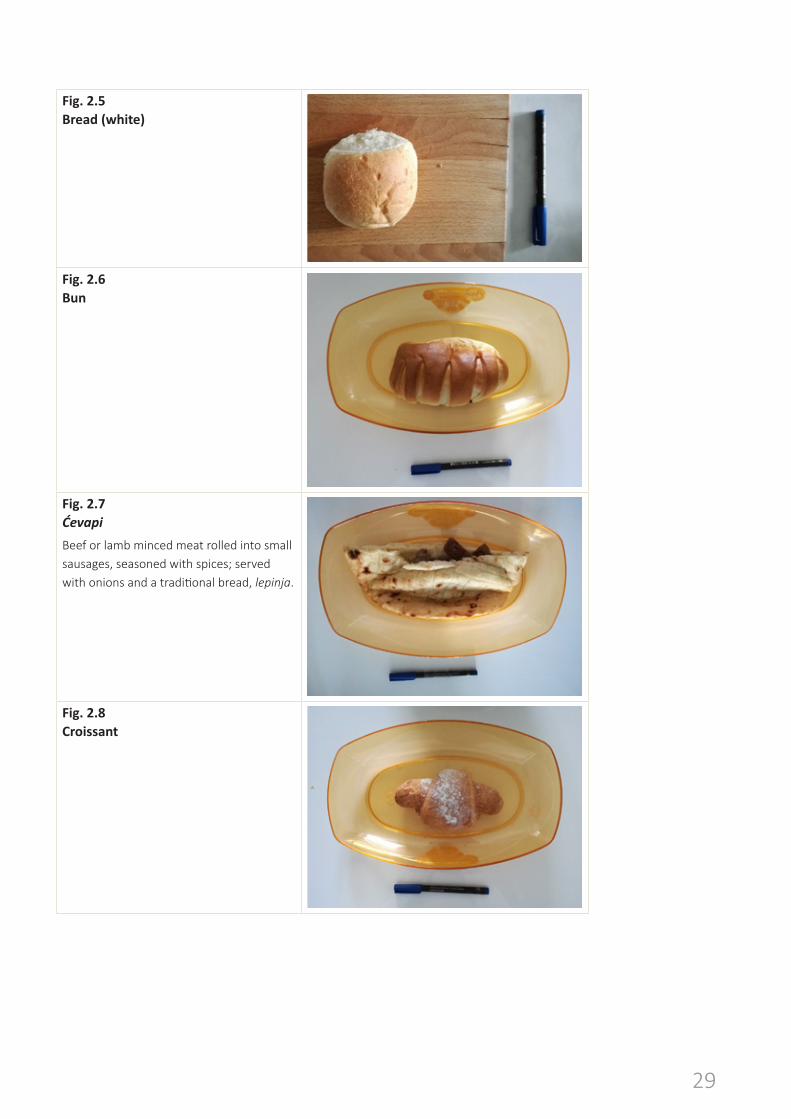
29
Fig. 2.5 Bread (white)
39
Fig. 2.3 Bread (kifla)
Fig. 2.4 Bread (perec)
Fig. 2.5 Bread (white)
Fig. 2.6 Bun
40
Fig. 2.6 Bun
Fig. 2.7 Ćevapi
Beef or lamb minced meat rolled into small sausages, seasoned with spices; served with onions and a traditional bread, lepinja.
Fig. 2.7 Ćevapi
Beef or lamb minced meat rolled into small sausages, seasoned with spices; served with onions and a traditional bread, lepinja.
40
Fig. 2.6 Bun
Fig. 2.7 Ćevapi
Beef or lamb minced meat rolled into small sausages, seasoned with spices; served with onions and a traditional bread, lepinja.
Fig. 2.8 Croissant
41
Fig. 2.8 Croissant
Fig. 2.9 Doughnut
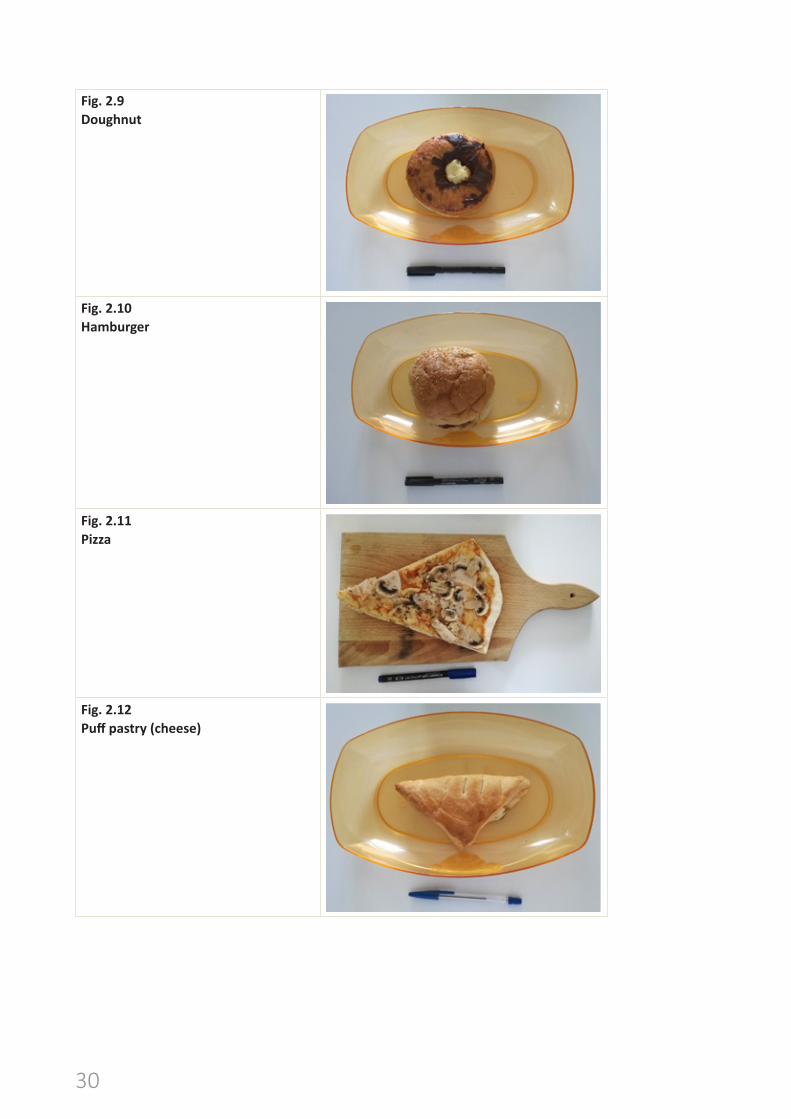
30
Fig. 2.9 Doughnut
41
Fig. 2.8 Croissant
Fig. 2.9 Doughnut
Fig. 2.10 Hamburger
42
Fig. 2.10 Hamburger
Fig. 2.11 Pizza
Fig. 2.11 Pizza
42
Fig. 2.10 Hamburger
Fig. 2.11 Pizza
Fig. 2.12 Puff pastry (cheese)
43
Fig. 2.12 Puff pastry (cheese)
Fig. 2.13 Sandwich (chicken)
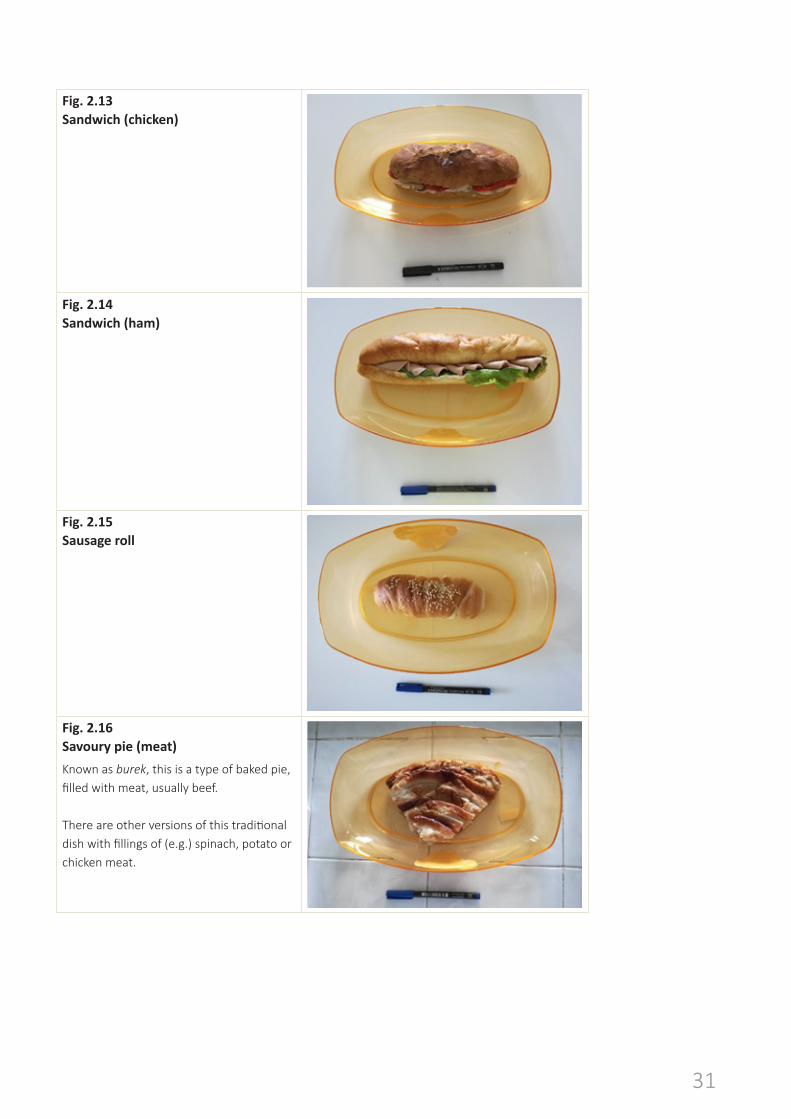
31
Fig. 2.13 Sandwich (chicken)
43
Fig. 2.12 Puff pastry (cheese)
Fig. 2.13 Sandwich (chicken)
Fig. 2.14 Sandwich (ham)
44
Fig. 2.14 Sandwich (ham)
Fig. 2.15 Sausage roll
Fig. 2.16 Savoury pie (meat)
Known as burek, this is a type of baked pie, filled with meat, usually beef.
There are other versions of this traditional dish with fillings of (e.g.) spinach, potato or chicken meat.
Fig. 2.15 Sausage roll
44
Fig. 2.14 Sandwich (ham)
Fig. 2.15 Sausage roll
Fig. 2.16 Savoury pie (meat)
Known as burek, this is a type of baked pie, filled with meat, usually beef.
There are other versions of this traditional dish with fillings of (e.g.) spinach, potato or chicken meat.
Fig. 2.16 Savoury pie (meat)
Known as burek, this is a type of baked pie, filled with meat, usually beef.
There are other versions of this traditional dish with fillings of (e.g.) spinach, potato or chicken meat.
44
Fig. 2.14 Sandwich (ham)
Fig. 2.15 Sausage roll
Fig. 2.16 Savoury pie (meat)
Known as burek, this is a type of baked pie, filled with meat, usually beef.
There are other versions of this traditional dish with fillings of (e.g.) spinach, potato or chicken meat.
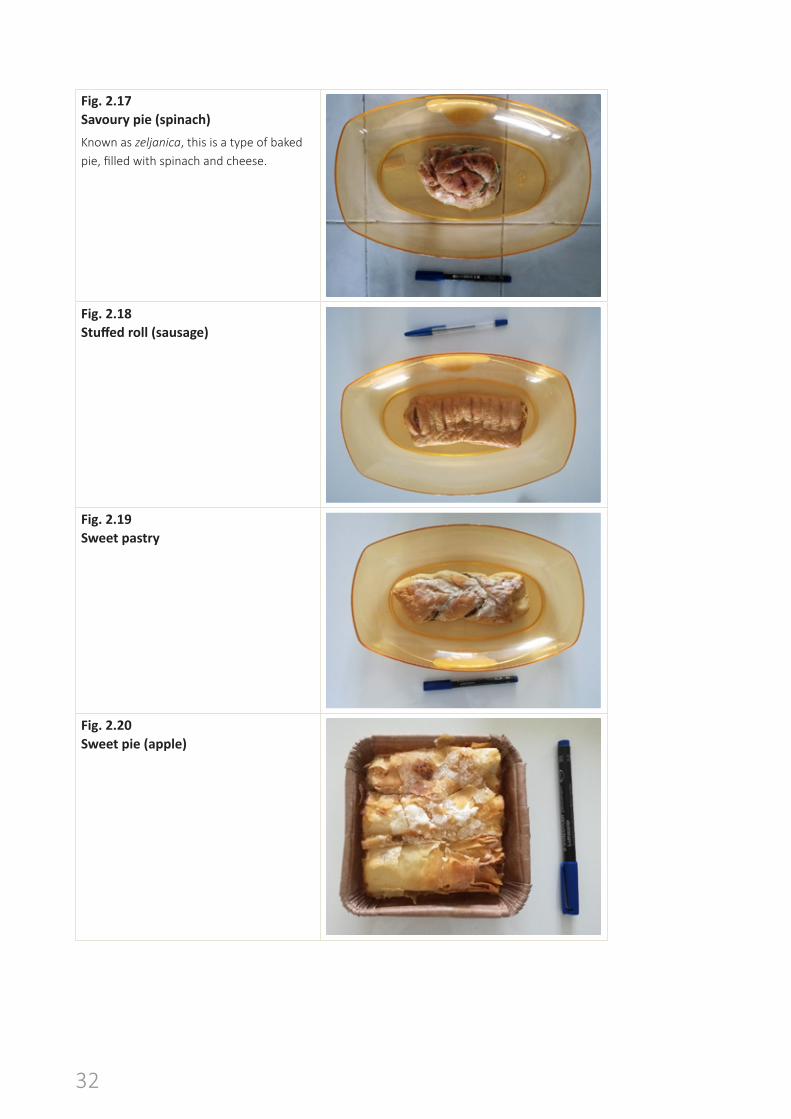
32
Fig. 2.17 Savoury pie (spinach)
Known as zeljanica, this is a type of baked pie, filled with spinach and cheese.
45
Fig. 2.17 Savoury pie (spinach)
Known as zeljanica, this is a type of baked pie, filled with spinach and cheese.
Fig. 2.18 Stuffed roll (sausage)
Fig. 2.18 Stuffed roll (sausage)
45
Fig. 2.17 Savoury pie (spinach)
Known as zeljanica, this is a type of baked pie, filled with spinach and cheese.
Fig. 2.18 Stuffed roll (sausage)
Fig. 2.19 Sweet pastry
46
Fig. 2.19 Sweet pastry
Fig. 2.20 Sweet pie (apple)
Fig. 2.20 Sweet pie (apple)
46
Fig. 2.19 Sweet pastry
Fig. 2.20 Sweet pie (apple)

33

34

AJ
The WHO Regional Office for Europe
The World Health Organization (WHO) is a specialized agency of the United Nations created in 1948 with the primary responsibility for international health matters and public health. The WHO Regional Office for Europe is one of six regional offices throughout the world, each with its own programme geared to the particular health conditions of the countries it serves.
Member States
AlbaniaAndorraArmeniaAustriaAzerbaijanBelarusBelgiumBosnia and HerzegovinaBulgariaCroatiaCyprusCzechiaDenmarkEstoniaFinlandFranceGeorgiaGermanyGreeceHungaryIcelandIrelandIsraelItalyKazakhstanKyrgyzstanLatviaLithuaniaLuxembourgMaltaMonacoMontenegroNetherlandsNorwayPolandPortugalRepublic of MoldovaRomaniaRussian FederationSan MarinoSerbiaSlovakiaSloveniaSpainSwedenSwitzerlandTajikistanThe former Yugoslav Republic of MacedoniaTurkeyTurkmenistanUkraineUnited KingdomUzbekistan
World Health Organization Regional Office for EuropeUN City, Marmorvej 51, DK-2100 Copenhagen Ø, Denmark
Tel.: +45 45 33 70 00 Fax: +45 45 33 70 01Email: [email protected]
Website: www.euro.who.int